1. Introduction
Energy consumption in buildings has grown significantly in recent decades, representing over 30% of the world’s total consumption, mainly from fossil fuels [
1]. Despite this high consumption, buildings often do not have satisfactory environmental quality for users [
2]. Thus, the architectural design must be guided by promoting sustainable development, energy efficiency, and thermal comfort [
3]. Large-scale national policies towards energy efficiency are already mandatory in several countries, even in residential buildings (e.g., Australia, Canada, France, Germany, and Spain) [
4,
5]. In Brazil, energy efficiency initiatives, the growing demand for supply, and the possible scarcity of natural resources have driven the development of environmental certification and labeling programs [
6].
The Brazilian Electricity Conservation Program (PROCEL) and the Institute of Metrology, Standardization and Industrial Quality (INMETRO), through the Labelling Program in Buildings (PBE Edifica), launched the Regulation for Energy Efficiency Labelling of Commercial, Service and Public Buildings (RTQ-C) in 2009, and for Residential Buildings (RTQ-R), in 2010 [
7,
9]. The PROCEL ushered in a new set of dynamics guiding the quest for architectural solutions and supplementary lighting and air-conditioning projects that upgrade buildings’ thermal and energy performances [
10].
The trend is for the existing labelling program to become mandatory for all types of buildings in the coming years [
11]. Currently, in Brazil, labelling is compulsory only for federal public buildings over 500 m², which are required to achieve Level A in RTQ-C [
12]. Regarding public universities, fewer than 10% have invested in building performance programs and policies, with incentives from the Brazilian Electricity Regulatory Agency (ANEEL). When evaluating the energy performance of a public higher education building in Porto Alegre, southern Brazil, a study by Tomazi et al. [
13] found the need to improve solar control on windows. Meanwhile, Moraes and Fonseca [
14] highlighted the potential of automation to reduce energy use and promote energy efficiency in public buildings. Similarly, Sá and Oliveira [
15] pointed out the need for improvements in the building envelope, air-conditioning, and lighting systems.
Within this context, the University of Campinas (UNICAMP) and CPFL Energy Company partnered to establish a management and energy efficiency model that can be replicated in other higher education institutions in Brazil and Latin America [
16]. The Sustainable Campus Project included a labelling subproject based on the RTQ-C regulation to evaluate the energy efficiency of the UNICAMP buildings.
This research investigated users’ energy performance and thermal comfort in a Brazilian public higher education building complex following the country’s Labelling Program in Buildings. The selected buildings in this research are located at the main campus of the University of Campinas, in the Campinas city, state of Sao Paulo, Brazil. An evaluation for thermal comfort analysis included on-site measurements of indoor thermal conditions and a survey of the building users. Questionnaires were applied to users in representative environments, following the criteria of the Performance Standard ASHRAE 55 [
41]. In addition to data collection for qualitative analysis of environments, observation and notes of information related to using constructive technologies (windows and doors) and air conditioning were also used.
2. Literature Review
The literature review section is organized into three topics that supported the research development: a) the Brazilian energy labelling regulation, b) indoor thermal comfort, focusing on university buildings, and c) occupant behaviour related to building use.
2.1. Energy labelling for buildings in Brazil
Building energy standards and labelling are key public policies that help accelerate the shift from conventional buildings towards sustainable low to ultra-low-energy buildings. In the United States, the implementation of the Energy Star certification is recognized by the housing market and has prompted buildings to reduce their total energy needs by 25%. The Energy Performance of Buildings Directive (EPBD) is a mandatory certification for European Union (EU) member states. China has been committed to researching and promoting energy-conservation standards, including assessment standards for green buildings [
17].
Following a global concern after the energy crisis from the 1970s, the Brazilian Electricity Conservation Program (PROCEL) was launched in 1985, encouraging energy savings in different areas. In Brazil, buildings account for 51.2% of the electricity consumption, half consumed by the commercial and public sectors [
18].
The Regulation for Energy Efficiency Labelling of Commercial Buildings (RTQ-C), launched by PROCEL in 2009, classifies buildings at five levels: from “A” (most efficient) to “E” (least efficient) [
7], based on two methods, the prescriptive method and the simulation method. The prescriptive method has as input the results of simulations of building prototypes for each Brazilian bioclimatic zone, where multi-linear regression calculates the energy performance of the building envelope, considering building geometry, window-to-wall ratio, glazing solar factor, and shading devices. It also considers the building’s lighting power density and air-conditioning system according to the equipment efficiency level.
The simulation method compares the proposed building with a reference model. The RTQ-C requirements are the normative reference for modelling to achieve the intended efficiency level. The same program and weather data are input for simulations for the proposed and reference buildings. The proposed building energy consumption should be equal to or lower than that of the reference building to comply with the code specifications of efficiency level.
Some studies assessed the methods used by RTQ-C and pointed out limitations of the prescriptive method regarding the building shape, envelope thermal properties, and window-to-wall ratio [
19,
21]. The regulation is under revision, and a new method is being developed using an artificial neural network to evaluate energy efficiency in commercial buildings [
22]. Optimization methods and machine learning are promising techniques that can be incorporated into energy policies. Furthermore, sustainable design extends beyond energy efficiency. In educational and office buildings, thermal comfort analysis is particularly interesting, as people spend around one third of their time in this environment [
23]. The past decade was marked by an extensive research interest in the subject due to the impact of comfort on well-being, health, and productivity [
24].
2.2. Indoor thermal comfort
Several authors and studies reported the crucial importance of thermal comfort for human health, both physical and well-being. From a large-scope state-of-the-art review of occupant comfort in buildings, Faraji et al.[
25] concluded that thermal comfort is more important than other aspects of occupant comfort. Furthermore, the interrelationship between occupant comfort and physiological, environmental, and psychological parameters has used regression-based approaches on most prediction models.
Faraji et al. [
25] also mentioned that other parameters, such as gender, outdoor temperature, and a person’s age, could play an important role in thermal comfort evaluation, although not included in several thermal comfort models.
Selected studies identified the differences in thermal perception depending on the building environment. According to [
26], the student’s thermal perception inside educational buildings is affected by psychological adaptation, the duration of lectures, students’ gender, educational level, building operation mode, and climatic zone. Faraji et al. [
25] highlighted differences in thermal perceptions between students inside architectural design studios and typical lecture rooms in Jordan.
The benefits of thermal environmental quality, with thermal comfort included, can affect the work performance and well-being of students and teachers since it helps improve productivity, learning ability, user´s systematic thinking, and building energy savings. On the other hand, thermal discomfort and poor air quality generate demotivation and dissatisfaction and distract students and teachers. These aspects must be considered in the design and use of educational buildings since people around 90% of their daily life indoors [
28,
29,
30].
2.3. Occupant behaviour
Occupants’ behaviour is one of the significant factors of uncertainty in building energy usage prediction, causing inaccuracies in consumption forecasts. It depends on how the occupants interact with the building, or rather, on their energy-related lifestyles. For several researchers [
30,
31,
32], the most influencing key variable on energy consumption is the variation in the behavioural patterns related to the interaction with the space heating/cooling setpoints, energy use for equipment, lighting, ventilation rates, and adjustment of the window opening, blinds, and shading devices.
Rashidzadeh and Matin [
33] pointed out that the advancements in control technologies and material science enable using smart windows in high-performing facades to improve the building’s energy performance and users’ comfort. The authors recommended useful advice for window choice based on their properties (reflectance, thermal transmittance rate, solar transmittance ratio, and solar heat gain coefficient) and the buildings’ specific climatic zones. Hu et al. [
34] highlighted the need for research to integrate occupant behaviour properly (OB) and building energy policies (BEP). They identified key questions and challenges related to technical standards and regulations, building information policies, energy incentives, and policy evaluations. They emphasized that uncertainties in services and diversity of OB cause uncertainties in BEP design, implementation, and final effects.
Mamani et al. [
29] identified the variables that influence the thermal comfort of a building, evidencing that the most used variables are the same used by the Predicted Mean Vote (PMV) index [
35]. However, OB research has focused on new variables seeking answers to individual differences in thermal perception, which can ultimately affect building energy consumption, aiming to improve people’s well-being and quality of life in a sustainable framework [
36]. Holanda [
37] conducted a monitoring study, combined with computer simulation and parametric analysis, to investigate the impact of air-conditioning setpoint temperatures on thermal comfort for schools in hot and humid climates in Brazil. The research confirms that design parameters (orientation, façade absorptance, and opening shadings), combined with HVAC capacity, can reduce up to 34% in energy consumption.
Hoyt et al. [
38] examined the benefits of widening HVAC setpoints in seven office buildings of ASHRAE climate zones. Increasing the cooling setpoint from 22°C to 25°C saved an average of 29% cooling energy without reducing thermal satisfaction levels. Further widened temperature bands achieved with fans or personal controls can result in 32% to 73% of HVAC savings, depending on the climate. All OB variables combined with thermal comfort and energy efficiency analysis can be incorporated into labelling programs for a more comprehensive approach in a sustainable framework.
3. Materials and Methods
Given the research objective, this work presents a case study of a building energy performance analysis using the RTQ-C prescriptive methodology to achieve energy efficiency and thermal comfort in a Brazilian subtropical climate context.
3.1. RTQ-C prescriptive method
The RTQ-C regulation classifies the energy efficiency of a building with three main categories of assessment: lighting system, expressed by the internal Lighting Power Density (LPD), air conditioning system (AC), and building envelope (ENV). Every requirement must be evaluated separately according to the specific assessment procedures. The final classification considers a 30% LPD, 40% AC, and 30% ENV weighting distribution [
7]. The total score (PT) defines the final classification of the building (A to E), as depicted in
Table 1.
Equation (1) calculates The Total Score (PT), composed of a ratio between weights (established by end uses) for each system and the numerical equivalent of its partial efficiency level. The prescriptive method employs a simplified framework to assess the building’s energy efficiency level based on actual buildings from a sample of different Brazilian cities [
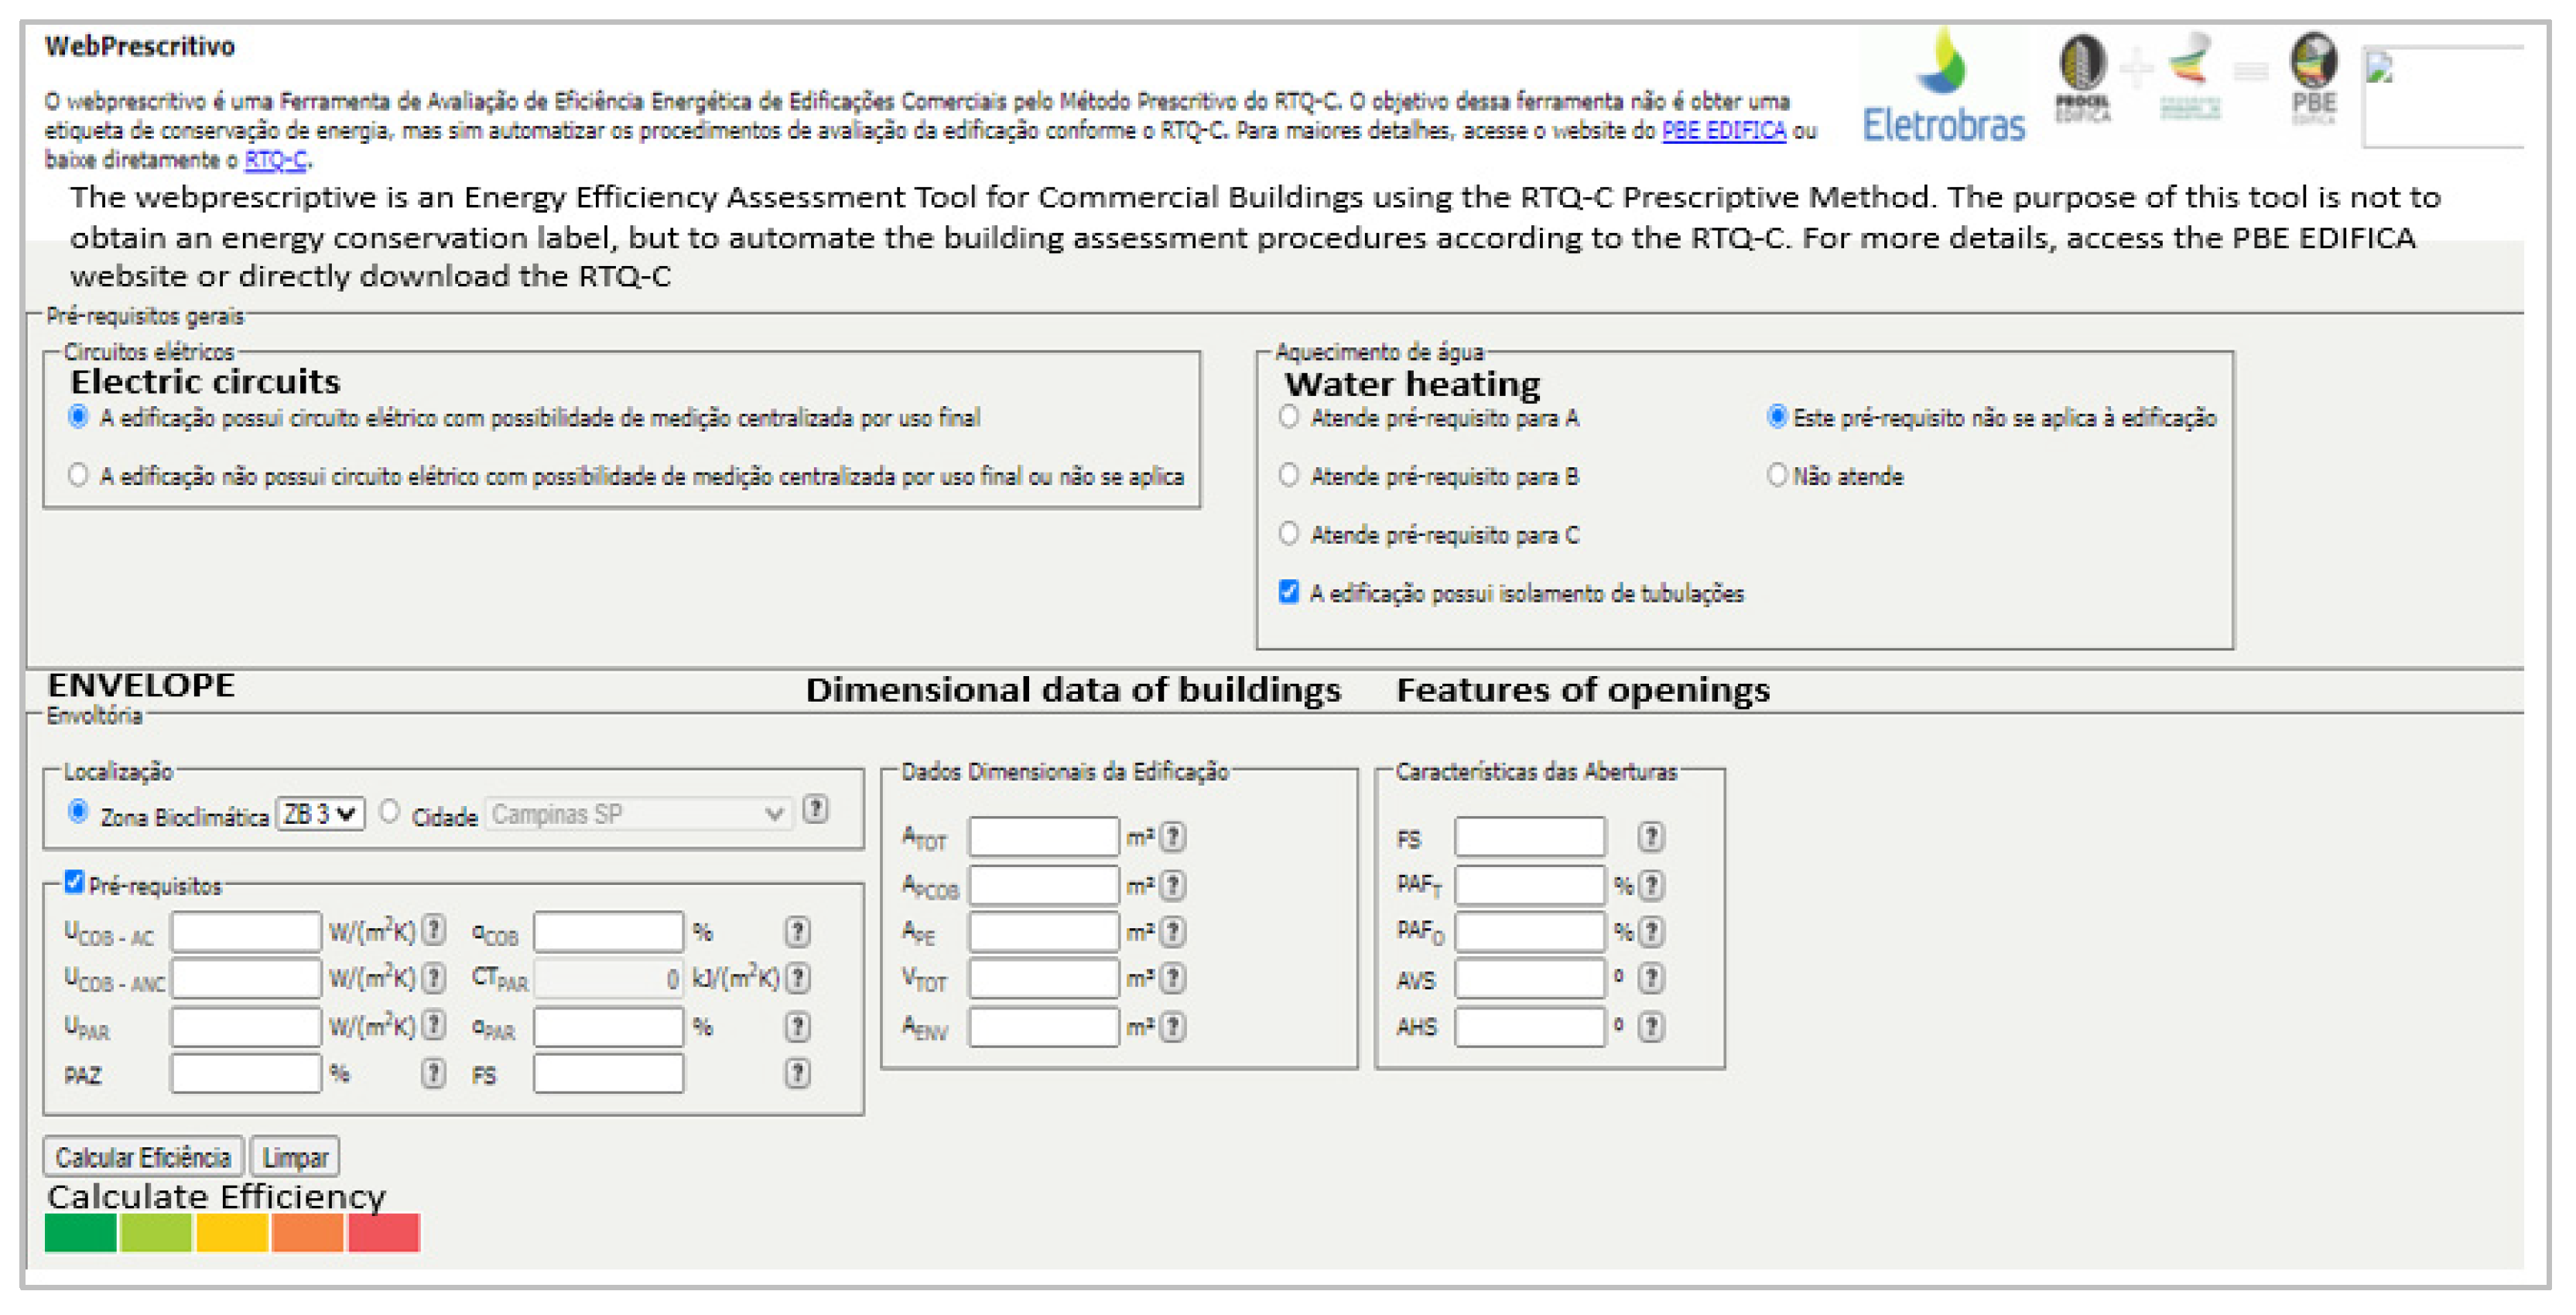
21]. According to the Brazilian bioclimatic zone where a building is placed, the envelope analysis considers geometric elements of the building (e.g., form factors, shading components, and façade orientations) and the materials’ properties for wall and roof designs. An online tool automates the assessment procedure that allows the user to estimate the building energy performance (
https://labeee.ufsc.br/sites/default/files/webprescritivo/index.html), as shown in
Figure 1.
Here,
PT is the total score;
𝐸𝑞𝑁𝑢𝑚𝐸𝑛𝑣 is the numerical equivalent of the envelope;
𝐸𝑞𝑁𝑢𝑚𝐷𝑃𝐼 is the numerical equivalent of the lighting system;
𝐸𝑞𝑁𝑢𝑚𝐶𝐴 is the numerical equivalent of the air conditioning system;
𝐸𝑞𝑁𝑢𝑚𝑉 is the numerical equivalent of unconditioned zones;
APT is the floor area of non-conditioned transitory permanence zones;
ANC is the floor area of long-term non-conditioned zones;
AC is the floor area of conditioned zones;
AU is the usable area;
b is the score obtained by the bonuses, which can vary from 0 to 1.
3.2. Buildings’ description (geometry, envelope, lighting and air conditioning)
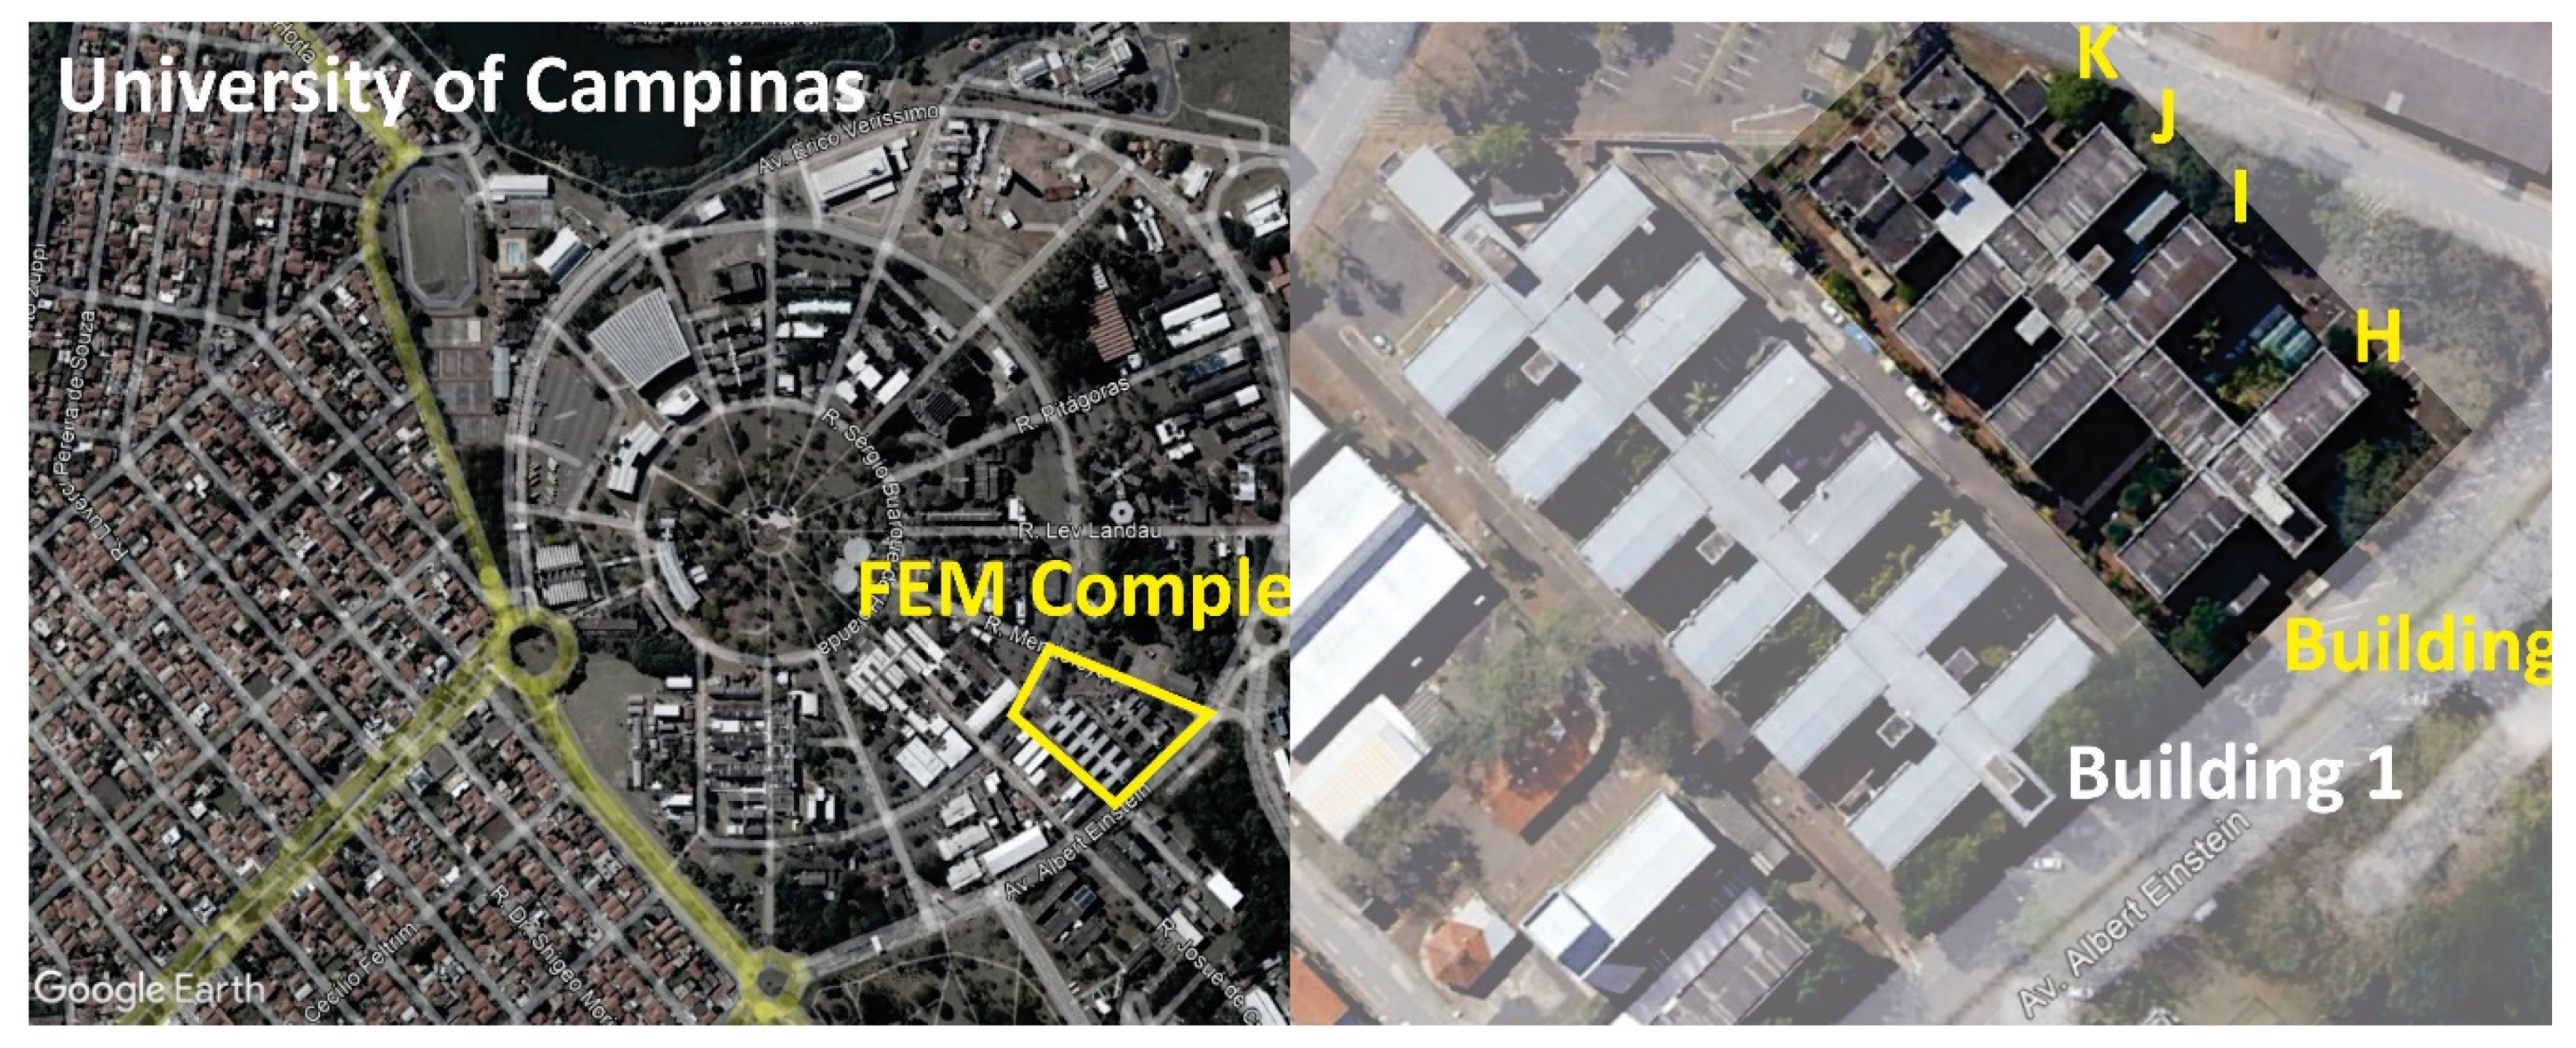
The selected buildings in this research are located at the main Campus of the State University of Campinas, District of Barão Geraldo. The School of Mechanical Engineering (FEM, in Portuguese) complex is composed of 10 (ten) blocks divided into 2 distinct building sets (
Figure 2). The research work took place in Building 2, which includes blocks H, I, J, and K. All blocks have three floors, in addition to transition blocks. The buildings’ internal division is quite varied, following different rhythms and dividing into spaces for workshops, laboratories, classrooms, teachers’ rooms, meeting rooms, administrative spaces, library, auditorium, and social integration areas.
The blocks of Building 2 all together have 6,877 m² of built area, and
Table 2 describes the envelope materials. The walls are made of concrete blocks, partly painted, and partly covered with ceramic tiles. The roofs are in concrete slabs with fibre cement tiles. The windows are made of single glass with an average window-to-wall ratio of 38.1%.
3.3. Climate region
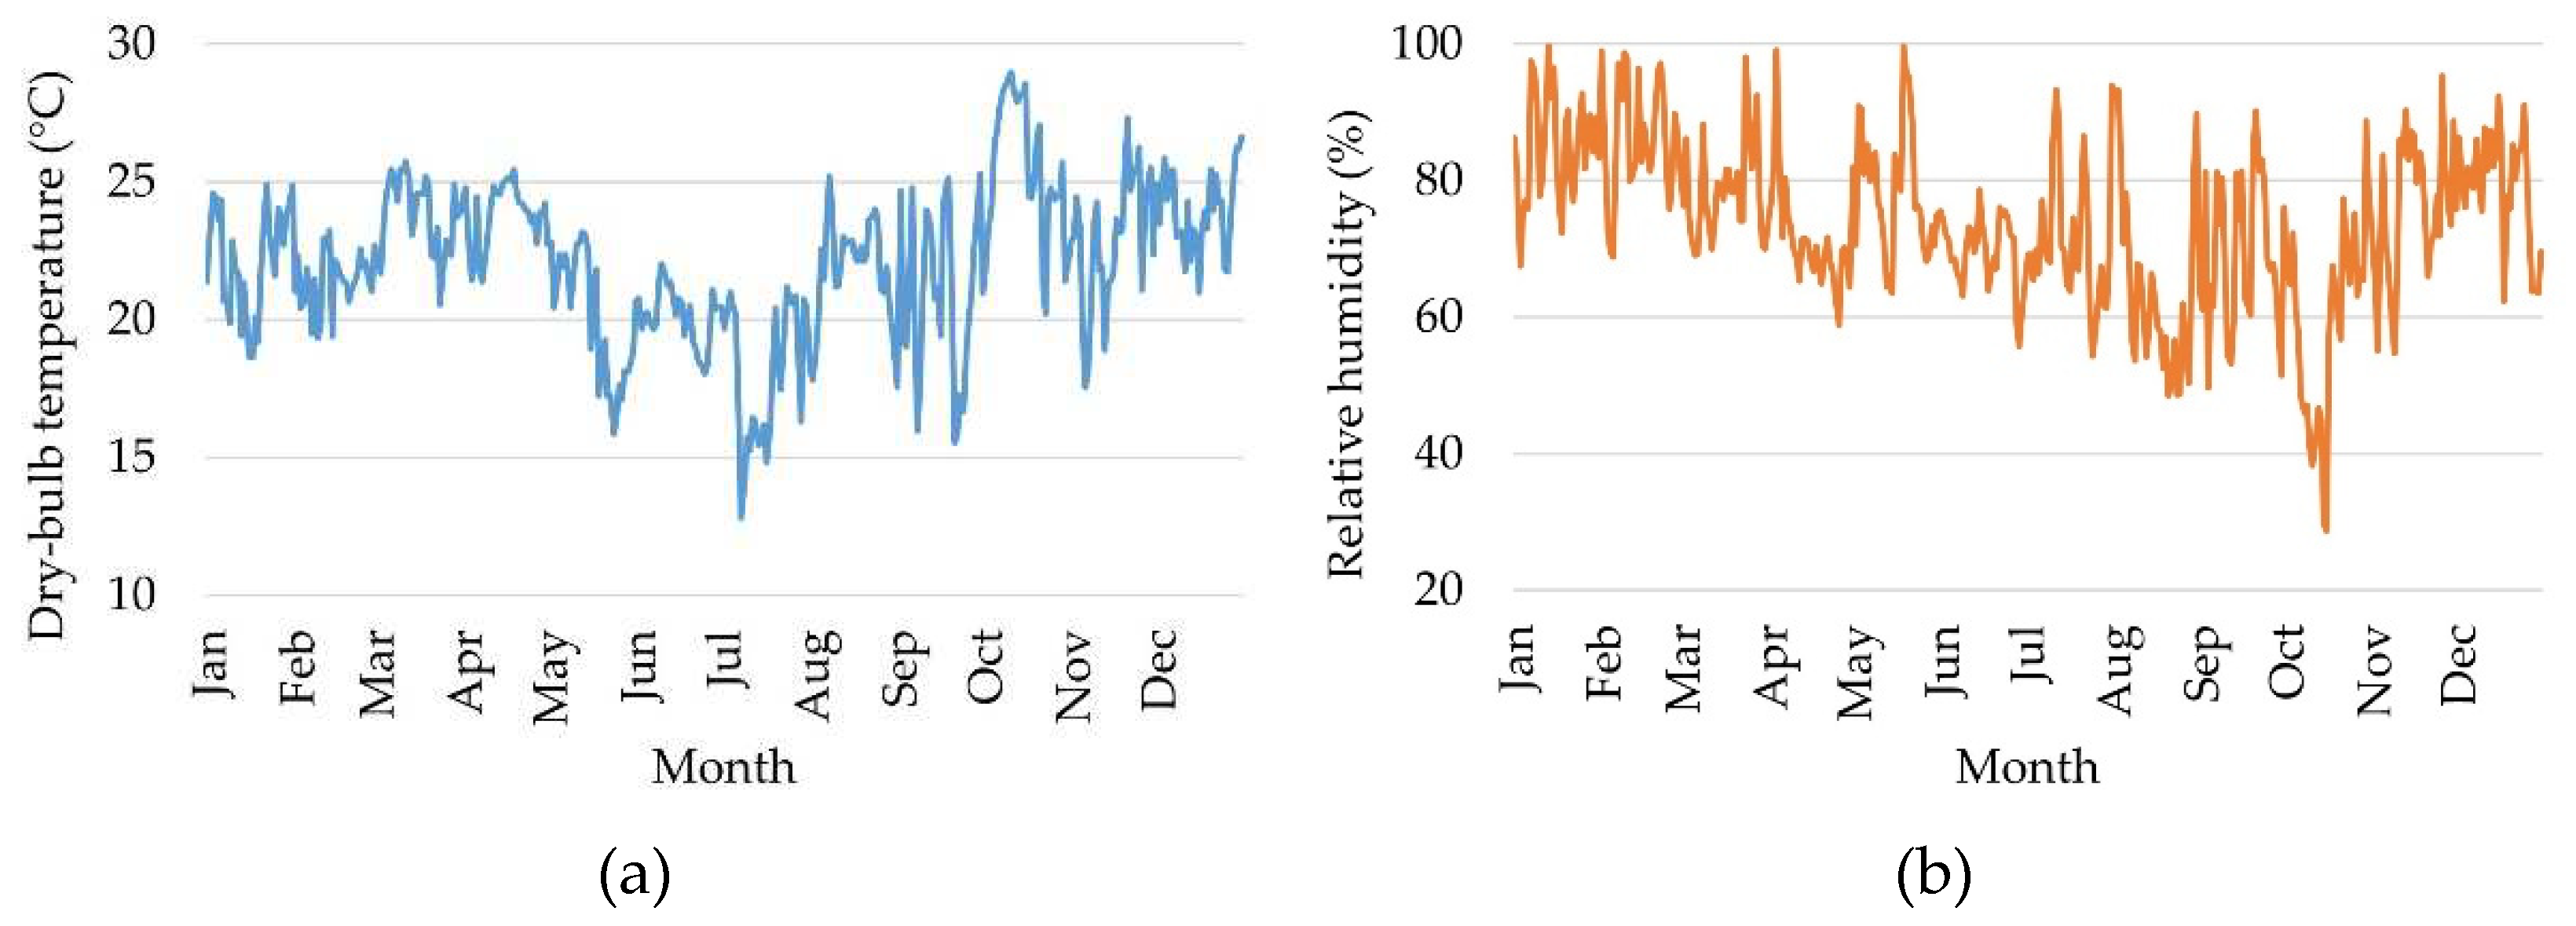
The FEM building is in Campinas, São Paulo, Brazil, at 22°54’ south latitude, 47°03’ west longitude, and 685 m altitude. It is located in a dry-winter humid subtropical climate region (Cwa), according to the Köppen–Geiger classification [
39]. The city’s average annual temperature is 22.4 °C, with an average annual rainfall of 1424.5 mm. The rainy season is from October to March, with August’s driest month. The average relative humidity in Campinas ranges from 67% in January to 36% in August [
40] (
Figure 3).
3.4. Thermal comfort analysis
An evaluation for thermal comfort analysis included on-site measurements of indoor thermal conditions and a survey of the building users [
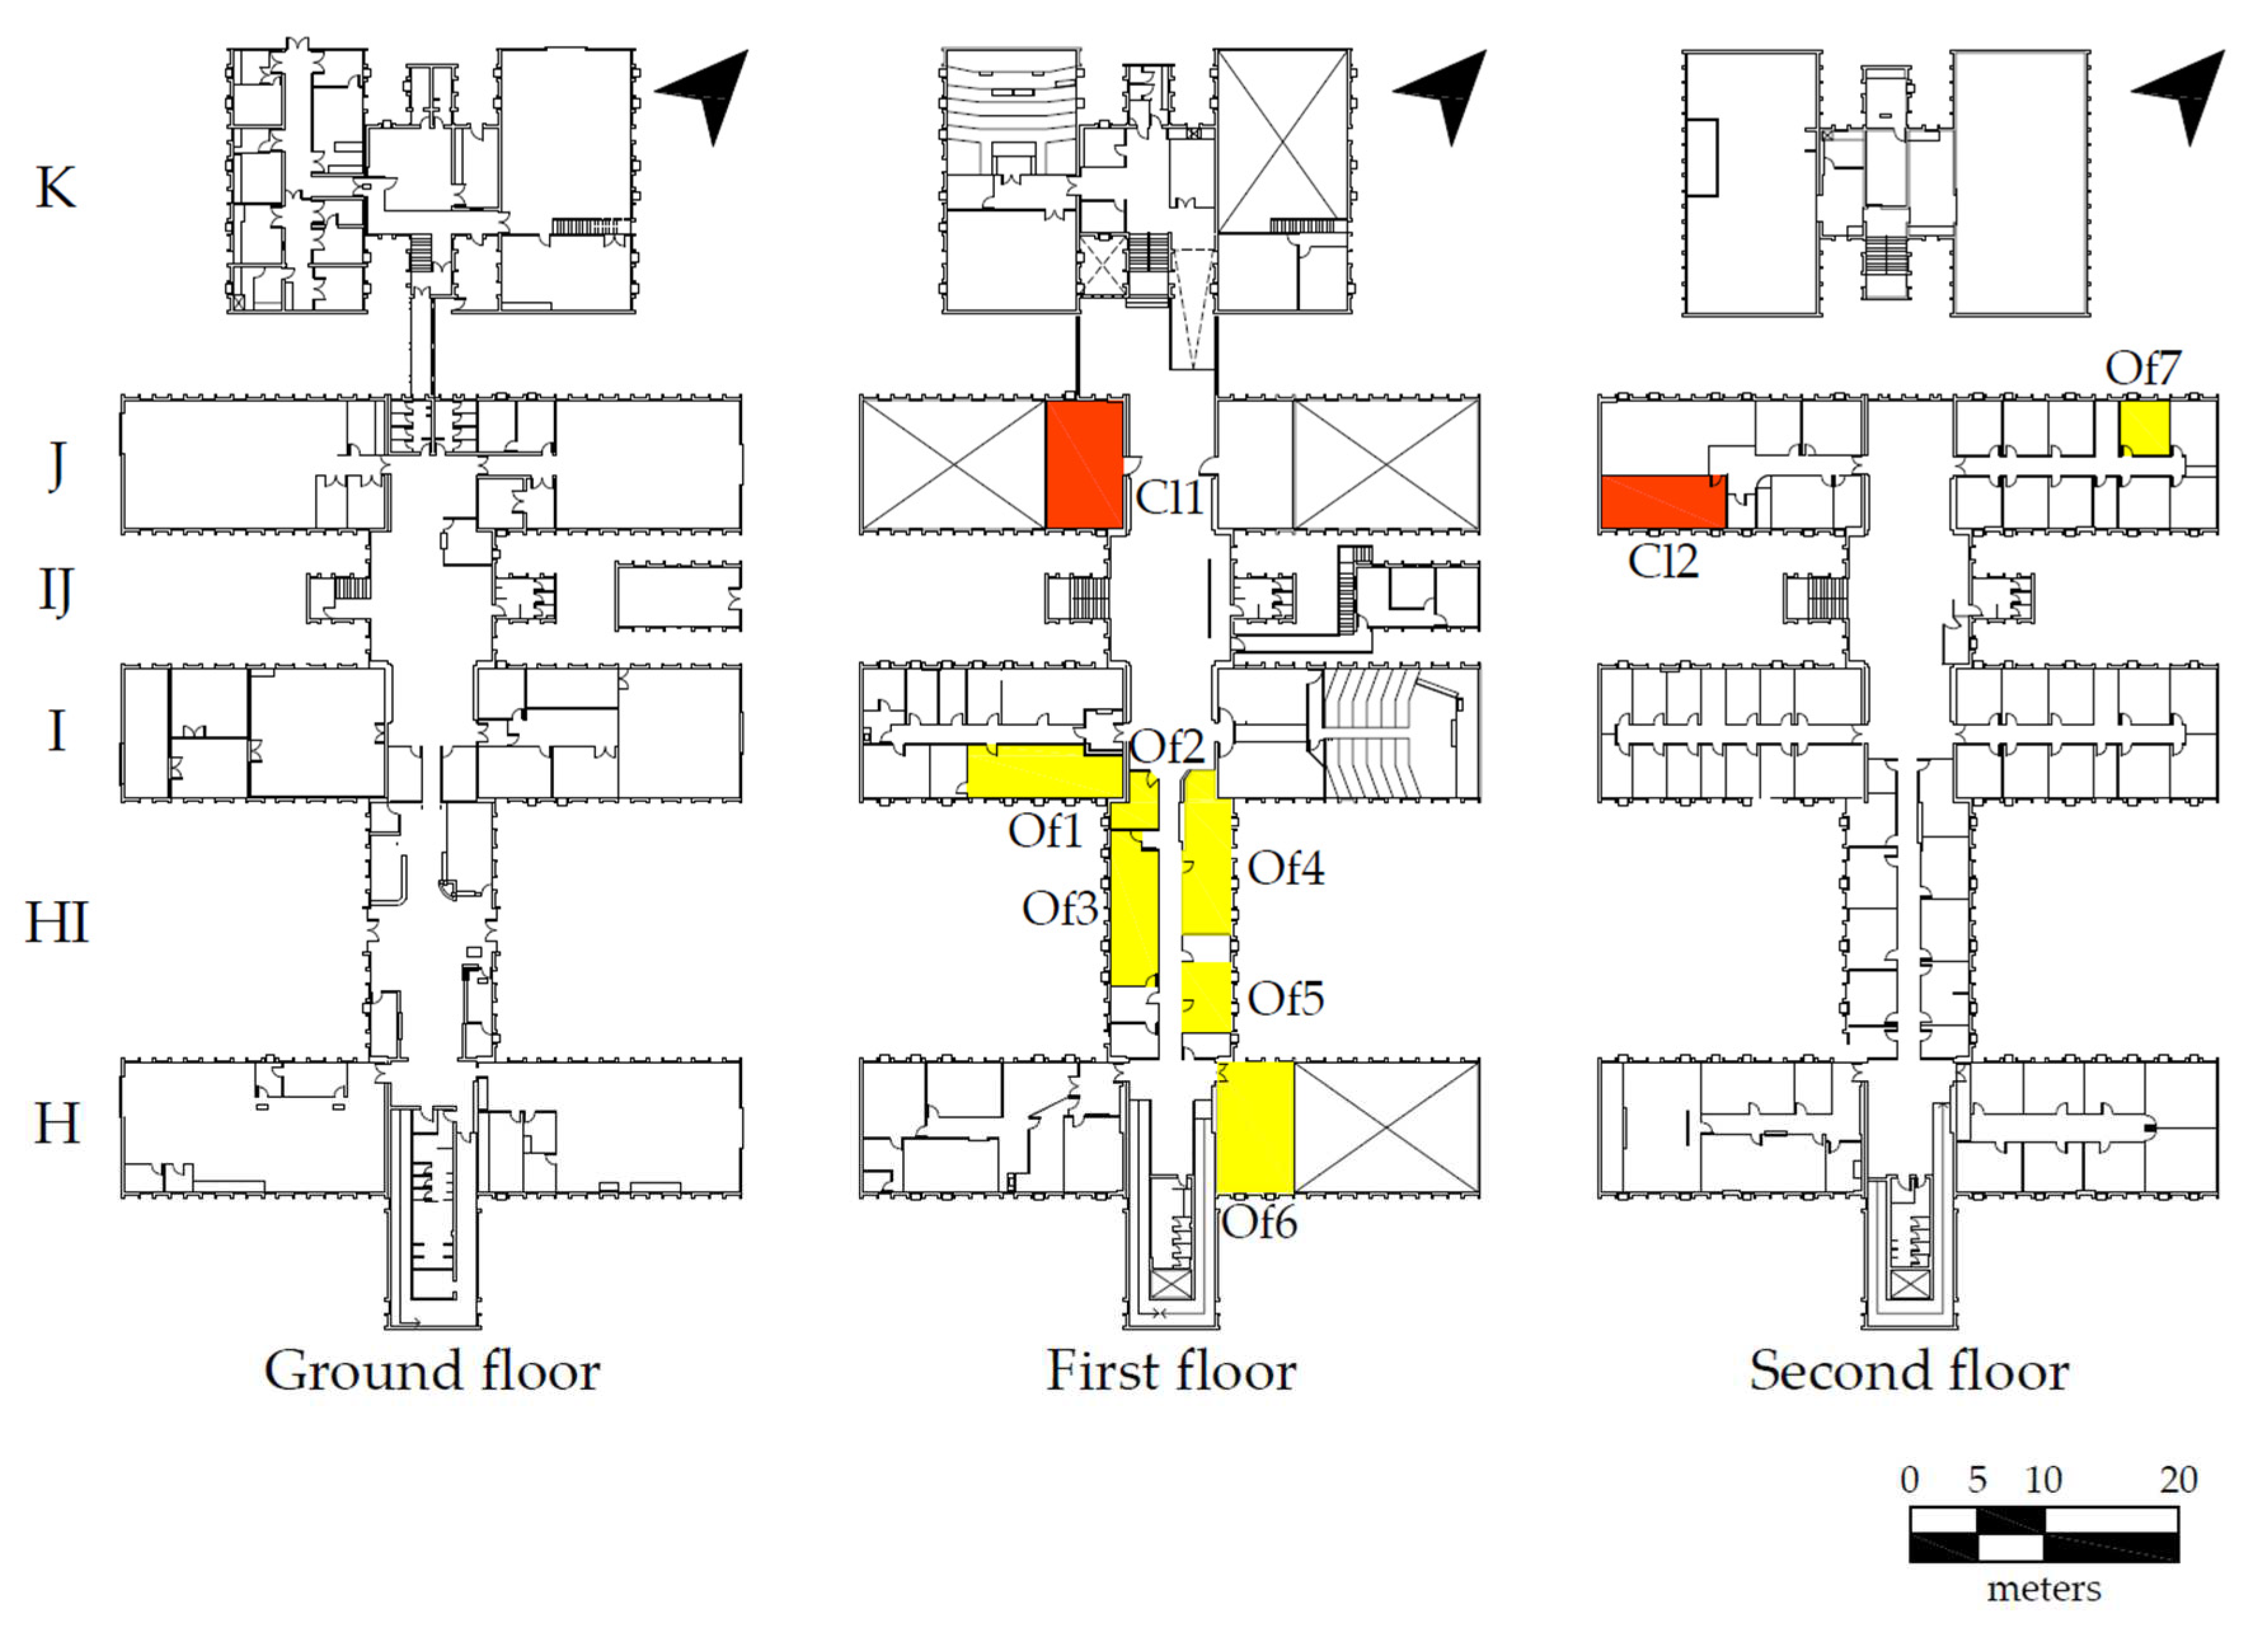
26]. Nine conditioned rooms were selected for analysis (two classrooms and seven office rooms), as shown in
Figure 4. The rooms were selected based on availability, according to the building manager. Both measurements and surveys occurred between November 13 and December 14, 2018, during the transition seasons between spring and summer in Campinas.
3.4.1. On-site measurements
The environmental parameters obtained during the monitoring period were the relative humidity, air and globe thermometer temperatures, and air velocity, with measurements using a microclimate data logger Testo brand digital thermo-hygrometer, model 175-H1; Testo brand digital thermometer, model 175-T2; Testo brand digital anemometer, model 405V. The equipment used was fixed on a tripod with a height of 1.10 cm above the ground to simulate the sitting position of the users and far away from the external walls but near where the user’s seat was. The instruments were shielded from direct solar radiation, cleaned, and calibrated.
The environmental and personal information collected in the buildings was input to evaluate through the Predict Mean Vote (PMV) and Percentage of Dissatisfaction (PPD) calculated by the computer program Comfort 2.03 [
41], with the version updated in 2018.
3.4.2. Questionnaires
Table 3.
Characteristics of the selected rooms.
Table 3.
Characteristics of the selected rooms.
| Room |
Area (m²) |
Floor level |
Orientation |
Window-to-wall ratio (%) |
HVAC |
People density (no.) |
Number of surveys |
| CL1 |
54.4 |
1st |
NW-SE |
22.73 |
S |
52 |
52 |
| CL2 |
37.1 |
2nd |
SE |
22.73 |
S |
45 |
45 |
| OF1 |
43.3 |
1st |
SE |
22.73 |
W |
3 |
10 |
| OF2 |
12.1 |
1st |
SW |
77.5 |
W |
4 |
16 |
| OF3 |
39.8 |
1st |
SW |
77.75 |
W |
5 |
21 |
| OF4 |
39.6 |
1st |
NE |
77.75 |
W |
3 |
12 |
| OF5 |
18.4 |
1st |
NE |
77.75 |
W |
3 |
12 |
| OF6 |
54.3 |
1st |
SE |
17.2 |
W |
4 |
16 |
| OF7 |
15.4 |
2nd |
NW |
17.2 |
W |
4 |
16 |
3.4.3. Survey study
The survey included a field study involving a set of five buildings that, inside, featured nine selected representative rooms for the thermal comfort study.
These buildings were from the University in Campinas—UNICAMP. The selected rooms used for research were teaching and administrative offices. The research occurred during the transition seasons between spring and summer, a warm time in the city. In Brazil, mechanically heated buildings with access to windows for natural ventilation are typical. Brager and Baker [
42] refer to this combination of natural ventilation, window operation, and mechanical systems to provide cooling and obtain thermal comfort as a “Mixed mode.” Therefore, the buildings surveyed function in this way.
During the collection of environmental data, the application of the questionnaire surveys, simultaneously at pre-established times and through observation, aimed to describe the leading construction technologies (windows and doors) and equipment (air-conditioning). The research objective at the University was to describe the real (as built) way of using environments and air conditioning technologies.
The questionnaire encompasses three steps:
Step one: general building information (local, room, time, kind of users, or other).
Step two: the students’ information, such as age, gender, height, and the insulation based on (ASHRAE 55, 2017) [
43] clothing vestment (clo) and activity (met).
Step three: evaluate the thermal environment, including the following questions:
Questions about Thermal Preference Vote (PPD) and Thermal Sensations Vote (PMV) in the representative rooms.
Questions:
Q1: What is your thermal sensation at this moment? This references the temperature from -3 cold to +3 hot. It is symmetrical by zero, which is considered neutral, where a person feels comfortable.
Q2: How would you prefer the temperature to be in this environment right now? The reference intensity would be from no change to much warmer or much cooler, as shown in
Figure 5.
Questionnaires were applied to users in representative environments, following the criteria of the Performance Standard (ASHRAE 55, 2017 [
43], page 16), or where they spend their time. In addition to data collection for qualitative analysis of environments, observation and notes of information related to using constructive technologies (windows and doors) and air conditioning were also used.
To understand the relationship between the environmental and personal variables, a descriptive analysis of the collected data and a statistical inference method were carried out, seeking relationships between thermal performance and the types of use of the environments.
The statistical sample was defined using Cochran’s equation (1997) based on the work of Luca e Silva [
44] according to expression (2):
where
N is the total size of the population;
n is the number of individuals in the sample (minimum sample size);
is the critical value that corresponds to the desired degree of confidence;
p is the expected frequency (when this value is not known, 0.50 is adopted);
q is equal to 1- p;
σ is the population standard deviation of the studied variable (in this example, users);
d is the acceptable error (d = 5.55%, for a significance level of 5%);
For a confidence level equal to 95%, the value of Z α/2 is 1.96.
Table 4.
Sample sizes for different rooms.
Table 4.
Sample sizes for different rooms.
| Building |
Room |
Data collection period |
Period of the day |
Minimum
sample size (n) |
Selected
sample size
(N) |
| FEM |
Classrooms |
| CL1 |
Nov. 13,14 2018 |
morning |
32.4 |
36 |
| afternoon |
15.3 |
16 |
| CL2 |
Nov. 13,14 2018 |
morning |
24.9 |
27 |
| |
afternoon |
17.1 |
18 |
| Offices |
| Of.3, 4 |
Nov. 13,14 2018 |
morning |
19.7 |
21 |
| afternoon |
12.5 |
13 |
| Of. 6, 7 |
Nov. 13, 14 2018 |
morning |
9.7 |
10 |
| afternoon |
13.4 |
14 |
| Of. 1, 5, 2 |
Dec. 13, 14 2018 |
morning |
9.7 |
10 |
| afternoon |
13.4 |
14 |
4. Results
4.1. RTQ-C energy efficiency labelling
All blocks achieved level C of energy efficiency in terms of the envelope, except the two transition areas, with level D. This was mainly due to non-compliance with the prerequisites for thermal transmittance of the roofs. The absorptance prerequisite still needs to be met. A possible suggestion to increase the efficiency of the envelope is to paint the roof in a lighter colour to meet the prerequisite and increase the energy rating. The details of the label classification level of the buildings are shown in
Table 5.
All blocks achieved level C of energy efficiency in terms of envelope, except for the two transition areas, which were level D. This was mainly due to non-compliance with the prerequisites for thermal transmittance of the roofs. The absorptance prerequisite was also not met. To increase the efficiency of the envelope, it is suggested to paint the roof in a lighter colour in order to meet the prerequisite and increase the energy rating.
Regarding the lighting system, most blocks reached level B, mainly due to non-compliance with the prerequisite of automatic lighting and circuit division. Block K was the only one that received a C level for lighting. It should be noted that common fluorescent lamps have been replaced by new LED technologies. Another highlight is that block K received level C for two reasons: first, the total installed power was less than the power limit for level C. Second, at the time of data collection, light bulbs were changed in all blocks except block K. All lamps were replaced by LEDs. It is essential to use lamps with good performance, as there is a difference in the label obtained.
Most received level A in a preliminary step on the label by calculating the installed power in the buildings, compared with the limit powers. However, as the buildings do not have an automatic shutdown of the circuits, the maximum level that can be obtained is B.
A suggestion to increase efficiency is to install automatic shutdown devices, such as “dimers” (presence sensors).
The two transition areas and block J received the worst rating, level E, considering the low performance of the air conditioning system. Blocks I and K reached level D, and block H reached level C. The old and outdated equipment contributed to low efficiency in some blocks.
Finally, regarding the general level of energy classification, blocks H, J, and K received level C; block I reached level B; and the transition areas obtained level D. It can be inferred that it would be necessary, for example, to include some bonuses suggested by the RTQ-C, such as installation of photovoltaic panels, reuse of water, aerators in taps, and flushes with a double activation, to improve the classification levels. In addition, implementing occupancy sensors and painting the roofs with more reflective paint colours could also contribute to greater energy efficiency.
4.2. Thermal comfort
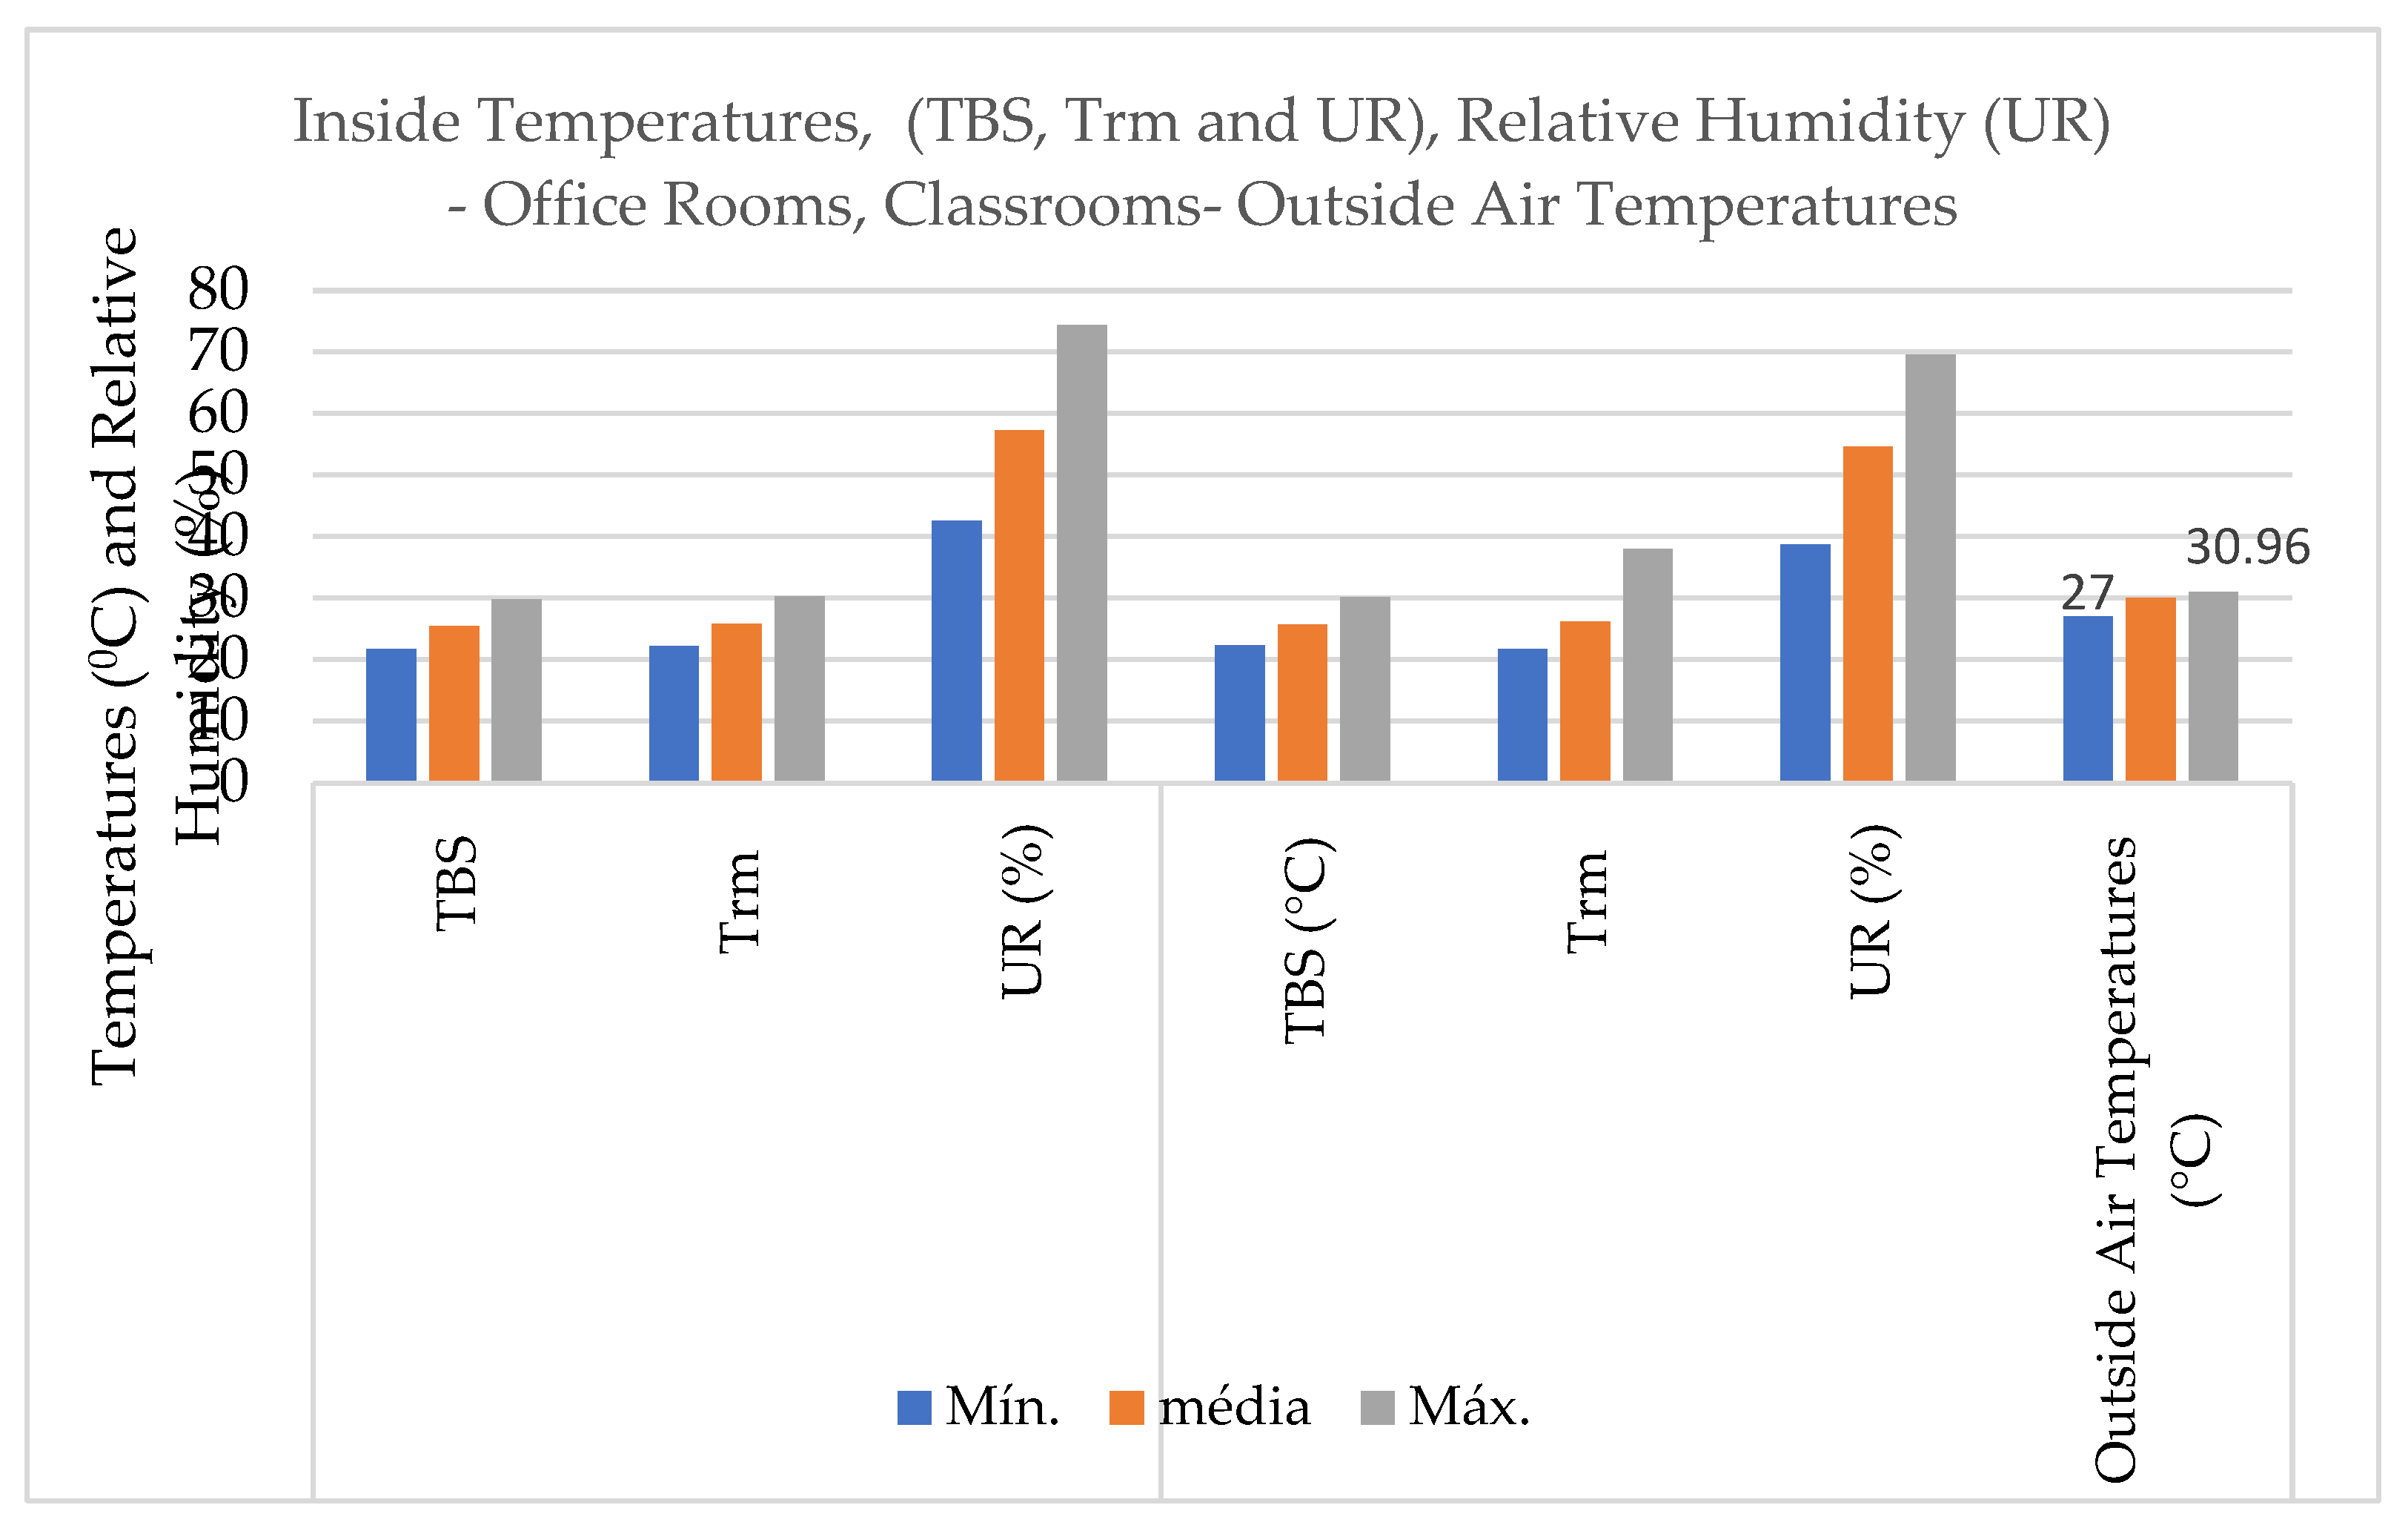
The climate environmental conditions are shown in
Figure 6, which describes the inside and outside temperatures where the questionnaires were applied, as well as the relative humidity.
Simultaneously with measuring environmental data, questionnaires were applied to users of the environments. A total of 199 questionaries were applied inside the buildings, 97 in a classroom, and 102 in office rooms.
There were four sessions of questionnaires for two days, applied at 9:00 am, 11:45 am, 2:00 pm, and 4:30 pm.
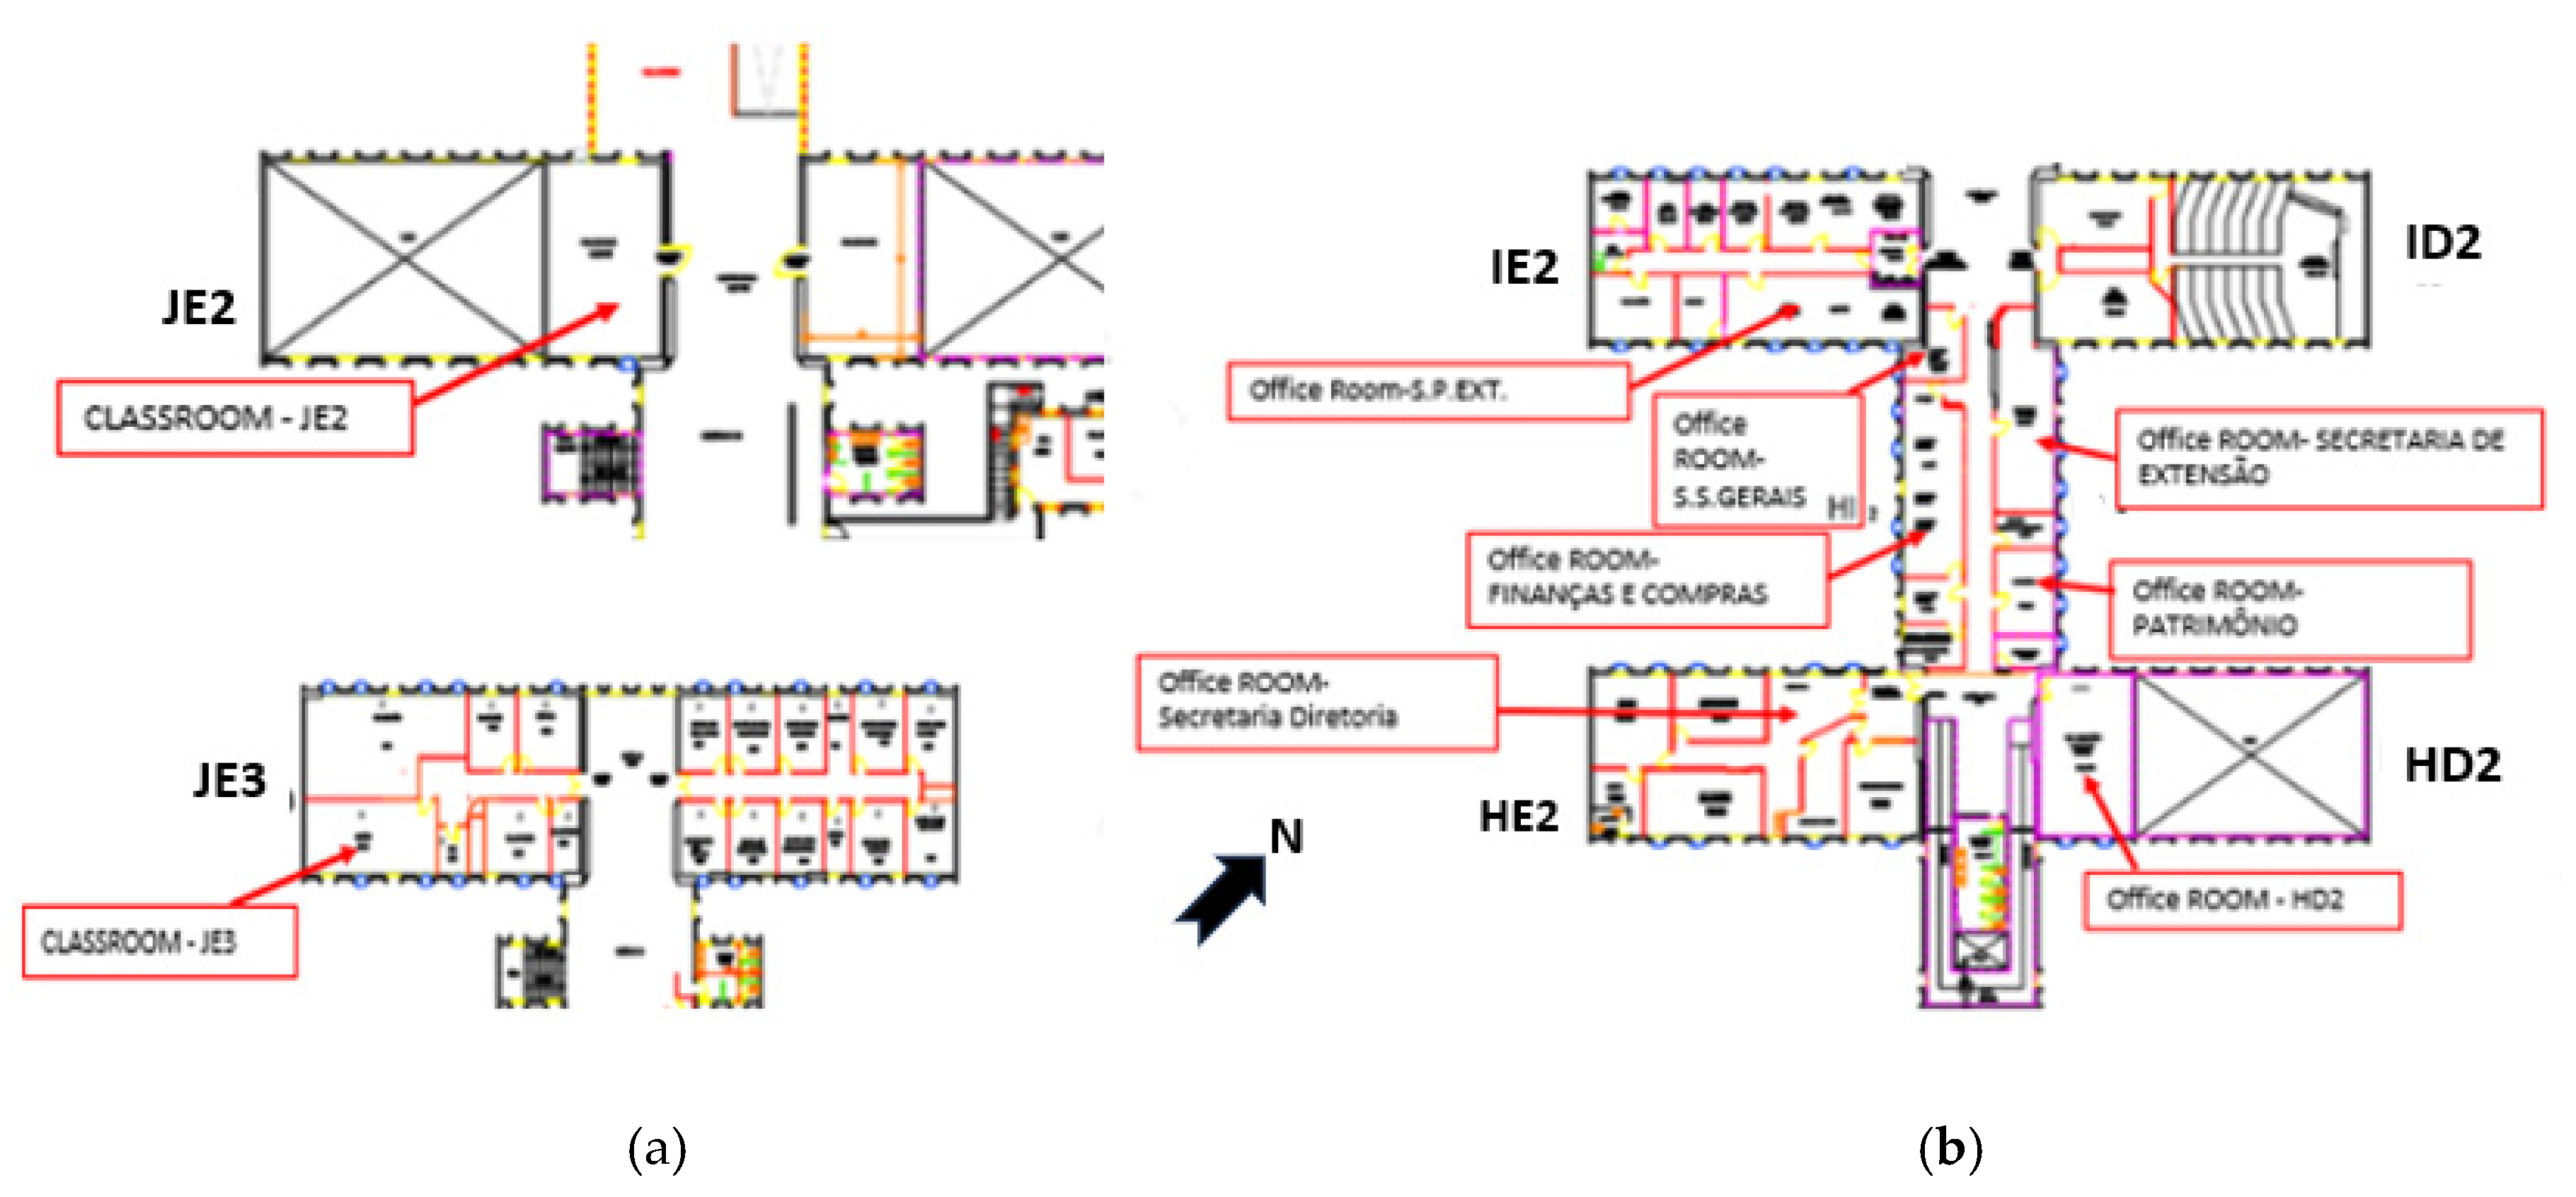
The questionnaires covered two classrooms, one on the intermediate floor and another on the last floor. Most of the selected office rooms were on the first floor. Some environments’ locations are shown in
Figure 7.a (classrooms) and
Figure 7.b (office rooms).
Monitoring and data collection occurred during a warm period in Campinas (13 November–14 December) in 2018. The images of some environments are shown in Figures 8.a.b.c.d.
The images of two classes are shown in
Figure 8 (
a,b). The CL1 classroom had two façades of windows, but users removed one to fix a blackboard. Thus, the ventilation is not the same as the original layout. Another is classroom CL2, located on the last floor. c and d feature office rooms.
4.2.1. Classroom’s survey results
Researchers advised users to maintain the same use of the rooms during the collection phase. Therefore, all data were collected with the air conditioning always on.
In classroom environments, 52 users responded to the questionnaires in room CL1, and in room CL2, there were 45 users, with a total of 97 people interviewed. The percentage of women using this environment was 34%, and 66% were men (
Table 3). The details of the two classroom environments investigated in the university are in
Table 3.
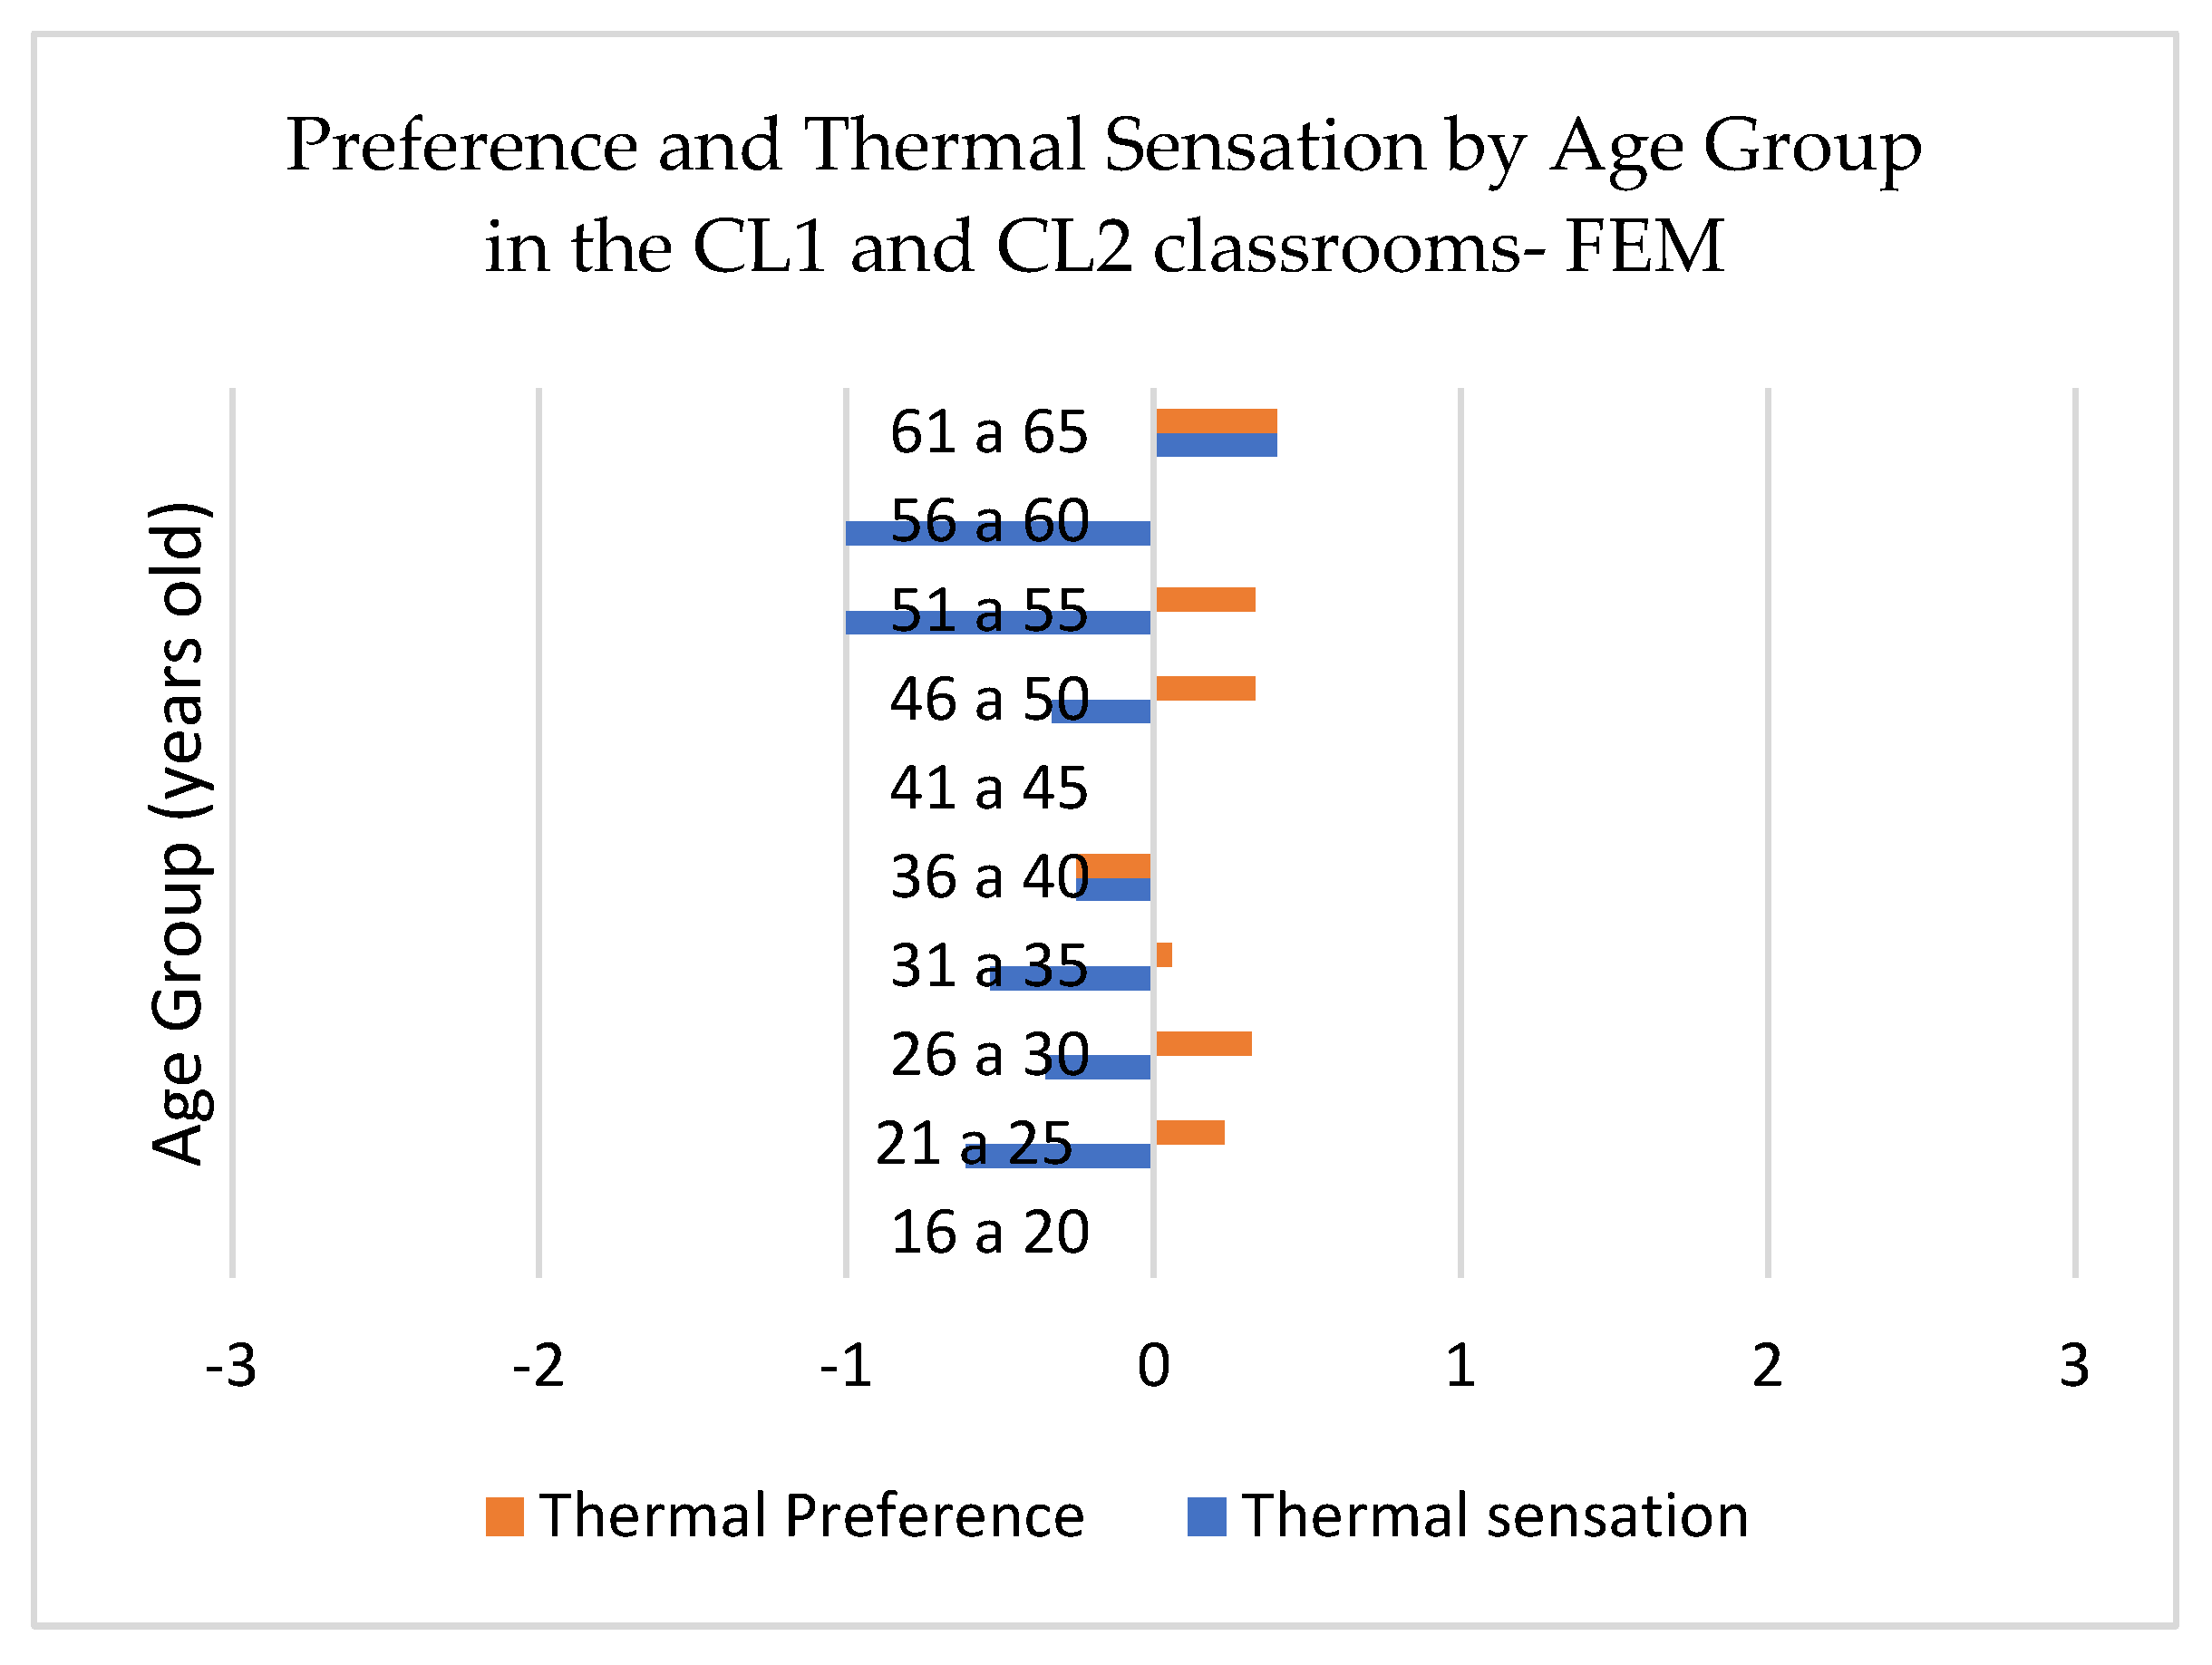
Figure 9 shows the relationship between the sensation and thermal preference of users in classrooms and the age group of users. The thermal sensation of the users indicates a feeling of cold, while they prefer slightly higher temperatures—that is, a slightly warmer environment. This preference for slightly higher temperatures may be an eventual loophole for energy savings in classrooms since they use air-conditioning equipment at the minimum temperature. According to Parra [
45], studies by the Brazilian Association of Refrigeration, Air Conditioning and Ventilation (ABRAVA) prove that raising the air conditioning temperature by two degrees can reduce energy consumption by 7%.
The results show an asymmetrical variation in the seven-point scale in classroom environments, indicating heat. However, this indication of heat is due to the room’s ambience on the third and last floors. This environment has a more significant impact on the thermal load on the roof of the building, according to the survey, set 2, seen in
Table 2. It has a thermal transmittance on the roof equal to (U¹ = 2.06 W/m²K | α² = 0.52). As quoted by the researcher Holanda [
37], parameters of design (orientation, facades, absorbance, transmittance, among others), combined with HVAC (air conditioning), can reduce energy consumption by 34%. Users can spend more energy on environmental comfort when some bioclimatic attributes and material performance are not considered during the design and construction phase of a building.
4.2.2. PMV/PPD of the classrooms
The results in
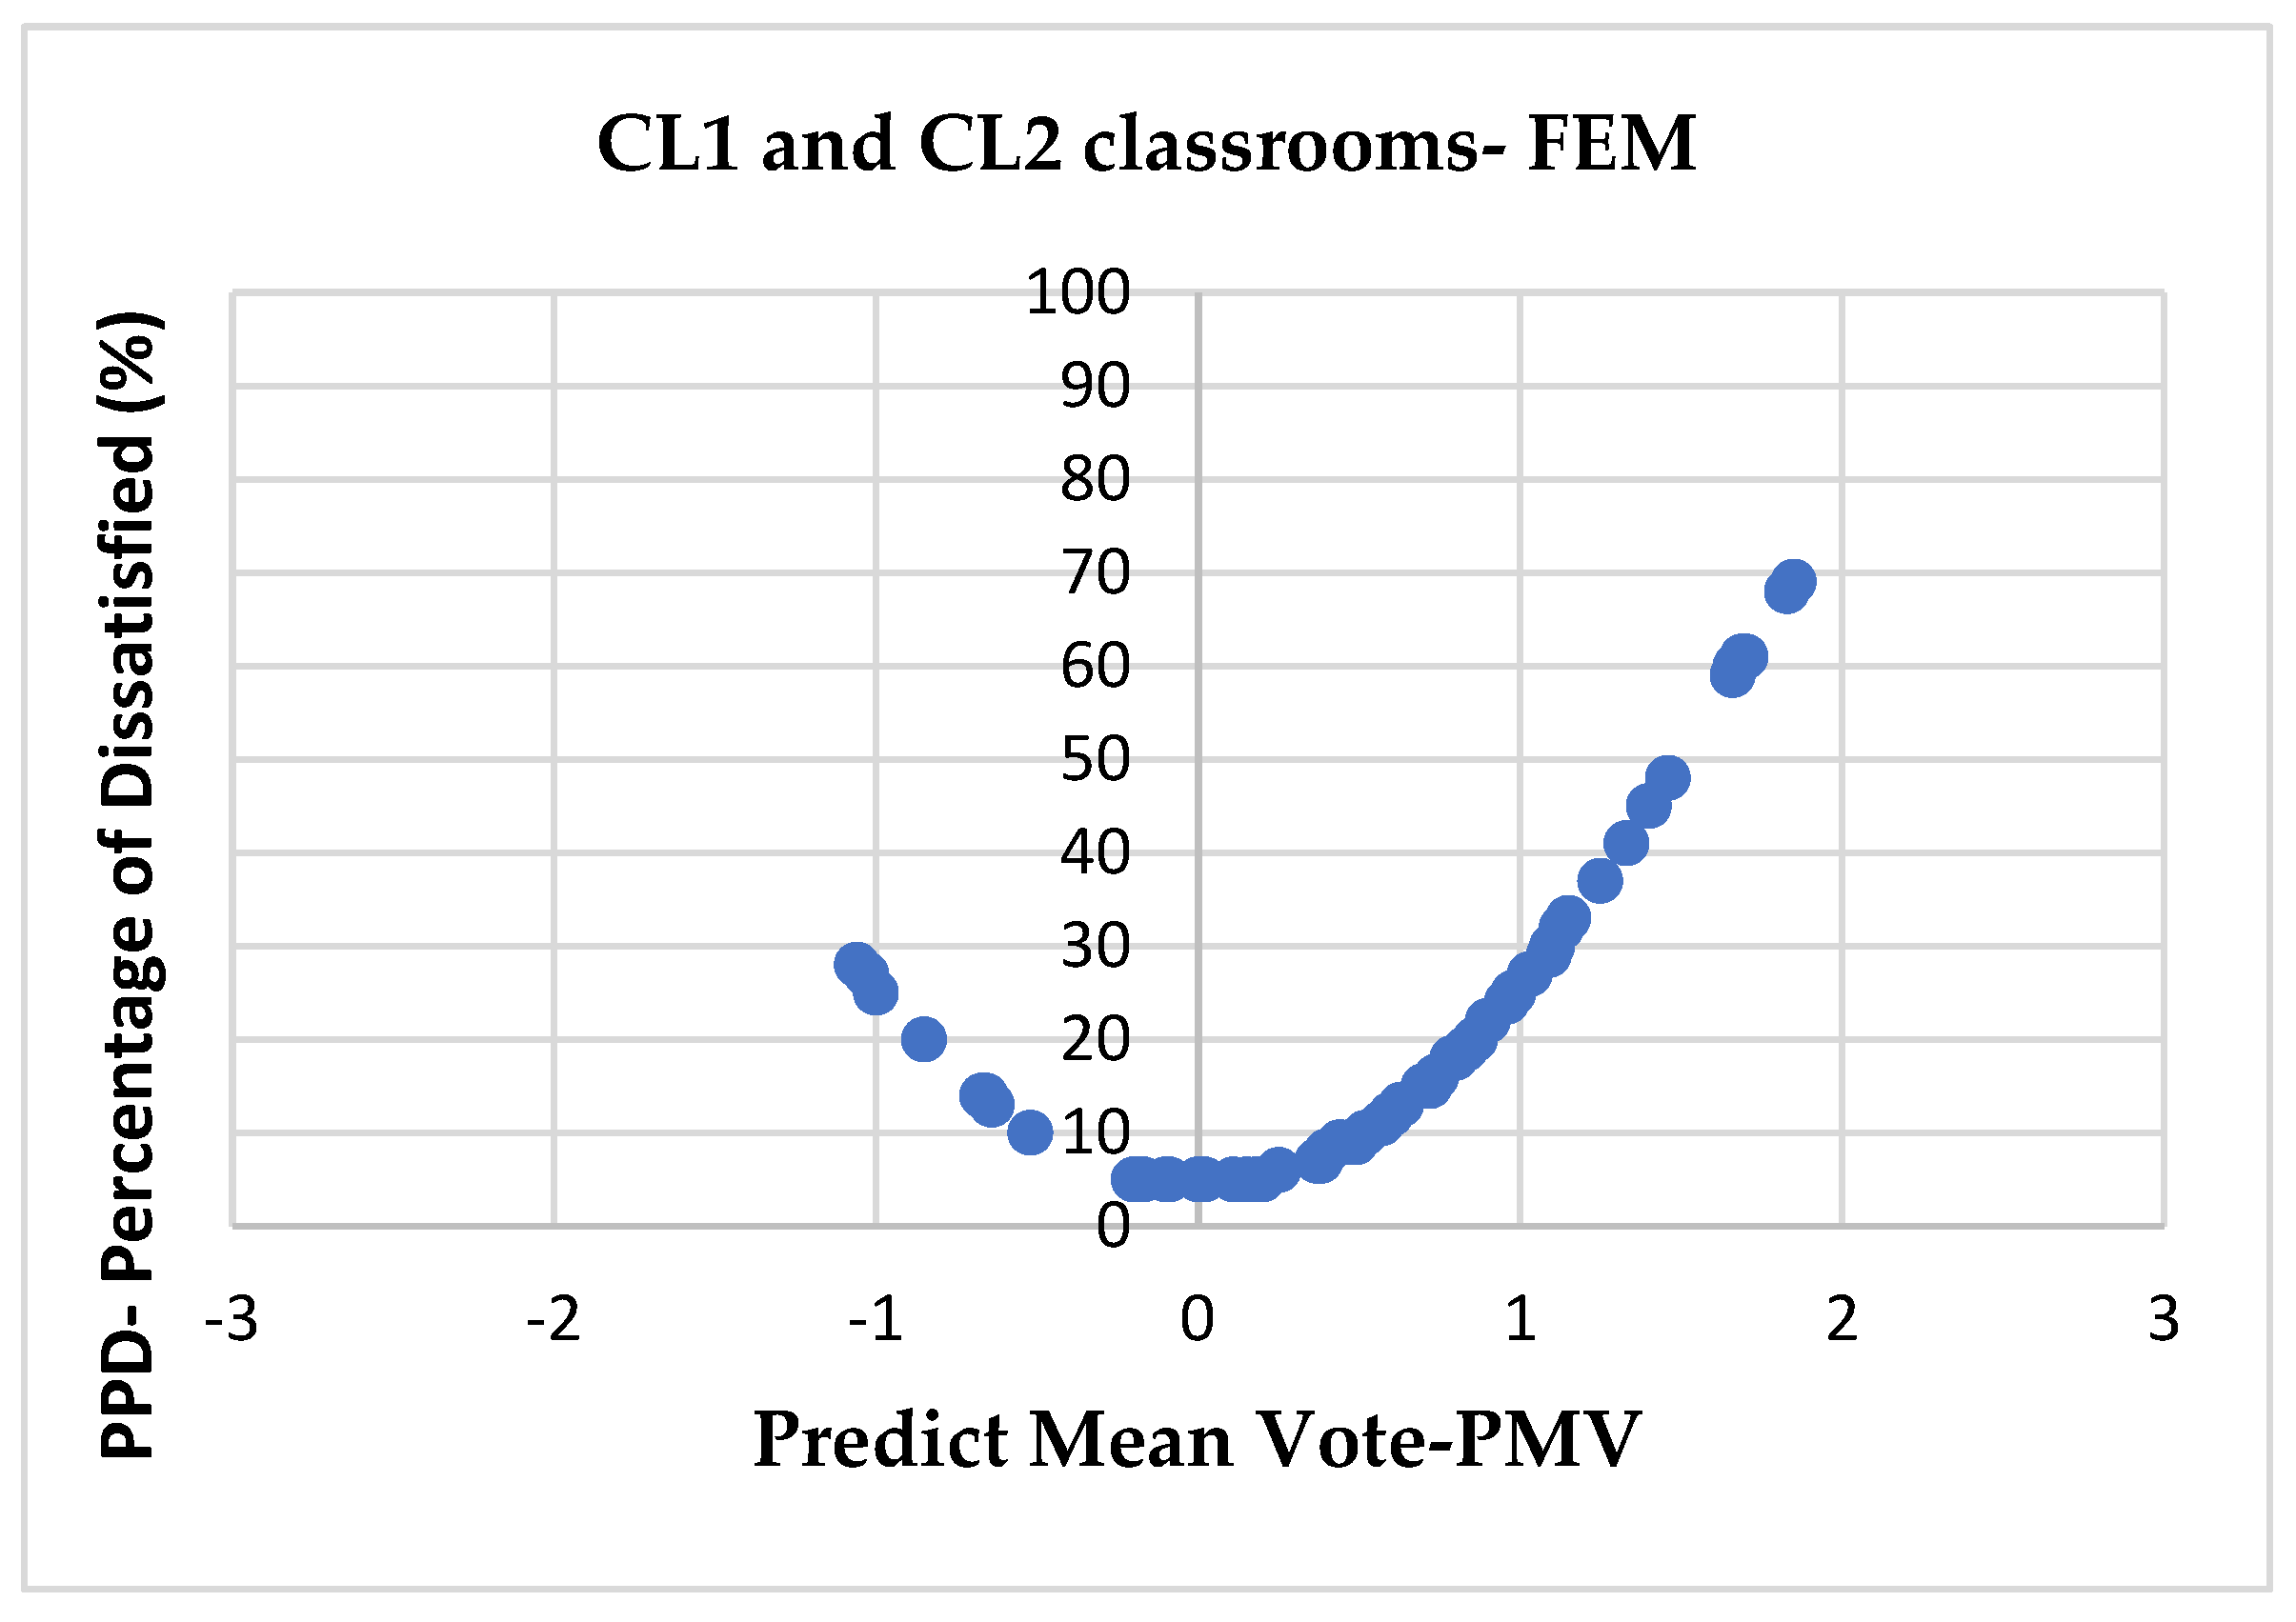
Figure 10 show that the PMV ranged from -1.06, with 28% dissatisfied, to 1.33, reaching 41% dissatisfied in the CL1 classroom, which means results were asymmetric, with a concentration on the positive side that directs to heat. The conditions of
Figure 10 occurred with the air conditioning on and according to the previous orientation of daily use of the environment as usual.
It is interesting to note that when analysing the same data related to the vote of sensation and thermal preference by the age group of users, this level of dissatisfaction due to the heat does not appear, replaced instead with a slight dissatisfaction directed at the cold in the classrooms, as shown in
Figure 9.
In this sense, Faraji et al. [
25] mentioned that it is also interesting to consider aspects such as age and some other parameters that are very important when evaluating thermal comfort that is not or were not considered in some models of comfort analysis. In this case, there is a contradiction in evaluating the data calculated by the Comfort 2.03 program and the real average data of sensation and thermal preference of the users. The user’s voted for slightly cool but preferred slightly warmer environments, as seen in
Figure 9 and
Figure 10.
The data in
Figure 9 and
Figure 10 included the two rooms (CL1 and CL2) as a whole. However, a separate assessment is also helpful since the rooms’ thermal characteristics and locations are distinct.
The result showed the influence of the different locations of the environments of the PMV on the last floor.
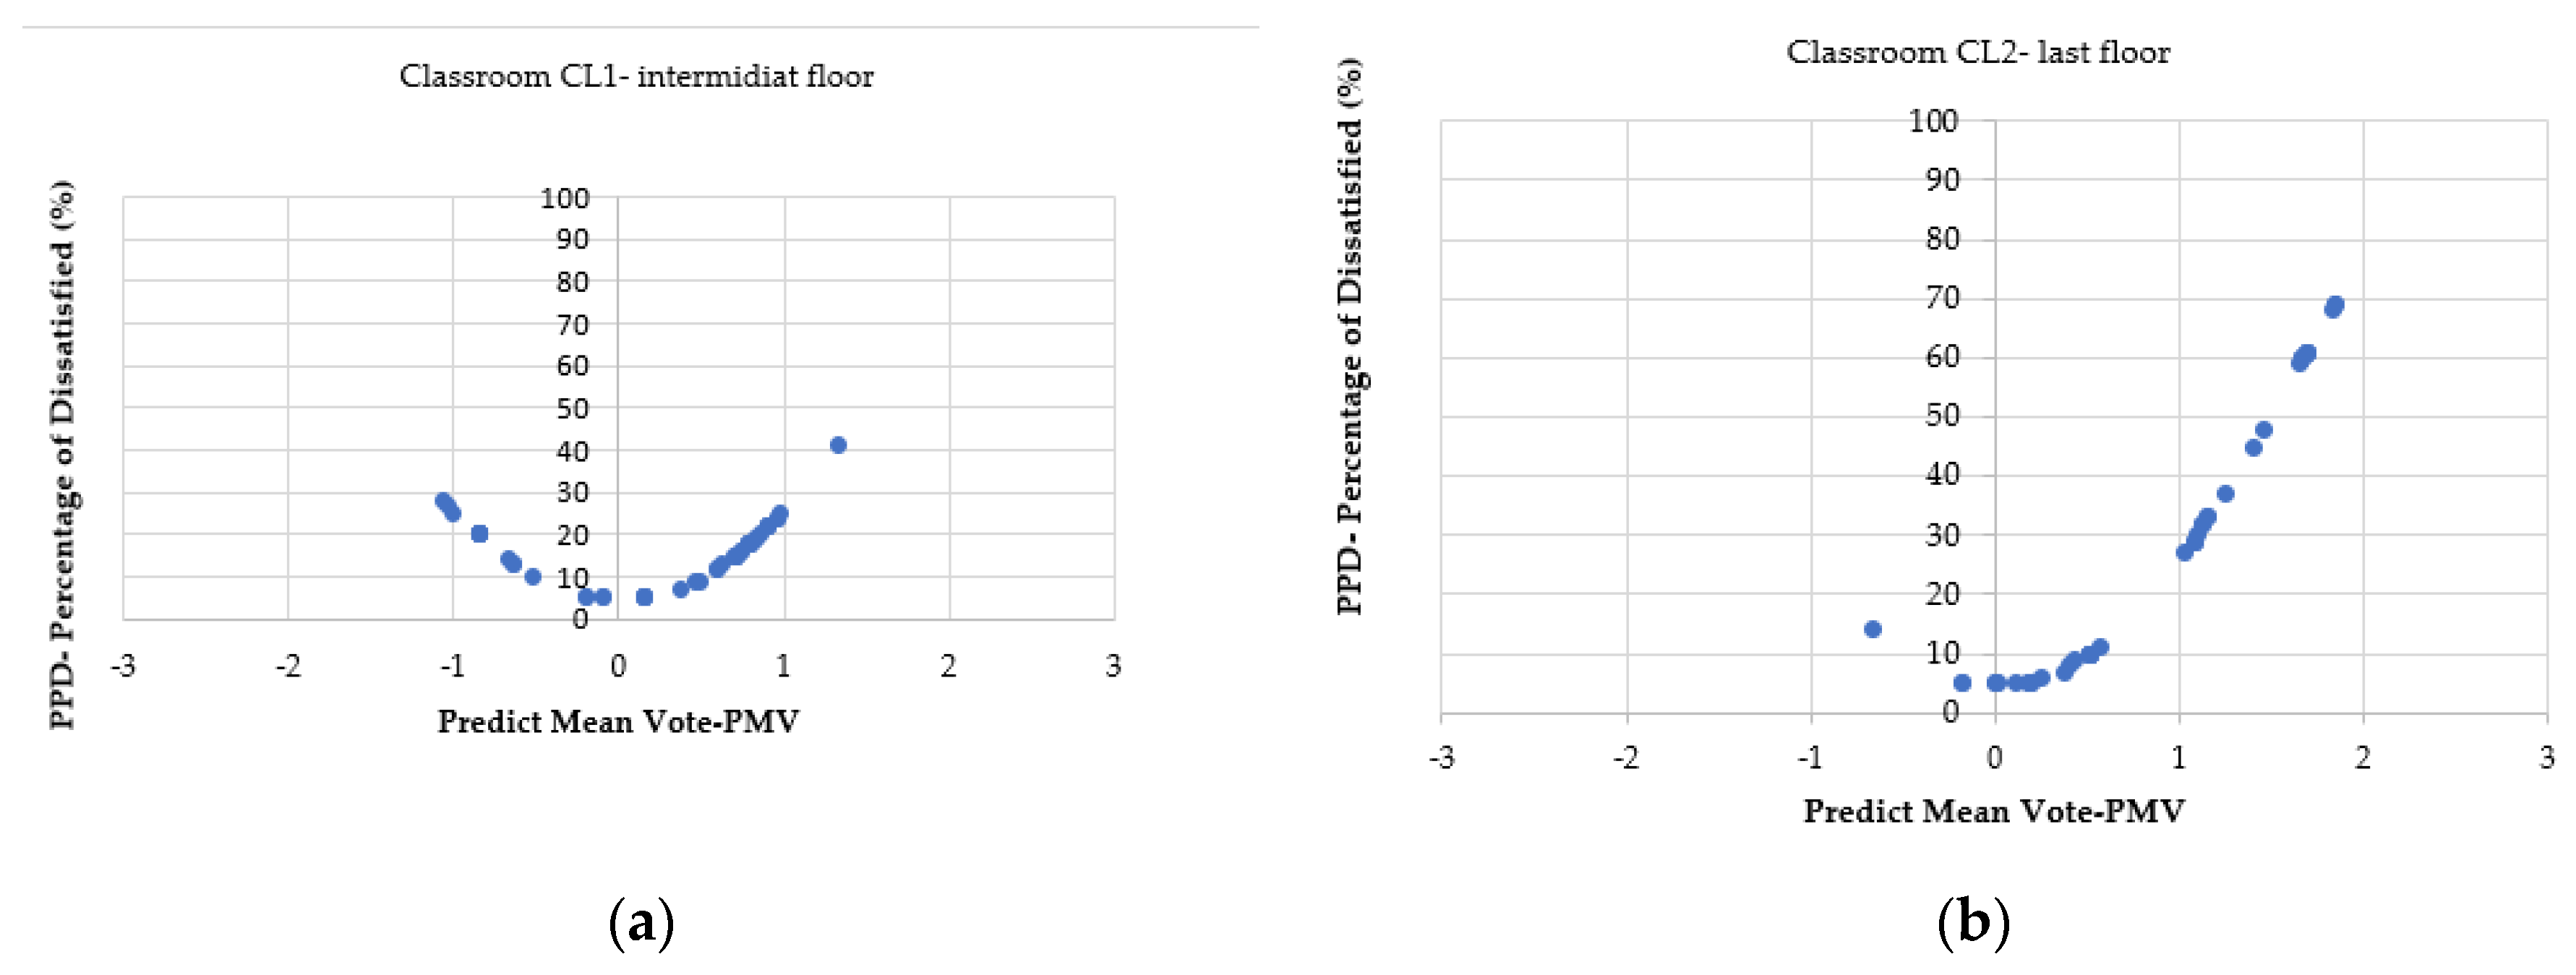
For the CL2 room, located on the intermediate floor by the PMV and PPD, there is a PMV value concentration between -1 and +1. However, a tendency toward discomfort due to heat occurred at a rate of approximately 30%, as shown in
Figure 11a.
In the CL2 room, discomfort due to heat reached about 70%, confirming the expected result of more significant discomfort in proximity to the roof and raising the level of dissatisfaction with the environment. As noted, a return to activities without a previous circulation of internal air to remove the hot air and without mechanical air conditioning makes the environment very uncomfortable, as shown in
Figure 11b.
Table 4 and
Table 5 show results for the mean and standard deviation of the calculated variables (PMV and PPD). The coefficient of variation (CV) of the PMV variable is very high in both rooms compared to the other variables.
The coefficient of variation of the PPD variable of room CL2, as shown in
Table 4, has a much higher value than that of room Cl1 in
Table 3. Additionally, the average value of PPD is much higher than that of CL1.
Table 4 shows the results, described as statistical parameters for Room Cl1 (mean value, standard deviation, and coefficient of variation).
In addition, the values of dissatisfaction perceived by users in room CL2 show more dispersion compared to room CL1, which is demonstrated by the comparison of the coefficient of variation between the two rooms.
Table 5.
Statistical parameters of the sample data for room CL2 (45 questionnaires).
Table 5.
Statistical parameters of the sample data for room CL2 (45 questionnaires).
| CL2 |
PMV |
PPD |
(Icl) |
| Average |
0.09 |
28 |
0.50 |
| Standard Deviation |
0.80 |
23 |
0.12 |
| Coefficient of Variation (%) |
888% |
82% |
24% |
The comparison between the coefficient of variation (CV) for PMV of room CL2 and CL1 shows that the variability of answers of CL2 is much higher than those of CL1. Part of this can be explained by the higher exposition to solar irradiance of JE3 since it is under the top of the building (
Figure 2. b, block J). In addition to the solar irradiance exposition, the material construction of the roof of building 2 is concrete slab and fibre cement tile with high thermal transfer parameters. The CL1 is on the intermediary floor of the building, thus with low solar irradiance exposition, which results in less variability in the ’s perception of users.
In the comparison of the averages of the isolation variables (Icl-Clo) of users’ clothing in both rooms, it is noticed that the difference in the average is only 0.1 (clo) and 2% with regard to the coefficient of variation between the interviewees of the two environments, according to data shown in
Table 3 and
Table 4.
Table 6 shows the results obtained through the measurements for the two rooms, CL1 and CL2. Based on the data, it is possible to verify that in the first measurement schedule at 9:00, the internal temperature is very close to the external one, being very close in both. CL2 was slightly lower. The air is turned on at the beginning of activities in both rooms.
Air conditioners are turned off at 11:30 am and switched on when users return at 2:00 pm. At that time, the temperature of the CL2 room again equalled the outside temperature. This situation might affect the roof since, in room CL1, there were no significant increases in temperature in the same range.
In room CL2, it is possible to notice that the internal temperature at 2 pm is close to the external temperature, with a difference of 1.4 °C, which may explain the dissatisfaction with the environment since the air conditioners were turned off during the lunch break activities restarting again at 2 pm in a scorching environment.
4.2.2. Office rooms
The offices were evaluated according to actual use; some environments were designed for individual use, while others were shared. The evaluation was also performed according to daily use and oriented to maintain use. Therefore, all data were collected with the air conditioning always on.
Questionaries
In the office room environments, users responded to 102 questionnaires. The percentage of women using the office room environment was 62%, and 38% of men (
Table 3). The data details of the office room environments investigated in the university are shown in
Table 7.
The average age of office users was 47 years, and when evaluating the group of women, the average age was 47.5 years and 49.2 years for men.
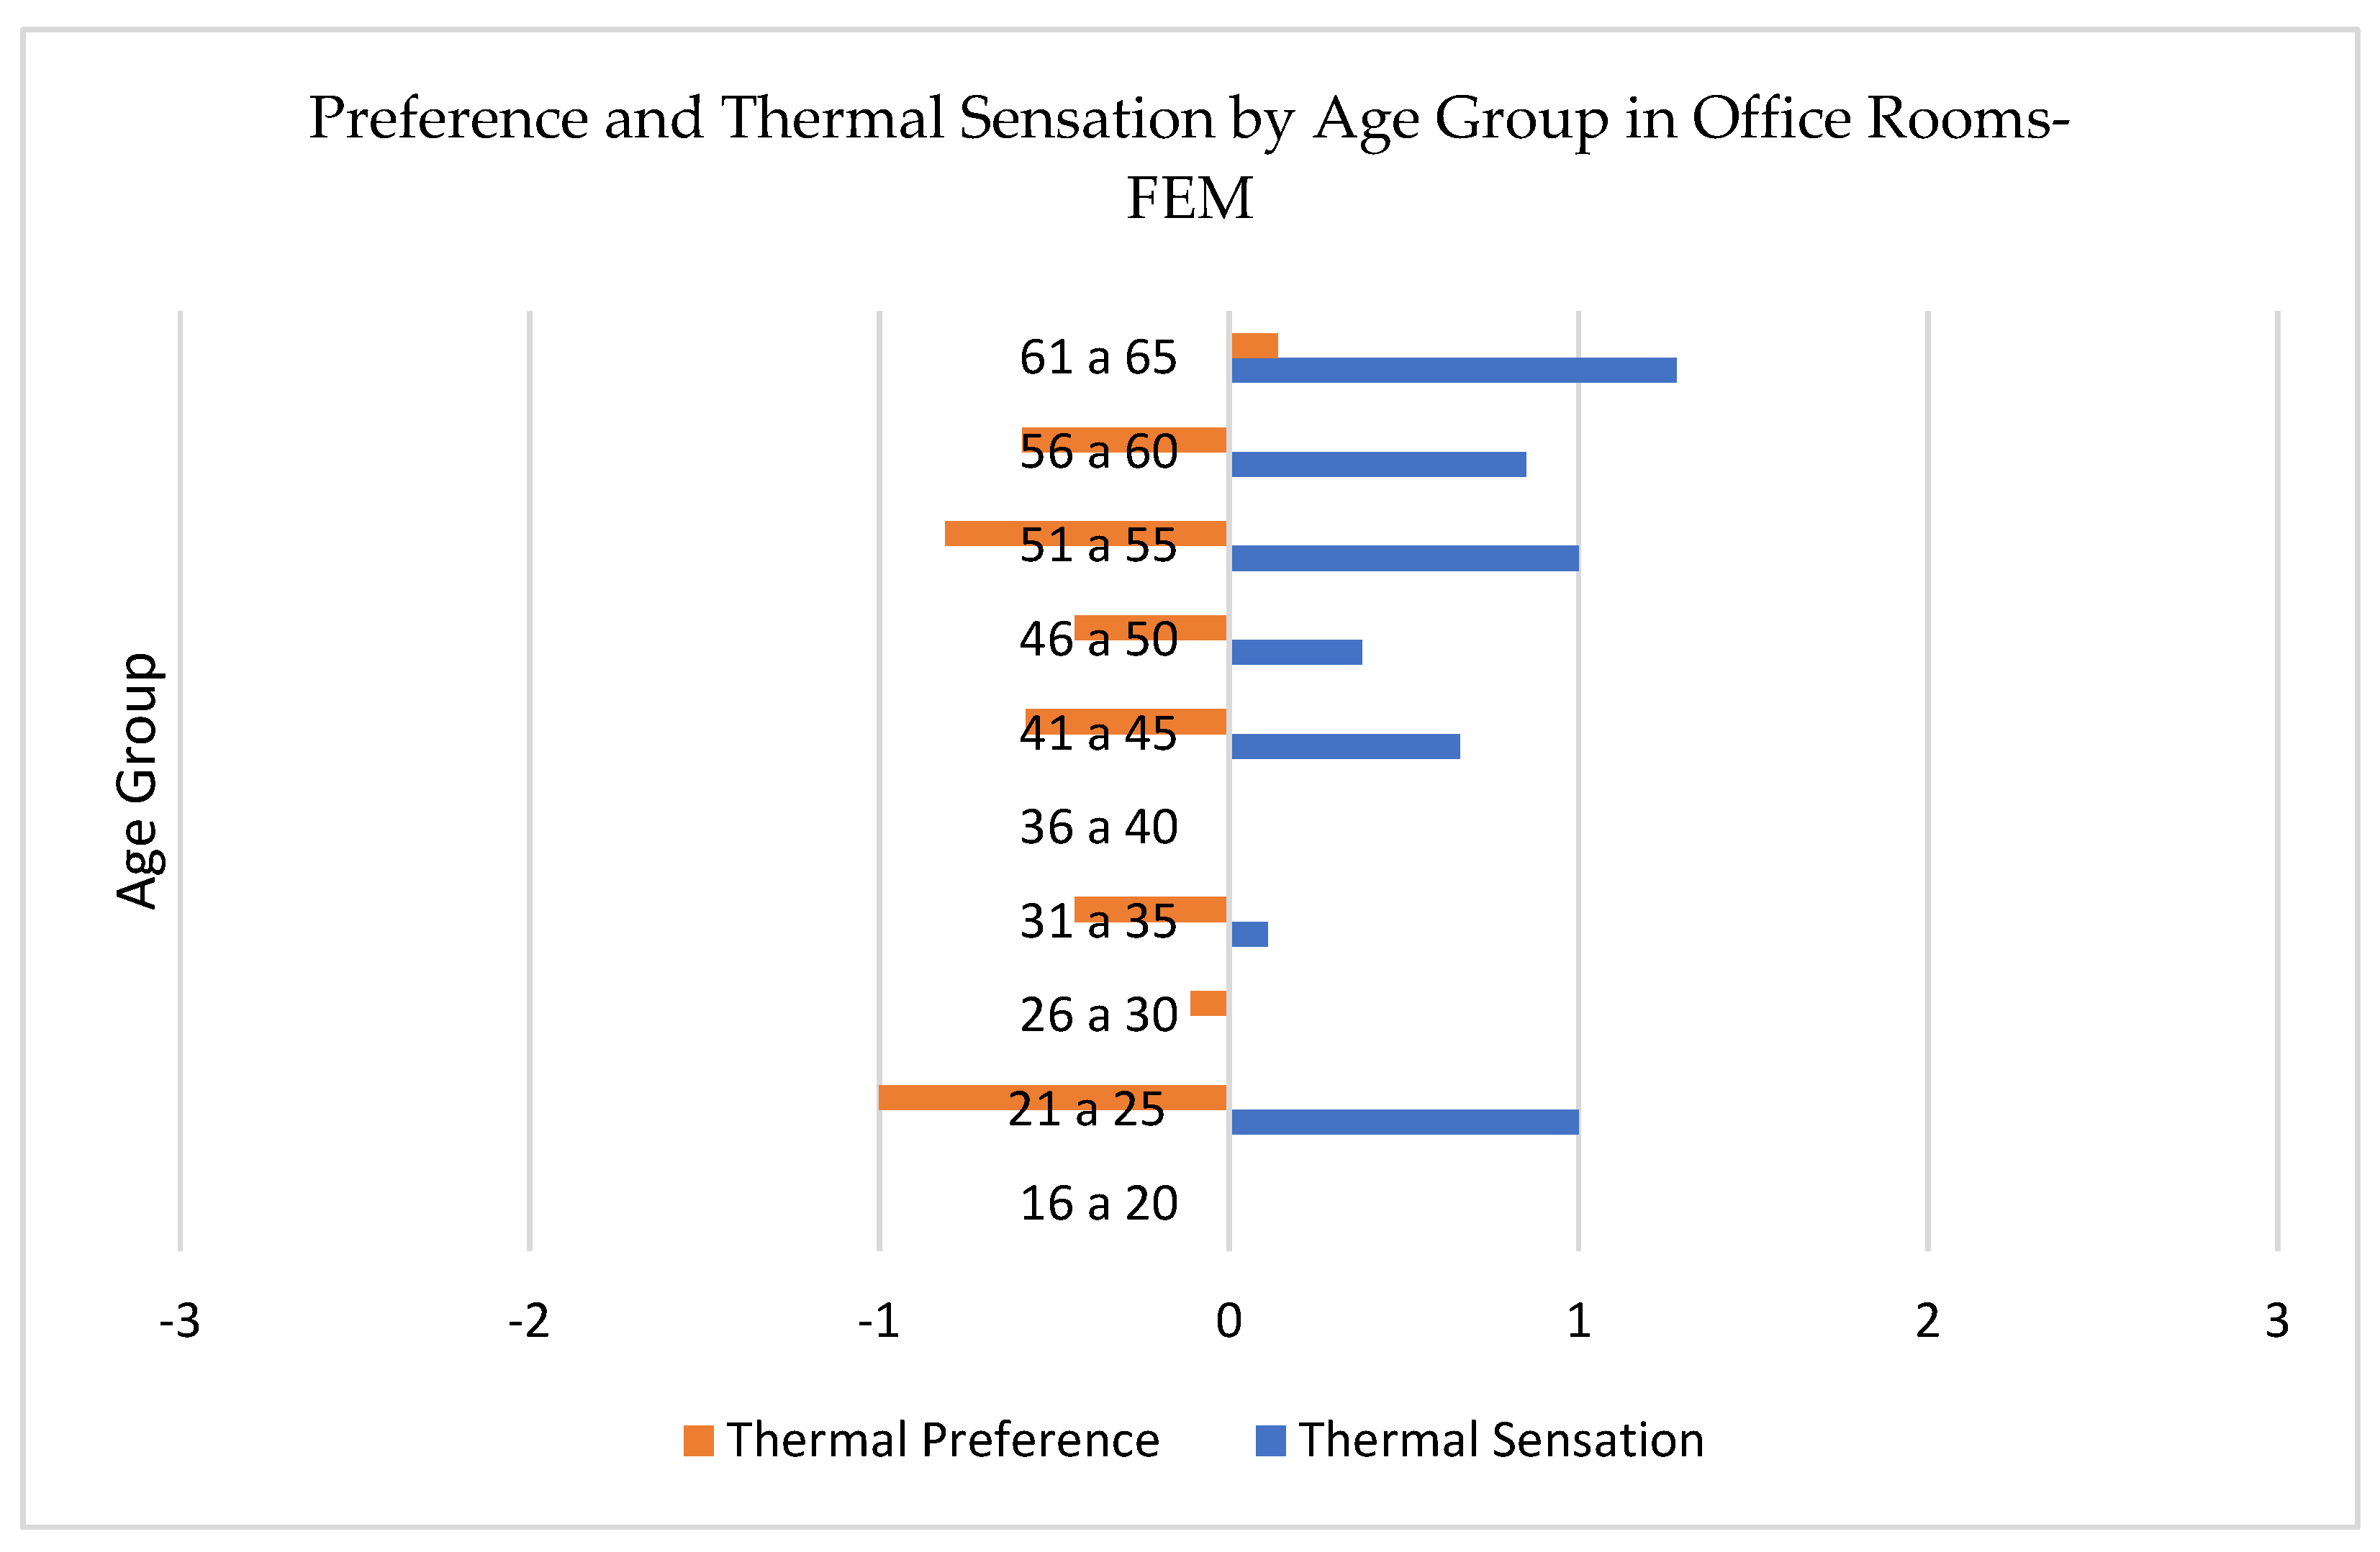
The relationship between the sensation and thermal preference of users in classrooms and the age group of users is shown in
Figure 12. The lowest age found for users in FEM office environments was 24 years old, and the maximum was 65 years old. In these office environments, there were no users in the three age groups, 16 to 20, 26 to 30 years old, and 36 to 40 years old (
Figure 12).
The age group with the highest representation in the offices was, in ascending order, the 31 to 35 age group and the 46 to 50 age group. The second largest group was between 51 and 55 years old, and the third was between 56 and 60. Notably, all users of the surveyed environments participated in the survey. They said, “They insisted on participating because they considered the environment uncomfortable.”
The thermal sensation vote ranged from 0.11 in the 31 to 35 age group, while in the 46 to 50 age group, it was 0.38; in the 51 to 55 age group, it was 1; and in the 61 to 65 age group, it was 1.28.
The average thermal preference vote in these same age groups was -0.44 in the 31 to 35 and 46 to 50 age groups. The average thermal preference vote in the 51-55 age group was -0.81. In the age group of those 56 to 60 years old, it was -0.59.
Environments remained wholly closed during the night. When arriving early, users turn on the air conditioning equipment and leave it on until lunchtime at noon. The equipment is turned off during the interval between leaving and returning from lunch. The devices are turned on again when people return to their work environment and are only turned off at the end of the day. Additionally, as observed in the study, a relatively common case at the university is opening the windows and “forgetting”, leaving them open for a long time, or even all day, with the air conditioning on.
4.2.3. PMV/PPD—office rooms
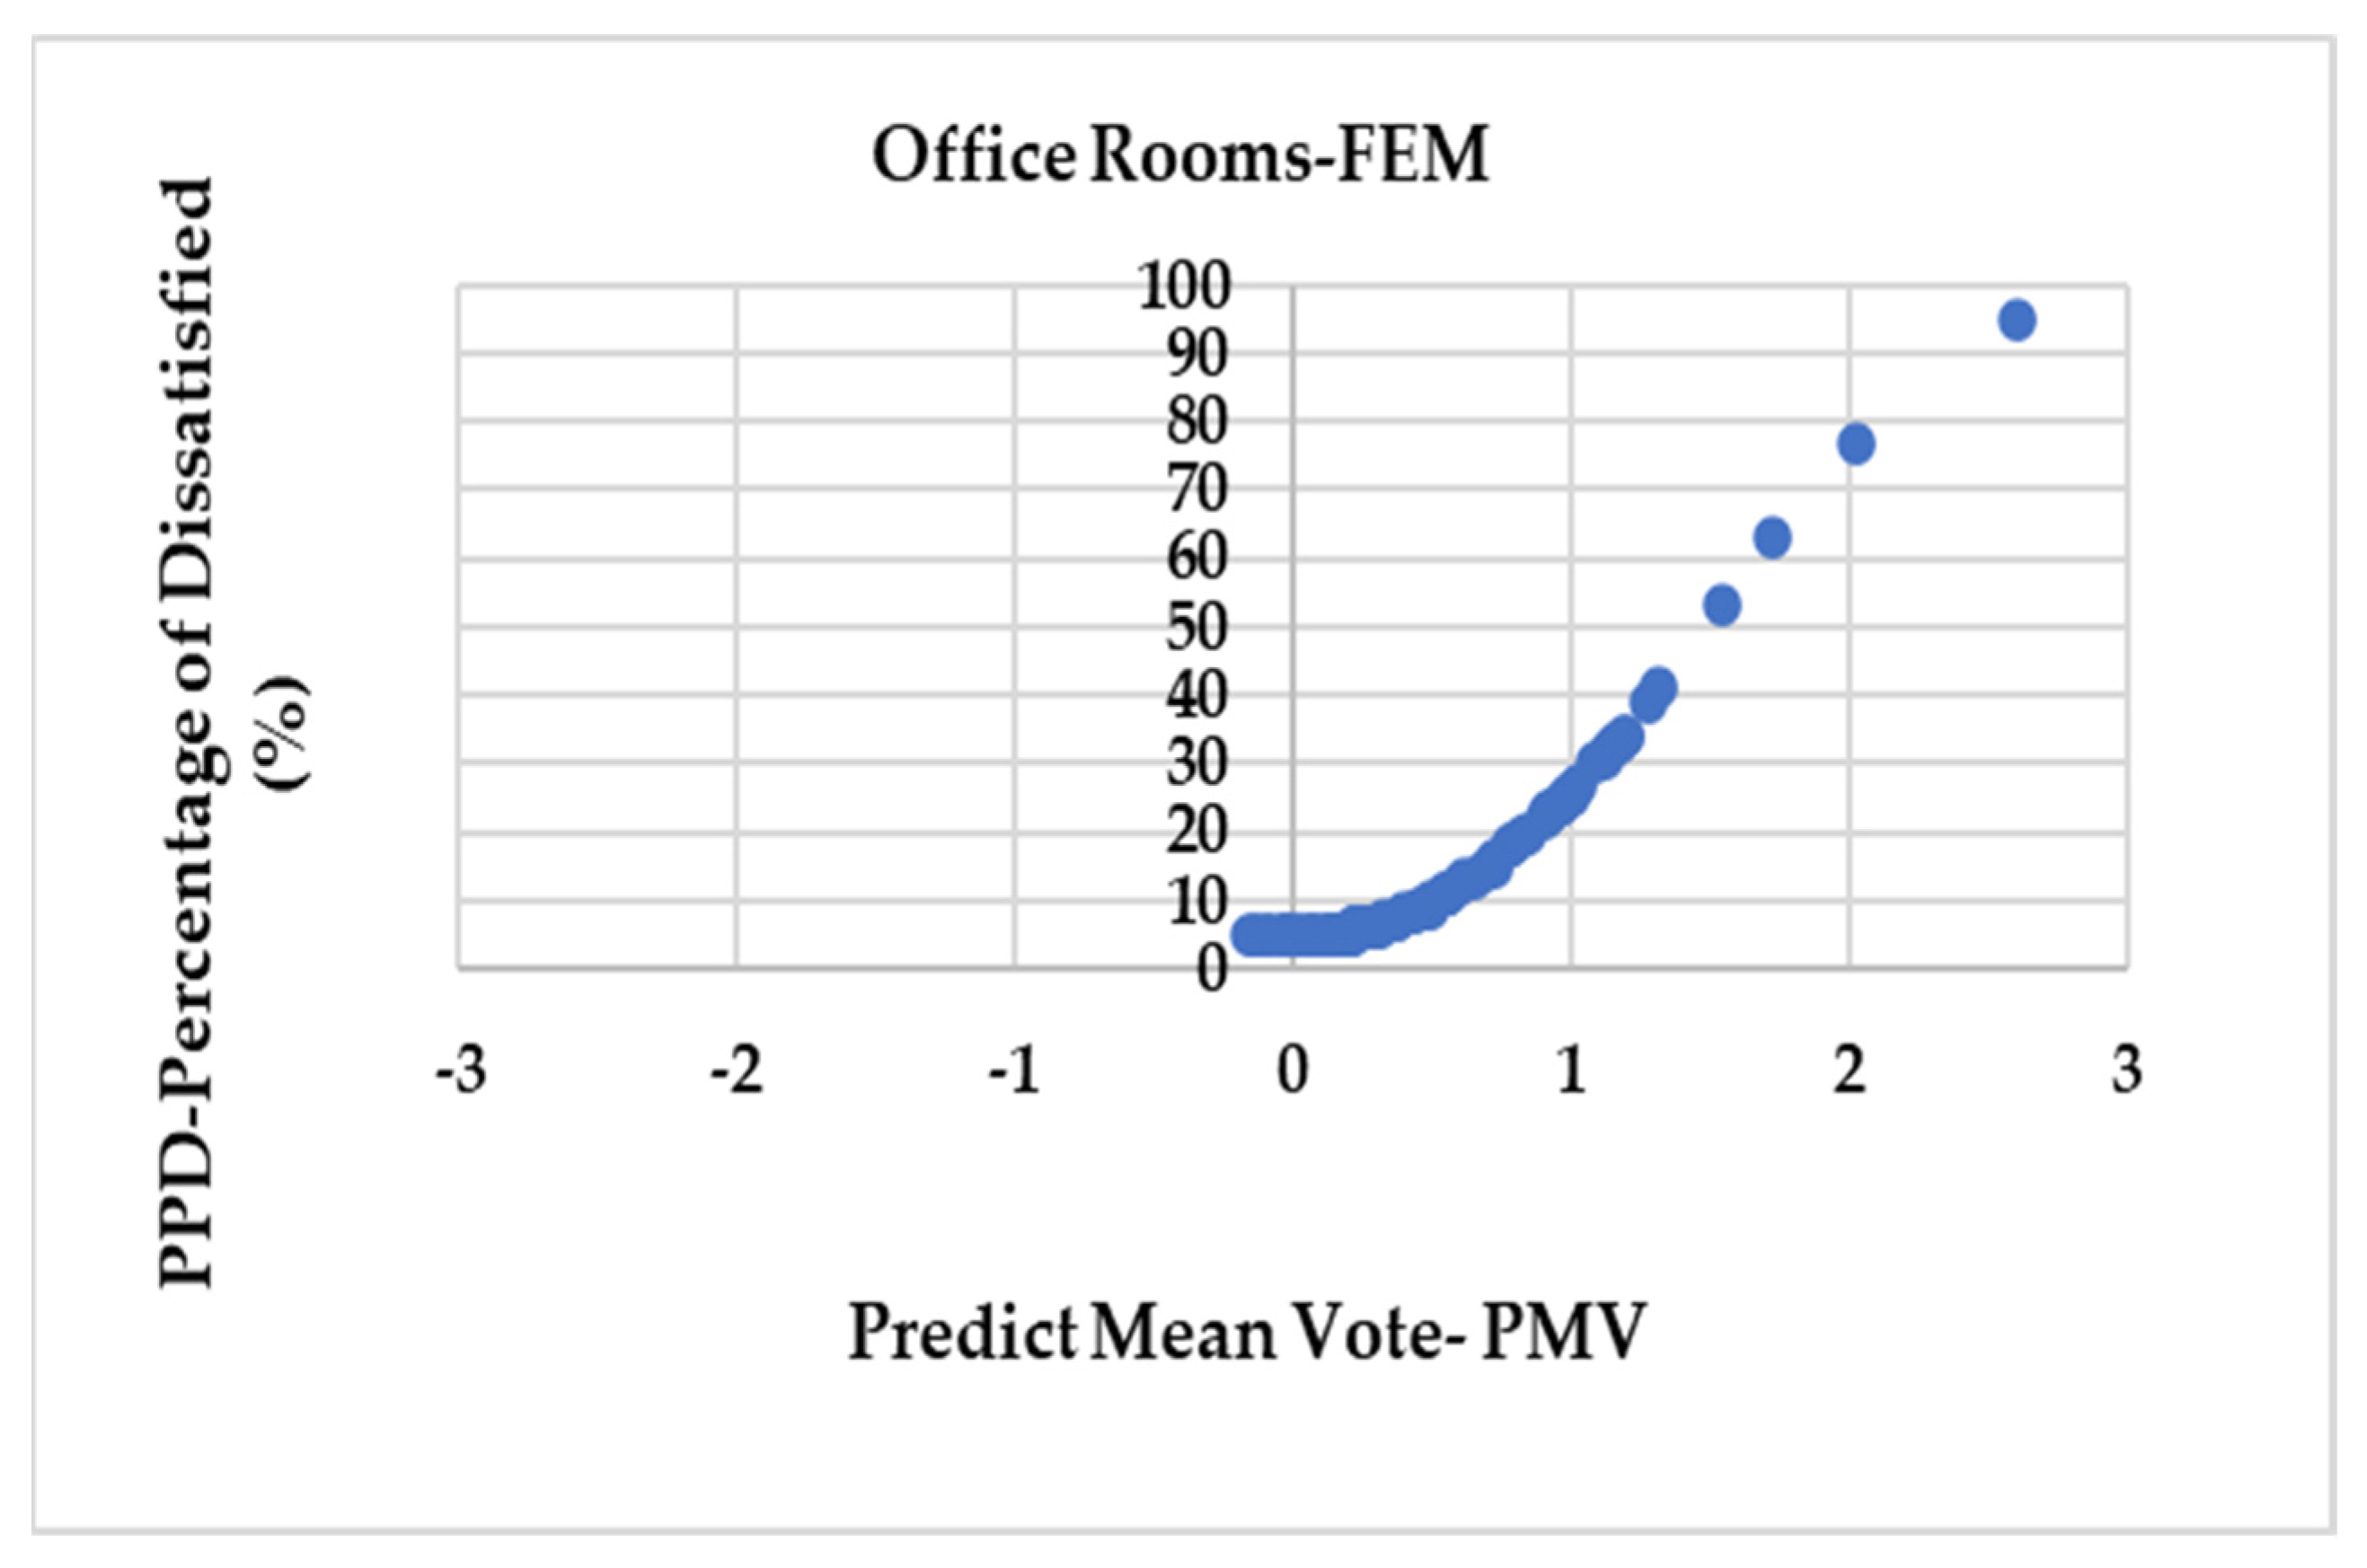
The predicted mean value of the thermal sensation votes of respondents inside office rooms of FEM ranged from neutral (-0.16) to very hot (+2.61), which is asymmetric, indicating a warmer environment.
In
Figure 13, asymmetry in the PMV scale ranging from -0.16 to + 2.91 in office environments is shown. Such asymmetry indicates dissatisfaction due to heat on the part of users. There was a higher concentration between +0.13 and +1.32. The PPD varied between -0.16 at 5% and 2.91 at 95%, concentrated between 5% and 41%.
Table 8.
Statistical parameters of the sample data for office rooms (102 questionnaires).
Table 8.
Statistical parameters of the sample data for office rooms (102 questionnaires).
| Office |
PMV |
PPD (%) |
Iclo-clo |
| Average |
0.52 |
14.59 |
0.48 |
| Standard Deviation |
0.49 |
15.28 |
0.12 |
| Coefficient of Variation (%) |
94.23 |
104.73 |
25 |
| TBS |
9:00 am |
11:30 am |
2:00 pm |
4:30 pm |
| Average air temperature outside |
27.7 |
30.65 |
31.5 |
30.9 |
| Average TBS inside |
25.81 |
25 |
25.75 |
26 |
5. Conclusions
Given the collected data, survey results, and discussions, it is clear that interventions in buildings are necessary to mitigate the low energy efficiency achieved in the selected buildings of the University of Campinas. Due to the architectural orientation and the use of spaces, interventions should focus on the internal environments to the detriment of the external ones since the area around the buildings already has vegetation with no prospect of expansion.
Therefore, interventions are needed to improve the efficiency and quality of equipment, whether lighting or air conditioning, given that these are used continuously for long periods of days and weeks. The environments generated discomfort for users due to inadequate lighting or the continuous dependence on appliances to improve thermal comfort.
Many pieces of equipment presented a technology lag, consuming unnecessary energy resources. They perform differently from their initial specifications, given the long period of use compared to the current technologies available. In this sense, the replacement of fluorescent lamps for LED lamps, as well as the replacement of air conditioning equipment for new ones with advanced technology, can contribute to a decrease in energy expenditure, a better energy efficiency rating, and an increase in the thermal comfort of the users of the room.
In the thermal comfort study, users showed a high level of dissatisfaction with the environment, around 95% due to heat, even with the air conditioning in office rooms. In this sense, some aspects were found that may be related to the low thermal performance of buildings. Some of them are as follows:
i) Inappropriate dimensions of environments related to the air conditioner;
ii) Inappropriate use of air conditioning equipment;
iii) Inappropriate use of constructive technologies (opening and closing windows and doors);
iv) Need for easy access to change the equipment setpoint for users;
v) Lack of changes in the worktable position inside the room offices to reach better performance and thermal comfort for users;
vi) Location, types, and quality of materials.
All these elements can enhance performance in the buildings for users. On the other hand, users should pay more attention to turning on the air conditioner and closing the windows and doors at the right moments.
Author Contributions
Conceptualization, E.F.T.B., L.C.L.; methodology, E.F.T.B., L.C.L, A.P.A.S.C.; formal analysis, E.F.T.B., A.P.A.S.C., F.S.D.L.; investigation, E.F.T.B., A.P.A.S.C.; writing—original draft preparation, E.F.T.B., A.P.A.S.C.; supervision, L.C.L., All authors have read and agreed to the published version of the manuscript.
Funding
This research was funded by the CPFL Energy Company- Companhia Paulista de Força e Luz, grant number 00063 -3032 /2017 - PA3032.
Informed Consent Statement
This study was conducted in accordance with Ethical Conduct in Human Research from the Research Ethics Committee (CEP) of the University of Campinas- Unicamp. (2018) and approved by the Ethics Committee of the University of Campinas, São Paulo. CAAE: 87220518.3.0000.8142 and authorization (protocol code 3.087.904 and date of approval: 12/17/2018. Home page: /
http://www.prp.unicamp.br/index.php/comite-de-etica-em-pesquisa/.
Data Availability Statement
The datasets presented in this study are available on request to the corresponding author, subject to the approval of the CPFL Brazil.
Acknowledgments
This work was developed under the Electricity Sector Research and Development Program PD 00063 -3032 /2017 - PA3032: “Sustainable campus model at the University of Campinas - Brazil: An integrated living lab for renewable energy, electric mobility, energy efficiency, monitoring and energy demand management”, regulated by the National Electricity Agency (ANEEL in Portuguese), in partnership with CPFL Brazil (Local Electricity Distributor). Acknowledgement is due to the School of Mechanical Engineering for supporting the research with field study.
Conflicts of Interest
The authors declare no conflict of interest.
References
- International Energy Agency International Energy Agency (IEA) World Energy Outlook 2022; 2022.
- Kong, X.; Lü, S.; Xin, Y.; Wu, W. Energy Consumption, Indoor Environmental Quality, and Benchmark for Office Buildings in Hainan Province of China. J Cent South Univ 2012, 19, 783–790. [Google Scholar] [CrossRef]
- Li, D.H.W.; Yang, L.; Lam, J.C. Zero Energy Buildings and Sustainable Development Implications – A Review. Energy 2013, 54, 1–10. [Google Scholar] [CrossRef]
- Skillington, K.; Crawford, R.H.; Warren-Myers, G.; Davidson, K. A Review of Existing Policy for Reducing Em bodied Energy and Greenhouse Gas Emissions of Buildings. Energy Policy 2022, 168, 112920. [Google Scholar] [CrossRef]
- Economidou, M.; Todeschi, V.; Bertoldi, P.; D’Agostino, D.; Zangheri, P.; Castellazzi, L. Review of 50 years of EU Energy Efficiency Policies for Buildings. Energy Build 2020, 225, 110322. [Google Scholar] [CrossRef]
- Fossati, M.; Scalco, V.A.; Linczuk, V.C.C.; Lamberts, R. Building Energy Efficiency: An Overview of the Brazilian Residential Labeling Scheme. Renew. Sustain. Energy Rev. 2016, 65, 1216–1231. [Google Scholar] [CrossRef]
- BRASIL. Instituto Nacional de Metrologia Normalização e Qualidade Industrial Portaria 372, de 17 de Setembro de 2010. Regulamento Técnico da Qualidade para o Nível de Eficiência Energética de Edificações Comerciais, de Serviços e Públicas; INMETRO: Rio de Janeiro, 2010. [Google Scholar]
- BRASIL. Instituto Nacional de Metrologia Normalização e Qualidade Industrial Portaria No 18,de 16 de Janeiro de 2012. Regulamento Técnico Da Qualidade Para o Nível de Eficiência Energética de Edificações Residenciais.; Rio de Janeiro. 2012.
- Tubelo, R.C.S.; Rodrigues, L.T.; Gillott, M. A Comparative Study of the Brazilian Energy Labelling System and the Passivhaus Standard for Housing. Buildings 2014, 4, 207–221. [Google Scholar] [CrossRef]
- Batista, N.D.N.; Rovere, E.L. La; Aguiar, J.C.R. Energy Efficiency Labeling of Buildings: An Assessment of the Brazilian Case. Energy Build 2011, 43, 1179–1188. [Google Scholar] [CrossRef]
- Lopes, M.; Iwamoto, G.; Riella, H.; Lamberts, R.; Campos, L. The Building Simulation as an Alternative Method in Brazilian Energy Efficiency Labelling Commercial Buildings. In Proceedings of the 12h Conference of International Building Performance Simulation Association; IBPSA: Sydney, 2011; pp. 2055–2063. [Google Scholar]
- BRASIL. MINISTÉRIO DO PLANEJAMENTO ORÇAMENTO E GESTÃO Instrução Normativa No 2, de 4 de junho de 2014; Diário Oficial [da] República Federativa do Brasil: Brasília, Brasília, DF, Brasil, 2014. [Google Scholar]
- Tomazi, J.O.; Rodrigues, L.J.; Schneider, P.S. Auditoria Energética Visando O Selo Procel De Economia De Energia Para Uma Edificação Pública De Ensino / Energy Audit Aiming At the Procel Seal of Energy Savings for a Public Education Building. Braz. J. Dev. 2020, 6, 99648–99664. [Google Scholar] [CrossRef]
- Moraes, C.S. de; Fonseca, A.L.A. da Automação Predial: Tecnologia e Gestão Em Prol Da Eficiência Energética Em Prédios Públicos. In Proceedings of the Encontro Nacional de Conforto no Ambiente Construído, 15; ANTAC, Ed.; ANTAC: João Pessoa; pp. 2216–2225.
- Sá, E.M.H. De; Oliveira, R.D. Análise de Medidas Aplicáveis à Edificação Pública Escolar Para Obtenção Da Classificação A Na Etiqueta Nacional de Conservação de Energia. In Proceedings of the Encontro Nacional de Conforto no Ambiente Construído, 15; ANTAC, Ed.; ANTAC: João Pessoa, 2019; pp. 2159–2168. [Google Scholar]
- University of Campinas Sustainable Campus Project Available online: https://campus-sustentavel.unicamp.br/en/home-2/.
- Moore, C.; Shrestha, S.; Gokarakonda, S. Building Energy Standards and Labelling in Europe; Wuppertal, 2019.
- Brasil. Ministério de Minas e Energia Balanço Energético Nacional 2021: Ano Base 2020. Rio de Janeiro, 2021.
- Liang Wong, I.; Krüger, E. Comparing Energy Efficiency Labelling Systems in the EU and Brazil: Implications, Challenges, Barriers and Opportunities. Energy Policy 2017, 109, 310–323. [Google Scholar] [CrossRef]
- Nakamura, N.K.; Maciel, L.F.; Carlo, J.C. Impactos de Medidas de Conservação de Energia Propostas No PBE Edifica Para o Nível de Eficiência Energética de Envoltórias de Um Edifício Naturalmente Condicionado. Ambiente Construído 2013, 13, 105–119. [Google Scholar] [CrossRef]
- Melo, A.P.; Sorgato, M.J.; Lamberts, R. Building Energy Performance Assessment: Comparison between ASHRAE Standard 90.1 and Brazilian Regulation. Energy Build 2014, 70, 372–383. [Google Scholar] [CrossRef]
- Melo, A.P.; Versage, R.S.; Sawaya, G.; Lamberts, R. A Novel Surrogate Model to Support Building Energy Labelling System: A New Approach to Assess Cooling Energy Demand in Commercial Buildings. Energy Build 2016, 131, 233–247. [Google Scholar] [CrossRef]
- Hien, W.N.; Jusuf, S.K. An Assessment Method for Existing Greenery Conditions in a University Campus. Arch. Sci Rev 2008, 51, 212–222. [Google Scholar] [CrossRef]
- Antoniadou, P.; Papadopoulos, A.M. Occupants’ Thermal Comfort: State of the Art and the Prospects of Personalized Assessment in Office Buildings. Energy Build 2017, 153, 136–149. [Google Scholar] [CrossRef]
- Faraji, A.; Rashidi, M.; Rezaei, F.; Rahnamayiezekavat, P. A Meta-Synthesis Review of Occupant Comfort Assessment in Buildings (2002–2022). Sustainability (Switzerland) 2023, 15. [Google Scholar] [CrossRef]
- Elnaklah, R.; Ayyad, Y.; Alnusairat, S.; AlWaer, H.; AlShboul, A. A Comparison of Students’ Thermal Comfort and Perceived Learning Performance between Two Types of University Halls: Architecture Design Studios and Ordinary Lecture Rooms during the Heating Season. Sustainability 2023, 15, 1142. [Google Scholar] [CrossRef]
- ASHRAE Standard 55-2017: Thermal Environmental Conditions for Human Occupancy; Atlanta, 2017.
- Singh, M.K.; Ooka, R.; Rijal, H.B.; Kumar, S.; Kumar, A.; Mahapatra, S. Progress in Thermal Comfort Studies in Classrooms over Last 50 Years and Way Forward. Energy Build, 2019; 188–189, 149–174,. [Google Scholar] [CrossRef]
- Mamani, T.; Herrera, R.F.; Rivera, F.M. La; Atencio, E. Variables That Affect Thermal Comfort and Its Measuring Instruments: A Systematic Review. Sustainability (Switzerland) 2022, 14. [Google Scholar] [CrossRef]
- Wargocki, P.; Wyon, D.P. Providing Better Thermal and Air Quality Conditions in School Classrooms Would Be Cost-Effective. Build Env. 2013, 59, 581–589. [Google Scholar] [CrossRef]
- Sorgato, M.J.; Melo, A.P.; Lamberts, R. The Effect of Window Opening Ventilation Control on Residential Building Energy Consumption. Energy Build 2016, 133, 1–13. [Google Scholar] [CrossRef]
- Hax, D.R.; Leitzke, R.K.; Silva, A.C.S.B. da; Cunha, E.G. da Influência do Comportamento do Usuário no Consumo de Energia em um Prédio de Ensino Público Na Zona Bioclimática 2. In Proceedings of the Encontro Nacional de Conforto no Ambiente Construído, 16. ANTAC: Palmas, 2021; pp. 1391–1400. [Google Scholar]
- Rashidzadeh, Z.; Heidari Matin, N. A Comparative Study on Smart Windows Focusing on Climate-Based Energy Performance and Users’ Comfort Attributes. Sustainability (Switzerland) 2023, 15. [Google Scholar] [CrossRef]
- Hu, S.; Yan, D.; Azar, E.; Guo, F. A Systematic Review of Occupant Behavior in Building Energy Policy. Build Env. 2020, 175, 106807. [Google Scholar] [CrossRef]
- Fanger, P.O. Thermal Comfort: Analysis and Application in Environmental Engineering; McGraw-Hill: New York, 1972. [Google Scholar]
- Delzendeh, E.; Wu, S.; Lee, A.; Zhou, Y. The Impact of Occupants’ Behaviours on Building Energy Analysis: A Research Review. Renew. Sustain. Energy Rev. 2017, 80, 1061–1071. [Google Scholar] [CrossRef]
- Holanda, M.R.A. Influência Da Definição Do Setpoint Do Ar- Condicionado Para o Conforto Térmico e Consumo Energético Em Clima Quente e Úmido, Universidade Federal de Alagoas - UFAL: Maceió, 2020.
- Hoyt, T.; Arens, E.; Zhang, H. Extending Air Temperature Setpoints: Simulated Energy Savings and Design Considerations for New and Retrofit Buildings. Build Env. 2015, 88, 89–96. [Google Scholar] [CrossRef]
- Peel, M.C.; Finlayson, B.L.; McMahon, T.A. Updated World Map of the Köppen-Geiger Climate Classification. Hydrol Earth Syst Sci 2007, 11, 1633–1644. [Google Scholar] [CrossRef]
- Centro de Pesquisas Meteorológicas e Climáticas Aplicadas à Agricultura (CEPAGRI) Climatologia Campinas. Available online: https://www.cpa.unicamp.br/graficos.
- RUAS, A. C. Systematization of thermal comfort assessment in built environments and its application in software. 2002. Comfort Program 2.03. updated version provided by the author in 2018.version updated by the author in 2018. School of Civil Engineering, Architecture and Urbanism. University of Campinas. Unicamp.
- Gail Brager & Lindsay Baker. Occupant satisfaction in mixed-mode buildings. Build. Res. Inf. 2009, 37, 369–380. [Google Scholar] [CrossRef]
- ANSI/ASHRAE 55; Thermal Environmental Conditions for Human Occupancy. American Society for Heating, Refrigerating and Air Conditioning Engineers, Inc.: Atlanta, GA, USA, 2017.
- Lucas, R, E, C. ; Silva, L, B.; Conforto Ambiental em Sala de Aula: Análise da percepção térmica dos estudantes de duas regiões e estimação de zonas de conforto. Revista Produção Online: Florianópolis, SC, 2017; Volume 17, pp. 804–827. [Google Scholar] [CrossRef]
- Parra, A. L. ; Qual a temperatura ideal para o ar-condicionado consumir menos energia? Gazeta do Povo. autoria da jornalista (Luciana Belin) Disponível: https://www.gazetadopovo.com.br/haus/sustentabilidade/qual-temperatura-ideal-ar-condicionado-consumir-menos-energia/> Acessado, 10/02/2023.
Figure 1.
Webprescritivo interface (RTQ-C prescriptive method tool).
Figure 1.
Webprescritivo interface (RTQ-C prescriptive method tool).
Figure 2.
Building location: (a) the University of Campinas; (b) the School of Mechanical Engineering (FEM) Complex, with emphasis on the analysed blocks.
Figure 2.
Building location: (a) the University of Campinas; (b) the School of Mechanical Engineering (FEM) Complex, with emphasis on the analysed blocks.
Figure 3.
Climate characteristics of Campinas: (a) monthly average temperature; (b) monthly average relative humidity.
Figure 3.
Climate characteristics of Campinas: (a) monthly average temperature; (b) monthly average relative humidity.
Figure 4.
Floor plan of the FEM building, highlighting the selected classrooms (Cl1 and Cl2) and office rooms (Of1 through Of7).
Figure 4.
Floor plan of the FEM building, highlighting the selected classrooms (Cl1 and Cl2) and office rooms (Of1 through Of7).
Figure 5.
The questions applied to the users.
Figure 5.
The questions applied to the users.
Figure 6.
The inside environmental data and outside air temperature.
Figure 6.
The inside environmental data and outside air temperature.
Figure 7.
Location of surveyed buildings’ (a) classroom and (b) office rooms.
Figure 7.
Location of surveyed buildings’ (a) classroom and (b) office rooms.
Figure 8.
(a) Classrooms—CL1 and (b) CL2. (c and d) Sample of two office rooms. (Personal collection.).
Figure 8.
(a) Classrooms—CL1 and (b) CL2. (c and d) Sample of two office rooms. (Personal collection.).
Figure 9.
Relationship between sensation and thermal preference of users in classrooms by age group.
Figure 9.
Relationship between sensation and thermal preference of users in classrooms by age group.
Figure 10.
Relations PMV and PPD in classroom.
Figure 10.
Relations PMV and PPD in classroom.
Figure 11.
Relationship between PMV and PPD in (a) CL2 and (b) CL2.
Figure 11.
Relationship between PMV and PPD in (a) CL2 and (b) CL2.
Figure 12.
Relationship between sensation and thermal preference of users in office rooms by age group of users.
Figure 12.
Relationship between sensation and thermal preference of users in office rooms by age group of users.
Figure 13.
PPD and PMV in the office rooms of FEM.
Figure 13.
PPD and PMV in the office rooms of FEM.
Table 1.
Final label levels of a building according to RTQ-C.
Table 1.
Final label levels of a building according to RTQ-C.
| Total Score (PT) |
Final Label |
| 5 to PT ≥ 4.5 |
A |
| 4.5 > PT ≥ 3.5 |
B |
| 3.5 > PT ≥ 2.5 |
C |
| 2.5 > PT ≥ 1.5 |
D |
| PT < 1.5 |
E |
Table 2.
Envelope materials properties of the buildings.
Table 2.
Envelope materials properties of the buildings.
| Element |
Properties |
| External walls |
Exterior plaster (25 mm)/concrete block (90 mm)/interior plaster (25 mm)(U¹ = 2.92 W/m²K | α² = 0.52) |
| Floors |
Concrete slab (30 mm)/plaster (25 mm)/tile (10 mm) |
| Internal ceilings |
Plaster (15 mm)/concrete slab (70 mm)/air gap/gypsum liner (10 mm) |
| Roof |
Concrete slab (100 mm)/air gap/fibre cement tile (8 mm)(U¹ = 2.06 W/m²K | α² = 0.52) |
| Windows |
Simple glazing (U¹ = 5.80 W/m²K | SHGC³ = 0.80) |
Table 5.
Classification of the energy efficiency level.
Table 5.
Classification of the energy efficiency level.
| Block |
H |
I |
J |
K |
HI |
IJ |
| Envelop |
C |
C |
C |
C |
D |
D |
| Lighting |
B |
B |
B |
C |
B |
B |
| Air conditioning |
C |
D |
E |
D |
E |
E |
| Score |
2.68 |
3.87 |
3.03 |
3.44 |
2.22 |
2.38 |
| General level |
C |
B |
C |
C |
D |
D |
Table 3.
Classroom information.
Table 3.
Classroom information.
| Classroom |
Total |
Percentage (%) |
Mean Age (years) |
| Questionaries Responded |
97 |
100 |
--- |
| CL1 |
52 |
53% |
--- |
| Cl2 |
45 |
46% |
--- |
| Woman |
33 |
34% |
29.4 |
| Man |
64 |
66% |
35.5 |
Table 4.
Statistical parameters of the sample data for room CL1 (52 questionnaires).
Table 4.
Statistical parameters of the sample data for room CL1 (52 questionnaires).
| CL1 |
PMV |
PPD |
(Icl- Clo |
| Average |
0.22 |
16.10 |
0.49 |
| Standard Deviation |
0.71 |
7.42 |
0.13 |
| Coefficient of Variation (%) |
322% |
46% |
26% |
Table 6.
Average internal temperatures of rooms JE2 and JE3 and external average temperature of the building at the evaluated times.
Table 6.
Average internal temperatures of rooms JE2 and JE3 and external average temperature of the building at the evaluated times.
| Data |
9:00 am |
11:30 am |
2:00 pm |
4:30 pm |
| TBS inside—CL1 |
26.20C |
21.70C |
24.10C |
26.20C |
| Tar outside |
27.70C |
30.650C |
31.50C |
32 0C |
| TBS inside—CL2 |
280C |
25.70C |
30.20C |
23.5 0C |
Table 7.
Data collected with the questionnaires in office rooms.
Table 7.
Data collected with the questionnaires in office rooms.
| Office Rooms |
Total |
Percentage (%) |
Middle Age (years) |
| Questionaries responded |
102 |
100 |
47 |
| Woman |
63 |
62% |
45.7 |
| Man |
39 |
38% |
49.2 |
|
Disclaimer/Publisher’s Note: The statements, opinions and data contained in all publications are solely those of the individual author(s) and contributor(s) and not of MDPI and/or the editor(s). MDPI and/or the editor(s) disclaim responsibility for any injury to people or property resulting from any ideas, methods, instructions or products referred to in the content. |
© 2023 by the authors. Licensee MDPI, Basel, Switzerland. This article is an open access article distributed under the terms and conditions of the Creative Commons Attribution (CC BY) license (http://creativecommons.org/licenses/by/4.0/).
