Submitted:
20 August 2023
Posted:
22 August 2023
You are already at the latest version
Abstract
Keywords:
1. Introduction
2. Experiment Design
2.1. Experimental Platform Construction
2.2. Experimental samples
2.3. Experimental conditions
2.4. Calculation models
3. Results and discussion
3.1. Influence of Confining Pressure on Diffusion Coefficient
3.2. Influence of gas pressure on the diffusion coefficient
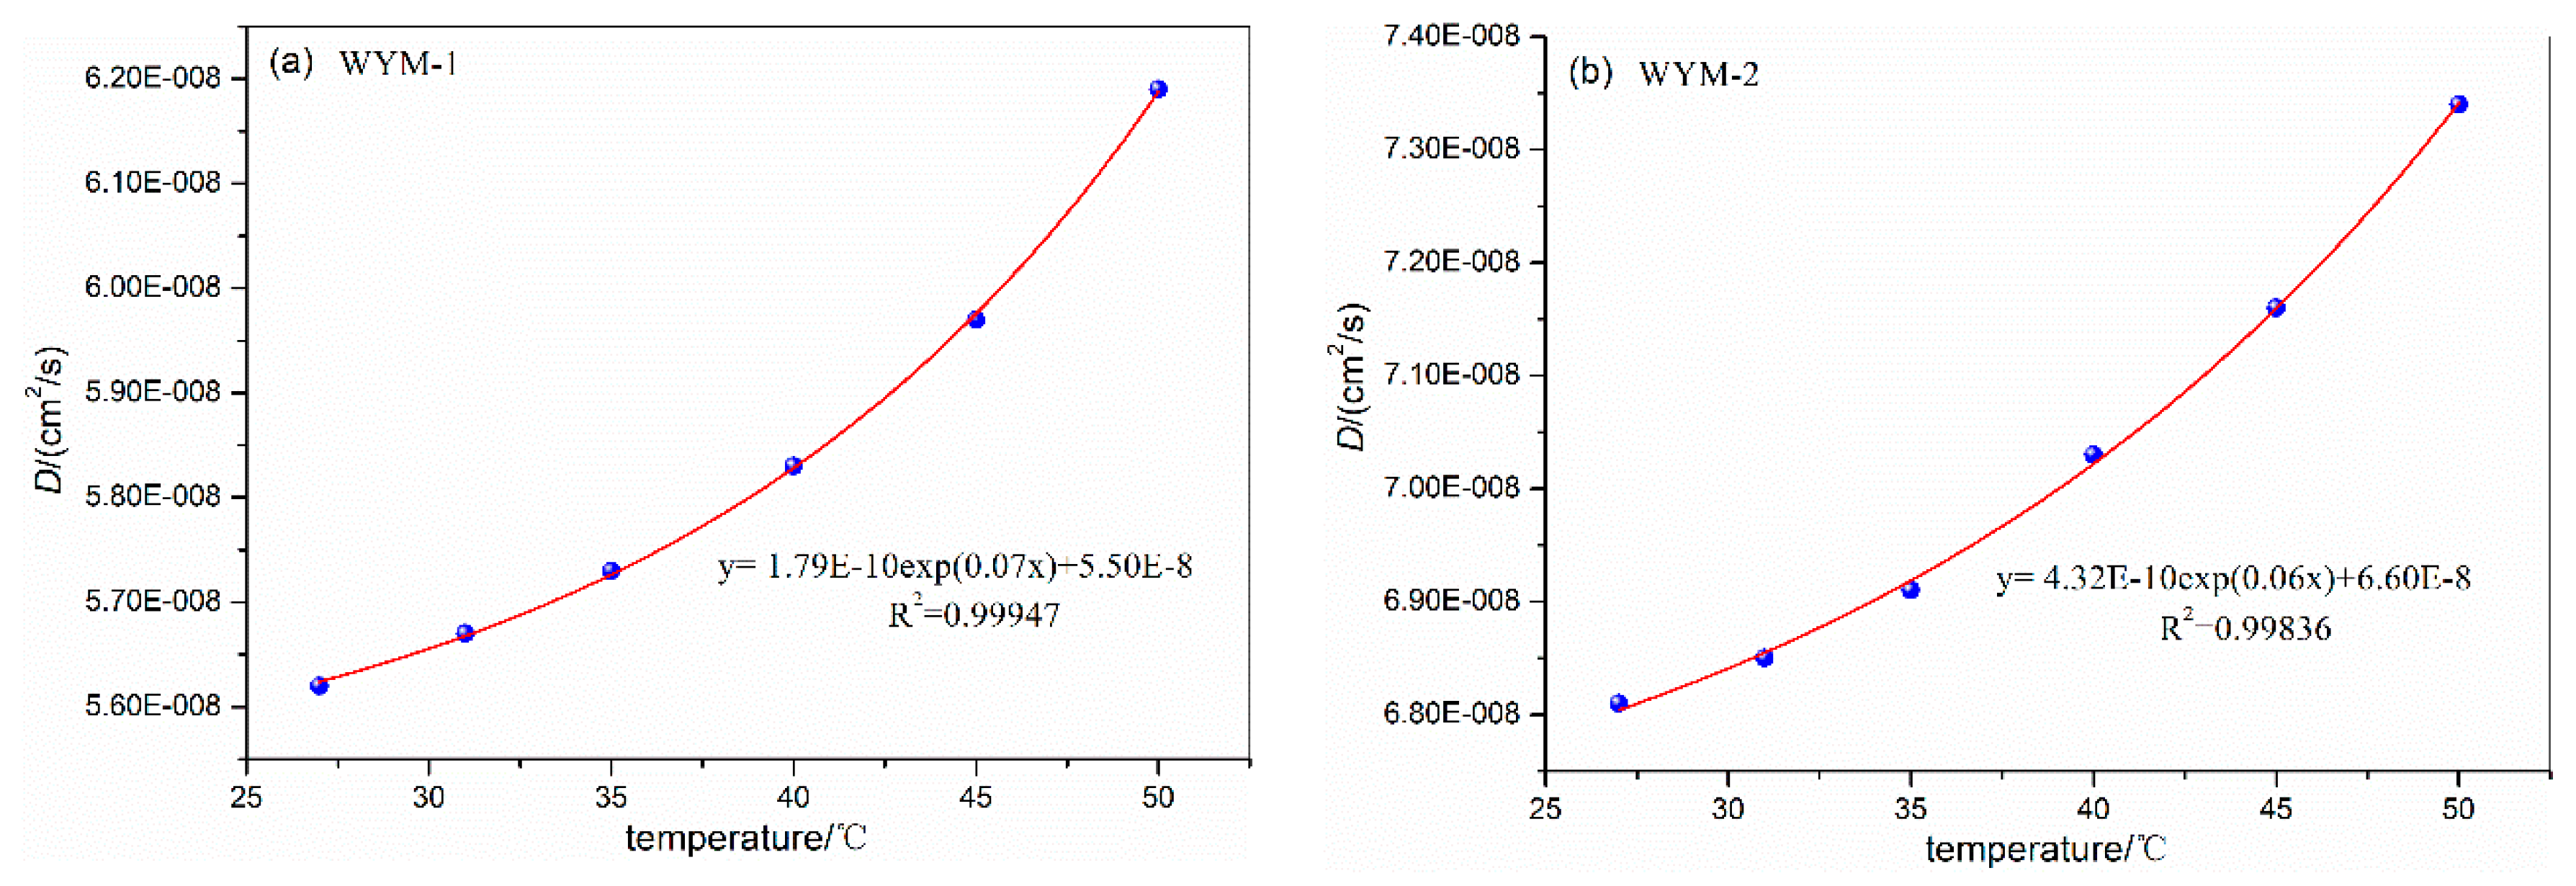
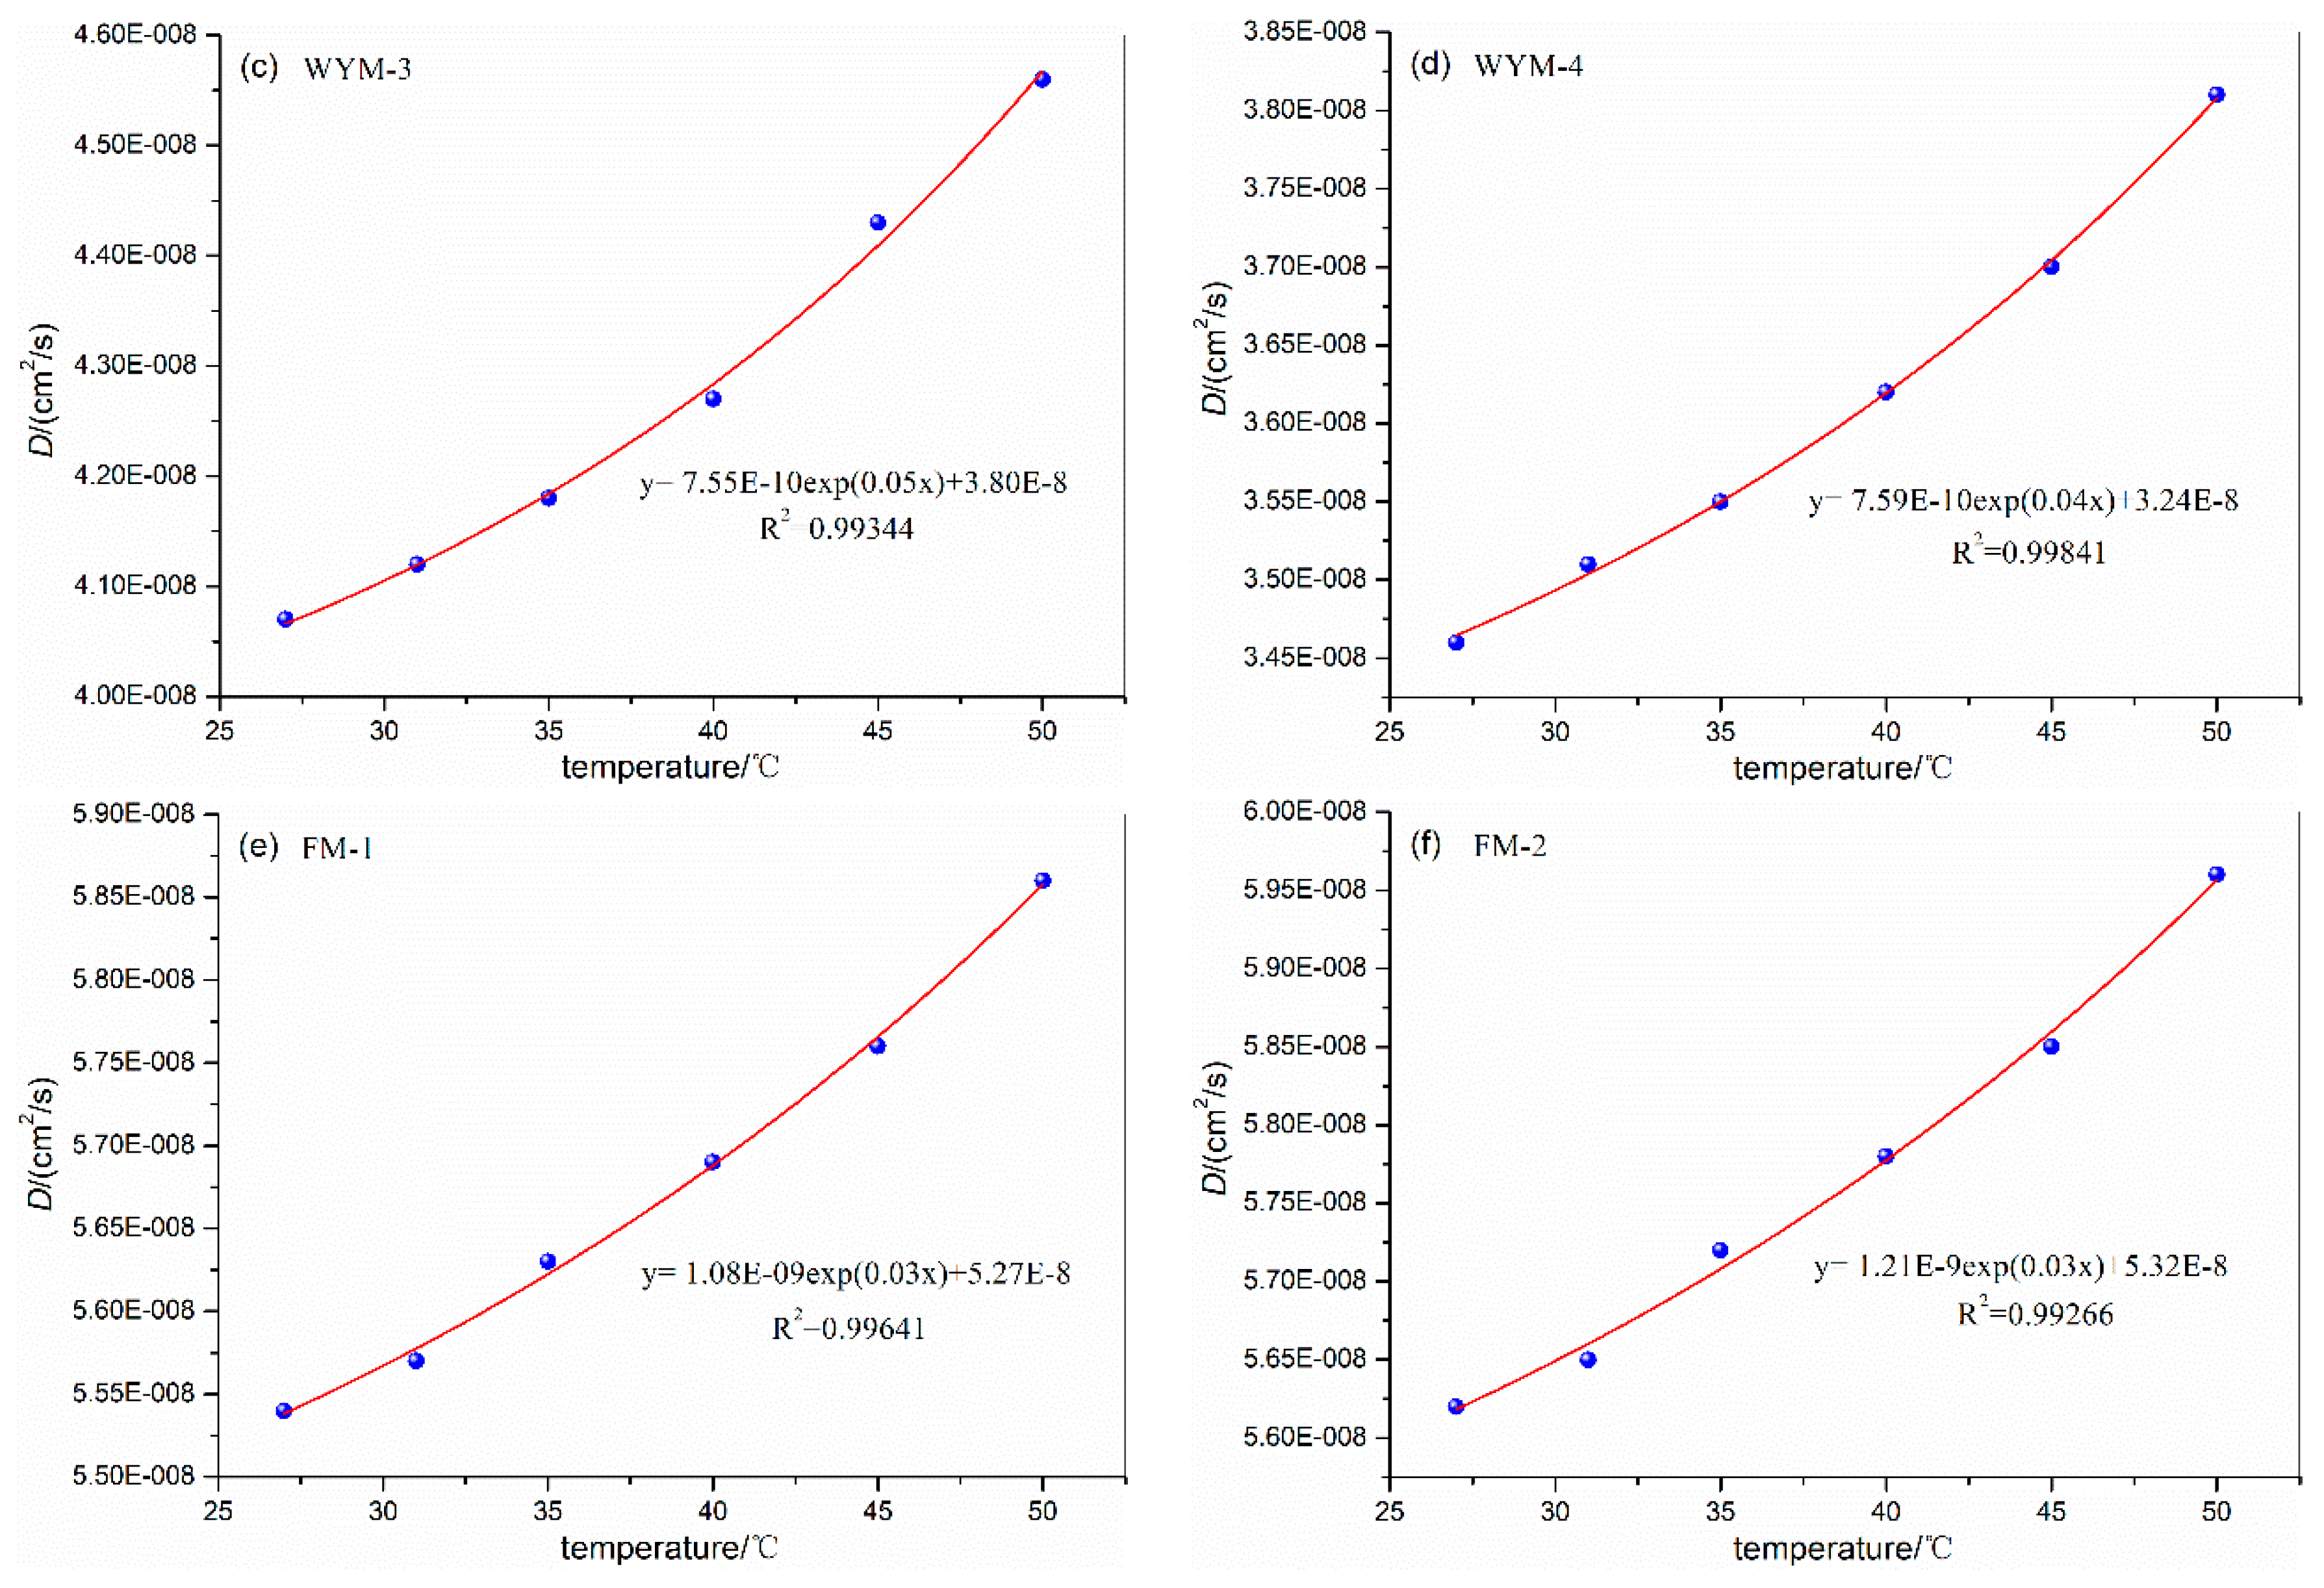
3.3. Influence of Temperature on Diffusion Coefficient
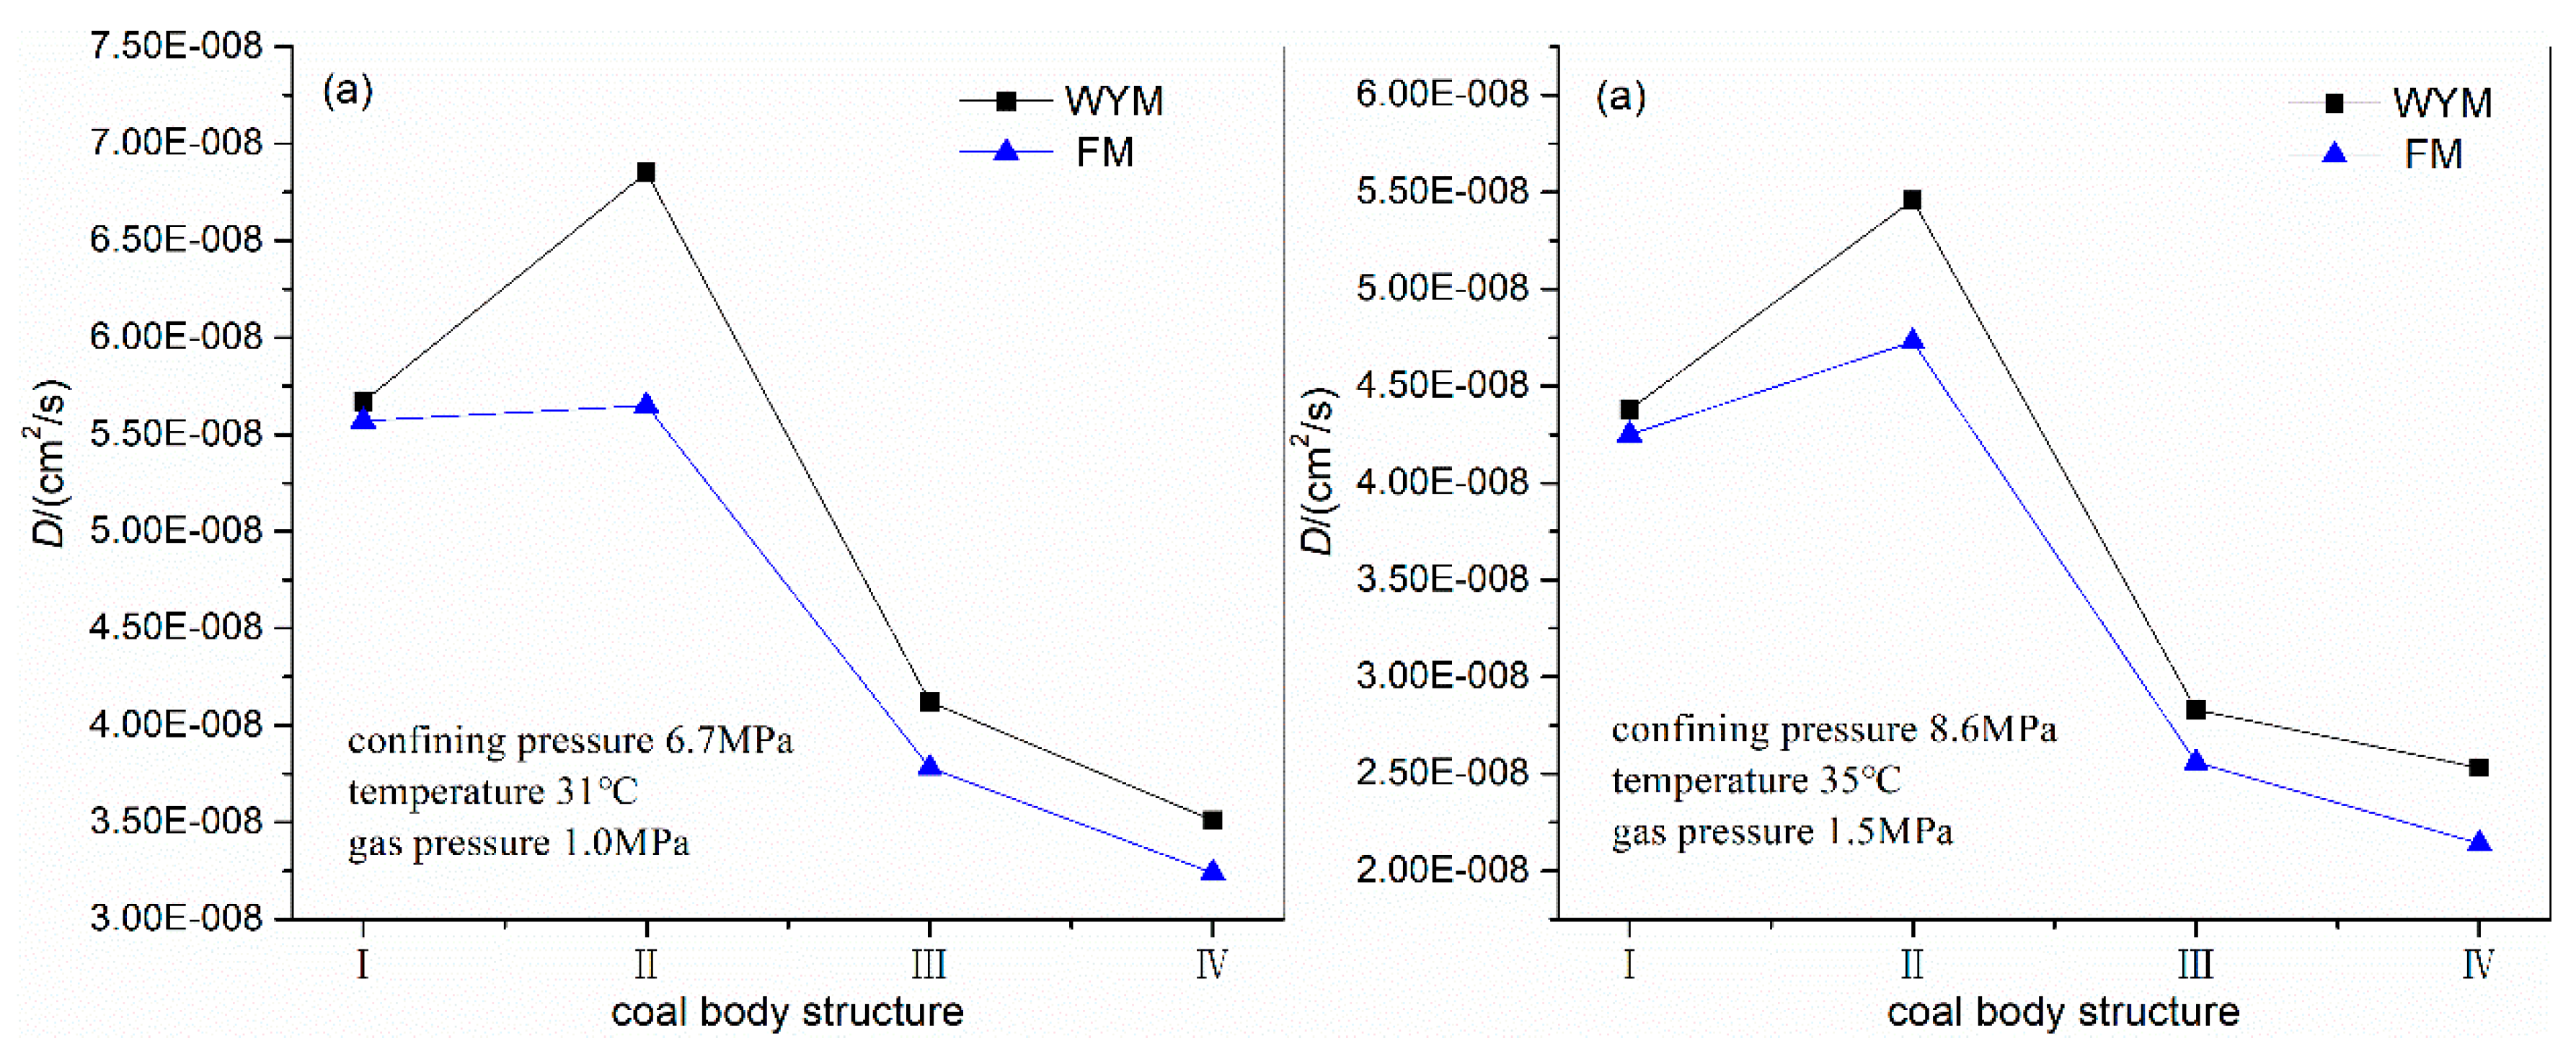
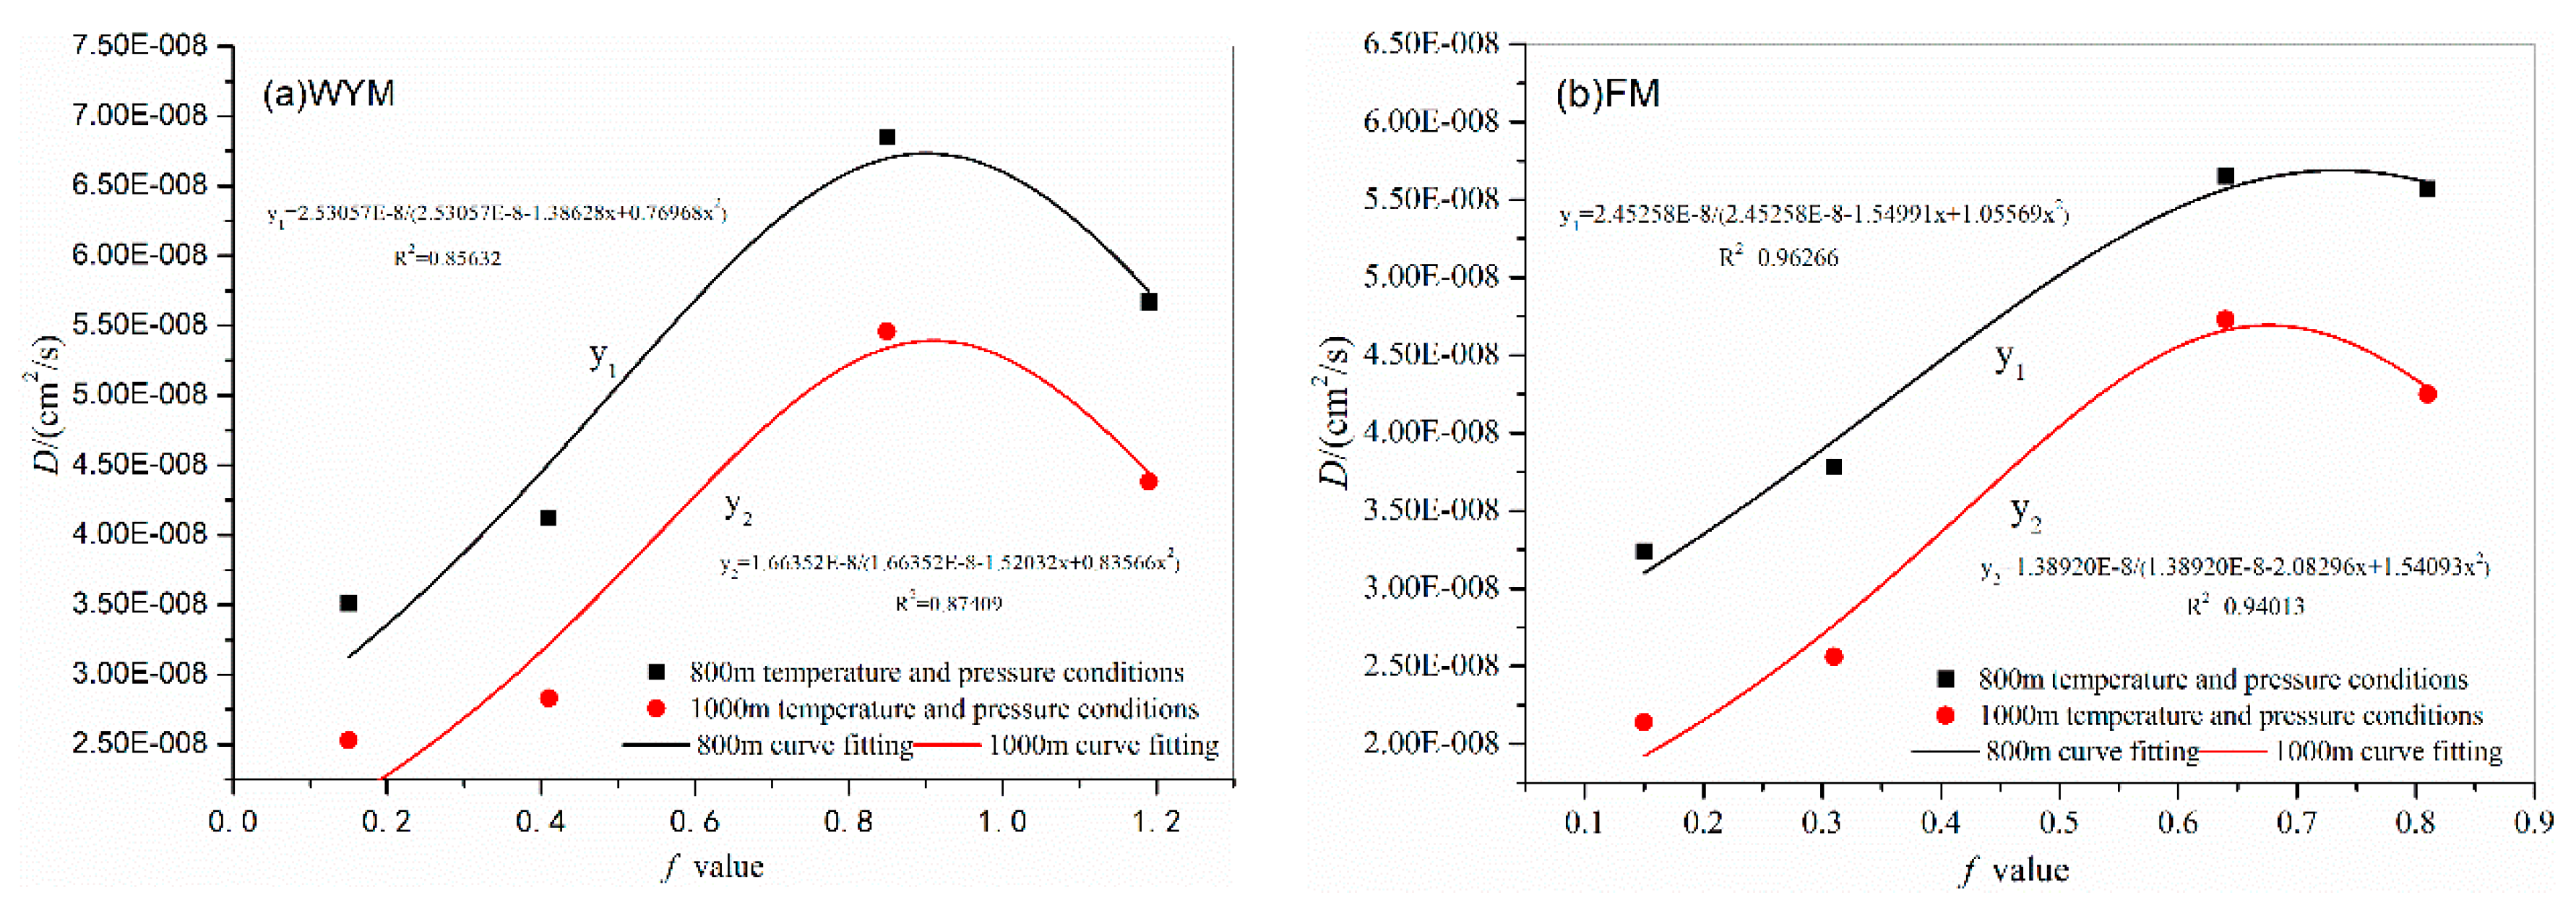
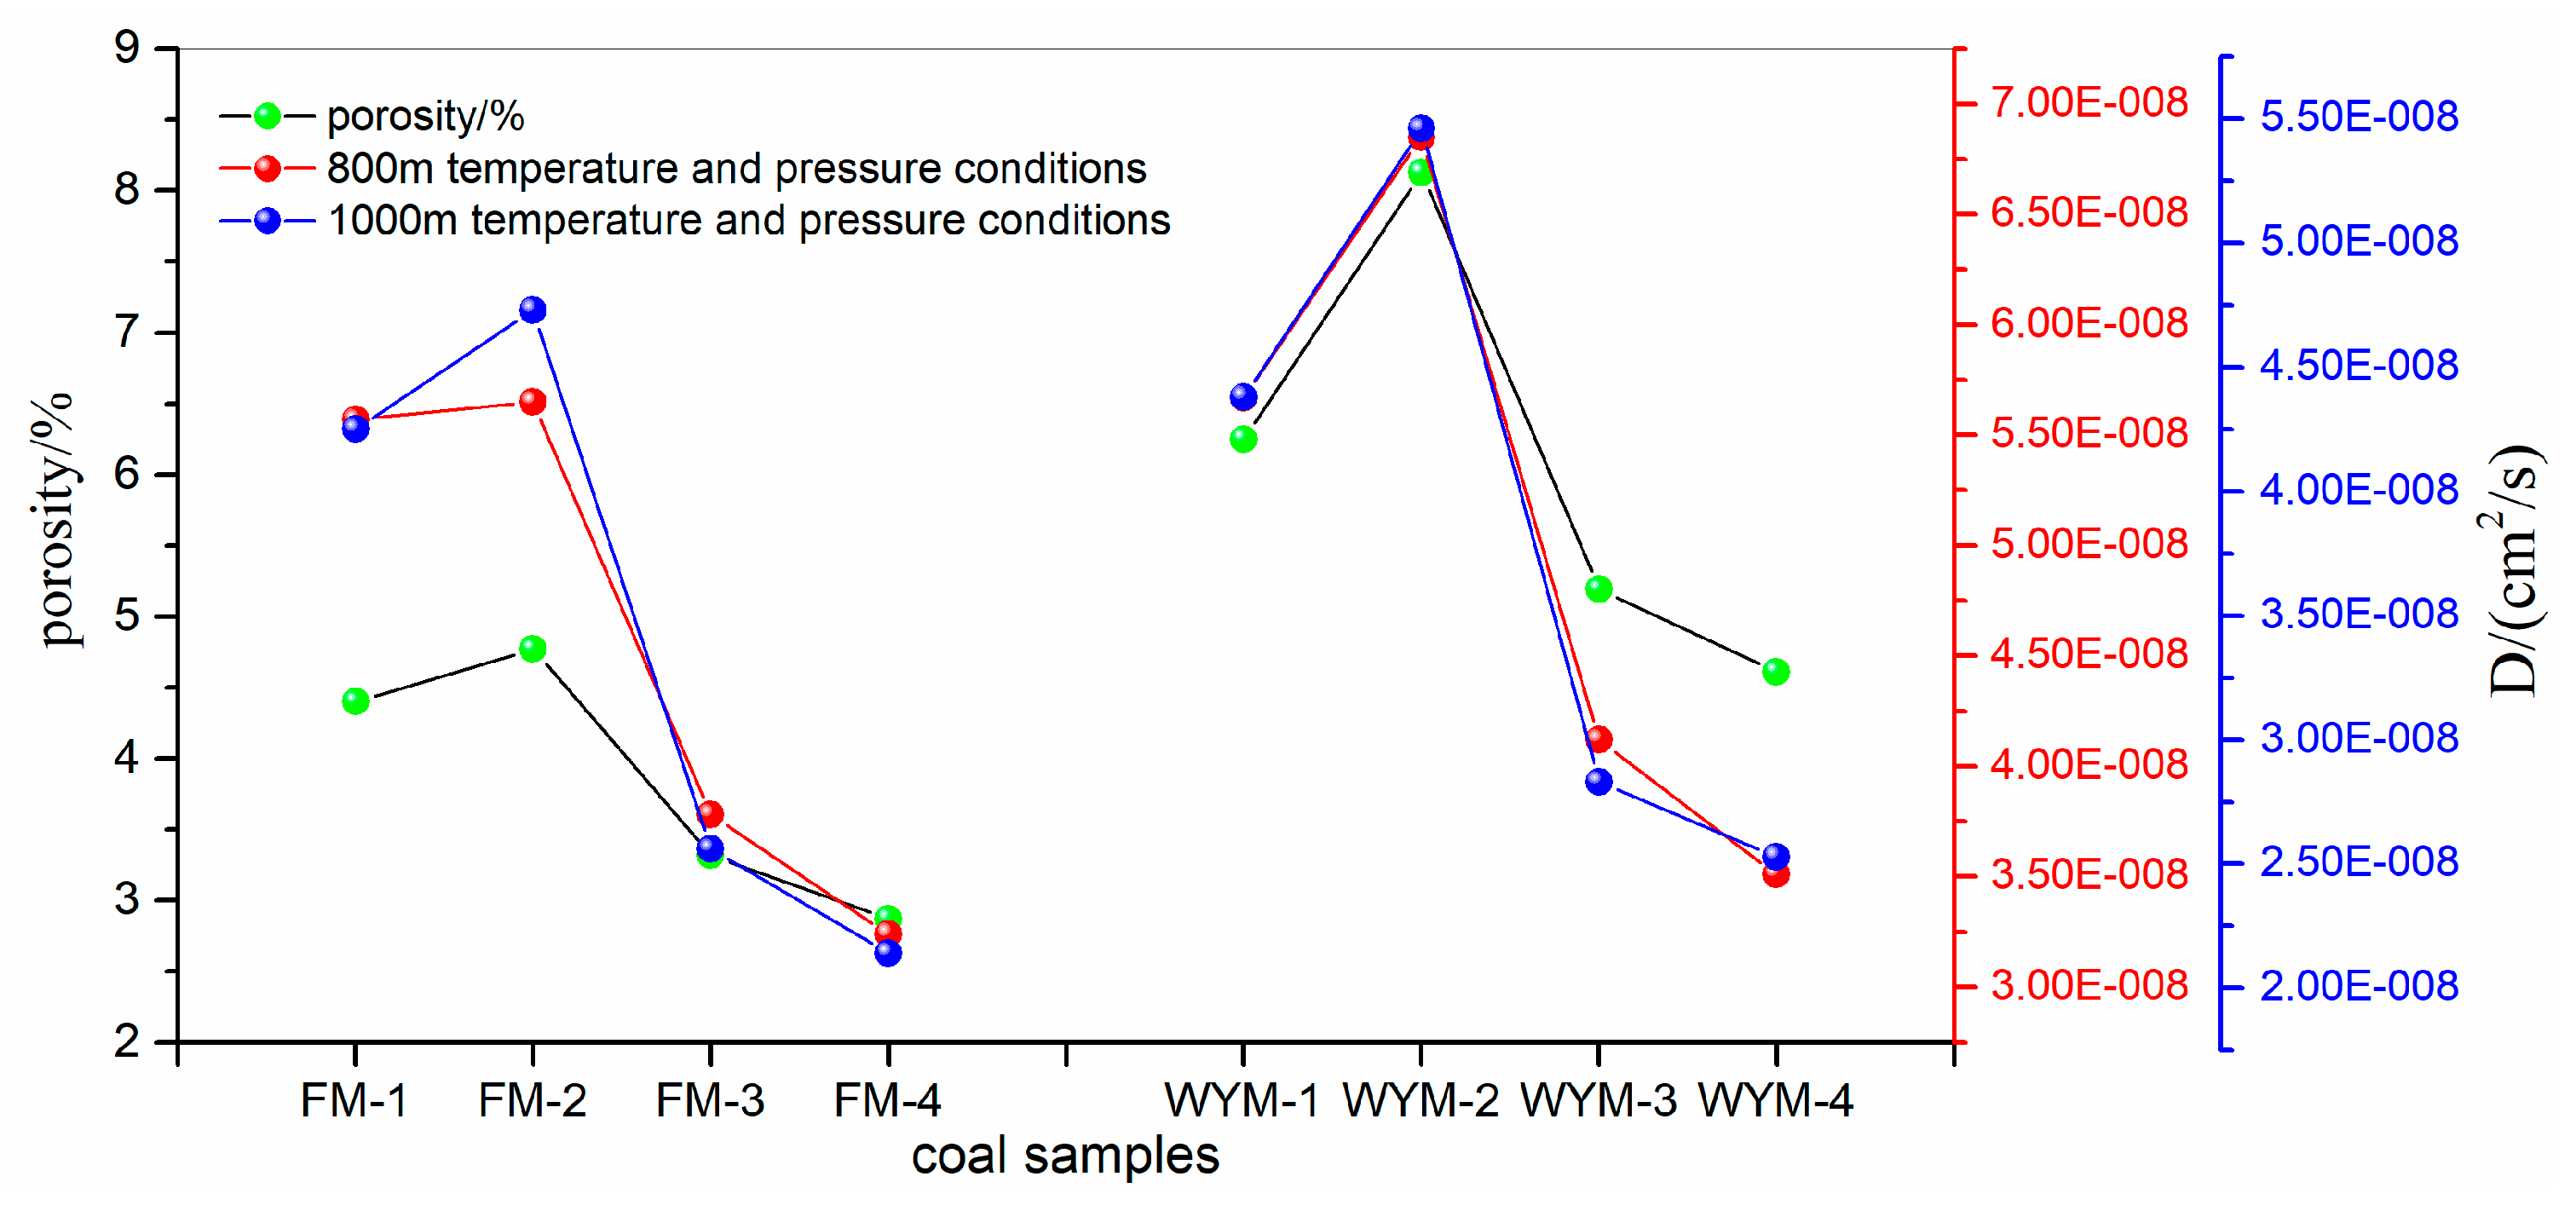
3.4. Influence of Degree of Metamorphism and Deformation on Diffusion Coefficient
4. Conclusions
Author Contributions
Funding
Institutional Review Board Statement
Informed Consent Statement
Data Availability Statement
Conflicts of Interest
References
- Wang, X.L.; Pan, J.N.; Wang, K.; Mou, P.W.; Li, J.X. Fracture variation in high-rank coal induced by hydraulic fracturing using X-ray computer tomography and digital volume correlation. International Journal of coal geology 2022, 252, 103942. [Google Scholar] [CrossRef]
- Wang, Q.W.; GUO, B.; Song, M.; Yan, Q. Construction and application of “coal-water-environment” coordinated development evaluation index system: A case study of Sihe Minefield. Coal Geology & Exploration 2022, 50, 98–105. [Google Scholar]
- Ren, J.G.; Song, Z.M.; Li, B.; Liu, J.B.; Lv, R.S.; Liu, G.F. Structure feature and evolution mechanism of pores in different metamorphism and deformation coals. Fuel. 2021, 283, 119292. [Google Scholar] [CrossRef]
- Zhao, W.; Cheng, Y.P.; Pan, Z.J.; Wang, K.; Liu, S.M. Gas diffusion in coal particles: A review of mathematical models and their applications. Fuel 2019, 252, 77–100. [Google Scholar] [CrossRef]
- Zhang, Q.G.; Li, Q.S.; Fan, X.Y.; Liu, C.; Ge, Z.L.; Jiang, Z.G.; Peng, X.L.; Li, X.C.; Zhu, S.Y.; Zhao, S.L.; Zhao, P.F.; Chen, Y.F. Current situation and development trend of theories and technologies for coal and CBM co-mining in China. Natural Gas Industry 2022, 42, 130–145. [Google Scholar]
- Wang, Z.Z.; Fu, X.H.; Hao, M.; Li, G.F.; Pan, J.N.; Niu, Q.H.; Zhou, H. Experimental insights into the adsorption-desorption of CH4/N2 and induced strain for medium-rank coals. Journal of Petroleum Science and Engineering 2021, 204, 108705. [Google Scholar] [CrossRef]
- Tao, S.; Pan, Z.J.; Tang, S.L.; Chen, S.D. Current status and geological conditions for the applicability of CBM drilling technologies in China: A review. International Journal of Coal Geology 2019, 202, 95–108. [Google Scholar] [CrossRef]
- Hu, B.; Cheng, Y.P.; Pan, Z.J. Classification methods of pore structures in coal: A review and new insight. Gas Science and Engineering 2023, 110, 204876. [Google Scholar] [CrossRef]
- Zhou, H.; Wu, C.F.; Pan, J.N.; Wang, Z.Z.; Niu, Q.H.; Du, M.Y. Research on Molecular Structure Characteristics of Vitrinite and Inertinite from Bituminous Coal with FTIR, Micro-Raman, and XRD Spectroscopy. Energy & Fuel 2021, 35, 1322–1335. [Google Scholar]
- Mou, P.W.; Pan, J.N.; Niu, Q.H.; Wang, Z.Z.; Li, Y.B.; Song, D.Y. Coal Pores: Methods, Types, and Characteristics. Energy & Fuel 2021, 35, 7467–7484. [Google Scholar]
- Liu, D.; Wang, Y.; Ni, X.; Tao, C.; Fan, J.; Wu, X.; Zhao, S. Classification of Coal Structure Combinations and Their Influence on Hydraulic Fracturing: A Case Study from the Qinshui Basin, China. Energies 2020, 13, 4559. [Google Scholar] [CrossRef]
- Li, Z.Q.; Li, P.F.; Wang, L.; Liu, Y.W.; Li, L. Experiment, Model, and Mechanism of Multiscale Dynamic Diffusion–Permeability in Coal under Different Fluids. ACS Omega 2023, 8, 1606–1617. [Google Scholar] [CrossRef] [PubMed]
- Ren, J.G.; Wang, Z.Z.; Li, B.; Chen, F.; Liu, J.B.; Liu, G.F.; Song, Z.M. Fractal-Time-Dependent Fick Diffusion Model of Coal Particles Based on Desorption–Diffusion Experiments. Energy & Fuel 2022, 36, 6198–6215. [Google Scholar]
- Li, Z.Q.; Peng, J.S.; Li, L.; Qi, L.L.; Li, W. Novel Dynamic Multiscale Model of Apparent Diffusion Permeability of Methane through Low-Permeability Coal Seams. Energy & Fuel 2021, 35, 7844–7857. [Google Scholar]
- Pan, Z.J.; Connell, L.D.; Camilleri, M.; Connelly, L. Effects of matrix moisture on gas diffusion and flow in coal. Fuel 2010, 89, 3207–3217. [Google Scholar] [CrossRef]
- Wen, Z.H.; Wang, Q.; Ren, J.G.; Zhang, L.L.; Yuan, Y.W. Dynamic Gas Diffusion Model of Capillary Pores in a Coal Particle Based on Pore Fractal Characteristics. Transport in Porous Media 2021, 140, 581–601. [Google Scholar] [CrossRef]
- Wang, Y.; Liu, S.M. Estimation of Pressure-Dependent Diffusive Permeability of Coal Using Methane Diffusion Coefficient: Laboratory Measurements and Modeling. Energy & Fuel 2016, 30, 8968–8976. [Google Scholar]
- Xu, H.; Tang, D.Z.; Zhao, J.L.; Li, S.; Tao, S. A new laboratory method for accurate measurement of the methane diffusion coefficient and its influencing factors in the coal matrix. Fuel 2015, 158, 239–247. [Google Scholar] [CrossRef]
- Liu, J.J.; Cheng, D.Q.; Li, Y.L.; Zhao, K.; Kou, Q.Q. Quantitative evaluation of the influence of coal particle size distribution on gas diffusion coefficient by image processing method. Fuel 2022, 314, 122946. [Google Scholar] [CrossRef]
- Liu, Z.D.; Lin, X.S.; Cheng, Y.P.; Chen, R.; Zhao, L.Y.; Wang, L.; Li, W.; Wang, Z.Y. Experimental investigation on the diffusion property of different form coal: Implication for the selection of CO2 storage reservoir. Fuel 2022, 318, 123691. [Google Scholar] [CrossRef]
- Sander, R.; Connell, L.D.; Camilleri, M.C.; Pan, Z.J. CH4, CO2, N2 diffusion in Bowen Basin (Australia) coal: Relationship between sorption kinetics of coal core and crushed coal particles. Journal of Natural Gas Science and Engineering 2020, 81, 103468. [Google Scholar] [CrossRef]
- Bai, Y.; Lin, H.F.; Li, S.G.; Long, H.; Yan, M.; Li, Y.; Qin, L.; Zhou, B. Experimental study on kinetic characteristics of gas diffusion in coal under nitrogen injection. Energy 2022, 254, 124251. [Google Scholar] [CrossRef]
- Tan, Y.L.; Pan, Z.J.; Liu, J.S.; Kang, J.H.; Zhou, F.B.; Connell, L.D.; Yang, Y.X. Experimental study of impact of anisotropy and heterogeneity on gas flow in coal. Part I: Diffusion and adsorption. Fuel 2018, 232, 444–453. [Google Scholar] [CrossRef]
- Liu, Q.Q.; Wang, J.; Liu, J.J.; Yang, Q.Q.; Huang, W.Y.; Liu, Y.Y.; Wang, L. Determining diffusion coefficients of coal particles by solving the inverse problem based on the data of methane desorption measurements. Fuel 2022, 308, 122045. [Google Scholar] [CrossRef]
- Lu, S.Q.; Li, M.J.; Sa, Z.Y.; Liu, J.; Wang, S.C.; Qu, M. Discrimination of gas diffusion state in intact coal and tectonic coal: Model and experiment. Fuel 2022, 325, 124916. [Google Scholar] [CrossRef]
- An, F.H.; Jia, H.F.; Feng, Y. Effect of stress, concentration and temperature on gas diffusion coefficient of coal measured through a direct method and its model application. Fuel 2022, 312, 122991. [Google Scholar] [CrossRef]
- Li, Y.D.; Pan, J.N.; Cheng, N.N.; Wang, Z.Z.; Zhang, L.; Liu, W.Q. Relationship Between Micropore Structure of Different Coal Ranks and Methane Diffusion. Natural Resources Research volume 2022, 31, 2901–2917. [Google Scholar] [CrossRef]
- Lu, X.; Armstrong, R.T.; Mostaghimi, P. Analysis of gas diffusivity in coal using micro-computed tomography. Fuel 2020, 261, 116384. [Google Scholar] [CrossRef]
- Meng, Y.; Li, Z.P. Experimental study on diffusion property of methane gas in coal and its influencing factors. Fuel 2016, 185, 219–228. [Google Scholar] [CrossRef]
- Cheng, Y.P.; Pan, Z.J. Reservoir properties of Chinese tectonic coal: A review. Fuel 2020, 260, 116350. [Google Scholar] [CrossRef]
- Dong, J.; Cheng, Y.P.; Pan, Z.J. Comparison of transient and pseudo-steady diffusion of methane in coal and implications for coalbed methane control. Journal of Petroleum Science and Engineering 2020, 184, 106543. [Google Scholar] [CrossRef]
- Thimons, E.D.; Kissell, F.N. Diffusion of methane through coal. Fuel 1973, 52, 274–280. [Google Scholar] [CrossRef]
- Baatar, L.; Mostaghimi, P.; Yuan, M.; Armstrong, R.T.; Adler, L.; Canbulat, I.; Si, G.Y.; Gaidarov, B.; Jing, Y. Multiscale measurements of gas diffusion coefficient of coal using counter-diffusion and image-based methods. International Journal of Coal Geology 2023, 265, 104155. [Google Scholar] [CrossRef]
- Liu, T.; Lin, B.Q.; Fu, X.H.; Gao, Y.B.; Kong, J.; Zhao, Y.; Song, H.R. Experimental study on gas diffusion dynamics in fractured coal: A better understanding of gas migration in in-situ coal seam. Energy 2020, 195, 117005. [Google Scholar] [CrossRef]
- Qin, Y.J.; An, F.H.; Su, W.W.; Jia, H.F.; Chen, X.J. Direct determination of the diffusion coefficient variation of cylindrical coal based on Fick’s law and model construction. Coal Science and Technology 2023, 51, 1–10. [Google Scholar]
- Yi, M.H.; Wang, L.; Cheng, Y.P.; Wang, C.H.; Hu, B. Calculation of gas concentration-dependent diffusion coefficient in coal particles: Influencing mechanism of gas pressure and desorption time on diffusion behavior. Fuel 2022, 320, 123973. [Google Scholar] [CrossRef]
- Fang, X.L.; Liu, D.L.; Zhou, Y.F.; Liu, X.B.; Cai, Y.D. Factors influencing methane diffusion behaviors in micro-nano coal pores: A comprehensive study. Frontiers of Earth Science 2023, 17, 71–86. [Google Scholar] [CrossRef]
- Song, H.R.; Lin, B.Q.; Zhong, Z.; Liu, T. Experimental study on methane diffusion kinetics in three typical metamorphic coals. Fuel 2022, 311, 122601. [Google Scholar] [CrossRef]
- Yang, X.; Wang, G.D.; Zhang, J.Y.; Ren, T. The Influence of Sorption Pressure on Gas Diffusion in Coal Particles: An Experimental Study. Processes 2019, 7, 219. [Google Scholar] [CrossRef]
- Zang, J.; Wang, K.; Liu, A. Phenomenological over-parameterization of the triple-fitting-parameter diffusion models in evaluation of gas diffusion in coal. Processes 2019, 7, 241. [Google Scholar] [CrossRef]
- Liu, Q.Q.; Huang, W.Y.; Lv, B.; Ma, X.H.; Lu, X.D.; Wang, J.; Wang, L. Decoupling experiments for CH4 “diffusion-seepage” in coal columns to effectively measure sorption time. International Journal of Coal Geology 2022, 261, 104074. [Google Scholar] [CrossRef]
- Cai, Y.Y.; Cheng, J.S.; Cheng, B. Study on the gas emission law of circular column cinder based on time-varying diffusion coefficient. Mining Safety & Environmental Protection 2020, 47, 32–36. [Google Scholar]
- Song, Y.; Jiang, B.; Li, M.; Hou, C.L.; Xu, S.C. A review on pore-fractures in tectonically deformed coals. Fuel 2020, 278, 118248. [Google Scholar]
- Ren, J.G.; Weng, H.B.; Song, Z.M.; Li, B.; Lv, R.S. Method of Making Raw Coal Isostatic Pressing Columnar Coal Samples for Heavily Tectonically Deformed Coal. Safety in Coal Mines 2018, 49, 66–69. [Google Scholar]
- Liu, G.F. Mechanism and model of coal adsorption gas in high temperature and pressure and three-phase medium. Doctoral Thesis, Henan Polytechnic University, Jiaozuo, China, 2011. [Google Scholar]
- Zhu, W.C.; Liu, S.Y.; Zhang, X.F.; Wei, C.H. Coupled coal–gas interaction during CBM and CO2-ECBM recovery in coal seams: A critical review. Geomechanics and Geophysics for Geo-Energy and Geo-Resources 2022, 8, 195. [Google Scholar] [CrossRef]
- Liu, Z.D.; Lin, X.S.; Wang, Z.Y.; Zhang, Z.; Chen, R.; Wang, L.; Li, W. Modeling and experimental study on methane diffusivity in coal mass under in-situ high stress conditions: A better understanding of gas extraction. Fuel 2022, 321, 124078. [Google Scholar] [CrossRef]
- Niu, Q.H.; Cao, L.W.; Sang, S.X.; Zhou, X.Z.; Wang, W.; Yuan, W.; Ji, Z.M.; Wang, H.C.; Nie, Y. Study on the anisotropic permeability in different rank coals under influences of supercritical CO2 adsorption and effective stress and its enlightenment for CO2 enhance coalbed methane recovery. Fuel 2020, 262, 116515. [Google Scholar] [CrossRef]
- Ji, X.F.; Song, D.Y.; Shi, W.F.; Li, Y.F. Influence of Nanopore Structure Deformation on Gas Migration in Coal. ACS Omega 2021, 29, 19115–19126. [Google Scholar] [CrossRef]
- Wang, Z.Z.; Fu, X.H.; Pan, J.N.; Deng, Z. Effect of N2/CO2 injection and alternate injection on volume swelling/shrinkage strain of coal. Energy 2023, 275, 127377. [Google Scholar] [CrossRef]
- Zhao, D. Study on the behavior and mechanism of methane desorption-diffusion for multi-scale coal samples under multi-temperature conditions. Fuel 2022, 328, 125332. [Google Scholar] [CrossRef]
- Qin, Y. Modeling of Gas Desorption and Diffusion Kinetics in a Coal Seam Combined with a Free Gas Density Gradient Concept. Energy & Fuel 2022, 36, 10052–10063. [Google Scholar]
- Liu, S.; Wei, C.; Zhu, W.; Zhang, M. Temperature- and pressure-dependent gas diffusion in coal particles: Numerical model and experiments. Fuel 2020, 266, 117054. [Google Scholar] [CrossRef]
- Liu, Y.W.; Du, Y.; Li, Z.Q.; Zhao, F.J.; Zuo, W.Q.; Wei, J.P.; Mitri, H. A rapid and accurate direct measurement method of underground coal seam gas content based on dynamic diffusion theory. International Journal of Mining Science and Technology 2020, 30, 799–810. [Google Scholar] [CrossRef]
- Lu, S.Q.; Wang, C.F.; Li, M.J.; Sa, Z.Y.; Zhang, Y.L.; Liu, J.; Wang, H.; Wang, S.C. Gas time-dependent diffusion in pores of deformed coal particles: Model development and analysis. Fuel 2021, 295, 120566. [Google Scholar] [CrossRef]
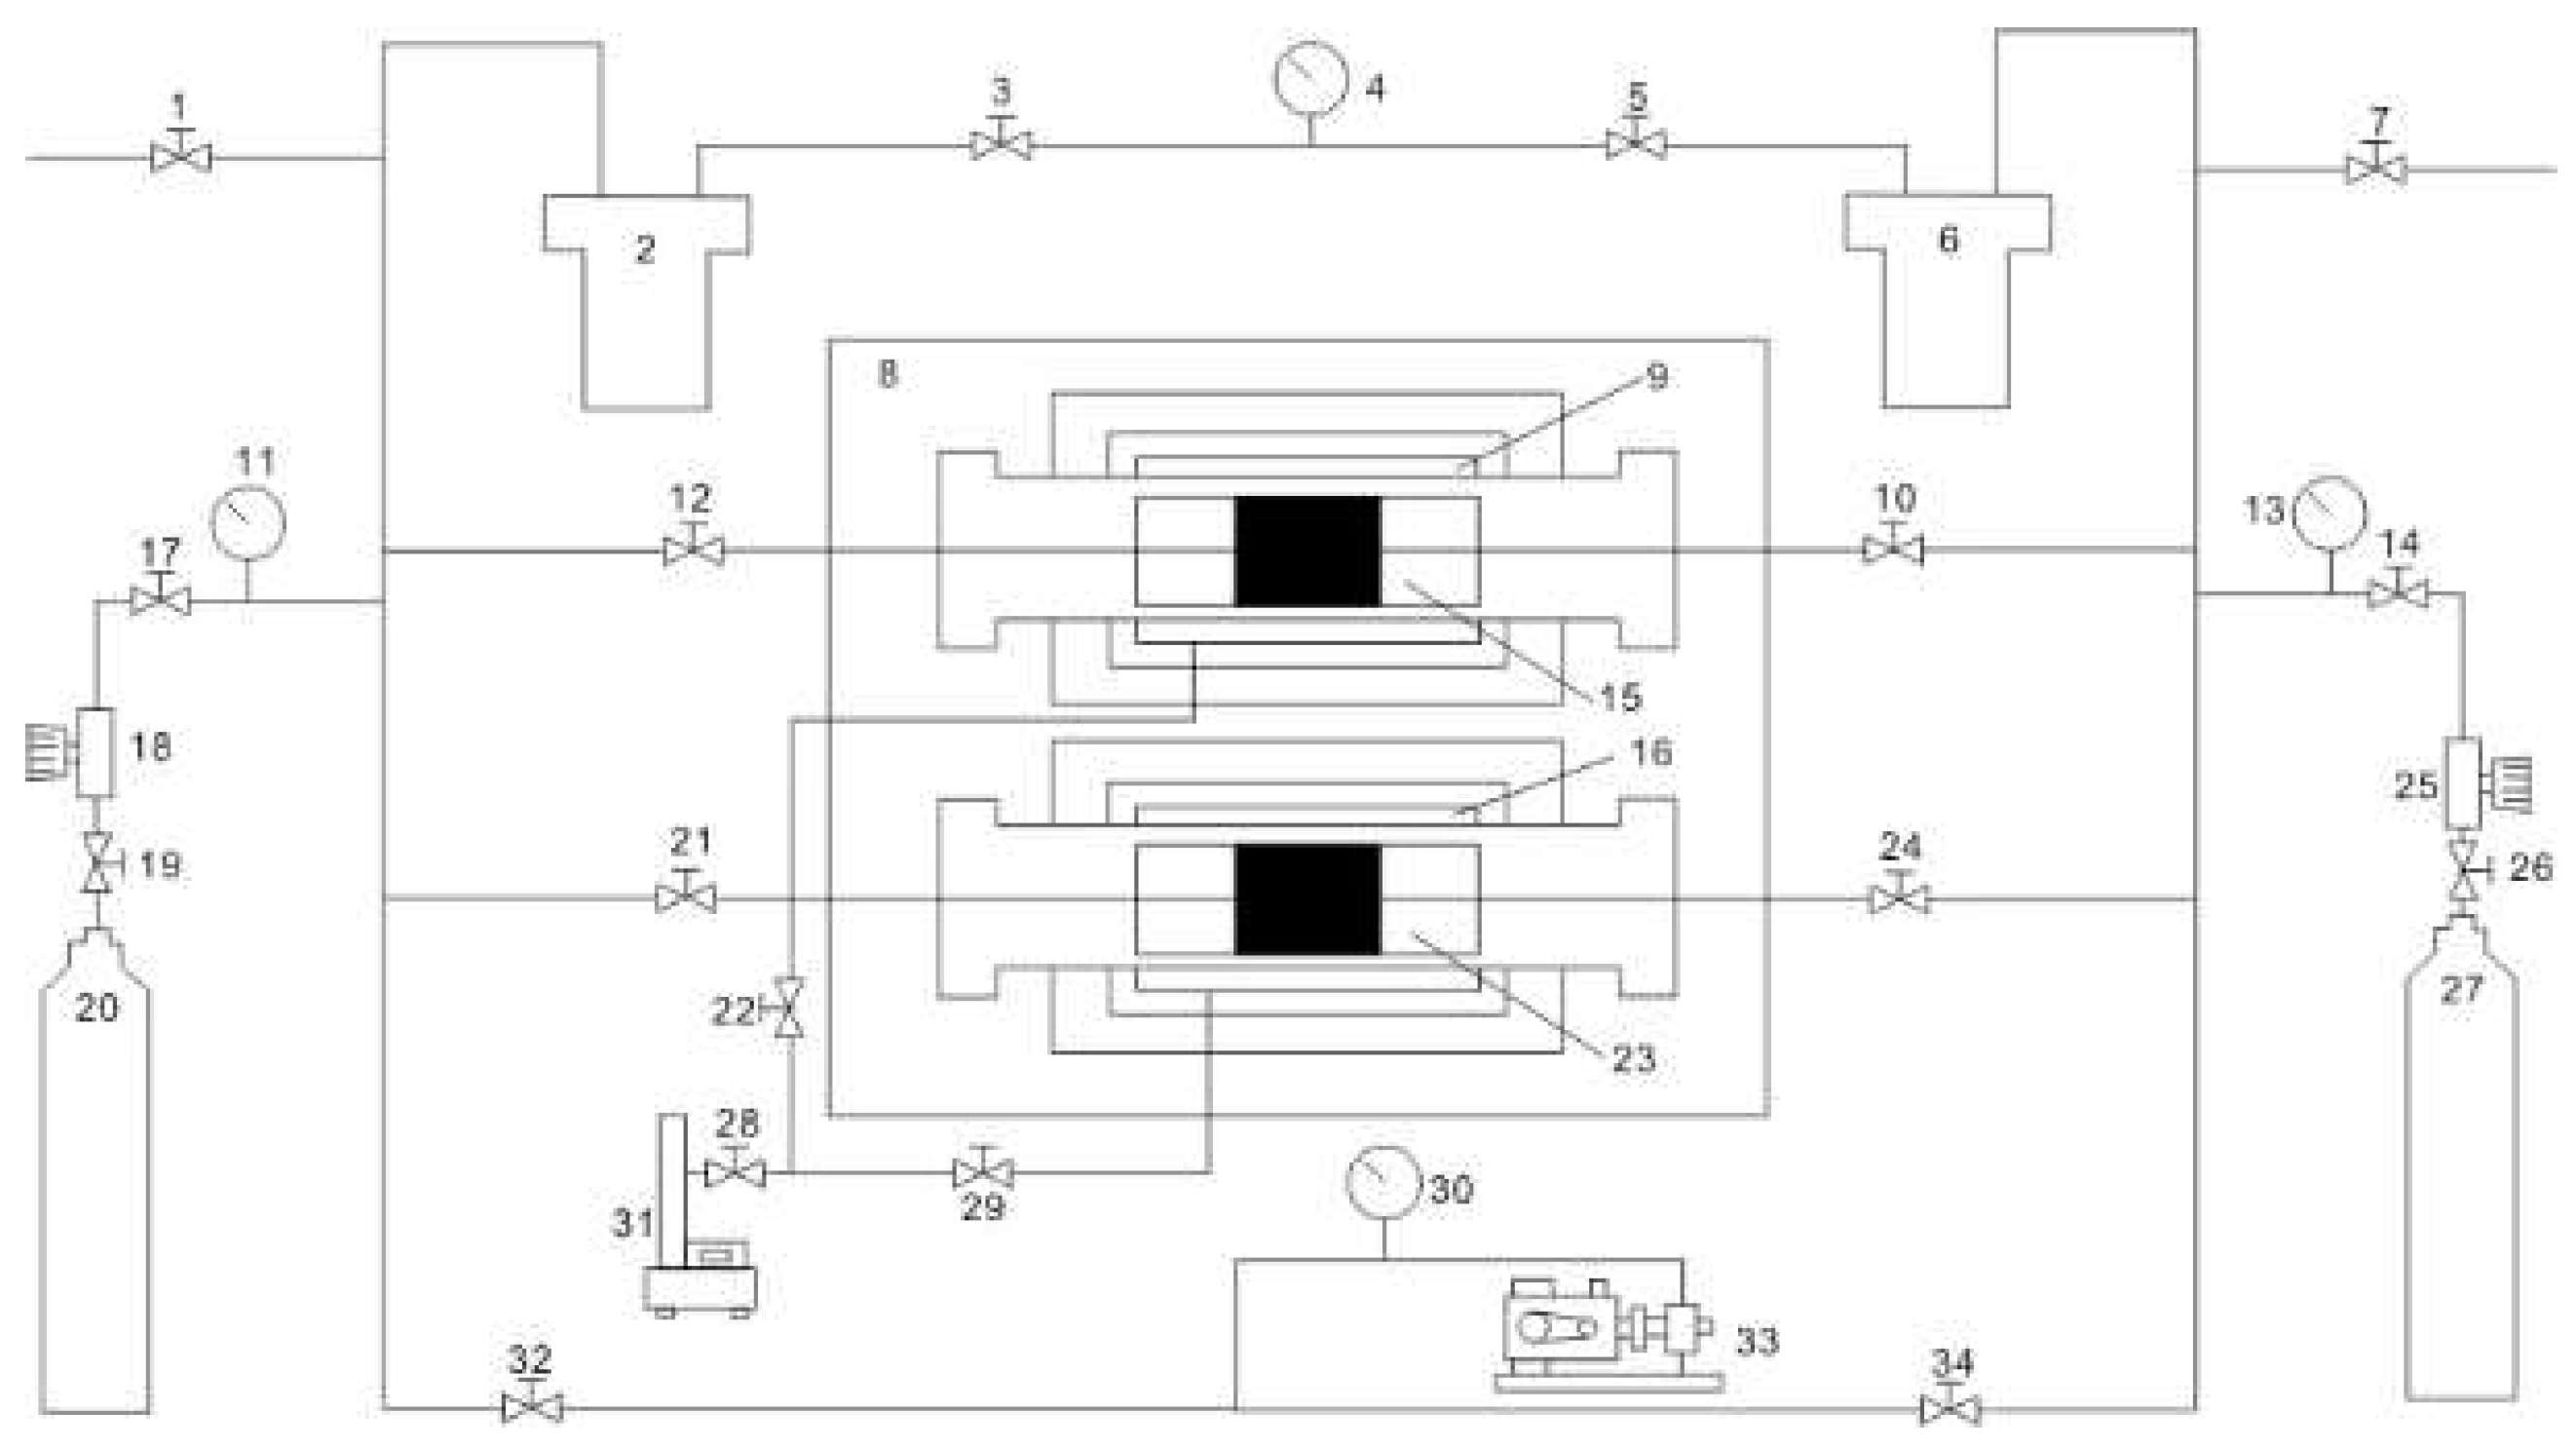
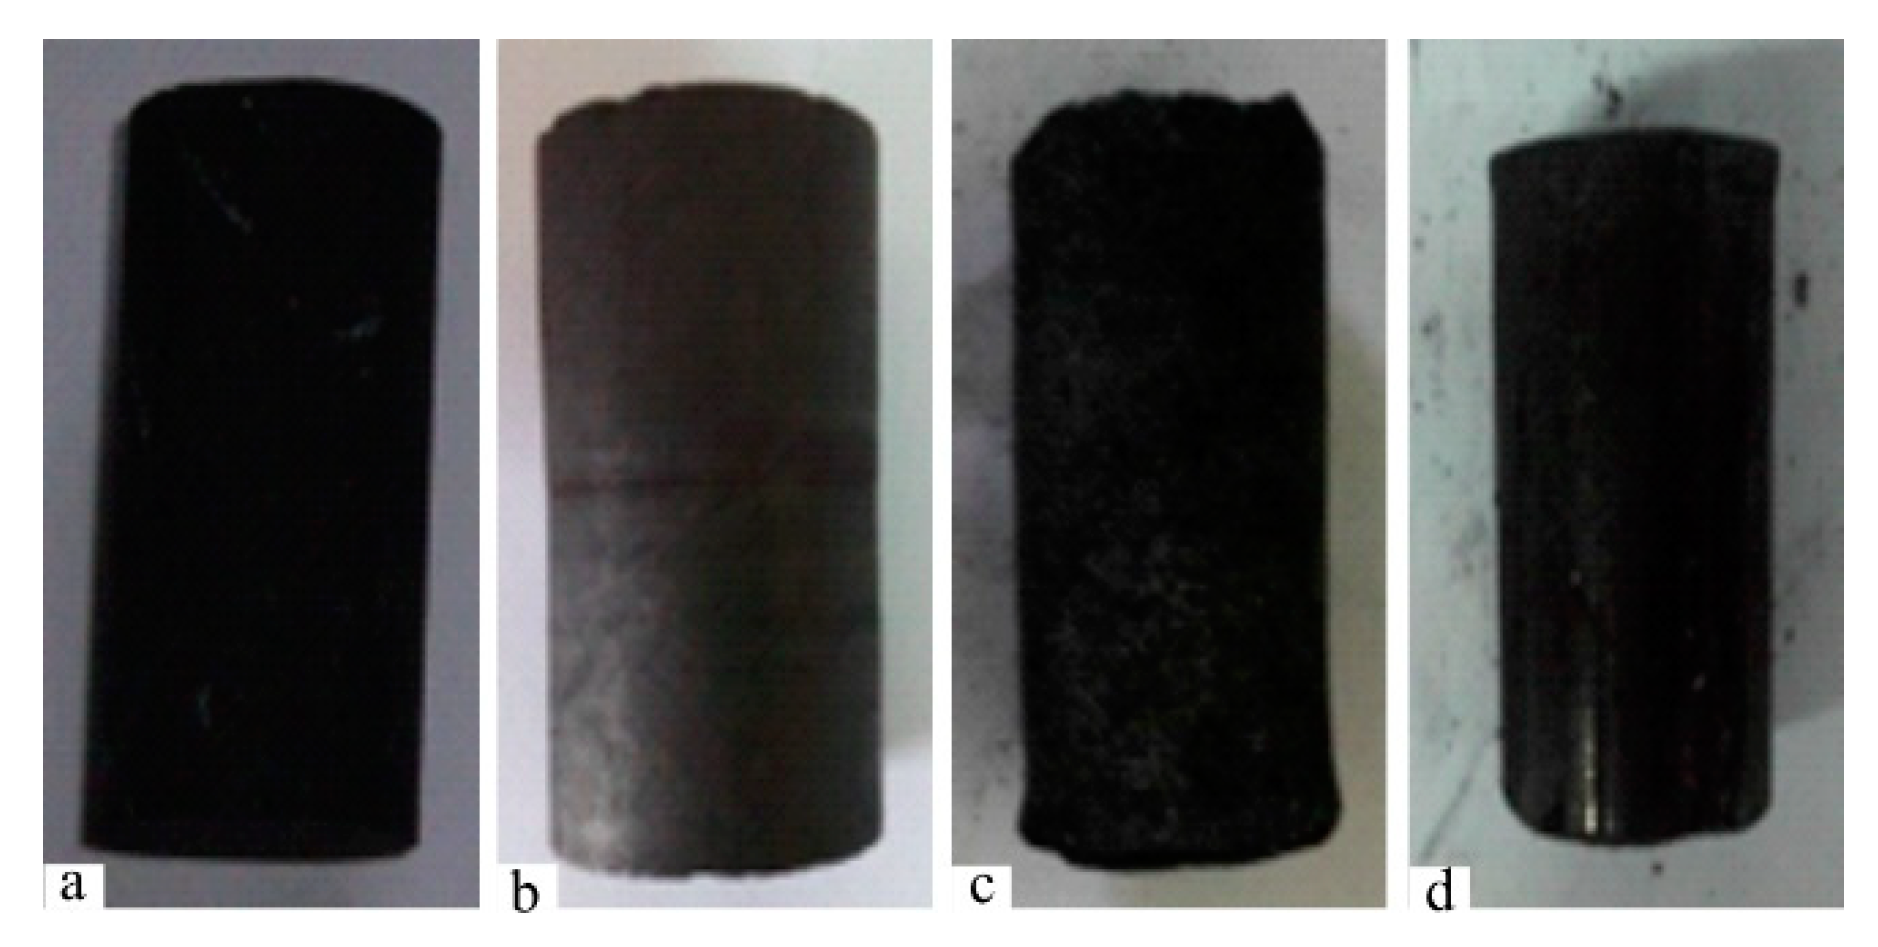
| Samples | Coal structure | Ro,max(%) | Mad (%) | Ad (%) | Vdaf (%) | FCd (%) | Porosity /% | f value |
| WYM-1 | Original structure coal | 3.38 | 2.94 | 8.41 | 5.50 | 83.15 | 6.25 | 1.19 |
| WYM-2 | Fragmented coal | 3.41 | 2.93 | 8.41 | 5.49 | 83.17 | 8.13 | 0.85 |
| WYM-3 | Flax seed coal | 3.39 | 2.67 | 8.36 | 5.63 | 83.22 | 5.19 | 0.41 |
| WYM-4 | Mylonitized coal | 3.44 | 2.53 | 8.57 | 5.71 | 83.19 | 4.61 | 0.15 |
| FM-1 | Original structure coal | 1.14 | 1.42 | 10.10 | 11.03 | 70.65 | 4.40 | 0.81 |
| FM-2 | Fragmented coal | 1.16 | 1.44 | 8.70 | 10.52 | 69.99 | 4.77 | 0.64 |
| FM-3 | Flax seed coal | 1.14 | 1.21 | 8.65 | 10.79 | 70.52 | 3.32 | 0.31 |
| FM-4 | Mylonitized coal | 1.15 | 1.06 | 8.77 | 10.21 | 70.32 | 2.87 | 0.15 |
| Coal seam burial depth /m |
Predicted coal seam temperature/℃ | Average value/℃ | Predicted reservoir pressure/MPa | Average value /MPa |
| Minimum/Maximum | Minimum/Maximum | |||
| 600 | 22/32 | 27 | 2.4/7.7 | 5.0 |
| 700 | 24/34 | 29 | 2.8/9.0 | 5.9 |
| 800 | 26/36 | 31 | 3.2/10.3 | 6.7 |
| 900 | 28/38 | 33 | 3.6/11.6 | 7.6 |
| 1000 | 30/40 | 35 | 4.0/12.9 | 8.6 |
| 1100 | 32/43 | 37.5 | 4.4/14.2 | 9.5 |
| 1200 | 34/46 | 40 | 4.8/15.5 | 10.3 |
| 1300 | 36/49 | 42.5 | 5.2/16.8 | 11.0 |
| Simulated burial depth/m | Confining pressure/MPa | Gas pressure/MPa | Temperature/℃ | Remarks |
| 600 | 5.0 | 0.5 | 27 | Orthogonal experiment designed accordingly |
| 800 | 6.7 | 1.0 | 31 | |
| 1000 | 8.6 | 1.5 | 35 | |
| 1200 | 10.3 | 2.0 | 40 |
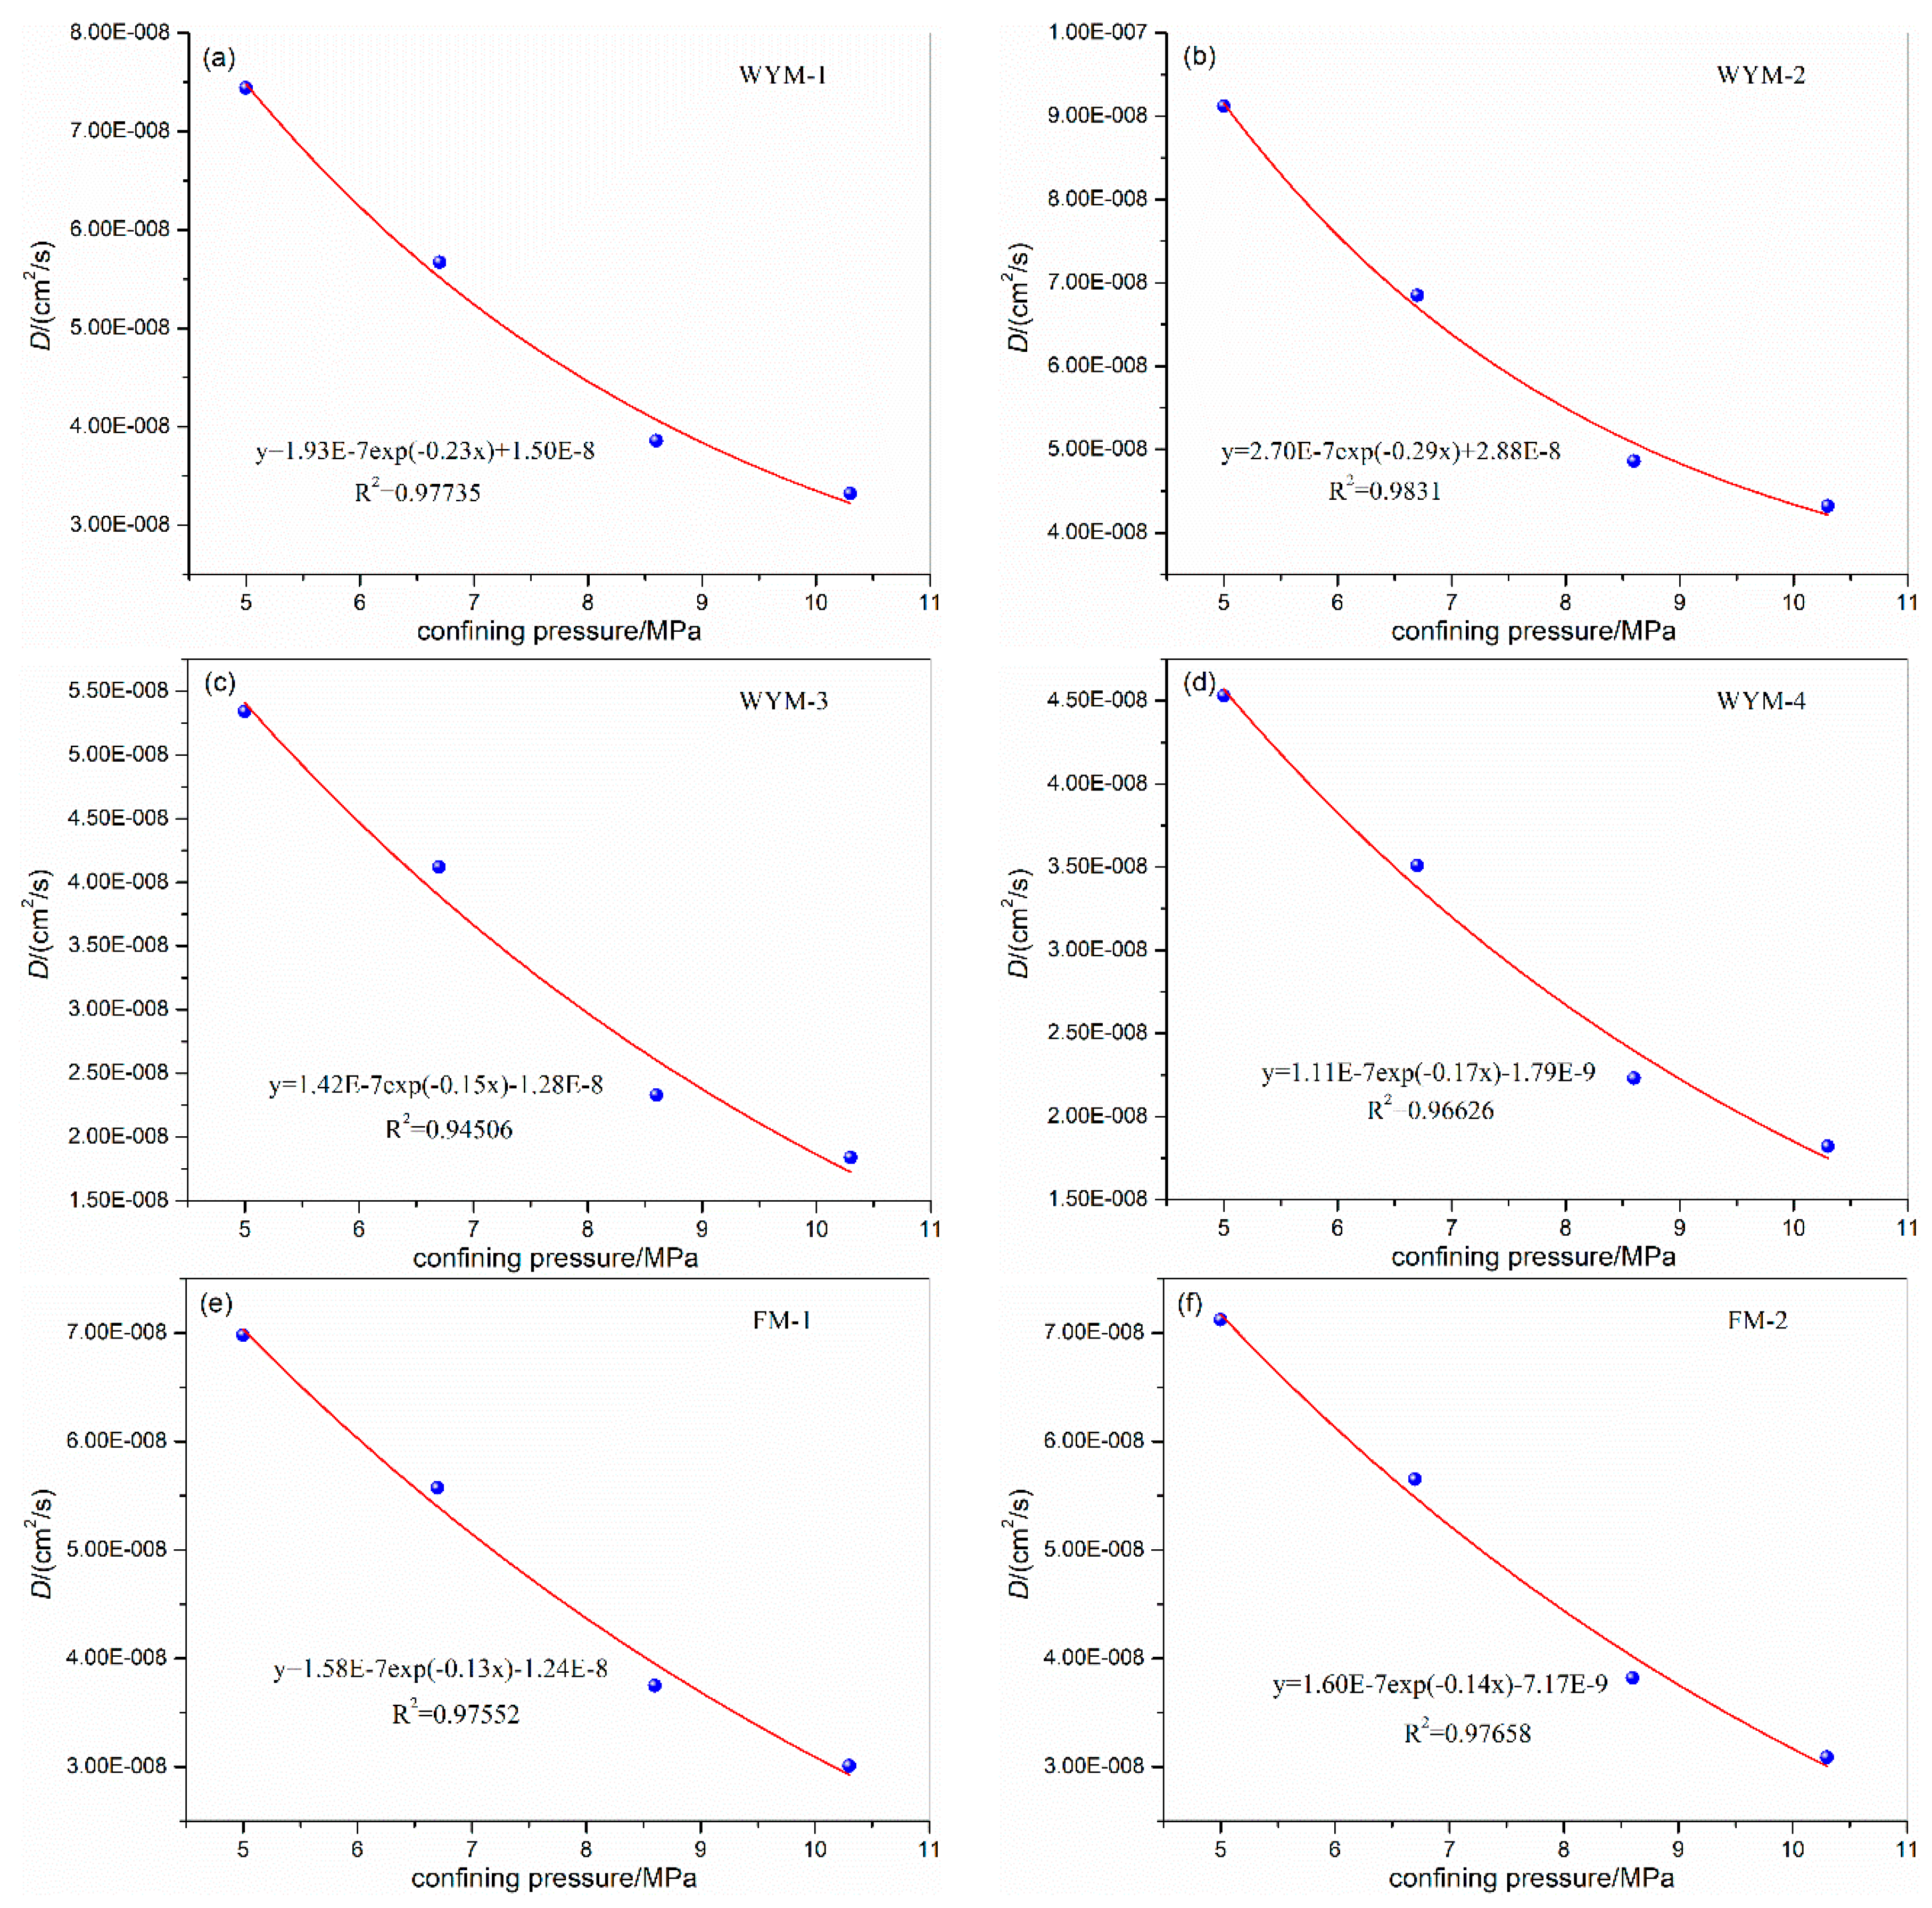
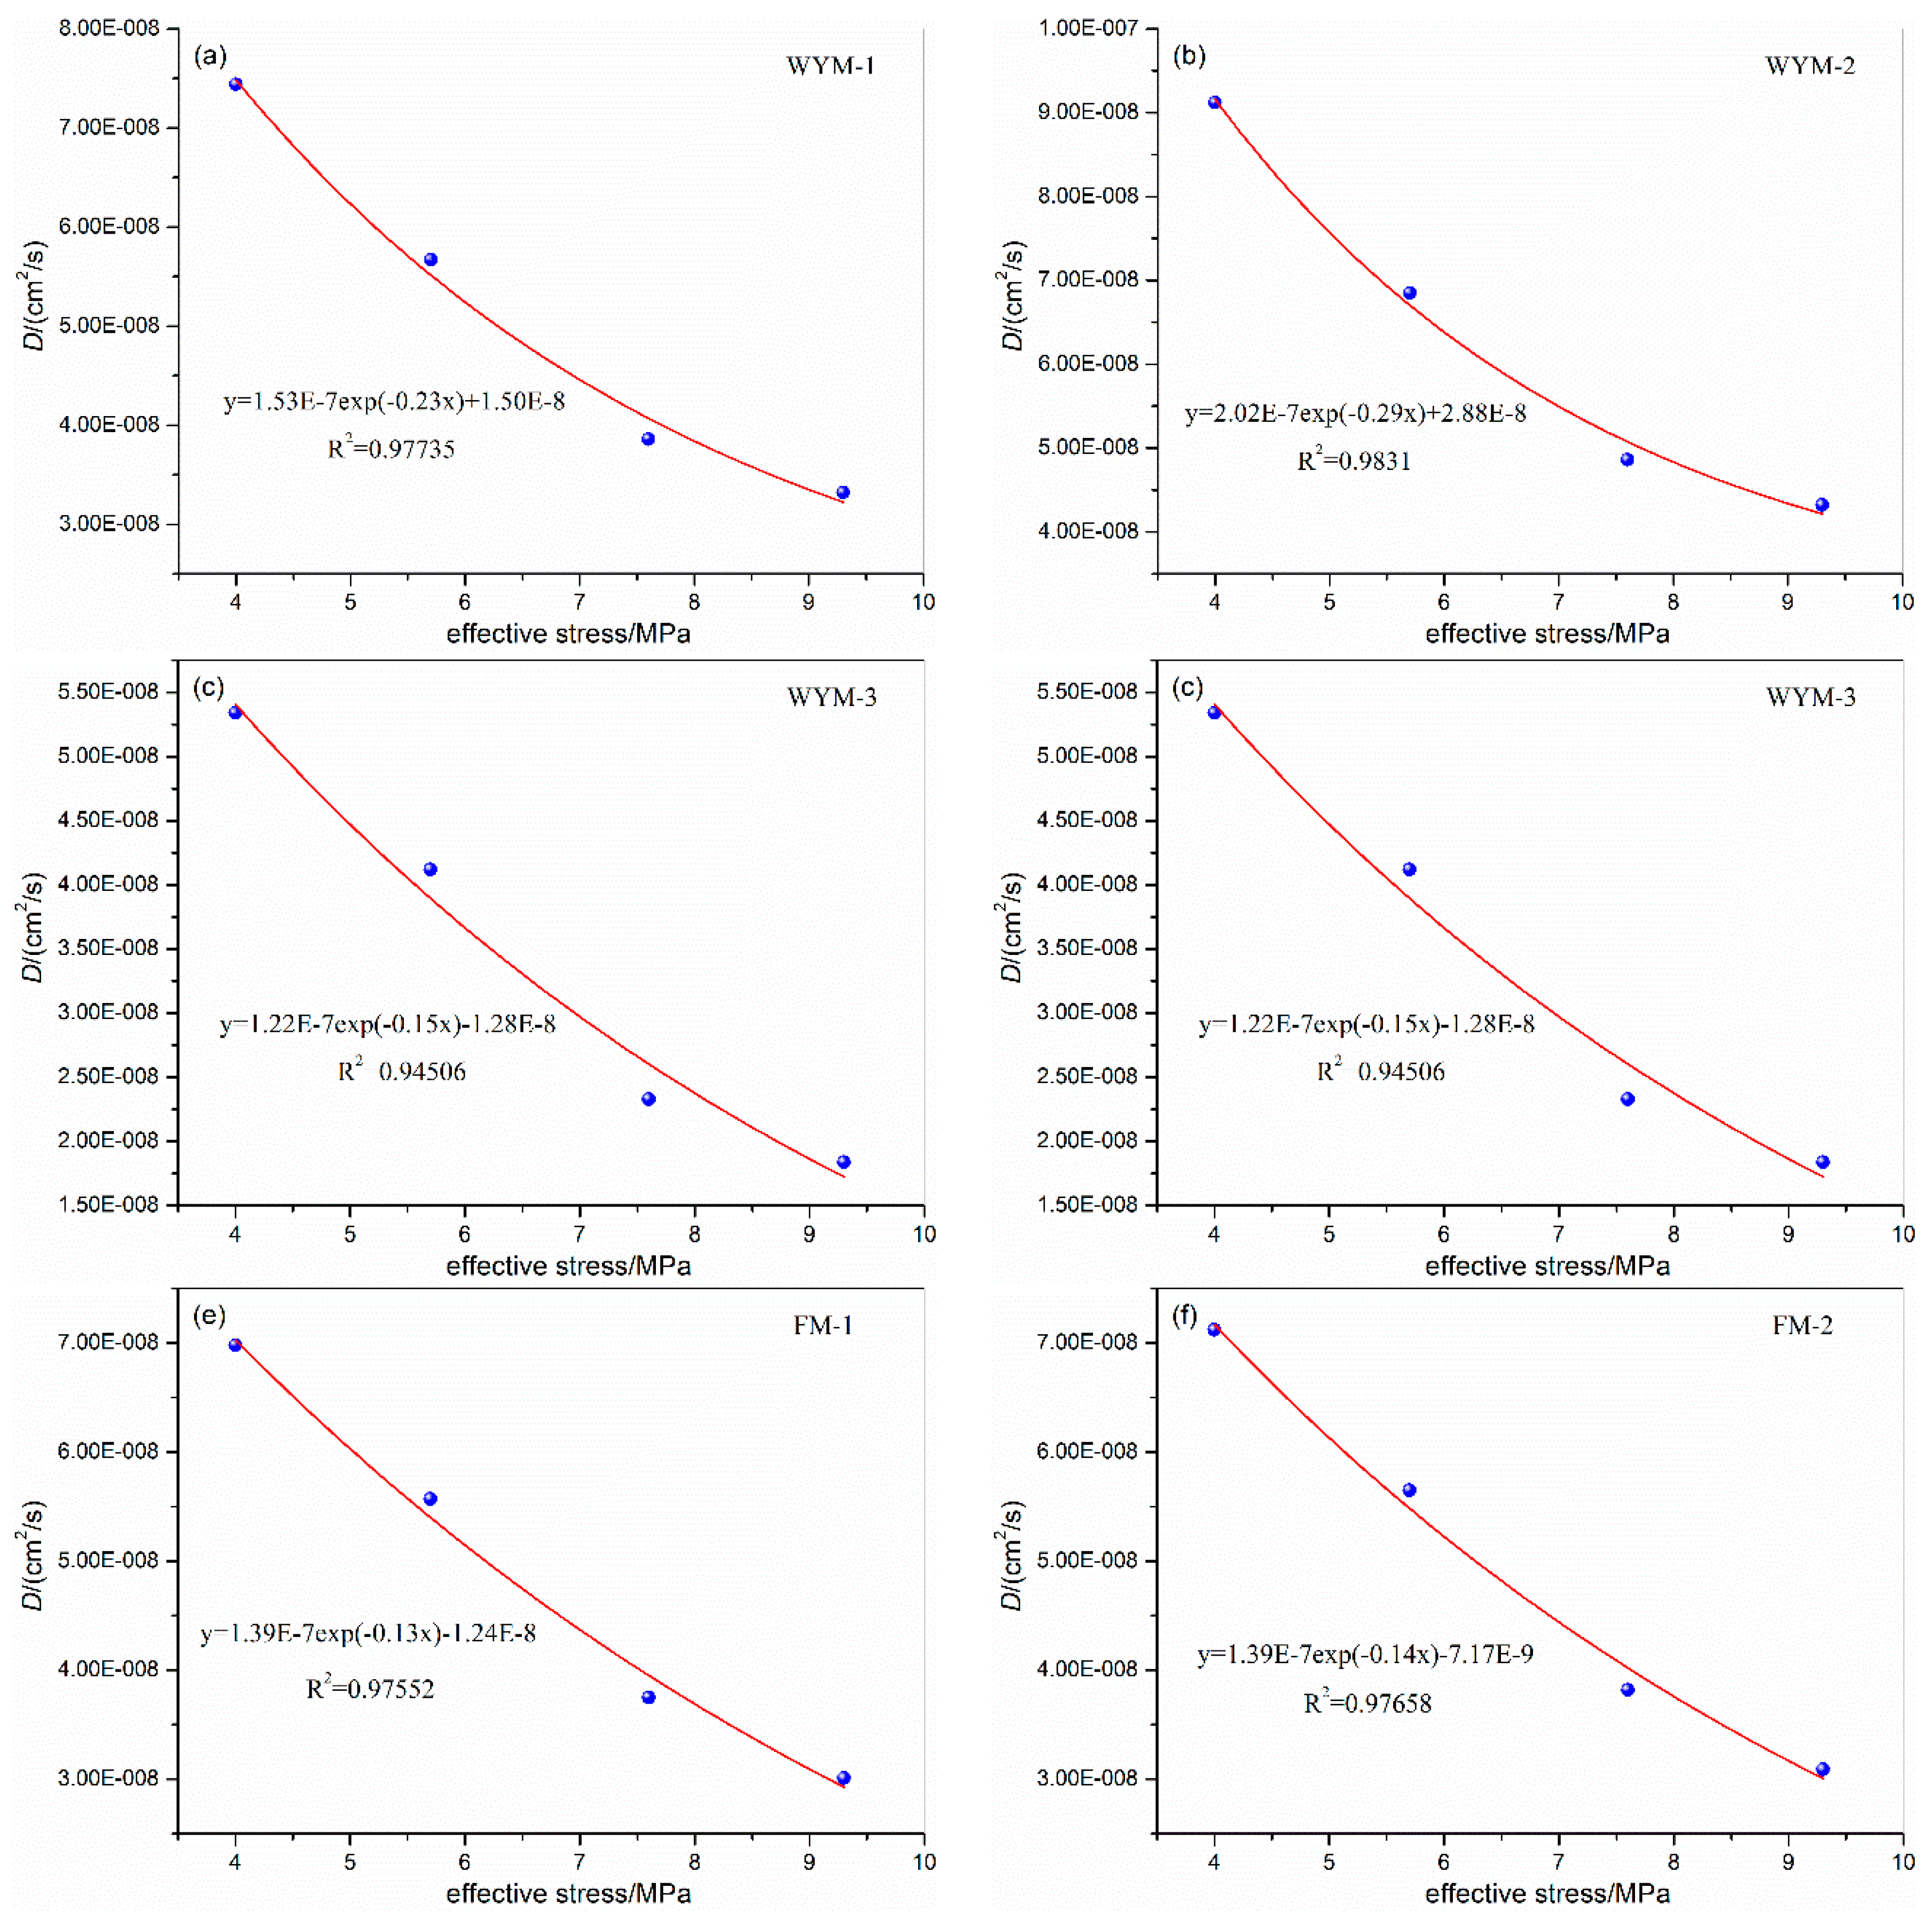
| Samples | Experimental conditions | Effective stress/MPa | CH4 diffusion coefficient D/(cm2/s) | Samples | Experimental conditions | Effective stress/MPa | CH4 diffusion coefficient D/(cm2/s) | ||||
| Confining pressure /MPa | Temperature /℃ | Gas pressure /MPa | Confining pressure /MPa | Temperature /℃ | Gas pressure /MPa | ||||||
| WYM-1 | 5.0 | 31 | 1.0 | 4.0 | 7.44E-08 | WYM-3 | 5.0 | 31 | 1.0 | 4.0 | 5.34E-08 |
| 6.7 | 5.7 | 5.67E-08 | 6.7 | 5.7 | 4.12E-08 | ||||||
| 8.6 | 7.6 | 3.86E-08 | 8.6 | 7.6 | 2.33E-08 | ||||||
| 10.3 | 9.3 | 3.32E-08 | 10.3 | 9.3 | 1.84E-08 | ||||||
| WYM-2 | 5.0 | 31 | 1.0 | 4.0 | 9.12E-08 | WYM-4 | 5.0 | 31 | 1.0 | 4.0 | 4.53E-08 |
| 6.7 | 5.7 | 6.85E-08 | 6.7 | 5.7 | 3.51E-08 | ||||||
| 8.6 | 7.6 | 4.86E-08 | 8.6 | 7.6 | 2.23E-08 | ||||||
| 10.3 | 9.3 | 4.32E-08 | 10.3 | 9.3 | 1.82E-08 | ||||||
| FM-1 | 5.0 | 31 | 1.0 | 4.0 | 6.98E-08 | FM-2 | 5.0 | 31 | 1.0 | 4.0 | 7.12E-08 |
| 6.7 | 5.7 | 5.57E-08 | 6.7 | 5.7 | 5.65E-08 | ||||||
| 8.6 | 7.6 | 3.75E-08 | 8.6 | 7.6 | 3.82E-08 | ||||||
| 10.3 | 9.3 | 3.01E-08 | 10.3 | 9.3 | 3.09E-08 | ||||||
| Samples | Experimental conditions | Effective stress/MPa | CH4 diffusion coefficient D/(cm2/s) | Samples | Experimental conditions | Effective stress/MPa | CH4 diffusion coefficient D/(cm2/s) | ||||
| Gas pressure /MPa | Temperature /℃ | Confining pressure /MPa | Gas pressure /MPa | Temperature /℃ | Confining pressure /MPa | ||||||
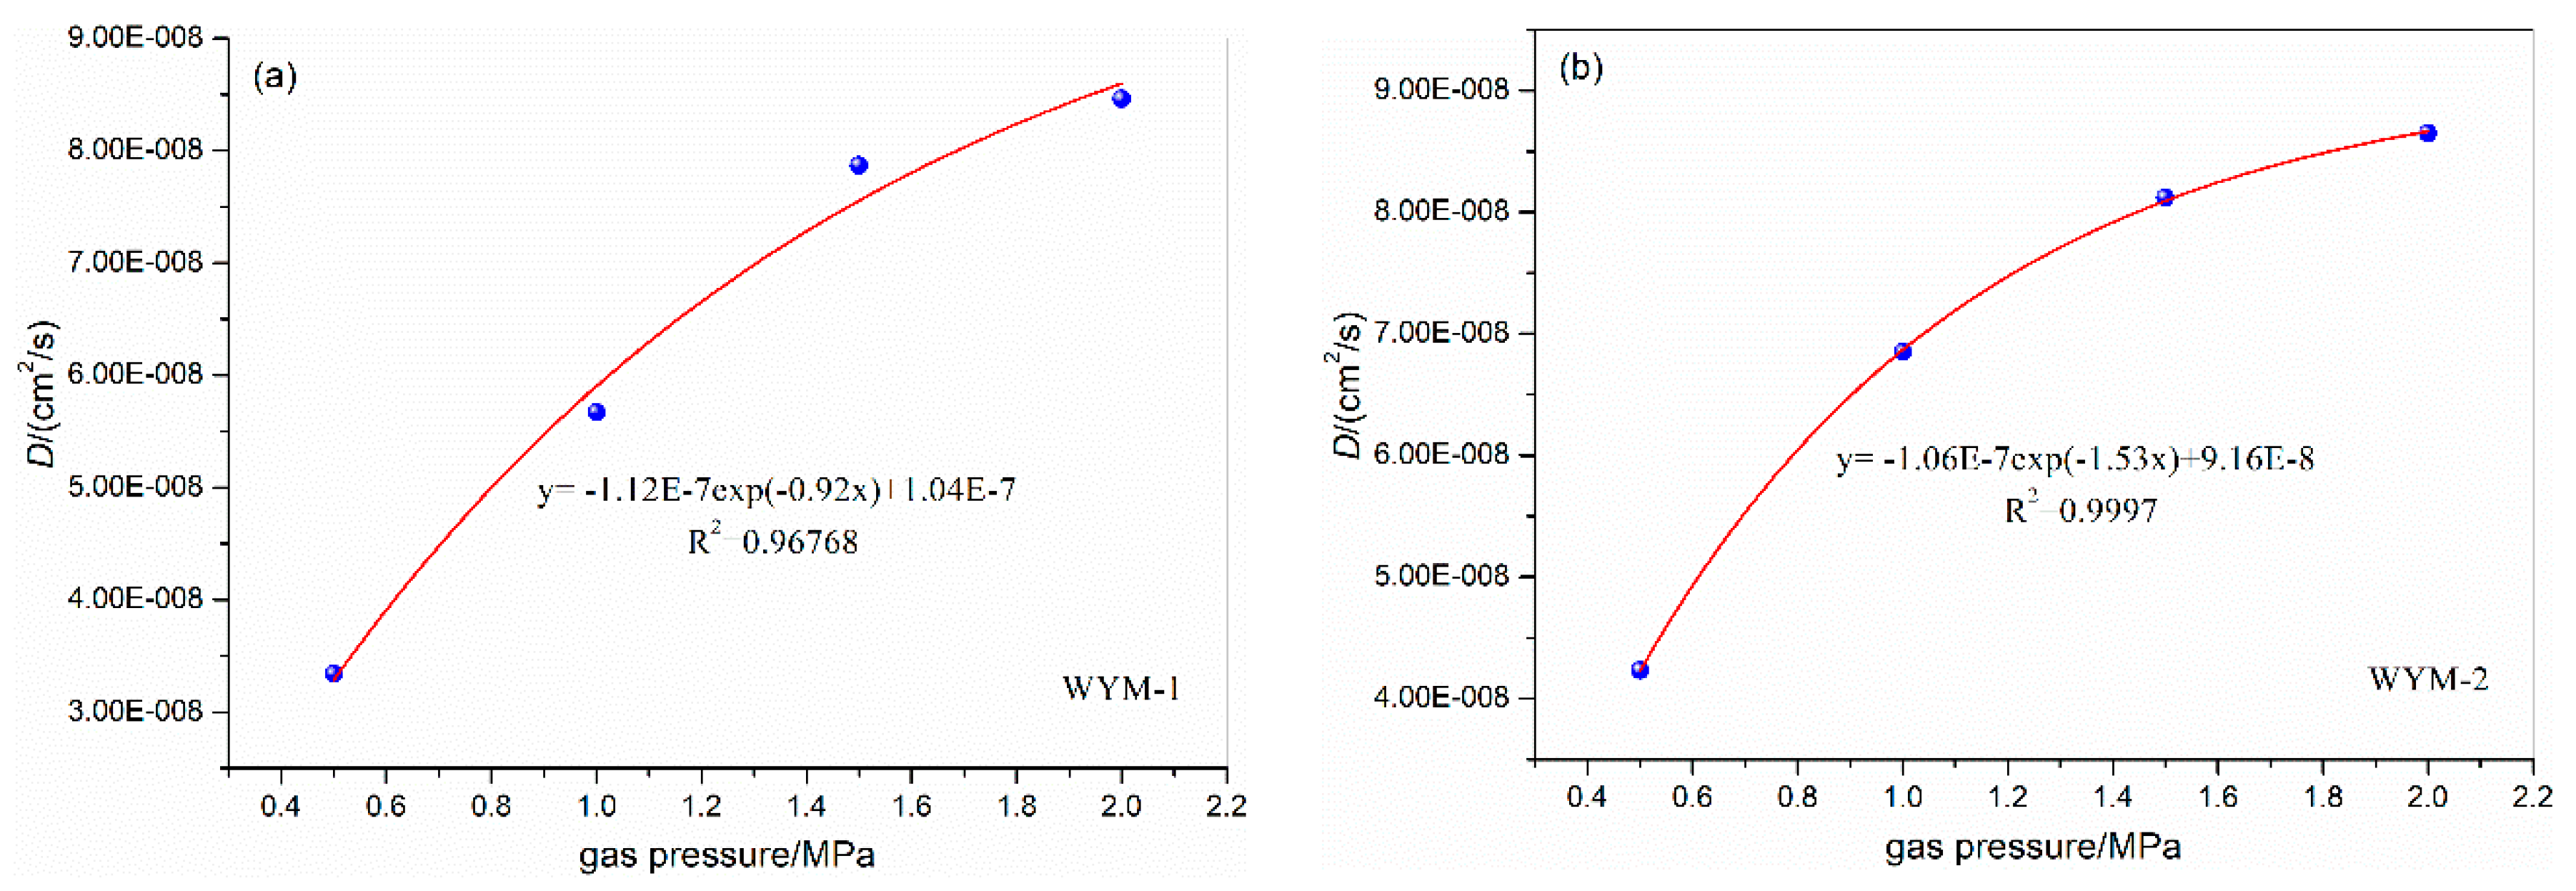
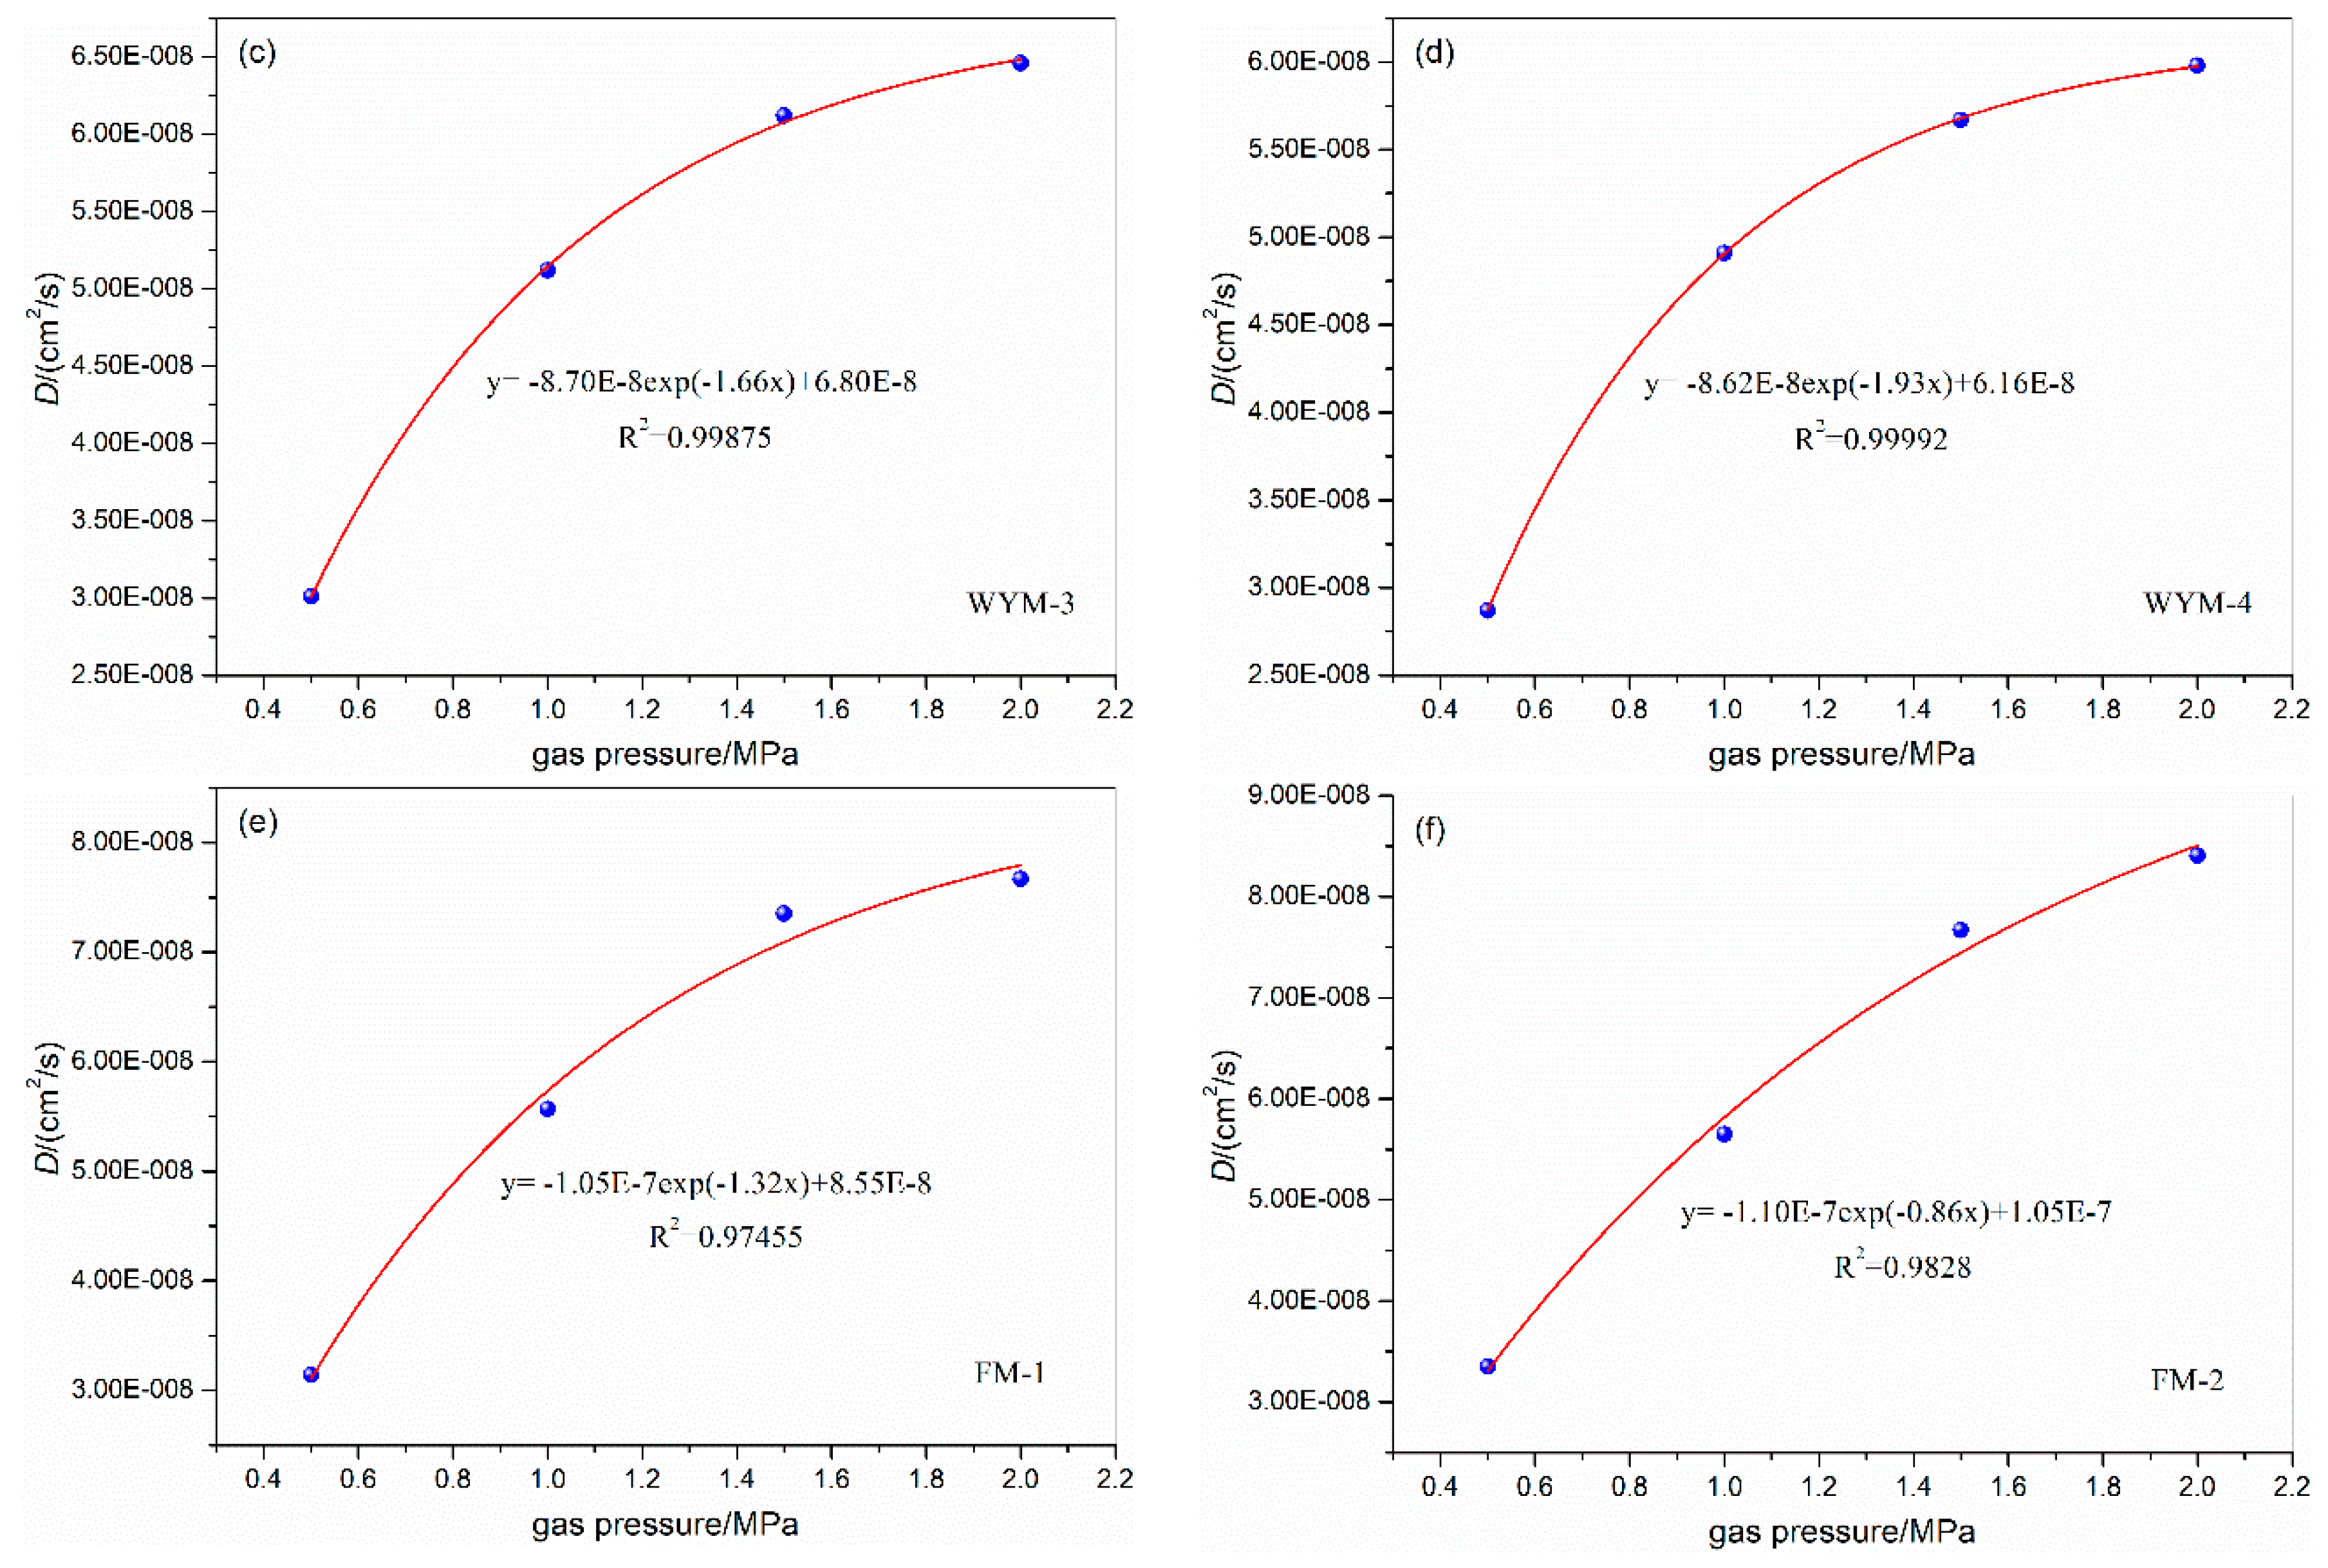
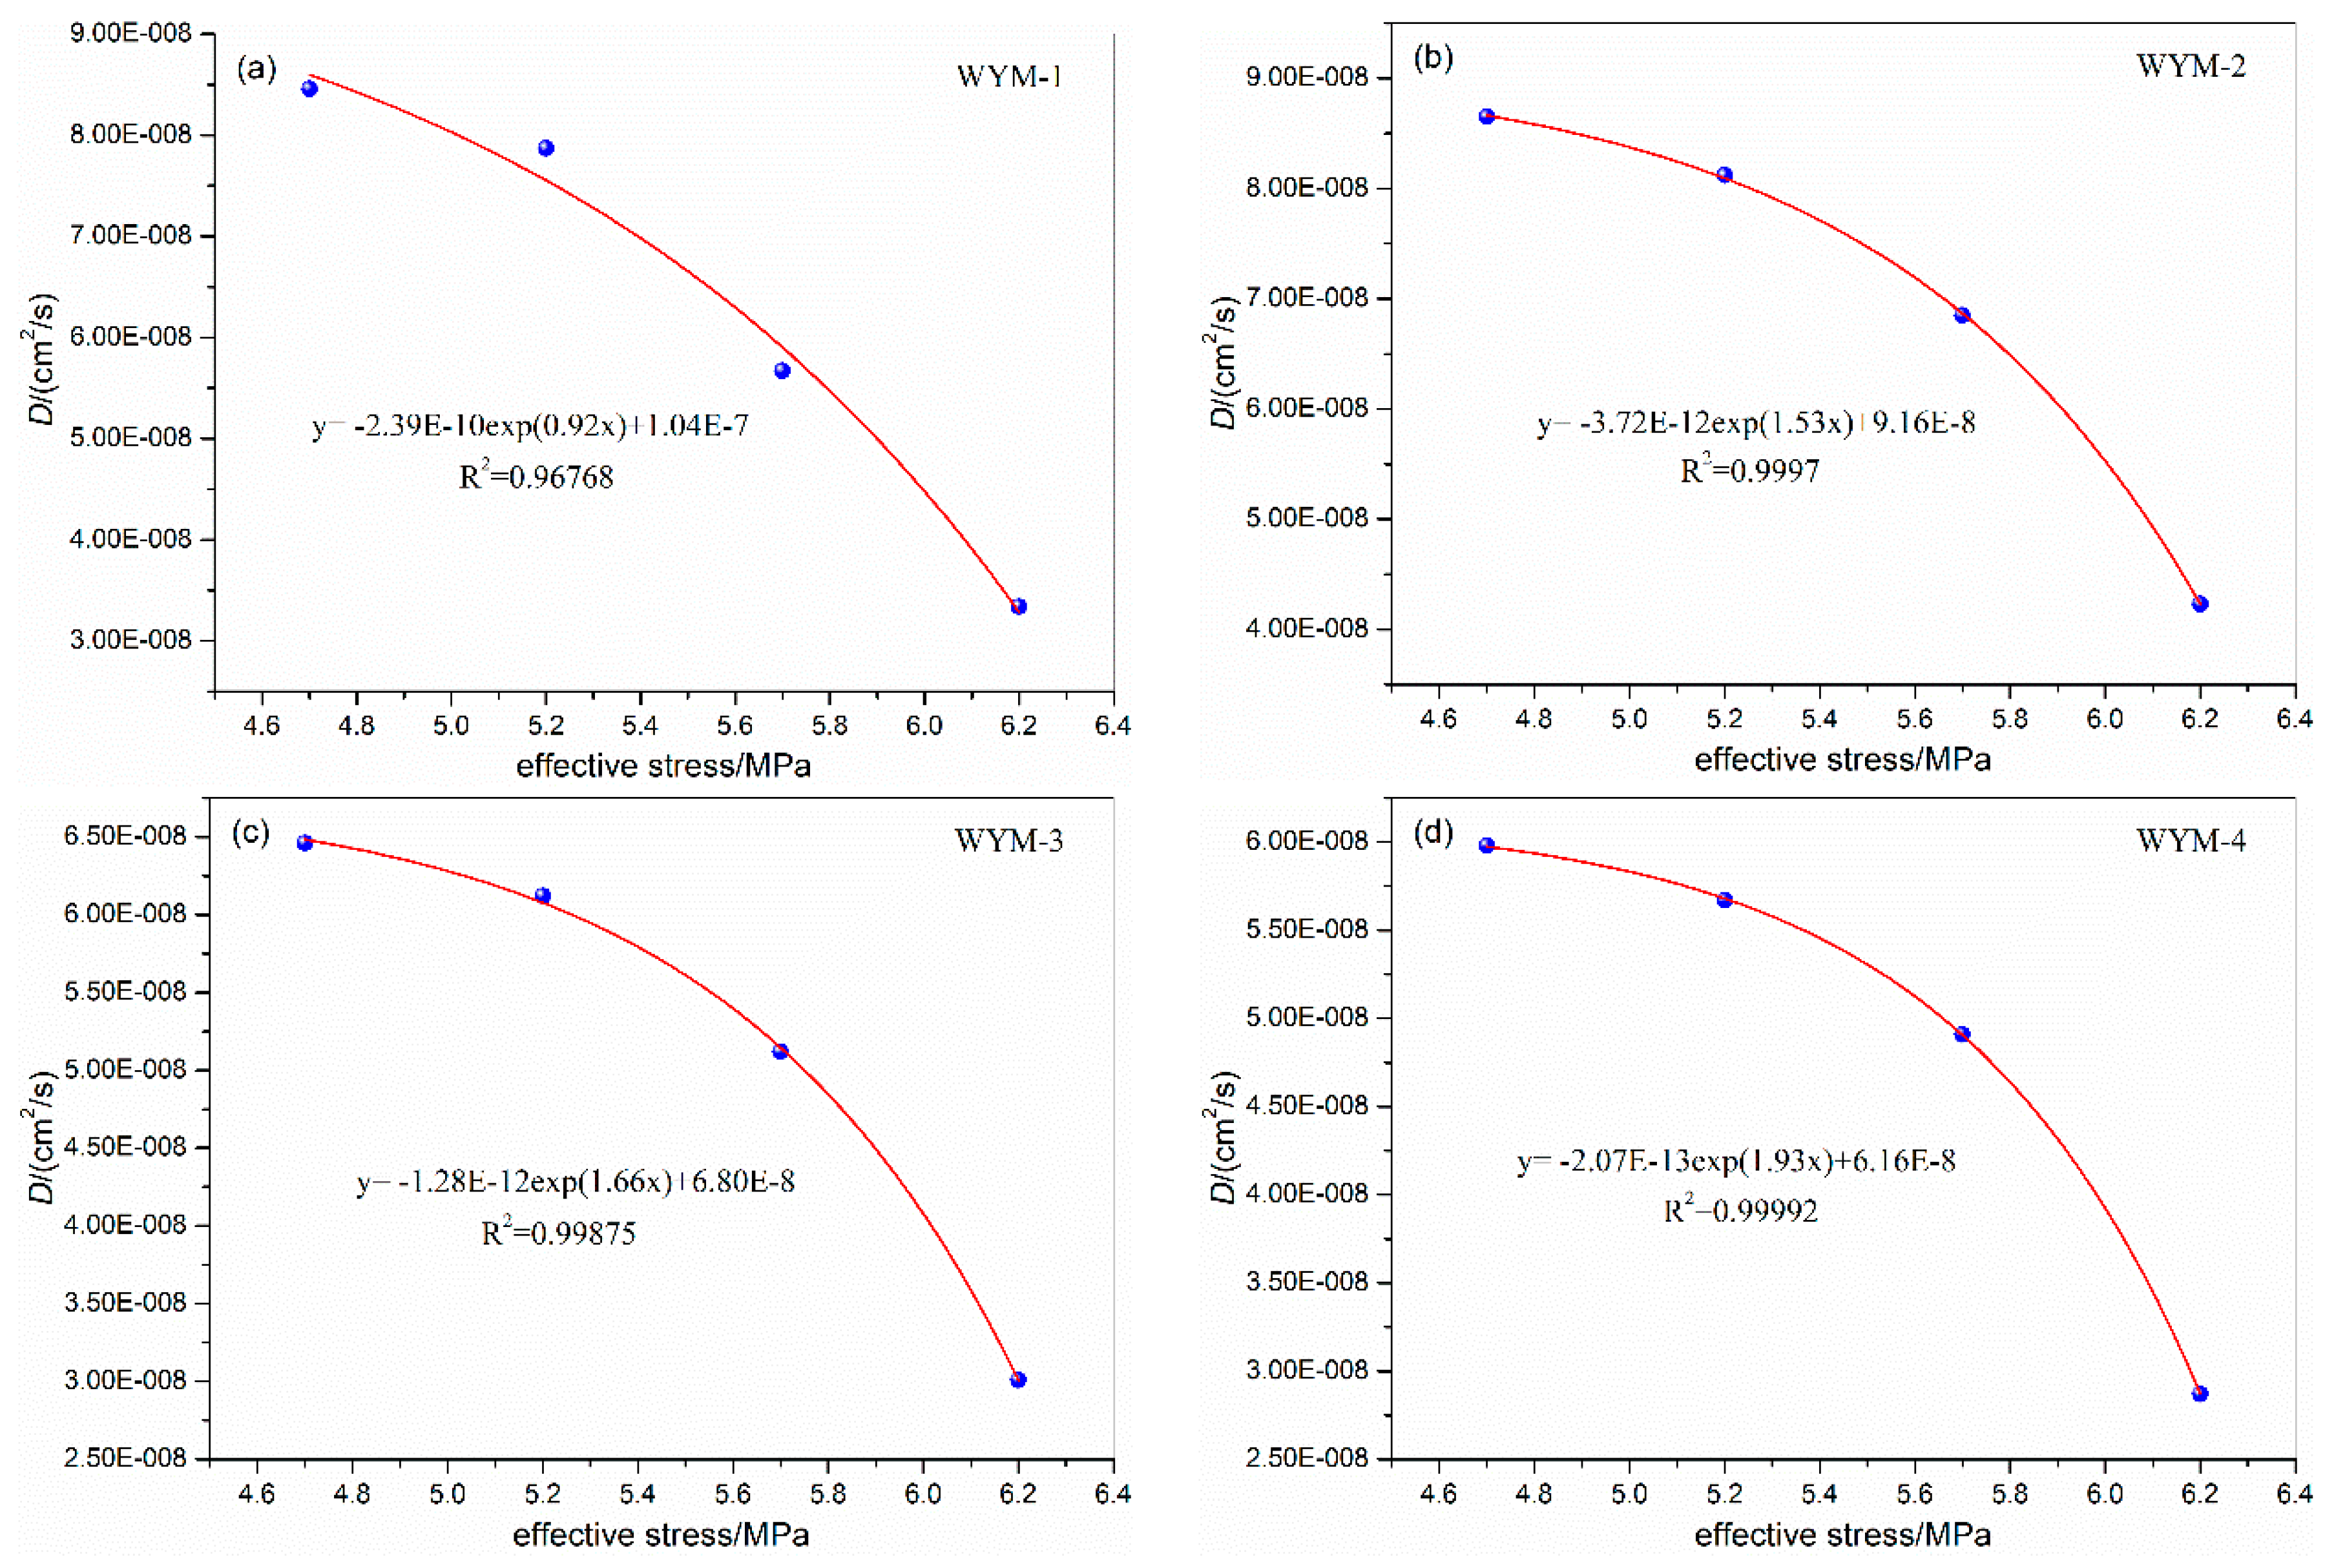
| WYM-1 | 0.5 | 31 | 6.7 | 6.2 | 3.34E-08 | WYM-3 | 0.5 | 31 | 6.7 | 6.2 | 3.01E-08 |
| 1.0 | 5.7 | 5.67E-08 | 1.0 | 5.7 | 4.12E-08 | ||||||
| 1.5 | 5.2 | 7.87E-08 | 1.5 | 5.2 | 6.12E-08 | ||||||
| 2.0 | 4.7 | 8.46E-08 | 2.0 | 4.7 | 6.46E-08 | ||||||
| WYM-2 | 0.5 | 31 | 6.7 | 6.2 | 4.23E-08 | WYM-4 | 0.5 | 31 | 6.7 | 6.2 | 2.87E-08 |
| 1.0 | 5.7 | 6.85E-08 | 1.0 | 5.7 | 3.51E-08 | ||||||
| 1.5 | 5.2 | 8.12E-08 | 1.5 | 5.2 | 5.67E-08 | ||||||
| 2.0 | 4.7 | 8.65E-08 | 2.0 | 4.7 | 5.98E-08 | ||||||
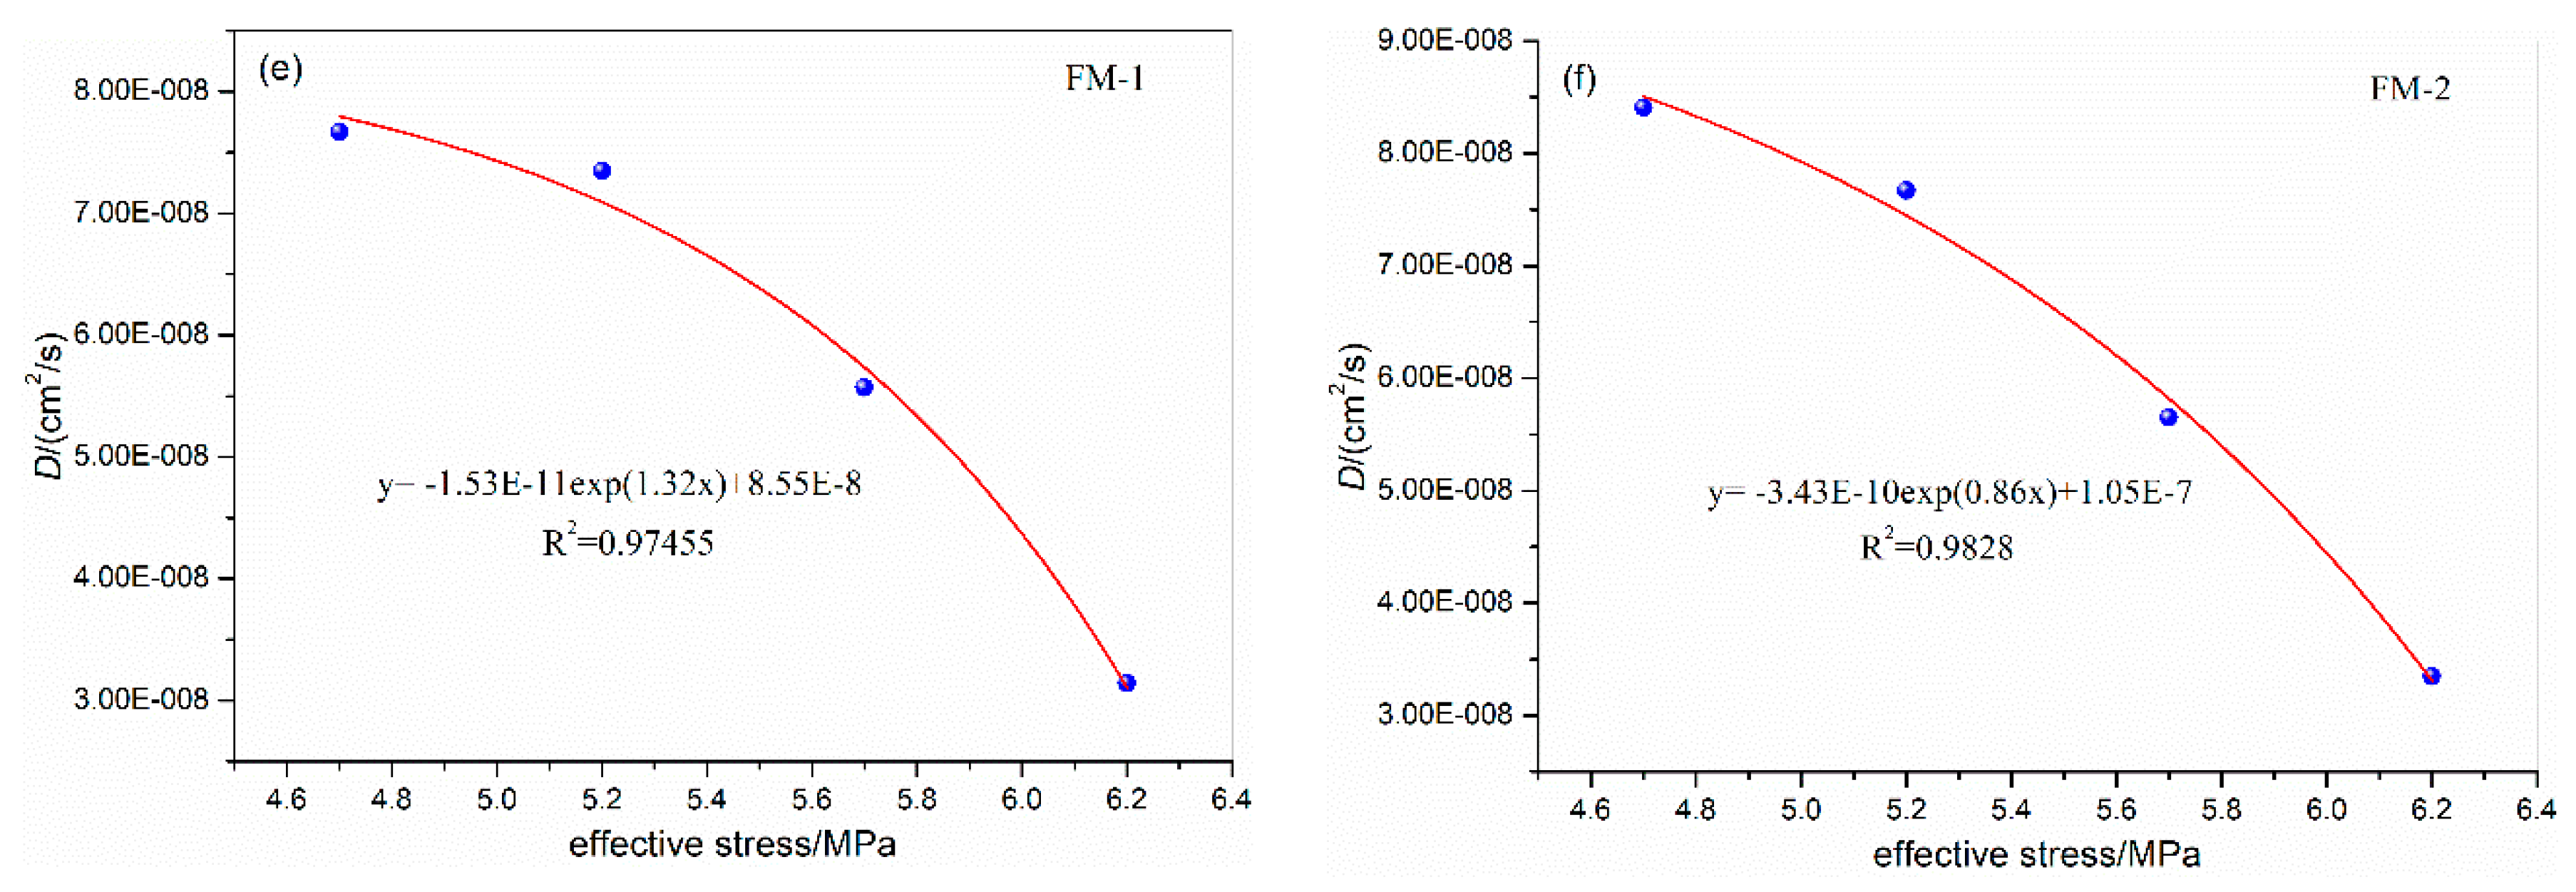
| FM-1 | 0.5 | 31 | 6.7 | 6.2 | 3.14E-08 | FM-2 | 0.5 | 31 | 6.7 | 6.2 | 3.35E-08 |
| 1.0 | 5.7 | 5.57E-08 | 1.0 | 5.7 | 5.65E-08 | ||||||
| 1.5 | 5.2 | 7.35E-08 | 1.5 | 5.2 | 7.67E-08 | ||||||
| 2.0 | 4.7 | 7.67E-08 | 2.0 | 4.7 | 8.41E-08 | ||||||
| Samples | Experimental conditions | CH4 diffusion coefficient D/(cm2/s) | No. | Experimental conditions | CH4 diffusion coefficient D/(cm2/s) | ||||
| Temperature/℃ | Confining pressure/MPa | Gas pressure/MPa | Temperature/℃ | Confining pressure/MPa | Gas pressure/MPa | ||||
| WYM-1 | 27 | 6.7 | 1.0 | 5.62E-08 | WYM-3 | 27 | 6.7 | 1.0 | 4.07E-08 |
| 31 | 5.67E-08 | 31 | 4.12E-08 | ||||||
| 35 | 5.73E-08 | 35 | 4.18E-08 | ||||||
| 40 | 5.83E-08 | 40 | 4.27E-08 | ||||||
| 45 | 5.97E-08 | 45 | 4.43E-08 | ||||||
| 50 | 6.19E-08 | 50 | 4.56E-08 | ||||||
| WYM-2 | 27 | 6.7 | 1.0 | 6.81E-08 | WYM-4 | 27 | 6.7 | 1.0 | 3.46E-08 |
| 31 | 6.85E-08 | 31 | 3.51E-08 | ||||||
| 35 | 6.91E-08 | 35 | 3.55E-08 | ||||||
| 40 | 7.03E-08 | 40 | 3.62E-08 | ||||||
| 45 | 7.16E-08 | 45 | 3.70E-08 | ||||||
| 50 | 7.34E-08 | 50 | 3.81E-08 | ||||||
| FM-1 | 27 | 6.7 | 1.0 | 5.54E-08 | FM-2 | 27 | 6.7 | 1.0 | 5.62E-08 |
| 31 | 5.57E-08 | 31 | 5.65E-08 | ||||||
| 35 | 5.63E-08 | 35 | 5.72E-08 | ||||||
| 40 | 5.69E-08 | 40 | 5.78E-08 | ||||||
| 45 | 5.76E-08 | 45 | 5.85E-08 | ||||||
| 50 | 5.86E-08 | 50 | 5.96E-08 | ||||||
| Samples | f value | Experimental conditions | CH4 diffusion coefficient D/(cm2/s) | Simulated coal seam burial depth/m | ||
| Confining pressure /MPa | Temperature /℃ | Gas pressure /MPa | ||||
| WYM-1 | 1.19 | 6.7 | 31 | 1.0 | 5.67E-08 | 800m |
| WYM-2 | 0.85 | 6.7 | 31 | 1.0 | 6.85E-08 | |
| WYM-3 | 0.41 | 6.7 | 31 | 1.0 | 4.12E-08 | |
| WYM-4 | 0.15 | 6.7 | 31 | 1.0 | 3.51E-08 | |
| FM-1 | 0.81 | 6.7 | 31 | 1.0 | 5.57E-08 | |
| FM-2 | 0.64 | 6.7 | 31 | 1.0 | 5.65E-08 | |
| FM-3 | 0.31 | 6.7 | 31 | 1.0 | 3.78E-08 | |
| FM-4 | 0.15 | 6.7 | 31 | 1.0 | 3.24E-08 | |
| WYM-1 | 1.19 | 8.6 | 35 | 1.5 | 4.38E-08 | 1000m |
| WYM-2 | 0.85 | 8.6 | 35 | 1.5 | 5.46E-08 | |
| WYM-3 | 0.41 | 8.6 | 35 | 1.5 | 2.83E-08 | |
| WYM-4 | 0.15 | 8.6 | 35 | 1.5 | 2.53E-08 | |
| FM-1 | 0.81 | 8.6 | 35 | 1.5 | 4.25E-08 | |
| FM-2 | 0.64 | 8.6 | 35 | 1.5 | 4.73E-08 | |
| FM-3 | 0.31 | 8.6 | 35 | 1.5 | 2.56E-08 | |
| FM-4 | 0.15 | 8.6 | 35 | 1.5 | 2.14E-08 | |
Disclaimer/Publisher’s Note: The statements, opinions and data contained in all publications are solely those of the individual author(s) and contributor(s) and not of MDPI and/or the editor(s). MDPI and/or the editor(s) disclaim responsibility for any injury to people or property resulting from any ideas, methods, instructions or products referred to in the content. |
© 2023 by the authors. Licensee MDPI, Basel, Switzerland. This article is an open access article distributed under the terms and conditions of the Creative Commons Attribution (CC BY) license (http://creativecommons.org/licenses/by/4.0/).


