Submitted:
21 August 2023
Posted:
22 August 2023
You are already at the latest version
Abstract
Keywords:
Introduction:
Material and Methods:
Sample collection and DNA extraction:
Primer designing:
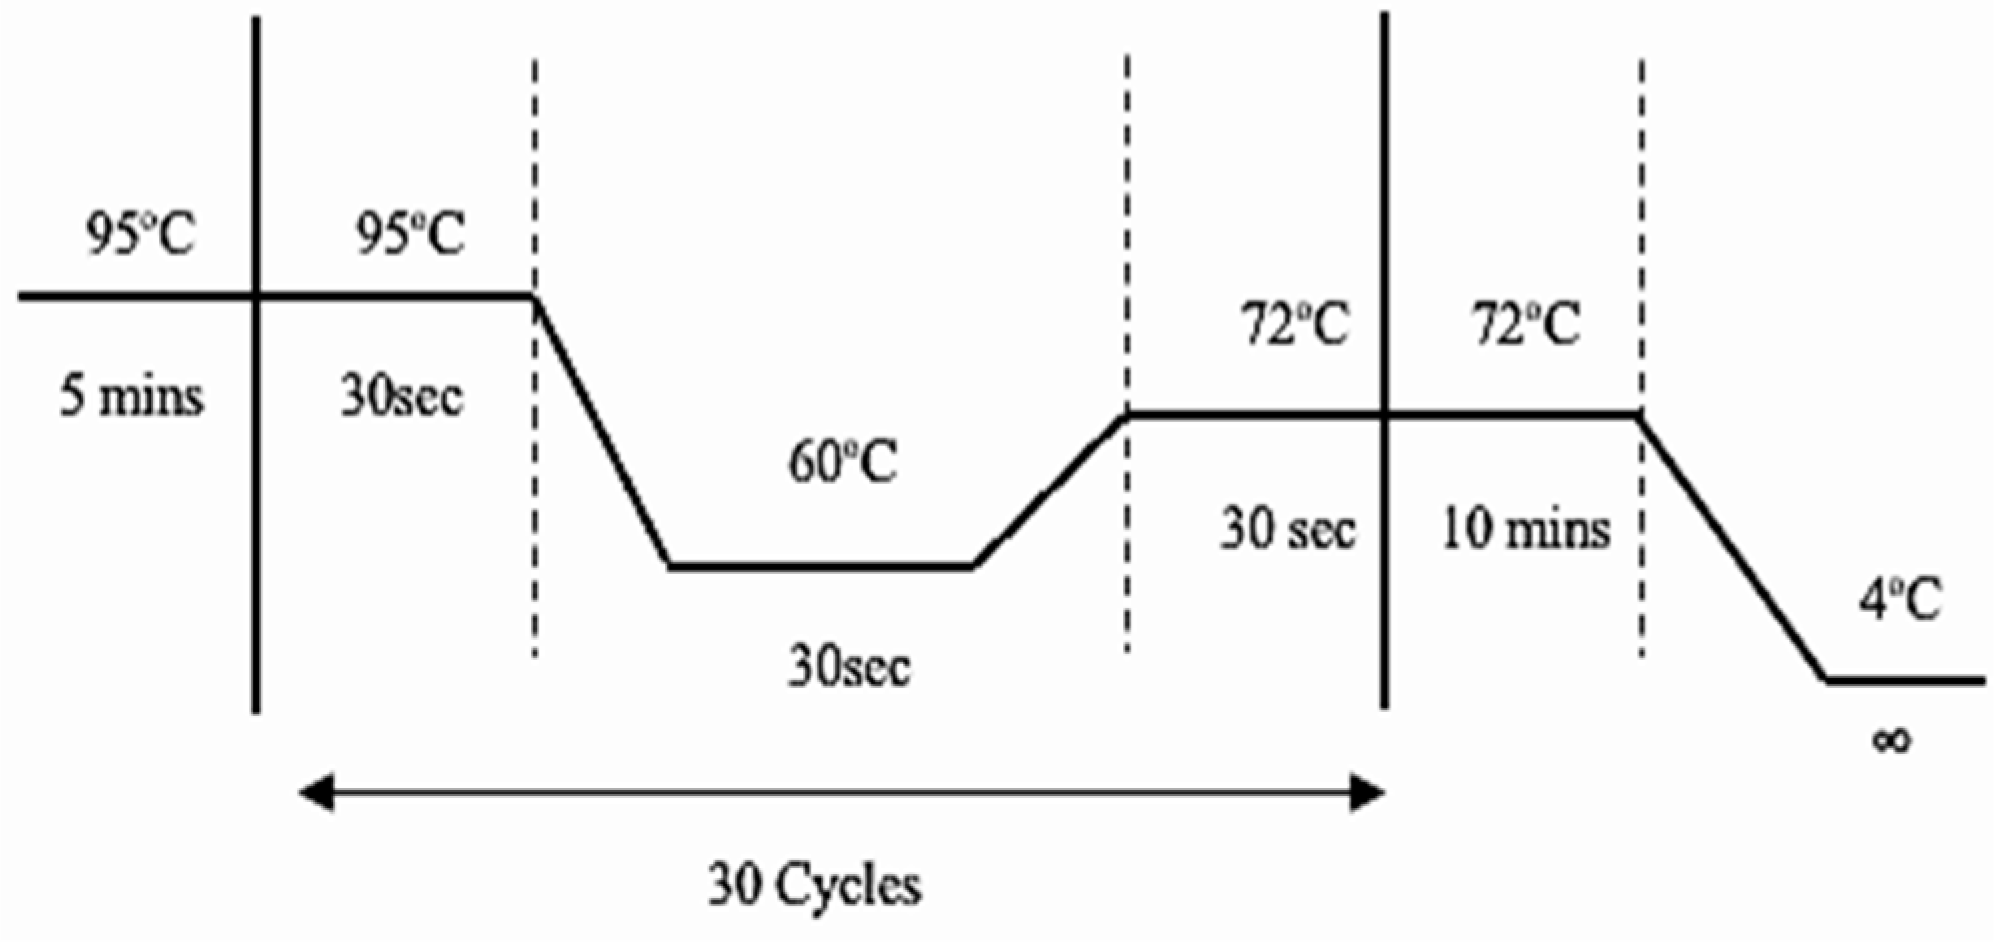
PCR amplification:
Statistical analysis:
Bioinformatics Analyses:
Physicochemical properties:
Secondary structure prediction:
Conserved domains valuations:
Transmembrane structure investigation:
Three-dimensional (3D) structure prediction:
Post-translational modifications:
Protein-protein interaction and functional analysis:
Results:
Variant genotyping:
Statistical association/correlation and odds-ratio analyses:
UMOD protein analysis using different bioinformatics tools:
- I.
- Physicochemical findings using Protparam:
- II.
- Secondary structure prediction of UMOD using PsiPred:
- III.
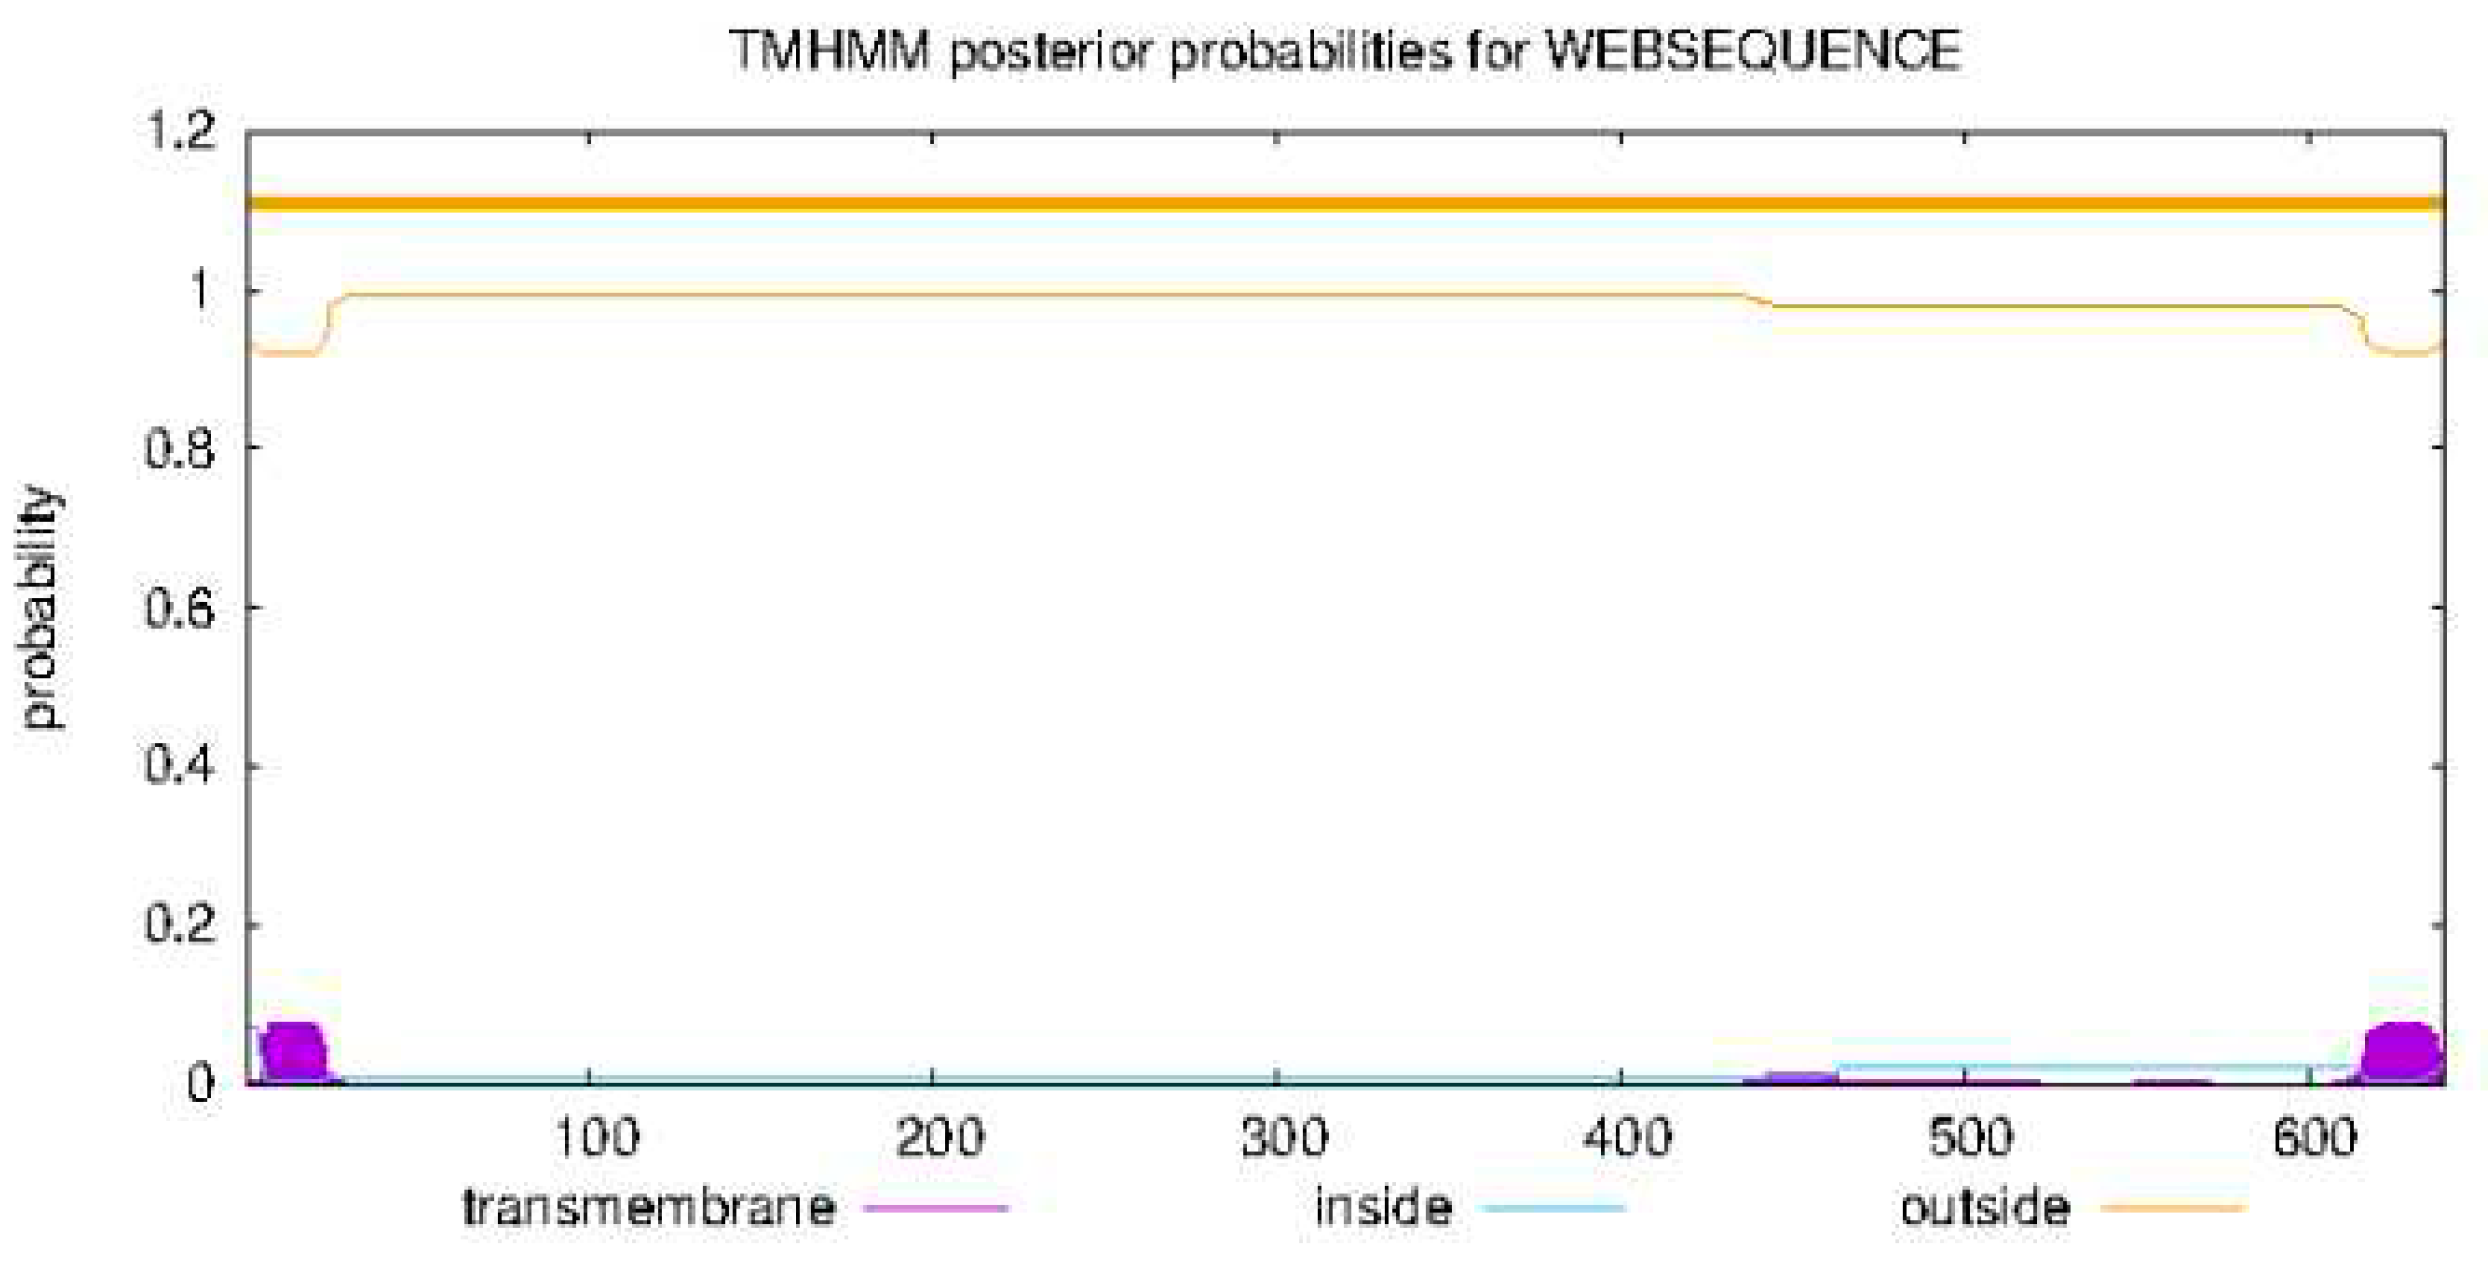
- Transmembrane structure prediction using TMHMM - 2.0:
- IV.
- Protein motifs prediction using Motif finder:
- V.
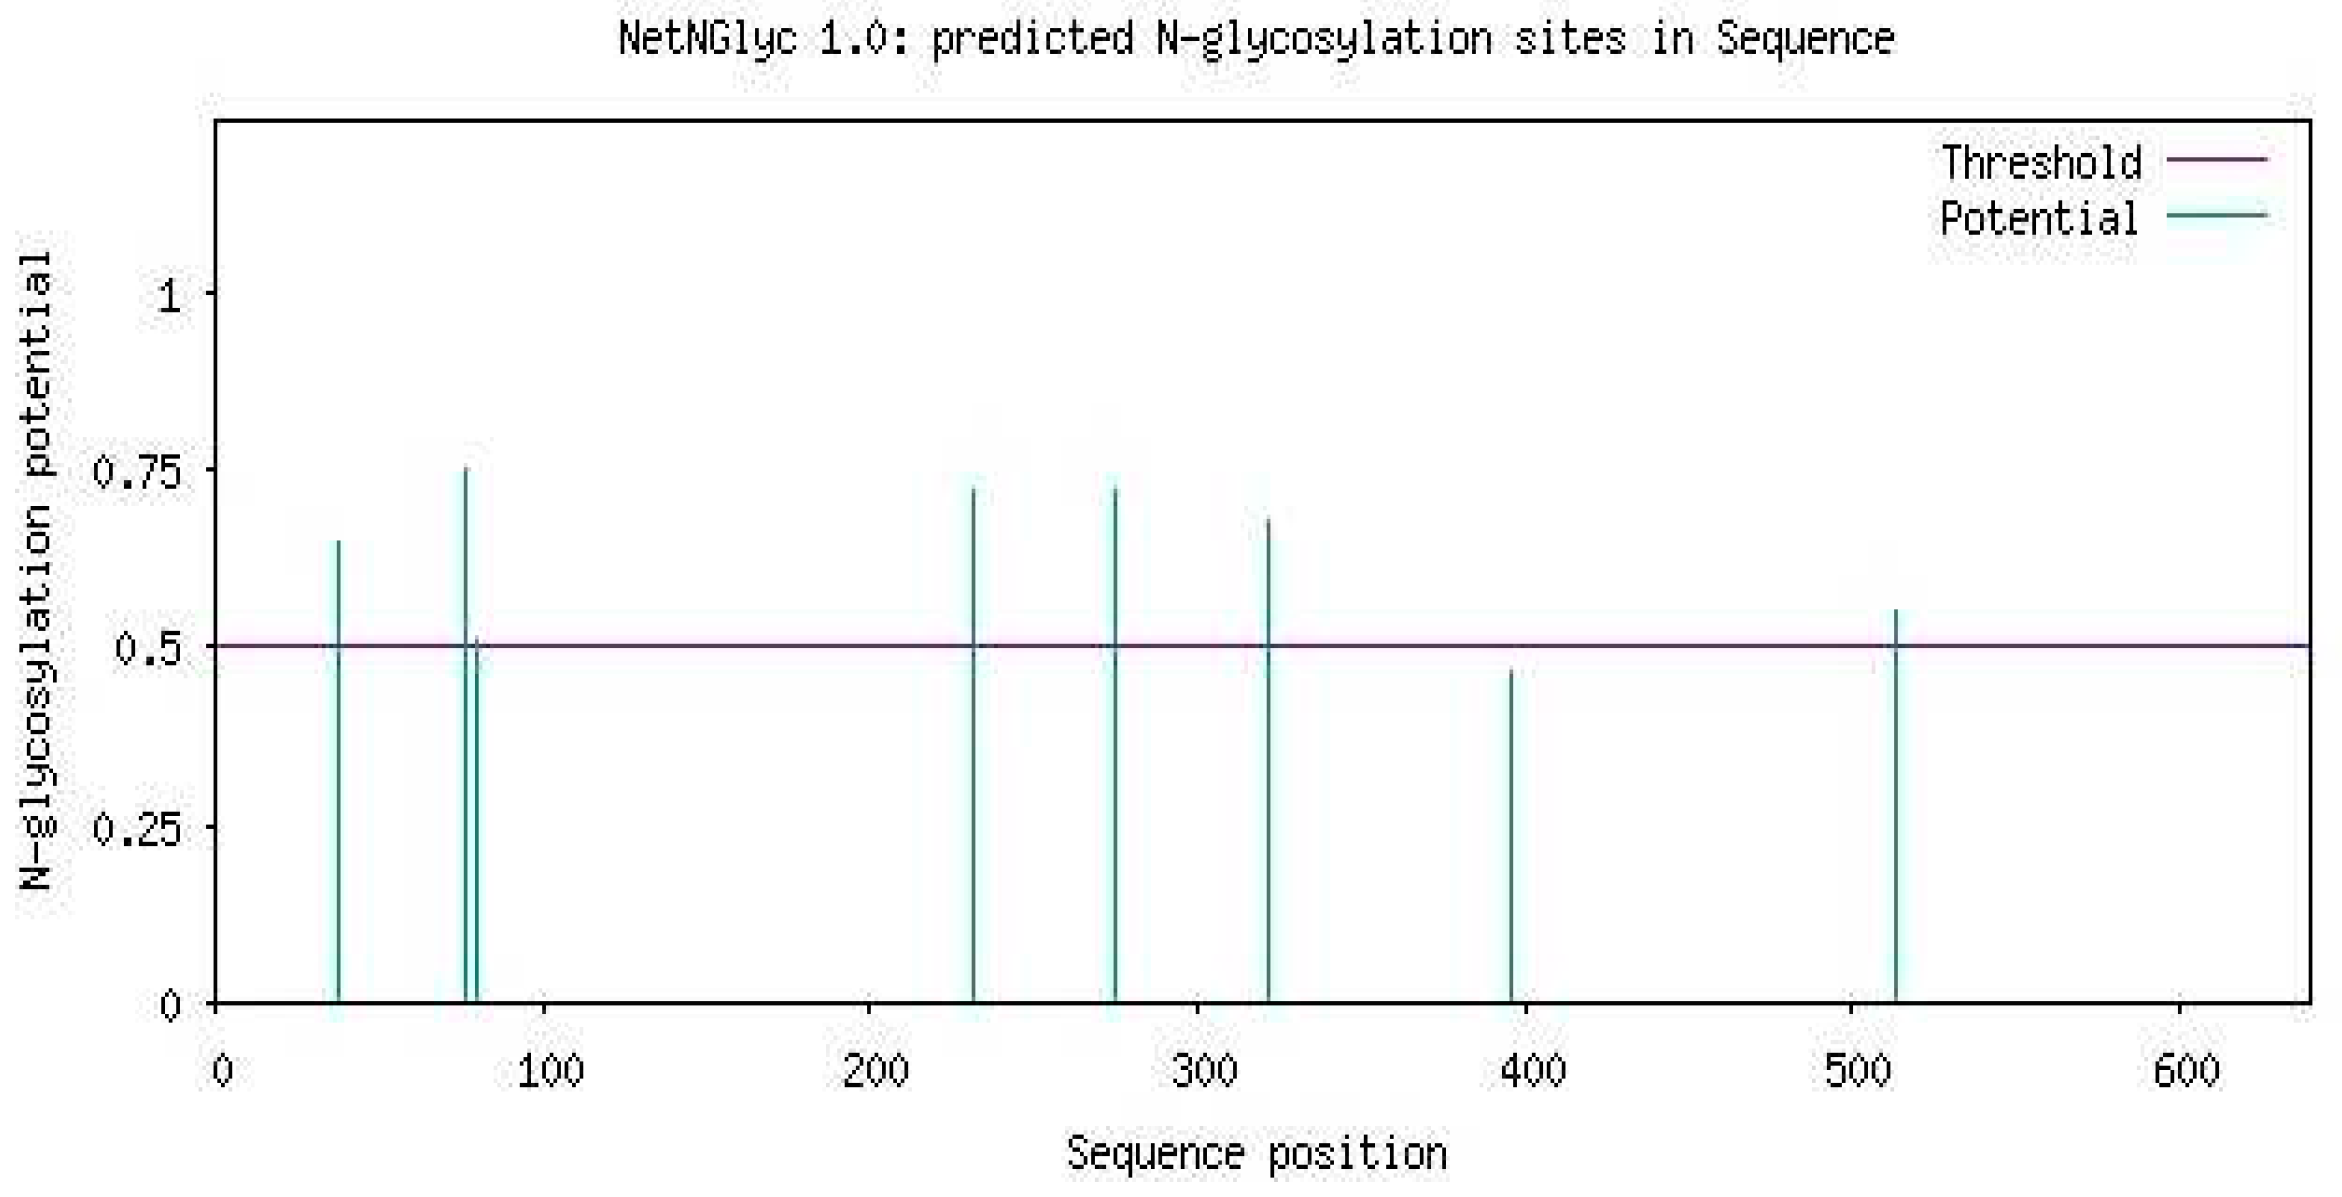
- Post-translational modifications using ScanProsite:
| Amino acid position | Glycosylation | Phosphorylation |
|---|---|---|
| 38 | N-linked glycosylation at asparagine | |
| 40 | -- | Phospho-threonine |
| 42 | -- | Phospho-threonine |
| 51 | -- | Phospho-threonine |
| 62 | -- | Phospho-threonine |
| 76 | N-linked glycosylation at asparagine | -- |
| 80 | N-linked glycosylation at asparagine | -- |
| 107 | -- | Phospho-threonine |
| 179 | -- | Phospho-threonine |
| 232 | N-linked glycosylation at asparagine | |
| 237 | -- | Phospho-serine |
| 275 | N-linked glycosylation at asparagine | -- |
| 291 | -- | Phospho-serine |
| 296 | -- | Phospho-threonine |
| 301 | -- | Phospho-serine |
| 322 | N-linked glycosylation at asparagine | -- |
| 327 | -- | Phospho-serine |
| 394 | -- | Phospho-serine |
| 396 | N-linked glycosylation at asparagine | -- |
| 434 | -- | Phospho-serine |
| 457 | -- | Phospho-threonine |
| 489 | -- | Phospho-threonine |
| 513 | N-linked glycosylation at asparagine | -- |
| 573 | -- | Phospho-threonine |
| 591 | -- | Phospho-serine |
| 605 | -- | Phospho-threonine |
- VI.
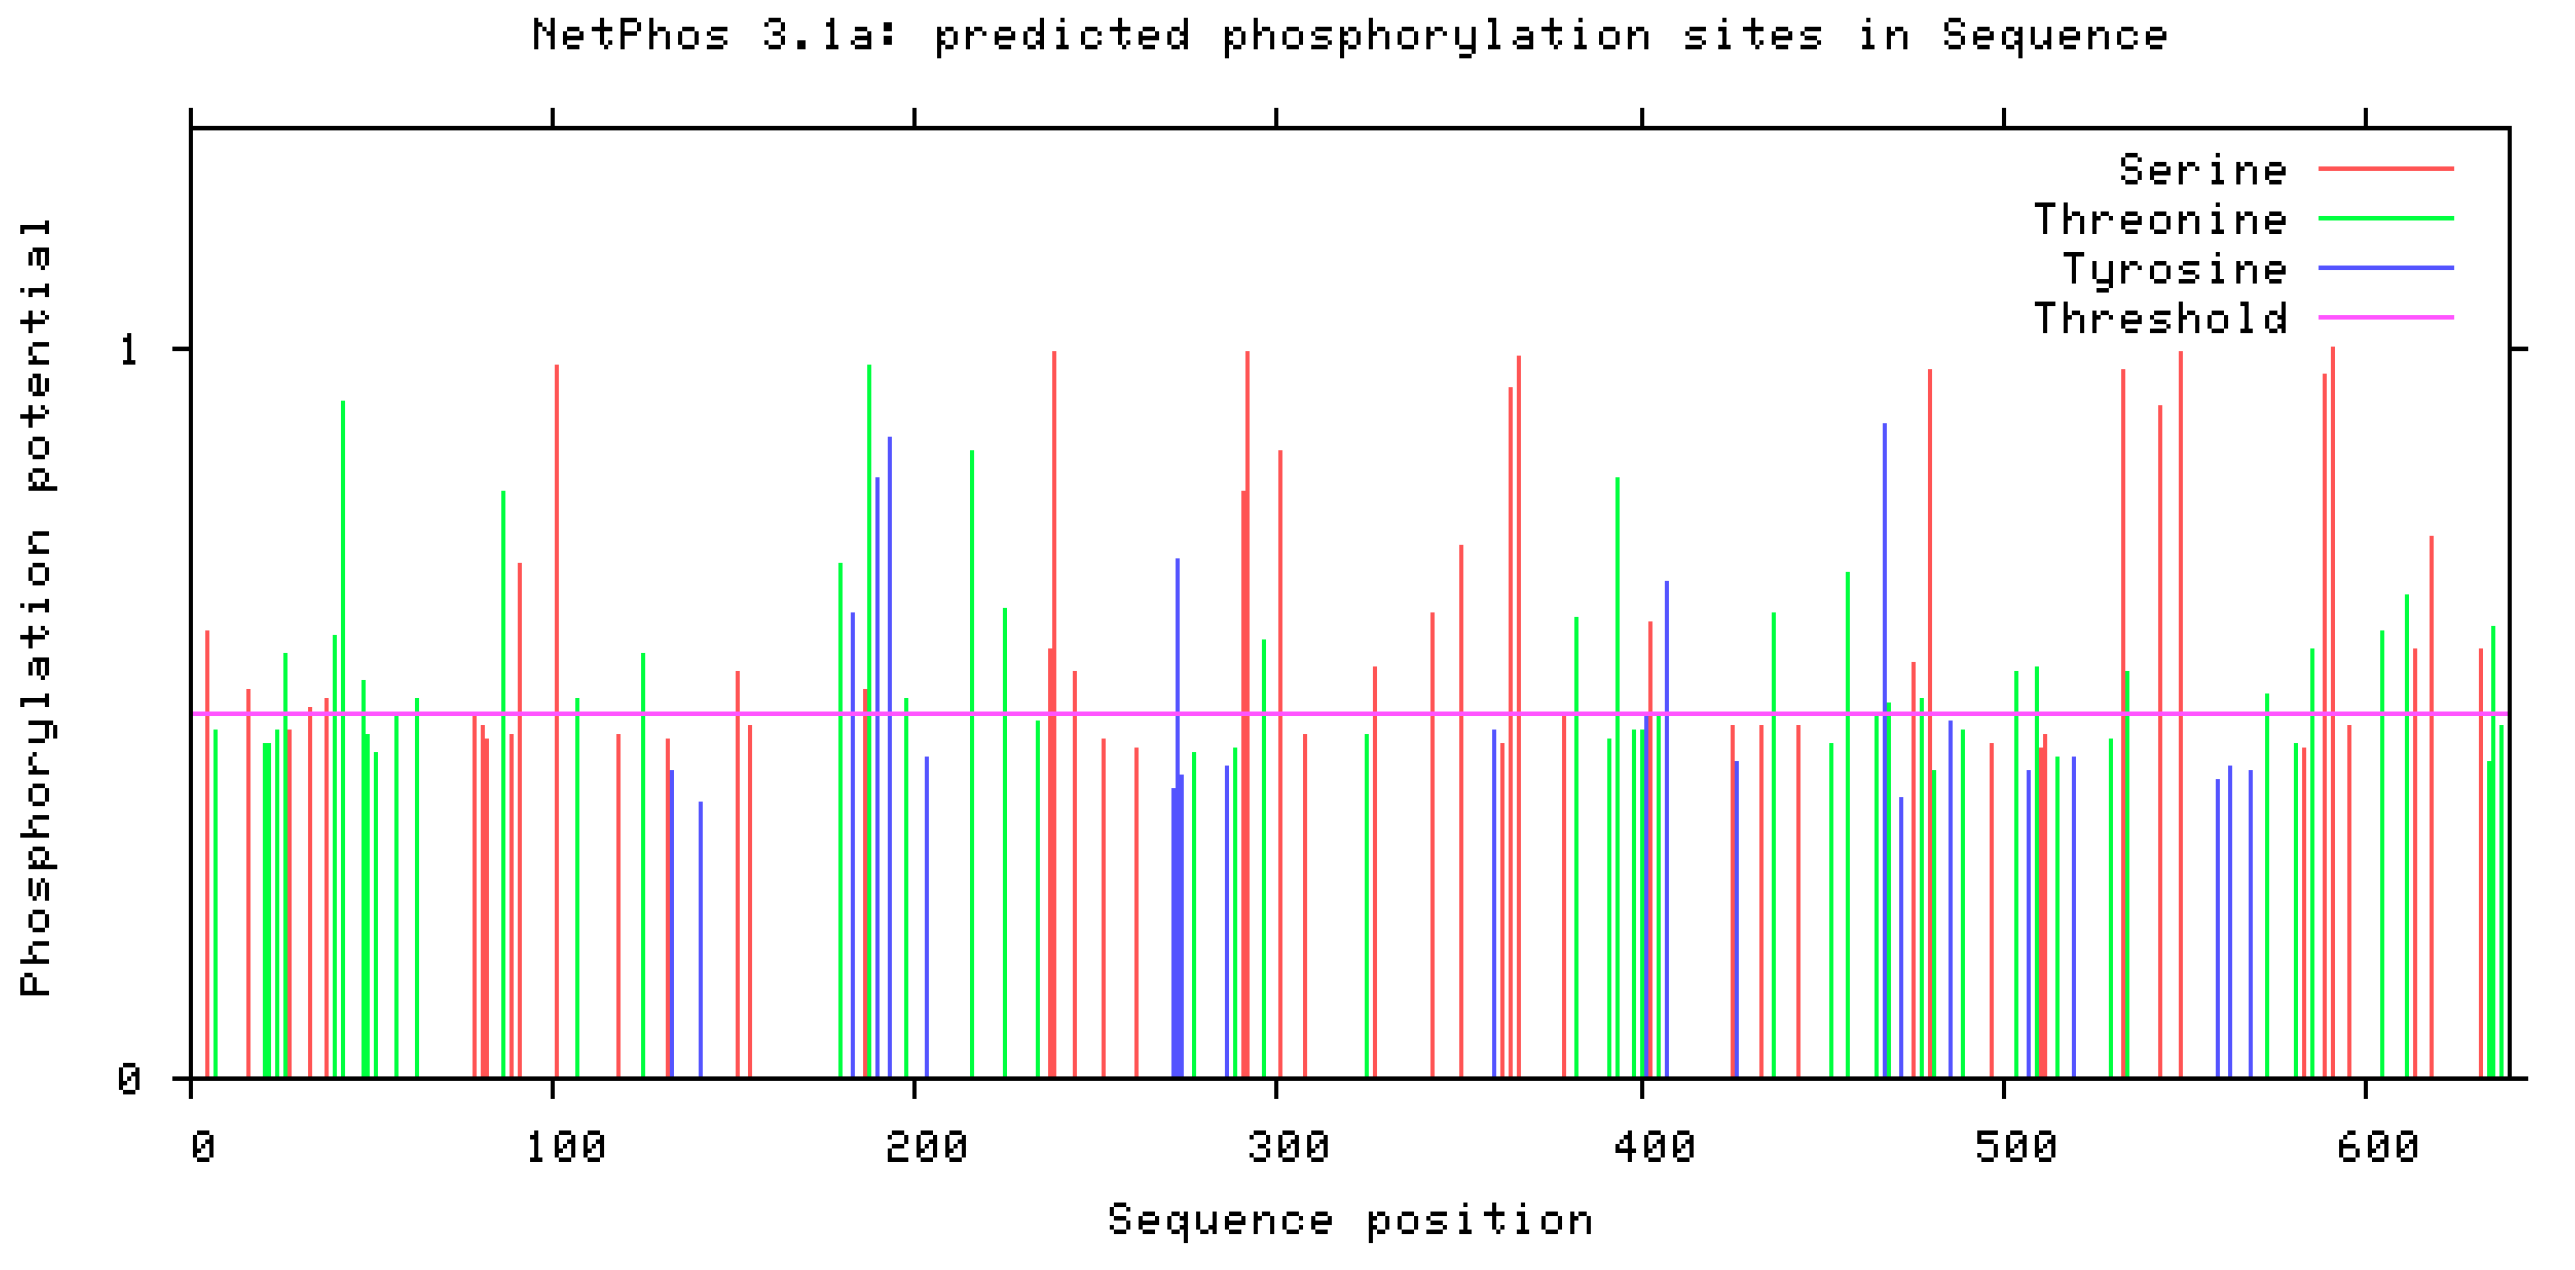
- Phosphorylation prediction using NetPhos 3.1:
- VII.
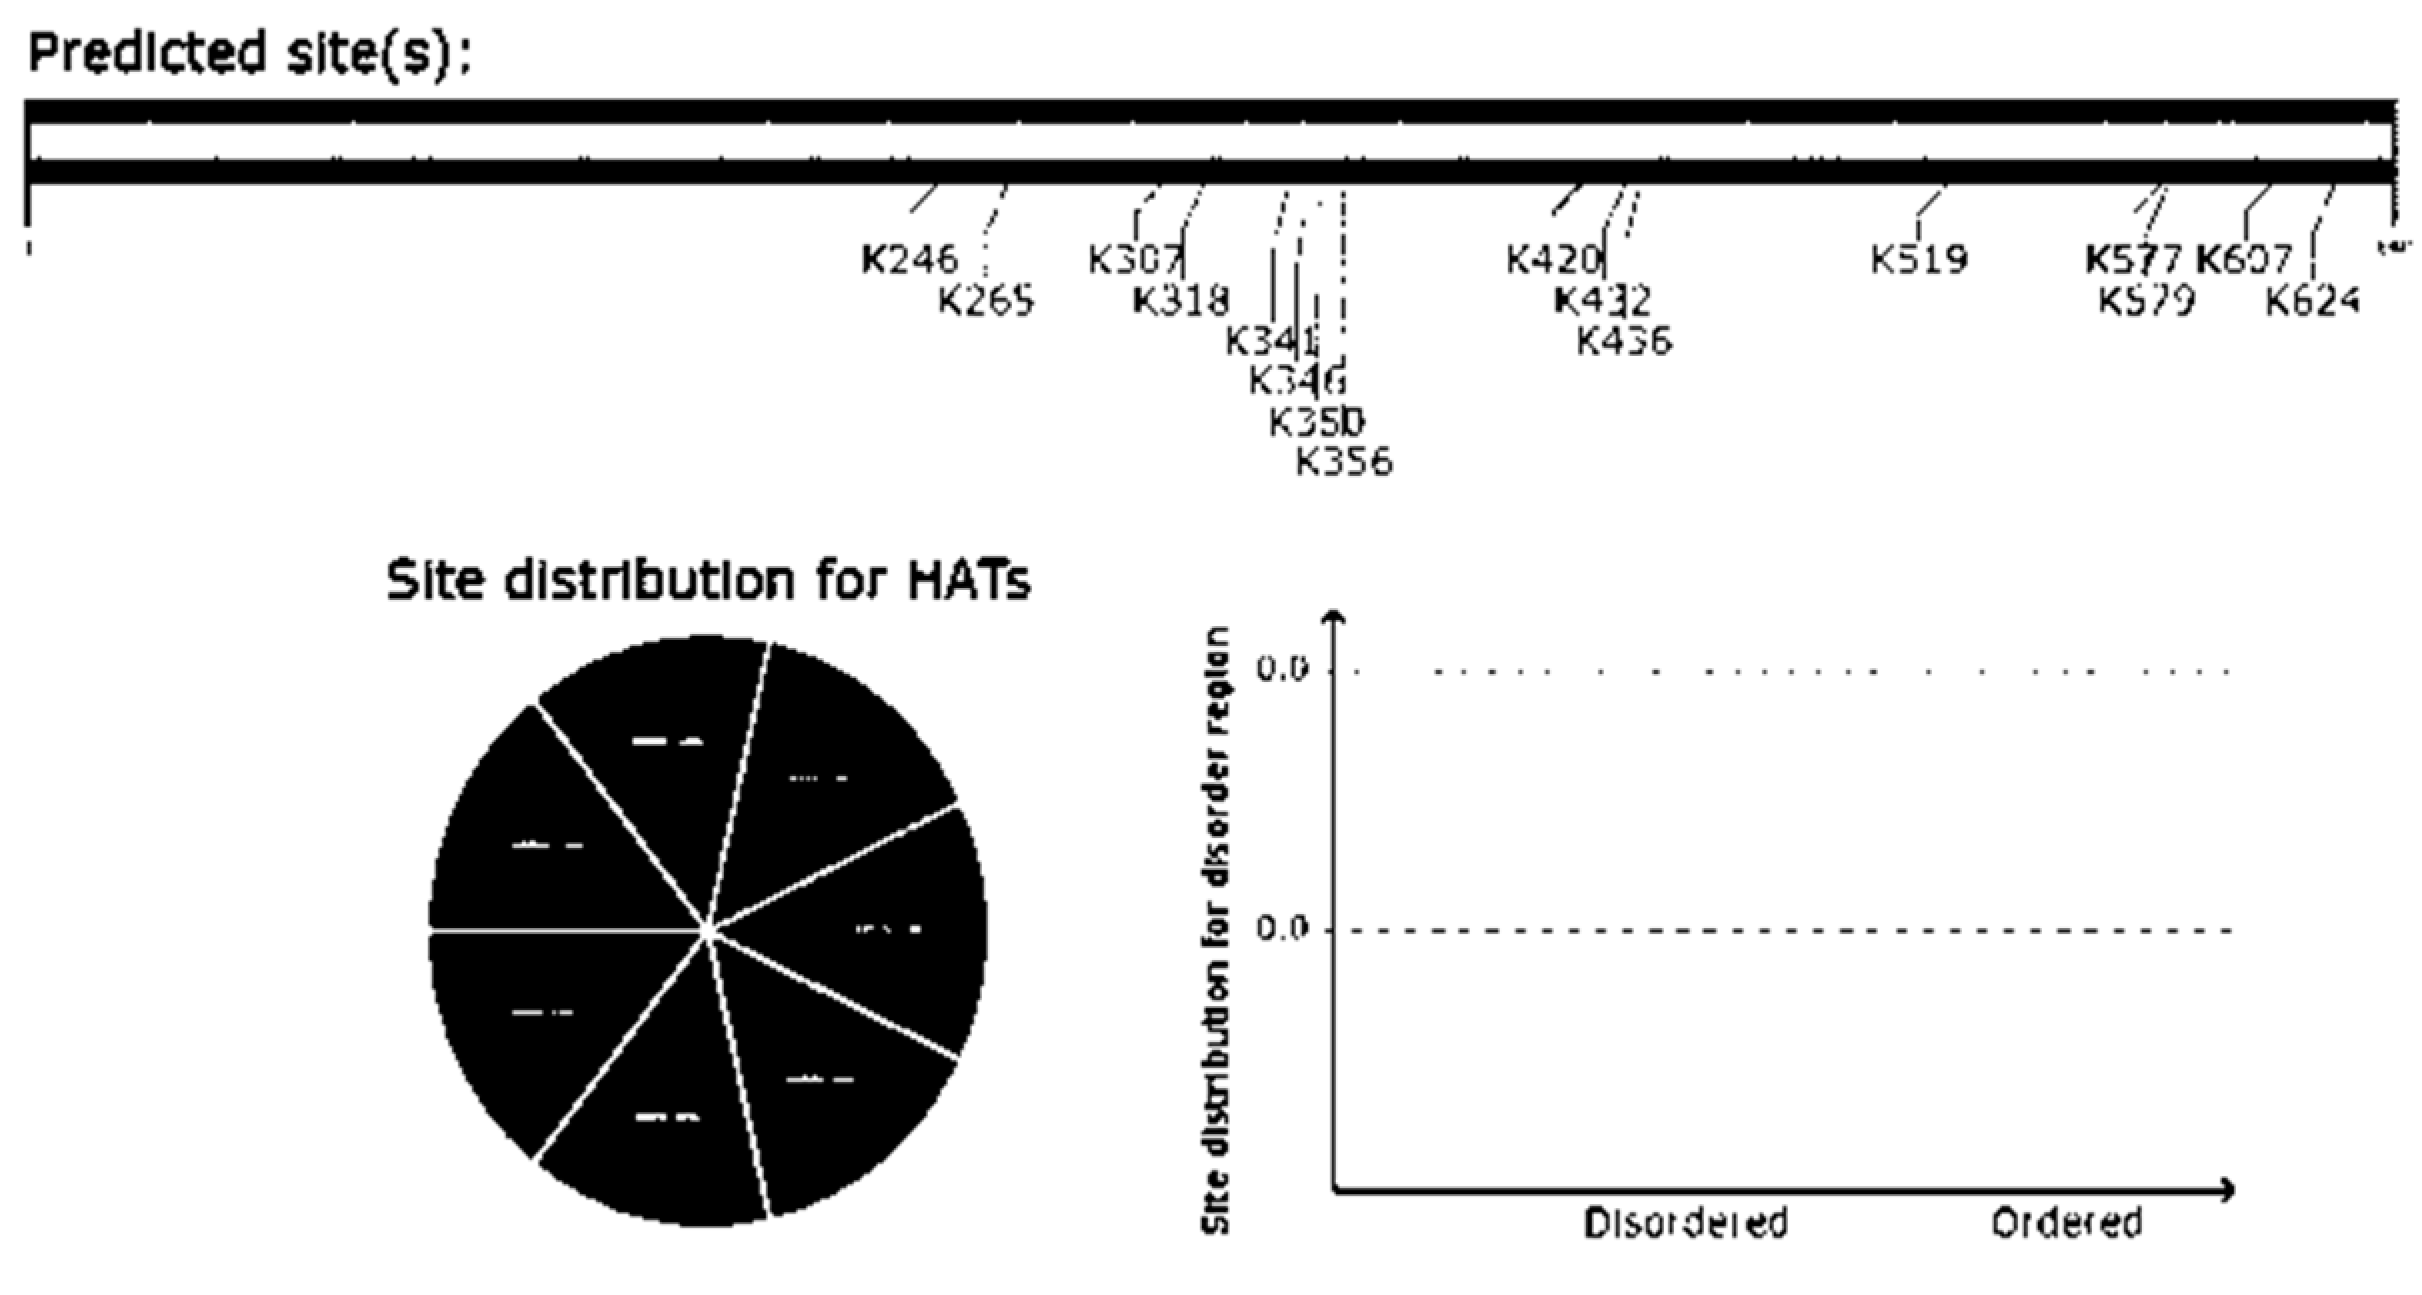
- Acetylation prediction using GPS PAIL 2.0:
- VIII.
- Glycosylation prediction of Uromodulin using NetOGlyc-4.0:
- IX.
- Methylation prediction of Uromodulin using PRmePRed:
| Position | Peptide | Prediction score |
|---|---|---|
| 99 | FSCVCPEGFRLSPGLGCTD | 0.692402 |
| 142 | YLCVCPAGYRGDGWHCECS | 0.785598 |
| 200 | EGYACDTDLRGWYRFVGQG | 0.780858 |
| 204 | CDTDLRGWYRFVGQGGARM | 0.823455 |
| 212 | YRFVGQGGARMAETCVPVL | 0.788485 |
| 245 | PSSDEGIVSRKCAHWSGH | 0.556259 |
| 365 | KVFMYLSDSRCSGFNDRDN | 0.543877 |
| 385 | DWVSVVTPARDGPCGTVLT | 0.708181 |
| 449 | QPMVSALNIRVGGTGMFTV | 0.763262 |
| 459 | VGGTGMFTVRMALFQTPSY | 0.515069 |
| 498 | TMLDGGDLSRFALLMTNCY | 0.602271 |
| 547 | VENGESSQGRFSVQMFRFA | 0.932742 |
| 586 | KCKPTCSGTRFRSGSVIDQ | 0.766291 |
| 588 | KPTCSGTRFRSGSVIDQSR | 0.817883 |
| 597 | RSGSVIDQSRVLNLGPITR | 0.676464 |
| 606 | RVLNLGPITRKGVQATVSR | 0.831847 |
| 615 | RKGVQATVSRAFSSLGLLK | 0.729294 |
- X.
- Prediction of 3D structure using PDB RCSB:

- XI.
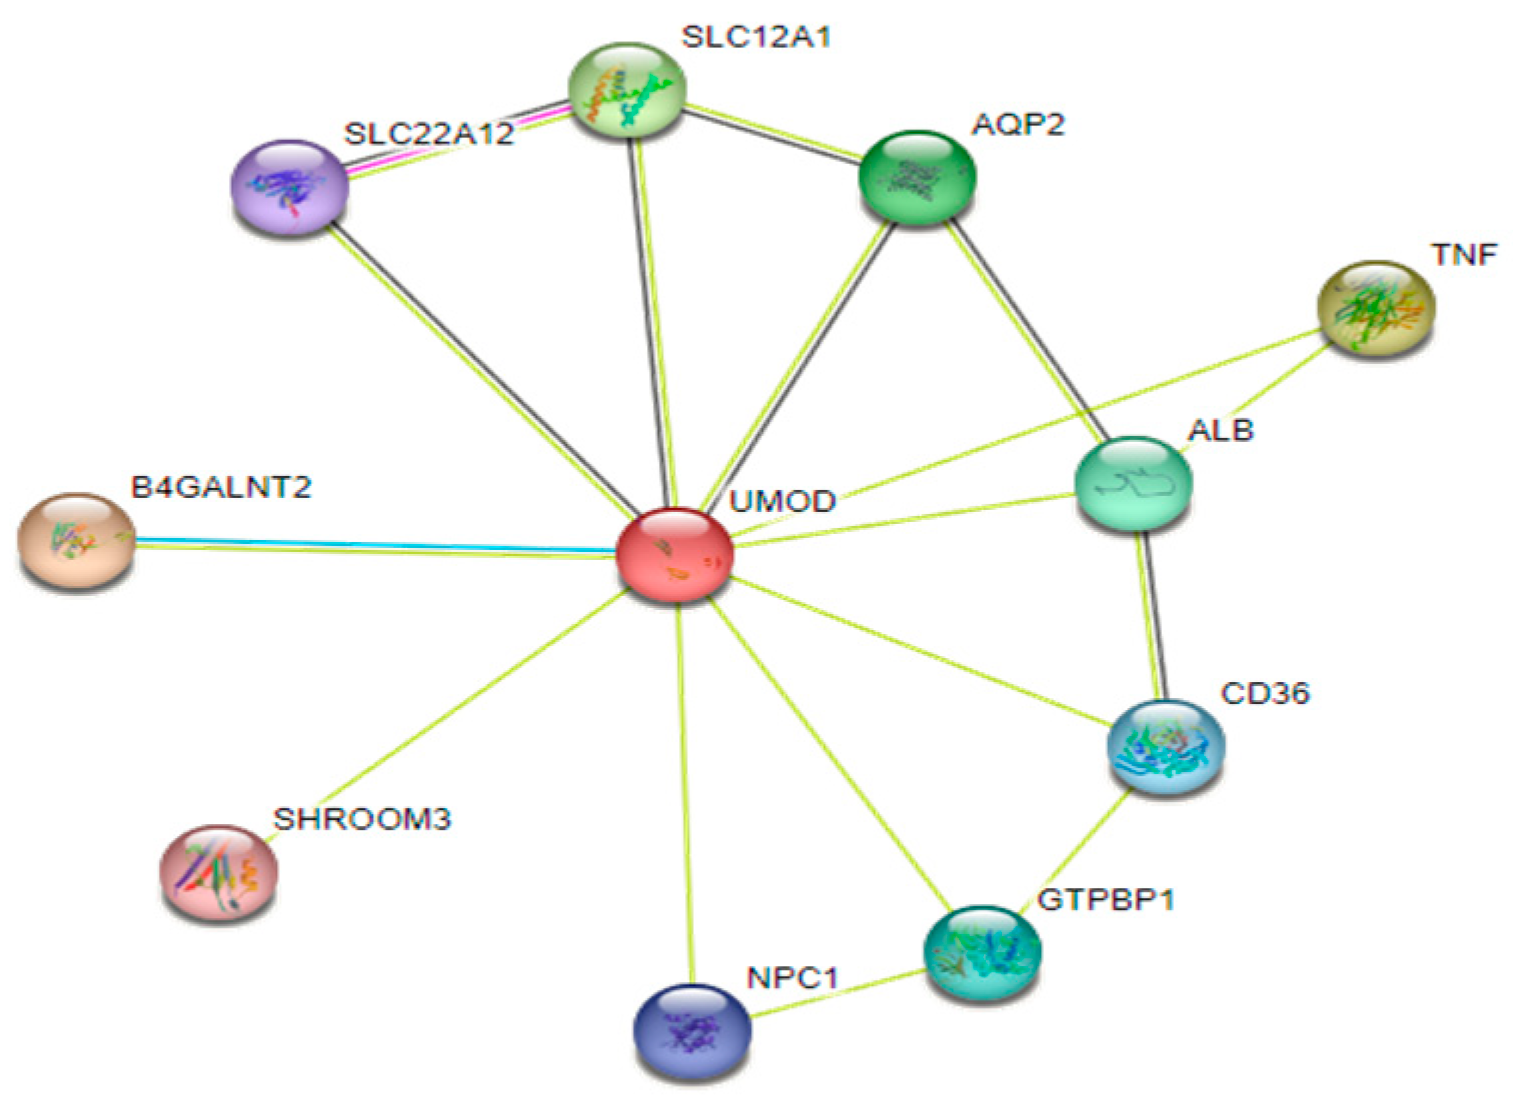
- Prediction of Uromodulin interaction networks using STRING database:
Discussion:
Conclusion:
Supplementary Materials
Acknowledgements
Conflicts of Interest
Ethical statement
References
- Chen, T.K.; Knicely, D.H.; Grams, M.E. Chronic kidney disease diagnosis and management: A review. JAMA 2019, 322, 1294–1304. [Google Scholar] [CrossRef]
- Levin, A.; Tonelli, M.; Bonventre, J.; Coresh, J.; Donner, J.-A.; Fogo, A.B.; et al. Global kidney health 2017 and beyond: A roadmap for closing gaps in care, research, and policy. The Lancet 2017, 390, 1888–1917. [Google Scholar] [CrossRef] [PubMed]
- Alam, A.; Amanullah, F.; Baig-Ansari, N.; Lotia-Farrukh, I.; Khan, F.S. Prevalence and risk factors of kidney disease in urban Karachi: Baseline findings from a community cohort study. BMC research notes 2014, 7, 1–11. [Google Scholar] [CrossRef] [PubMed]
- Jessani, S.; Bux, R.; Jafar, T.H. Prevalence, determinants, and management of chronic kidney disease in Karachi, Pakistan-a community based cross-sectional study. BMC nephrology 2014, 15, 1–9. [Google Scholar] [CrossRef]
- Trudu, M.; Janas, S.; Lanzani, C.; Debaix, H.; Schaeffer, C.; Ikehata, M.; et al. Common noncoding UMOD gene variants induce salt-sensitive hypertension and kidney damage by increasing Uromodulin expression. Nature medicine 2013, 19, 1655–1660. [Google Scholar] [CrossRef]
- Devuyst, O.; Pattaro, C. The UMOD locus: Insights into the pathogenesis and prognosis of kidney disease. Journal of the American Society of Nephrology 2018, 29, 713–726. [Google Scholar] [CrossRef] [PubMed]
- Devuyst, O.; Olinger, E.; Rampoldi, L. Uromodulin: From physiology to rare and complex kidney disorders. Nature Reviews Nephrology 2017, 13, 525–544. [Google Scholar] [CrossRef]
- Brunati, M.; Perucca, S.; Han, L.; Cattaneo, A.; Consolato, F.; Andolfo, A.; et al. The serine protease hepsin mediates urinary secretion and polymerisation of Zona Pellucida domain protein Uromodulin. Elife 2015, 4, e08887. [Google Scholar] [CrossRef]
- Bokhove, M.; Nishimura, K.; Brunati, M.; Han, L.; De Sanctis, D.; Rampoldi, L.; et al. A structured interdomain linker directs self-polymerization of human Uromodulin. Proceedings of the National Academy of Sciences 2016, 113, 1552–1557. [Google Scholar] [CrossRef]
- Jovine, L.; Qi, H.; Williams, Z.; Litscher, E.; Wassarman, P.M. The ZP domain is a conserved module for polymerization of extracellular proteins. Nature cell biology 2002, 4, 457–461. [Google Scholar] [CrossRef]
- Sveinbjornsson, G.; Mikaelsdottir, E.; Palsson, R.; Indridason, O.S.; Holm, H.; Jonasdottir, A.; et al. Rare mutations associating with serum creatinine and chronic kidney disease. Human molecular genetics 2014, 23, 6935–6943. [Google Scholar] [CrossRef] [PubMed]
- Bernascone, I.; Vavassori, S.; Di Pentima, A.; Santambrogio, S.; Lamorte, G.; Amoroso, A.; et al. Defective intracellular trafficking of Uromodulin mutant isoforms. Traffic 2006, 7, 1567–1579. [Google Scholar] [CrossRef] [PubMed]
- Smith, G.D.; Robinson, C.; Stewart, A.P.; Edwards, E.L.; Karet, H.I.; Norden, A.G.; et al. Characterization of a recurrent in-frame UMOD indel mutation causing late-onset autosomal dominant end-stage renal failure. Clinical Journal of the American Society of Nephrology 2011, 6, 2766–2774. [Google Scholar] [CrossRef] [PubMed]
- Garibotto, G.; Tessari, P.; Robaudo, C.; Zanetti, M.; Saffioti, S.; Vettore, M.; et al. Protein turnover in the kidney and the whole body in humans. Mineral and electrolyte metabolism 1997, 23, 185–188. [Google Scholar] [PubMed]
- Lee, J.W.; Chou, C.-L.; Knepper, M.A. Deep sequencing in microdissected renal tubules identifies nephron segment–specific transcriptomes. Journal of the American Society of Nephrology 2015, 26, 2669–2677. [Google Scholar] [CrossRef]
- Uhlén, M.; Fagerberg, L.; Hallström, B.M.; Lindskog, C.; Oksvold, P.; Mardinoglu, A.; et al. Proteomics. Tissue-based map of the human proteome. Science 2015, 347, 1260419. [Google Scholar]
- Scherberich, J.E.; Gruber, R.; Nockher, W.A.; Christensen, E.I.; Schmitt, H.; Herbst, V.; et al. Serum Uromodulin—A marker of kidney function and renal parenchymal integrity. Nephrology Dialysis Transplantation 2018, 33, 284–295. [Google Scholar] [CrossRef]
- Kidd, K.; Vylet’al, P.; Schaeffer, C.; Olinger, E.; Živná, M.; Hodaňová, K.; et al. Genetic and clinical predictors of age of ESKD in individuals with autosomal dominant tubulointerstitial kidney disease due to UMOD mutations. Kidney international reports 2020, 5, 1472–1485. [Google Scholar] [CrossRef]
- Utami, S.B.; Mahati, E.; Li, P.; Maharani, N.; Ikeda, N.; Bahrudin, U.; et al. Apoptosis induced by an Uromodulin mutant C112Y and its suppression by topiroxostat. Clinical and experimental nephrology 2015, 19, 576–584. [Google Scholar] [CrossRef]
- Williams, S.E.; Reed, A.A.; Galvanovskis, J.; Antignac, C.; Goodship, T.; Karet, F.E.; et al. Uromodulin mutations causing familial juvenile hyperuricaemic nephropathy lead to protein maturation defects and retention in the endoplasmic reticulum. Human molecular genetics 2009, 18, 2963–2974. [Google Scholar] [CrossRef]
- Lin, Z.; Yang, J.; Liu, H.; Cai, D.; An, Z.; Yu, Y.; et al. A novel Uromodulin mutation in autosomal dominant tubulointerstitial kidney disease: A pedigree-based study and literature review. Renal Failure 2018, 40, 146–151. [Google Scholar] [CrossRef] [PubMed]
- Kumar, V.; Yadav, A.K.; Kumar, V.; Bhansali, A.; Jha, V. Uromodulin rs4293393 T> C variation is associated with kidney disease in patients with type 2 diabetes. The Indian Journal of Medical Research 2017, 146 Suppl. 2, S15. [Google Scholar]
- Wang, J.; Liu, L.; He, K.; Gao, B.; Wang, F.; Zhao, M.; et al. UMOD Polymorphisms Associated with Kidney Function, Serum Uromodulin and Risk of Mortality among Patients with Chronic Kidney Disease, Results from the C-STRIDE Study. Genes 2021, 12, 1687. [Google Scholar] [CrossRef] [PubMed]
- Devuyst, O.; Bochud, M.; Olinger, E. UMOD and the architecture of kidney disease. Pflügers Archiv-European Journal of Physiology 2022, 1–11. [Google Scholar] [CrossRef] [PubMed]
- Al-khalidi, R.A.A.; Alwan, I.A.; Razaaq, H.A.A. The extent of UMOD gene polymorphism and its level in type 2 diabetes patients. Annals of Tropical Medicine and Public Health 2020, 23, 231–803. [Google Scholar] [CrossRef]




| Primers ARMS/IC | 5′-3′ Sequence | Tm (°C) | Length (bases) | GC s % | Product size (bp) |
|---|---|---|---|---|---|
| Forward common | TGGGAAAGCAGTGCCAAGGT | 60.5 | 20 | 55 | 282 |
| Reverse normal | GGGTCAGGTCCAGTGATTTCT | 61.2 | 21 | 52 | |
| Reverse mutant | GGTCAGGTCCAGTGATTTCC | 60.5 | 20 | 55 | |
| Forward IC | TAACCCACAGCCTCCTACAC | 60.5 | 20 | 55 | 618 |
| Reverse IC | GGTCAGGTCCAGTGATTTCC | 60.5 | 20 | 55 |
| # of samples | Chr. position | cDNA variant NM_003361.4 | Protein variant NP_003352.2 | Genotypic information | Alternative allele frequency | p-value (OR) | |||
|---|---|---|---|---|---|---|---|---|---|
| Homo-wild (AA/%) | Hetero (AG/%) | Homo-mutant (GG/%) | Cases | Controls | |||||
| 75 | 16:20353266 | r.1264T>C | p.= | 45/60 | 21/28 | 9/12 | 0.15 | 0.48 | 1.40 × 10-005 (0.2) |
| Variable | R-value |
|---|---|
| Urea/creatinine | .435 |
| Age/creatinine | -0.117 |
| Age/urea | .099 |
| Physicochemical properties | Parameters |
|---|---|
| Number of amino acids Theoretical PI | 640 aa 5.05 |
| Molecular weight | 69760.86 |
| (Asp + Glu) Negative charged residues | 69 |
| (Arg + Lys) Positive charged residues | 46 |
| Molecular formula | C3011H4654N832O952S63 |
| No. of atoms | 9512 |
| Extension coefficient | 101780 (considering that all pairs of cysteines are formed) 98780 (supposing that all pairs of cysteines are reduced) |
| Estimated half life | 30 hrs |
| Instability index | 40.53 |
| Aliphatic index | 70.69 |
| GRAVY | -0.111 |
| Pfam ID: | Position | Description | i-Evalue |
|---|---|---|---|
| Zona_pellucida | 335..583 | PF00100, Zona pellucida-like domain | 9.5e-52 |
| EGF_3 | 34..63 73..99 118..148 299..321 |
PF12947, EGF domain | 5.7e-08 1.4e-06 3.2e-10 0.88 |
| EGF_CA | 65..99 108..148 |
PF07645, Calcium-binding EGF domain | 1.5e-12 6.6e-10 |
| cEGF | 49..68 89..111 132..149 |
PF12662, Complement Clr-like EGF-like | 0.0001 8.1e-06 0.0071 |
| EGF | 34..59 75..99 115..144 |
PF00008, EGF-like domain | 0.021 0.00011 7.4e-06 |
| hEGF | 35..56 77..98 124..141 |
PF12661, Human growth factor-like EGF | 0.87 0.0084 9.9e-05 |
| FXa_inhibition | 76..102 120..143 |
PF14670, Coagulation Factor Xa inhibitory site | 0.0033 0.25 |
| EGF_MSP1_1 | 75..98 119..148 |
PF12946, MSP1 EGF domain 1 | 0.25 0.0053 |
Disclaimer/Publisher’s Note: The statements, opinions and data contained in all publications are solely those of the individual author(s) and contributor(s) and not of MDPI and/or the editor(s). MDPI and/or the editor(s) disclaim responsibility for any injury to people or property resulting from any ideas, methods, instructions or products referred to in the content. |
© 2023 by the authors. Licensee MDPI, Basel, Switzerland. This article is an open access article distributed under the terms and conditions of the Creative Commons Attribution (CC BY) license (http://creativecommons.org/licenses/by/4.0/).


