Submitted:
21 August 2023
Posted:
21 August 2023
You are already at the latest version
Abstract
Keywords:
1. Introduction
2. Materials and Methods
- DNA isolation
- PCR Amplification and SSR Markers
- Detection of PCR Amplicons
- Data Analysis
3. Results
3.1. Polymorphism Analysis of EST-SSR Markers
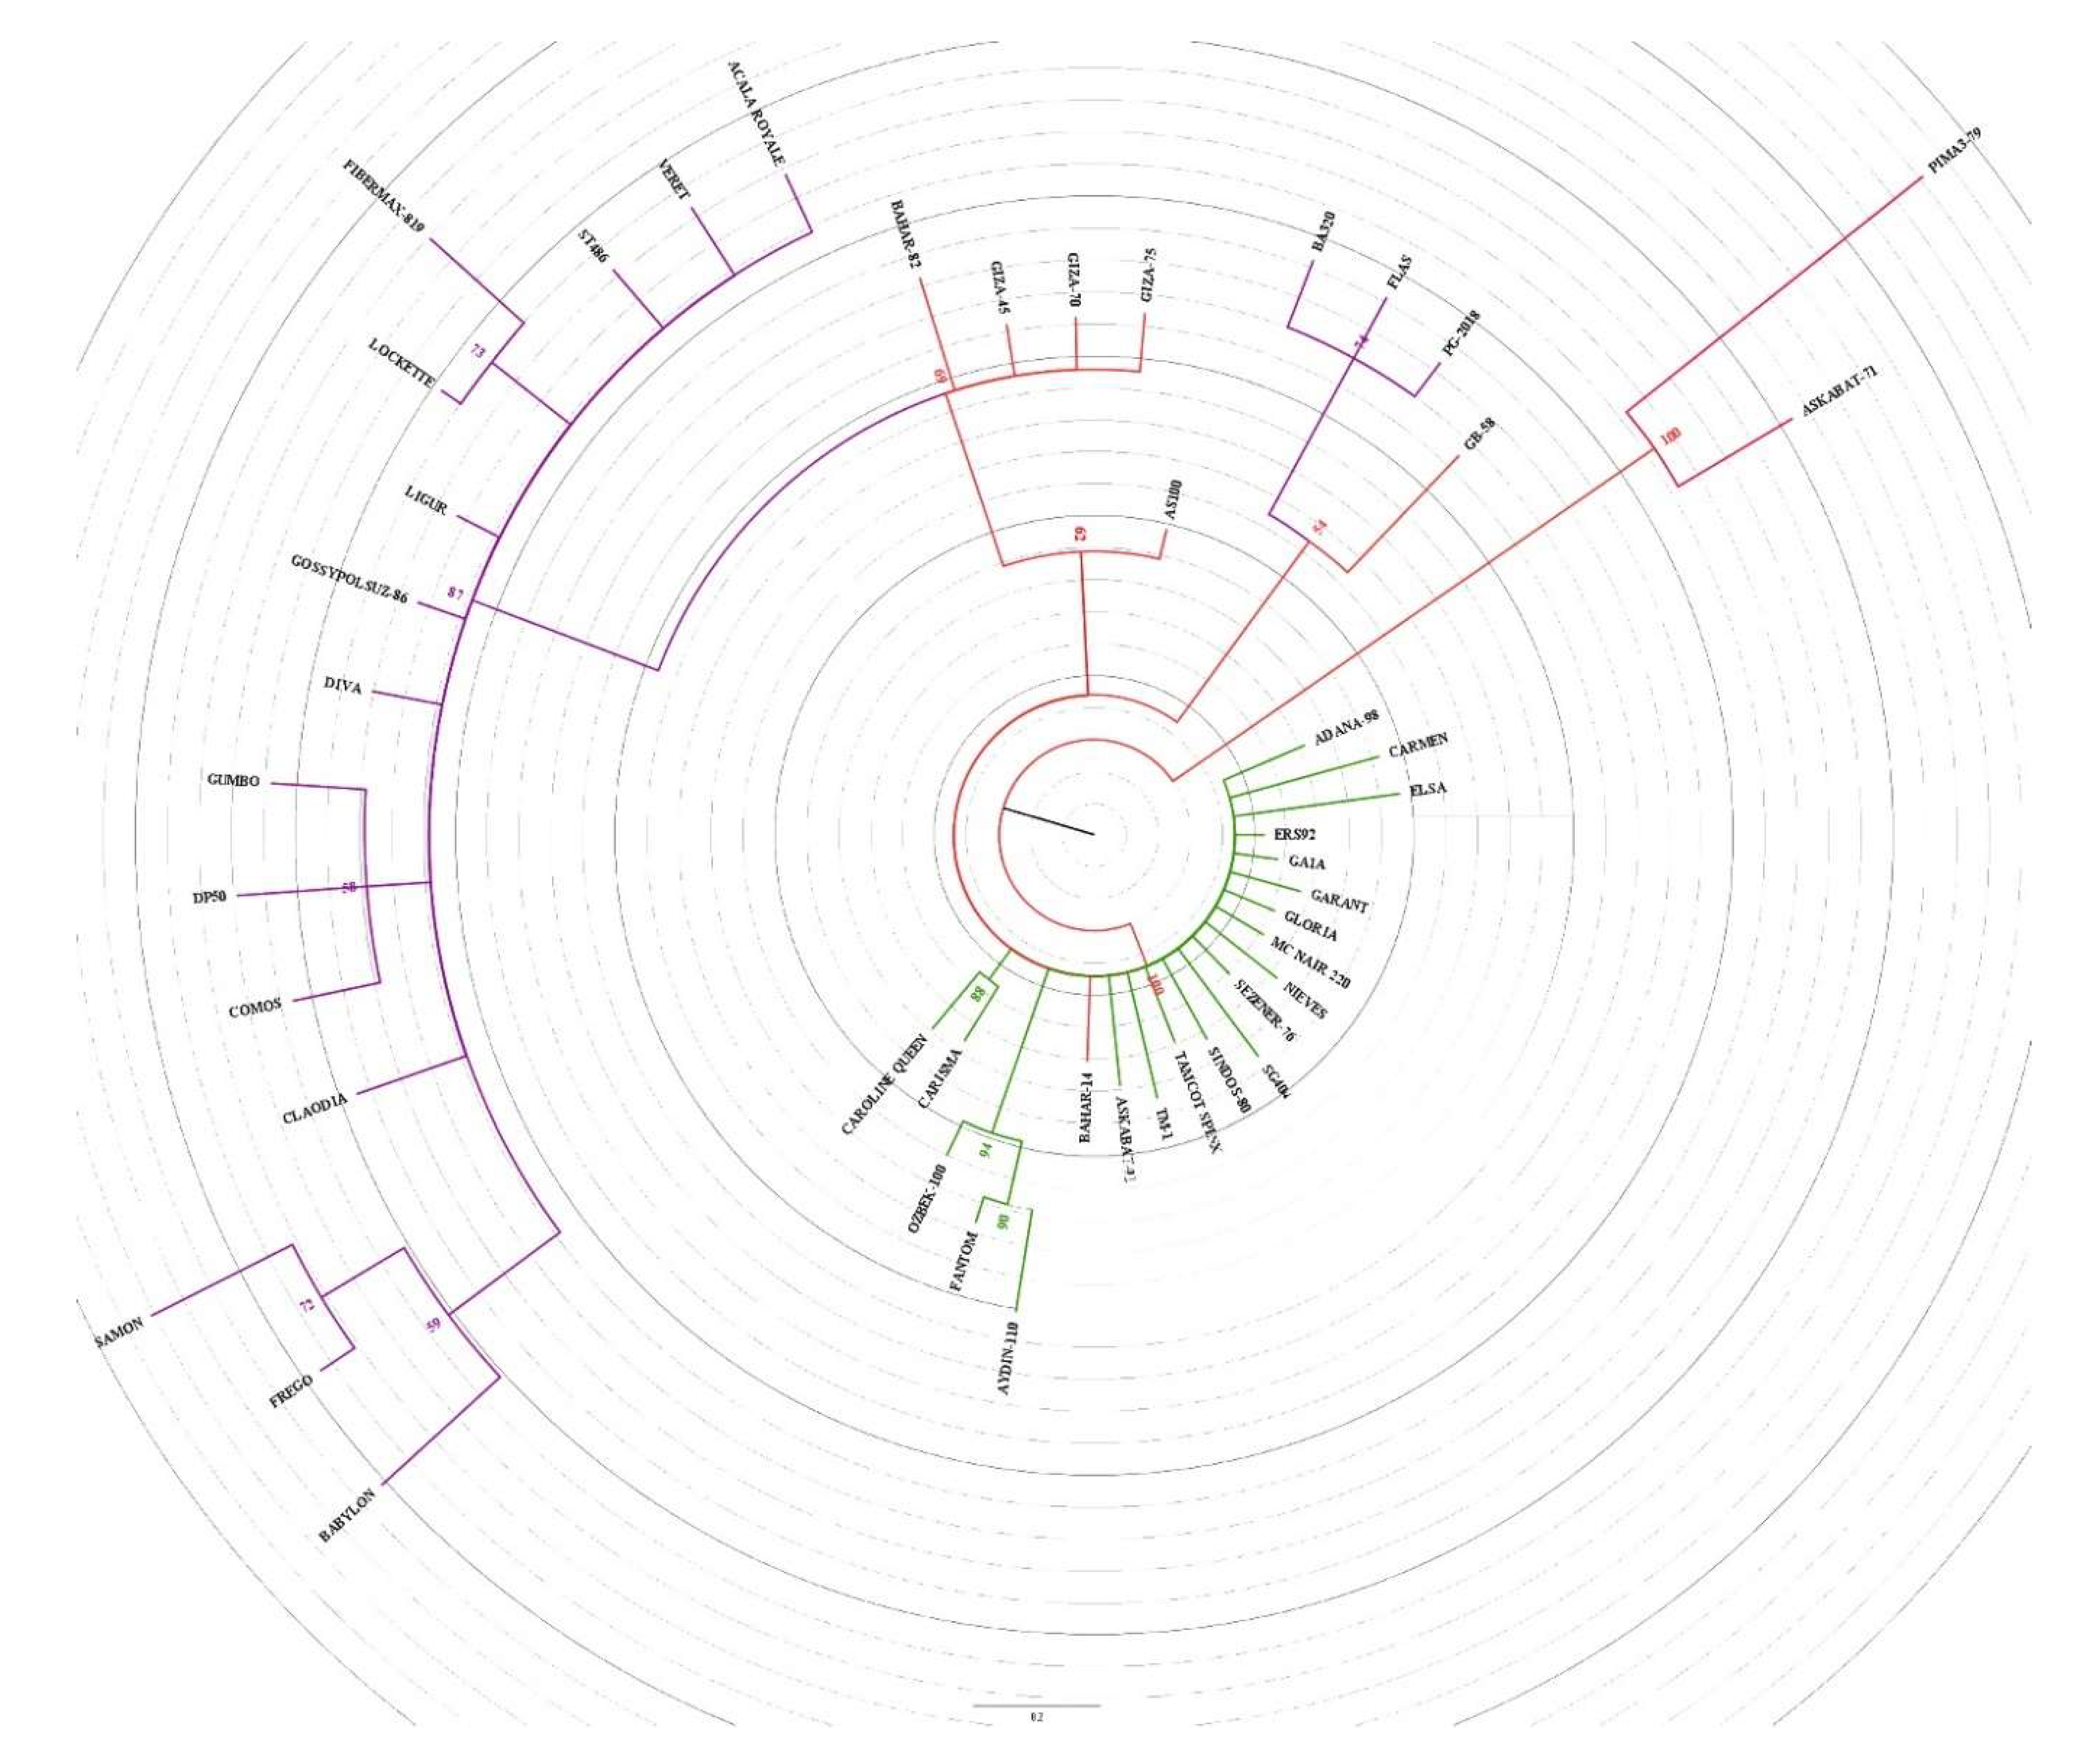
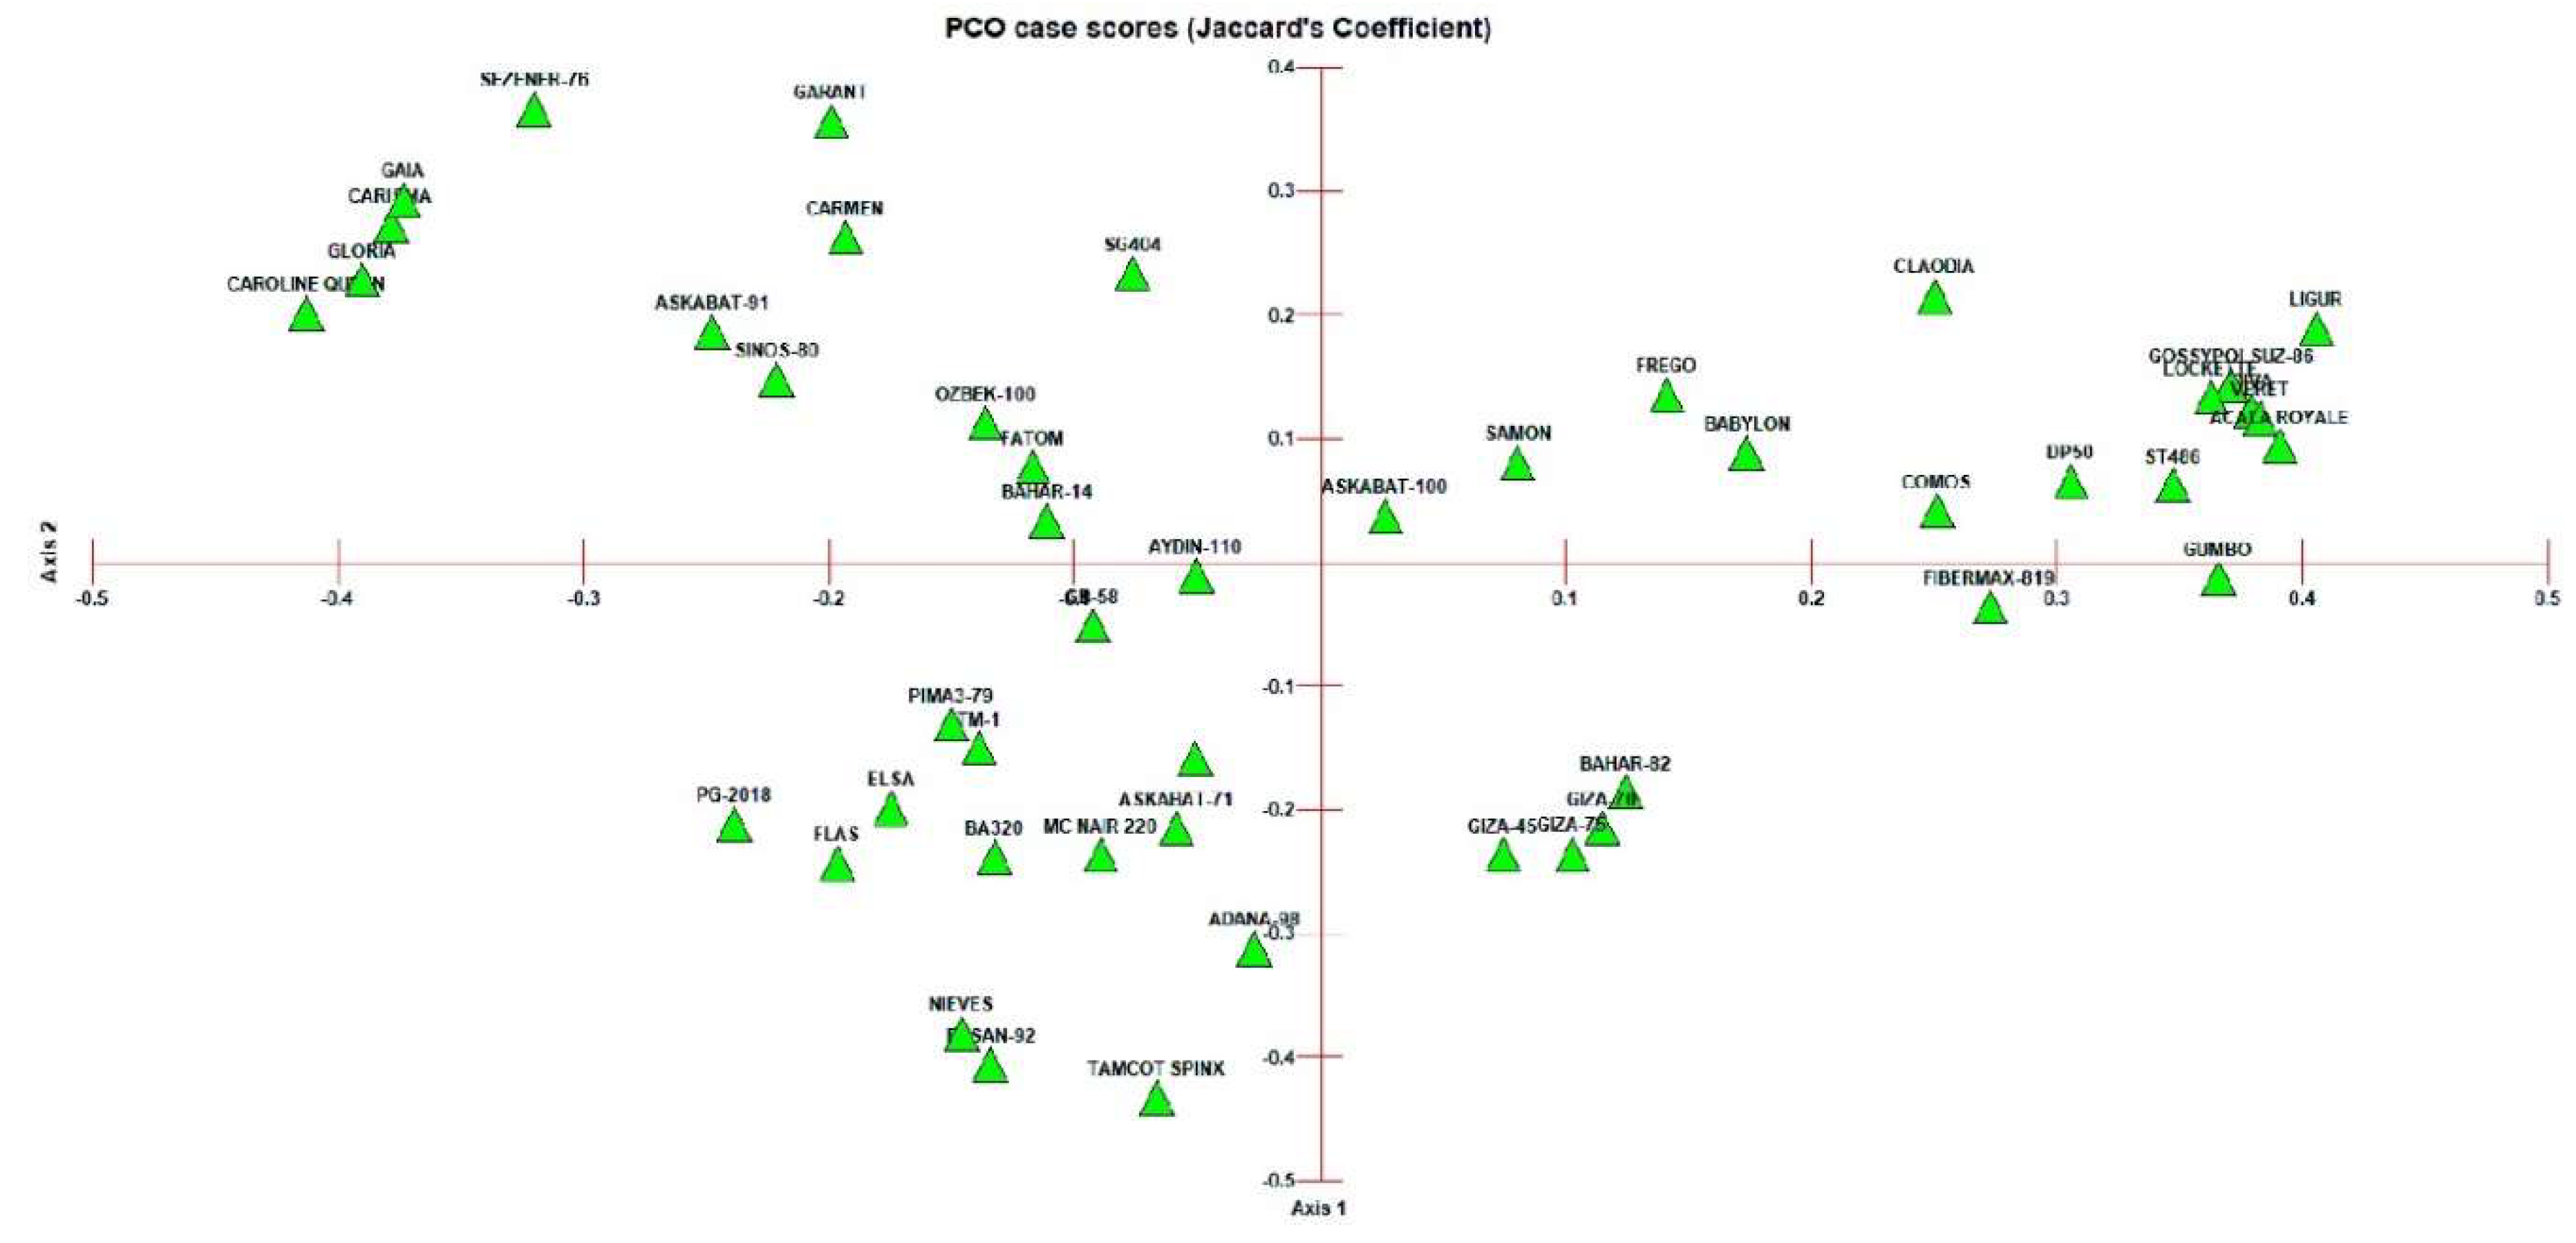
3.2. Clustering and PCoA Analysis
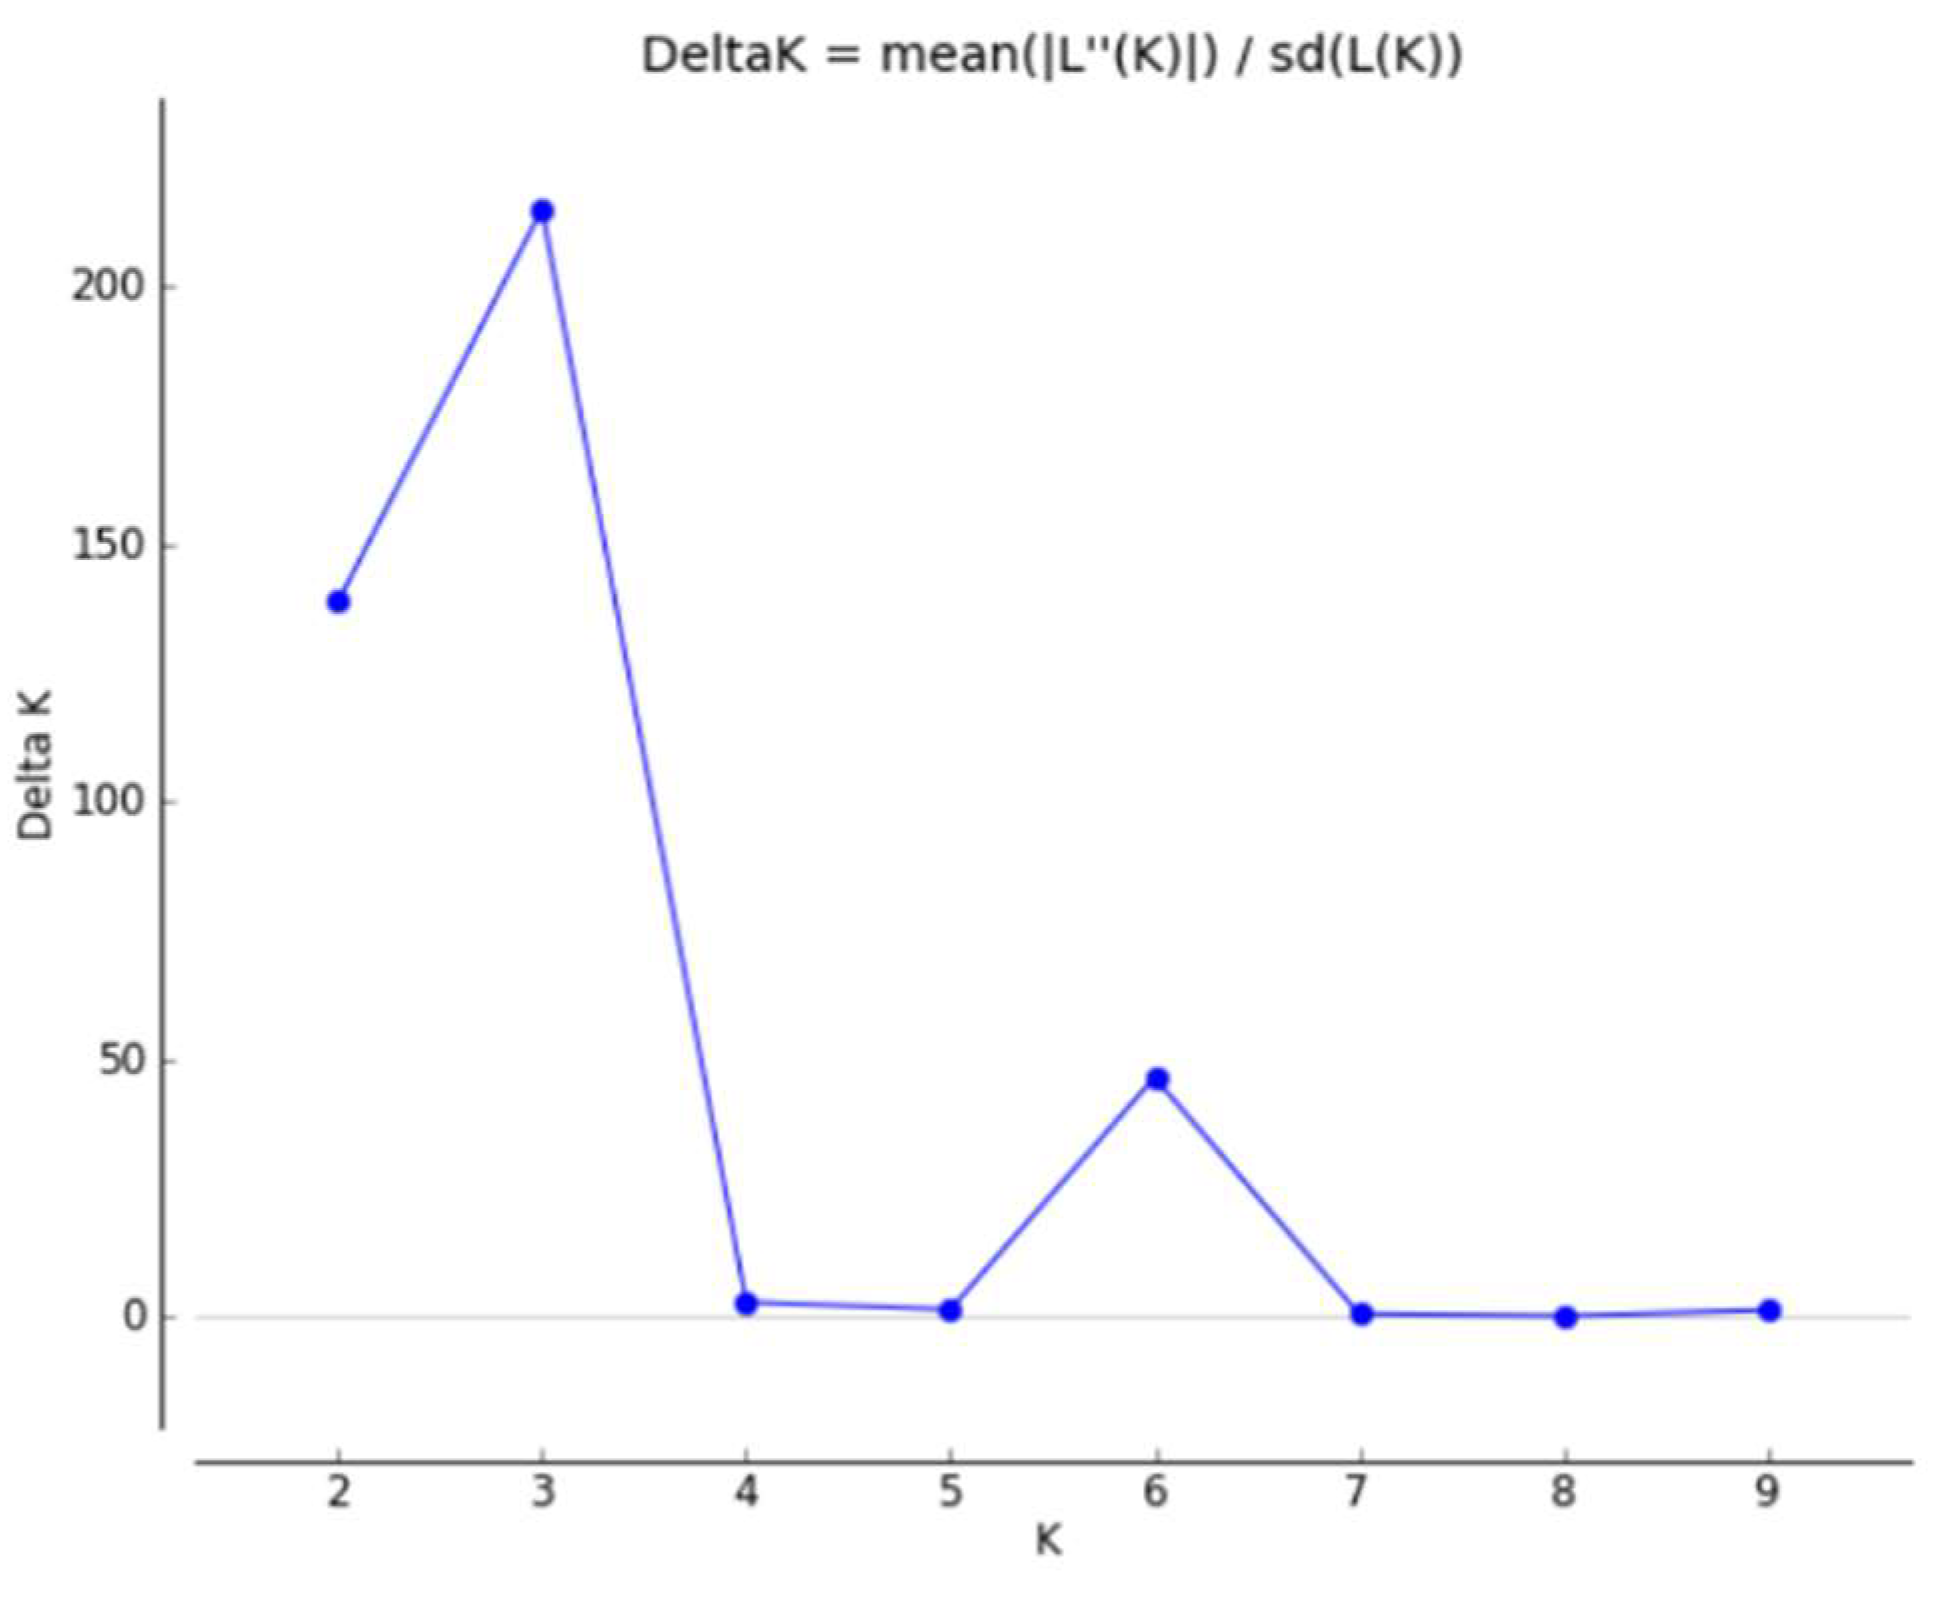
3.3. Population Structure Analysis
4. Discussion
- Effects of Molecular Markers on Population
- Cluster Analysis and Population Structure
5. Conclusions
References
- Wang, K., Wendel, J. F., & Hua, J. (2018). Designations for individual genomes and chromosomes in Gossypium. J. Cotton Res., 1(1), 1-5.
- Witt, T. W., Ulloa, M., Schwartz, R. C., & Ritchie, G. L. (2020). Response to deficit irrigation of morphological, yield and fiber quality traits of upland (Gossypium hirsutum L.) and Pima (G. barbadense L.) cotton in the Texas High Plains. Field Crops Res., 249, 107759.
- Karaca, M., & Ince, A. G. (2011). New non-redundant microsatellite and CAPS-microsatellite markers for cotton (Gossypium L.) Turk. J. Field Crops., 16(2), 172-178.
- Kumlay, A. M. , Eren, B. , Demirel, S. , Demirel, F. & Yıldırım, B. (2021). Reveal of Genetic Variation by iPBS Analysis in Some Cotton Varieties. Eur. j., eng. sci., tech., (21) , 67-73 . [CrossRef]
- Rashid, U., Anwar, F., & Knothe, G. (2009). Evaluation of biodiesel obtained from cottonseed oil. Fuel Process. Technol., 90(9), 1157-1163.
- Sekhar, S. C., & Rao, B. V. K. (2011). Cottonseed oil as health oil. Pertanika J. Trop. Agric. Sci, 34(1), 17-24.
- Guo, Q., Liu, J., Li, J., Cao, S., Zhang, Z., Zhang, J., ... & Li, Y. (2022). Genetic diversity and core collection extraction of Robinia pseudoacacia L. germplasm resources based on phenotype, physiology, and genotyping markers. Ind Crops Prod., 178, 114627.
- Shi, J., Zhang, Y., Wang, N., Xu, Q., Huo, F., Liu, X., & Yan, G. (2023). Genetic diversity and population structure analysis of upland cotton (Gossypium hirsutum L.) germplasm in China based on SSR markers. Genet. Resour. Crop Evol., 1-12.
- Ghuge, S. B., Mehetre, S. S., Chimote, V. P., Pawar, B. D., & Naik, R. M. (2018). Molecular characterization of cotton genotypes using SSR, ISSR and RAPD markers in relation to fiber quality traits. J. Cotton Res., 32(1), 1-12.
- Tyagi, P., Gore, M. A., Bowman, D. T., Campbell, B. T., Udall, J. A., & Kuraparthy, V. (2014). Genetic diversity and population structure in the US Upland cotton (Gossypium hirsutum L.). Theor. Appl. Genet., 127, 283-295.
- Moiana, L. D., Filho, P. S. V., Gonçalves-Vidigal, M. C., & de Carvalho, L. P. (2015). Genetic diversity and population structure of upland cotton Brazilian cultivars ('Gossypium hirsutum'L. race'latifolium'H.) using SSR markers. Aust. J. Crop Sci., 9(2), 143-152.
- Morales, N., Ogbonna, A. C., Ellerbrock, B. J., Bauchet, G. J., Tantikanjana, T., Tecle, I. Y., ... & Mueller, L. A. (2022). Breedbase: a digital ecosystem for modern plant breeding. G3, 12(7), jkac078.
- Zhao, X., Zhang, Q., Tang, X., Xu, Y., Du, Y., Zhao, B., ... & Zhao, K. (2019). Multiplex detection of transgenic maize by microdroplet PCR combined with capillary gel electrophoresis. Acta Biochim. Biophys. Sin., 51(5), 535-538.
- Cheng, B., Xia, J., Gong, J., & Yang, S. (2011). Application of capillary electrophoresis detection with fluorescent SSR markers in rice DNA fingerprint identification. Chin. J. Rice Sci., 25(6), 672-676.
- Aydın, A. (2018). A Study on the Molecular Characterization of Some Commercial Cotton Varieties Registered in Turkey. Ph.D. Dissertation. Akdeniz University (Antalya/TÜRKİYE).
- Wang, Q., Fang, L., Chen, J., Hu, Y., Si, Z., Wang, S., ... & Zhang, T. (2015). Genome-wide mining, characterization and development of microsatellite markers in Gossypium species. Sci. Rep., 5(1), 10638.
- Ince, A. G., & Karaca, M. (2012). Species-specific touch-down DAMD-PCR markers for Salvia species. J Med Plants Res, 6, 1590-1595.
- Ronquist, F., Teslenko, M., Van Der Mark, P., Ayres, D. L., Darling, A., Höhna, S., ... & Huelsenbeck, J. P. (2012). MrBayes 3.2: efficient Bayesian phylogenetic inference and model choice across a large model space., Syst. Biol., 61(3), 539-542.
- Pritchard, J. K., Stephens, M., & Donnelly, P. (2000). Inference of population structure using multilocus genotype data. Genet., 155(2), 945–959. [CrossRef]
- Eren, B., Keskin, B., Demirel, F., Demirel, S., Türkoğlu, A., Yilmaz, A., & Haliloğlu, K. (2023). Assessment of genetic diversity and population structure in local alfalfa genotypes using iPBS molecular markers. Genet. Resour. Crop Evol., 70(2), 617-628.
- Demirel, S., & Demirel, F. (2023). Molecular identification and population structure of emmer and einkorn wheat lines with different ploidy levels using SSR markers. Genet. Resour. Crop Evol., 1-10.
- Karaca, M., Ince, A. G., Aydin, A., Elmasulu, S. Y., & Turgut, K. (2015). Microsatellites for genetic and taxonomic research on thyme (Thymus L.). Turk. J. Biol., 39(1), 147-159.
- Nadeem, M. A., Nawaz, M. A., Shahid, M. Q., Doğan, Y., Comertpay, G., Yıldız, M., ... & Baloch, F. S. (2018). DNA molecular markers in plant breeding: current status and recent advancements in genomic selection and genome editing. Biotechnol. Biotechnol. Equip., 32(2), 261-285.
- Sabev, P., Valkova, N., & Todorovska, E. G. (2020). Molecular markers and their application in cotton breeding: progress and future perspectives. Bulg. J. Agric. Sci., 26(4).
- Mishra, N., Tripathi, M. K., Tiwari, S., Tripathi, N., Gupta, N., Sharma, A., ... & Tiwari, S. (2022). Characterization of soybean genotypes on the basis of yield attributing traits and SSR molecular markers. book: Innovations in Science and Technology. 2022b, 3, 87-106.
- Cardle, L., Ramsay, L., Milbourne, D., Macaulay, M., Marshall, D., & Waugh, R. (2000). Computational and experimental characterization of physically clustered simple sequence repeats in plants. Genet., 156(2), 847-854.
- Saha, S., Karaca, M., Jenkins, J. N., Zipf, A. E., Reddy, O. U. K., & Kantety, R. V. (2003). Simple sequence repeats as useful resources to study transcribed genes of cotton. Euphytica, 130, 355-364.
- Qureshi, S. N., Saha, S., Kantety, R. V., & Jenkins, J. N. (2004). EST-SSR: a new class of genetic markers in cotton. J. Cotton Sci., 8, 112–123.
- Karaca, M., Ince, A. G., Aydin, A., & Ay, S. T. (2013). Cross-genera transferable e-microsatellite markers for 12 genera of the Lamiaceae family. J. Sci. Food Agric., 93(8), 1869-1879.
- Noormohammadi, Z., Rahnama, A., & Sheidai, M. (2013). EST-SSR and SSR analyses of genetic diversity in diploid cotton genotypes from Iran. Nucleus, 56, 171-178.
- Saleem, M. A., Amjid, M. W., Ahmad, M. Q., Riaz, H., Arshad, S. F., & Zia, Z. U. (2020). EST-SSR based analysis revealed narrow genetic base of in-use cotton varieties of Pakistan. Pak. J. Bot, 52(5), 1667-1672.
- 3Hinchliffe, D. J., Turley, R. B., Naoumkina, M., Kim, H. J., Tang, Y., Yeater, K. M., ... & Fang, D. D. (2011). A combined functional and structural genomics approach identified an EST-SSR marker with complete linkage to the Ligon lintless-2 genetic locus in cotton (Gossypium hirsutum L.). BMC genomics, 12, 1-18.
- Wang, B. H., Zhu, P., Yuan, Y. L., Wang, C. B., Yu, C. M., Zhang, H. H., ... & Li, P. (2014). Development of EST-SSR markers related to salt tolerance and their application in genetic diversity and evolution analysis in Gossypium. Genet. Mol. Res, 13(2), 3732-3746.
- Han, Z. G., Guo, W. Z., Song, X. L., & Zhang, T. Z. (2004). Genetic mapping of EST-derived microsatellites from the diploid Gossypium arboreum in allotetraploid cotton. Mol. Genet. Genom., 272, 308-327.
- Han, Z., Wang, C., Song, X., Guo, W., Gou, J., Li, C., ... & Zhang, T. (2006). Characteristics, development and mapping of Gossypium hirsutum derived EST-SSRs in allotetraploid cotton. Theoretical and Applied Genetics., 112, 430-439.
- Sánchez-Pérez, R., Ballester, J., Dicenta, F., Arús, P., & Martínez-Gómez, P. (2006). Comparison of SSR polymorphisms using automated capillary sequencers, and polyacrylamide and agarose gel electrophoresis: implications for the assessment of genetic diversity and relatedness in almond. Sci. Hortic., 108(3), 310-316.
- McCudden, C. R., Mathews, S. P., Hainsworth, S. A., Chapman, J. F., Hammett-Stabler, C. A., Willis, M. S., & Grenache, D. G. (2008). Performance comparison of capillary and agarose gel electrophoresis for the identification and characterization of monoclonal immunoglobulins. Am. J. Clin. Pathol., 129(3), 451-458.
- Wendel, J. F., Brubaker, C. L., & Seelanan, T. (2010). The origin and evolution of Gossypium. In Physiology of cotton (pp. 1-18). Dordrecht: Springer Netherlands.
- Wendel, J. F. (1989). New World tetraploid cottons contain Old World cytoplasm. Proc. Natl. Acad. Sci., 86(11), 4132-4136.
- Rana, M. K., & Bhat, K. V. (2005). RAPD markers for genetic diversity study among Indian cotton cultivars. Current Science, 1956-1961.
- Abdellatif, K. F., & Soliman, Y. A. (2013). Genetic relationships of cotton (Gossypium barbadense L.) genotypes as studied by morphological and molecular markers. Afr. J. Biotechnol., 12(30).
- Zhang, J., Percy, R. G., & McCarty, J. C. (2014). Introgression genetics and breeding between Upland and Pima cotton: a review. Euphytica, 198, 1-12.
- Li, Y., Si, Z., Wang, G., Shi, Z., Chen, J., Qi, G., ... & Zhang, T. (2023). Genomic insights into the genetic basis of cotton breeding in China. Mol Plant, 16(4), 662-677.


| No | Genotype | Species | No | Genotype | Species | |
|---|---|---|---|---|---|---|
| 1 | Adana-98 | G. hirsutum | 25 | Nieves | G. hirsutum | |
| 2 | Aydın-110 | G. hirsutum | 26 | Özbek-100 | G. hirsutum | |
| 3 | BA-320 | G. hirsutum | 27 | PG -2018 | G. hirsutum | |
| 4 | Babylon | G. hirsutum | 28 | Samon | G. hirsutum | |
| 5 | Carisma | G. hirsutum | 29 | Sezener-76 | G. hirsutum | |
| 6 | Carmen | G. hirsutum | 30 | SG-404 | G. hirsutum | |
| 7 | Caroline Queen | G. hirsutum | 31 | Sindos-80 | G. hirsutum | |
| 8 | Claodia | G. hirsutum | 32 | ST-468 | G. hirsutum | |
| 9 | Comos | G. hirsutum | 33 | Veret | G. hirsutum | |
| 10 | Diva | G. hirsutum | 34 | Acala Royale | G. hirsutum | |
| 11 | DP-50 | G. hirsutum | 35 | Fibermax-819 | G. hirsutum | |
| 12 | Elsa | G. hirsutum | 36 | Tamcot Spinx | G. hirsutum | |
| 13 | Erşan-92 | G. hirsutum | 37 | TM-1 | G. hirsutum | |
| 14 | Fantom | G. hirsutum | 38 | Pima 3-79 | G. barbadense | |
| 15 | Flash | G. hirsutum | 39 | G.B-58 | G. barbadense | |
| 16 | Frego | G. hirsutum | 40 | Askabat-71 | G. barbadense | |
| 17 | Gaia | G. hirsutum | 41 | Askabat-91 | G. barbadense | |
| 18 | Garant | G. hirsutum | 42 | Askabat-100 | G. barbadense | |
| 19 | Gloria | G. hirsutum | 43 | Bahar-14 | G. barbadense | |
| 20 | Gossypolsüz 86 | G. hirsutum | 44 | Bahar-82 | G. barbadense | |
| 21 | Gumbo | G. hirsutum | 45 | Giza-45 | G. barbadense | |
| 22 | Ligur | G. hirsutum | 46 | Giza-70 | G. barbadense | |
| 23 | Lockette | G. hirsutum | 47 | Giza-75 | G. barbadense | |
| 24 | Mc Nair 220 | G. hirsutum |
| Primer ID | Primer Sequence | Motif | Alellel Number | Tm (oC) | He | H0 | PIC |
|---|---|---|---|---|---|---|---|
| GA01-2651 | F:AAATCCTACCTCTCCGGCCA R: CCCAGGGCAAAACAATGTCG |
(GCCGGC)3 | 6 | 60 | 0,485 | 0,479 | 0,475 |
| GA02-54 | F:GGGAAAGCGCGTCATTGATC R: GCCGAGCCCAGACCTAATAG |
(GCCGG)4 | 4 | 60 | 0,450 | 0,096 | 0,437 |
| GA04-1418 | F:GCAGGCAGAATACAAAAGATCGA R: AAGAAAAGGGGGAGGGGAGA |
(GCCGGC)3 | 33 | 60 | 0,737 | 0,596 | 0,730 |
| GA07-410 | F:GAAATTACCTTTCCGGCCACC R: GACGTCGTTTTGGAGGGCTA |
(GCCGGC)3 | 24 | 60 | 0,720 | 0,528 | 0,708 |
| GA08-323 | F:GAACCGACCTAAGGTGACTGT R: AGAGAGAAGGGAGGGGGAAG |
(CCGGCG)3 | 6 | 60 | 0,476 | 0,266 | 0,473 |
| GD01-295 | F:TTTACCTTTCCGACCACCGC R: GGTGCGTTTTGGTCCCCTAT |
(GCCGGC)3 | 7 | 60 | 0,704 | 0,415 | 0,693 |
| GD02-301 | F:AAACCCGTTGTGCAACCATG R: GGATGAGGCTGAGAAGGAGC |
(CCGGTG)3 | 15 | 60 | 0,898 | 0,883 | 0,889 |
| GD03-2002 | F:GGCCCGGCCCGAATATAATA R: GACTAGACCTGTCCATGGGC |
(CCGGGC)3 | 19 | 60 | 0,798 | 0,539 | 0,788 |
| GD06-2808 | F:GGCCCGGCCCGAATATAATAA R: CGGCCCGAAATATGGGCTTA |
(CCGGGC)3 | 14 | 60 | 0,625 | 0,560 | 0,616 |
| GD08-420 | F:AGAGAAGGGAGGGGGAAAGG R: GGGCTCTAACACCAAATCGGA |
(CGCCGG)3 | 42 | 60 | 0,741 | 0,571 | 0,738 |
| GD09-1296 | F:GGCGCACAAAACACCAAGAT R: AGGGAGGAAGGAAAGGGGG |
(GCCGGC)3 | 14 | 60 | 0,745 | 0,546 | 0,737 |
| GD10-1664 | F:GGGCTCTAACACCAAATCGGA R: AGAGAAGGGAGGGGGAAAGG |
(GCCGGC)3 | 29 | 60 | 0,679 | 0,493 | 0,675 |
| MK086 | F:CCACCAGTTTGGTAGGTATGAAC R: TCAACAGTGCAAGGACTTCATC |
(CAT)8 | 2 | 66 | 0,293 | 0,121 | 0,268 |
| MK105 | F:CAAAGATGCCGAAAGAGAGG R: GTAAGATCGGCGGGTCATC |
(CCG)12 | 30 | 66 | 0,666 | 0,319 | 0,659 |
| MK126 | F:ACCGTACCCGTGGCTCTTAT R: TGTTGTTGTGGGAGGCTTCT |
(CAT)8 | 4 | 66 | 0,414 | 0,043 | 0,378 |
| MK129 | F:GCTGATGCTGATTCCTCCAT R: TGCCCTTCATCTCGTTTCTT |
(CAA)8 | 7 | 66 | 0,373 | 0,479 | 0,345 |
| MK132 | F:AGCAAGGCATGAGCGATACT R: GGTGGTACCTTCCCATGTTG |
(TCAGCC)6 | 8 | 66 | 0,541 | 0,391 | 0,511 |
| MK146 | F:ATGGAGGCTGCAAAGACTGT R: CCACTCCGACTAAAAGATCAGC |
(GTAGTGAGA)3 | 3 | 66 | 0,577 | 0,787 | 0,487 |
| MK173 | F:GGGGTCCACAGATACAGG R: GTCCAAAACTTGTCCCATTAG |
(TATG)9 | 13 | 66 | 0,867 | 0,106 | 0,858 |
Disclaimer/Publisher’s Note: The statements, opinions and data contained in all publications are solely those of the individual author(s) and contributor(s) and not of MDPI and/or the editor(s). MDPI and/or the editor(s) disclaim responsibility for any injury to people or property resulting from any ideas, methods, instructions or products referred to in the content. |
© 2023 by the authors. Licensee MDPI, Basel, Switzerland. This article is an open access article distributed under the terms and conditions of the Creative Commons Attribution (CC BY) license (https://creativecommons.org/licenses/by/4.0/).


