1. Introduction
1.1. Mangroves: An overview
Mangroves can be defined as a group or formation of trees and shrubs (including ferns and a palm tree) prevailing in muddy lowlands close to tropical and subtropical riverbanks and coasts, where the mangrove tree, in its diversity of species usually has a dominant presence [
1,
2,
3,
4]. They are present in 123 countries and territories covering approximately 152000 Km2, but only 12 countries represent over 66 percent of the total mangrove coverage, among them Indonesia, Malaysia and Myanmar, with more than 30 non-introduced mangrove species [
4]. According to [
5], mangroves barely represent 1 percent of all tropical forests.
However small the fraction of forests they represent, mangroves fulfill a variety of important ecological roles in their ecosystems. They actively participate in maintaining, mixing, consolidating, and generating matter and sediments, as well as helping with their root system to soil accretion [
6]. In certain zones of the Caribbean described [
7,
8] this surface accretion can generate elevations of up to 4 mm/year, allowing them to keep up with sea-level rises. Mangrove forests are also among the richest, densest and most productive in terms of organic carbon sequestration and its storage in local and ex situ sediment [
4,
9,
10,
11,
12,
13]; especially in wet tropical regions, they can store between three [
13] and five times more carbon than other terrestrial ecosystems [
9].
The high levels of biomass and productivity of mangrove forests serve as indicators of the role they could play in the global carbon cycle. It has been estimated that, on average, carbon pools in mangroves could reach 1023 Mg / ha [
10,
11]. This carbon stored by marine-coastal ecosystems such as mangroves, swamps and seagrasses are often referred to as “blue carbon” [
14]. A study carried out in the Hichinbrook Strait, Australia, has shown that carbon stocks in the first 50 centimeters of sediment are 1.7 times higher than in living biomass [
15]. Similar sedimentary borehole studies in Belize, Honduras, and Panama demonstrated a 65% ratio of organic matter media in boreholes located between 0.4 m and 10 m deep [
8]. Thanks to research regarding the Net Primary Productivity (NPP) of these ecosystems, it has been demonstrated that 10% thereof is incorporated to local sediments, 50% is consumed or decomposed on-site and 10-15% is exported as Dissolved Organic Carbon (DOC), with 10% not being considered [
16,
17], aided with calculations from [
18,
19] estimated that mangrove Particulate Organic Carbon (POC) exports could account for up to 15% of total carbon accumulation in sediments on the continental margin. Through a study performed off the shore of northern Brazil, [
20] estimated that more than 10% of the refractory DOC transported to the ocean derives from mangroves. [
21] also citing the previous paper, add that organic carbon export from mangrove areas to the ocean is more than one order of magnitude higher in proportion to their net primary production than any major river.
Coupled with their high productivity, their root system allows them to store and consolidate sediments, thus creating a buffer zone that protects the inland ecosystems from the erosive action of extreme climactic events such as tropical storms and tsunamis [
4,
22,
23]. As an example, zones in the southwest of the gulf of Thailand with an important mangrove coverage have all but ceased to experience erosion [
24].
Therefore, we examined sensitive variables such as air temperature and relative humidity in coastal tropical ecosystems in the area, it is considered necessary to carry out a monitoring and analysis of these variables to assess the current state of the mangroves in this wetland zone. Aiming to assess the variables between 2017 and 2018. We examined correlations between these environmental factors.
1.2. Potential threats from climate change
Evidence of human influence in the changes of the climactic system have increased since the 2007 IPCC’s (Intergovernmental Panel on Climate Change) report. It is believed to be extremely likely than more than half of the observed rises in surface temperature recorded from 1995 to 2010 have been caused by the concentration increment of greenhouse gases and other anthropogenic factors. In addition, a trend has been observed, in which each of the last three decades has successively been the warmest in regard to surface temperature than any other decade since 1850. Furthermore, combined and averaged global data on land and ocean surface temperatures from 1880 to 2012 where independently produced data clusters can be found, shows a linear increment of 0.85°C [
25]. Additionally, recent estimations forecast a 0.9 to 1.30 m rise in sea levels by the end of the XXI century [
26].
A study aimed at evaluating the response of mangroves to relative sea level rise found variable responses; the most common being accretion in the ecosystem’s substrate [
6]; however, in almost every case where there is accretion, this is countered by subsidence in the deepest strata of soil, causing instability even under current conditions [
6,
27,
28]. If the increments in sea levels are distended enough, mangroves are able to migrate inland [
28,
29,
30]. Nonetheless, a variety of factors such as availability of adequate substrate, geomorphology, or the impact of manmade structures (dams, watering canals, fillings, etc.) can affect their displacement ability [
4].
With regards to temperature raise, [
25] models predict an increment of between 2 and 4°C by the end of the century. Such increases in temperature could have varying effects on mangrove forests:
An increase in productivity and photosynthetic rates could be seen, given that the optimal temperature range for mangrove leaves is 28-32°C. Photosynthetic activity stops almost completely if temperatures of 38-40 °C are reached, however;
Alterations to the flowering and fructification processes;
Modifications to their specific composition;
Migration toward higher latitudes, where conditions allow for new mangrove establishment. It has been observed that this phenomenon could lead to the replacement of saltmarshes, and it is expected to continue in subtropical and template climates [
4,
28,
29,
30,
31,
32].
Realizing the imminent possibility of experiencing rapid increases in temperature in all tropical regions of the world, [
33] proposed carrying out a combination of large scale, in situ, variable manipulation studies and observational studies (such as eddy covariance, environmental gradients, among others) on a long-term basis in order to properly determine the way in which these ecosystems will react to changes. Temperature manipulation experiments are particularly important, since tropical ecosystems – including mangroves – may be especially vulnerable to thermal variations due to their long evolutionary history of development under climactic conditions of relatively low variance [
34,
35].
2. Materials and Methods
2.1. Study site
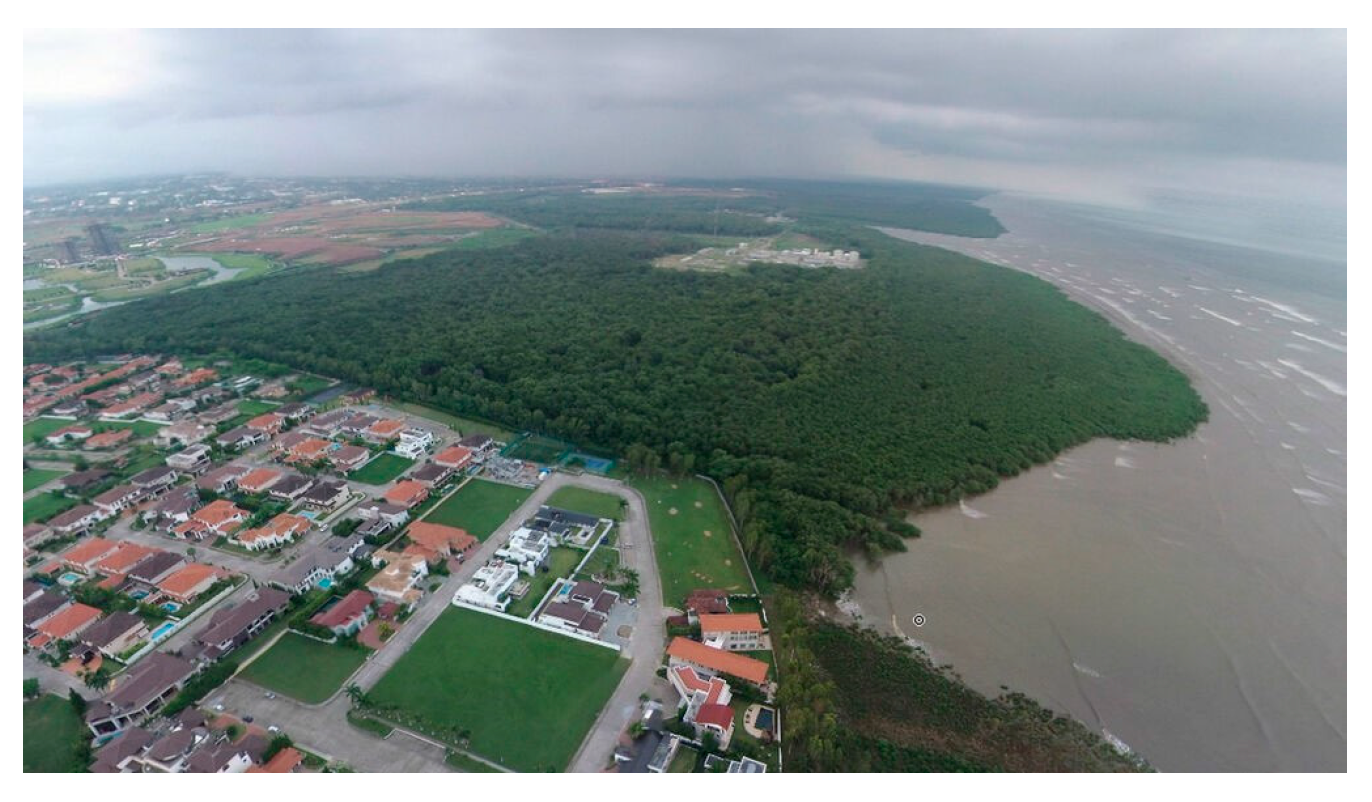
The monitored mangrove ecosystem is located within the westernmost limits of the Panama Bay Wetland Ramsar Site. It measures approximately 350 meters in ratio, and it neighbors the Costa del Este urbanization, the Santa Maria Country & Golf Club, as well as the Juan Diaz sewage treatment plant. The area is dominated by
Avicennia germinans and
A. bicolor, with other species such as
Pelliciera rhizophorae and
Laguncularia racemosa being present in lesser quantities. The area experiences the effects of low and high tides four times a day and has a mean canopy height of 17 meters [
36,
37].
Figure 1.
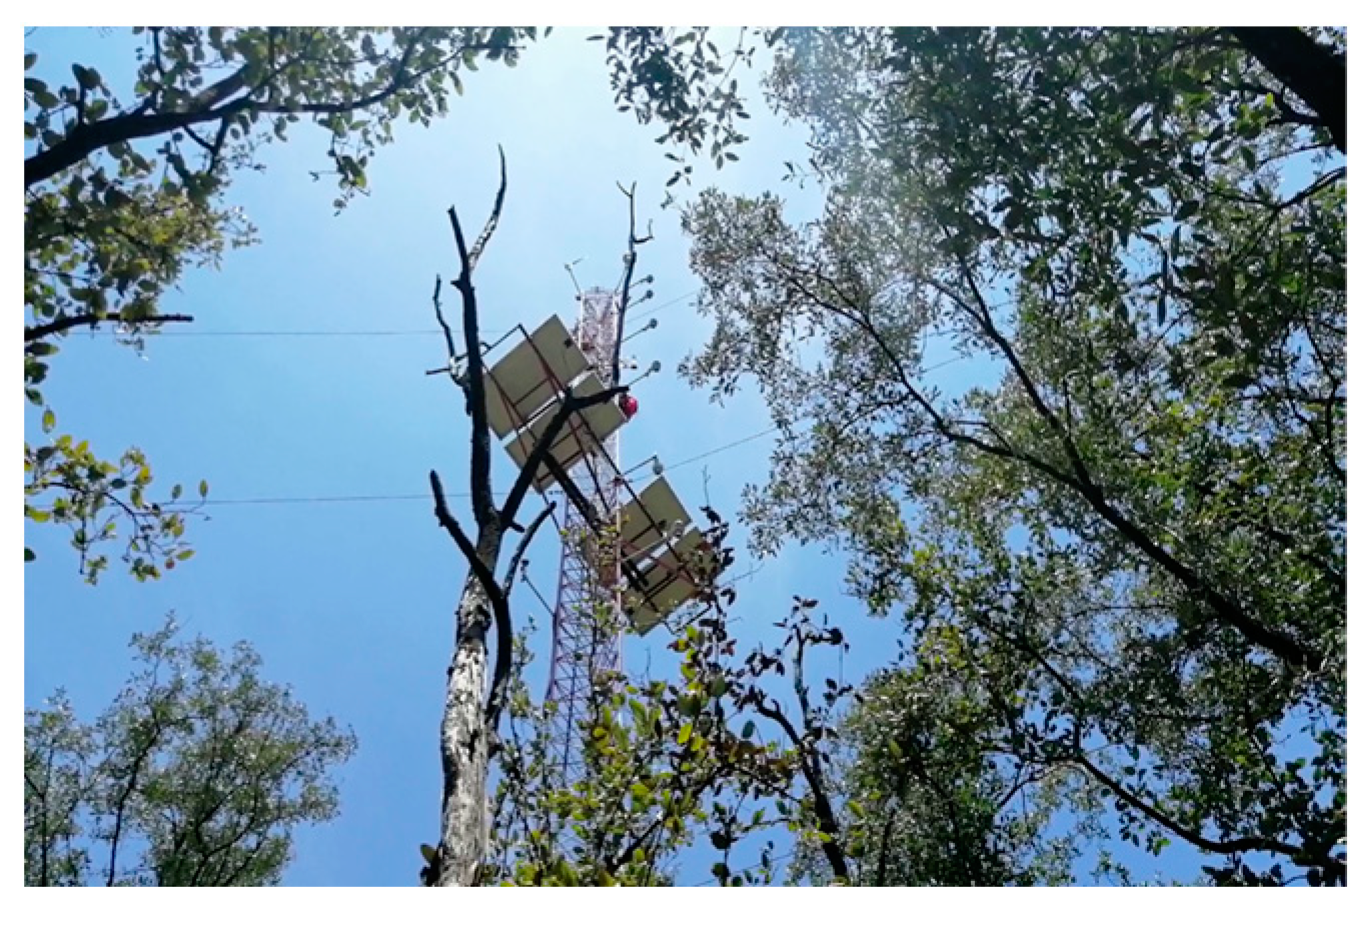
The micrometeorological and carbon flux tower was built in 2015, seven years after the visit of Doctor Joseph Zieman of the University of Virginia to the Juan Díaz mangroves; invited by the Ciudad del Saber Foundation and the former National Authority of the Environment (ANAM in Spanish), currently the Ministry of Environment. It is approximately 30 m in height and is located at the following coordinates 9°0´51.82” N, -79°27´10.53” W [
36,
38].
Figure 2.
For data collection, monthly trips to the study site were conducted. The data analyzed in this experience was collected between 2017 and 2018. Permission to enter the area must be granted by the Ministry of Health, who has jurisdiction over the terrains surrounding the sewage treatment plant; additionally, the National Frontiers Service (SENAFRONT in Spanish) must be notified of the monthly visits, in order to provide armed escorts due to the strategic importance for national security of the area. Access to the study site is done by car up to the sewage treatment plant; from there, it becomes necessary to follow a trail cut through nearby thickets until the tower is reached.
2.2. Air temperature and relative humidity
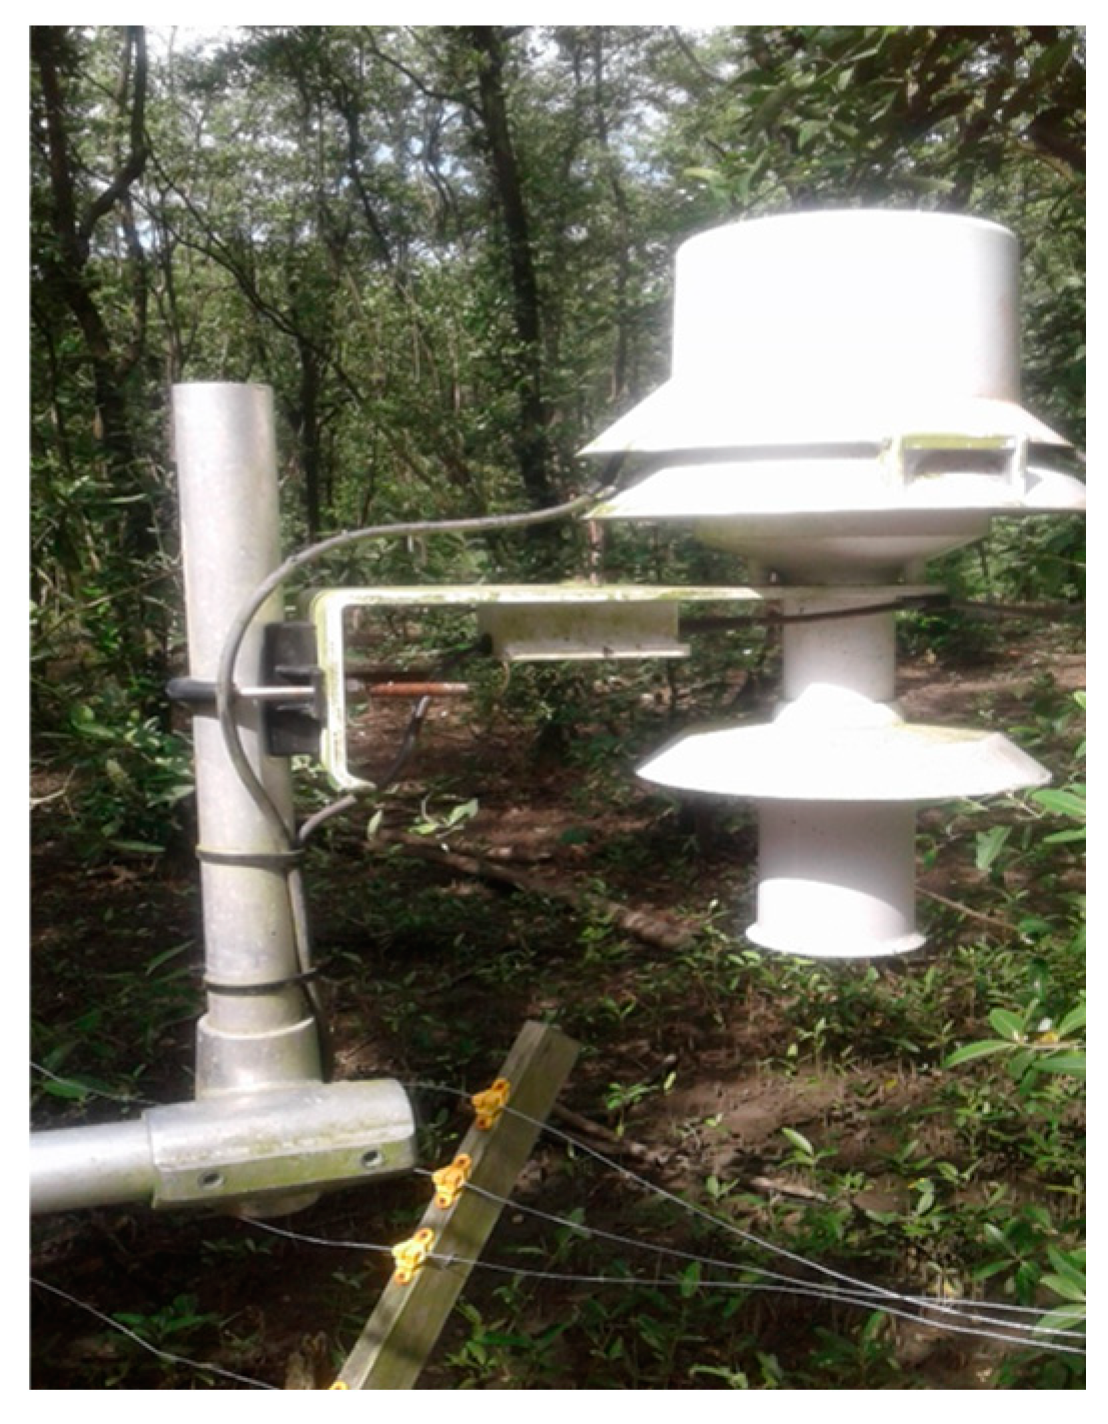
The tower is equipped with eight air temperature sensors (R.M. Young Company, model 41342VC) and two combined sensors for air temperature and relative humidity (R.M. Young Company, model 41382VC). All sensors are incased in radiation shields from the same maker. The heights at which each probe is set are shown in
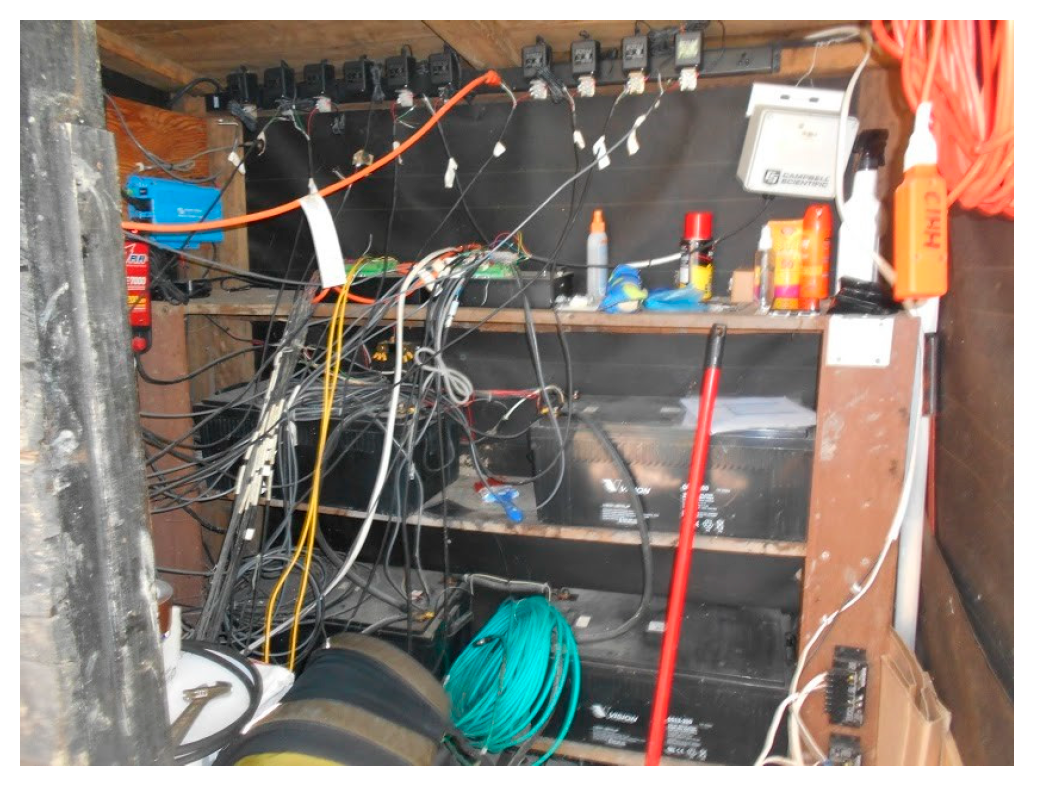
Table 1. Measurements are taken every ten minutes and are then stored in a CR3000 Campbell Scientific data logger, where it is downloaded upon arrival on the site of CIHH personnel.
Figure 3.
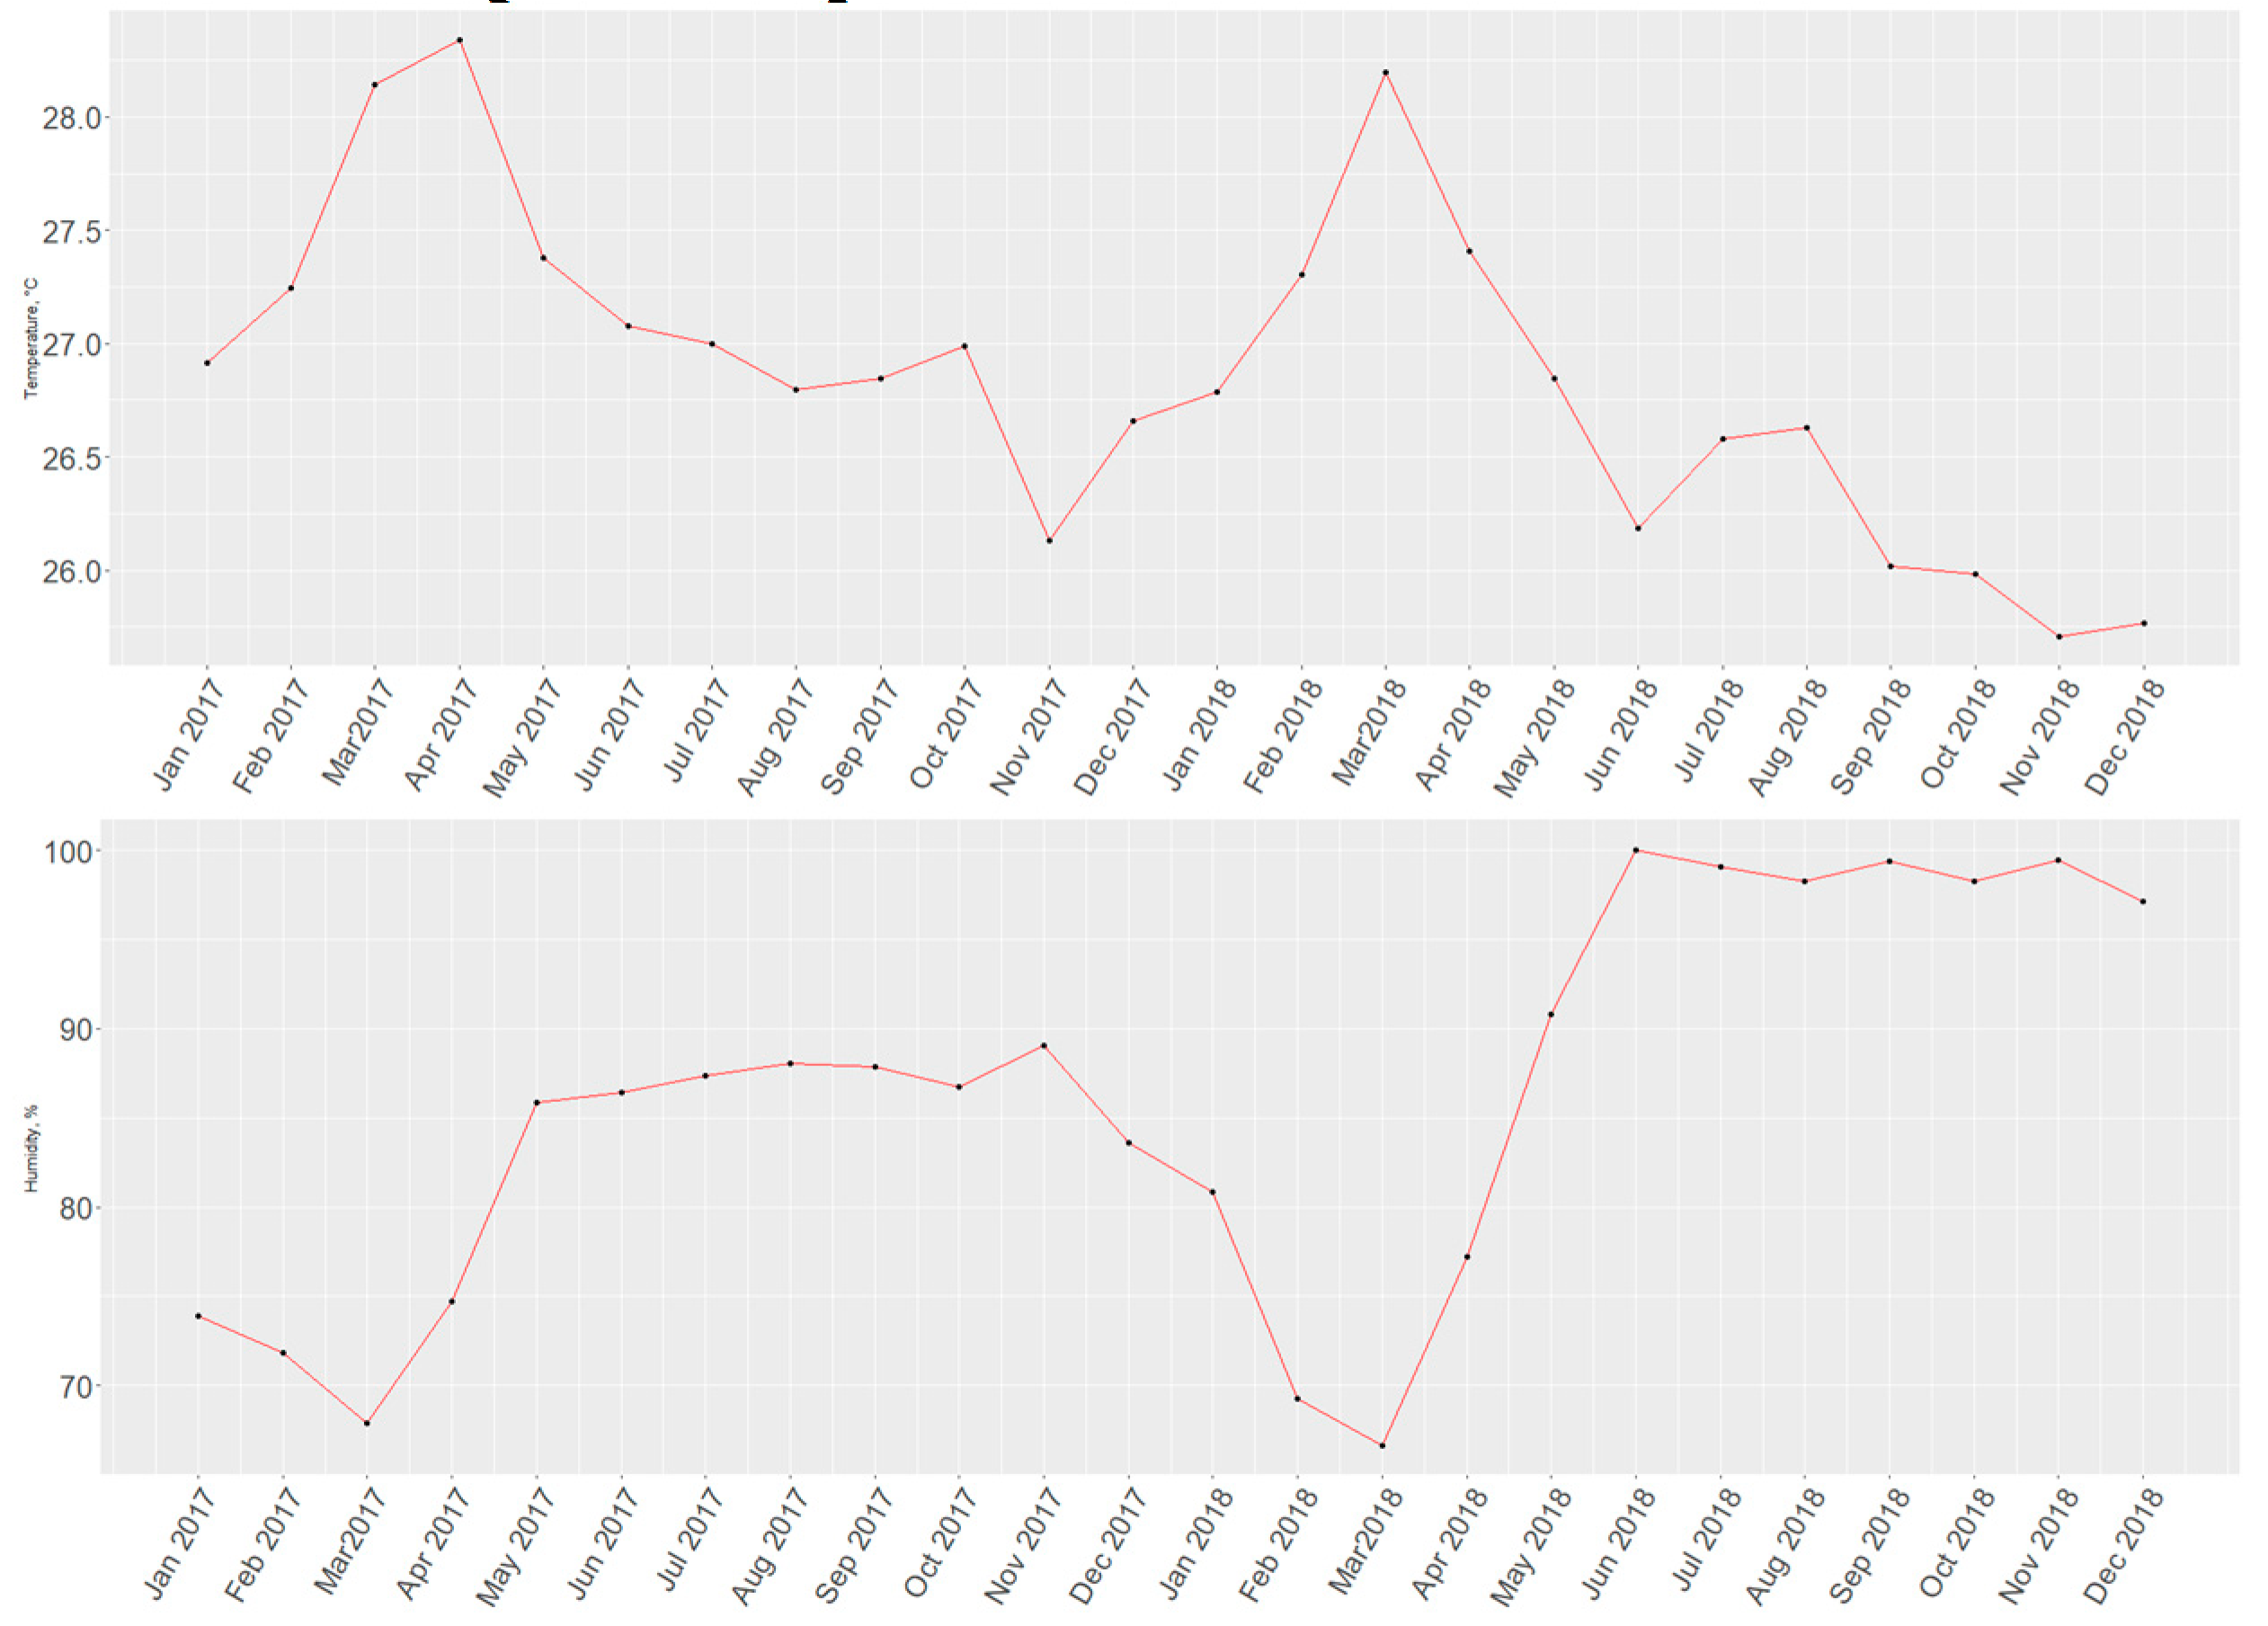
We performed monthly averages on our data set prior to the graphical analysis, which included monthly line plots comparing differences between stations by year and monthly boxplots of combined station values by year. Additionally, we created a time series for both variables given their monthly mean values for the T1-H1 station.
Figure 4.
2.3. Linear model fitting
Using R’s lm () function, we performed a least-squared linear model fitting for the air temperature and relative humidity data collected between the years 2017 and 2018 from the T1-H1 station. The lm () function uses the following formula:
The following assumptions are made for εi:
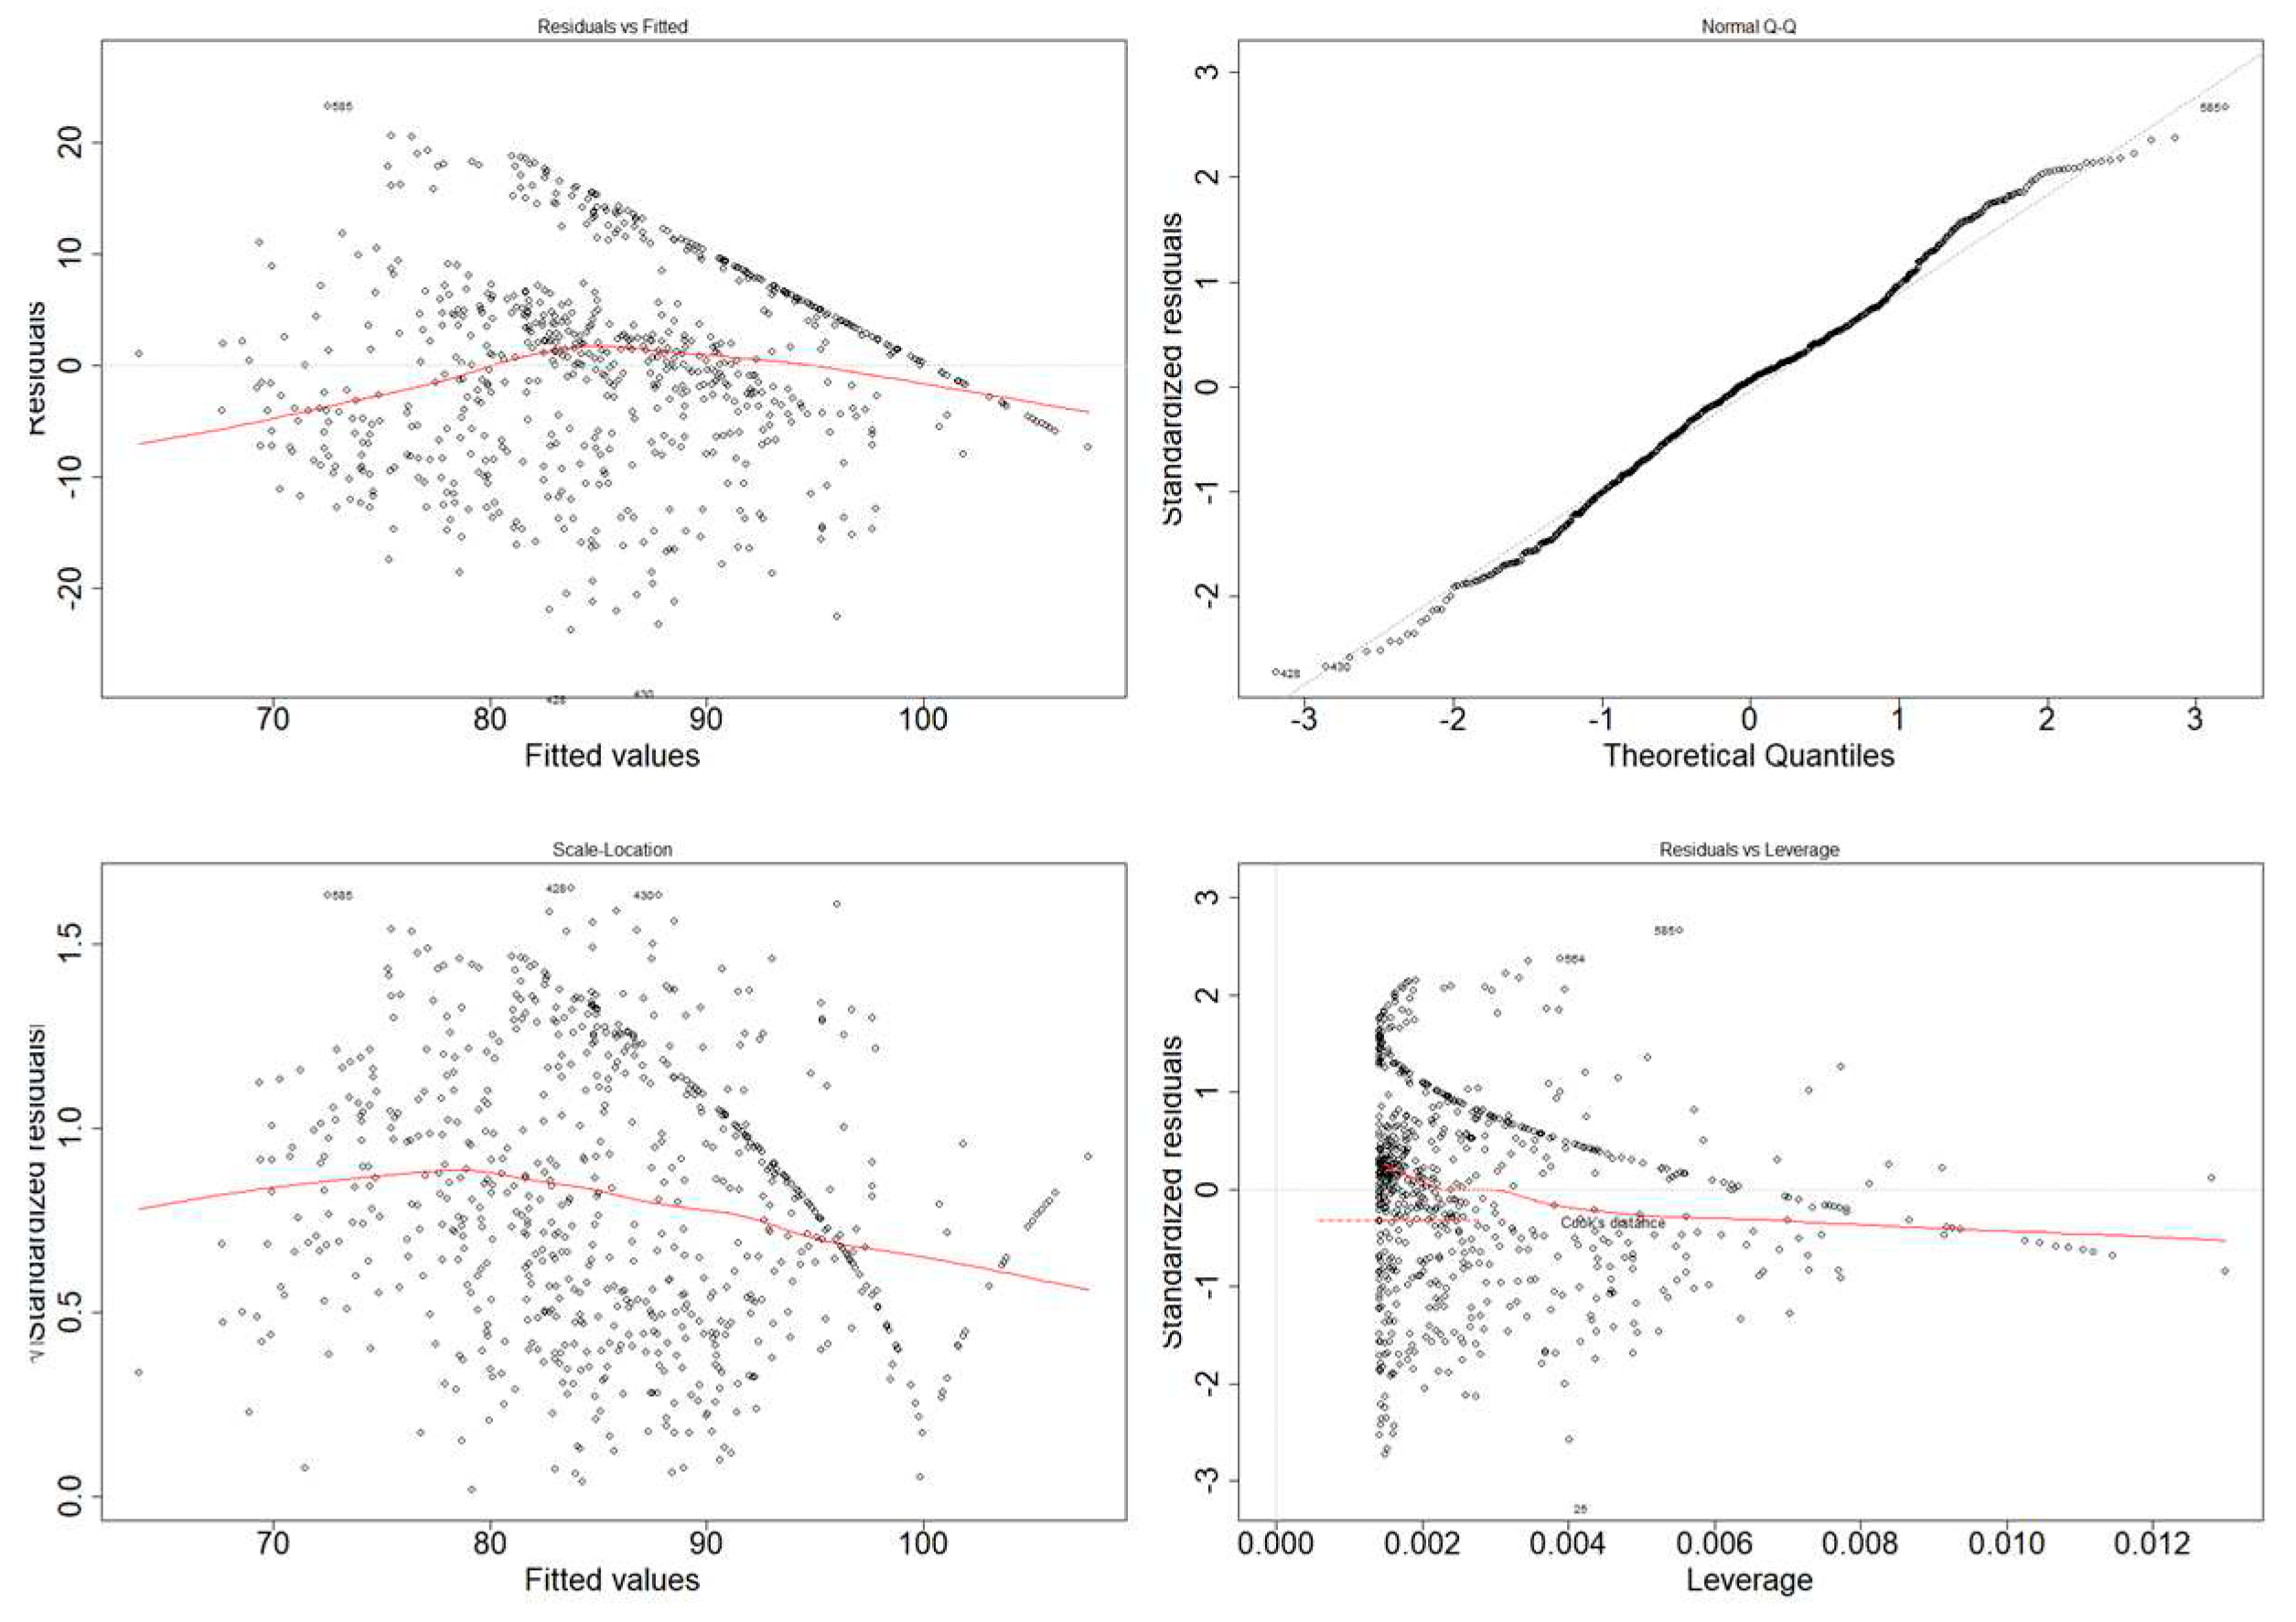
In order to determine if said assumptions were fulfilled, we relied on an evaluation through graphic methods, such as Q-Q plots, scale-location plots and residuals vs. fitted values plots time.
3. Results
3.1. Air temperature and heat map
In 2017, the T10-H10 probe malfunctioned for most of the year and thus, both air temperature and relative humidity readings were not considered valid for this period; therefore, station 10 is not shown on temperature analysis on either year.
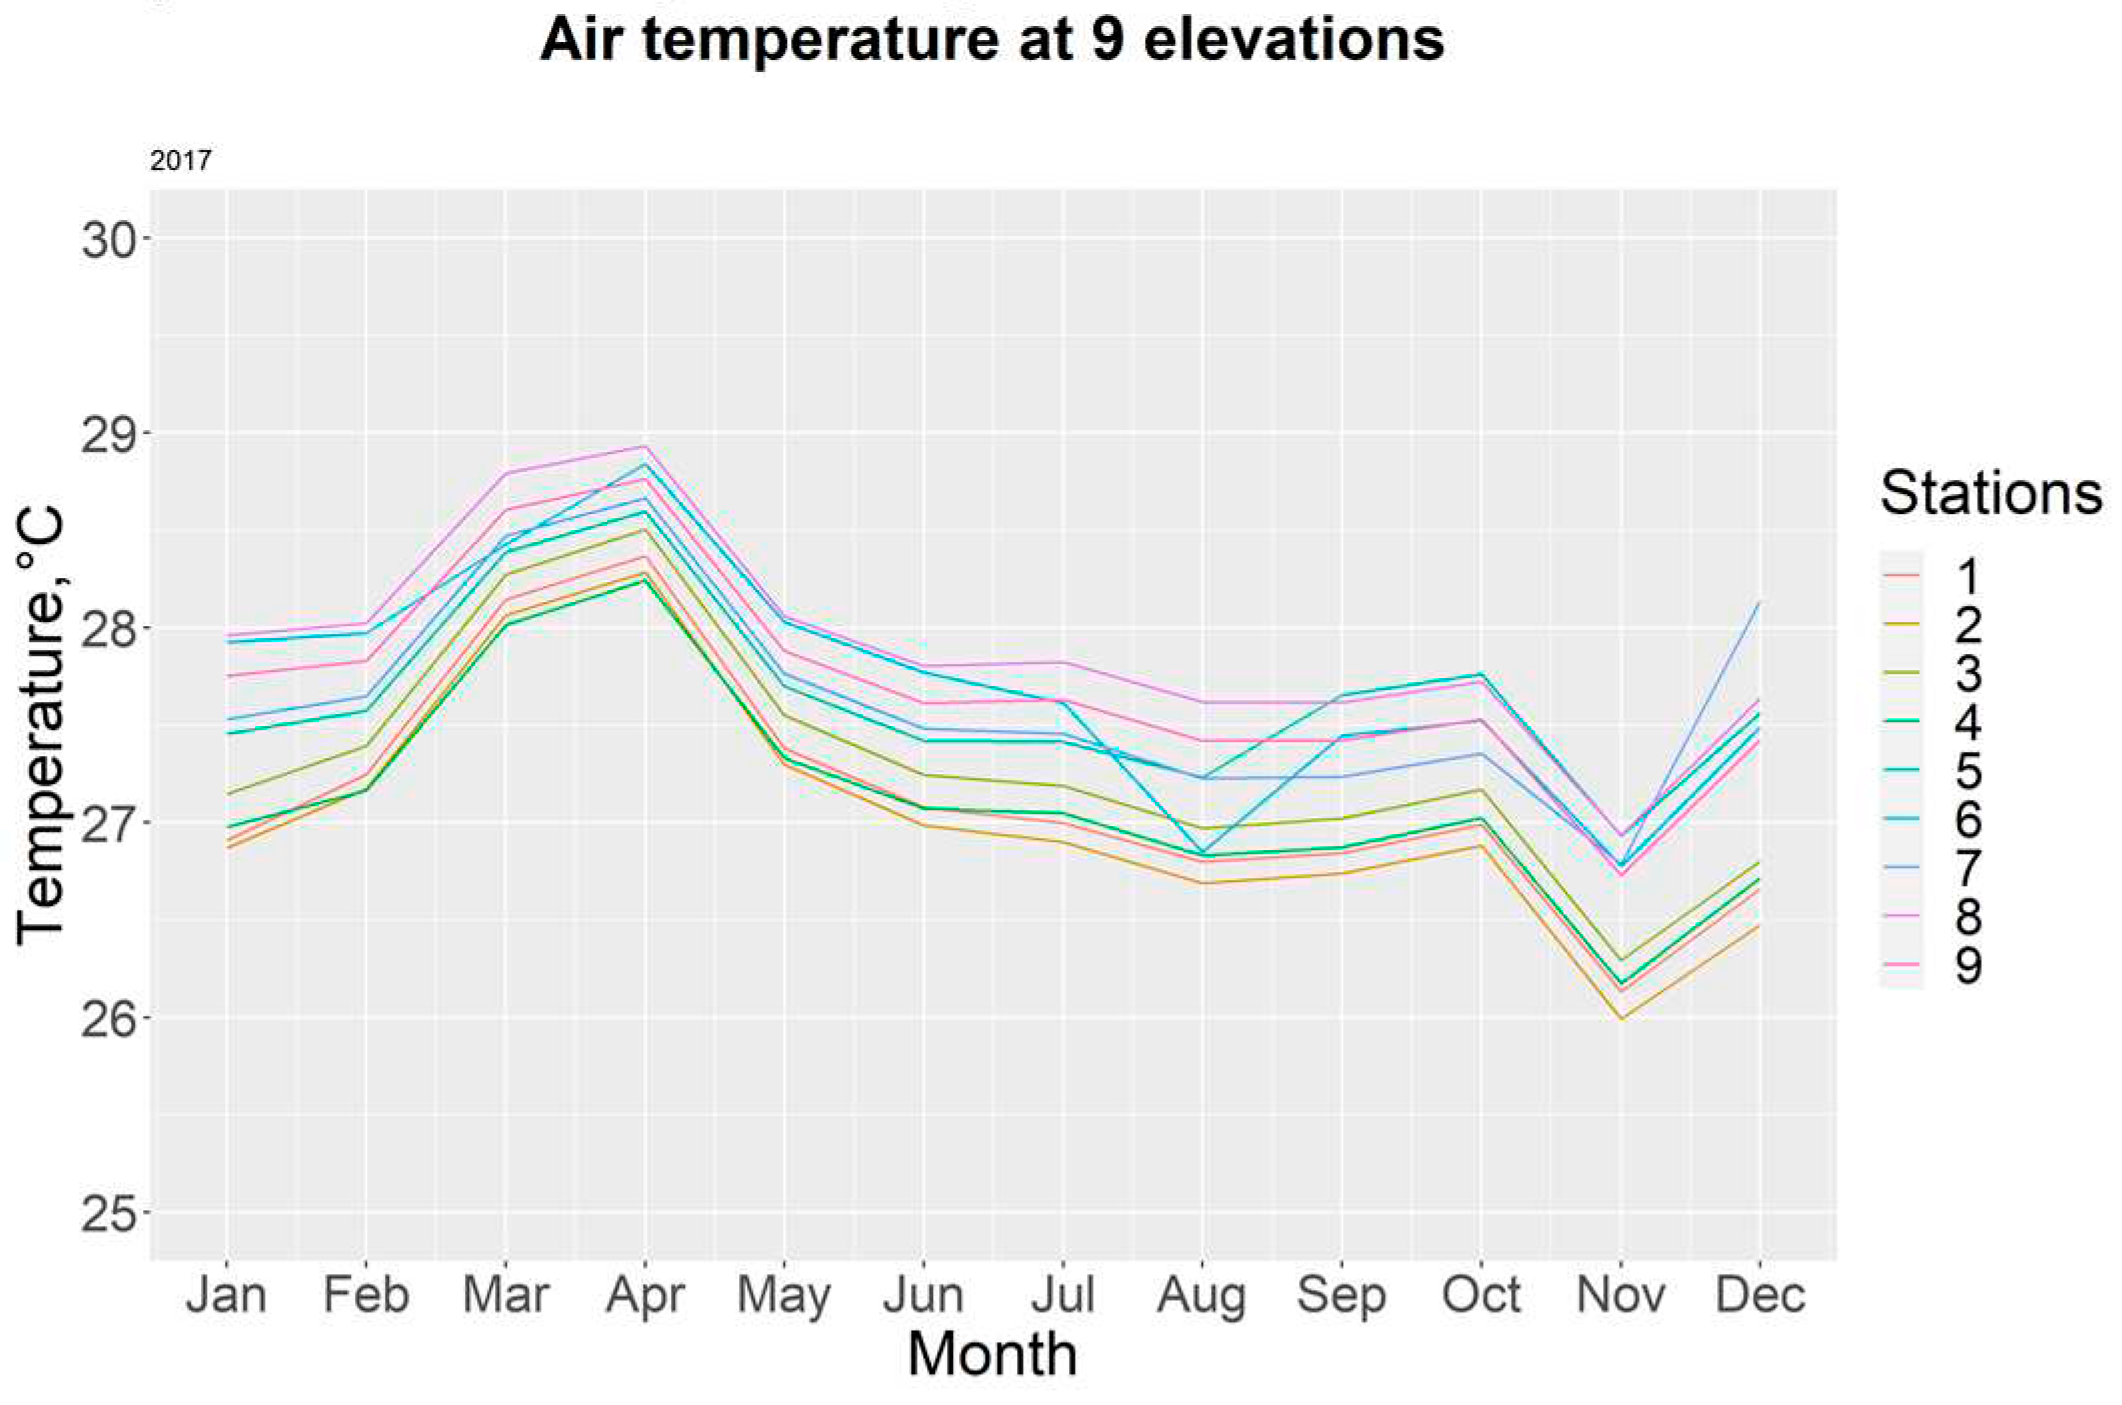
Figure 5.
For the year 2017, the highest recorded temperatures occurred during the month of April (28.93 ± 0.25 °C), with station T8 having the most elevated readings. The yearly average temperature was 27.47 ± 0.32°C.
Table 2.
The period with the greatest amount of deviation corresponds to transitioning months between the rainy and dry season (November and December), as well as January.
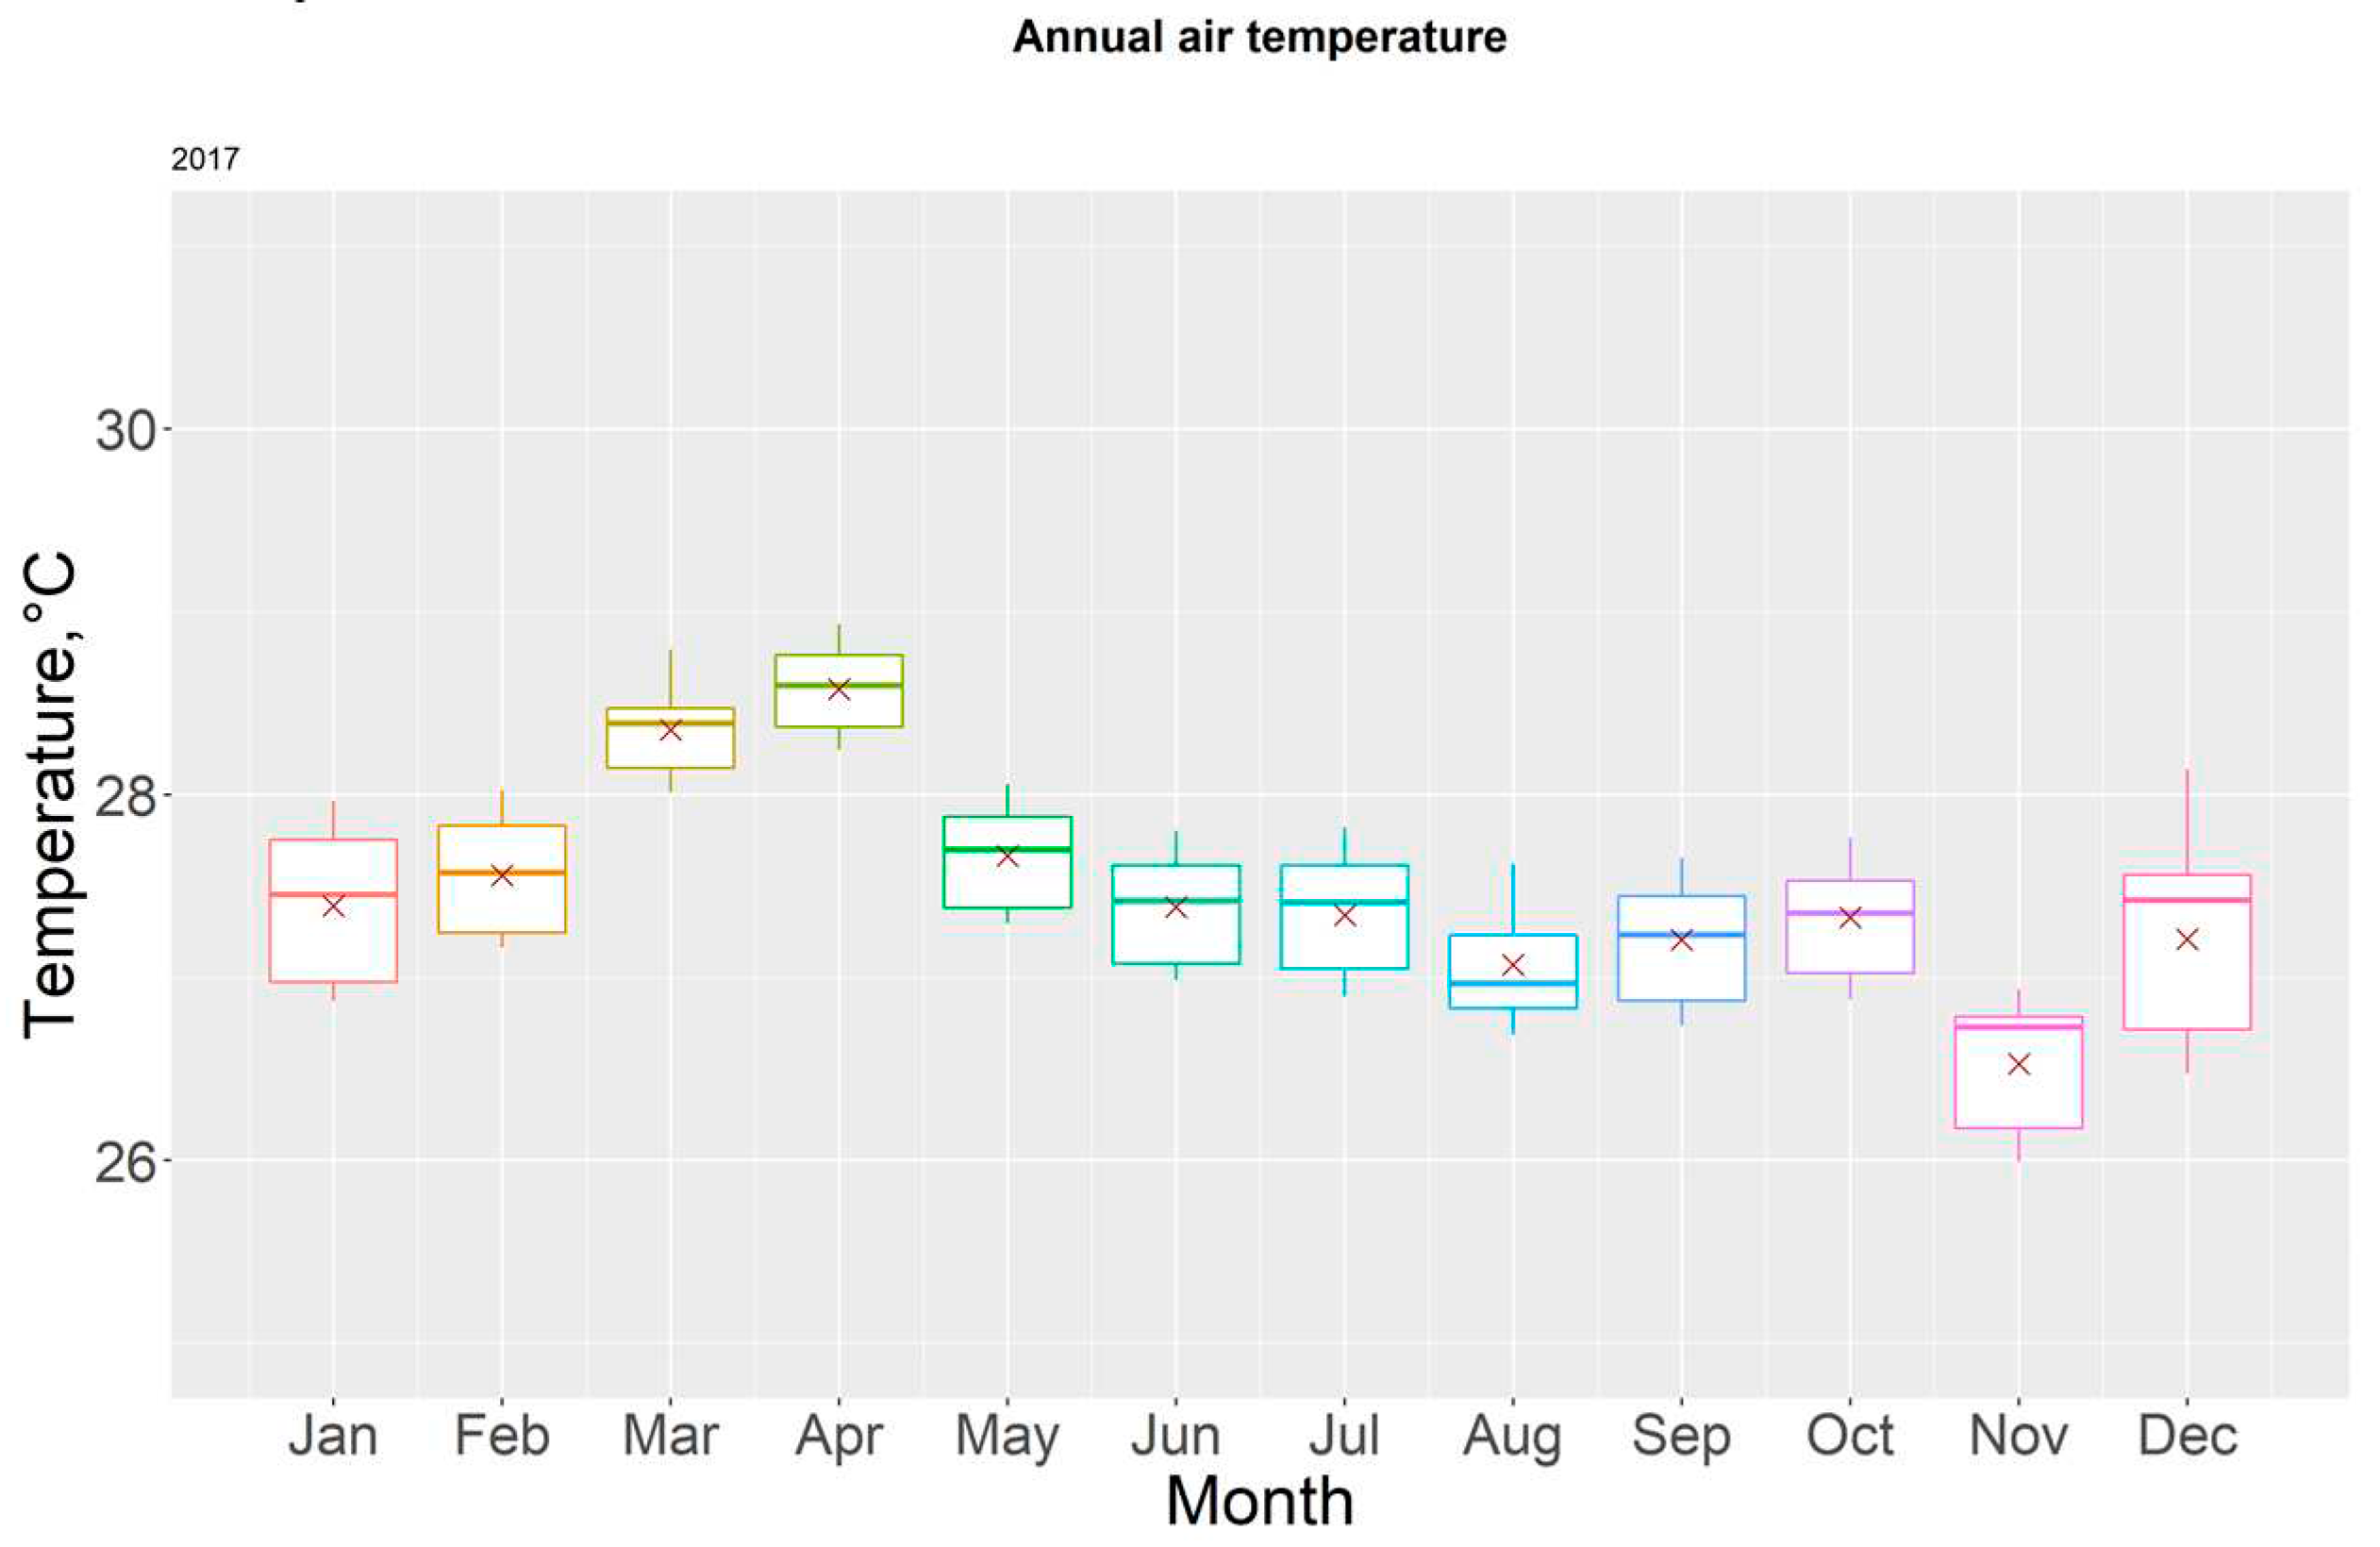
Figure 6 allows us to visualize temperature distribution every month through 2017. Additionally, we can observe that the only months with mean temperatures of 28°C or above are March and April; these two corresponding with the height of the dry season.
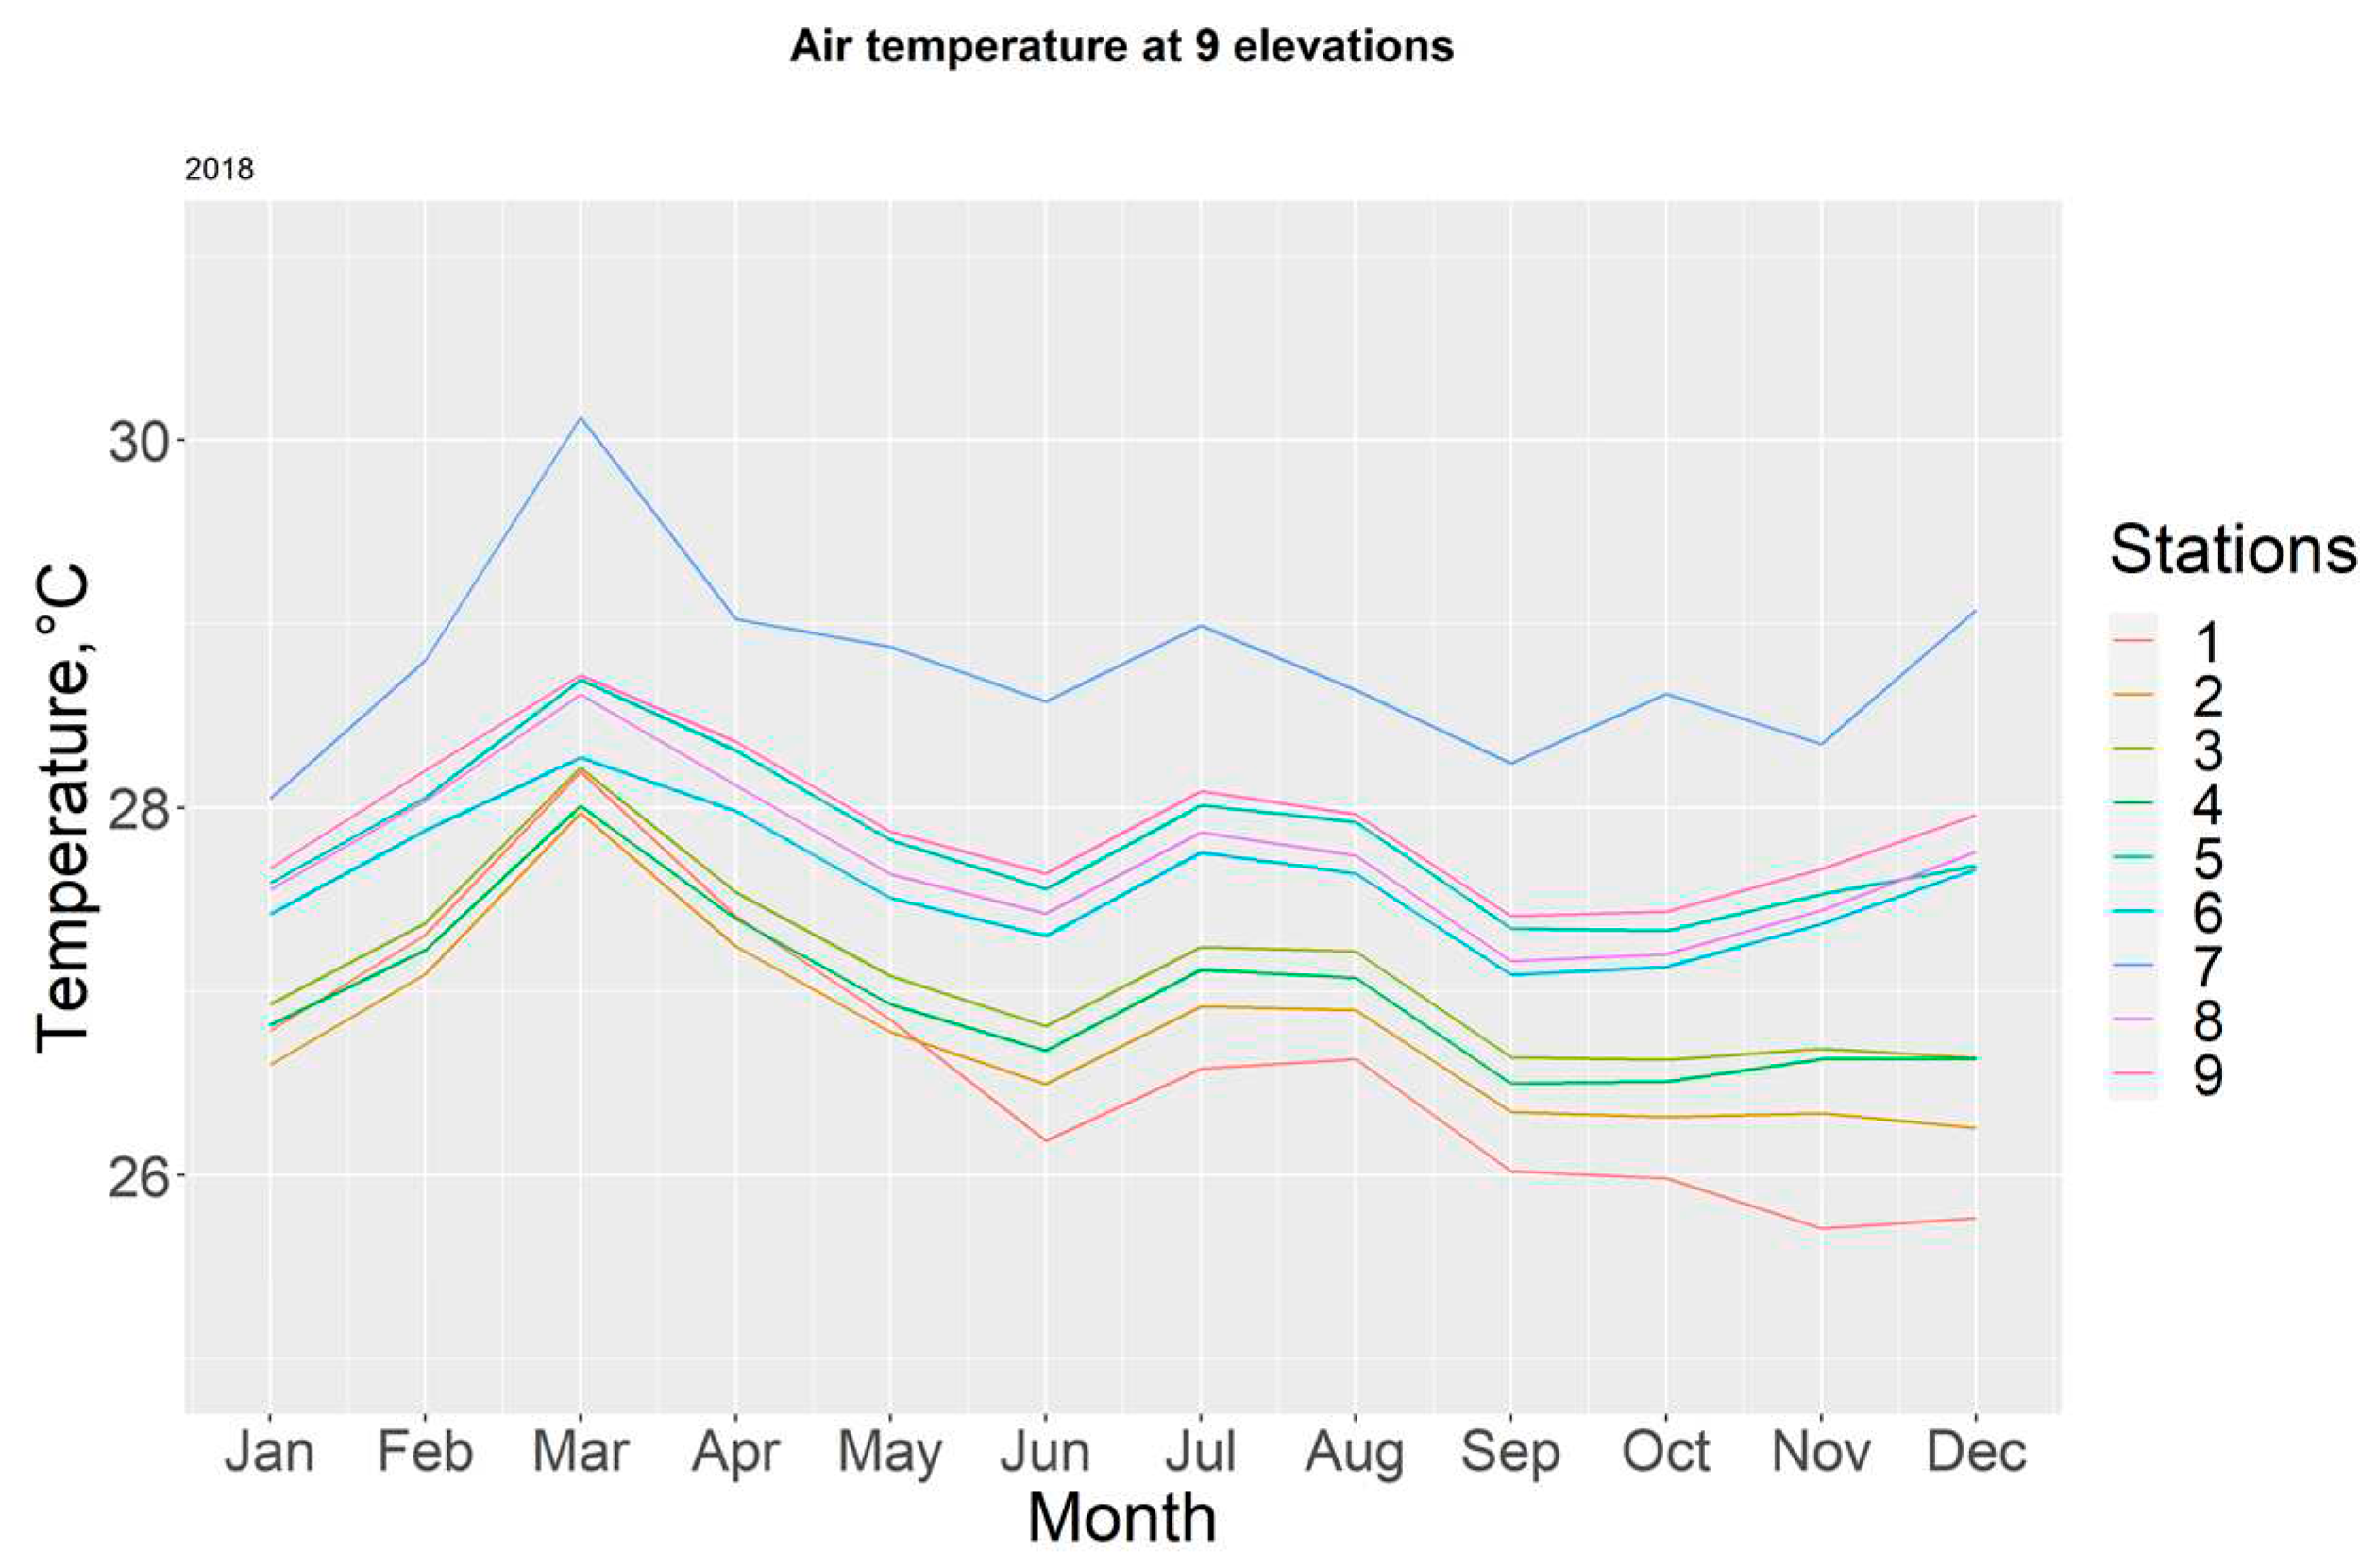
During 2018, the T-7 station registered the highest temperatures, with a maximum of 30.12 (±0.66) °C for the month of March,
Figure 7. The yearly average was calculated at 27.48 ± 0.67°C.
Table 3.
The months of March and October are characterized for outliers on the upper section of the boxplot; however, every other monthly boxplot showed greater elongation compared to its 2017 equivalent, indicating a wider range in temperature variations regardless of the season.
Figure 8.
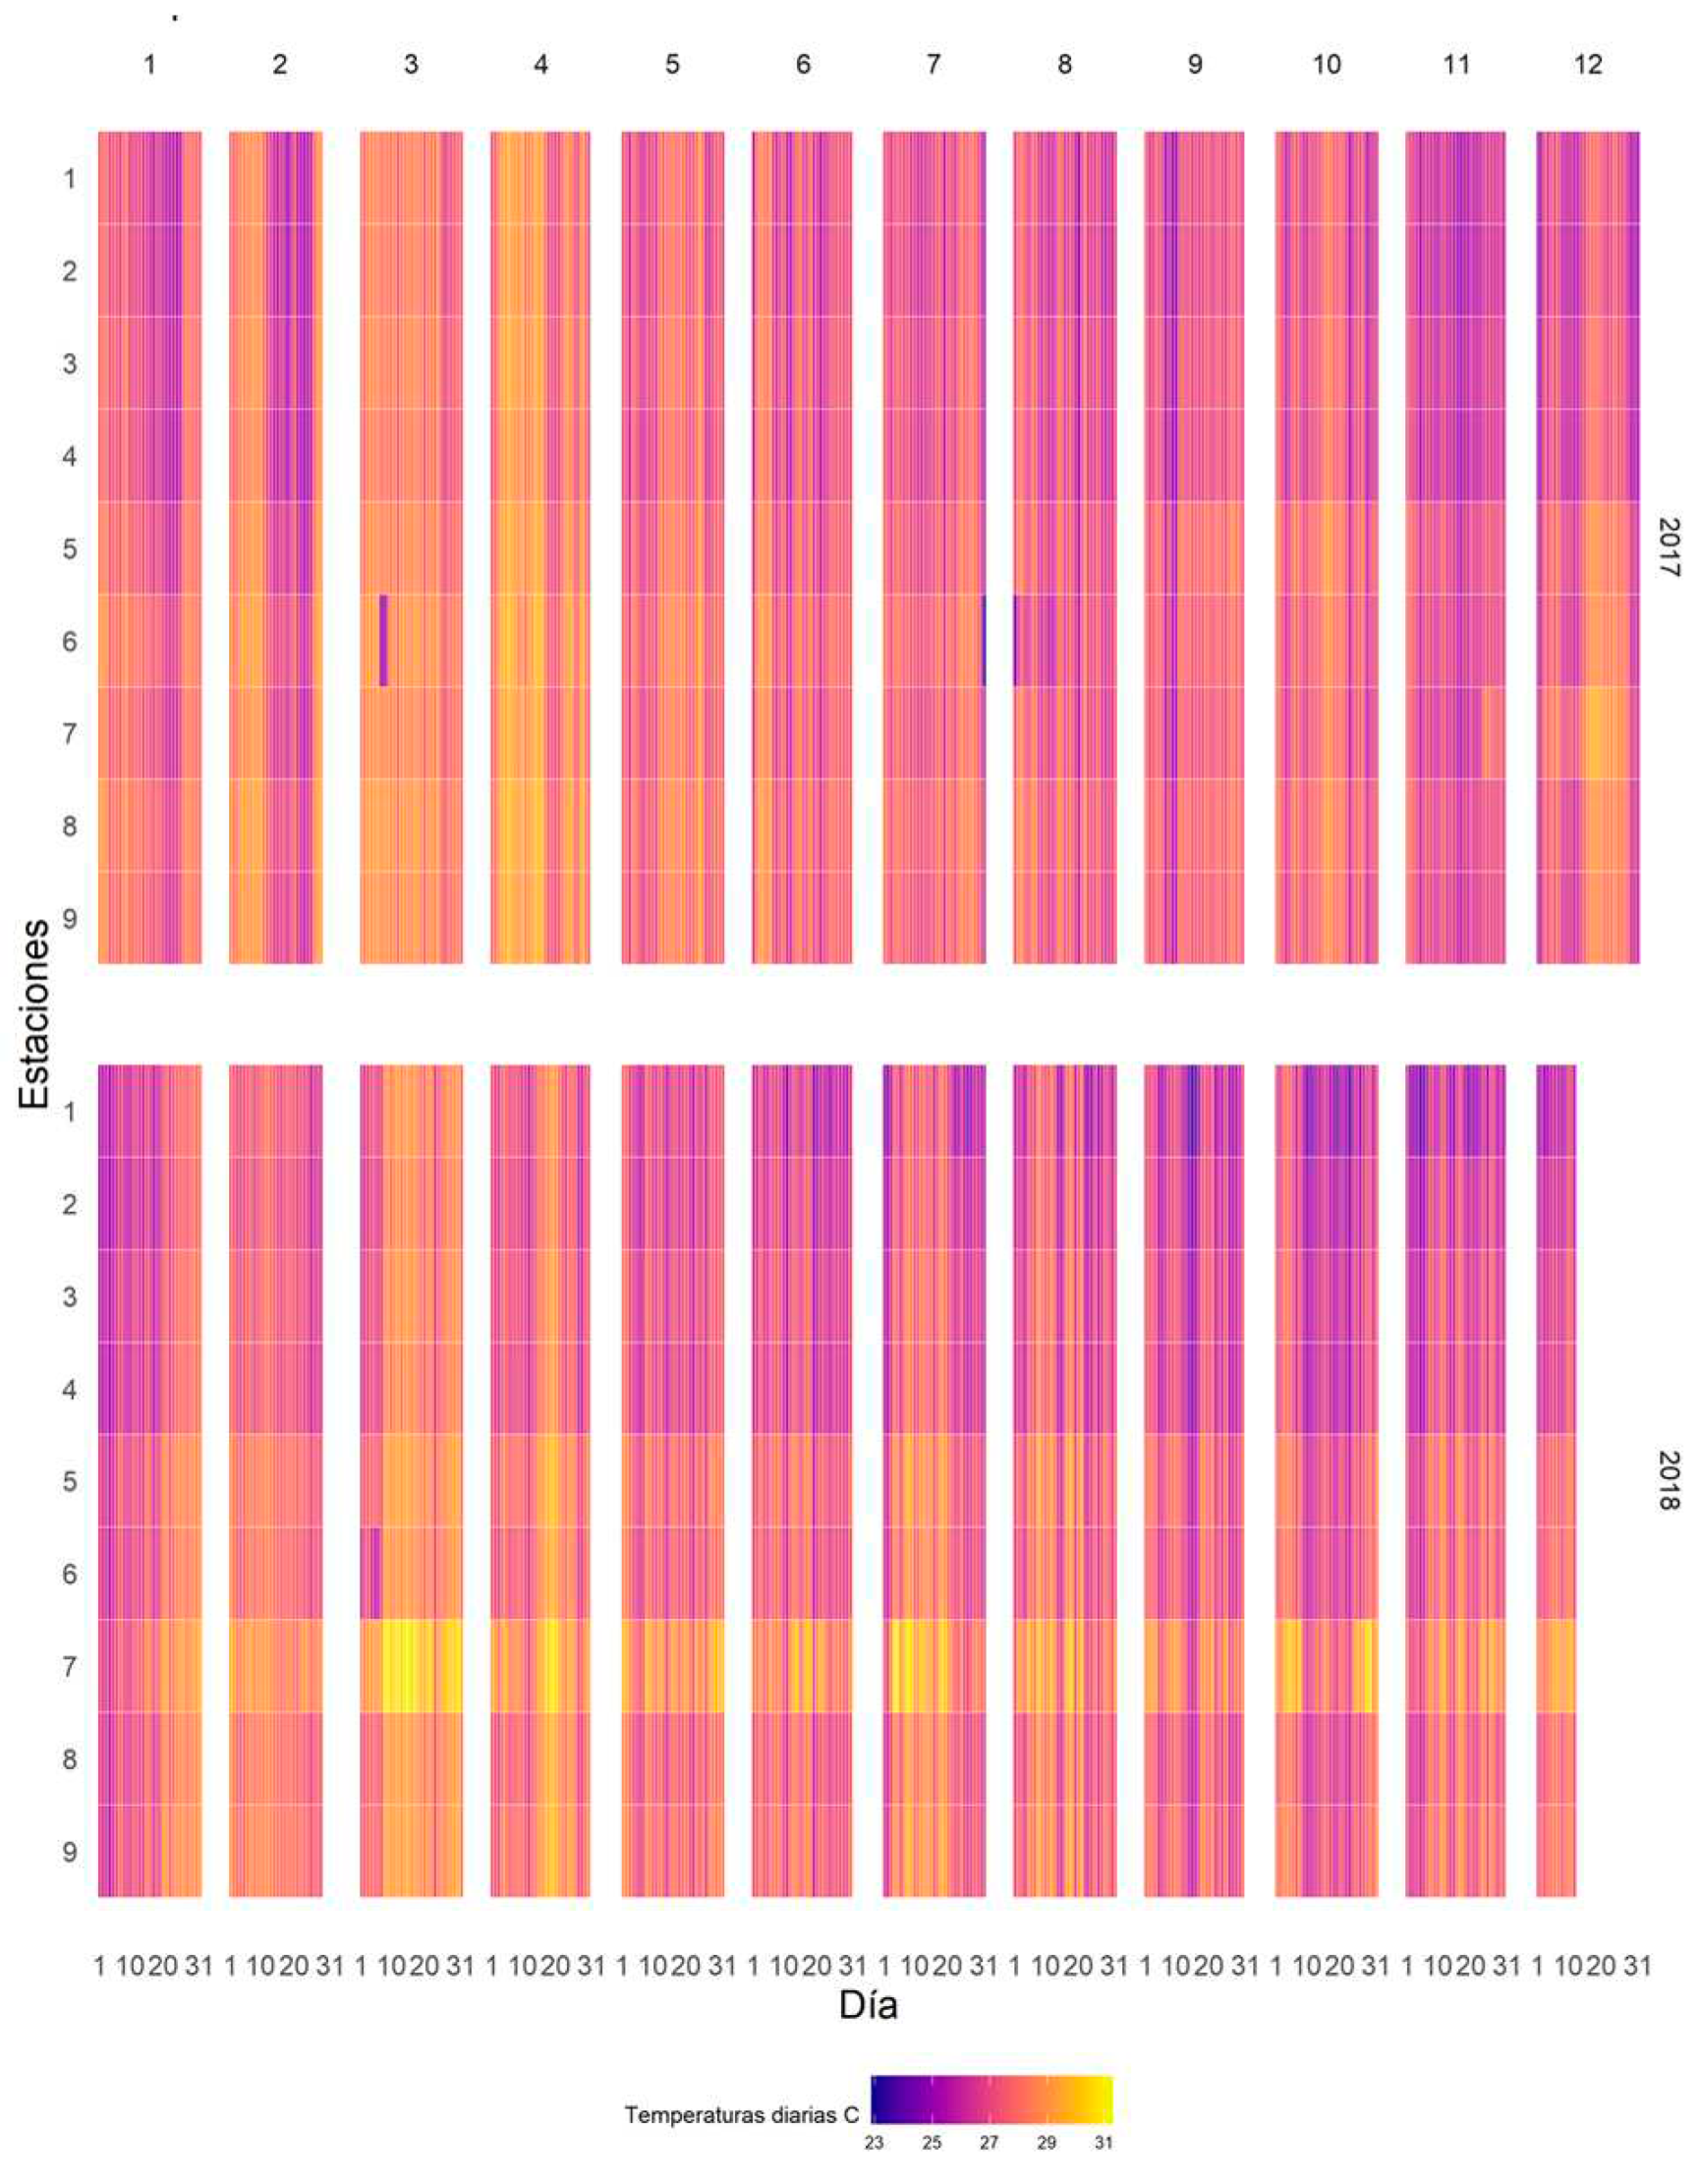
With the heat map it is possible to observe anomalies in the measurements or extreme events. Events.
Figure 9.
3.2. Relative Humidity
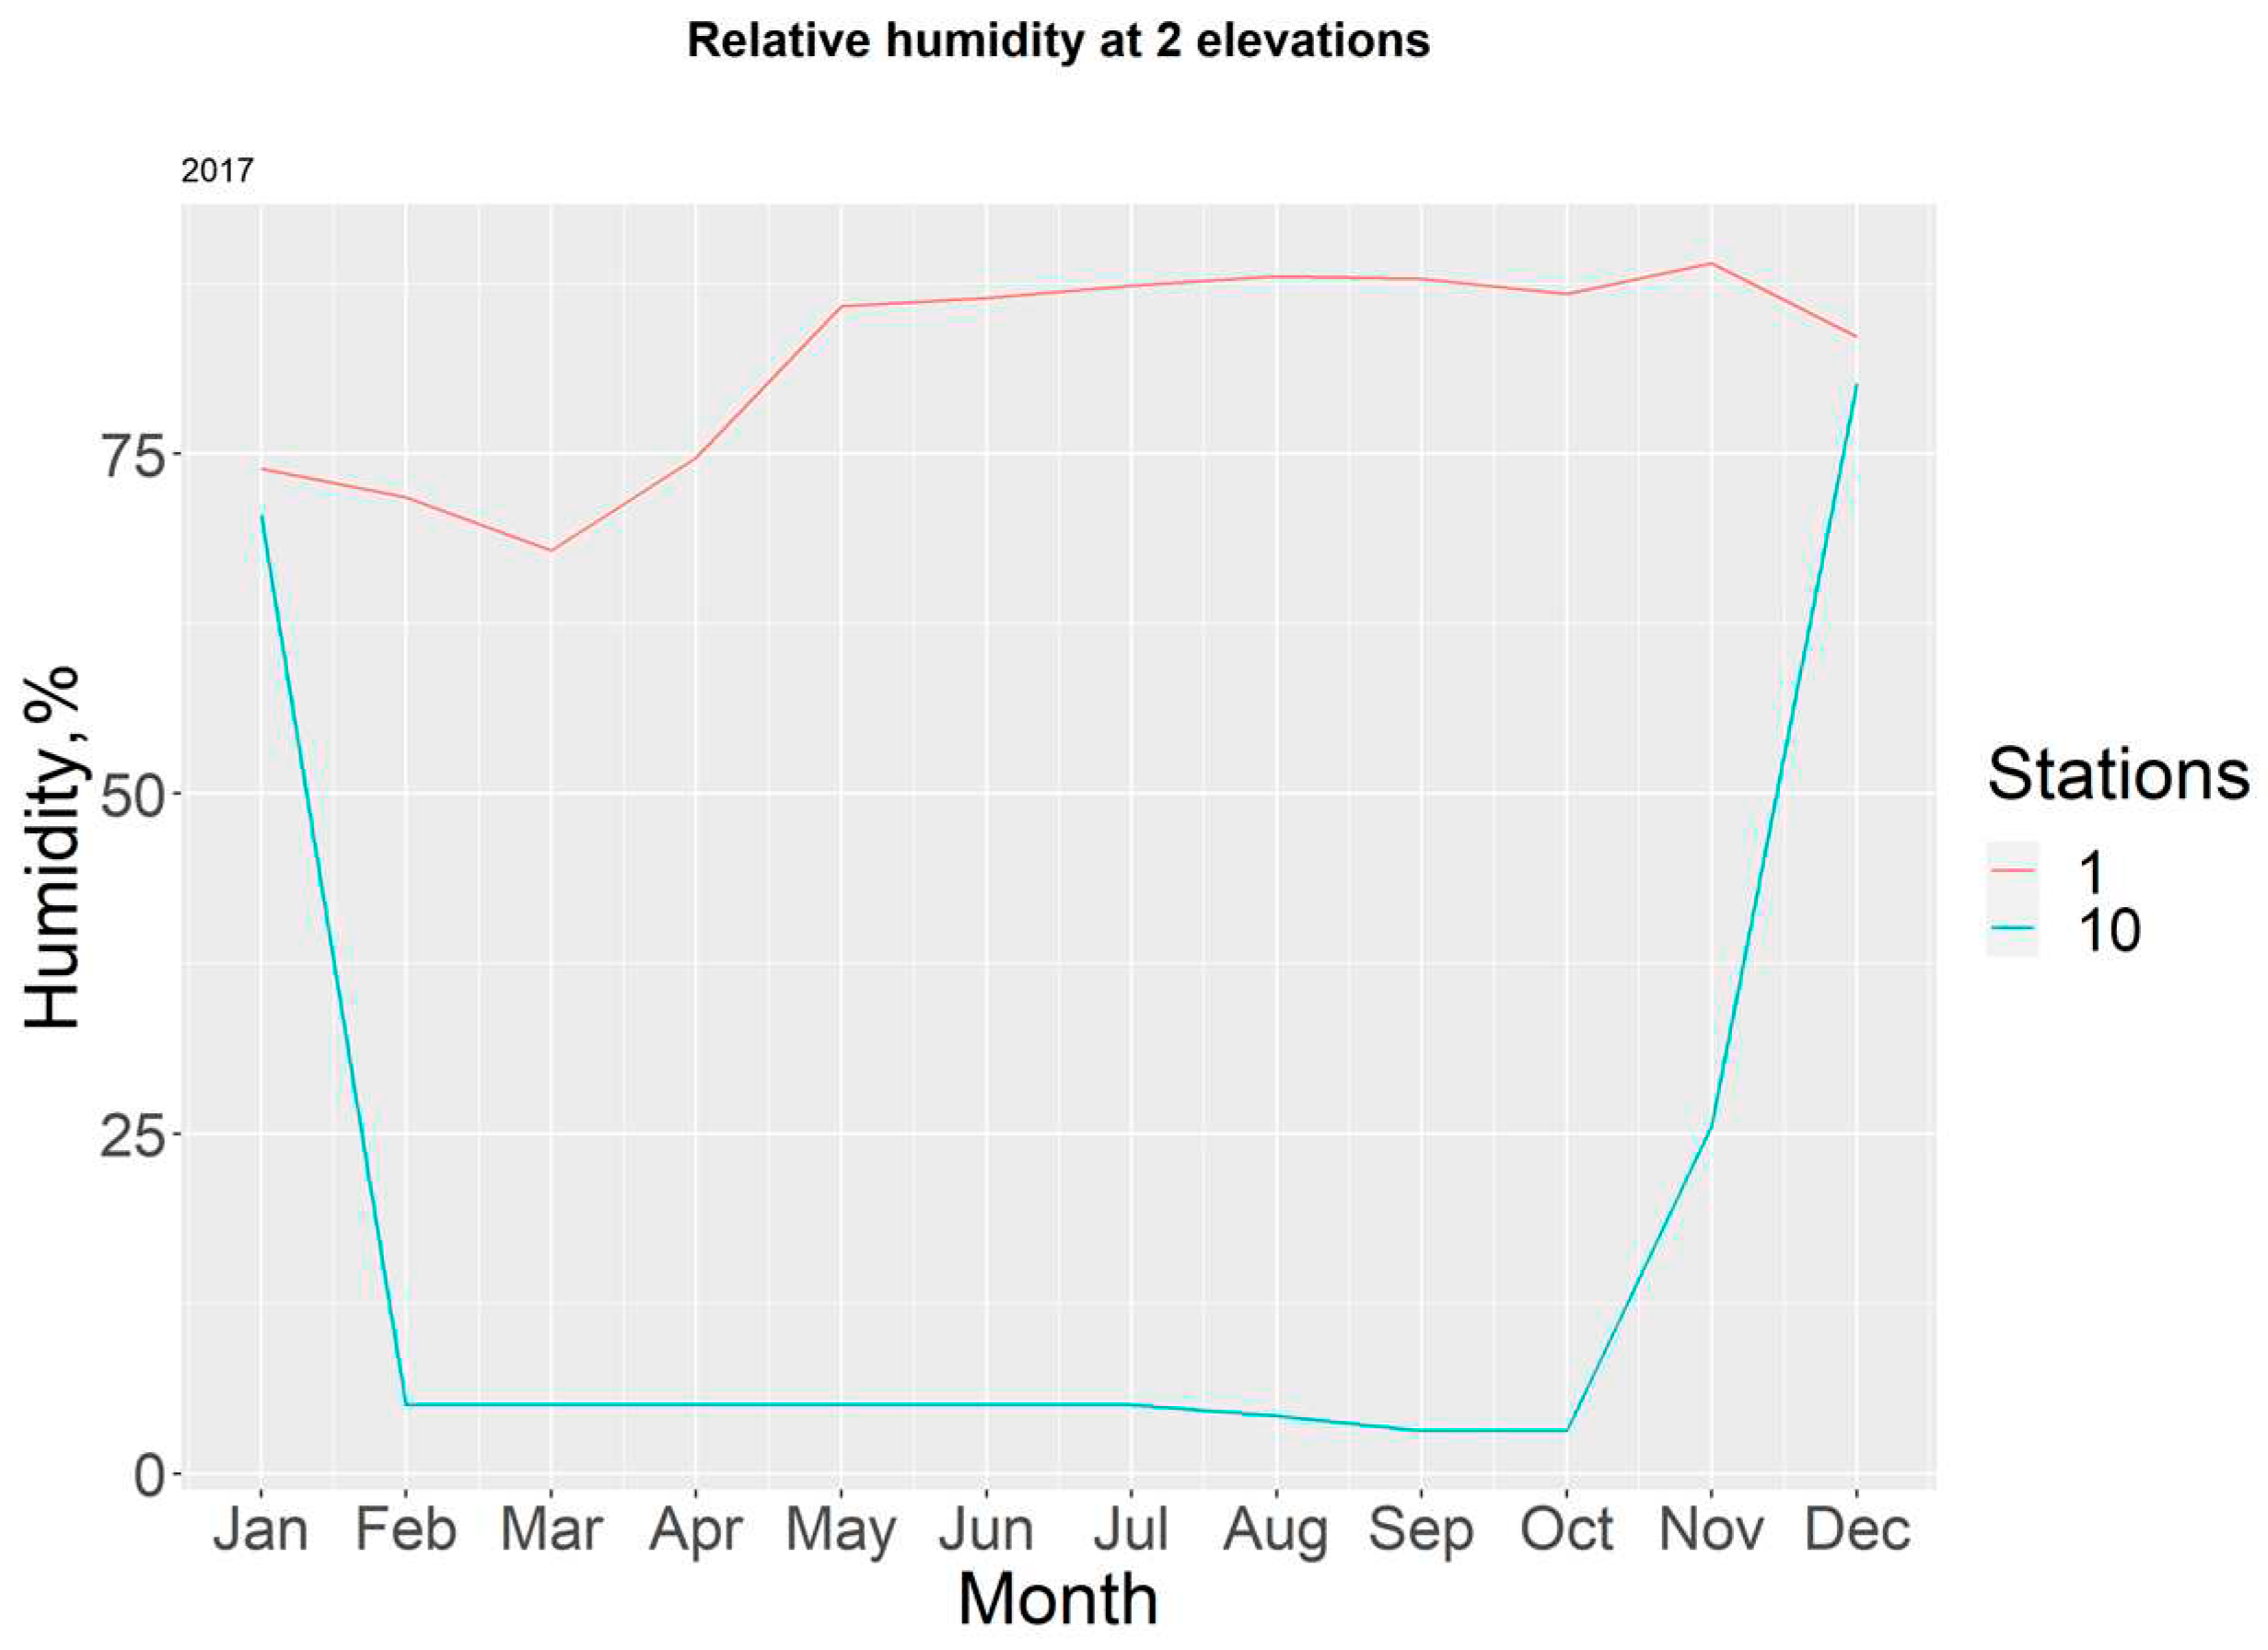
Figure 10 shows that most of the data collected from station T10-H10 during 2017 registered extremely low readings due to the damage caused to the censor. Meanwhile, humidity values for station T1-H1, remained overall high, with values over 75% from May to December.
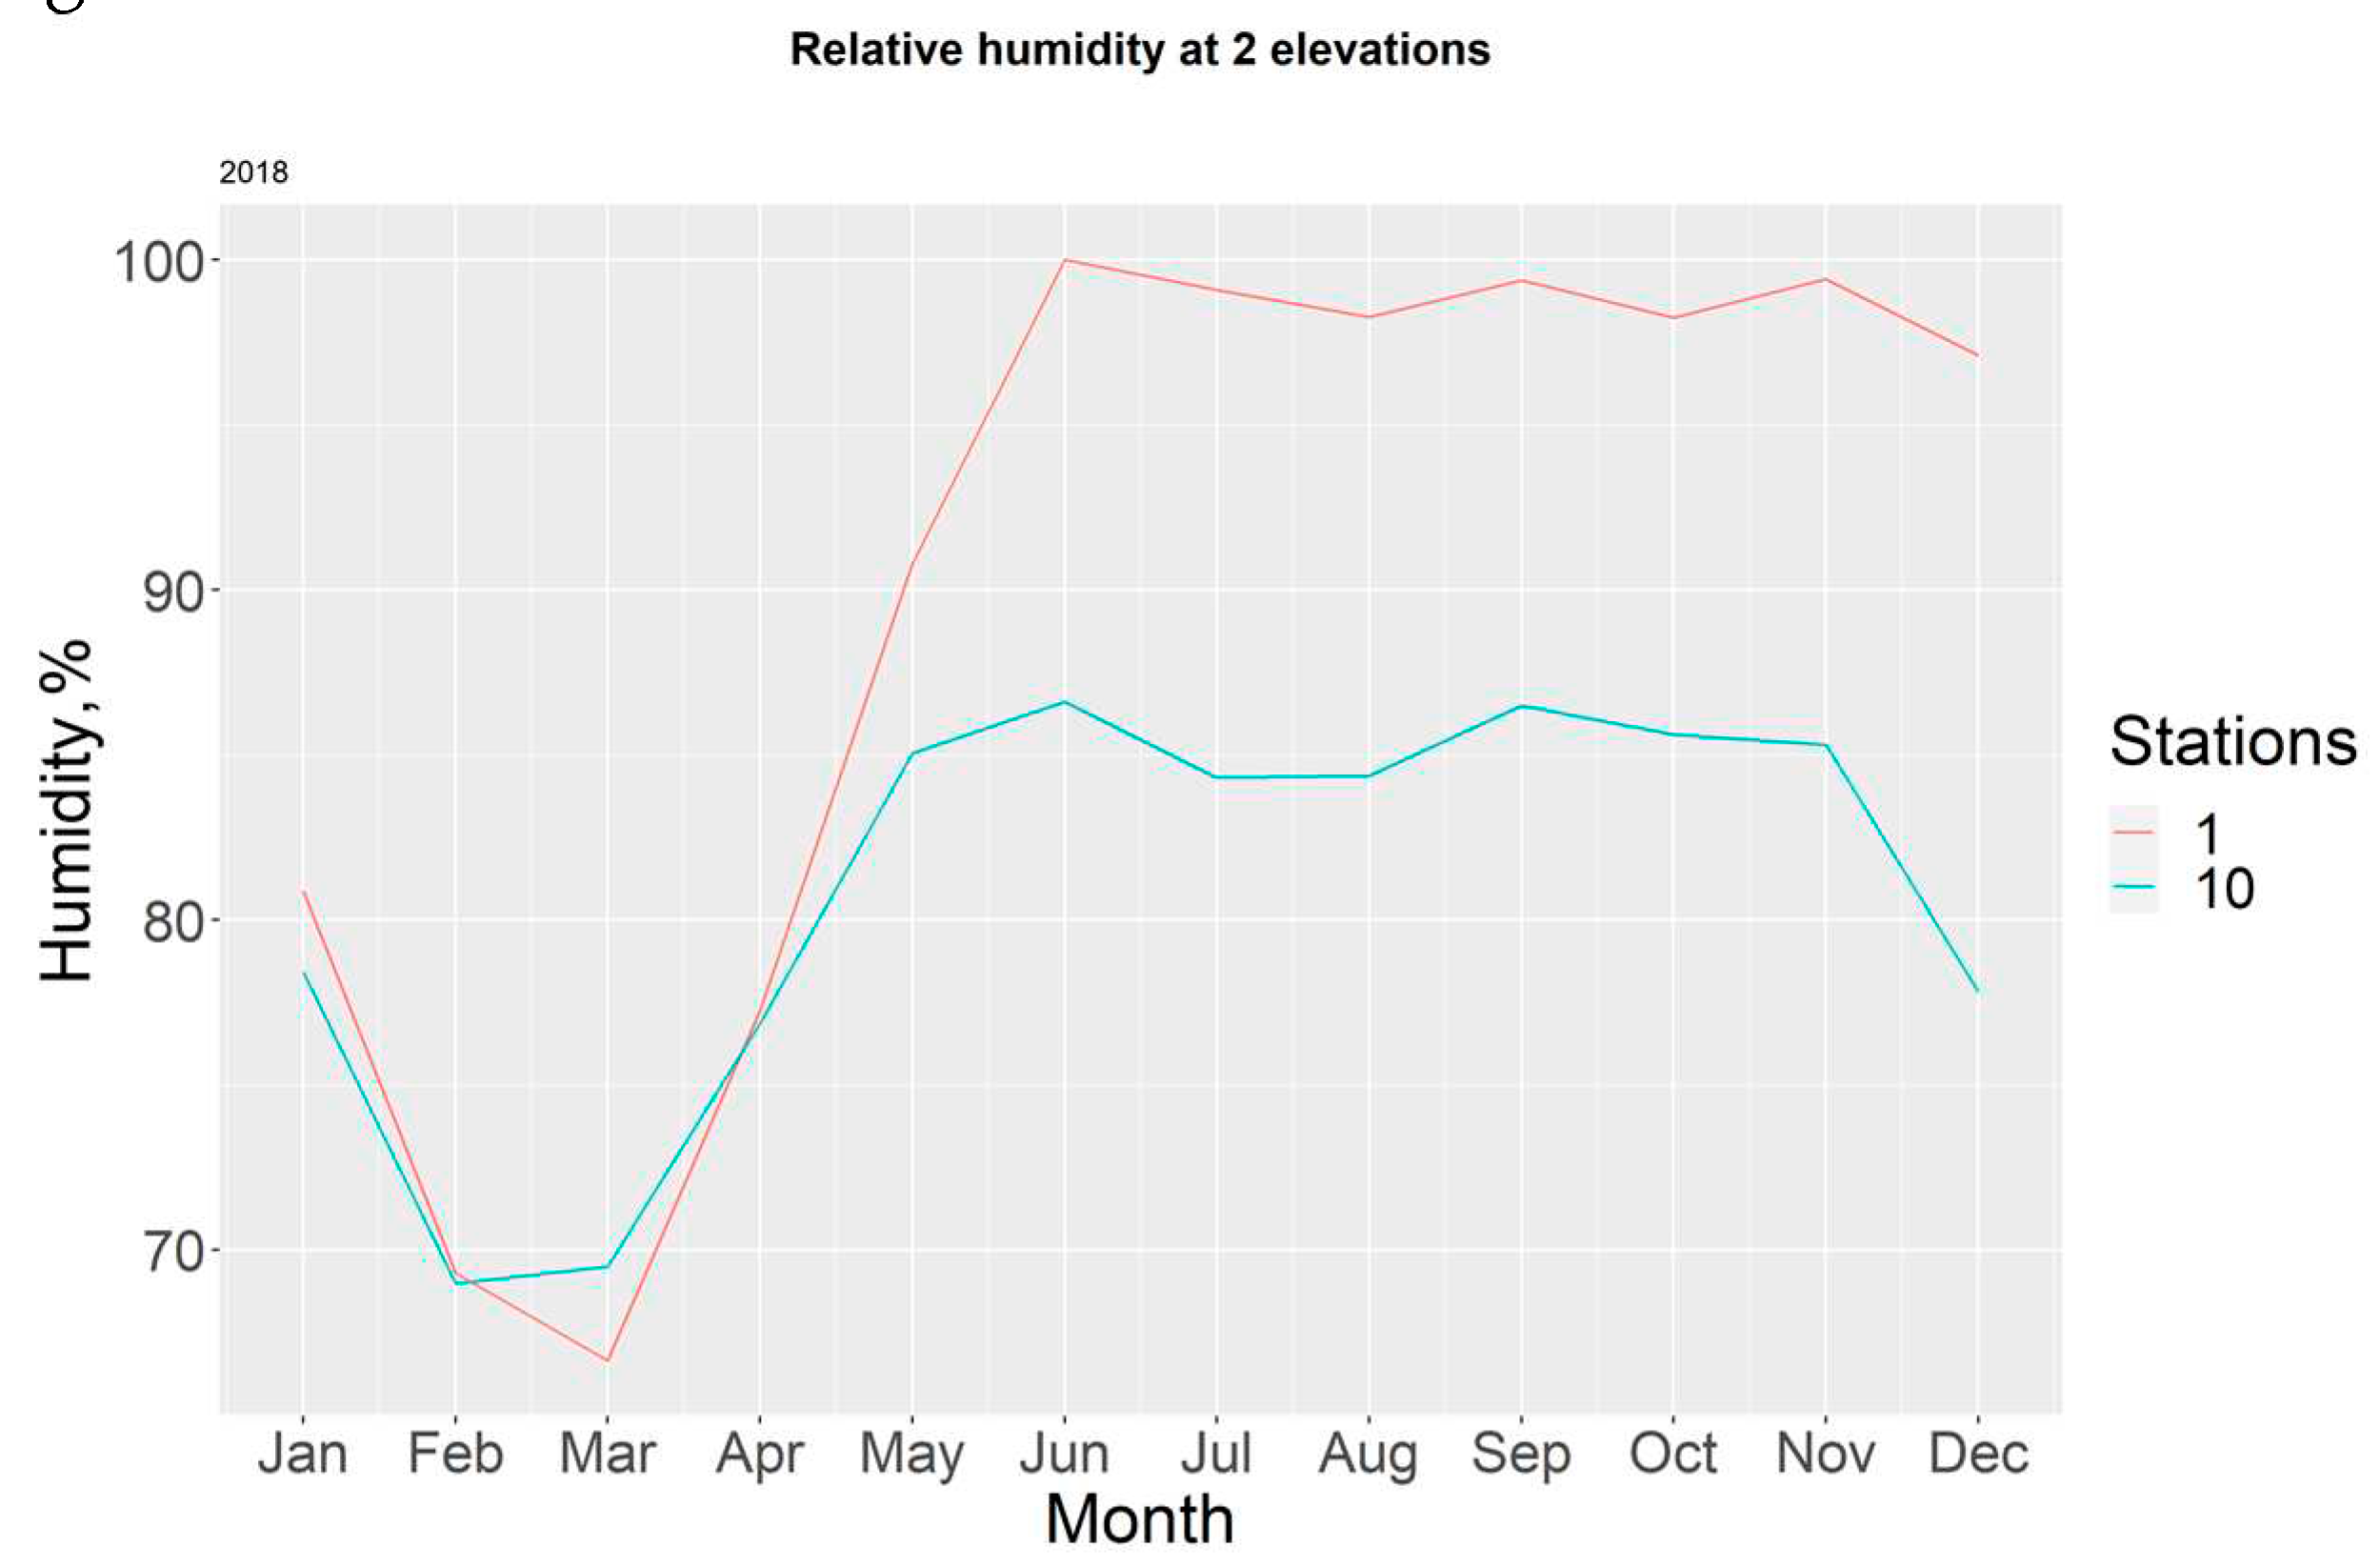
For 2018, it is possible to observe the variations between both stations, which become more noticeable during the dry season, mostly due to the difference in height between both sensors; with T10-H10 being more exposed to direct sunlight, whilst T1-H1 receives partial protection from the canopy shade.
Figure 11.
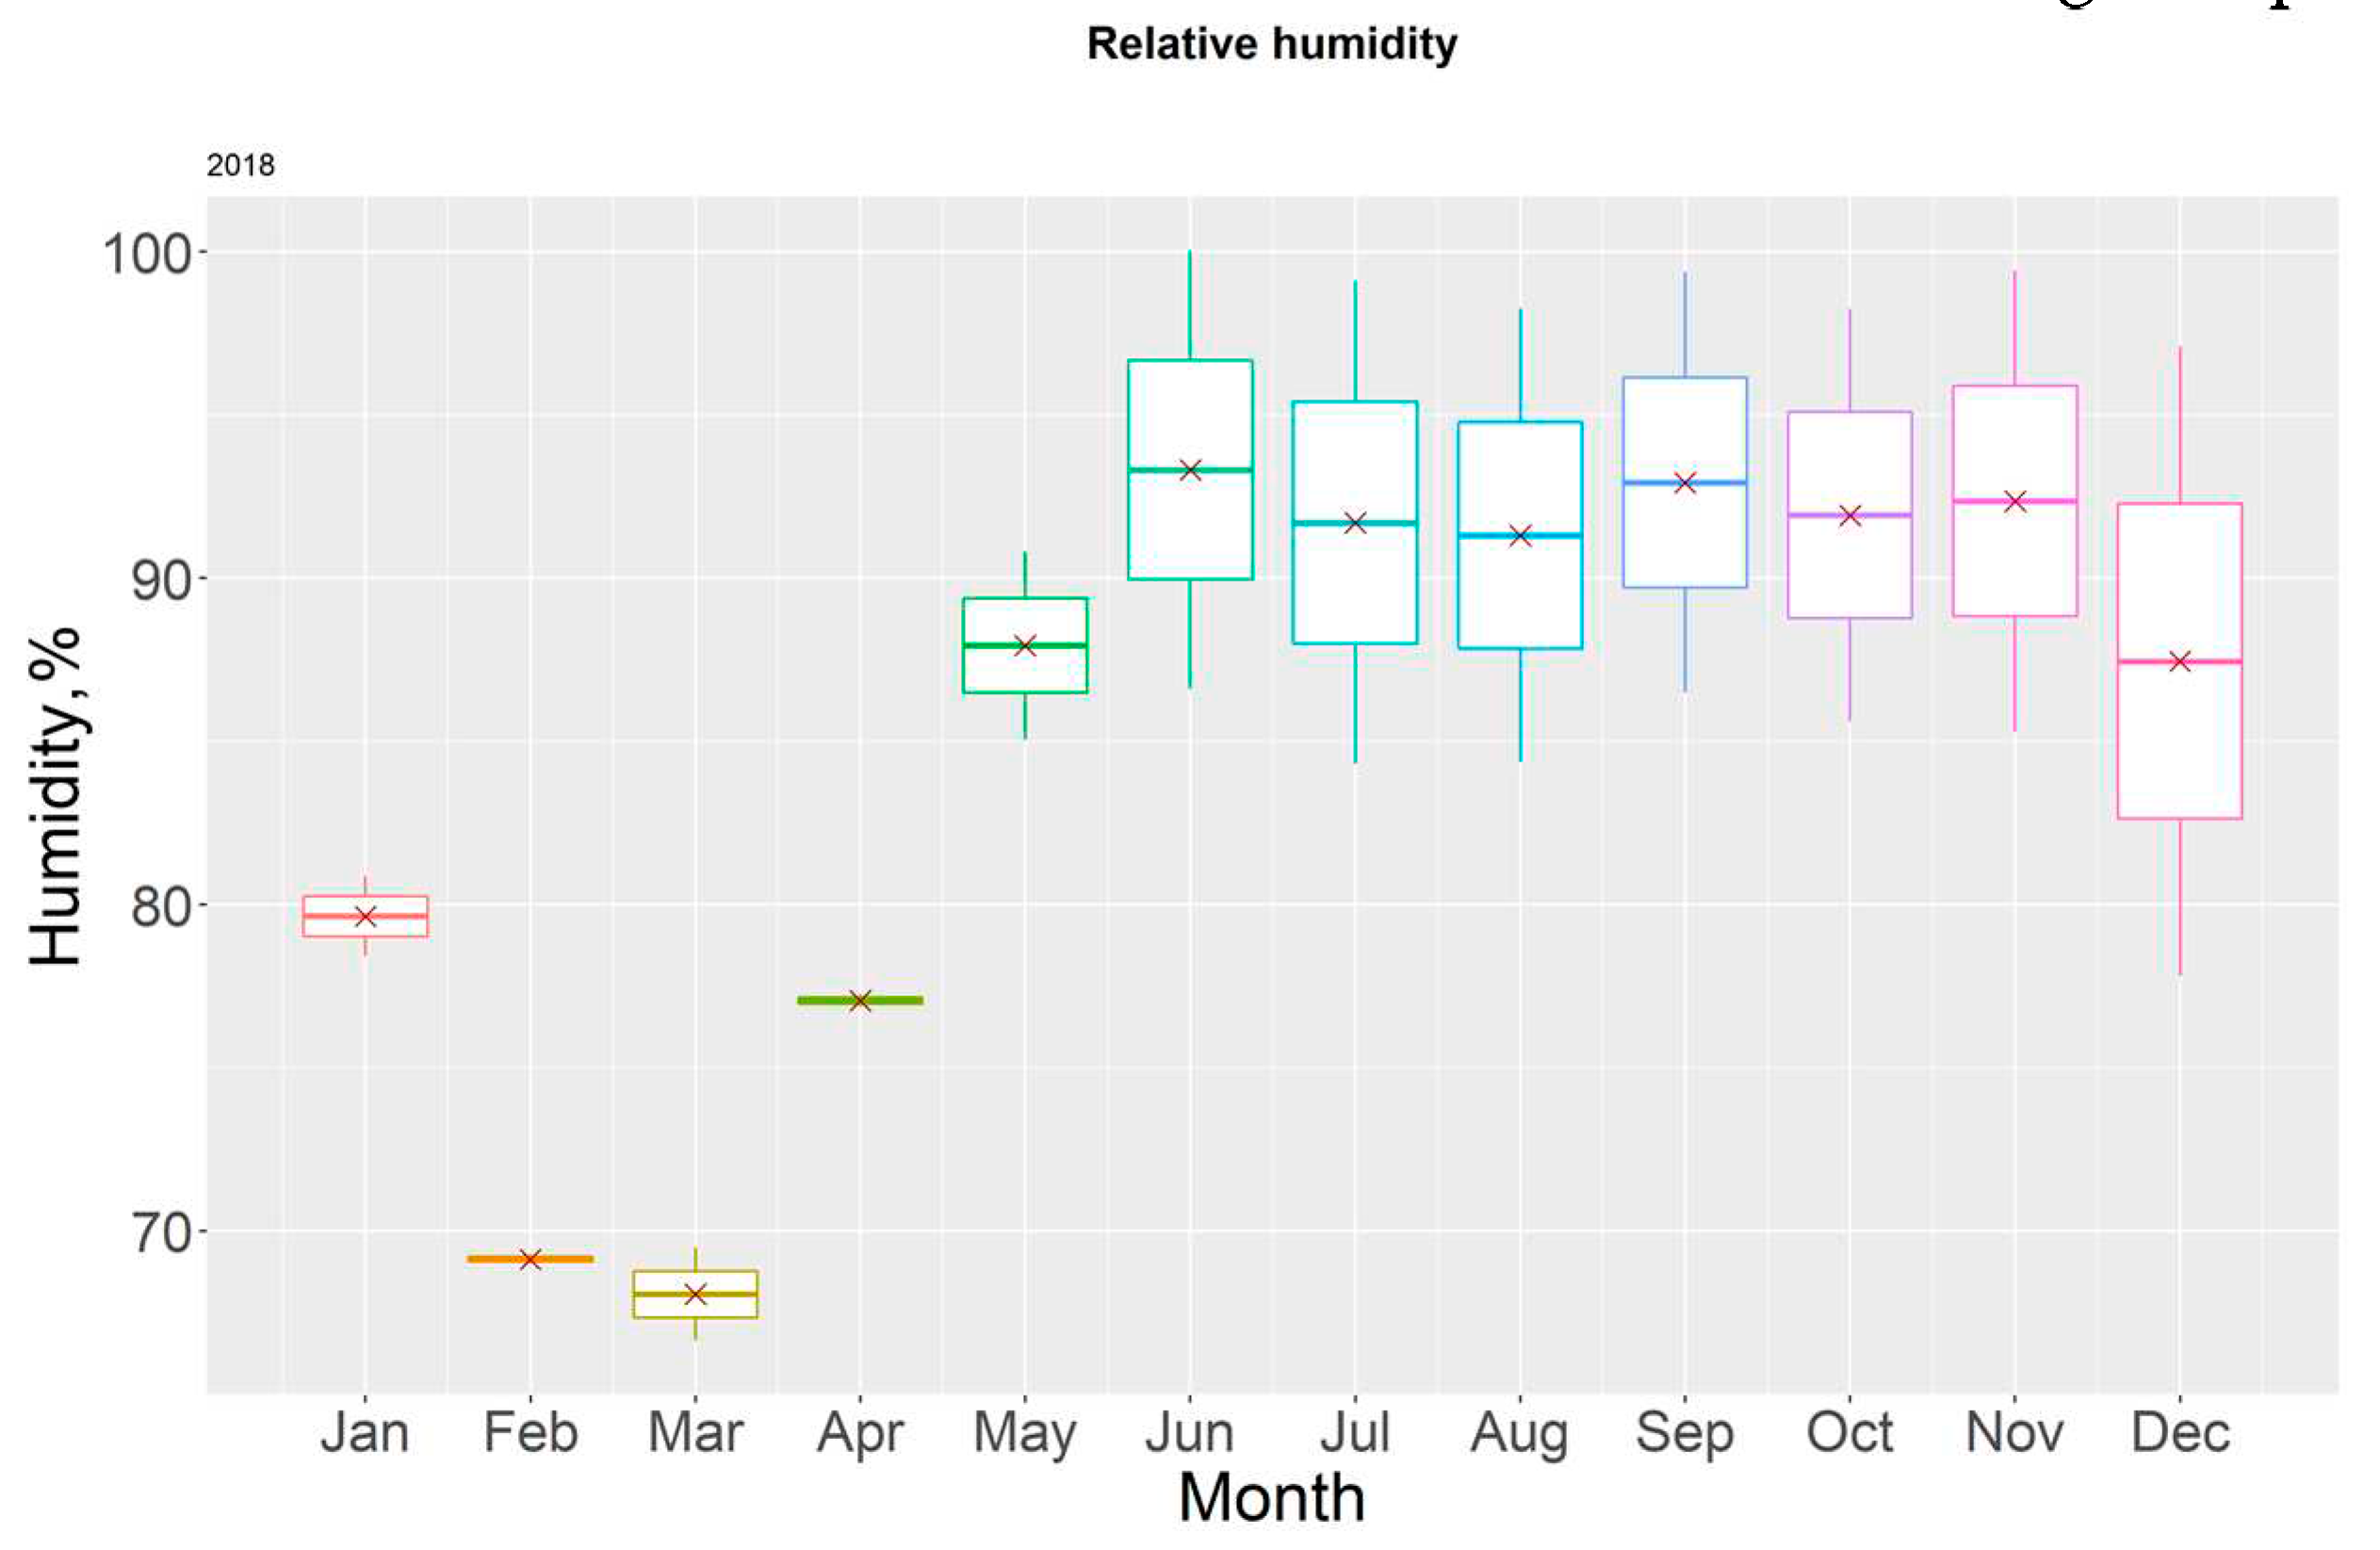
The great amount of oscillation between the recorded values of both stations, as it can be noted in
Table 4 and
Figure 12 becomes more noticeable from the month of May onwards. We attributed these changes to variations in other factors such as rainfall, wind, and sunlight exposure.
3.3. Linear fitting
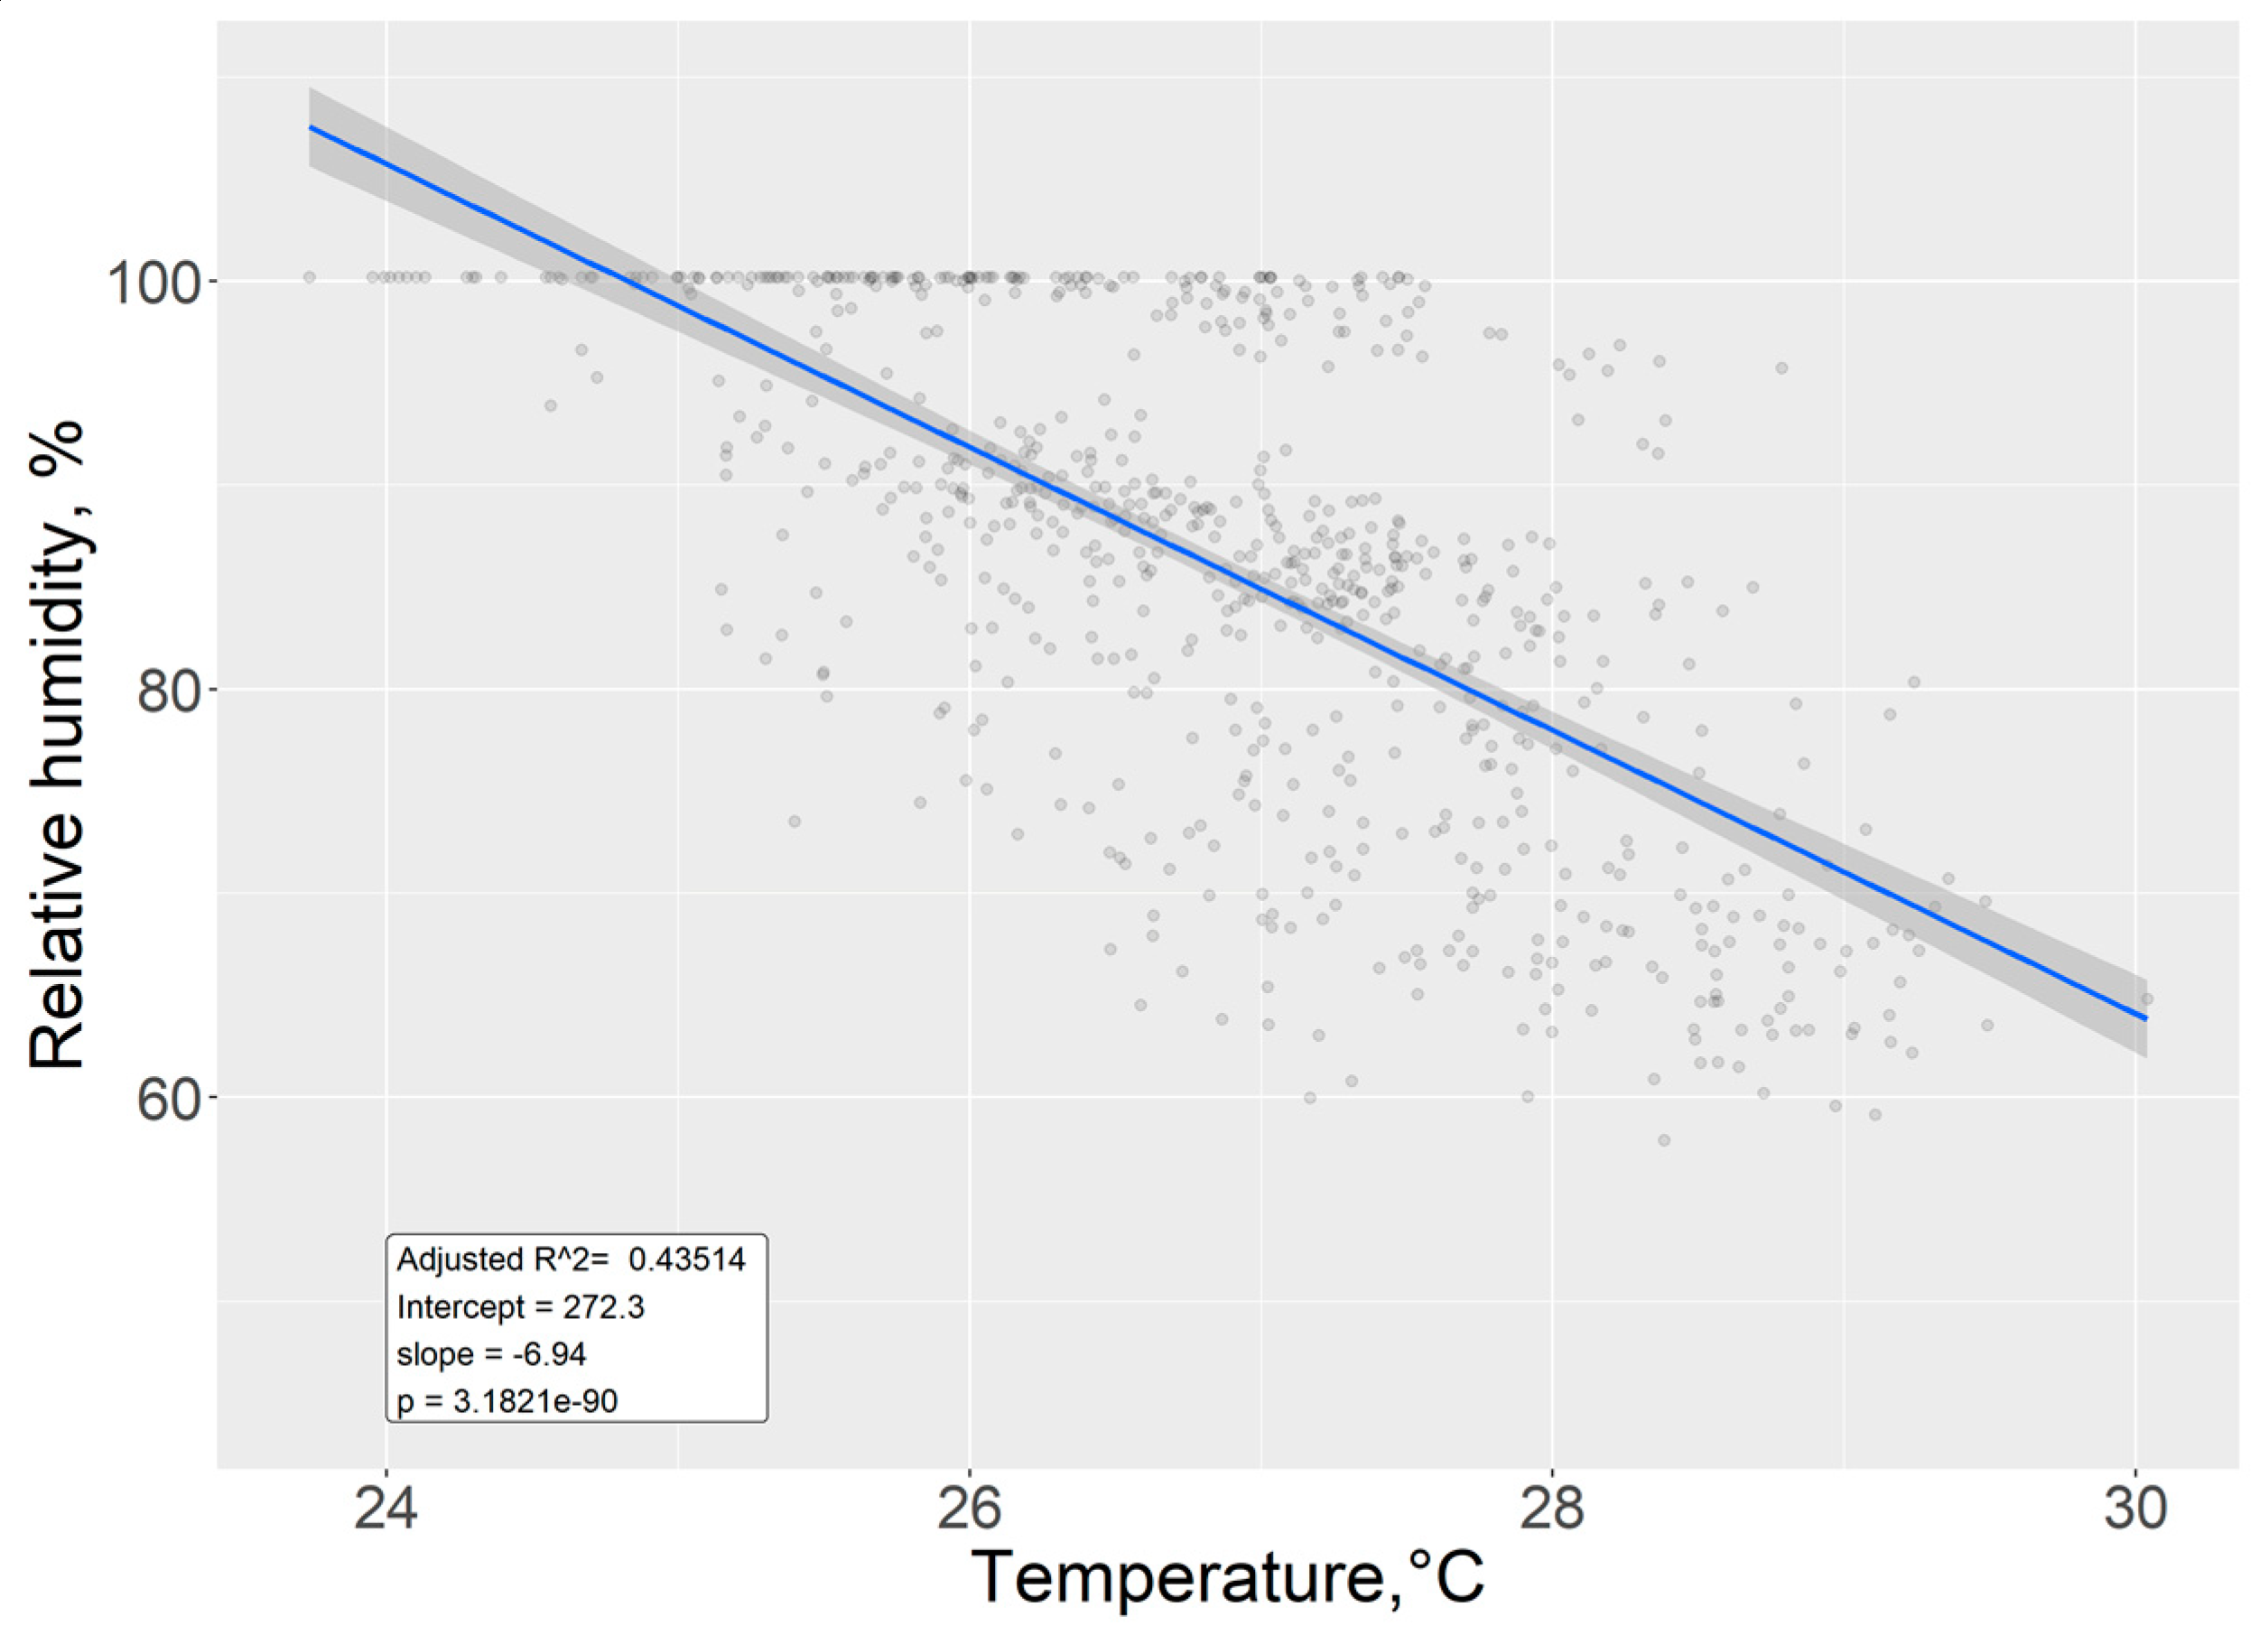
We determined that an intermediate negative correlation (r
2 = 0.43) exists between relative humidity and air temperature, with an estimated 6.94 (± 0.30) unitary decrease in relative humidity for every unitary increase in temperature. Since the p value is very close to zero (p <2e
-16), we can reject the null hypothesis and thus interpret from this result that the correlation is not due to random occurrences.
Figure 13.
Although
Figure 14 seems to indicate a trend towards a normal distribution and the leverage plot only showcases 3 possible outliers within Cook’s distance, the remaining diagnostic plots (Residuals vs. Fitted and Scale-location plot) do not show proper homoscedasticity; therefore, we cannot ascertain that the output of the model is reliable.
The time series for T1-H1 allows us to visualize that in almost every instance, a rise in temperature values corresponds to a drop in humidity, with only two exceptions occurring (Mar-Apr 2017 and Sep-Oct 2018). Although only graphical methods do not suffice to prove causation, it does serve to signal at a probable degree of correlation between these two and possibly other variables which were not studied in the present experiment.
4. Discussion
We were able to obtain a nearly complete air temperature and relative humidity elevation profile for the studied years. A more comprehensive look at variations in relative humidity was limited in part due to the existence of only two sensors and the damage caused by birds to the T10-H10 probe for most of 2017. We also found a moderate correlation between the studied variables, although the data did not fit our model of choice due to the presence of heteroscedasticity in our diagnostic residual plots. We believe that further modifications to our experiment, including the mathematical transformation of variables into an approximate normal distribution or performing a multivariable fitting with data from other sensors in the tower (anemometers, net radiometers, pluviometers, etc.) could not only yield better, but also more comprehensive results regarding the interactions of these variables with one another and their effect on the ecosystem.
The yearly temperature averages were found to be within the acceptable range for mangrove proliferation and survival. Humidity remained at high levels throughout the year, which is considered normal for these ecosystems, the lowest mean value having been recorder in March 2018 (68.07 ± 2.02%).
The heat map showed cold spots in the station T-6 during the months of March T-6 during the months of March 2017 and 2018 in the first days of the month; this is possibly explained by an out-of-calibration sensor, as no such incidents were observed at other stations used.
Research indicated that the productivity rates of mangrove ecosystems are strongly correlated with temperature, rainfall, and radiation. This suggests that global warming may have a significant impact on these environmental variables as well as other underlying parameters (such as salinity, tidal inundation patterns, etc.), potentially reducing the ability of these tropical Indian mangroves to sequester carbon.[
40]
Similar to this, rising temperatures are anticipated to cause drought stress in Brazil's large mangrove forests based on climatic models and decadal climate patterns [
41].
Temperature fluctuations can affect the growth and species composition of mangroves. Indeed, temperature is one of the primary ecological forces at work throughout the world, and the low annual mean air temperature is a significant constraint on the structure and productivity of Neotropical mangroves.[
42]
Utilizing litter traps to gather litterfall, phenological research on mangrove ecosystems revealed that mature fruit fall was impacted by relative humidity.[
43]
Due to the ecological and economic importance of the Bahía de Panamá wetland, we encourage further research on this and other mangroves in the region. Said research efforts, we believe should be focused towards evaluating mechanisms such as stomatal response and carbon fluxes, which are sensitive to changes in environmental factors such as salinity, humidity, and temperature.
Author Contributions
Conceptualization, C.G., and R.P.; methodology, C.G. and R.P.; software, C.G.; validation, C.G., and R.P.; formal analysis, C.G.; investigation, C.G. and R.P.; resources, R.P.; writing—original draft preparation, C.G.; writing—review and editing, R.P.; visualization, C.G.; supervision, R.P.; project administration, R.P.; funding acquisition, R.P. All authors have read and agreed to the published version of the manuscript.
Funding
This research was funded by project no. FID2016–30, the funding for which was provided by the Secretaría Nacional de Ciencia, Tecnología e Innovación (SENACYT in Spanish) to RP and through the Sistema Nacional de Investigación (SNI) of SENACYT. The APC was covered by R.P. SNI funds (Contract No. 27-2022).
Data Availability Statement
The data presented in this study are available on request from the corresponding author.
Acknowledgments
We thank the personnel of the CIHH of Universidad Tecnológica de Panamá for their technical assistance. In particular, Dr. Nathalia Tejedor, MSc. Ana Franco, MSC. Jaime González, and Mr. Daniel Nieto. Also, authors acknowledge the Programa de Saneamiento de Panamá of Ministerio de Salud (MINSA) of Panamá for allows to access at mangrove area where the covariance tower is located and to the Servicio Nacional Aereonaval (SENAN) of Panama for keep our security during the field works. Thank to Mister Juan Medina (ORCID ID: 0000-0002-8137-4017) for his support and contributions.
Conflicts of Interest
The authors declare no conflict of interest. The funders had no role in the design of the study; in the collection, analyses, or interpretation of data; in the writing of the manuscript; or in the decision to publish the results.
References
- Agraz Hernández, C., Noriega Trejo, R., López Portillo, J., & Flores Verdugo, F. J. (2006). Guía de Campo. Identificación de los Manglares en México (Universidad Autónoma de Campeche, Ed.). Retrieved from http://etzna.uacam.mx/epomex/pdf/Guia_Manglar.pdf.
- Cárdenas-Castillero, G. (2018). Entorno Socio-Ambiental y Calidad de Agua del Área Protegida Humedal Bahía de Panamá (1.st ed.). Ciudad de Panamá, República de Panamá: Centro de Incidencia Ambiental de Panamá; Fundación David y Lucile Packard.
- Spalding, M., Blasco, F., & Field, C. (1997). World mangrove atlas (1.st ed.; M. Spalding, F. Blasco, & C. Field, Eds.). Retrieved from http://www.environmentalunit.com/Documentation/04 Resources at Risk/World mangrove atlas.pdf.
- Spalding, M. , Kainuma, M., & Lorna, C. (2011). Atlas Mundial de los Manglares (2.nd ed.). Londres, Okinawa: Organización Internacional de las Maderas Tropicales (OIMT); Sociedad Internacional para los Ecosistemas de Manglares (SIEM).
- Benitez, L. A., & Segovia, E. A. (2003). Estructura Y Composición Floristica De La Vegetación Nuclear Del Manglar De La Bahía De La Unión, Departamento De La Unión, El Salvador (Universidad de El Salvador). Retrieved from http://ri.ues.edu.sv/id/eprint/8620/1/19200566.pdf.
- Cahoon, D. R. , Hensel, P. F., Spencer, T., Reed, D. J., McKee, K. L., & Saintilan, N. (2006). Coastal Wetland Vulnerability to Relative Sea-Level Rise: Wetland Elevation Trends and Process Controls. In J. T.. Verhoeven, B. Beltman, R. Robbink, & D. F. Whigham (Eds.), Wetlands and Natural Resource Management (1.st ed., pp. 271–292). [CrossRef]
- Cahoon, D. R., & Lynch, J. C. (1997). Vertical accretion and shallow subsidence in a mangrove forest of southwestern Florida, U.S.A. Mangroves and Salt Marshes, 1(3), 173–186. [CrossRef]
- Mckee, K. L., Cahoon, D. R., & Feller, I. C. (2007). Caribbean mangroves adjust to rising sea level through biotic controls on change in soil elevation. Global Ecology and Biogeography, 16(5), 545–556. [CrossRef]
- Bouillon, S. (2011). Storage beneath mangroves. Nature Geoscience, 4(5), 282–283. [CrossRef]
- Donato, D. C. , Kauffman, J. B., Murdiyarso, D., Kurnianto, S., Stidham, M., & Kanninen, M. (2011). Mangroves among the most carbon-rich forests in the tropics. Nature Geoscience, 4(5), 293–297. [CrossRef]
- Fourqurean, J. W., Duarte, C. M., Kennedy, H., Marbà, N., Holmer, M., Mateo, M. A., … Serrano, O. (2012). Seagrass ecosystems as a globally significant carbon stock. Nature Geoscience, 5(7), 505–509. [CrossRef]
- Silveira, J. A. H., Rico, A. C., Pech, E., Pech, M., Ramírez, J., & Teutli, C. (2015). Dinámica del carbono (almacenes y flujos) en manglares de México. Terra Latinoamericana, 34(1), 61–72. Retrieved from http://www.scielo.org.mx/pdf/tl/v34n1/2395-8030-tl-34-01-00061.pdf.
- Silveira, J. A. H., & Hernández, C. T. (2017). Carbono azul, manglares y políticas públicas. Elementos Para Políticas Públicas, 1(1), 43–52. Retrieved from http://www.elementospolipub.org/ojs/index.php/epp/article/view/4/4.
- Nellemann, C., Corcoran, E., Duarte, C. M., Valdés, L., De Young, C., Fonseca, L., & Grimsditch, G. (2009). Blue carbon: A Rapid Response Assessment. Retrieved from http://www.grida.no/files/publications/blue-carbon/BlueCarbon_screen.pdf.
- Matsui, N. (1998). Estimated stocks of organic carbon in mangrove roots and sediments in Hinchinbrook Channel, Australia. Mangroves and Salt Marshes, 2(4), 199–204. [CrossRef]
- Alongi, D. (2009). The Energetics of Mangrove Forests. In The Energetics of Mangrove Forests (1.st ed.). [CrossRef]
- Duarte, C. M., & Cebrián, J. (1996). The fate of marine autotrophic production. Limnology and Oceanography, 41(8), 1758–1766. [CrossRef]
- Jennerjahn, T. C., & Ittekkot, V. (2002). Relevance of mangroves for the production and deposition of organic matter along tropical continental margins. Naturwissenschaften, 89(1), 23–30. [CrossRef]
- Twilley, R. R. , Chen, R. H., & Hargis, T. (1992). Carbon sinks in mangroves and their implications to carbon budget of tropical coastal ecosystems. Water, Air, & Soil Pollution, 64(1–2), 265–288. [CrossRef]
- Dittmar, T., Hertkorn, N., Kattner, G., & Lara, R. J. (2006). Mangroves, a major source of dissolved organic carbon to the oceans. Global Biogeochemical Cycles, 20(1), 1–7. [CrossRef]
- Kristensen, E. , Bouillon, S., Dittmar, T., & Marchand, C. (2008). Organic carbon dynamics in mangrove ecosystems: A review. Aquatic Botany, 89(2), 201–219. [CrossRef]
- ANAM-ARAP] Autoriad Nacional del Ambiente y Autoridad de los Recursos Acuáticos de Panamá. (2013). Manglares de Panamá: importancia, mejores prácticas y regulaciones vigentes (1.st ed.; A. Tarté, Ed.). Retrieved from https://lac.wetlands.org/publicacion/manglares-de-panama-importancia-mejores-practicas-y-regulaciones-vigentes/.
- López-Angarita, J. , Roberts, C. M., Tilley, A., Hawkins, J. P., & Cooke, R. G. (2016). Mangroves and people: Lessons from a history of use and abuse in four Latin American countries. Forest Ecology and Management, 368(40), 151–162. [CrossRef]
- Thampanya, U., Vermaat, J. E., Sinsakul, S., & Panapitukkul, N. (2006). Coastal erosion and mangrove progradation of Southern Thailand. Estuarine, Coastal and Shelf Science, 68(1), 75–85. [CrossRef]
- IPCC [Panel Intergubernamental del Cambio Climático]. (2014). Climate Change 2014: Sythesis Report. Contribution of Work Groups I, II and III to the Fifth Assessment Report of the Intergovernmental Panel on Climate Change. Retrieved from https://archive.ipcc.ch/pdf/assessment-report/ar5/syr/SYR_AR5_FINAL_full_wcover.pdf.
- Grinsted, A., Moore, J. C., & Jevrejeva, S. (2010). Reconstructing sea level from paleo and projected temperatures 200 to 2100 AD. Climate Dynamics, 34(4), 461–472. [CrossRef]
- Gilman, E. L. , Ellison, J., Duke, N. C., & Field, C. (2008). Threats to mangroves from climate change and adaptation options: A review. Aquatic Botany, 89(2), 237–250. [CrossRef]
- Duke, N. C., Ball, M. C., & Ellison, J. C. (1998). Factors influencing biodiversity and distributional gradients in mangroves. Global Ecology and Biogeography Letters, 7(1), 27–47. [CrossRef]
- Ellison, J. C. (2000). How South Pacific Mangroves May Respond to Predicted Climate Change and Sea-level Rise. In A. Gillespie & W. C. Burns (Eds.), Climate Change in the South Pacific : New Zealand, and Small Island States Advances in Global Change Research (1.st ed., pp. 289–300). [CrossRef]
- Field, C. D. (1995). Impact of expected climate change on mangroves. Hydrobiologia, 295(1), 75–81. [CrossRef]
- Andrews, T. J. , Clough, B. F., & Muller, G. J. (1984). Photosynthetic gas exchange properties and carbon isotope ratios of some mangroves in North Queensland. In H. J. Teas (Ed.), Physiology and management of mangroves. Tasks for vegetation science, vol 9. (1.st ed., pp. 15–23). [CrossRef]
- Clough, B. F., Andrews, T. J., & Cowan, I. R. (1982). 11. Physiological Processes in Mangroves. In B. F. Clough (Ed.), Mangrove ecosystems in Australia : structure, function and management (1.st edició, pp. 193–210). Retrieved from https://openresearch-repository.anu.edu.au/bitstream/1885/115032/2/b1317910x.pdf.
- Cavaleri, M. A., Reed, S. C., Smith, W. K., & Wood, T. E. (2015). Urgent need for warming experiments in tropical forests. Global Change Biology, 21(6), 2111–2121. [CrossRef]
- Krause, G. H., Cheesman, A. W., Winter, K., Krause, B., & Virgo, A. (2013). Thermal tolerance, net CO2 exchange and growth of a tropical tree species, Ficus insipida, cultivated at elevated daytime and nighttime temperatures. Journal of Plant Physiology, 170(9), 822–827. [CrossRef]
- Wright, S. J. , Muller-Landau, H. C., & Schipper, J. (2009). The future of tropical species on a warmer planet. Conservation Biology, 23(6), 1418–1426. [CrossRef]
- Guerra Torres, C. P. (2018). Informe acerca del estatus de la torre de Eddy Covariance (Torre Jay Zeiman - TJZ) manglar del río Juan Díaz, Bahía de Panamá, Panamá.
- Mc Rae, K. , & Reyna, Z. (2018). Características estructurales adaptativas en las hojas de cinco especies de mangle [Avicennia germinans L., Conocarpus erectus L., Laguncularia racemosa (L.) Gaertn.f., Pelliciera rhizophorae (L.)Triana &Planch y Rhizophora mangle L.]. Universidad de Panamá.
- CIHH [Centro de Investigaciones Hidráulicas e Hidrotécnicas]. (2019). Análisis de Flujo de CO2 y Vapor de Agua de un Ecosistema de Manglar. Retrieved February 21, 2019, from http://manglar-carbono.utp.ac.pa/.
- Chambers, J., & Hastie, T. (1992). Statistical Models in S (1.st ed.; J. M. Chambers, T. J. Hastie, & AT&T Bell Laboratories, Eds.). Retrieved from https://archive.org/details/statisticalmodel00john/page/n1/mode/2up.
- Suraj Reddy Rodda, Kiran Chand Thumaty, Rakesh Fararoda, Chandra Shekhar Jha, Vinay Kumar Dadhwal, Unique characteristics of ecosystem CO2 exchange in Sundarban mangrove forest and their relationship with environmental factors,Estuarine, Coastal and Shelf Science, 2022,Volume 267,107764. [CrossRef]
- Segaran, T.C.; Azra, M.N.; Lananan, F.; Burlakovs, J.; Vincevica-Gaile, Z.; Rudovica, V.; Grinfelde, I.; Rahim, N.H.A.; Satyanarayana, B. Mapping the Link between Climate Change and Mangrove Forest: A Global Overview of the Literature. Forests 2023, 14, 421. [Google Scholar] [CrossRef]
- Tavares TCL; Bezerra WM; Normando LRO; Rosado AS and Melo VMM. Brazilian Semi-Arid Mangroves-Associated Microbiome as Pools of Richness and Complexity in a Changing World. Front. Microbiol. 2021, 12:715991. [CrossRef]
- Azad MS, Kamruzzaman M, Paul SK, Ahmed S, Kanzaki M. Vegetative and reproductive phenology of the mangrove Xylocarpus mekongensis Pierre in the Sundarbans, Bangladesh: Relationship with climatic variables. Regional Studies in Marine Science. 2020 Jul 1;38. [CrossRef]
|
Disclaimer/Publisher’s Note: The statements, opinions and data contained in all publications are solely those of the individual author(s) and contributor(s) and not of MDPI and/or the editor(s). MDPI and/or the editor(s) disclaim responsibility for any injury to people or property resulting from any ideas, methods, instructions or products referred to in the content. |
© 2023 by the authors. Licensee MDPI, Basel, Switzerland. This article is an open access article distributed under the terms and conditions of the Creative Commons Attribution (CC BY) license (http://creativecommons.org/licenses/by/4.0/).
