1. Introduction
Partial discharges (PDs) occur in electrical insulation systems and indicate the presence of defects or degradation within the insulation material [
1,
2,
3]. According to IEC 60270, a PD is referred to as an electrical pulse-type discharge that partially bridges the insulation [
4]. It is a critical parameter to monitor because excessive PD activity can lead to insulation breakdown and failure [
5,
6]. In recent years, the development of advanced measurement techniques and defect recognition methods has been instrumental in improving the accuracy and reliability of PD detection [
7,
8]. One method that has gained significant attention is phase-resolved partial discharge (PRPD) analysis. PRPD analysis involves capturing and analyzing the patterns of PD pulses in a time domain, allowing for a more comprehensive understanding of PD behavior and improved defect recognition capabilities [
9]. Valuable insights can be gained regarding the condition of the insulation material by examining the characteristics of PD pulses from a partial discharge inception voltage (PDIV) to a partial discharge extinction voltage (PDEV).
The accurate detection and characterization of defects are of the utmost importance in the field of epoxy resins that are widely used as insulation materials in various electrical applications [
10,
11,
19]. Artificially fabricated voids are commonly used as representative defects to simulate the imperfections that occur in epoxy resins. The positions of these voids within the resin can significantly influence the PD characteristics and, consequently, the accuracy of defect recognition. In this study, the positions of the voids in the epoxy were placed at the top, center, and bottom.
Caprara et al. increased the voltage value step by step above the repetitive partial discharge inception voltage (RPDIV) level, where sporadic bursts of PD can occur. These bursts meet the conditions for RPDIV. However, the PD activity is unstable and may be extinguished. The current definition of RPDIV in international standards does not account for PD bursts. To address this issue, conditioning the insulation system above the RPDIV level is proposed as a suitable approach to reduce the likelihood of observing PD bursts [
12,
13]. This study provides recommendations for performing more accurate RPDIV measurements by combining the understanding of PD activity behavior with the impact of conditioning.
Different procedures were followed in this study. Specifically, the voltage value was decreased step by step from below the PDIV level to the PDEV level. Subsequently, it was observed that PDs occurred at a very low level, even lower than from the PDIV to the PDEV. This observation raised questions regarding the influence of weak PDs on defect recognition during RPDEV measurements. Therefore, two PD measurement conditions were implemented to investigate this issue.
Under the first condition, the PD measurements were conducted for a duration of one minute from the lower PDIV to the PDEV. PRPD patterns were captured during this time. Under the second condition, the measurement duration was extended to one hour, allowing for the accumulation of PRPD patterns at the RPDEV.
The impact of weak PDs at the PDEV on the accuracy of defect recognition was evaluated by comparing the PD data obtained under these two conditions. This investigation is important for understanding the behavior of weak PDs and their role in defect detection.
Combining the PRPD method with advanced techniques, such as convolutional neural networks (CNNs), has shown promising results for defect recognition [
14,
15]. However, the traditional approaches often overlook the significance of weak PD signals in the PDEV. It is crucial to highlight that neglecting weak PDs in the PDEV can lead to missed detections and compromised accuracy in defect recognition. Therefore, this study aimed to clarify the potential of weak PDs by exploring the effects of an extended measurement duration and CNN-based analysis on PD analysis from the PDIV to the PDEV. In addition, this research aimed to enhance defect recognition capabilities and improve the reliability of high-voltage equipment diagnostics by emphasizing the importance of capturing weak PDs in the PDEV.
As mentioned previously, a CNN was employed to analyze and interpret PD data, which is a deep learning model known for its effectiveness in pattern recognition tasks. The CNN model was trained and tested using PRPD data collected under two measurement conditions. PD data that was recorded at the PDIV for a duration of one minute was utilized to train the CNN. Additionally, 100 PD data images were collected from each of the three test samples.
PD data were recorded by gradually reducing the voltage from the PDIV to the PDEV to test the CNN. Ten PD data images with a duration of one minute each were captured to evaluate the performance of the CNN model. Additionally, one PD data image was continuously captured for one hour to represent a saturated condition.
The duration of PD data collection and presence of saturated PD patterns affecting the accuracy of defect recognition in epoxy resins were assessed using these different approaches for training and testing the proposed CNN model. A comparison of the CNN performances under these different scenarios provided insights into the optimal data collection duration and conditions for accurate defect recognition.
The remainder of this paper is organized as follows. The PD test process, fabrication of test samples, experimental setup, and data collection are presented in
Section 2. The analysis of the PRPD patterns under different conditions from the PDIV to the PDEV are presented in Section 3. The CNN algorithm modeling is presented and the training and testing results and their implications are discussed in detail in
Section 4. Finally, significant remarks and suggestions for future research are provided in
Section 5.
2. Materials and Methods
2.1. PD Test System
PD experiments were conducted at the high-voltage laboratory of the National Taiwan University of Science and Technology. The pulse current method specified in the IEC 60270 standard was followed to conduct the PD measurements.
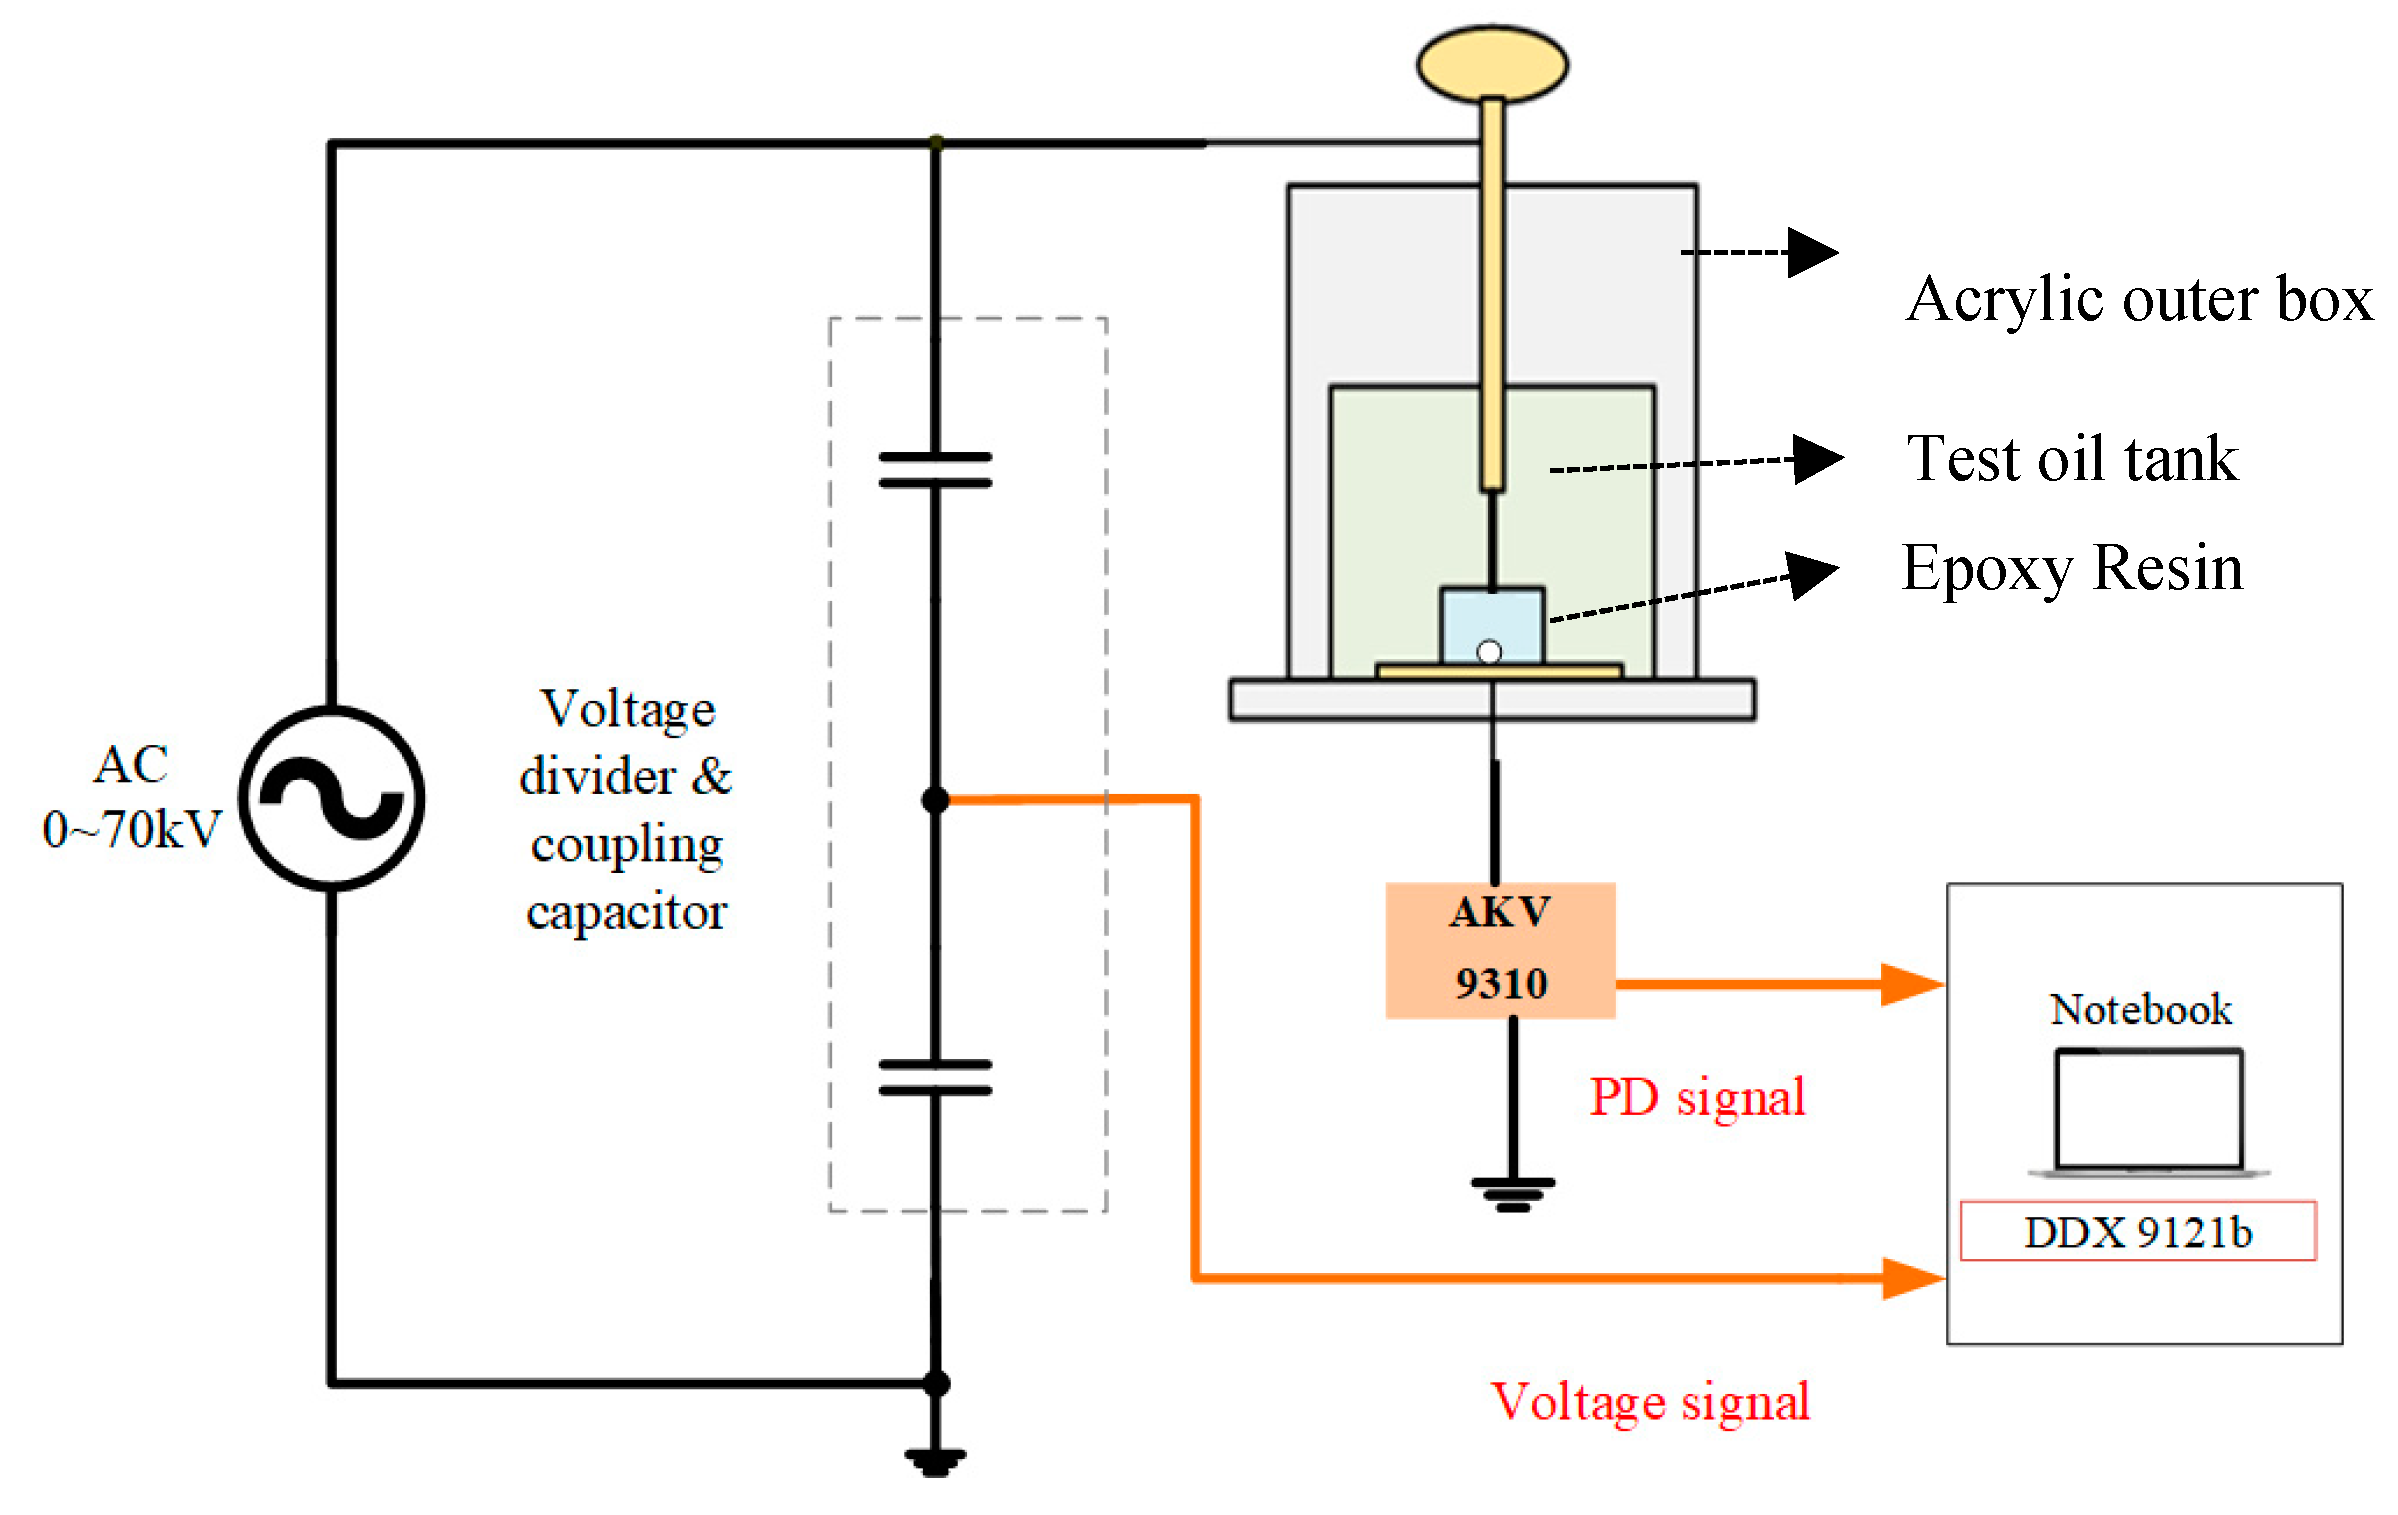
The PD measurement setup consisted of a Hipotronics 700-DI series AC Dielectric test set model with a high-voltage source, Haefely 9230 model high-voltage capacitive divider, PD test subjects representing the epoxy resin test samples with artificially fabricated voids at different positions that were immersed in a test oil tank, and a height-adjustable copper electrode on the top that could lock the high-voltage lead to connect to the high-voltage end of the test subject. The bottom was a screw connected to the low-voltage end of the test object, which was simultaneously connected to a Haefely AKV 9310 series PD analyzer that was optimized for use with the Haefely DDX 9121b series PD detector. The experimental setup of the epoxy resin with a void at the bottom is shown in
Figure 1.
An AC voltage source operating at a frequency of 60 Hz was used to supply high voltage to the test subjects. A test oil tank with an epoxy resin sample and void defect was connected to a PD analyzer. This constituted a wideband quadrupole system for PD measurements with a lower-limit frequency range of 34 – 7 kHz and an upper-limit frequency of > 8 MHz. The bandwidth and center frequencies were set to 400 and 230 kHz, respectively. These parameters determined the frequency range over which the PD signals could be effectively captured and analyzed.
The capacitive voltage divider had the primary function of stepping down the high voltage across the test subjects to a manageable level for measurement. This voltage reduction allowed for safe and accurate measurements without overwhelming the measurement equipment.
PD signals were acquired from the PD analyzer, whereas voltage signals were obtained from the capacitive voltage divider. The PD and voltage signals at the corresponding voltage levels were captured simultaneously using a PD detector and stored in a notebook for further analysis.
2.2. Fabrication of Artificial Defects in Epoxy Resins
Epoxy resin is a general term for a large class of polymer materials. It is characterized by high plasticity and can be poured into different shaped molds. Epoxy resins exhibit strong adhesion, low shrinkage, good chemical stability, and excellent mechanical and electrical insulation properties. As such, they are widely used in several fields, such as civil structure reinforcement, electronic component packaging, high-voltage insulation perfusion, waterproof engineering, adhesives, and industrial parts.
Bisphenol A and polyoxypropylene diamine were used as the epoxy resin and curing agent, respectively, and were mixed at a ratio of 3:1. The mixture solidified after curing, allowing for the easy observation of internal changes. The mixture was poured into a square silicone mold to form epoxy resin samples with a length and width of 3.5 cm.
The choice of a square shape for the mold offered some advantages. First, the square shape ensured that the image of the resin sample remained undistorted when viewed from the side, providing a clear and accurate representation of any defects. Second, the inner walls of the mold were designed to be smooth, which helped obtain clean and well-defined PRPD patterns.
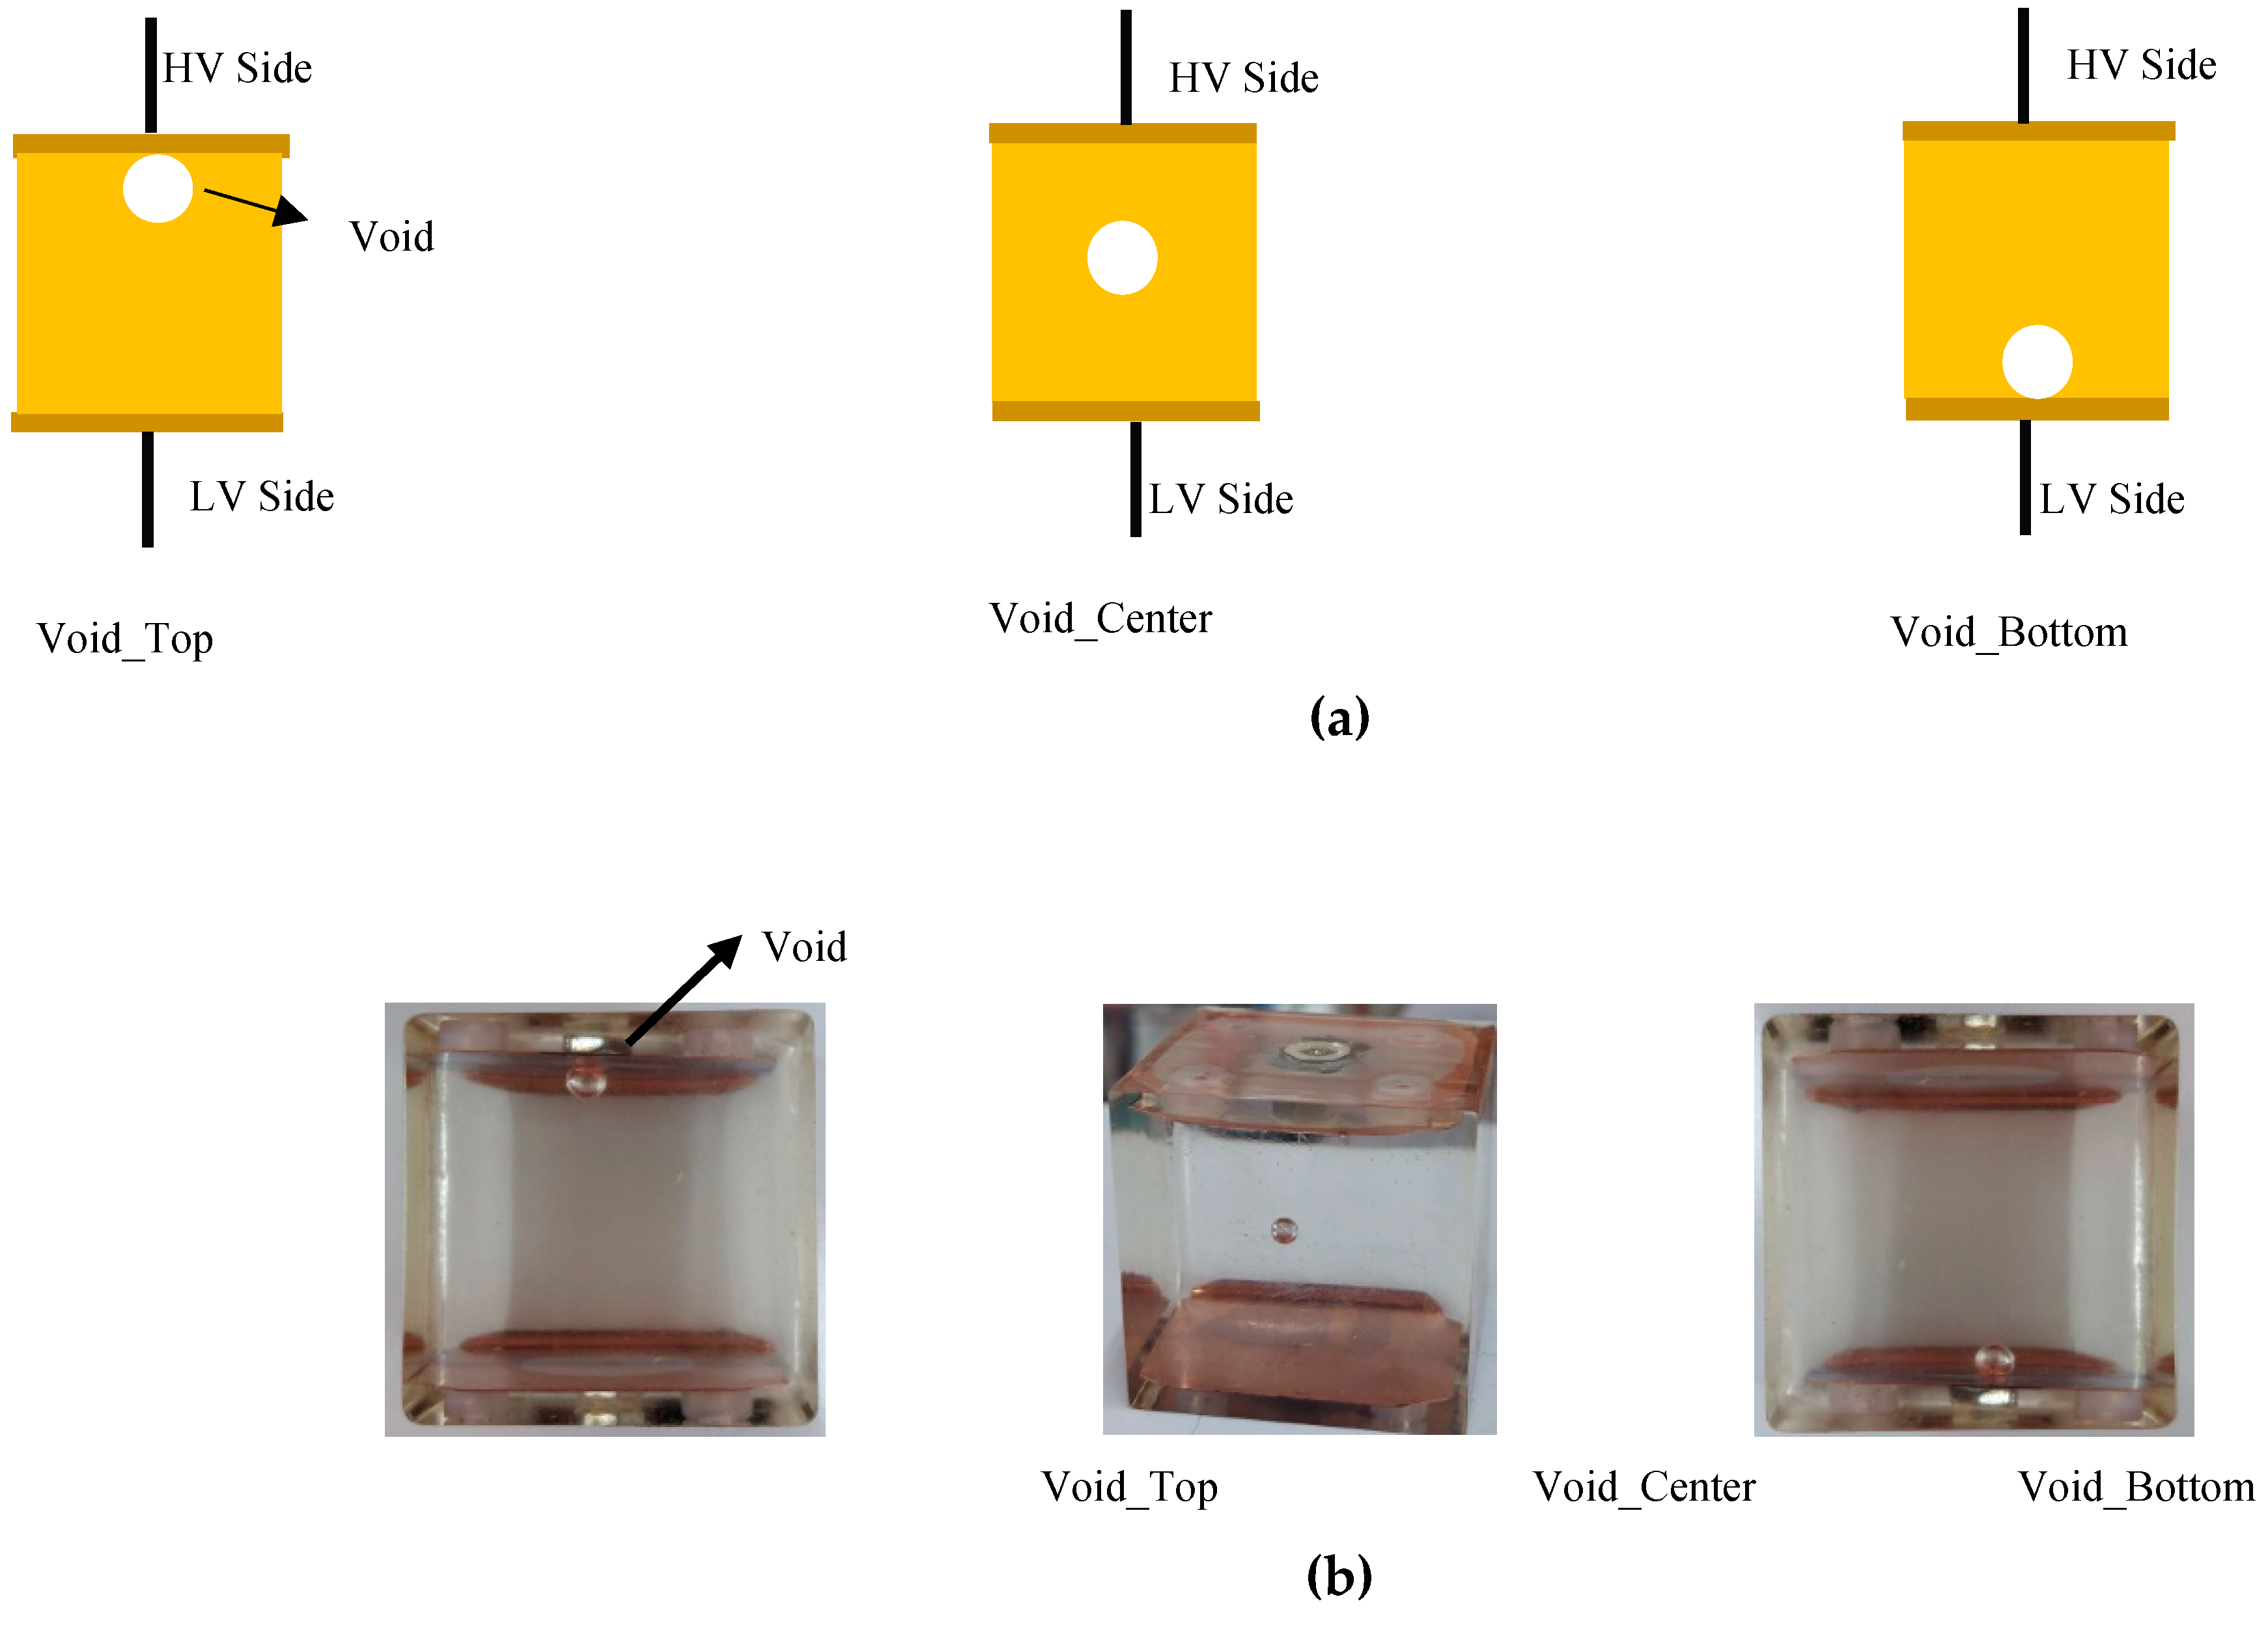
Artificial defects (voids of 0.3 cm in epoxy resins) were fabricated using a controlled and deliberate process. Schematic diagrams and photographs of the fabricated voids at different positions in the epoxy resin are shown in
Figure 2(a) and (b), respectively.
Copper sheets were positioned at the top and bottom of the epoxy test samples to ensure proper connectivity of the electrodes with the lead wires on the high voltage (HV) and low voltage (LV) sides. As mentioned previously, these samples were immersed in a test oil tank during the experiment, and the entire setup was placed in an acrylic outer box, as shown in
Figure 1.
2.3. PD Data Collection from Defect Samples
After establishing the necessary connections and ensuring proper electrical contact, high voltage was applied to the test object until PD inception occurred. The PD data were recorded for each test sample at the PDIV.
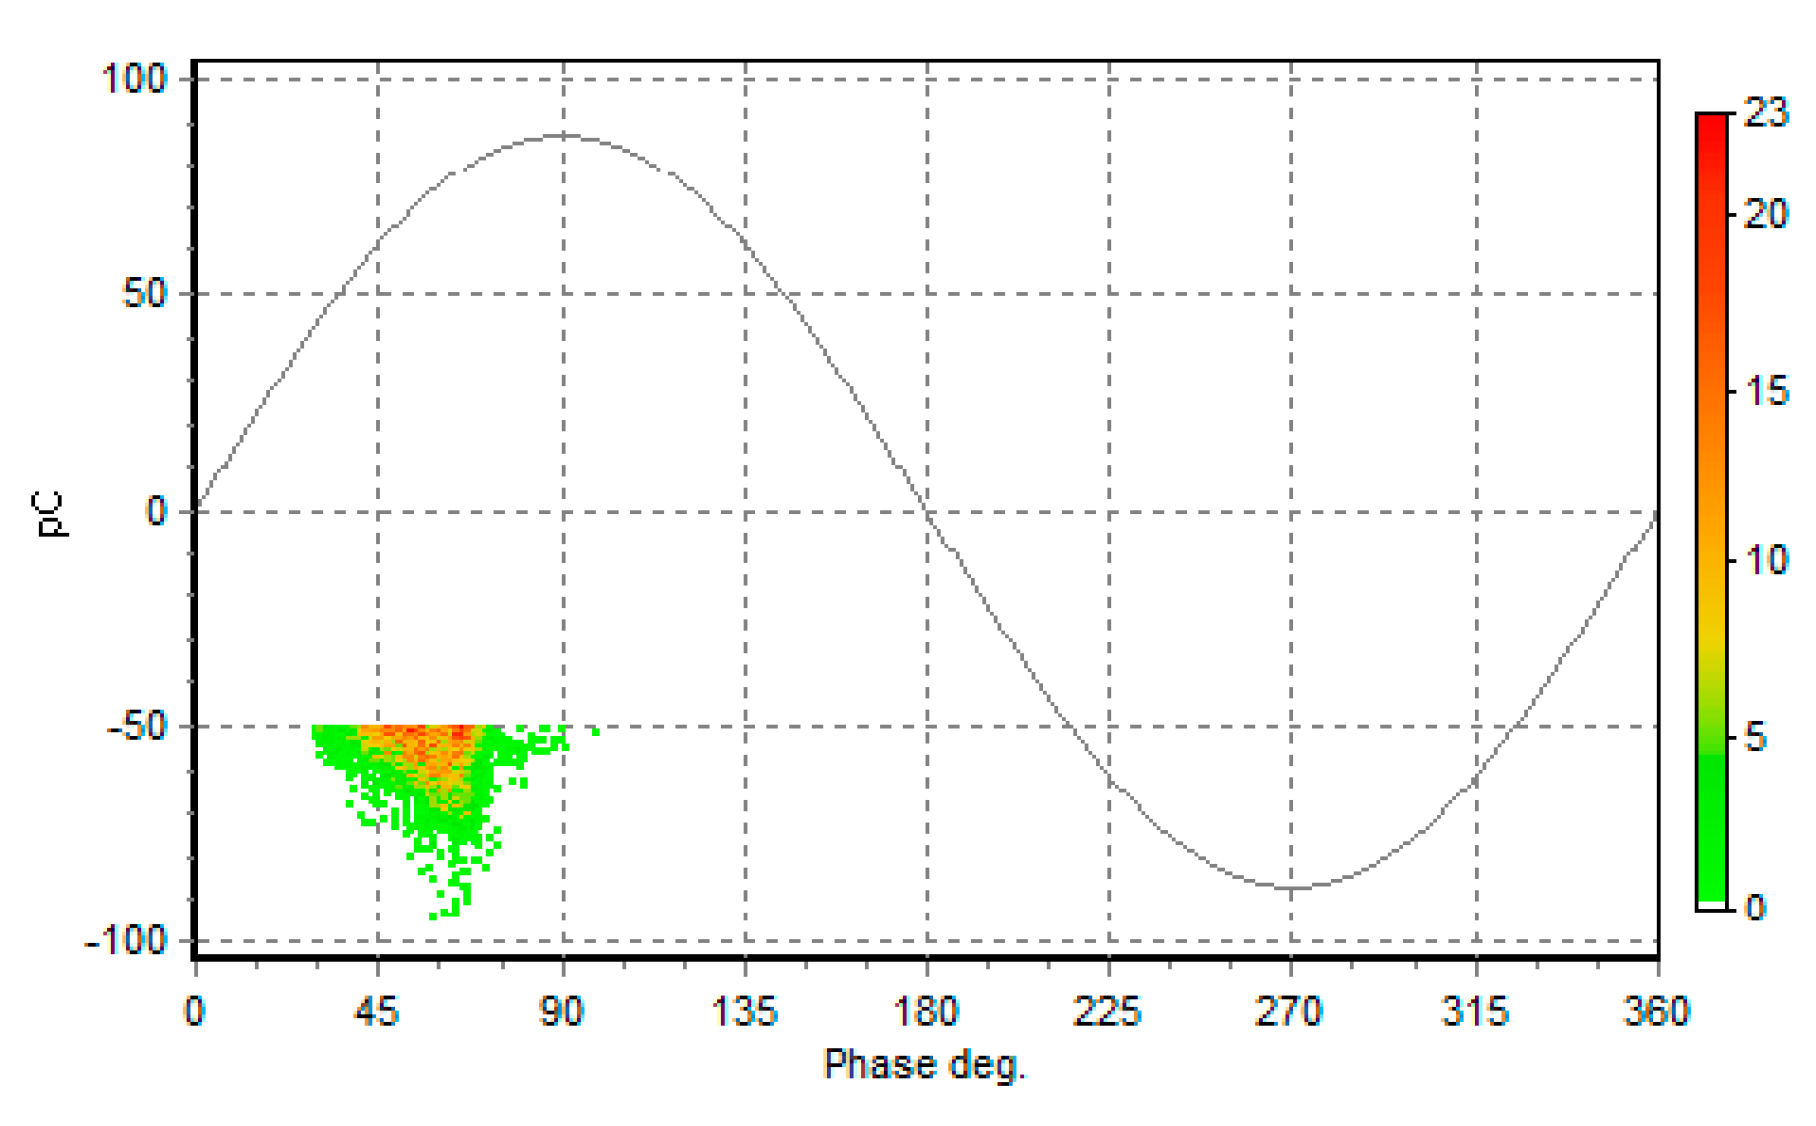
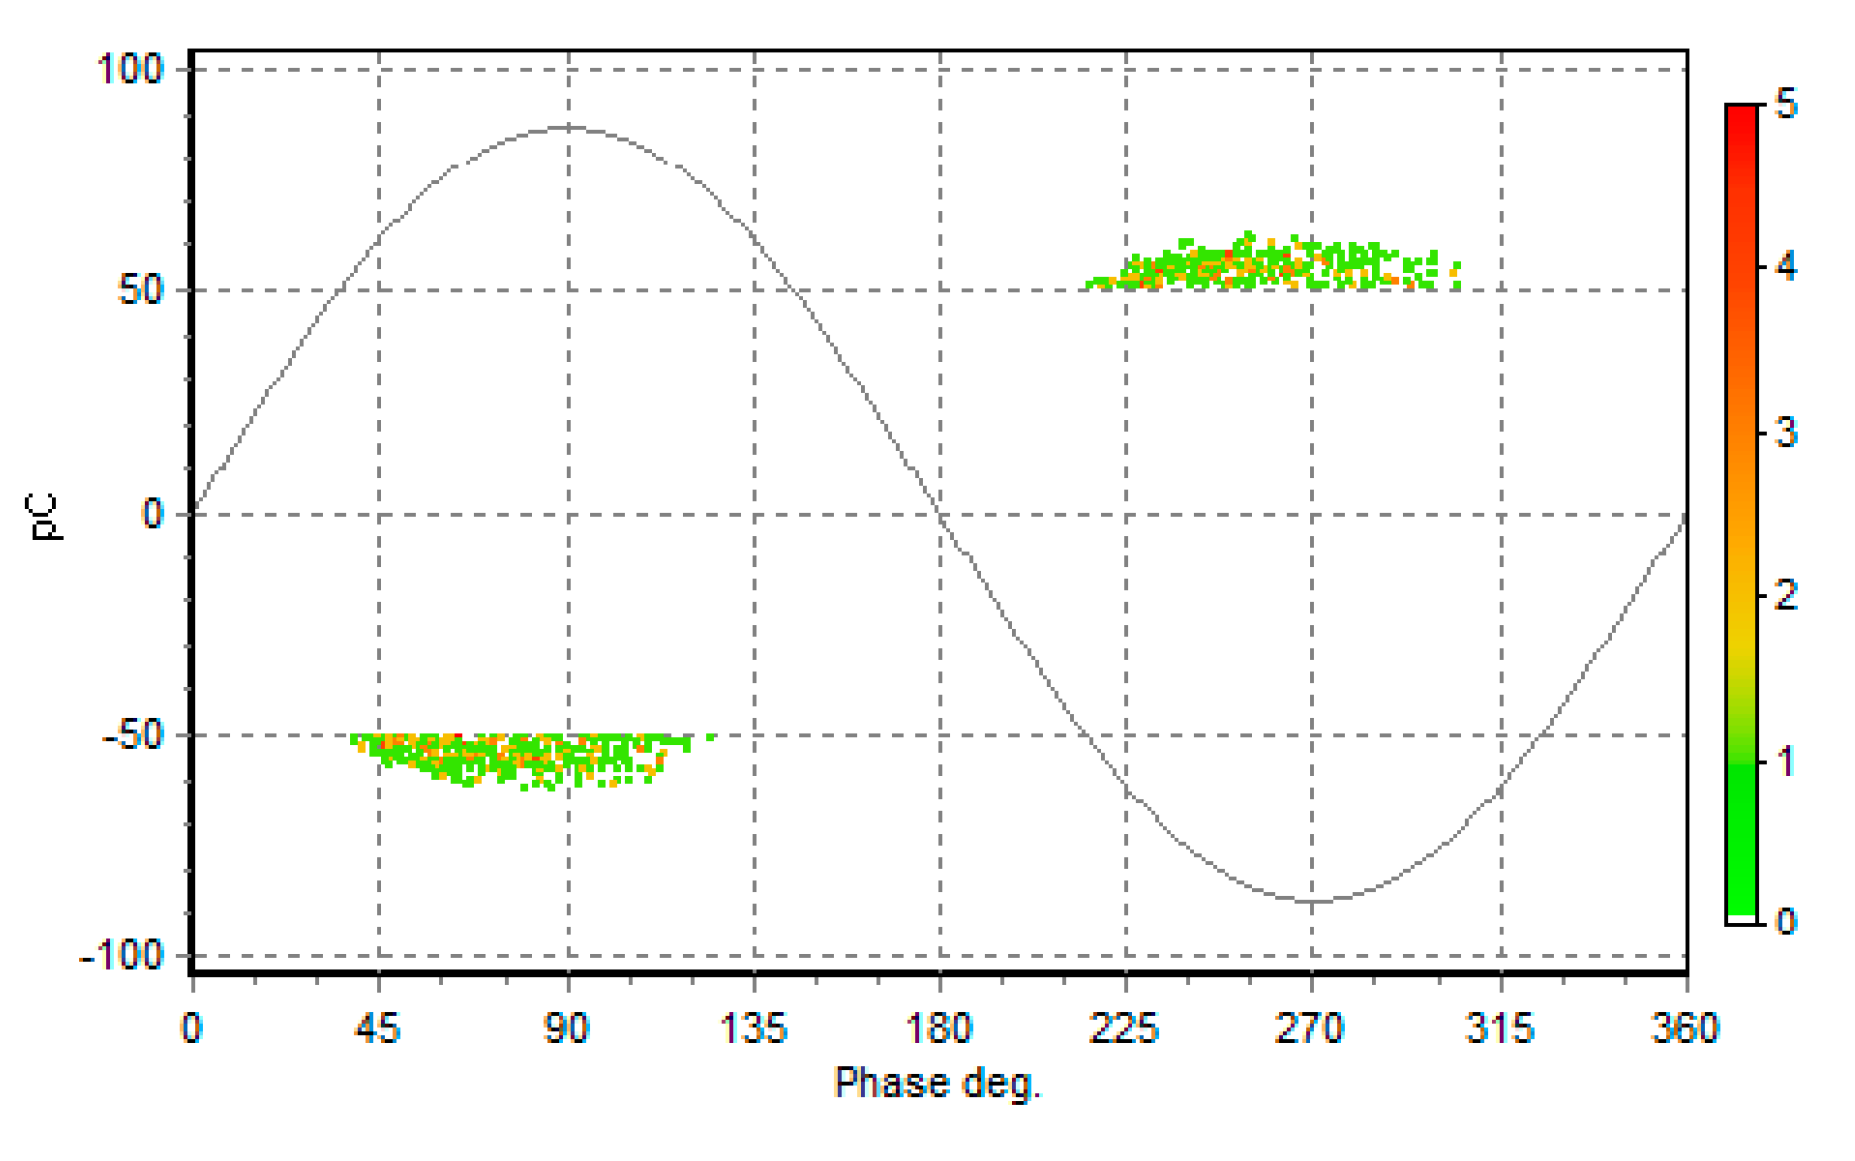
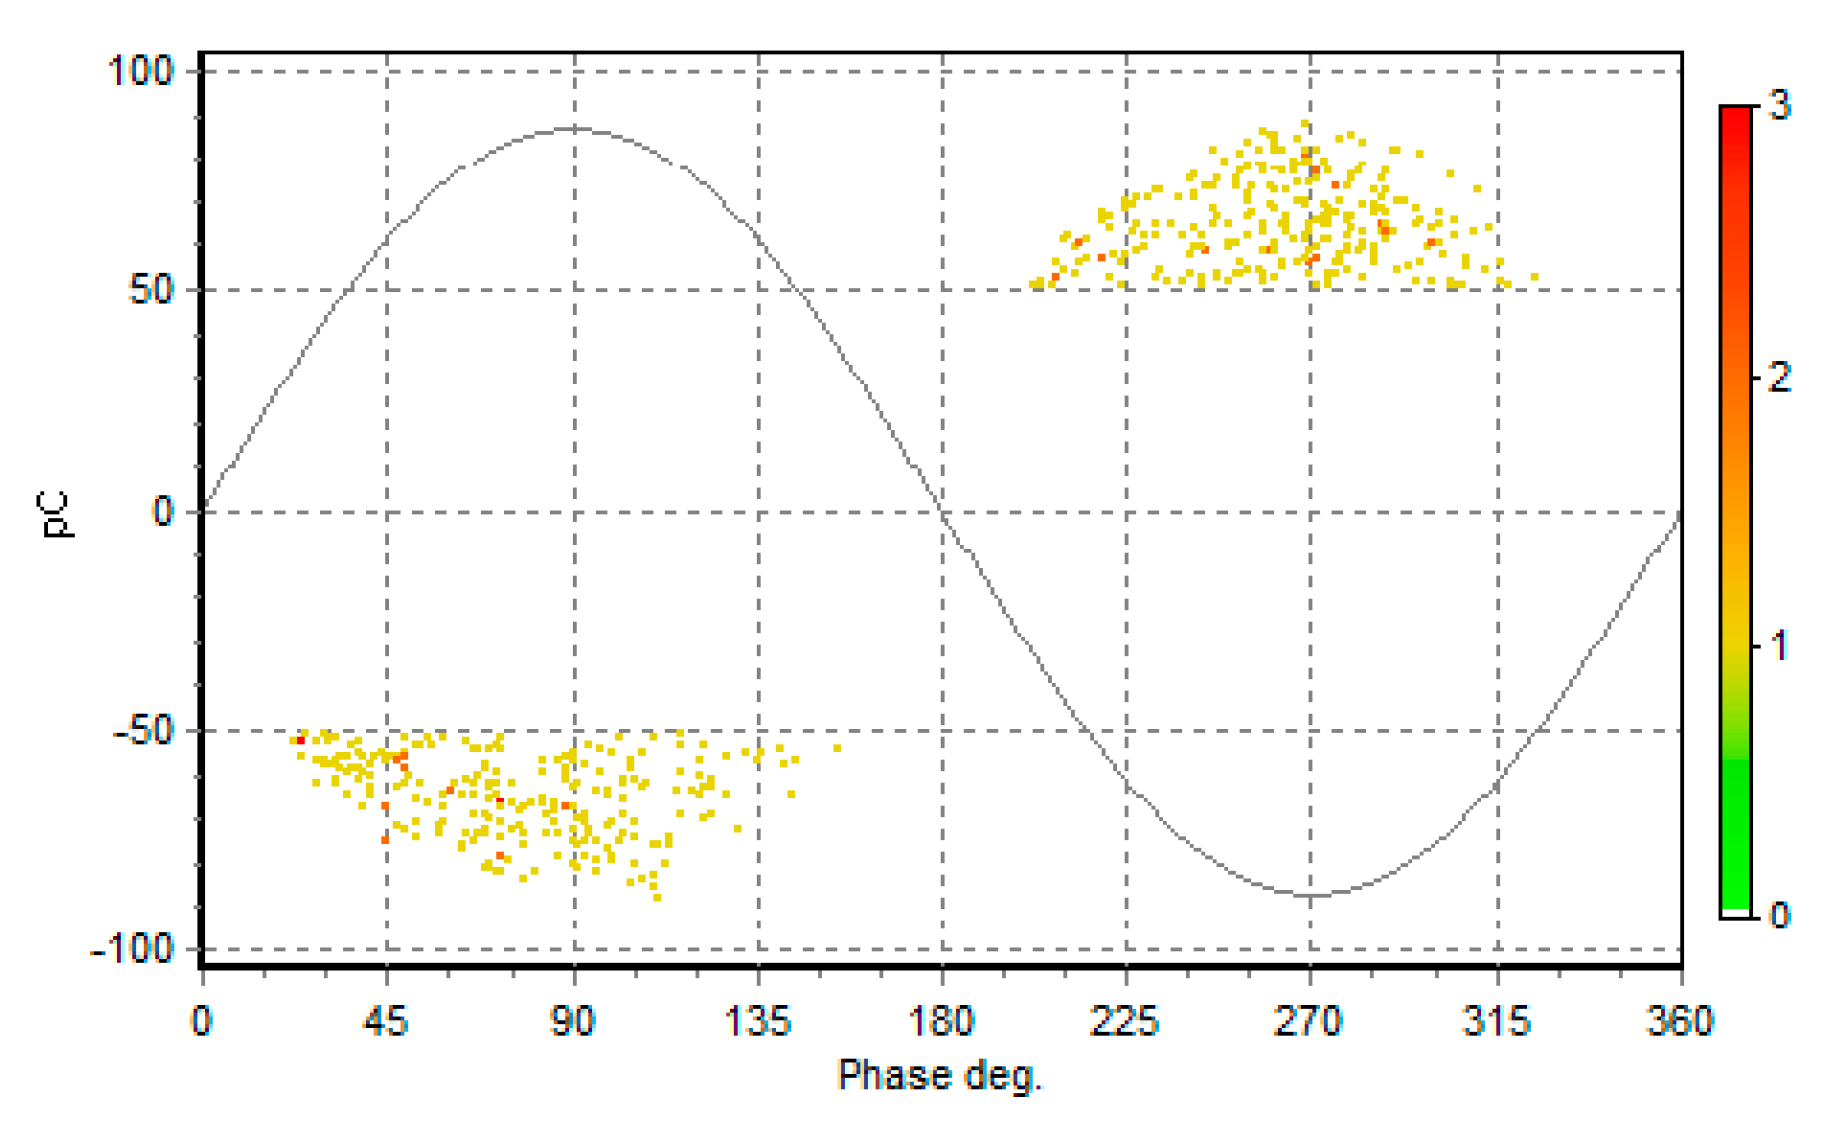
The PDIV values were measured to be 28, 23, and 35 kV for the test samples with void positions at the top, bottom, and center, respectively. The PRPD patterns of these test samples provided a visual representation of the PD signals recorded at the PDIV for each void position and are respectively shown in
Figure 3,
Figure 4 and
Figure 5.
PD data were collected during the recording process for a duration of one minute. The PD data obtained at the PDIV were comprised of 100 PRPD patterns for each test sample, labelled as Void_Top, Void_Center, and Void_Bottom. Subsequently, the PD data were used as the training dataset for the CNN, as shown in
Table 1. Therefore, the CNN could learn the distinctive features associated with each void position and improve its ability to accurately identify and classify defects in future testing scenarios. The PRPD data collection for the testing cases is discussed in more detail in
Section 4.
A stable PD shape was observed in the Void_Top, indicating that the PD phenomenon reached a steady state at the applied voltage. Additionally, a further increase in the voltage did not result in any significant changes in the shape of the PD pattern, as shown in
Figure 3.
Similar PD pattern shapes for the void positions at the center and bottom can be attributed to various factors, as shown in
Figure 4 and
Figure 5, respectively. One possibility is that the voids at these positions may have similar sizes, shapes, or distributions within the epoxy resin. These factors can influence the electrical field distribution and resulting PD characteristics. Additionally, other factors may contribute to the similarities in the observed PD pattern shapes, such as the resin properties, void geometry, and electrode configuration.
2.4. Defect Recognition using CNNs at Different PD Measurement Cycles
The goal of this study was to enhance defect type recognition in epoxy resins using CNNs, particularly focusing on PRPD pattern images associated with three different void positions within the epoxy material. CNNs have demonstrated significant success in image recognition tasks, making them suitable for analyzing and classifying PRPD patterns [
16,
17,
18].
The CNN architecture is particularly well-suited for image recognition owing to its inherent characteristics. CNNs are comprised of input, hidden, and output layers, with the hidden layers incorporating four convolutional layers, two max-pooling layers, and three rectified linear unit activation functions. The convolutional layers are responsible for learning local features within the input images using filters. The pooling layers then downsample the learned features, reduce the spatial dimensions, and extract the most relevant information. The activation functions introduce nonlinearity into the network, enabling it to capture complex patterns and make accurate predictions. The Adam optimizer was used to update the network-learnable parameters, and a maximum of 20 epochs were used for training. In addition, a cross-entropy method was used to adjust the weights during model training.
PRPD pattern images were captured from epoxy resin samples containing void defects positioned at three different locations: top, bottom, and center. These void positions were deliberately selected to represent different scenarios encountered in real-world applications. The PD data associated with each void position were recorded, and the corresponding PRPD pattern images were generated for defect type recognition.
The images of the PRPD patterns of all three types of defects were stored and individually labeled as Void_Top, Void_Bottom, and Void_Center. All images considered for training the CNN had a size of 88 × 66 px. This size was chosen because of its effectiveness and best performance when training and testing a CNN [
16].
4. Results
4.1. Training CNN with PD Data Recorded at the PDIV
The CNN model was trained using the PD data recorded at the PDIV for a duration of one minute. As mentioned in
Section 2, 300 PRPD images were captured for training the CNN. This training phase allowed the CNN to learn distinctive features and patterns associated with each void position. The CNN model was tested using new PD data after the training was complete. Data were recorded for one-minute and one-hour durations at a PDIV lower than the PDEV to evaluate accuracy in recognizing and classifying the defect types. This will be discussed in more detail in
Section 4.2.
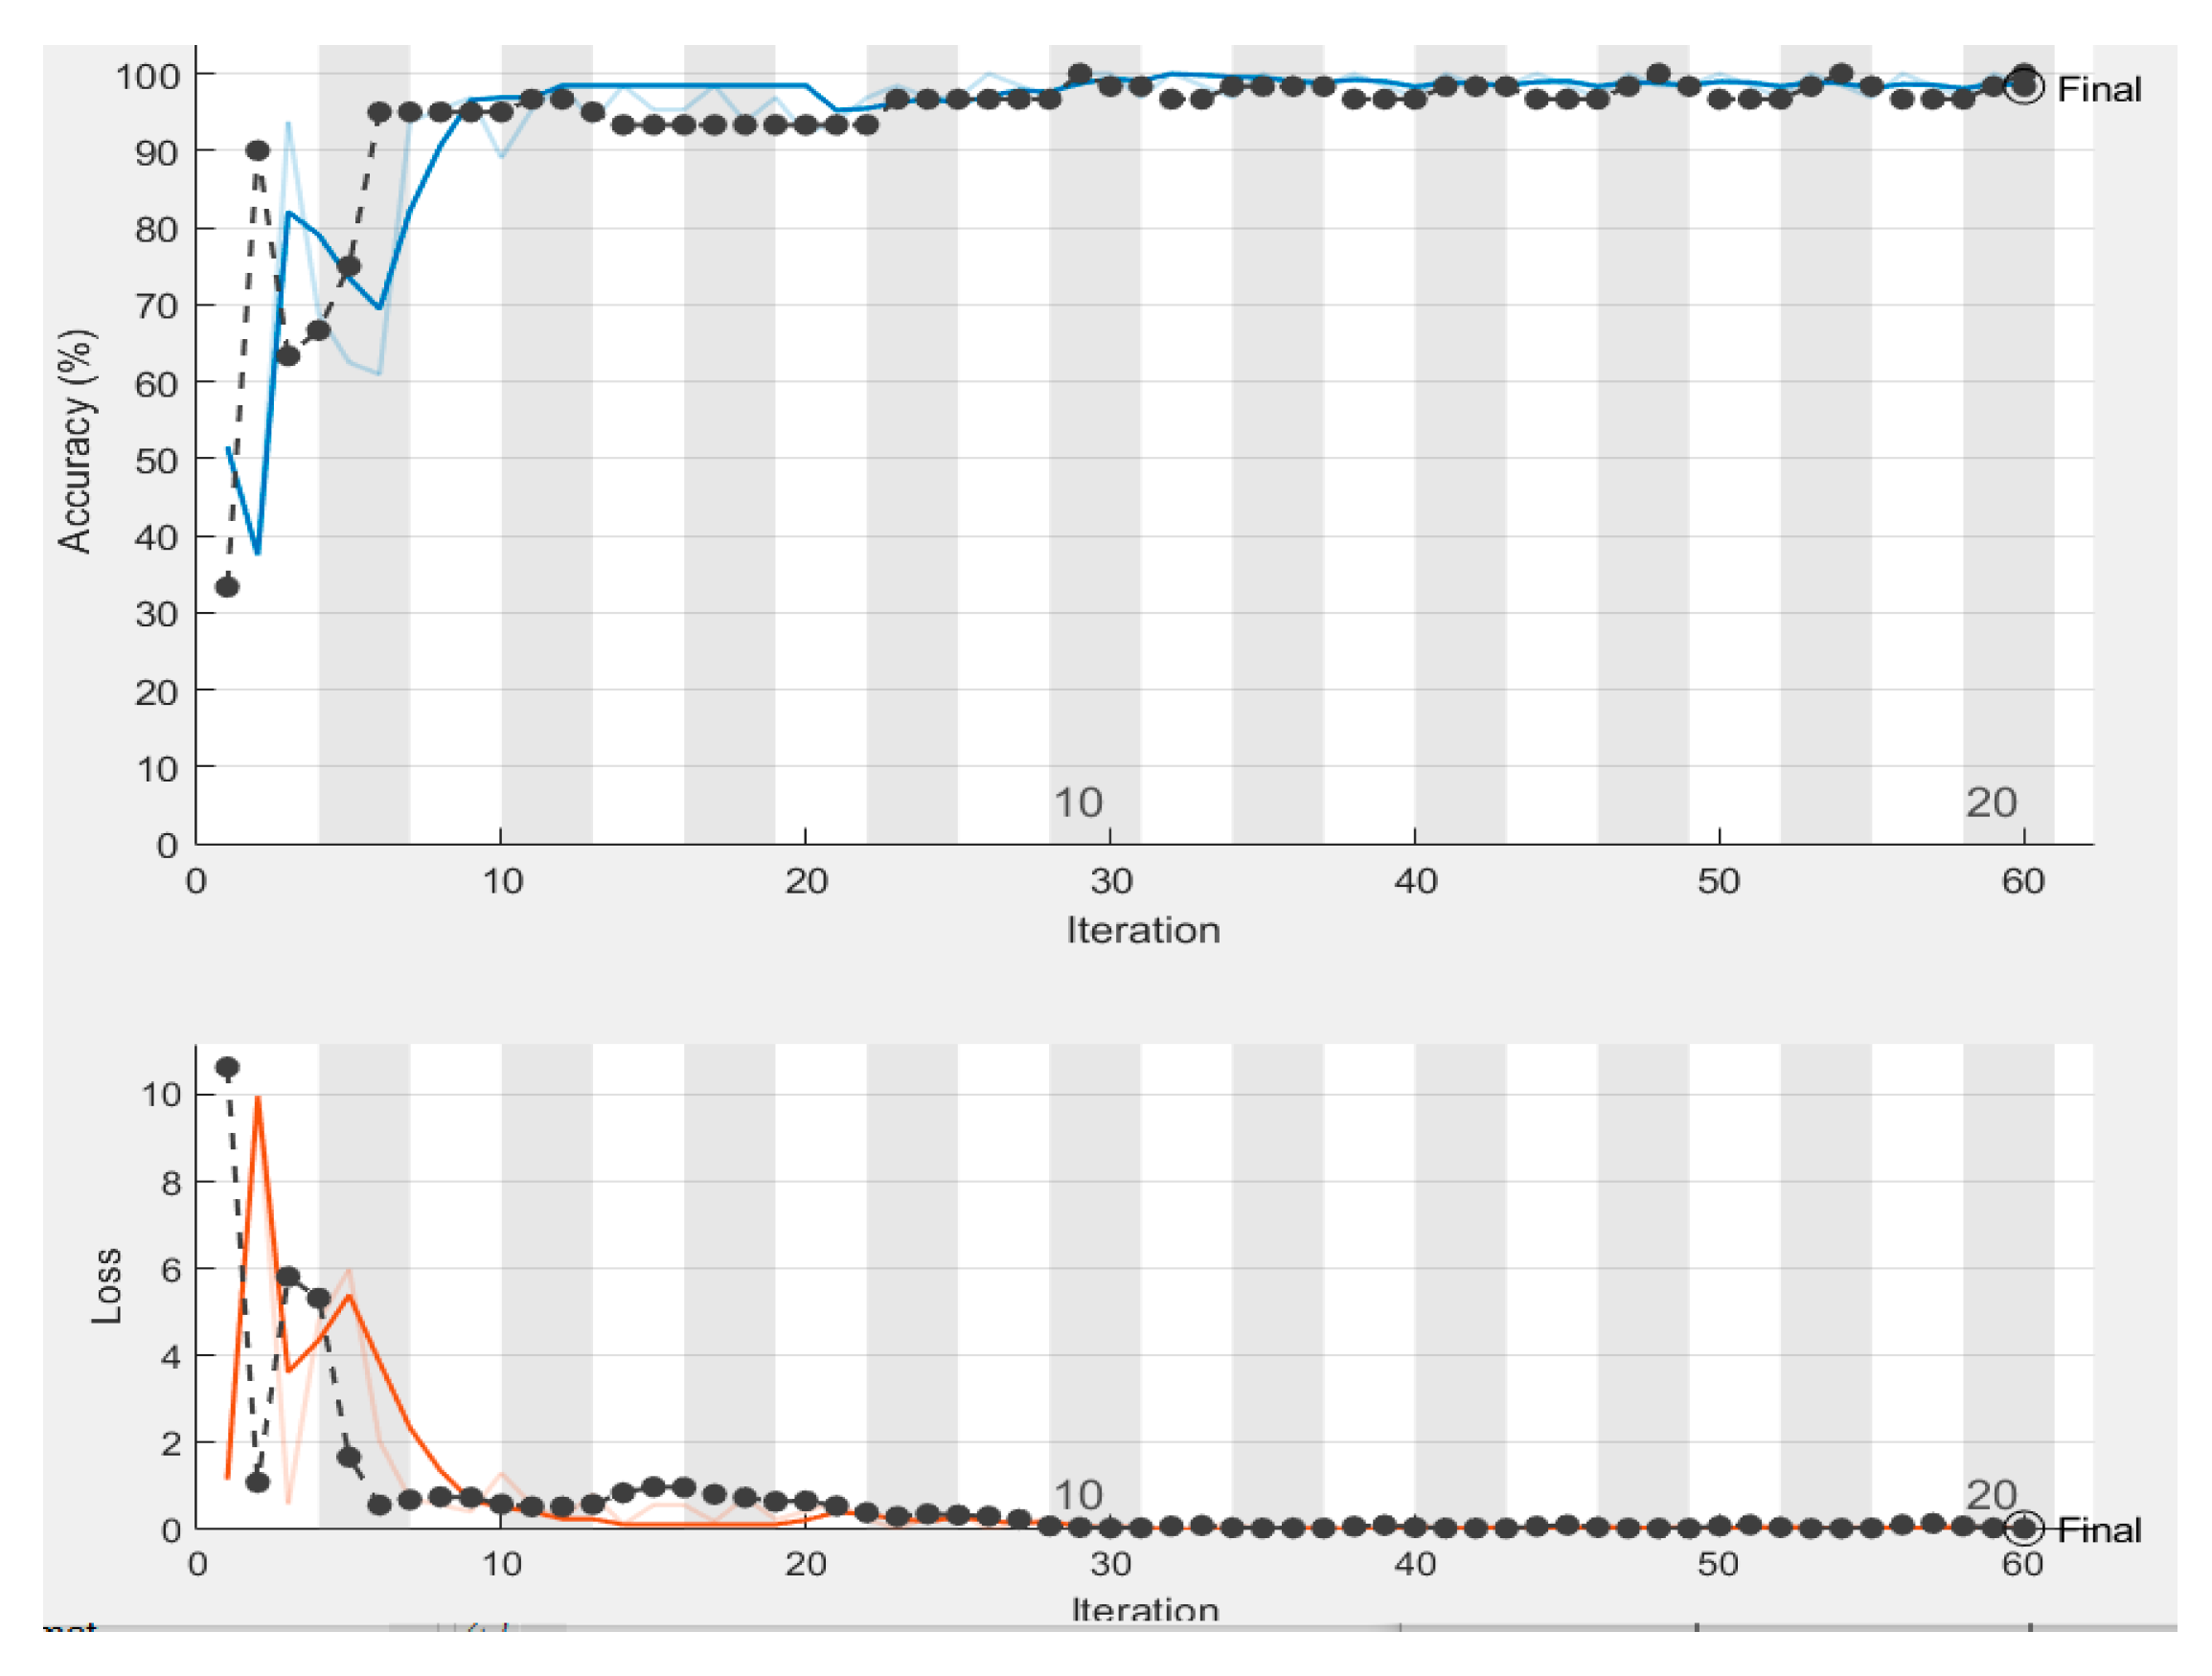
The training of the CNN model using 300 PRPD patterns labelled Void_Top, Void_Center, and Void_Bottom for the one-minute duration at PDIV yielded promising results. The learning curves for accuracy and loss during the training process are shown in
Figure 6.
The graph of the accuracy curve demonstrates how the accuracy of the model improved over the iterations until convergence. The accuracy steadily increased as the iterations progressed, indicating that the model effectively learned the patterns and features associated with each type of defect. A training accuracy of 98.33% demonstrated that the model correctly classified the majority of the training samples.
The loss curve represents the loss of the model, which measures the dissimilarity between the predicted and actual labels. The decreasing trend of the loss curve indicated that the model predictions gradually aligned with the true labels as training proceeded. This indicates that the model effectively minimized the errors in its predictions and improved its overall performance.
The high training accuracy achieved in this study is a positive outcome, indicating that the CNN model could effectively learn and recognize PRPD patterns associated with different void positions in the epoxy resin. However, it is important to note that the performance of a model with unseen data may vary. To validate the robustness of the model, it was crucial to evaluate its performance on a separate testing dataset that the model did not observe during training.
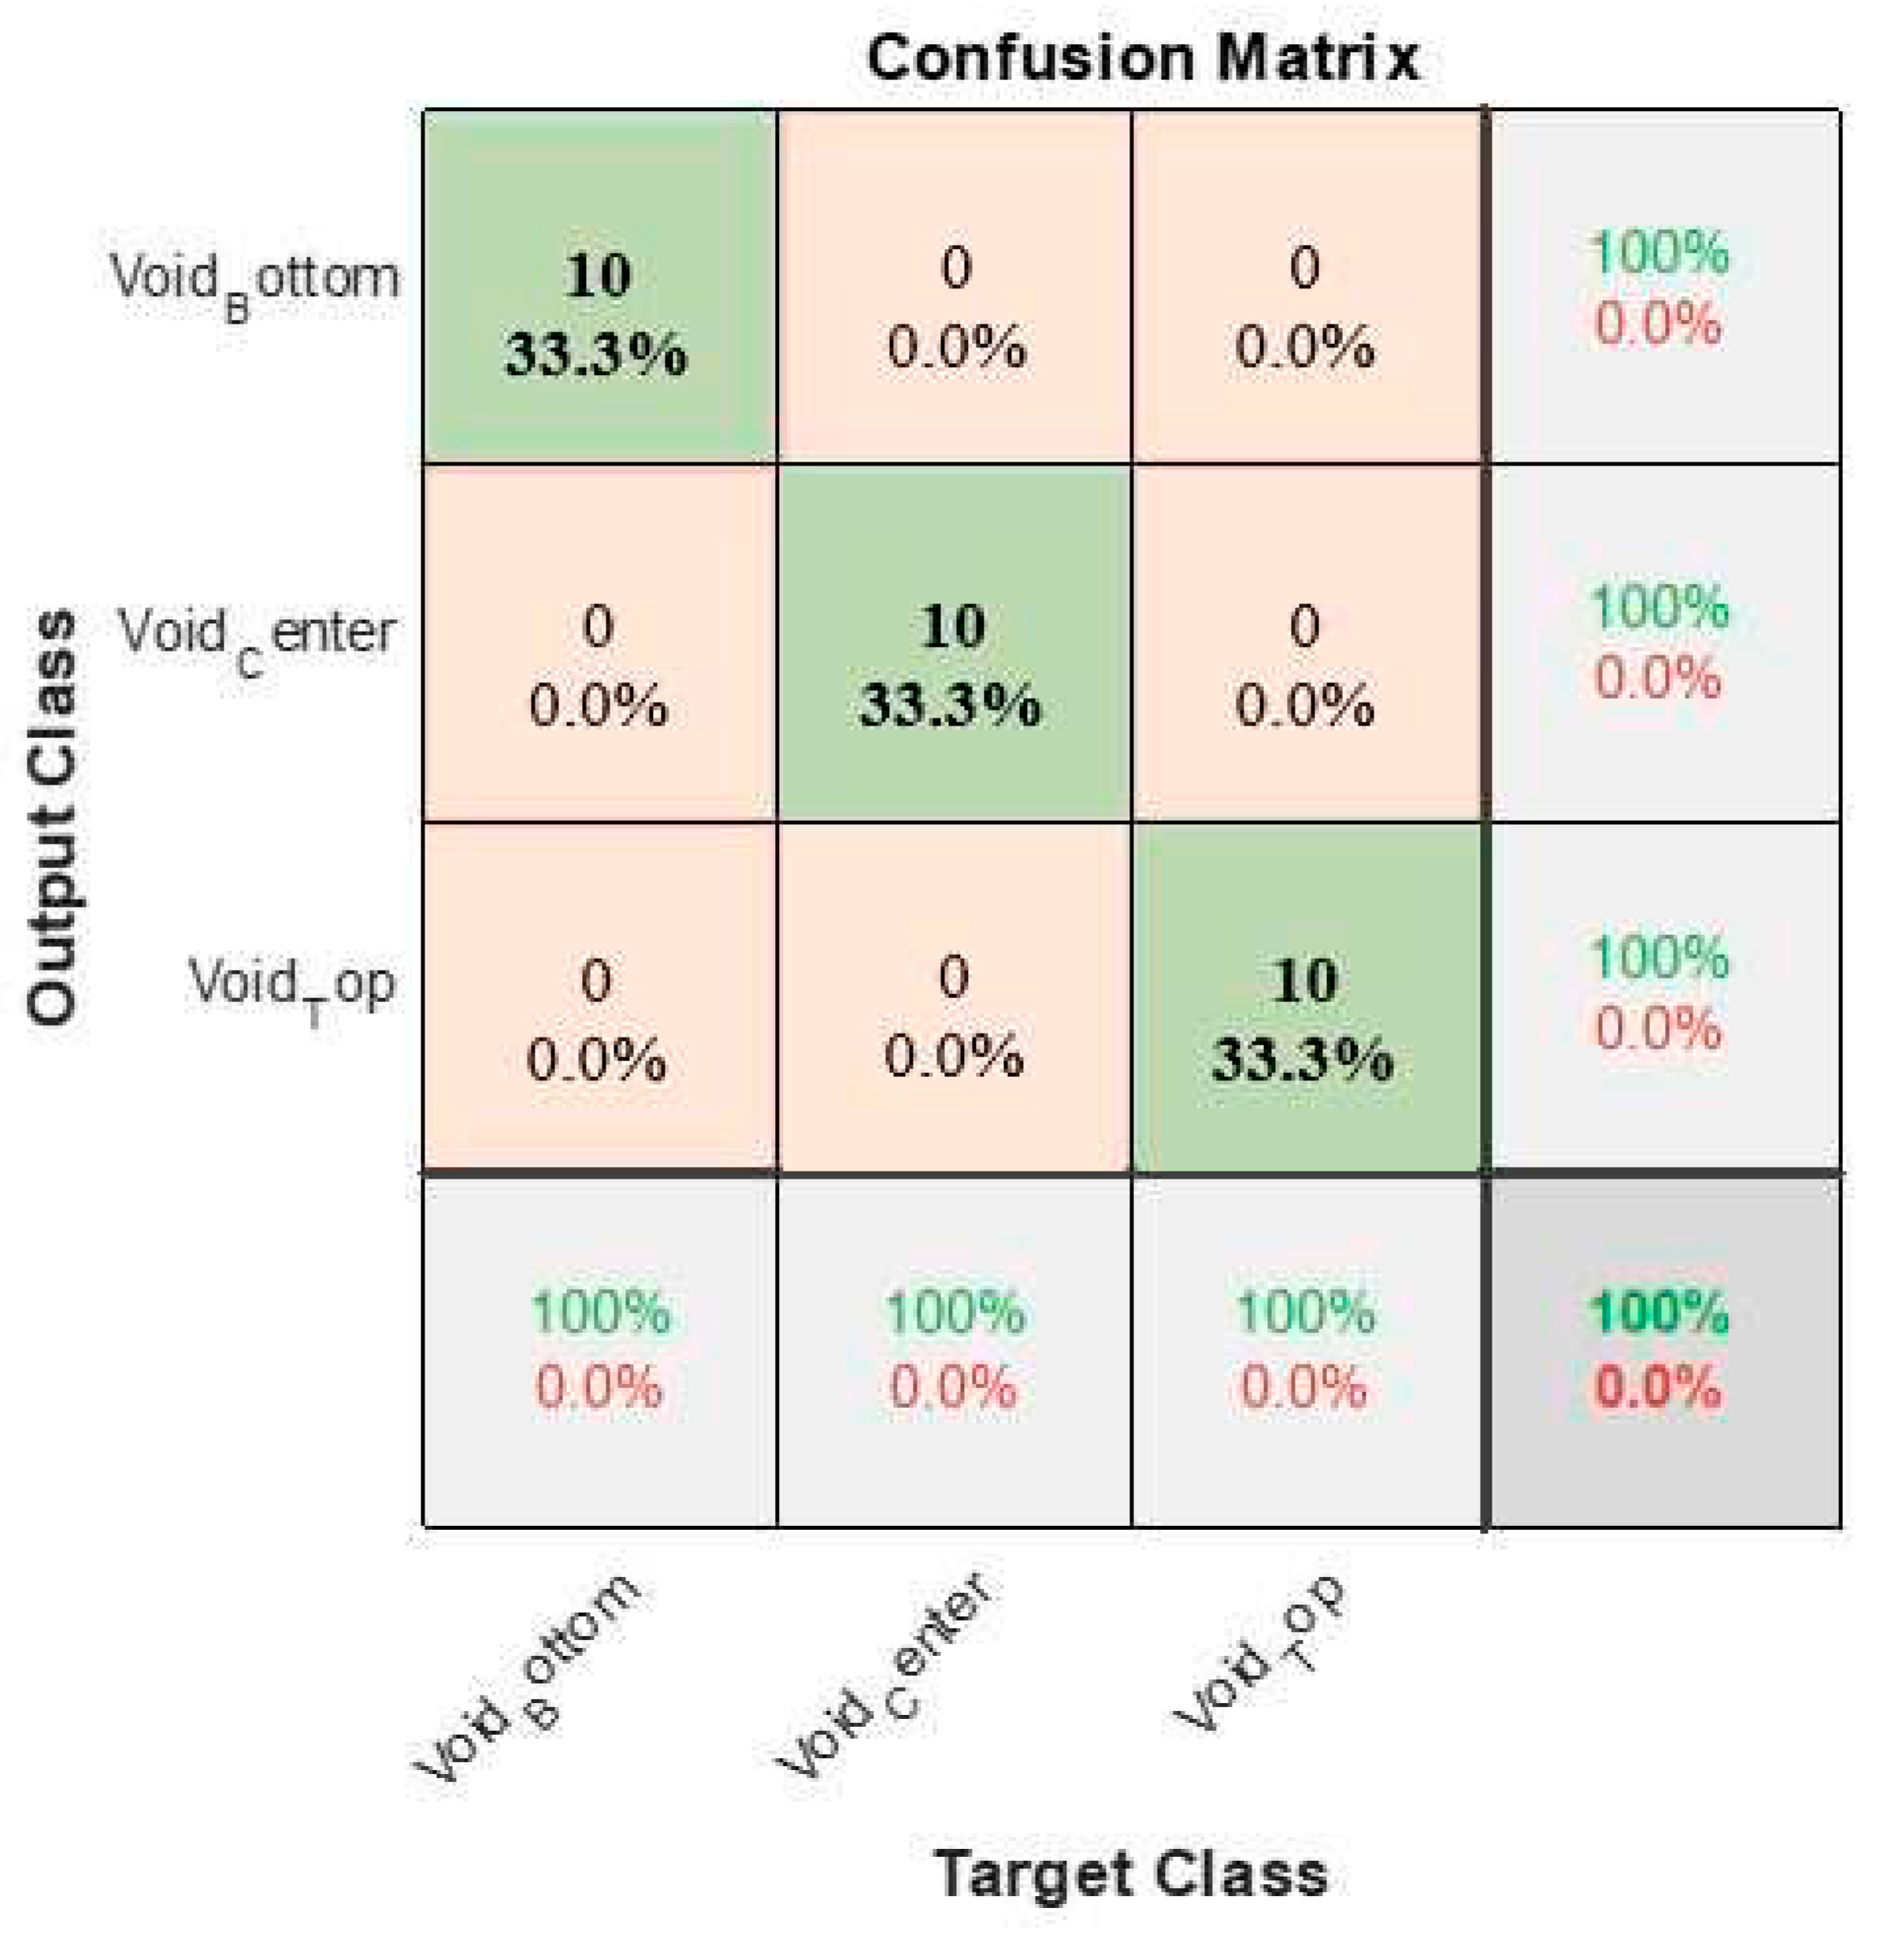
The confusion matrices represent the metrics for evaluating the performance in predicting the three defect types and were obtained during the training process, as shown in
Figure 7. These confusion matrices provide important information regarding the correct and incorrect predictions of every combination of the CNN model during the training process.
No incorrect predictions were found, suggesting that the trained CNN model achieved perfect accuracy on the training dataset, as shown in
Figure 7.
4.2. Testing Results of CNN with PD Data
The PD data were recorded during the testing phase by gradually reducing the voltage from the PDIV to the PDEV, with reductions performed in steps of one. The PDEV values for the test samples with void positions at the top, bottom, and center were 20, 21, and 26 kV, respectively.
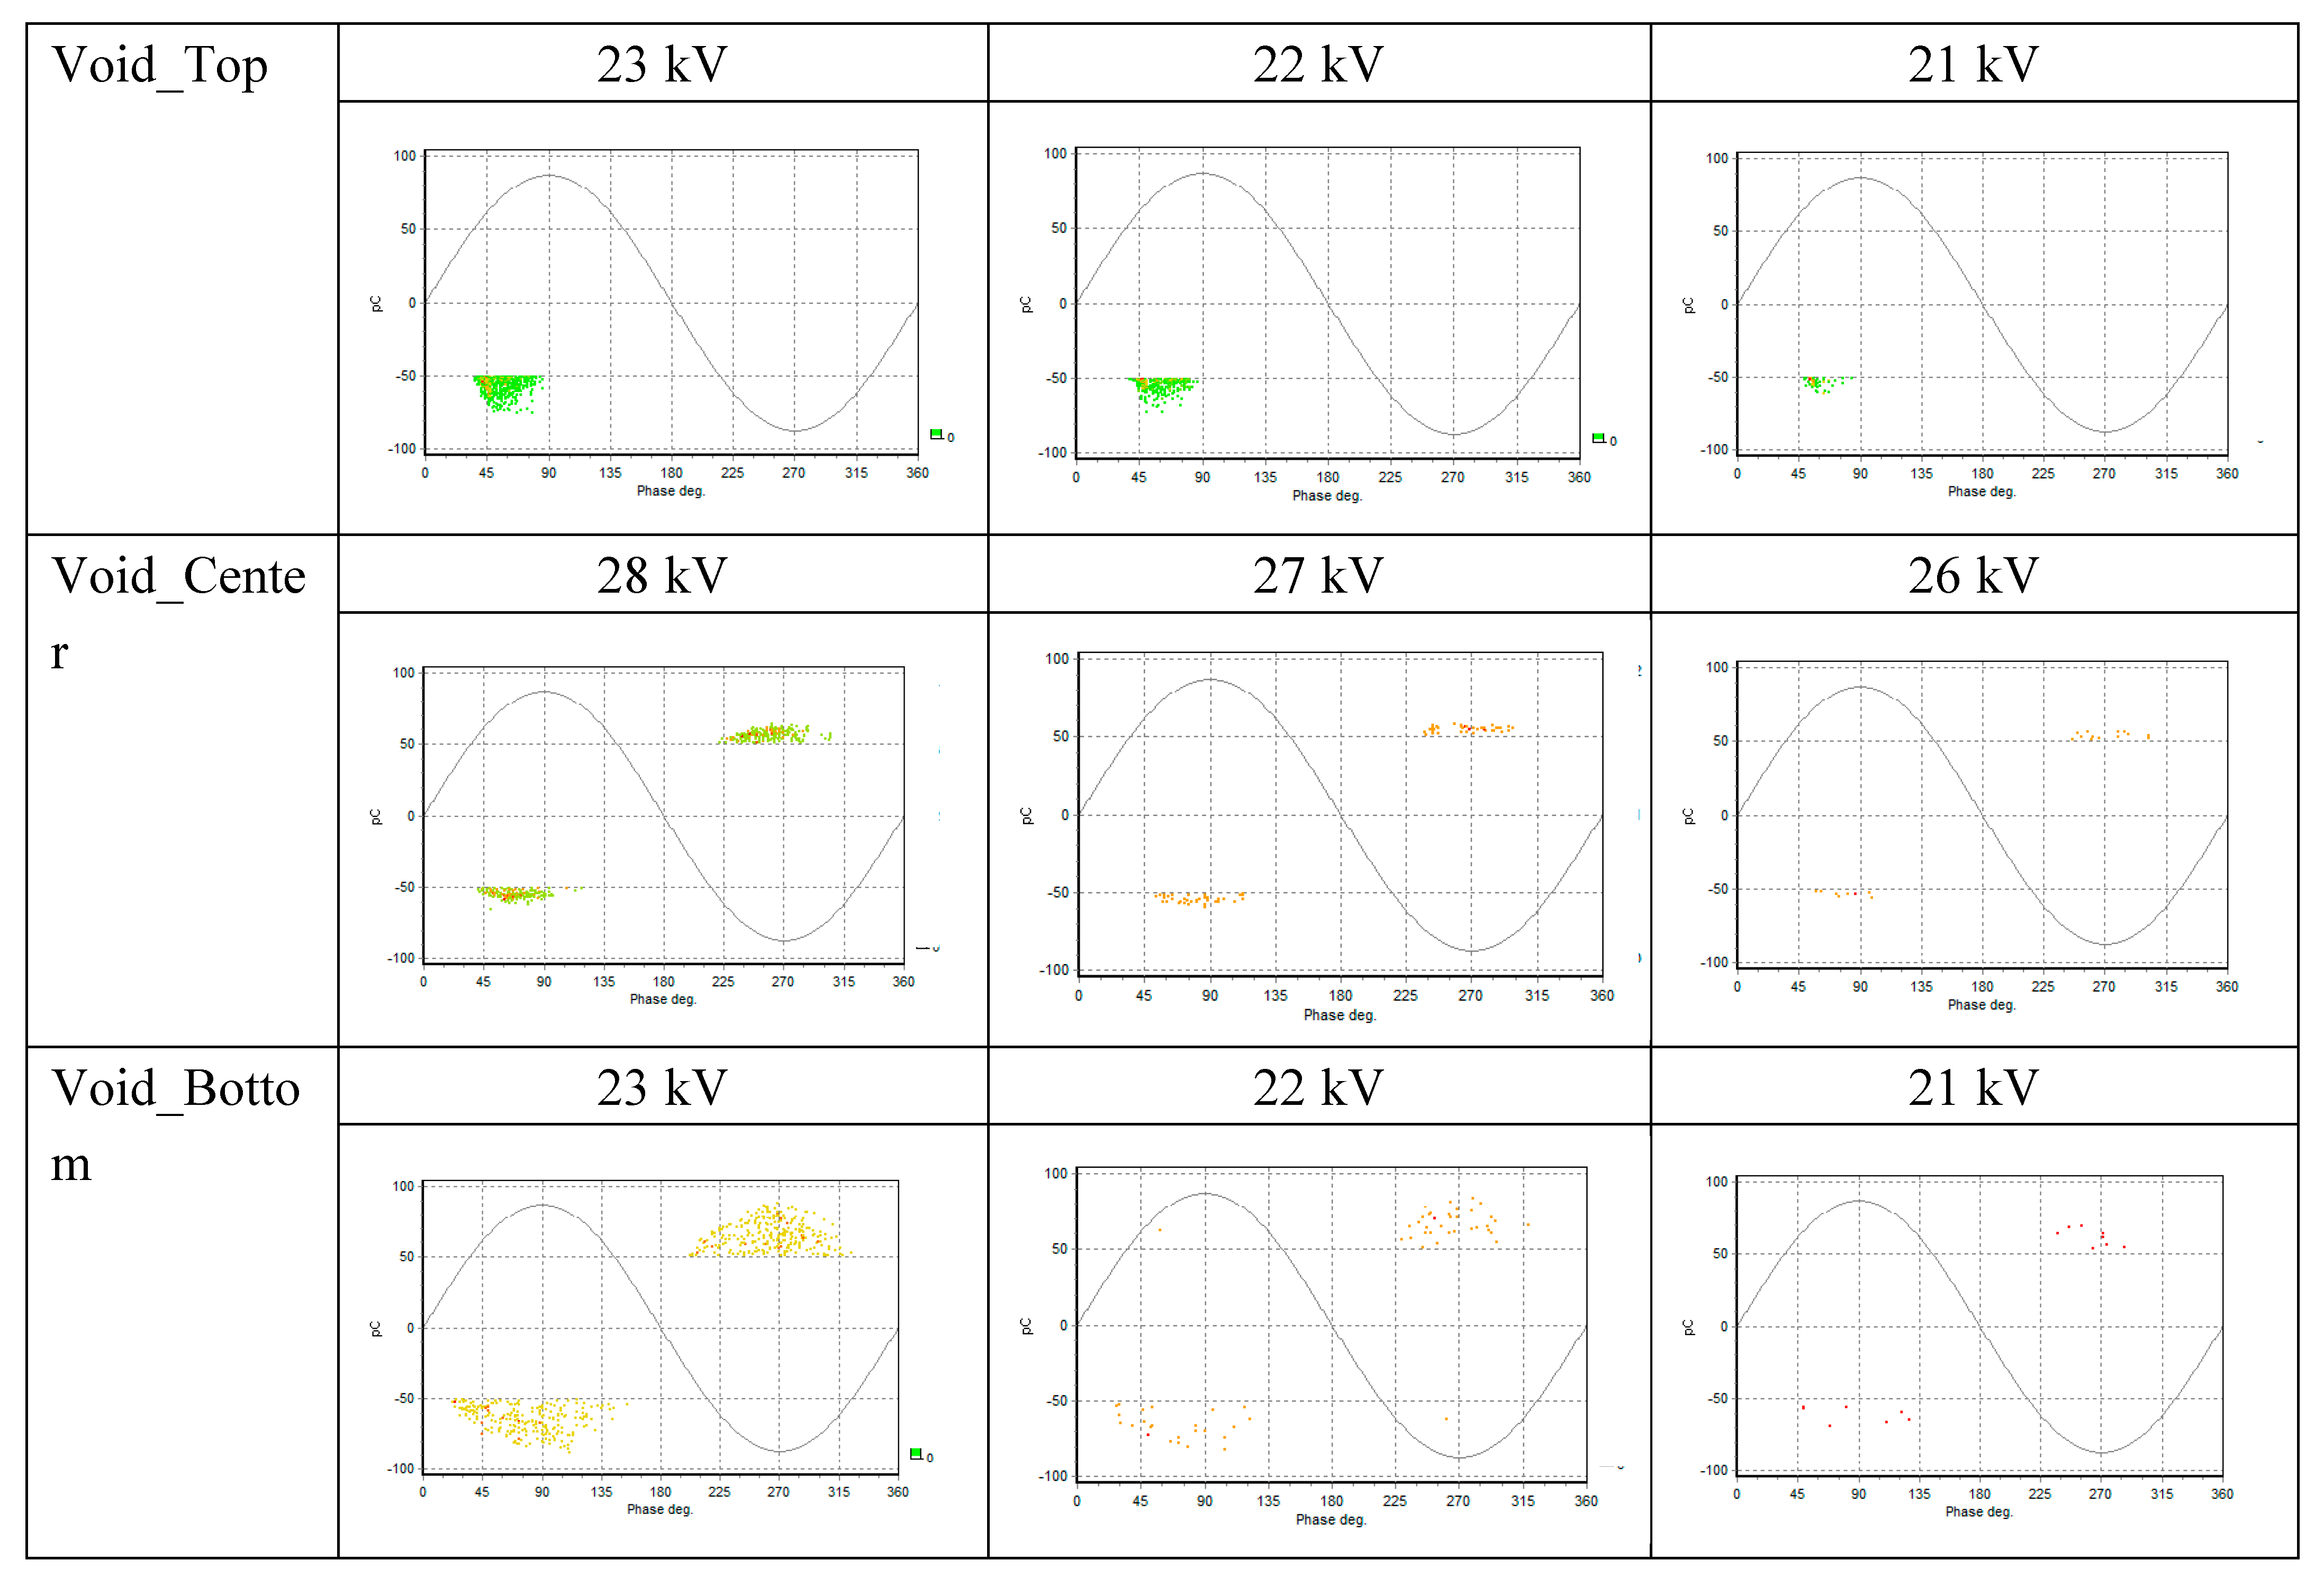
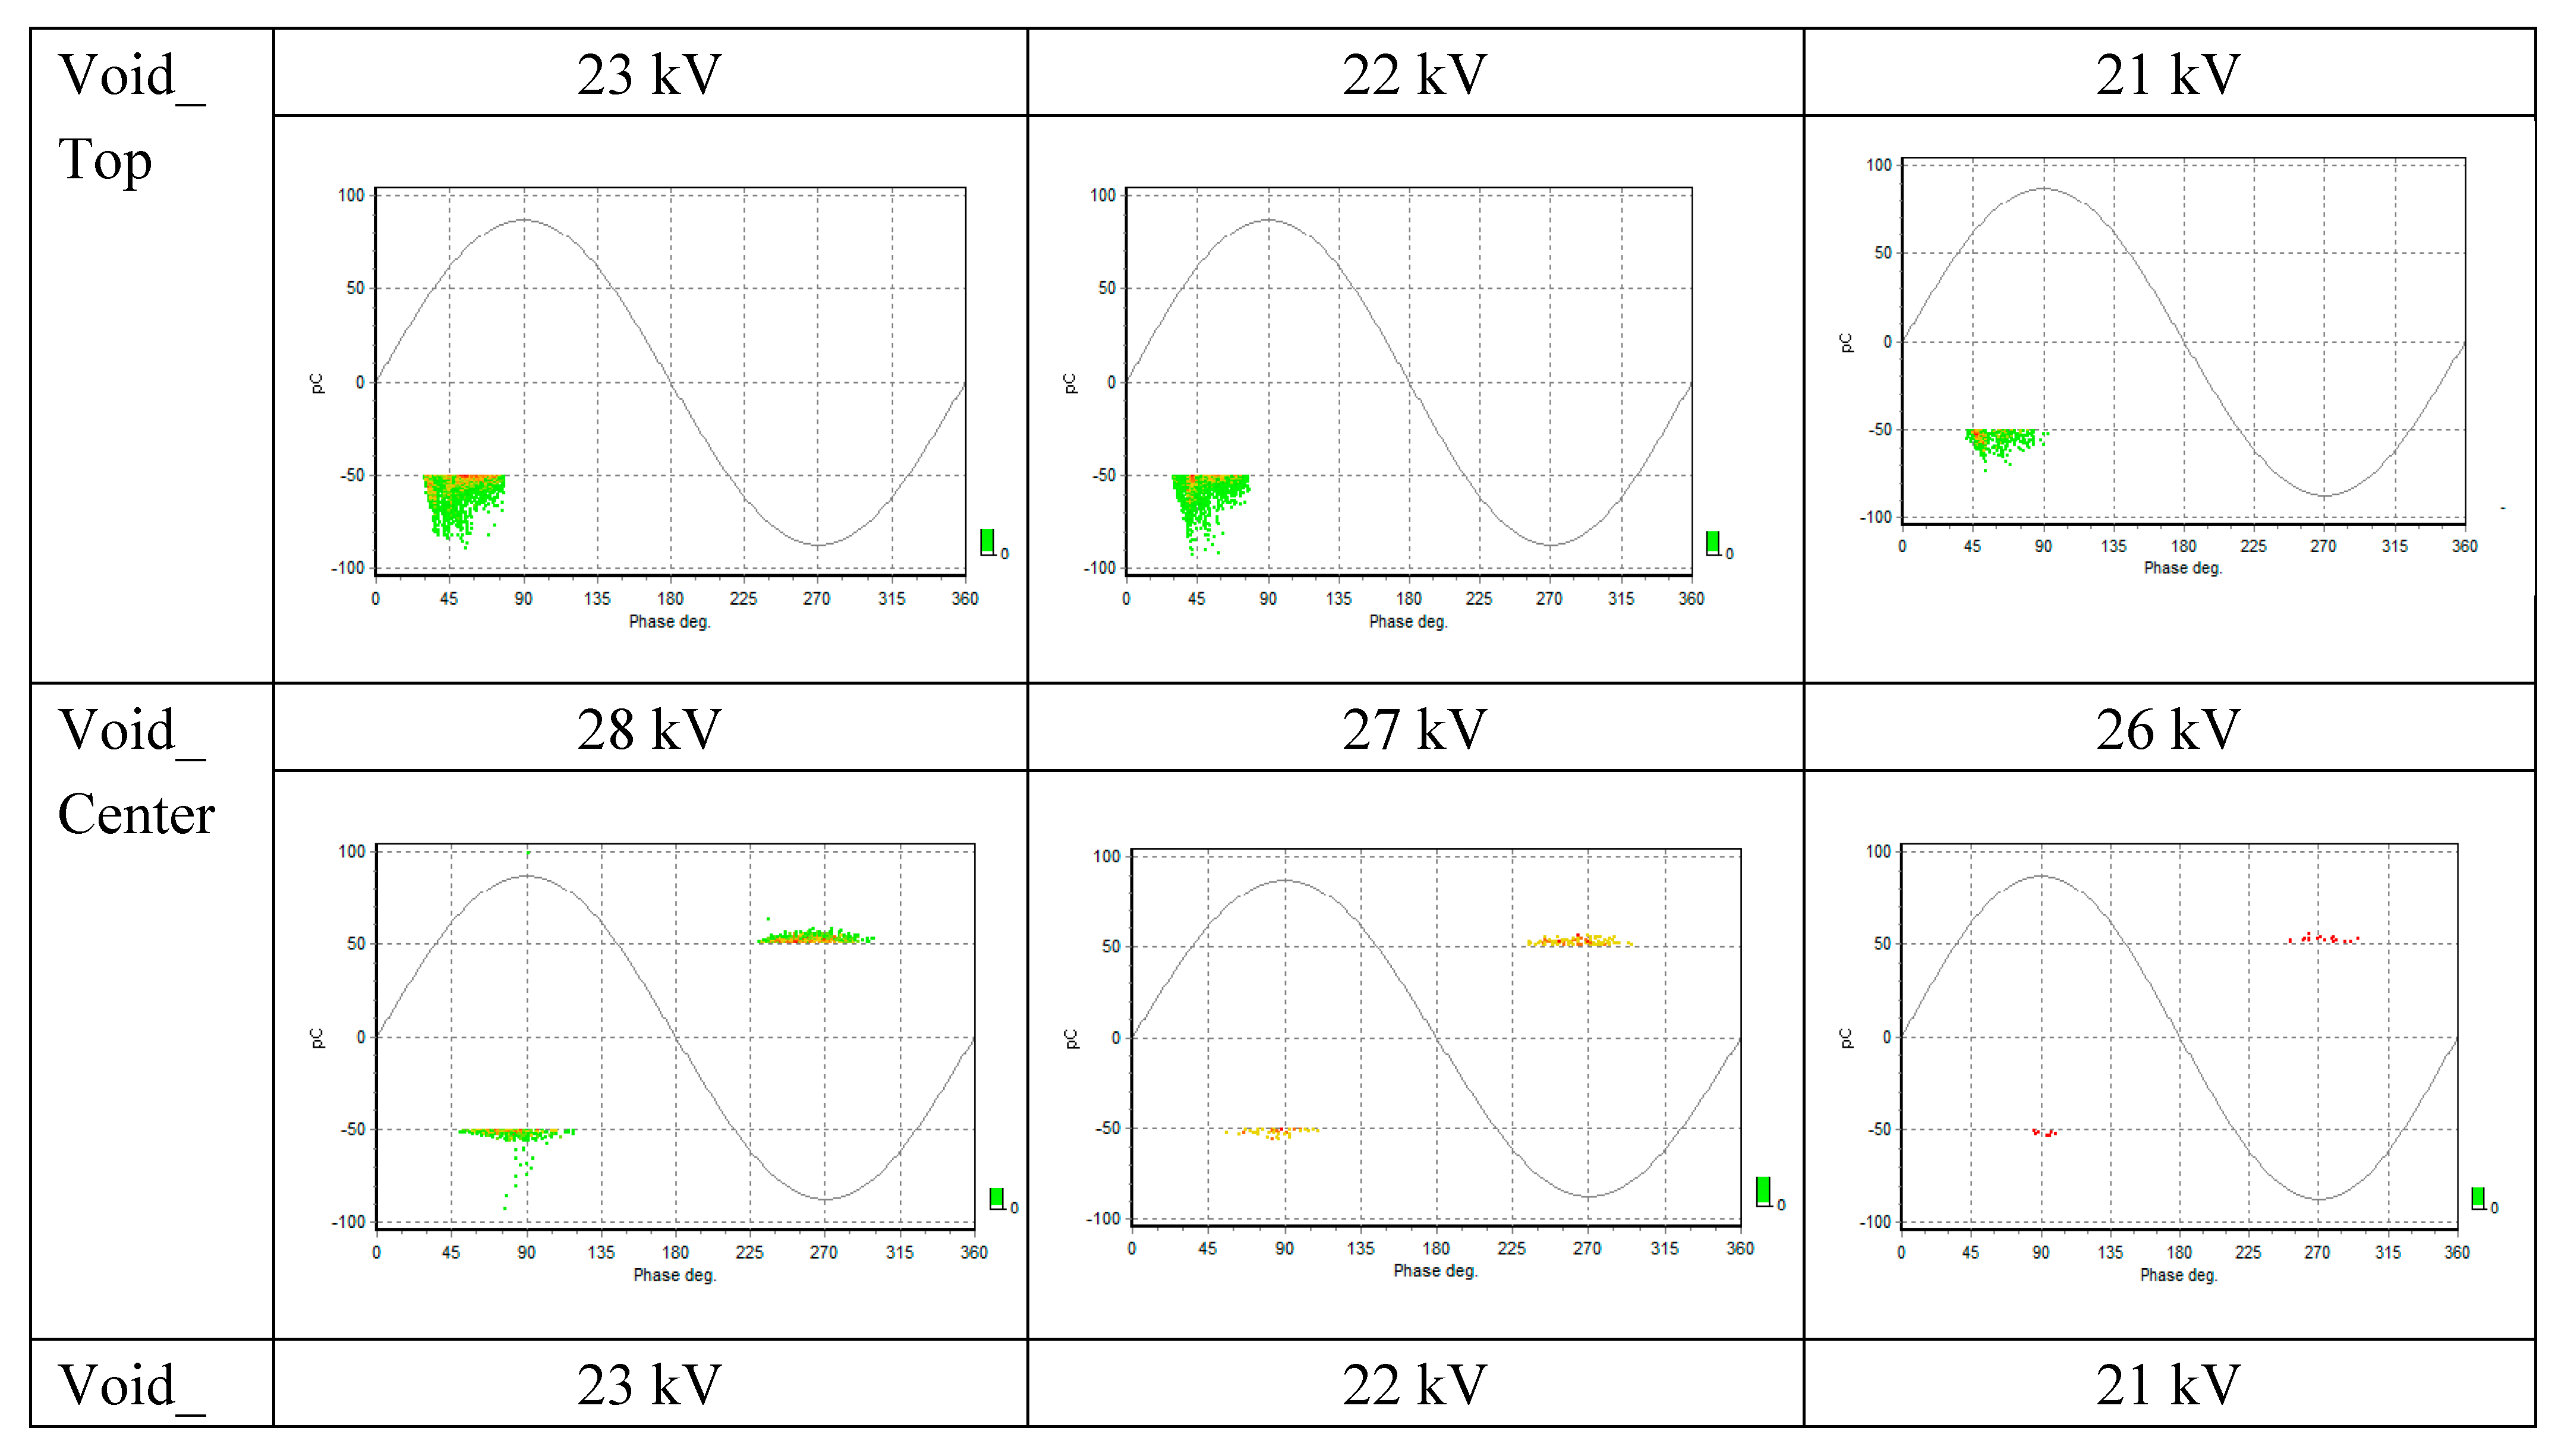
The PRPD patterns during this voltage reduction process exhibited distinct characteristics. Ten PRPD patterns were captured for a one-minute duration for each type of test sample from the lower PDIV to the PDEV, which were labelled as Void_ Top, Void_Center, and Void_Bottom. The PRPD patterns of these test samples demonstrated the influence of voltages from the PDEV to the PDIV on the PD pattern shapes, as shown in
Figure 8.
The visibility and stability of the patterns clearly improved as the voltage increased from the PDEV, based on an analysis of the PRPD patterns shown in
Figure 8. However, it is impractical to adjust the voltage levels during PD testing in real-world scenarios. A more feasible approach is to increase the measurement duration of the PRPD analysis.
In addition, there can be instances of inrush surges in practical scenarios, in which the voltage levels momentarily exceed the PDIV and then stabilize at normal or lower PDIV values over time. This voltage fluctuation makes it challenging to precisely adjust the voltage according to the desired PDIV. In such cases, increasing the measurement duration in the PRPD analysis becomes a more feasible and viable approach. This approach will be discussed in more detail in
Section 4.3.
After analyzing the PRPD pattern shapes, defect type testing of the CNN model that was trained using the PDIV and PRPD patterns (as discussed in
Section 4.1) was conducted with two data sets. The first data set included all the lower PDIV and PRPD patterns up to the PDEV, whereas the second data set only focused on the PDEV and PRPD patterns of the three defect types. The results of the test scenarios are presented in
Table 2.
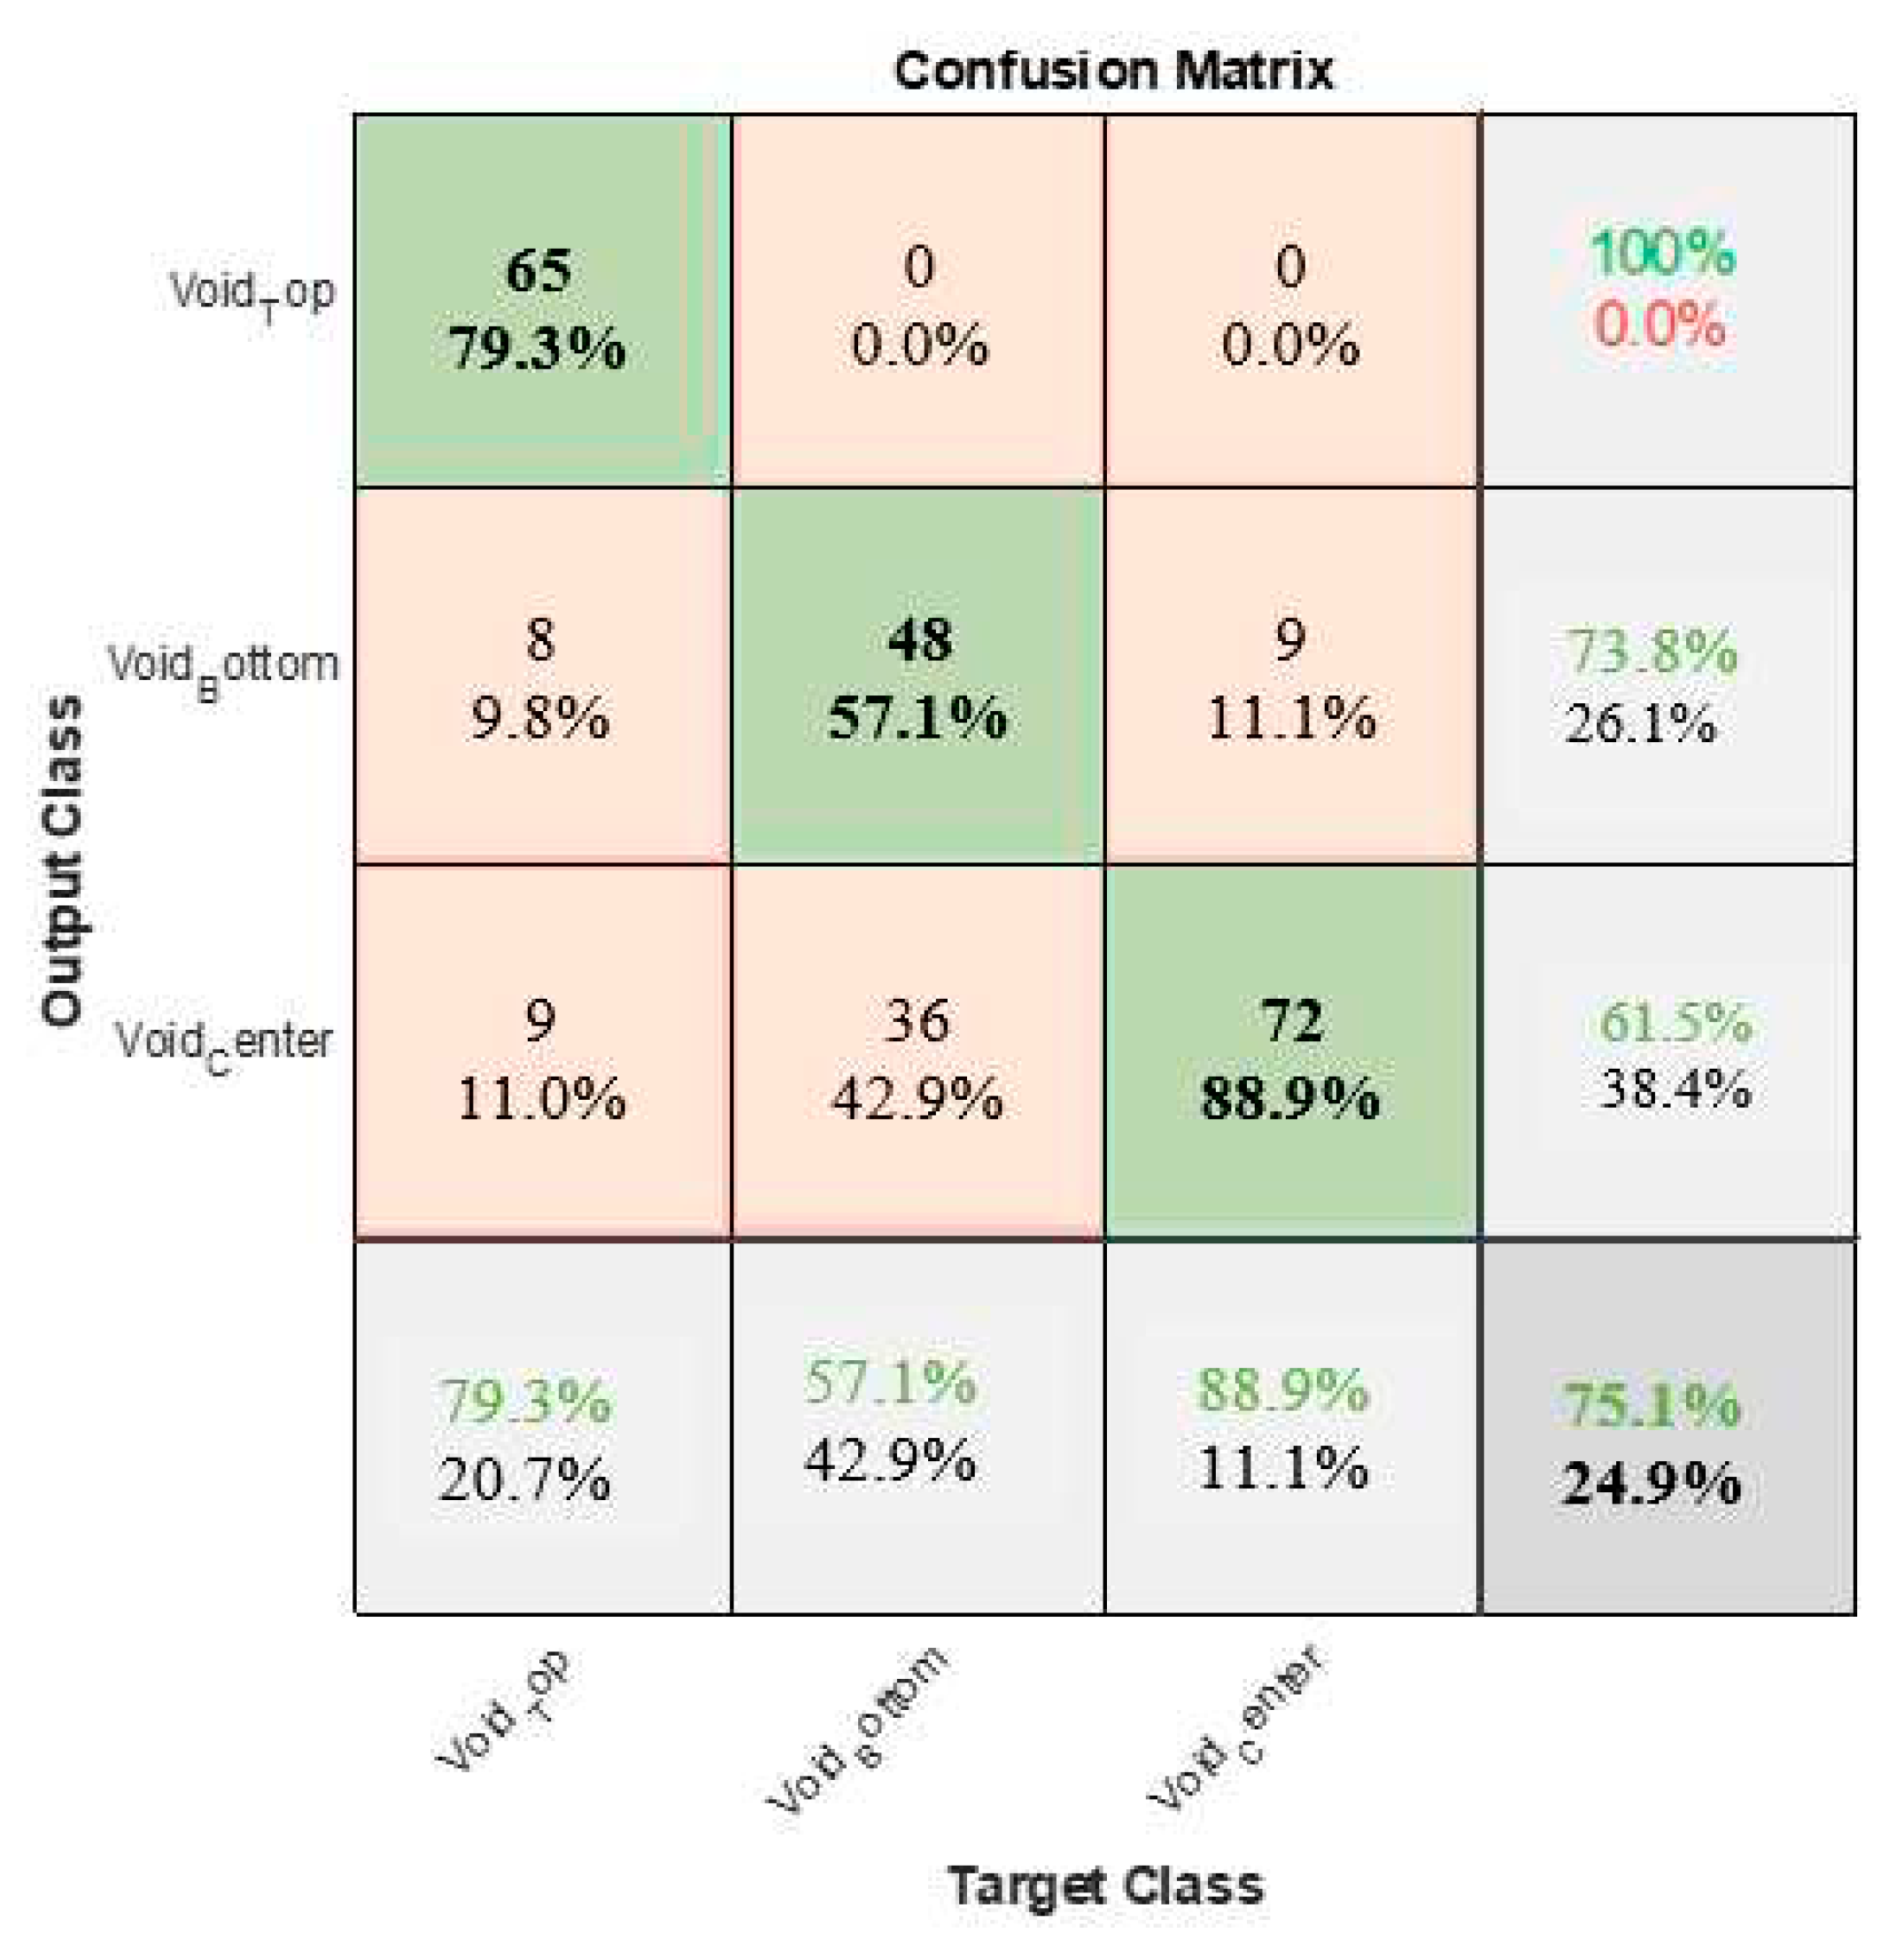
Considering all the lower PDIV values, the overall testing accuracies for the different void positions were 79.3%, 57.1%, and 88.9% for Void_ Top, Void_Bottom, and Void_Center, respectively. These accuracies indicated the ability of the trained CNN model to correctly classify the PRPD patterns associated with each void position.
However, the results showed a decrease in accuracy for Void_Top (50%) and Void_Bottom (20%) when focusing specifically on the testing accuracy at the PDEV compared to the accuracies obtained when considering all the lower PDIV values. Conversely, the testing accuracy for Void_Center remained at 88%, which may be due to the high PRPD data.
The confusion matrix of the CNN when testing the overall data from the lower PDIV to the PDEV is shown in
Figure 9. The reason for the lower accuracy of the Void_Bottom defect type was owing to the Void_Center accuracy being 42.9%.
4.3. Testing CNN Model with One-hour Measurement Duration
A wider range of PD events could be captured by extending the measurement duration, including those occurring during inrush surges and subsequent stable periods, as discussed in
Section 4.2. This provided a more comprehensive understanding of the defect patterns and their characteristics under different voltage conditions. Consequently, the CNN model trained on longer-duration PRPD patterns became more robust and capable of handling variations in voltage levels.
Defect recognition accuracy was improved by increasing the measurement duration to one hour for each voltage from the lower PDIV to the PDEV. This decision was made based on the observation that the condition of one-minute duration PRPD patterns did not yield satisfactory results.
The choice of one hour as the measurement duration was influenced by the maximum duration of the PD analyzer used in the experiment. This longer duration provided a more comprehensive capture of the PD activity and greater amount of data for analysis. The PRPD patterns of these test samples for the one-hour duration are depicted in
Figure 10.
Similar to previous conditions, it was clear that the visibility and stability of the patterns improved as the voltage increased, as shown from the analysis of the PRPD pattern shapes shown in
Figure 10. The defect recognition accuracy of the CNN model during defect type testing was significantly enhanced compared to similar test results from the one-minute condition, as summarized in
Table 3.
The overall testing accuracies for Void_Top, Void_Bottom, and Void_Center were all 100% when considering the lower PDIV values up to the PDEV. This indicated that the CNN model successfully classified the PRPD patterns for all three defect types with perfect accuracy.
Moreover, the testing accuracies for Void_Top, Void_Bottom, and Void_Center remained 100% when focusing specifically on the PDEV and PRPD patterns. This implies that the CNN model correctly identified the defect types without any misclassifications, even at the lowest voltage level (PDEV).
The highlight of these results is that the PRPD measurements for the transition from the one-minute to one-hour duration led to improved accuracy in defect recognition. The CNN model achieved perfect classification accuracy for all defect types, demonstrating its enhanced ability to differentiate between the PRPD patterns. Additionally, the robust generalization of the model was evident, as it maintained perfect accuracy at the lowest voltage level (PDEV). The extended measurement duration allowed the capture of more distinct PRPD patterns, resulting in enhanced discrimination and improved defect recognition across different void positions in the epoxy resin samples.
These findings underscore the need to consider and analyze weak PD signals, even at the PDEV, as they can provide valuable insights for reliable defect recognition.
5. Discussion
The main objective of this study was to compare the performance of CNN models trained on one-minute duration PRPD patterns at the PDIV and evaluate their effectiveness in defect type recognition under two testing conditions. The first condition involved testing the CNN model with one-minute duration PRPD patterns recorded from the lower PDIV to the PDEV, whereas the second condition involved testing with one-hour duration PRPD patterns.
The results clearly demonstrated the crucial role of measurement duration in defect type recognition accuracy in epoxy resin materials with void defects. Moderate to high accuracy for defect recognition was observed when testing the CNN model with one-minute duration PRPD patterns recorded from the lower PDIV to the PDEV. However, certain misclassifications occurred. Remarkable improvements in accuracy were achieved when using one-hour duration PRPD patterns recorded at the PDEV. Furthermore, the CNN model successfully recognized void defects at different positions with 100% accuracy.
This study is important because it addresses the critical challenges in defect recognition in PRPD analysis, specifically the impact of inrush surges, longer measurement durations for PD, and potential of using CNNs. By exploring these aspects, this study contributes to the advancement of defect detection techniques for high-voltage equipment, fosters improved operational safety, and minimizes the risk of equipment failures.
Weak PDs at the PDEV present a challenge owing to their lower intensities and less pronounced patterns. Future research could focus on developing adaptive thresholding methods that dynamically adjust the detection threshold based on signal characteristics. This would enable more accurate identification and classification of weak PD signals, thereby improving the overall performance of defect recognition algorithms.
References
- Aschenbrenner, D.; Kranz, H.-G. On line PD measurements and diagnosis on power transformers. IEEE Trans. Dielectr. Electr. Insul. 2005, 12, 216–222. [Google Scholar] [CrossRef]
- Ashtiani, M.B.; Shahrtash, S.M. On-line decision tree-based insulation assessment employing mathematical morphology filters for HV cables. IEEE Trans. Dielectr. Electr. Insul. 2013, 20, 1347–1355. [Google Scholar] [CrossRef]
- Shahsavarian, T.; Pan, Y.; Zhang, Z.; Pan, C.; Naderiallaf, H.; Guo, J.; Li, C.; Cao, Y. A review of knowledge-based defect identification via PRPD patterns in high voltage apparatus. IEEE Access 2021, 9, 77705–77728. [Google Scholar] [CrossRef]
- IEC International Standard 60270: High-voltage test techniques - partial discharge measurements. International Electrotechnical Commission.
- Cavallini, A.; Conti, M.; Montanari, G.C.; Arlotti, C.; Contin, A. PD inference for the early detection of electrical treeing in insulation systems. IEEE Trans. Dielectr. Electr. Insul. 2004, 11, 724–735. [Google Scholar] [CrossRef]
- Gulski, E.; Smit, J.J.; Wester, F.J. PD knowledge rules for insulation condition assessment of distribution power cables. IEEE Trans. Dielectr. Electr. Insul. 2005, 12, 223–239. [Google Scholar] [CrossRef]
- Ma, H.; Chan, J.C.; Saha, T.K.; Ekanayake, C. Pattern recognition techniques and their applications for automatic classification of artificial partial discharge sources. IEEE Trans. Dielectr. Electr. Insul. 2013, 20, 468–478. [Google Scholar] [CrossRef]
- Janani, H.; Kordi, B.; Jozani, M.J. Classification of simultaneous multiple partial discharge sources based on probabilistic interpretation using a two-step logistic regression algorithm. IEEE Trans. Dielect. Elect. Insul. 2017, 24, 54–65. [Google Scholar] [CrossRef]
- Truong, L.H.; Lewin, P.L. Convolutional resolved analysis of partial discharges in liquid nitrogen under AC voltages. IEEE Trans. Dielectr. Electr. Insul. 2013, 20, 2179–2187. [Google Scholar] [CrossRef]
- Schifani, R.; Candela, R.; Romano, P. On PD mechanisms at high temperature in voids included in an epoxy resin. IEEE Trans. Dielect. Elect. Insul. 2001, 8, 589–597. [Google Scholar] [CrossRef]
- Gutfleisch, F.; Niemeyer, L. Measurement and simulation of PD in epoxy voids. IEEE Trans. Dielect. Elect. Insul. 1995, 2, 729–743. [Google Scholar] [CrossRef]
- Caprara, A.; Ciotti, G.; Cavallini, A.; Rumi, A. The definition of RPDIV in impulsive testing and the effect of the electrical conditioning on the variability of the results. In Proceedings of the 2020 IEEE Electrical Insulation Conference (EIC), Knoxville, TN, USA, 22 June 2020; pp. 234–237. [Google Scholar] [CrossRef]
- Caprara, A.; Ciotti, G.; Cavallini, A.; Rumi, A. The RPDIV and the limits of its definition according to IEC 60034-18-41: the effect of voltage conditioning. In Proceedings of the 2019 IEEE Electrical Insulation Conference (EIC), Calgary, AB, Canada, 16 June 2019; pp. 180–183. [Google Scholar] [CrossRef]
- Song, H.; Dai, J.; Sheng, G.; Jiang, X. GIS partial discharge pattern recognition via deep convolutional neural network under complex data source. IEEE Trans. Dielect. Elect. Insul. 2018, 25, 678–685. [Google Scholar] [CrossRef]
- Peng, X.; Yang, F.; Wang, G.; Wu, Y.; Li, L.; Li, Z.; Bhatti, A.; Zhou, C.; Hepburn, M.; Reid, J.; Judd, D.; Siew, H. A Convolutional Neural Network-Based Deep Learning Methodology for Recognition of Partial Discharge Patterns from High-Voltage Cables. IEEE Trans. Pow. Del. 2019, 34, 1460–1469. [Google Scholar] [CrossRef]
- Chang, C.-K.; Chang, H.-H.; Boyanapalli, B.K. Application of Pulse Sequence Partial Discharge Based Convolutional Neural Network in Pattern Recognition for Underground Cable Joints. IEEE Trans. Dielect. Elect. Insul. 2022, 29, 1070–1078. [Google Scholar] [CrossRef]
- Hui, S.; Dai, J.; Sheng, G.; Jiang, X. GIS partial discharge pattern recognition via deep convolutional neural network under complex data source. IEEE Trans. Dielect. Elect. Insul. 2018, 25, 678–685. [Google Scholar] [CrossRef]
- Li, G.; Wang, X.; Li, X.; Yang, A.; Rong, M. Partial discharge recognition with a multi-resolution convolutional neural network. Sensors 2018, 18, 1–27. [Google Scholar] [CrossRef] [PubMed]
- Shibuya, Y.; Zoledziowski, S.; Calderwood, J.H. Void formation and electrical breakdown in epoxy resin. IEEE Trans. Dielect. Elect. Insul. 1977, 96, 198–207. [Google Scholar] [CrossRef]
|
Disclaimer/Publisher’s Note: The statements, opinions and data contained in all publications are solely those of the individual author(s) and contributor(s) and not of MDPI and/or the editor(s). MDPI and/or the editor(s) disclaim responsibility for any injury to people or property resulting from any ideas, methods, instructions or products referred to in the content. |
© 2023 by the authors. Licensee MDPI, Basel, Switzerland. This article is an open access article distributed under the terms and conditions of the Creative Commons Attribution (CC BY) license (http://creativecommons.org/licenses/by/4.0/).
