1. Introduction
Greenhouse gases are contributing to global warming resulting in the amplification of several problems, including environmental problems. One of the ways to control the concentrations of these gases is, e.g., by the reduction of fossil fuels in energy sectors.
Therefore, wind energy is an important ally in this process. Thus, energy forecasting and planning are important for different stakeholders’ decision-making in global energy development. Forecasting studies related to wind energy are essential to know the potential of a given location and for the installation of wind farms, once a forecast study with high uncertainty will generate a cubed error on the predicted power value, which can result in huge losses for investors. Therefore, knowing research trends in this area can guide researchers and investors in decision-making, avoiding future losses. Forecasting is the means of obtaining predicted ranges based on future demand from present and past data, generally investigating future trends [
1].
Among some important articles that portray the importance of the subject, we can cite [
2,
3,
4]. There are several forecasting models, their applications are quite comprehensive, therefore, this review article highlights the cutting-edge works on wind speed forecasting models, considering a period of the last five years, since 2019, whose objective is to conduct a bibliometric analysis on the scientific production applied to the study of wind speed forecasts, using the Scopus database and the Bibliometrix tool. The bibliometric analysis allows identifying trends, patterns and gaps in scientific production on the subject, in addition to providing relevant information for the formulation of public policies and investments in research and development within this field. Through data analysis, it is possible to better understand the evolution and geographic distribution of scientific production, identify the main thematic areas of research, the main institutions and authors involved, among other relevant information. Based on these results, it is expected that we are able to contribute to the advancement of scientific knowledge on the subject.
2. Materials and Methods
For this study, the Scopus database was used as the source for the extracted scientific data in April 2023. Containing many articles from reputable sources, Scopus is a widely accepted and often used tool for both scientific research and data extraction. This study proposes mapping trends in the field of wind speed forecasting. The literature was searched considering all the last years, since 2019, using the advanced search options of “
title, abstract and keywords”. Bibliometrics helps to understand research traditions, employing citations, refinements and mapping clusters, indicating research networks. To compile the data and perform an analysis of the information, the Bibliometrix tool (
https://www.bibliometrix.org/) was used, a free software written in the R language [
5].
The search was performed by applying “
advanced search”, and when looking for the terms ("
forecast" OR "
prevision") AND "
wind" AND ("
turbine" OR "
power" OR "
energy" or "
velocity" or "
speed "), applying filters, according to
Table 1, for "
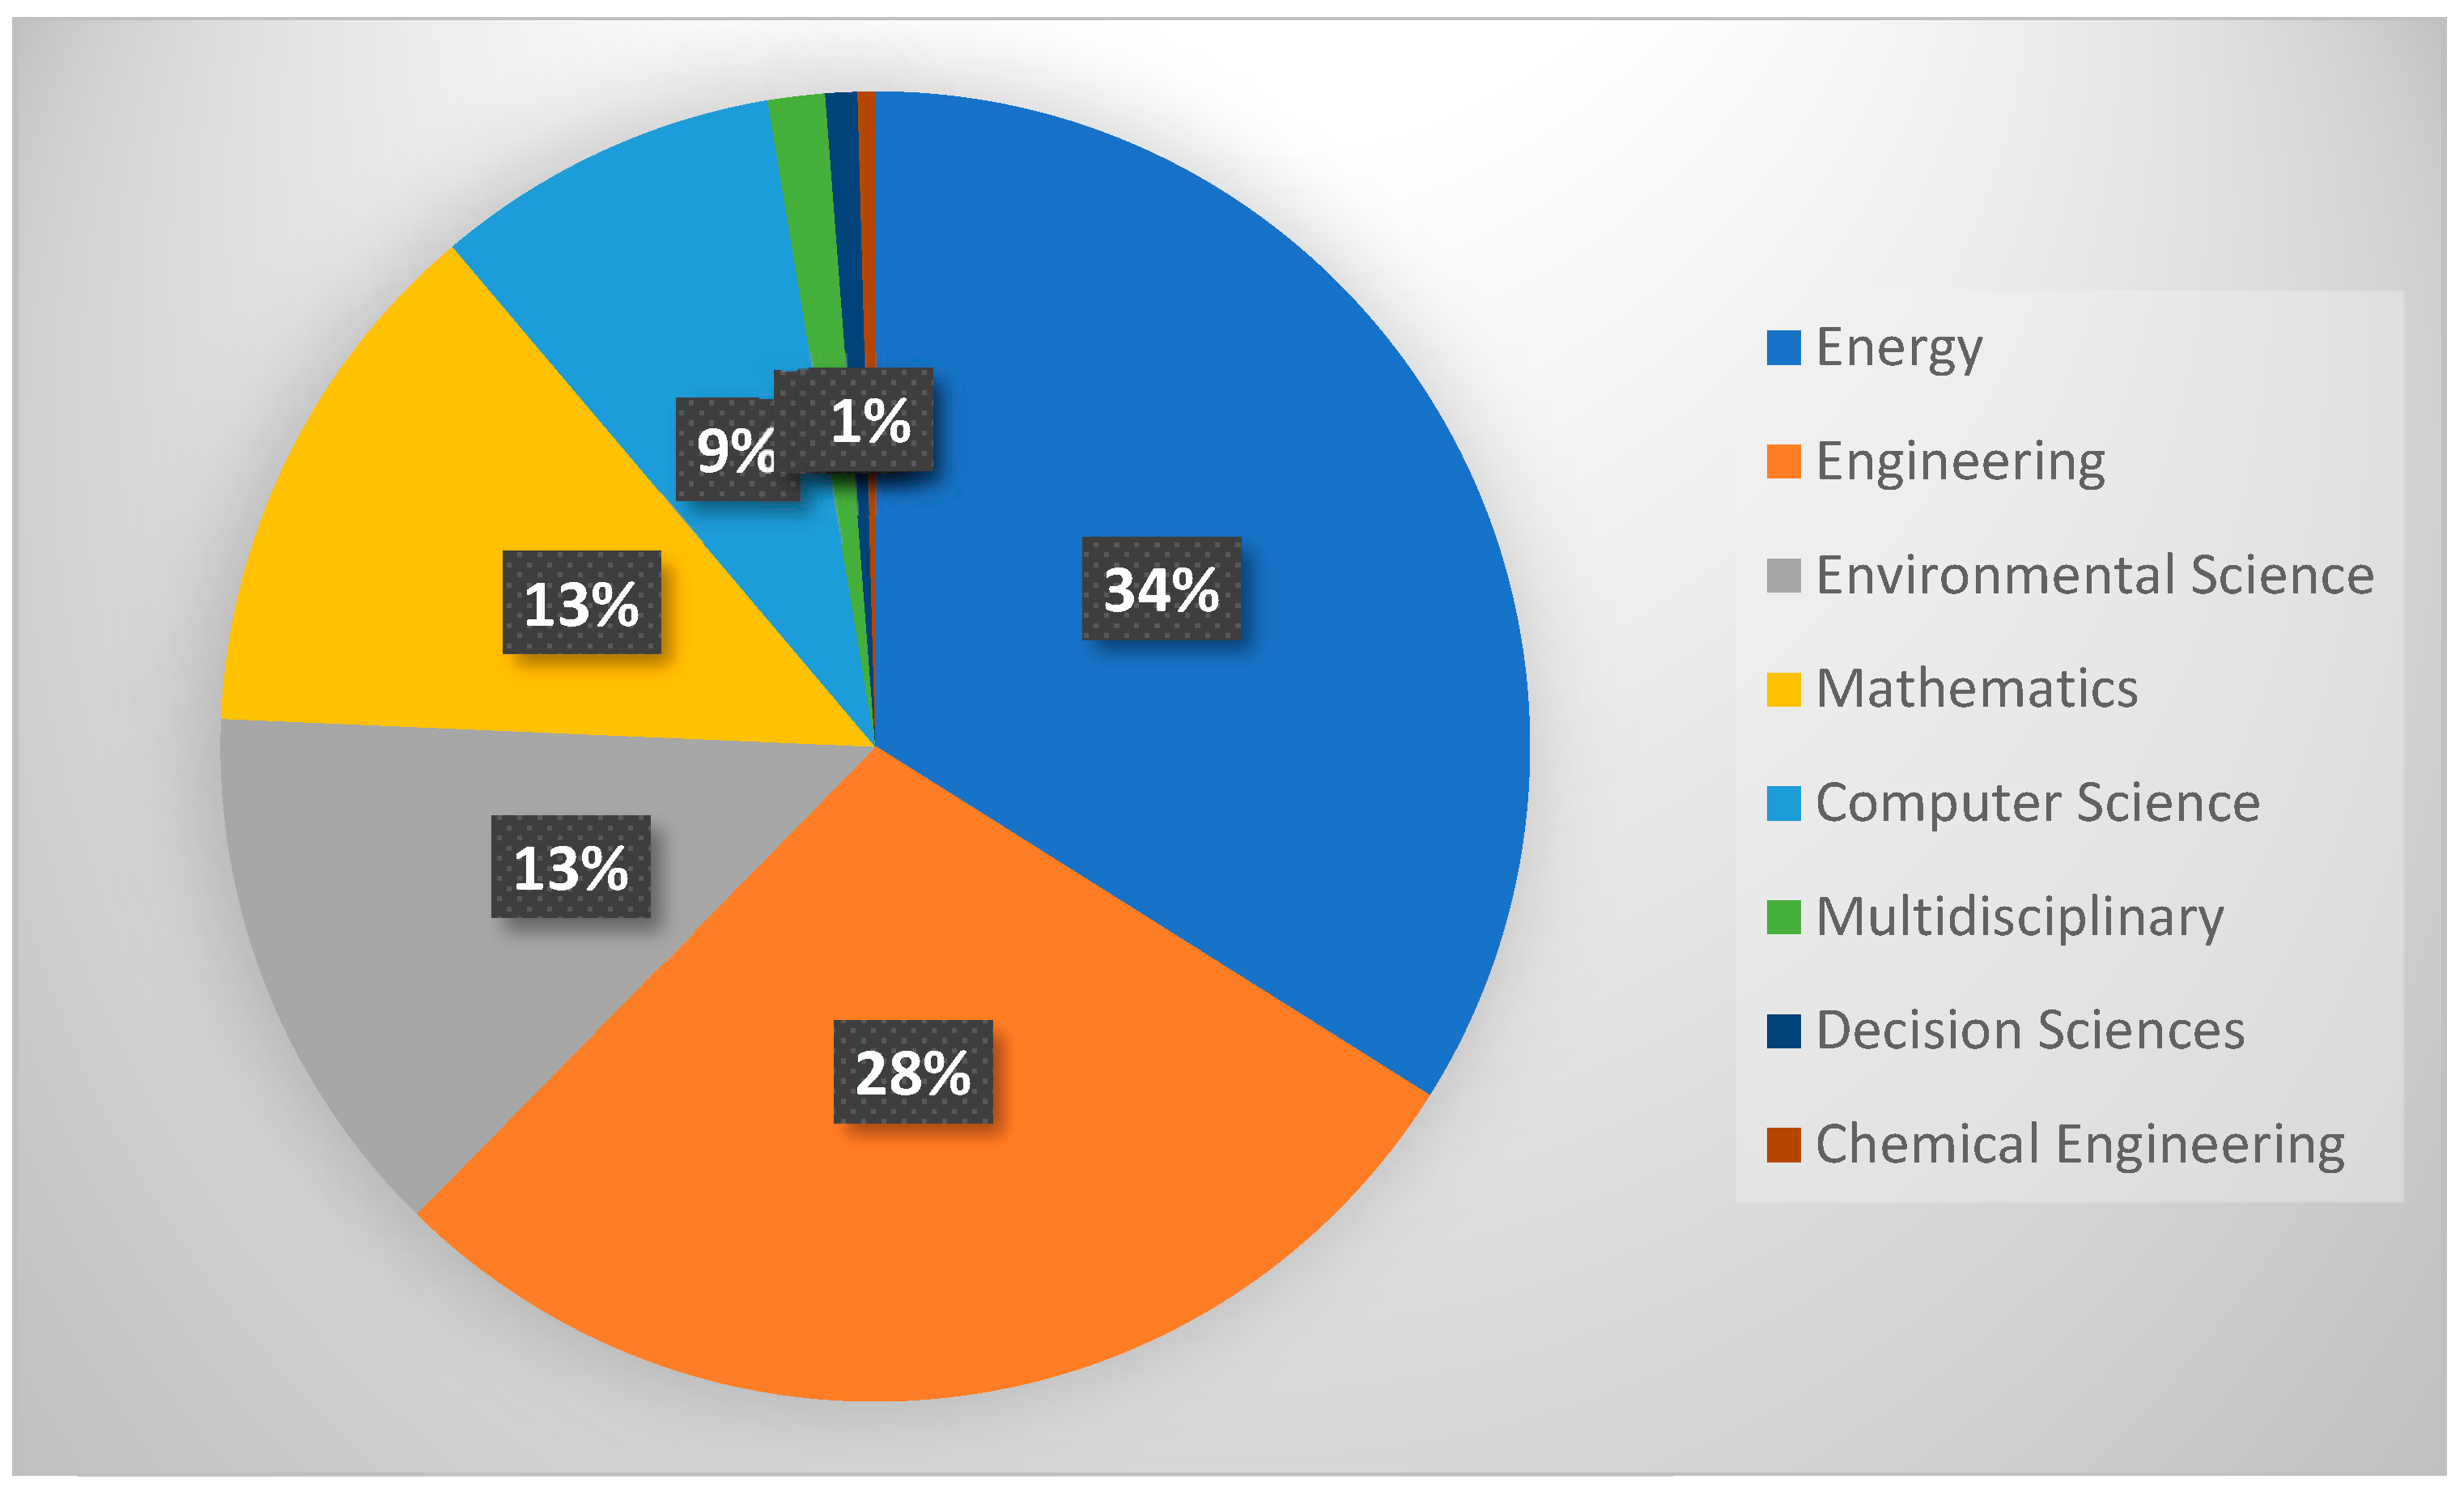
article and review", English language, final publication stage, type of source, there were 1,534 documents left, which were divided into the sub-areas described in
Figure 1.
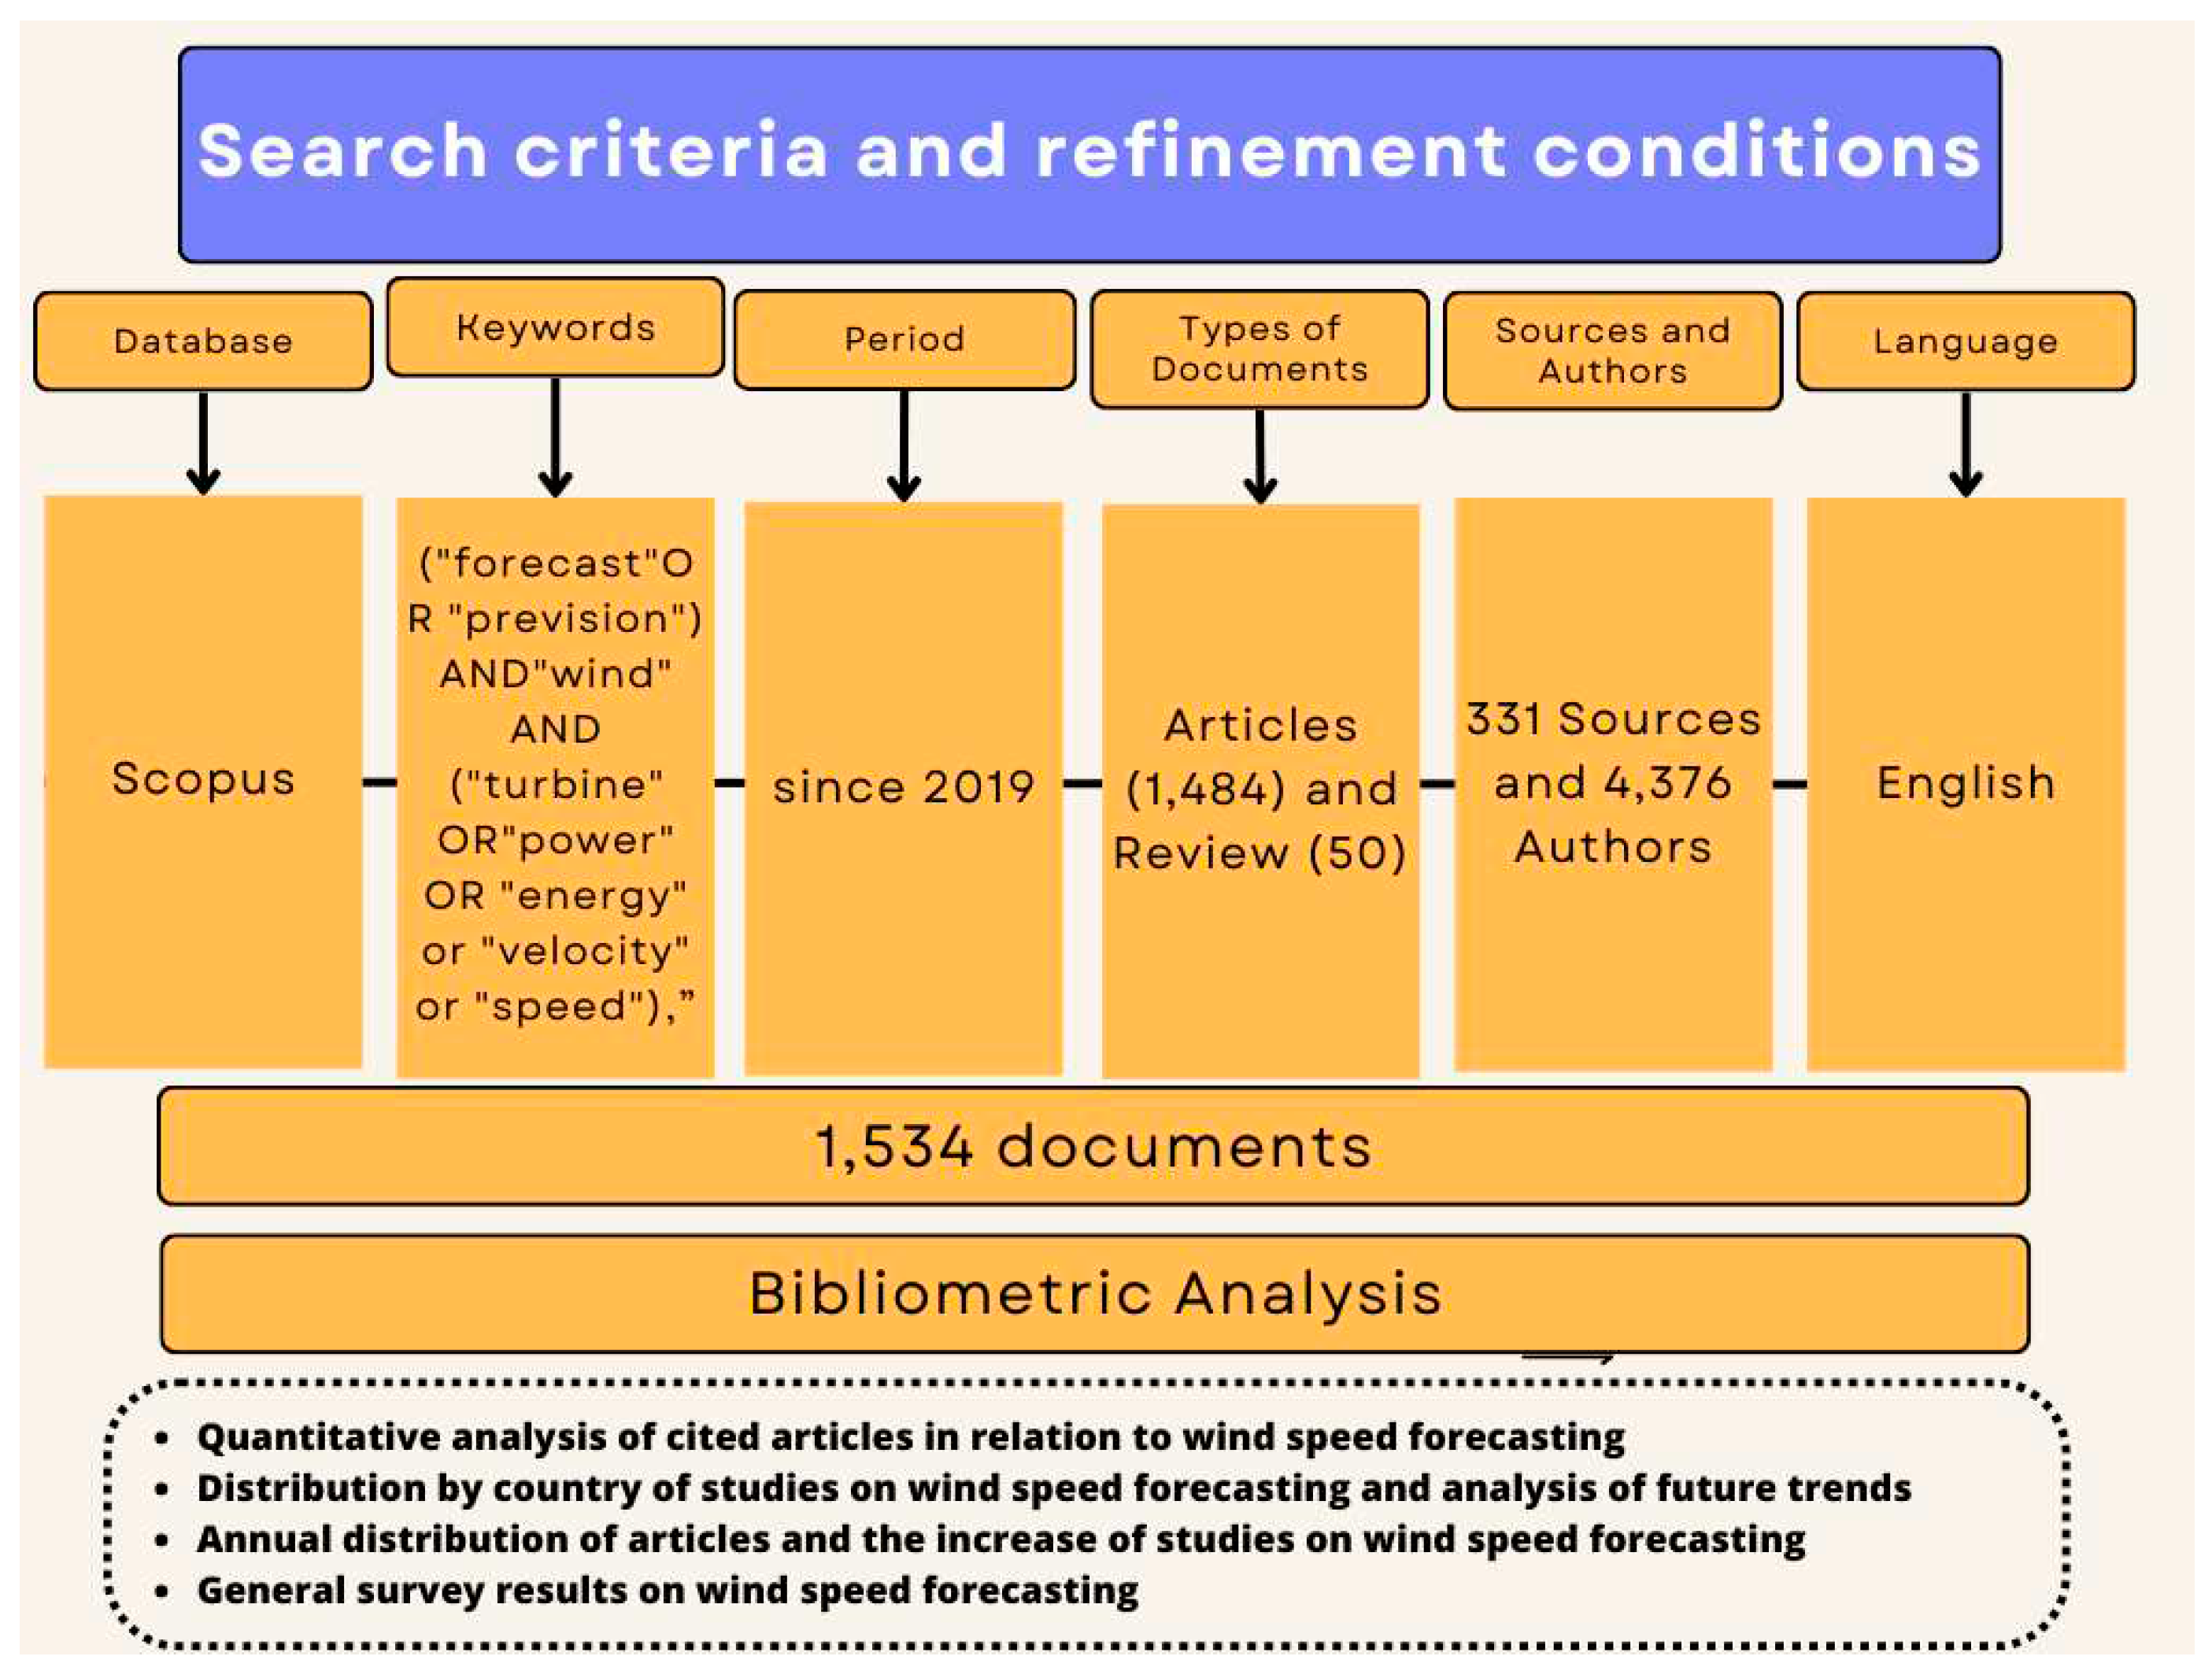
The final set contains a total of 1,534 documents, of which 1,484 are articles and 50 are review papers, distributed across 331 sources and with the participation of 4,376 authors. Thus, a thorough analysis to evaluate the participation of the newest developments, future research perspectives was carried out using this dataset.
Aiming to obtain accurate and reliable data based on the selected words, this search query was then implemented, including title, abstract, and author keywords. The systematic search was carried out considering the period since 2019, using Scopus database, up to the first week of April 2023, searching for published works in indexed journals to improve the understanding of the current situation of scientific research about wind velocity prediction. The search date was set as the first week of April to account for any changes in the number of articles that may have occurred over time as new articles were published. Data were obtained in .bib format, and analyzed in bibliometric software. The “Bibliometrix” package (R language) was used to obtain graphs, tables, and diagrams. Scopus (
https://www.scopus.com/) is the world's largest database of peer-reviewed interdisciplinary articles and it is continually expanding [
1], [
7]. It is an important provider of global research output across a multidisciplinary spectrum [
8], which is the reason it is a great choice for bibliometric studies.
The main objective here is to present a clear view of the technical progress and innovation within the wind speed forecasting field, and why it is so important to understand this phenomenon of nature, which directly impacts the production of wind energy. The methodology of this study was set by assessing the published works found in the Scopus database, for different “subject areas”, as shown in
Figure 1.
This is the set of publications worked on using Bibliometrix, allowing the construction of maps of journals, countries, institutions, and authors to understand the organization of the clusters. Standard spreadsheets were also used for the analysis.
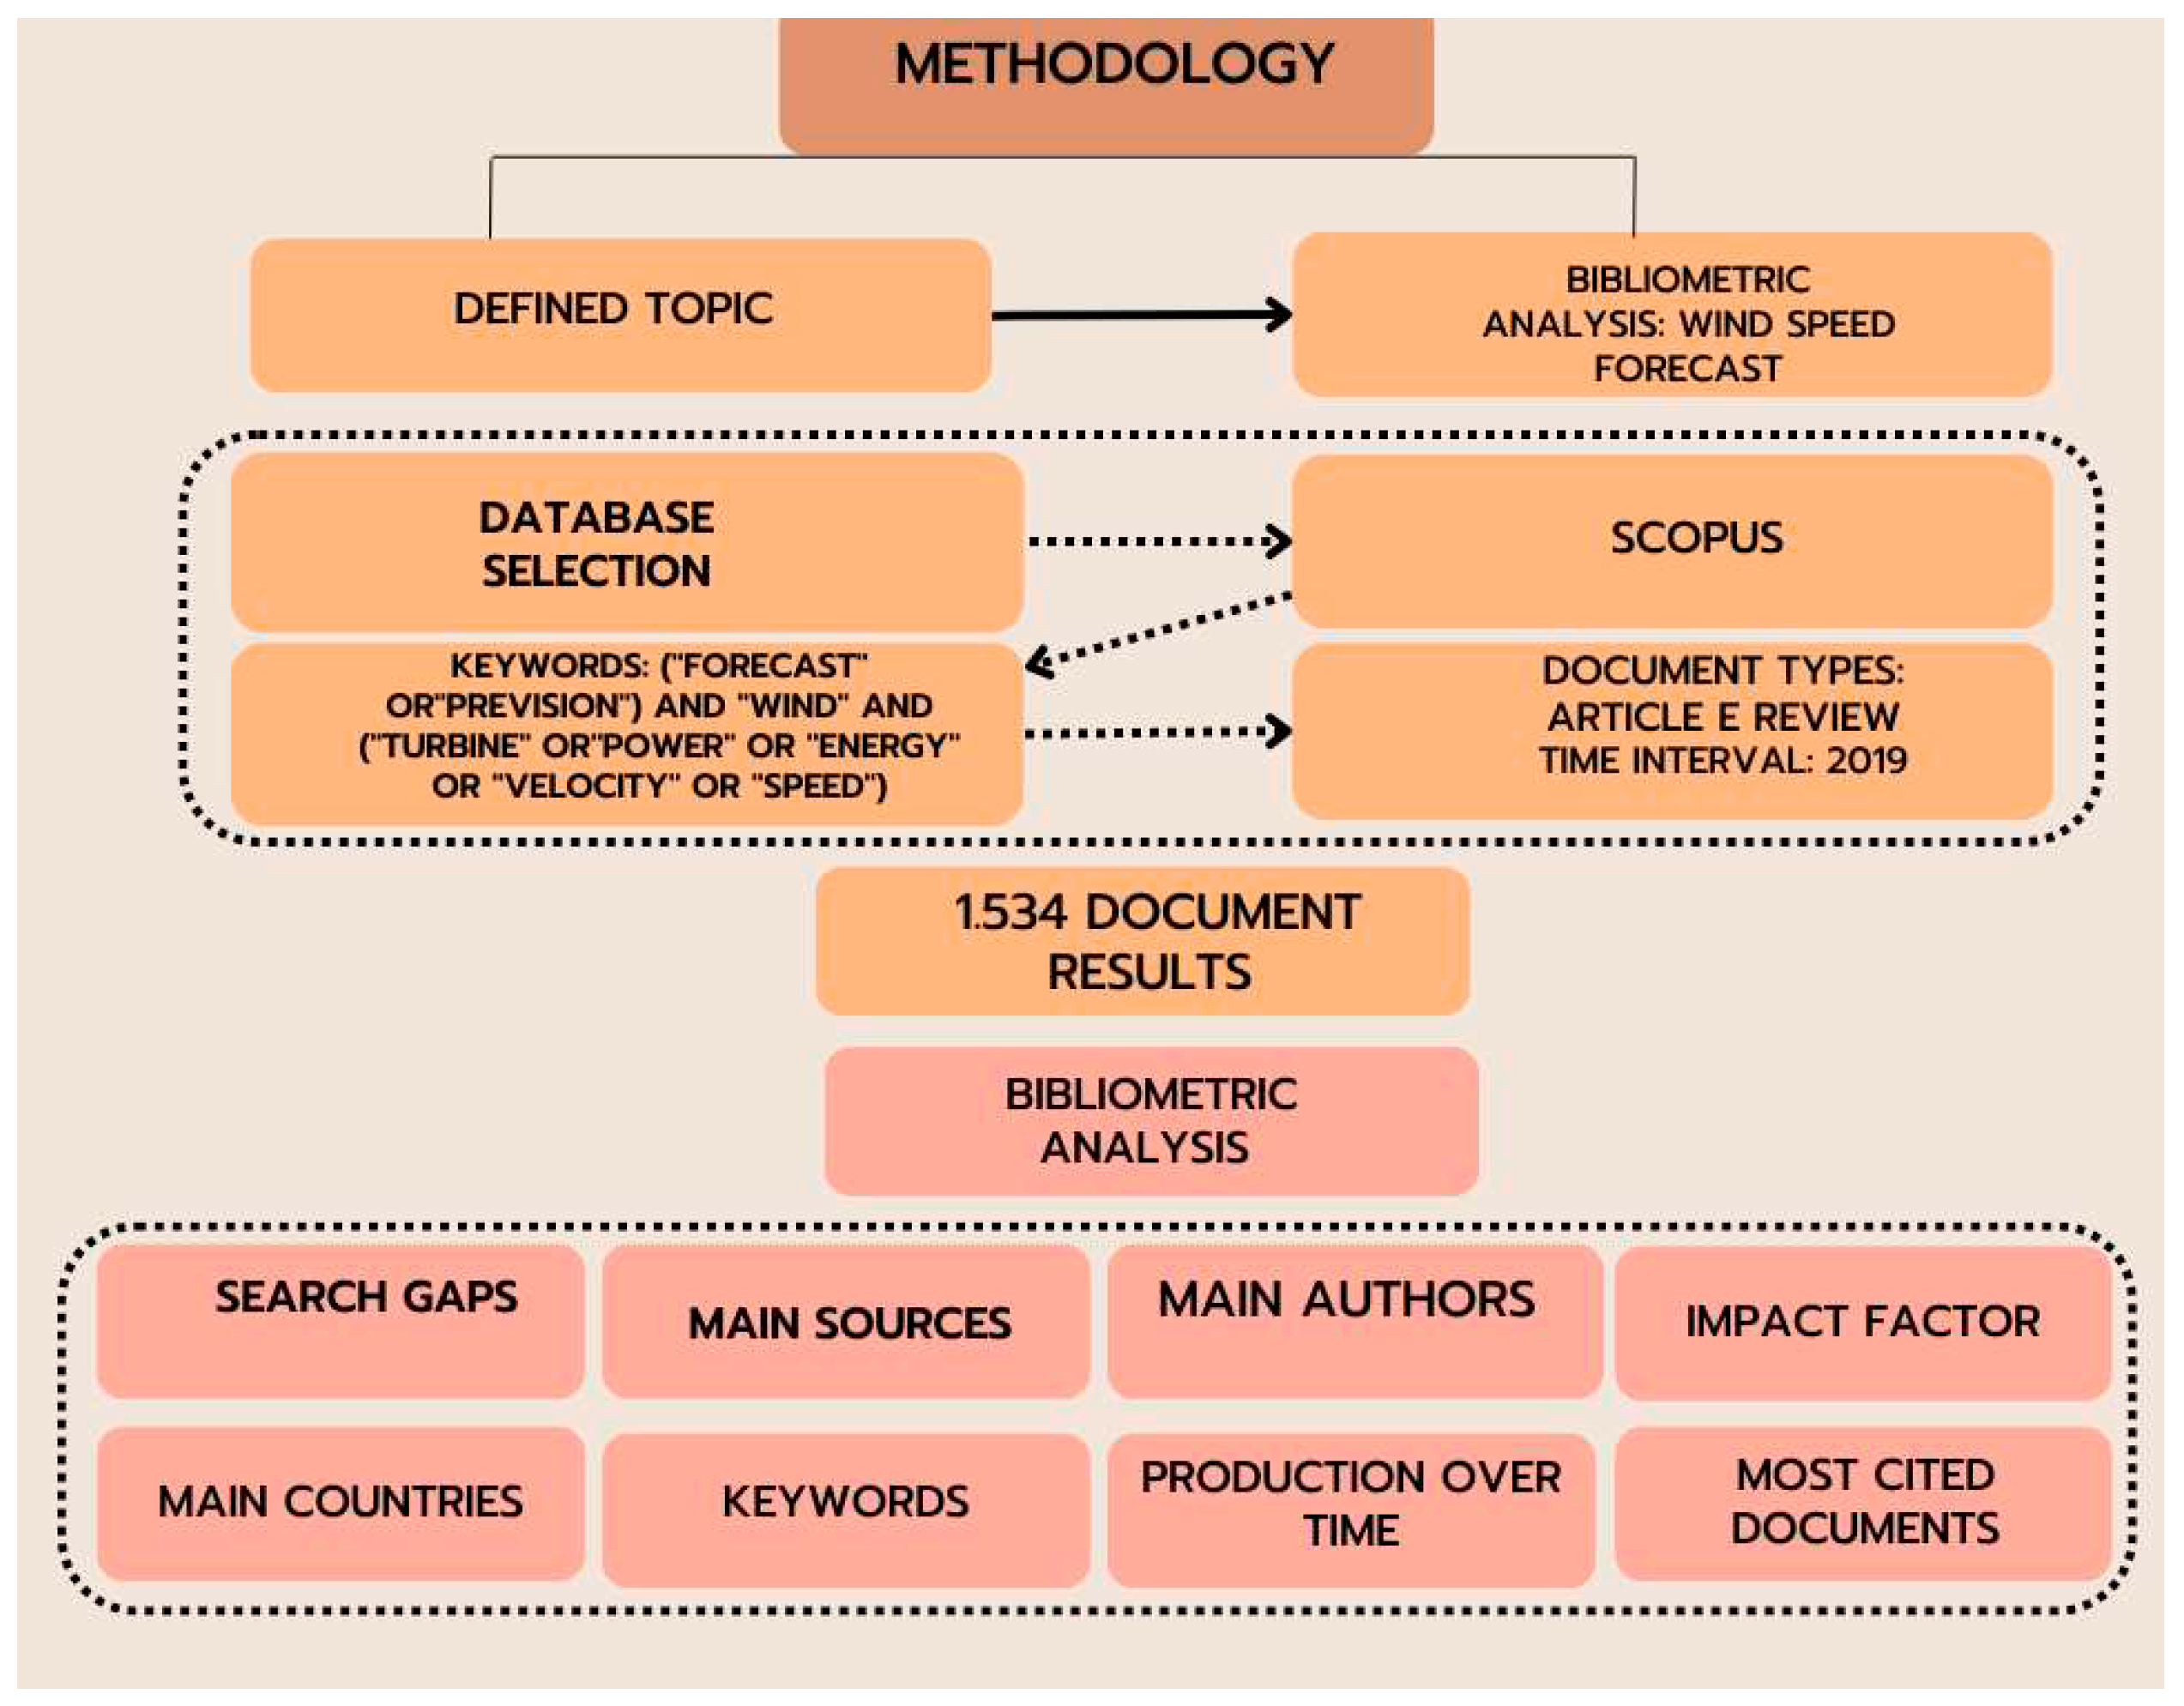
Figure 2 shows the chosen variables used to analyze information from articles of the Scopus database: (a) list of most cited articles; (b) authors' names, as well as the year of publication of the articles; (c) keywords; (d) number of citations of the documents; (e) journal sources; (f) most prestigious journals and their impact factor (IF); (i) countries and (j) research gaps. It is important to emphasize the importance of considering the impact factor (IF) of the journal and the h-index of an author. The IF can be obtained from the Scopus website and is always up to date. The h-index is as an indicator to quantify the research results of an academic. It is a unique value where
h of total publications (TP) hold a minimum of
h citations each and (TP-h) articles have
h citations each [
9].
Study limitations were added to promote insights and future developments in the research for wind speed forecasting. Finally, an analysis of the most cited works was carried out to contribute to an overview of the subject. The review’s results elucidate the outcomes of the bibliographic analysis and make recommendations for further research based on relevant conclusions from other articles.
3. Results
Bibliometric analyzes are scientific specialties, posing as a major aspect of research evaluation, especially in both the scientific and the applied sectors [
10]. The present bibliometric work using Scopus was carried out in the second week of April 2023, where, after using filters, 1,534 documents were reached, published since 2019. All the papers included in this study were sourced from journal articles and were published exclusively in English.
Figure 3 shows the search criteria and refinement conditions used.
The bibliometric study's findings on wind speed prediction are detailed in the sections that follow, highlighting the most important research areas, keywords, affiliations, journals, authors, and countries. Each aspect of the results is discussed to provide insight into the field of wind speed forecasting's progress, trends, updates, and hotspots.
The number of citations in a field is a crucial metric for categorizing and comprehending current research trends. It also serves as a clear indicator of the impact of a particular journal or publication, providing transparent data on the most significant areas of research, as well as current trends in wind speed prediction studies.
According to the observed data, the publication trend has been growing in recent years, with 268 articles published in 2019, 332 in 2020, 346 articles in 2021 and 438 documents in 2022. In the year 2023, so far, there are already 150 publications in this research area. Of course, an increase in the number of articles leads to a rise of researchers with similar research interests.
Among current work, one can cite [
4] which is concerned with leveraging hub height measurements collected from a fleet of turbines on a farm to make turbine-specific short-term wind speed and power predictions. Already in 20202, the authors of [
11] offered a forecasting tool based on a set of time series data to estimate wind energy. And [
12] evaluated wind speed prediction and power generation using statistical metrics. In [
13] it is said that the accuracy of energy prediction results can be impaired by insufficient modeling capacity. And finally, [
14] proposes a unified model for predicting wind velocity.
3.1. Most relevant sources
Table 2 shows a list of the top fifteen journals that publish topics on wind speed forecasting, that is, the most prominent scientific journals, according to the number of publications in the research area. CiteScore or Impact Factor, h-index, and Total Publications are metrics that aid in measuring citation relevance and journal growth [
9], [
15], [
16].
A quantitative analysis of the publications from these 15 journals elucidates that they aggregate more than 50% of the identified publications.
A total of 167 documents, which corresponds to 10.9% of the total articles published considering this data set, were published in ENERGIES (
https://www.mdpi.com/journal/energies), which is an open access, peer-reviewed journal published biweekly online by MDPI. Despite the amount of published works, that is, having the highest publication frequency, the journal currently has one of the lowest impact factors in the list of the top 15 journals, 3.252, where the impact factor of a given year relies on, for example, the number of citations in recent years. Subsequently, ENERGY journal (
https://www.sciencedirect.com/journal/energy) appears in second place in terms of publication frequency, with 89 documents (5.80%), followed by RENEWABLE ENERGY journal (
https://www.sciencedirect.com/journal/renewable-energy), with 78 publications (5.08%).
Among the list of high-impact factor journals, RENEWABLE AND SUSTAINABLE ENERGY REVIEWS (
https://www.sciencedirect.com/journal/renewable-and-sustainable-energy-reviews) obtained the highest ranking, having an impact factor of 16,799, even though the journal occupies a lower position, 14th, in terms of publication of articles on the proposed topic, covering only 1.43% of published documents, and this probably occurs because it is a journal that addresses several topics, so this wind speed prediction topic is just one of them.
3.2. Most cited articles
The growing demand for energy imposes the search for renewable energy sources and modern energy systems to meet recent and future energy needs [
17]. Among the most used and studied renewable sources today is wind energy, whose production depends directly on the wind potential of the region where a given farm can be installed. An error in estimating the wind parameter can generate a cubed error in the power to be generated. Therefore, studying methods for predicting this wind speed is extremely important to try to work with data as close as possible to reality.
In this sense, Table 3 lists the 15 most cited articles, considering the general set of researched documents. The following information was extracted from them: i) Name of the first author of the article; ii) Title of the article; iii) Total citations per article; iv) Journal that published the 15 most cited articles; v) year the article was published and vi) the country of the first author.
Table 4.
The 15 most cited articles considering the set of documents studied, with the author and country listed in this table corresponding to the first author of each article.
Table 4.
The 15 most cited articles considering the set of documents studied, with the author and country listed in this table corresponding to the first author of each article.
| RANK |
AUTHOR / CITATION |
TITLE |
TOTAL CITATIONS |
JOURNAL |
YEAR |
COUNTRY |
| 1 |
Farzaneh Mirzapour [18] |
A new prediction model of battery and wind-solar output in hybrid power system |
285 |
Journal of Ambient Intelligence and Humanized Computing |
2019 |
Iran |
| 2 |
Tanveer Ahmad [19] |
A critical review of comparative global historical energy consumption and future demand: The story told so far |
253 |
Energy Reports |
2020 |
China |
| 3 |
H. Díaz [20] |
Review of the current status, technology and future trends of offshore wind farms |
183 |
Ocean Engineering |
2020 |
Portugal |
| 4 |
Mahdi Khodayar [21] |
Spatio-Temporal Graph Deep Neural Network for Short-Term Wind Speed Forecasting |
180 |
IEEE Transactions on Sustainable Energy |
2019 |
USA |
| 5 |
Halil Demolli [22] |
Wind power forecasting based on daily wind speed data using machine learning algorithms |
172 |
ElsevierEnergy Conversion and Management |
2019 |
Kosovo |
| 6 |
Jinhua Zhang [23] |
Short-term forecasting and uncertainty analysis of wind turbine power based on long short-term memory network and Gaussian mixture model |
167 |
Applied Energy |
2019 |
China |
| 7 |
Pei Du [24] |
A novel hybrid model for short-term wind power forecasting |
165 |
Applied Soft Computing |
2019 |
China |
| 8 |
Wenqing Wu [25] |
Forecasting short-term renewable energy consumption of China using a novel fractional nonlinear grey Bernoulli model |
162 |
Renewable Energy |
2019 |
China |
| 9 |
Liu, Zhenkun [26] |
A combined forecasting model for time series: Application to short-term wind speed forecasting |
157 |
Applied Energy |
2020 |
China |
| 10 |
Min-Rong Chen [27] |
A Two-Layer Nonlinear Combination Method for Short-Term Wind Speed Prediction Based on ELM, ENN, and LSTM |
149 |
IEEE Internet of Things Journal |
2019 |
China |
| 11 |
Yan Hao [28] |
A novel two-stage forecasting model based on error factor and ensemble method for multi-step wind power forecasting |
146 |
Applied Energy |
2019 |
China |
| 12 |
Yun Wang [29] |
A review of wind speed and wind power forecasting with deep neural networks |
142 |
Applied Energy |
2021 |
China |
| 13 |
Zhendong Zhang [30] |
Wind speed prediction method using Shared Weight Long Short-Term Memory Network and Gaussian Process Regression |
141 |
Applied Energy |
2019 |
China |
| 14 |
Adil Ahmed [31] |
A review on the selected applications of forecasting models in renewable power systems |
133 |
Renewable and Sustainable Energy Reviews |
2019 |
Saudi Arabia |
| 15 |
Farah Shahid [32] |
A novel genetic LSTM model for wind power forecast |
130 |
Energy |
2021 |
Pakistan |
The work of [
18] studies the short-term energy forecast of wind energy to evaluate the available power output, where the proposed forecasting approach includes a resource selection filter and a hybrid forecast engine established on neural networks (NN) and an intelligent evolutionary algorithm, and the effectiveness of the proposed method was applied on real data. The article by [
19] presents a critical analysis of mixed energy demand in developed/developing countries, summarizing time series and concluding that there is a large future global demand for energy until 2040 under several scenarios.
The authors of [
20] provide a comprehensive overview of the present state and future trends of offshore wind farms worldwide. They discuss the technological difficulties associated with wind farm layout and key components, such as the number of turbines, installed capacity, distance from shore, and water depth. In the article by [
21] a graph-based deep learning model is built to capture the powerful spatiotemporal characteristics of wind speed and direction data from neighboring wind farms.
In the study by [
22], long-term wind energy prediction was conducted based on daily wind speed data using five machine learning models. They concluded that machine learning algorithms can be implemented to predict long-term wind energy values against historical wind speed data, also proving that machine learning-based models can be applied to a location other than the locations trained by the model. According to [
23], the authors suggest that improving the accuracy of wind turbine power prediction is an effective measure. To this end, they implemented a deep learning network based on a long short-term memory (LSTM) algorithm to forecast wind turbine power. Furthermore, they employed a Gaussian mixture model (GMM) to analyze the error distribution characteristics of short-term wind turbine energy forecasting, achieving better performance and evaluation than other methods.
According to [
24], wind energy forecasting has a major effect on the planning, operation, and maintenance of wind farms. Therefore, to increase forecast accuracy, the authors developed a hybrid model that incorporates a wavelet neural network enhanced by optimization methods and used to implement wind energy forecasting. In the paper of [
25], a new non-linear gray Bernoulli model with fractional order accumulation, abbreviated as the FANGBM(1,1) model, is proposed to predict China's short-term renewable energy consumption. Using updated data sets, the model can predict both total and wind consumption.
To overcome some challenges and further enhance the performance and stability of wind speed forecasting, the authors of [
26] developed a forecasting system based on a data pre-treatment strategy, a modified multi-objective optimization algorithm, and various forecasting models. In another article [
27], a two-layer nonlinear combination method called EEL-ELM is implemented for short-term wind speed forecasting for both 10 min and 1 h ahead. The first layer is comprised of an extreme learning machine (ELM) architecture, an Elman neural network (ENN), and an LSTM layer to separately predict wind speed.
The authors of [
28] proposed a new two-stage forecasting model based on the error factor, a non-linear ensemble method, and the multi-objective gray wolf optimizer algorithm for wind energy forecasting. According to [
22], due to the improvement of artificial intelligence technologies, especially deep learning, an increasing number of models based on deep learning are being implemented for wind speed and wind power (WS/WP) prediction because of their superior ability to deal with complex nonlinear problems. Therefore, the authors comprehensively analyzed a plethora of deep learning methodologies used in WS/WP prediction.
According to [
30], obtaining reliable and high-quality wind speed forecast results is important for wind energy planning. In their study, the authors proposed the Shared Weight Long Short-Term Memory Network (SWLSTM) method to reduce the number of variables to be optimized, as well as the training time of the LSTM without substantially impacting the accuracy of the forecast. They also combined a new hybrid SWLSTM and GPR model to obtain reliable probabilistic wind speed forecast results. In [
31], the authors analyze works about selected topics applying renewable resources and energy prediction models to promote the optimal integration of renewable energy (RE) in power systems. The authors of [
32] proposed a new structure of long-term genetic memory (GLSTM) composed of long-term memory and genetic algorithm (GA) to forecast short-term wind energy and realized that GLSTM, on average, boosts wind power forecasts from 6% to 30% compared to existing techniques.
It is important to emphasize that among these 15 research works, different techniques and methods were used trying to analyze which is the best to predict wind speed.
3.3. Most Relevant Affiliations
With regard to the performance of the institutions, the 20 most productive ones, that is, those that most developed articles in the considered area, are listed in
Table 5. The number of articles linked to them, the country or region where they are located, and the percentage that each one represents in view of the global amount of publications are also presented.
NORTH CHINA ELECTRIC POWER UNIVERSITY, TSINGHUA UNIVERSITY, and HUAZHONG UNIVERSITY OF SCIENCE AND TECHNOLOGY, all three universities located in China, lead with a total of 112 documents, corresponding to 7.3% of the total documents analyzed.
Furthermore, it can be inferred that a significant part of the affiliations was found to be Chinese institutions, where of the 20 institutions with the most publications, 13 are from China, responsible for a total of 271 documents that correspond to almost 18% of general publications.
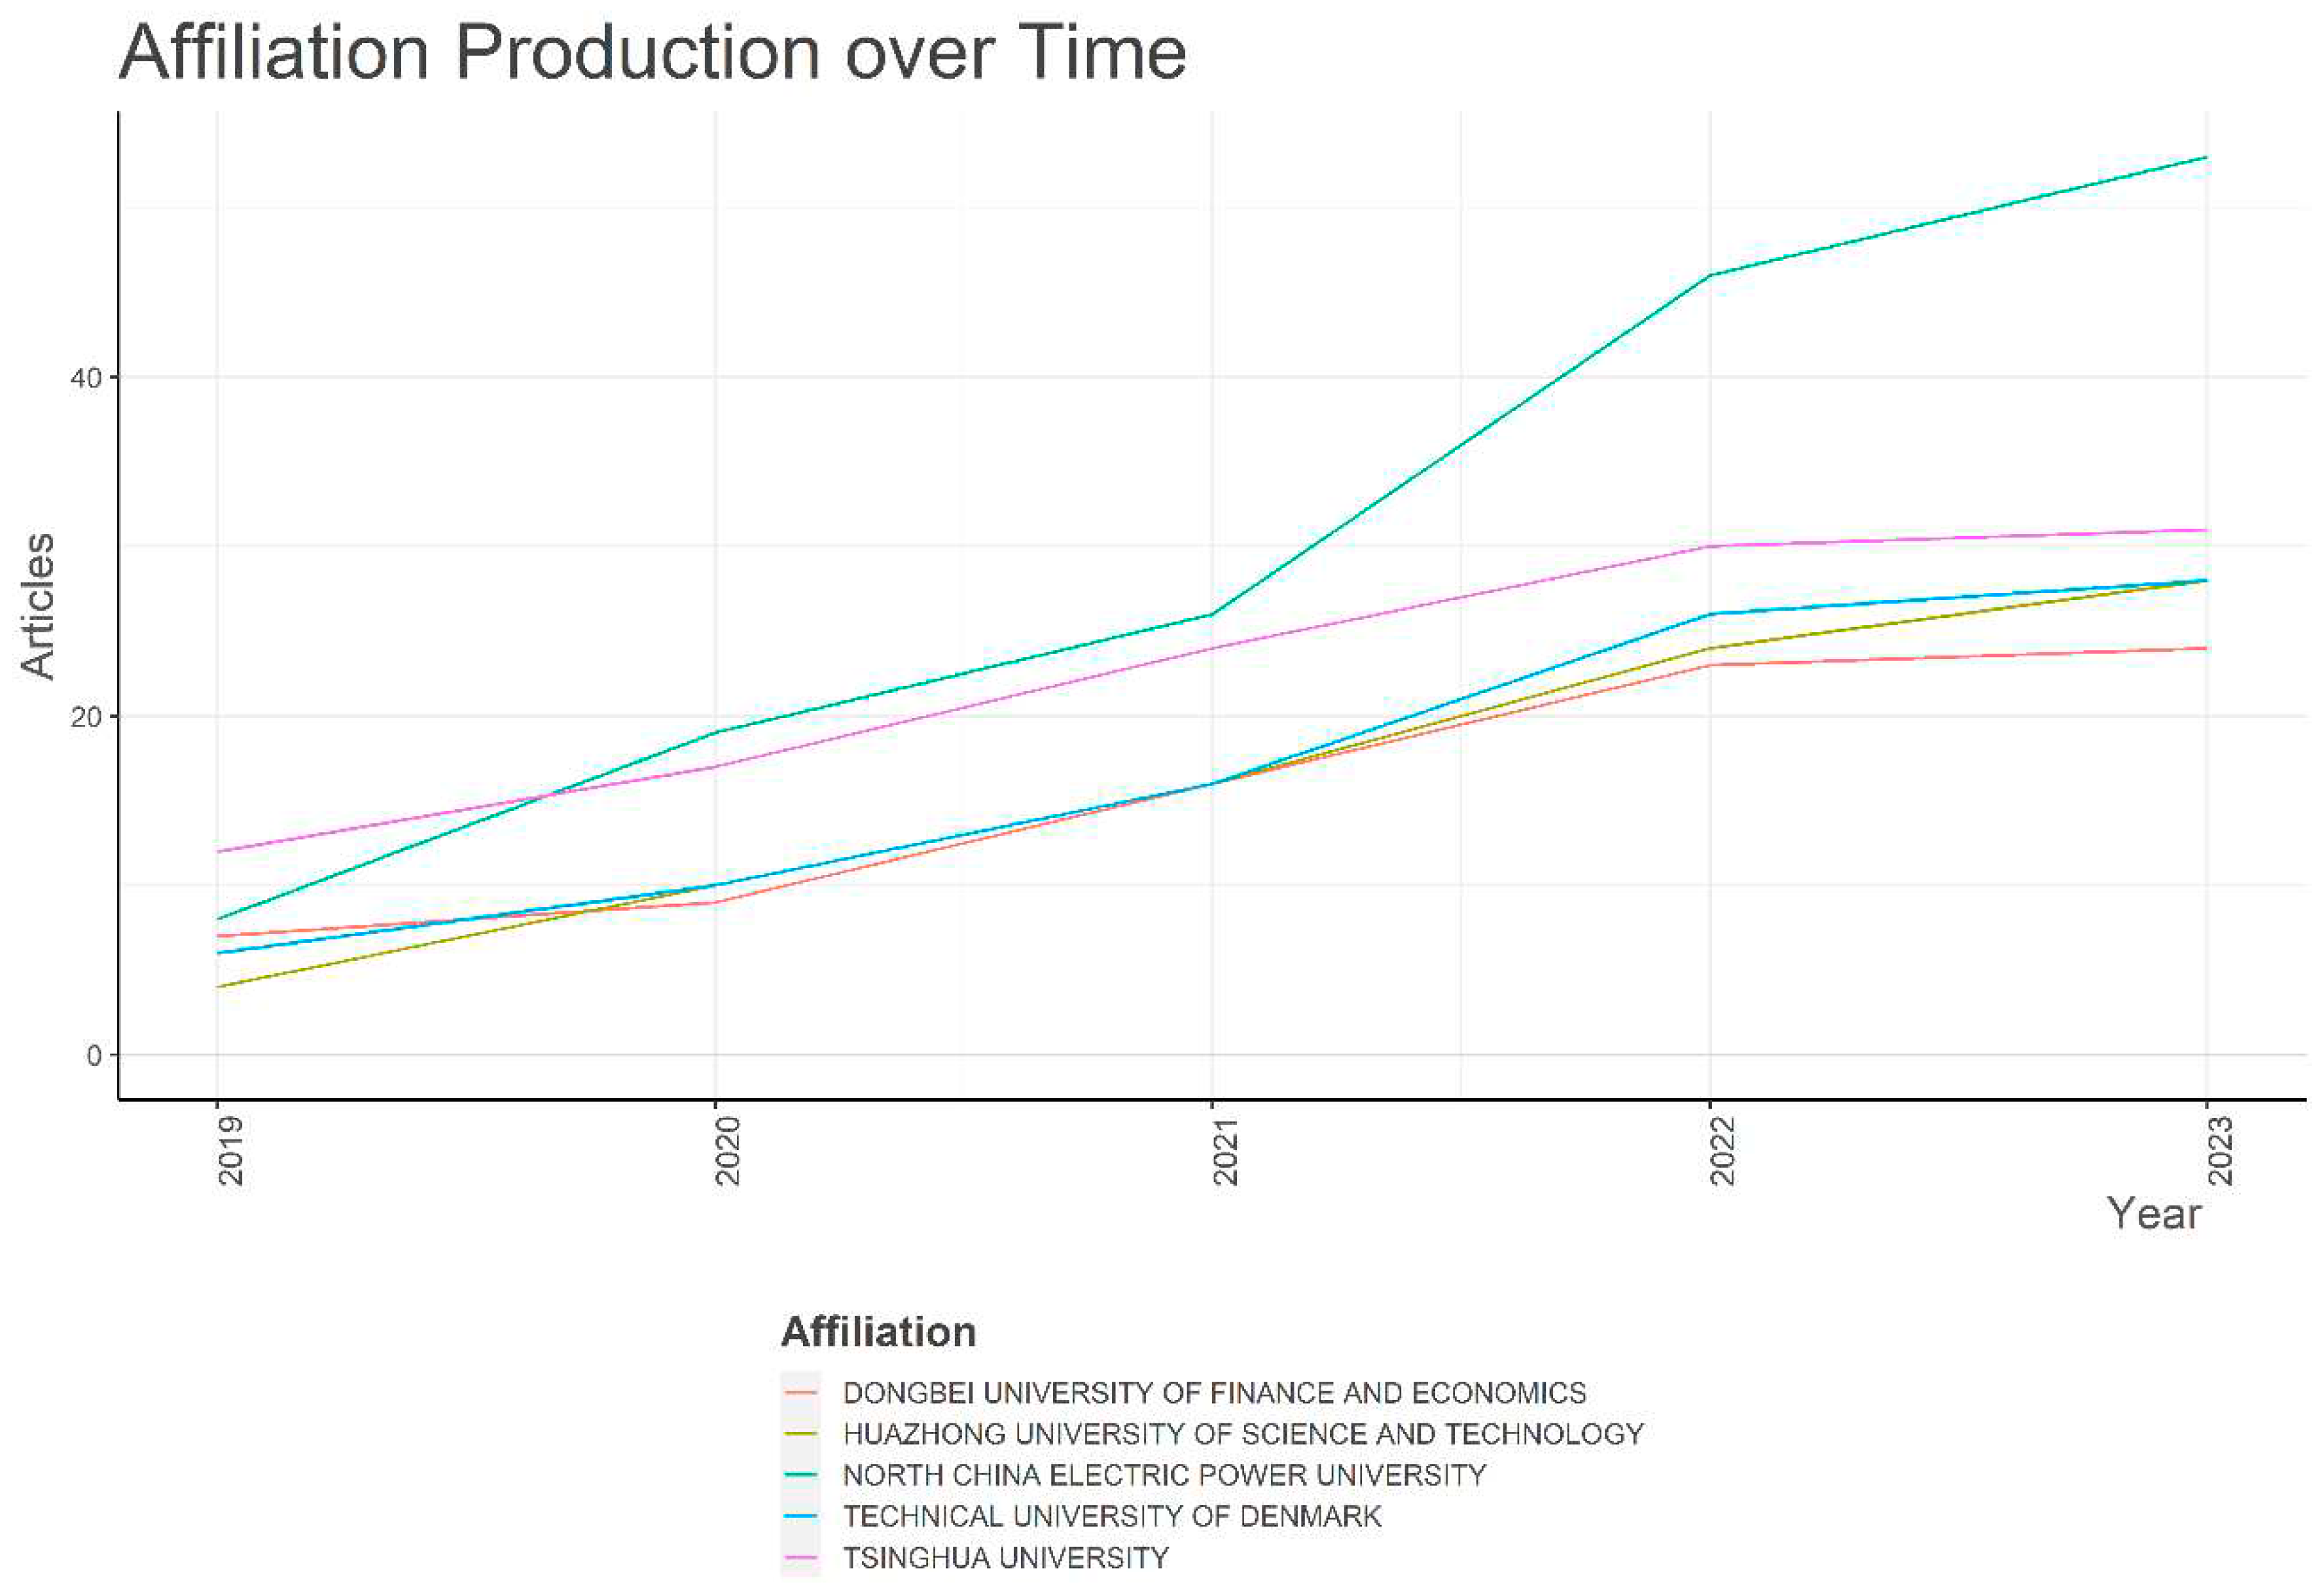
Figure 4 shows the growth of the five main institutions over the time considered.
There is a growth in the number of published works related to this subject in all five institutions considered. However, it is possible to notice that NORTH CHINA ELECTRIC POWER UNIVERSITY has been having a greater growth in relation to the number of publications over the years and standing out in the area in question.
Among the articles linked to these institutions, we can mention the work of [
33], from the North China Electric Power University, which already had 172 citations, and the document [
34], with 121 citations. From Dongbei University of Finance and Economics, one can cite the article by [
35], which already had 159 citations, the work[
36] already with 147 citations, and the work of [
37] with 114 citations. With regard to works developed by researchers from Huazhong University of Science and Technology, one can cite the document [
38] with 145 citations and the work of [
39] with 102 citations. The Technical University of Denmark has the work of [
40] with 100 citations.
3.4. Number of articles by the county of the authors' affiliations
The network mapping of countries and territories, together with their publications and citation analyses, are displayed in
Table 6.
Table 6 shows the number of documents by countries taking into account not only the corresponding authors but any author that is in the publication.
This result shows the considerable participation of Chinese researchers in the various works, both as authors and co-authors.
For the present study on the wind speed forecast, the results elucidate that the maximum number of articles are from Chinese authors (1154 articles), corresponding to more than 75% of the papers published in the area, considering that the total number of retrieved documents is 1534. The second largest amount of published works is from the United States (414 articles), followed by India (211 articles), Iran (131 articles), and the United Kingdom (112 articles). The participation of Chinese researchers exceeds the participation of researchers from other countries both in terms of the number of articles as well as in the number of citations received, while Iran only does not surpass China and the United States in the number of citations, that is, articles with researchers from Iran are the second most cited.
A possible explanation for the surge in the number of publications and citations in the case of the USA and China may be attributed to the fact that the developed countries started the renewable energy usage discussion years before the developing countries, allowing them to set a relatively effective management system for future advances [
41]. In addition, due to environmental concerns in the USA and the high consumption of fossil fuels in both countries, concerns have arisen around the theme, contributing to the development of studies and research. It is interesting to mention that these nations have some of the largest populations in the world and are the world's largest emitters of CO
2 [
42].
Among the most cited works with Chinese authors, we can mention the work [
43] with 172 citations, the work of [
44] with 165 citations, the document [
45] also with 165 citations, and the article [
46] with 160 citations. All these documents have the participation of Chinese authors and are fully linked to the theme of this present study.
The Bibliometrix tool also analyzes the number of publications considering only the corresponding author and observing whether the publications had contributions of authors from other countries, and this information can be analyzed in
Table 7, where the largest publications from a single country (SCP) and publications from several countries (MCP) showed that researchers in China have been working closely with other countries.
These data show that globalization in wind speed forecasting expands substantially across Asia, Australia, America, and Europe.
For the data in
Table 7, the information given by the corresponding author that was considered is the country and institution of origin of the works. The 17 most productive countries are home to 83.3% of total publications. China concentrates the most significant number of publications (451 publications, about 29.4% of the total), followed by the USA (102 publications, about 6.65% of the total) and India (94 publications, about 6 .13% of the total). One can understand the interest of these two powers in wind speed forecasting for the study of wind energy is due to the pursuit of clean solutions and renewable energy sources and the commitment to the decarbonization of transport [
47].
3.5. TreeMap - WordCloud
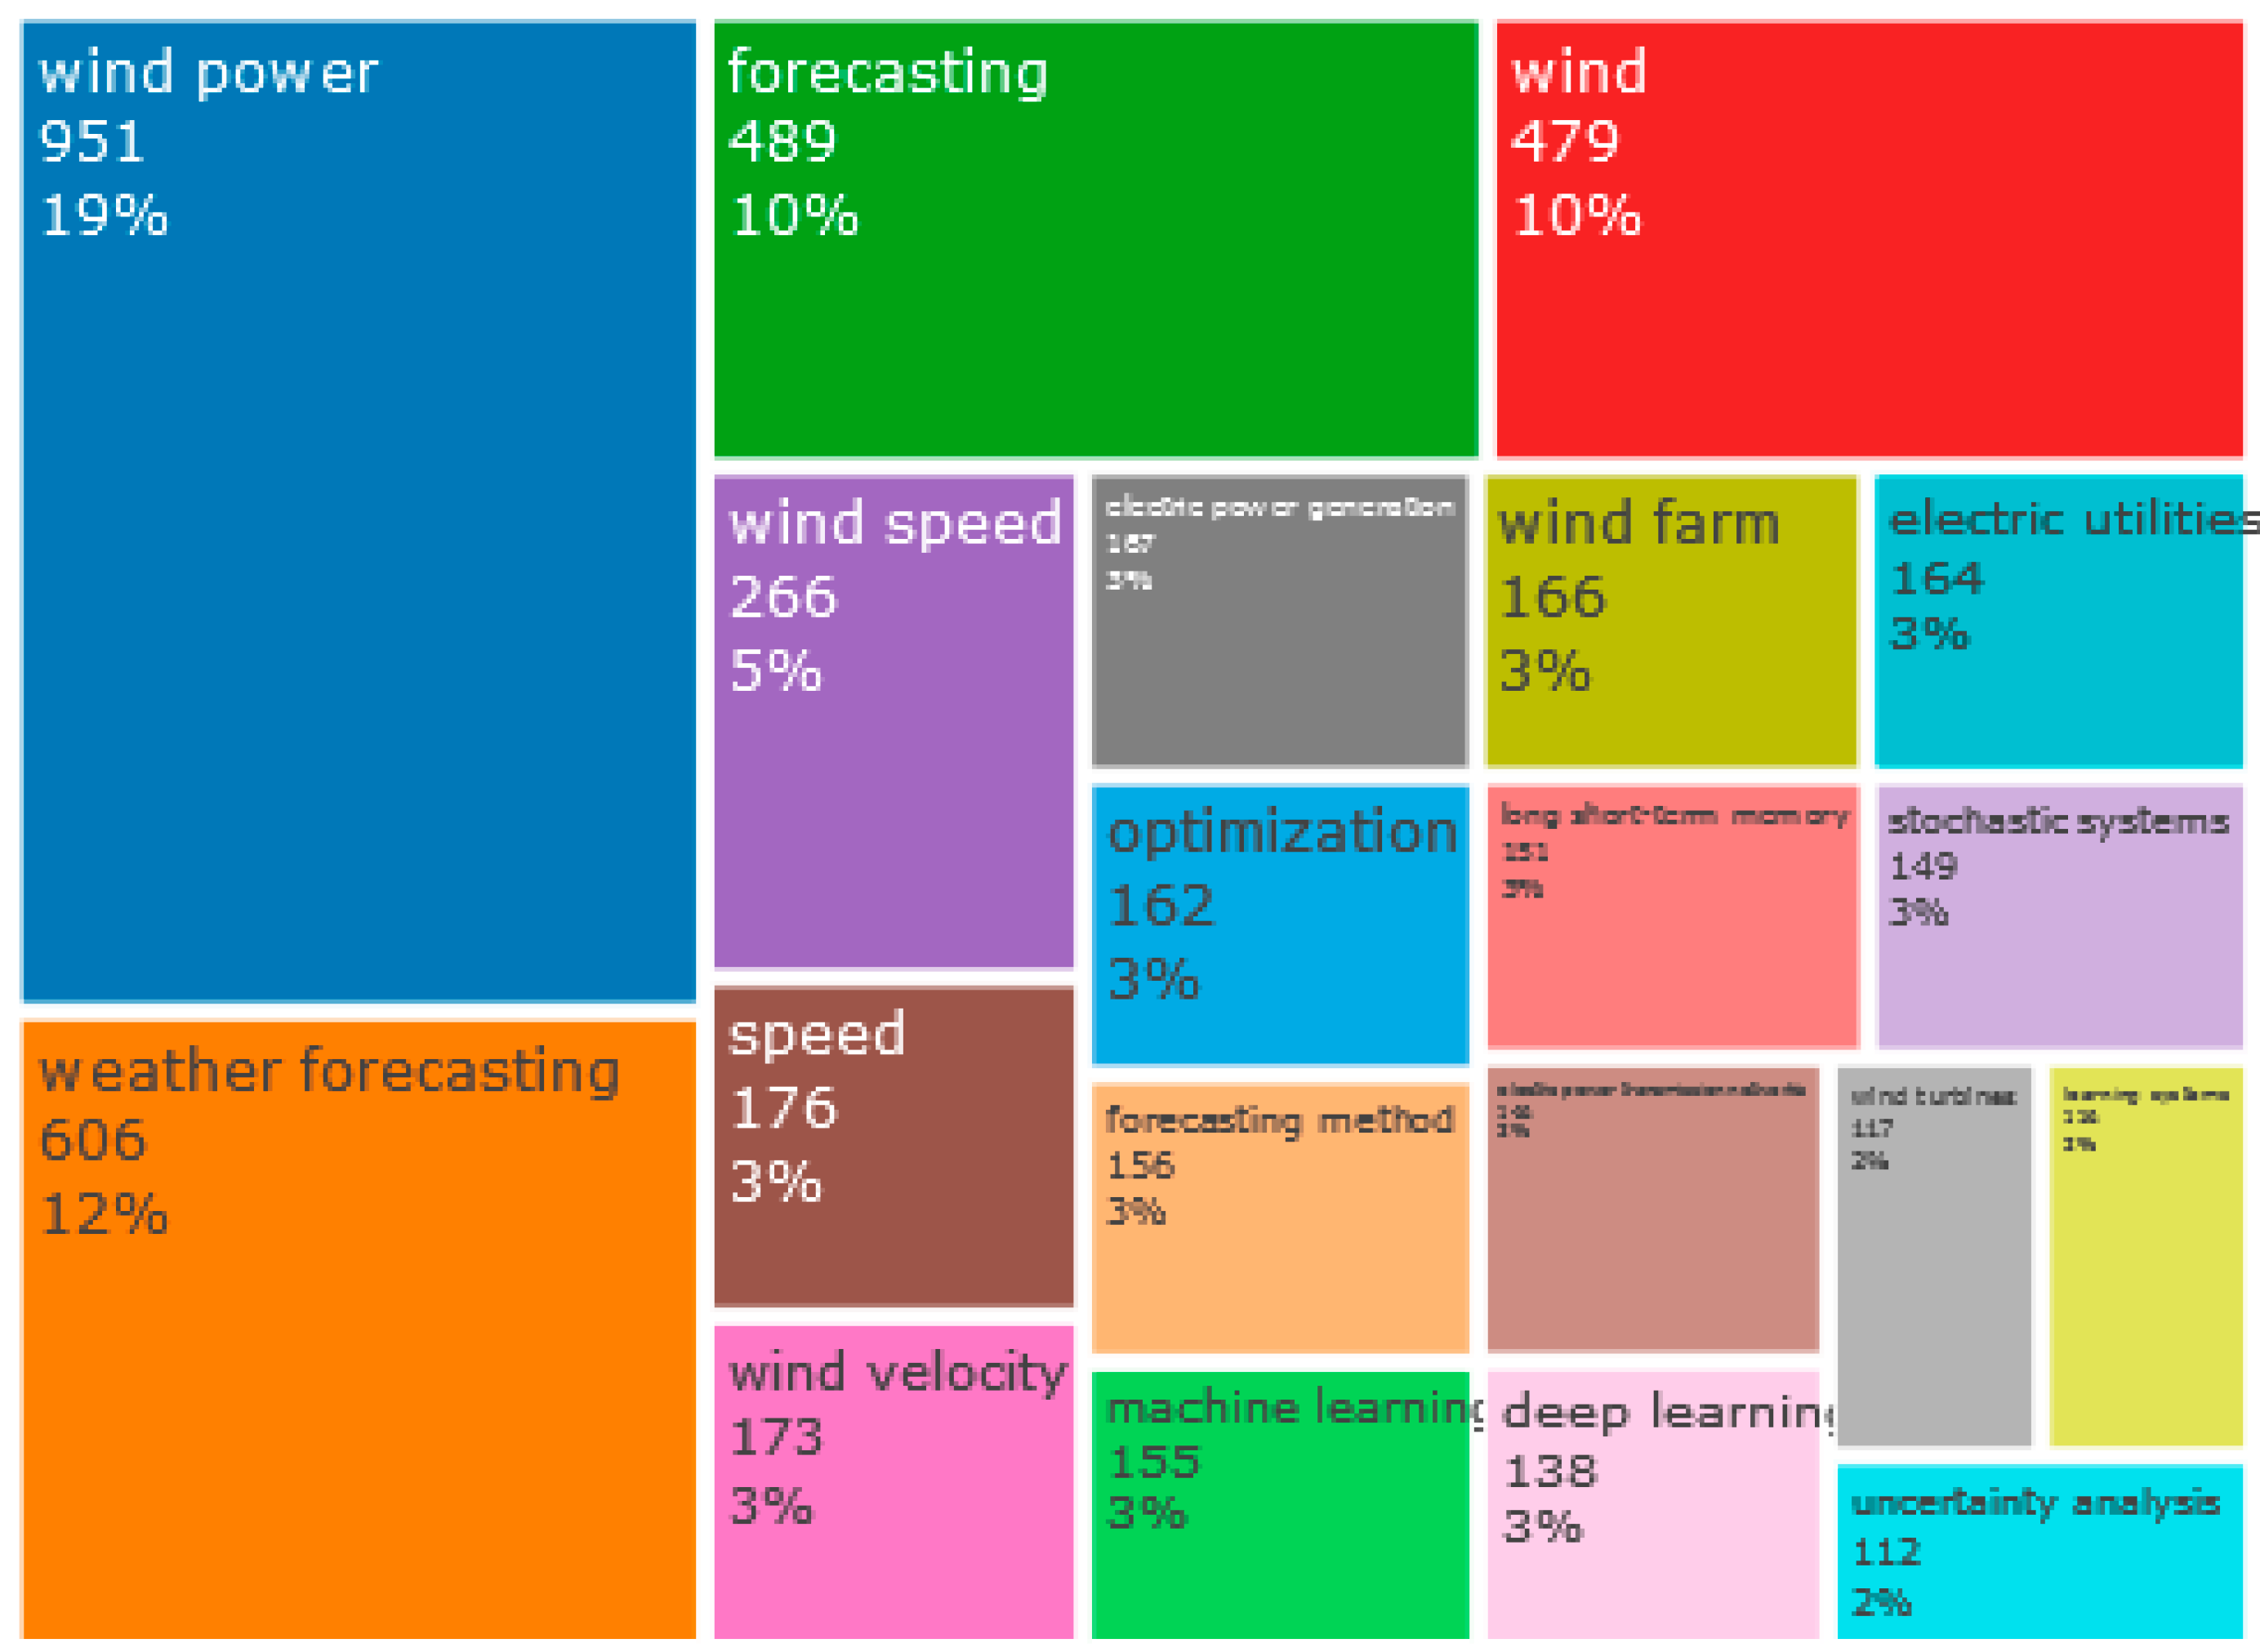
The TreeMap presents, in plot form, the most used keyword terms in a given topic and their frequency of citation. For this set of data,
Figure 8 was obtained, which portrays the author's keywords that were considered most significant in the set of analyzed documents.
This research centers on analyzing the 20 most commonly utilized keywords that play a significant role in the highest-ranked articles, aiming to uncover the primary areas of active research within the wind speeds forecasting field.
Figure 8 indicates the 20 most used keywords in the keyword field, ranging in frequency from 164 to 951. The different sizes and colors of the fields indicate keyword frequency and rank. According to this figure, the term wind power is the most used keyword, with a frequency of 951, which corresponds to 19%. It is followed by the term weather forecasting, forecasting, wind, and wind speed, with relative frequencies of 606, 489, 479, and 266. Meanwhile, the term uncertainty analysis has a frequency of 112, which can be considered small for this data set, but it is still a reasonable number because it is still greater than 100.
Notably, keywords, such as machine learning, long short-term memory, stochastic systems, electric power transmission networks, deep learning, wind turbines, learning systems, and uncertainty analysis, hold significance because they play a special role in facilitating the researcher in locating and identifying information pertinent to work on forecasting wind speed. Keywords can also indicate an attempt to identify what has been elaborated in the publications, along with the knowledge structure of the topic and the interrelationships between distinct fields of wind speed forecasting.
It is noticed that the themes focus of this work appear little, what can show that it is a theme that still has a lot to be explored and that there are still few works addressing the theme as a priority in recent years.
Among works that present these keywords as those of the author, it can be mentioned, from the year 2019, the paper [
48] with 189 citations, the article [
49] with 180 citations, and the document[
50] with 172 citations. From the year 2020, one can reference the paper [
51], with 160 citations, and the article [
52] with 125 citations. And from the year 2021, the article[
53] with 150 citations, and the document[
54] with 138 citations. As of 2022, one can reference the paper of [
55] with 31 citations.
Through the terms that appear in less occurrence, it is possible to indicate a direction of which themes need to be further explored and researched, where additional work is needed, but it is important to carry out a preliminary evaluation of these terms. Therefore, it can be based on some terms that have a low occurrence may be used as a guide for future research, showing new fields to be explored and researched.
3.6. Grouping by Coupling (bibliographic link)
Two articles are said to be bibliographically linked if at least one cited source appears in the bibliographies or reference lists of both articles. Clusters of terms most used to refer to a particular topic and their relationship with other terms can be graphically presented, in the form of a map and/or network. This data can be visualized by the analysis units, author, document, or source, and coupled with abstracts, references, titles, and keywords.
3.6.1. Co-occurrence Network
Graphically presents the formation of networks of the most representative words of a given theme, according to the network of authors, and its connection with other networks of words. These words may be derived from keywords, abstract, title, or words most used in the text. In the case of this work, the network was a result of the keywords.
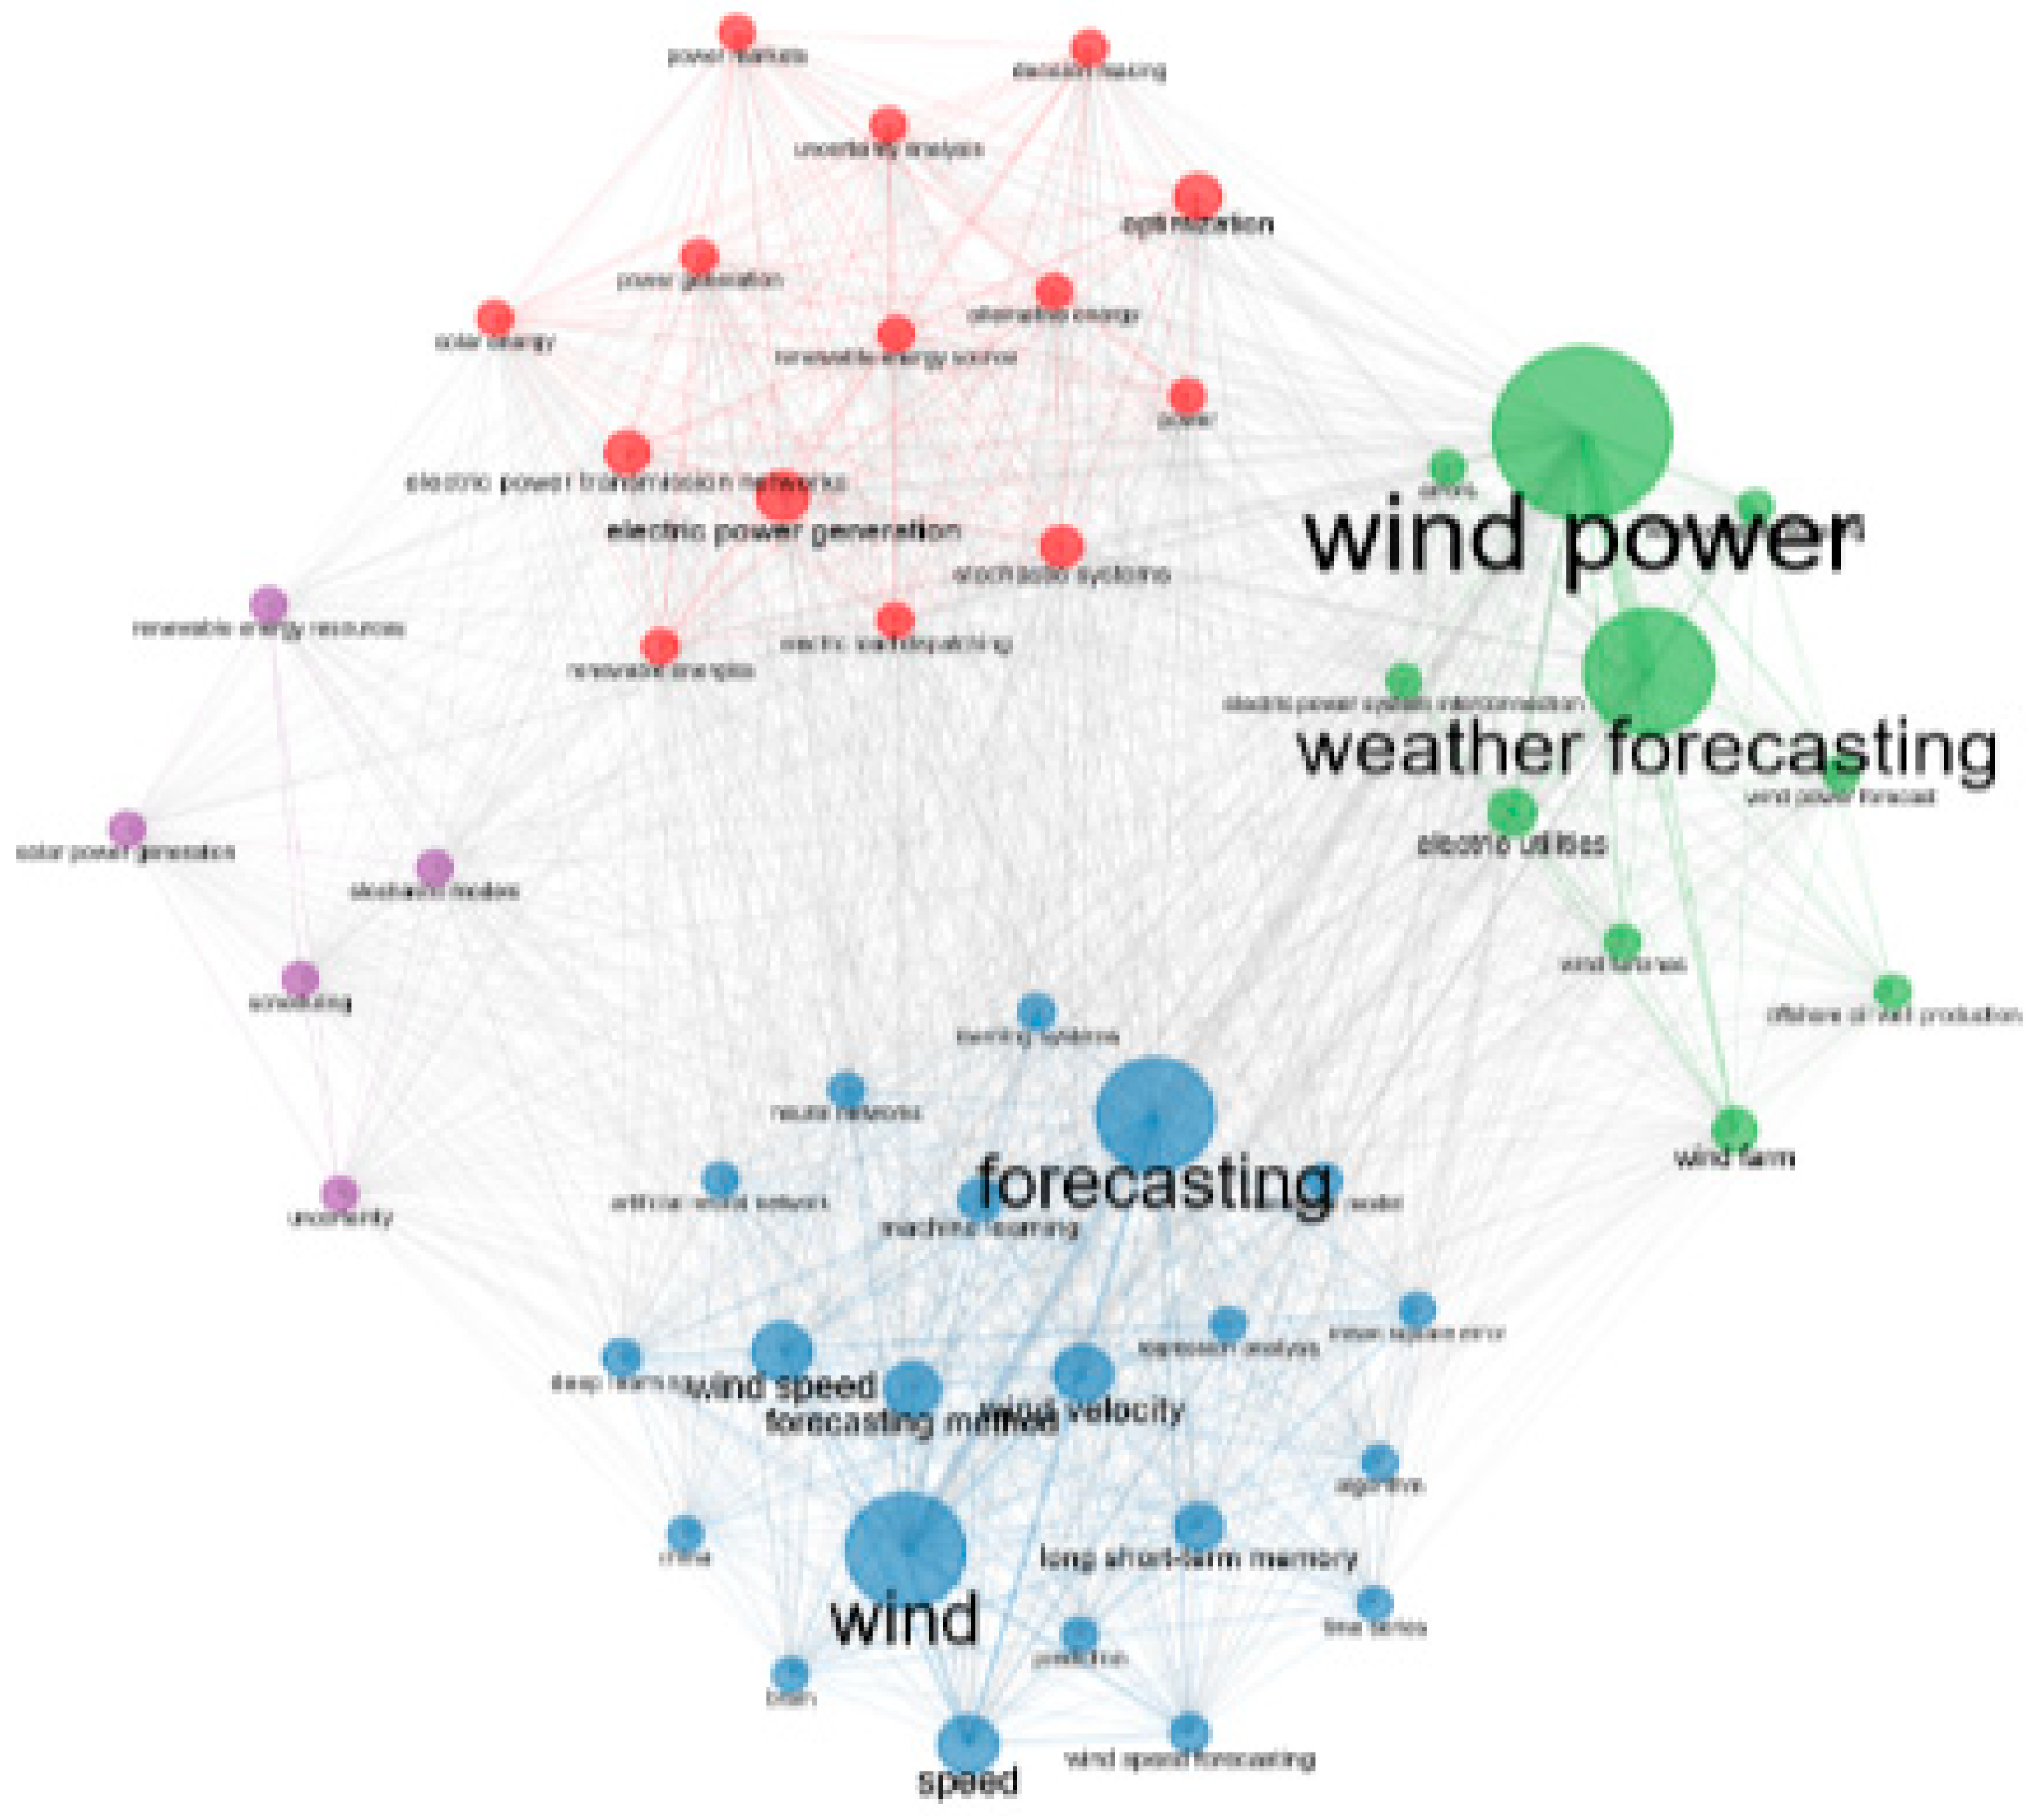
In
Figure 9, one can see the clusters that group the subjects, delimiting the communities that are working on them with similar efforts.
The connectivity of the keywords that have the strongest binding strengths is depicted, containing several clusters that include wind, wind power, foresting, and weather foresting, all focused on wind speed forecasting. The blue cluster contains most of the terms related to wind speed prediction. Within this network diagram, different colors represent different groups, and the conformation of the groups was set on the connections between elements (instances of keyword occurrences across documents), leading to groups of closely related elements. In this bibliometric investigation, the keywords were categorized into 4 clusters. The map depicts the different groups, and size of the circles directly reflecting the overall strength of links associated with each keyword. Also, the distance between the terms suggests whether they were related to each other or not.
Here we can refer to some review works between these groups, such as the paper [
56] of 2022 with 31 citations, developed in the United Kingdom, and the article [
57] of 2022, with 11 citations, developed by researchers from China, Denmark, and Germany and[
58] with 10 citations from 2021, with the participation of researchers from Denmark.
3.6.2. Co-citation network
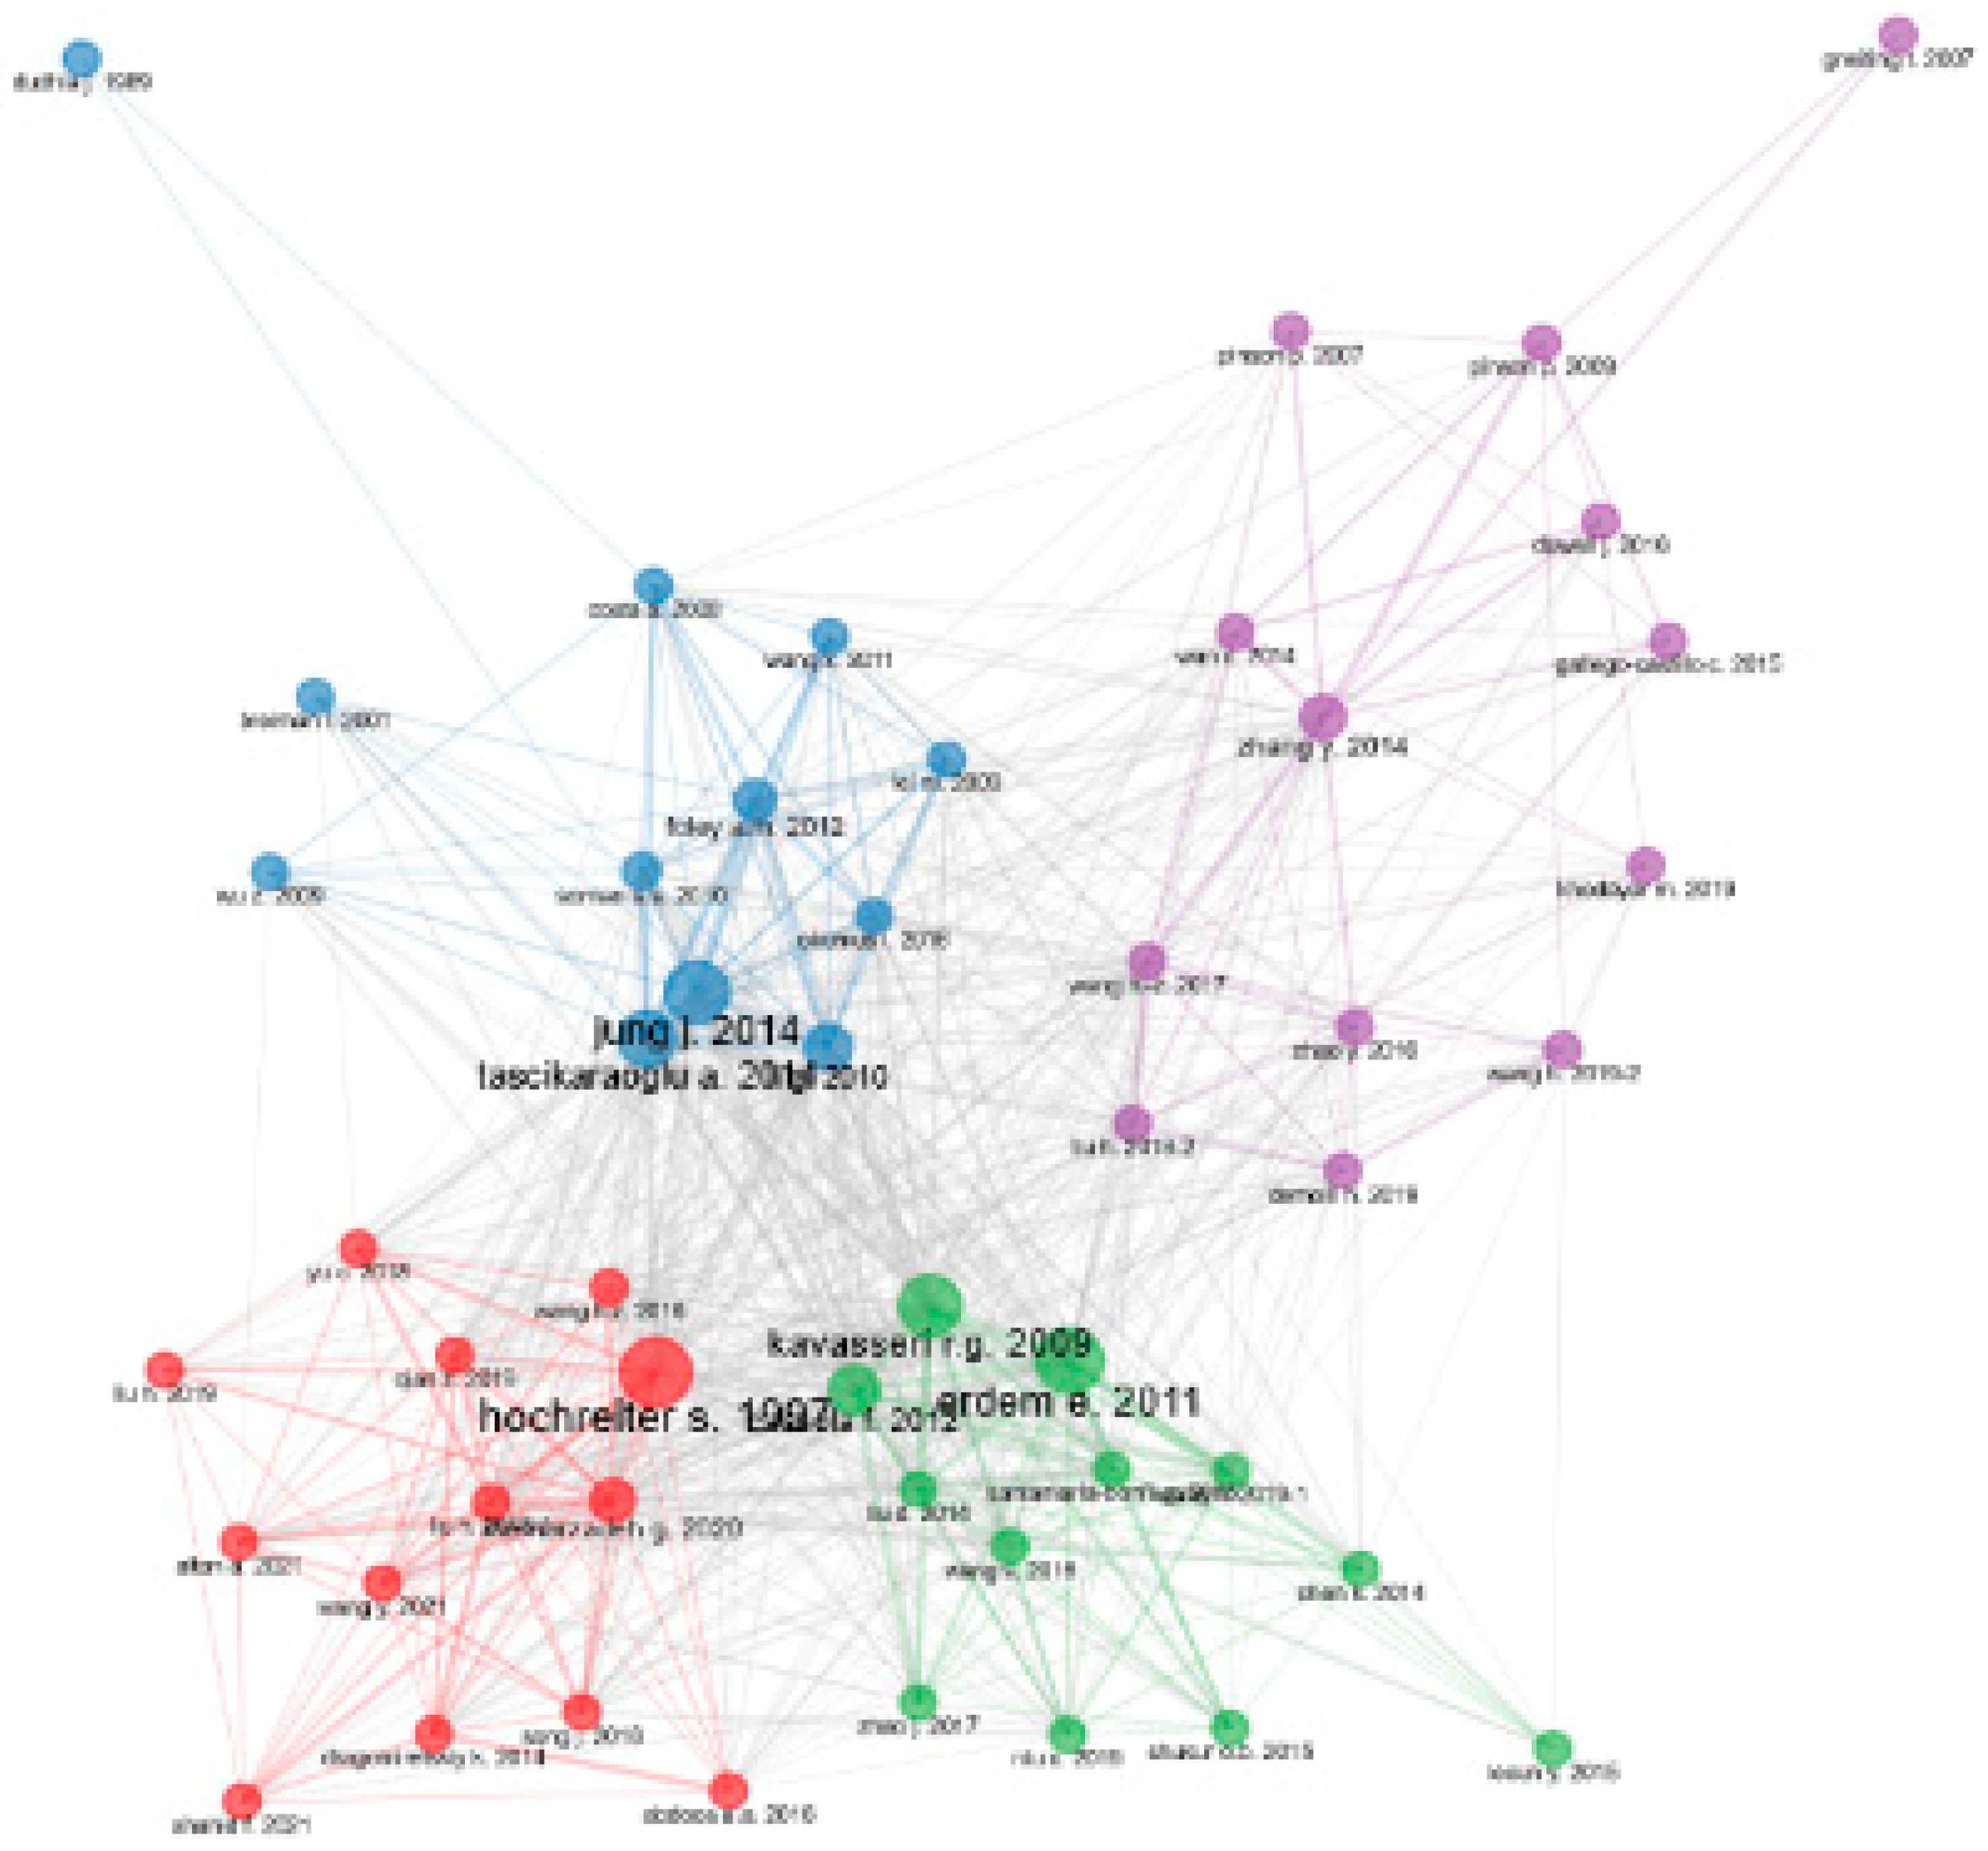
It graphically presents the networks of authors, allowing to show which are the main authors of each network (those who publish the most) and the intensity of the connection with the other networks of authors.
Figure 14 displays the co-citation network map encompassing the most cited references. The colors designate the clusters assigned to cited references based on the strength of their associations. The circle’s size represents the number of citations, while the lines connecting the circles signify linkages. This may be a good starting point for a researcher to explore this field.
3.6.3. Collaboration world map
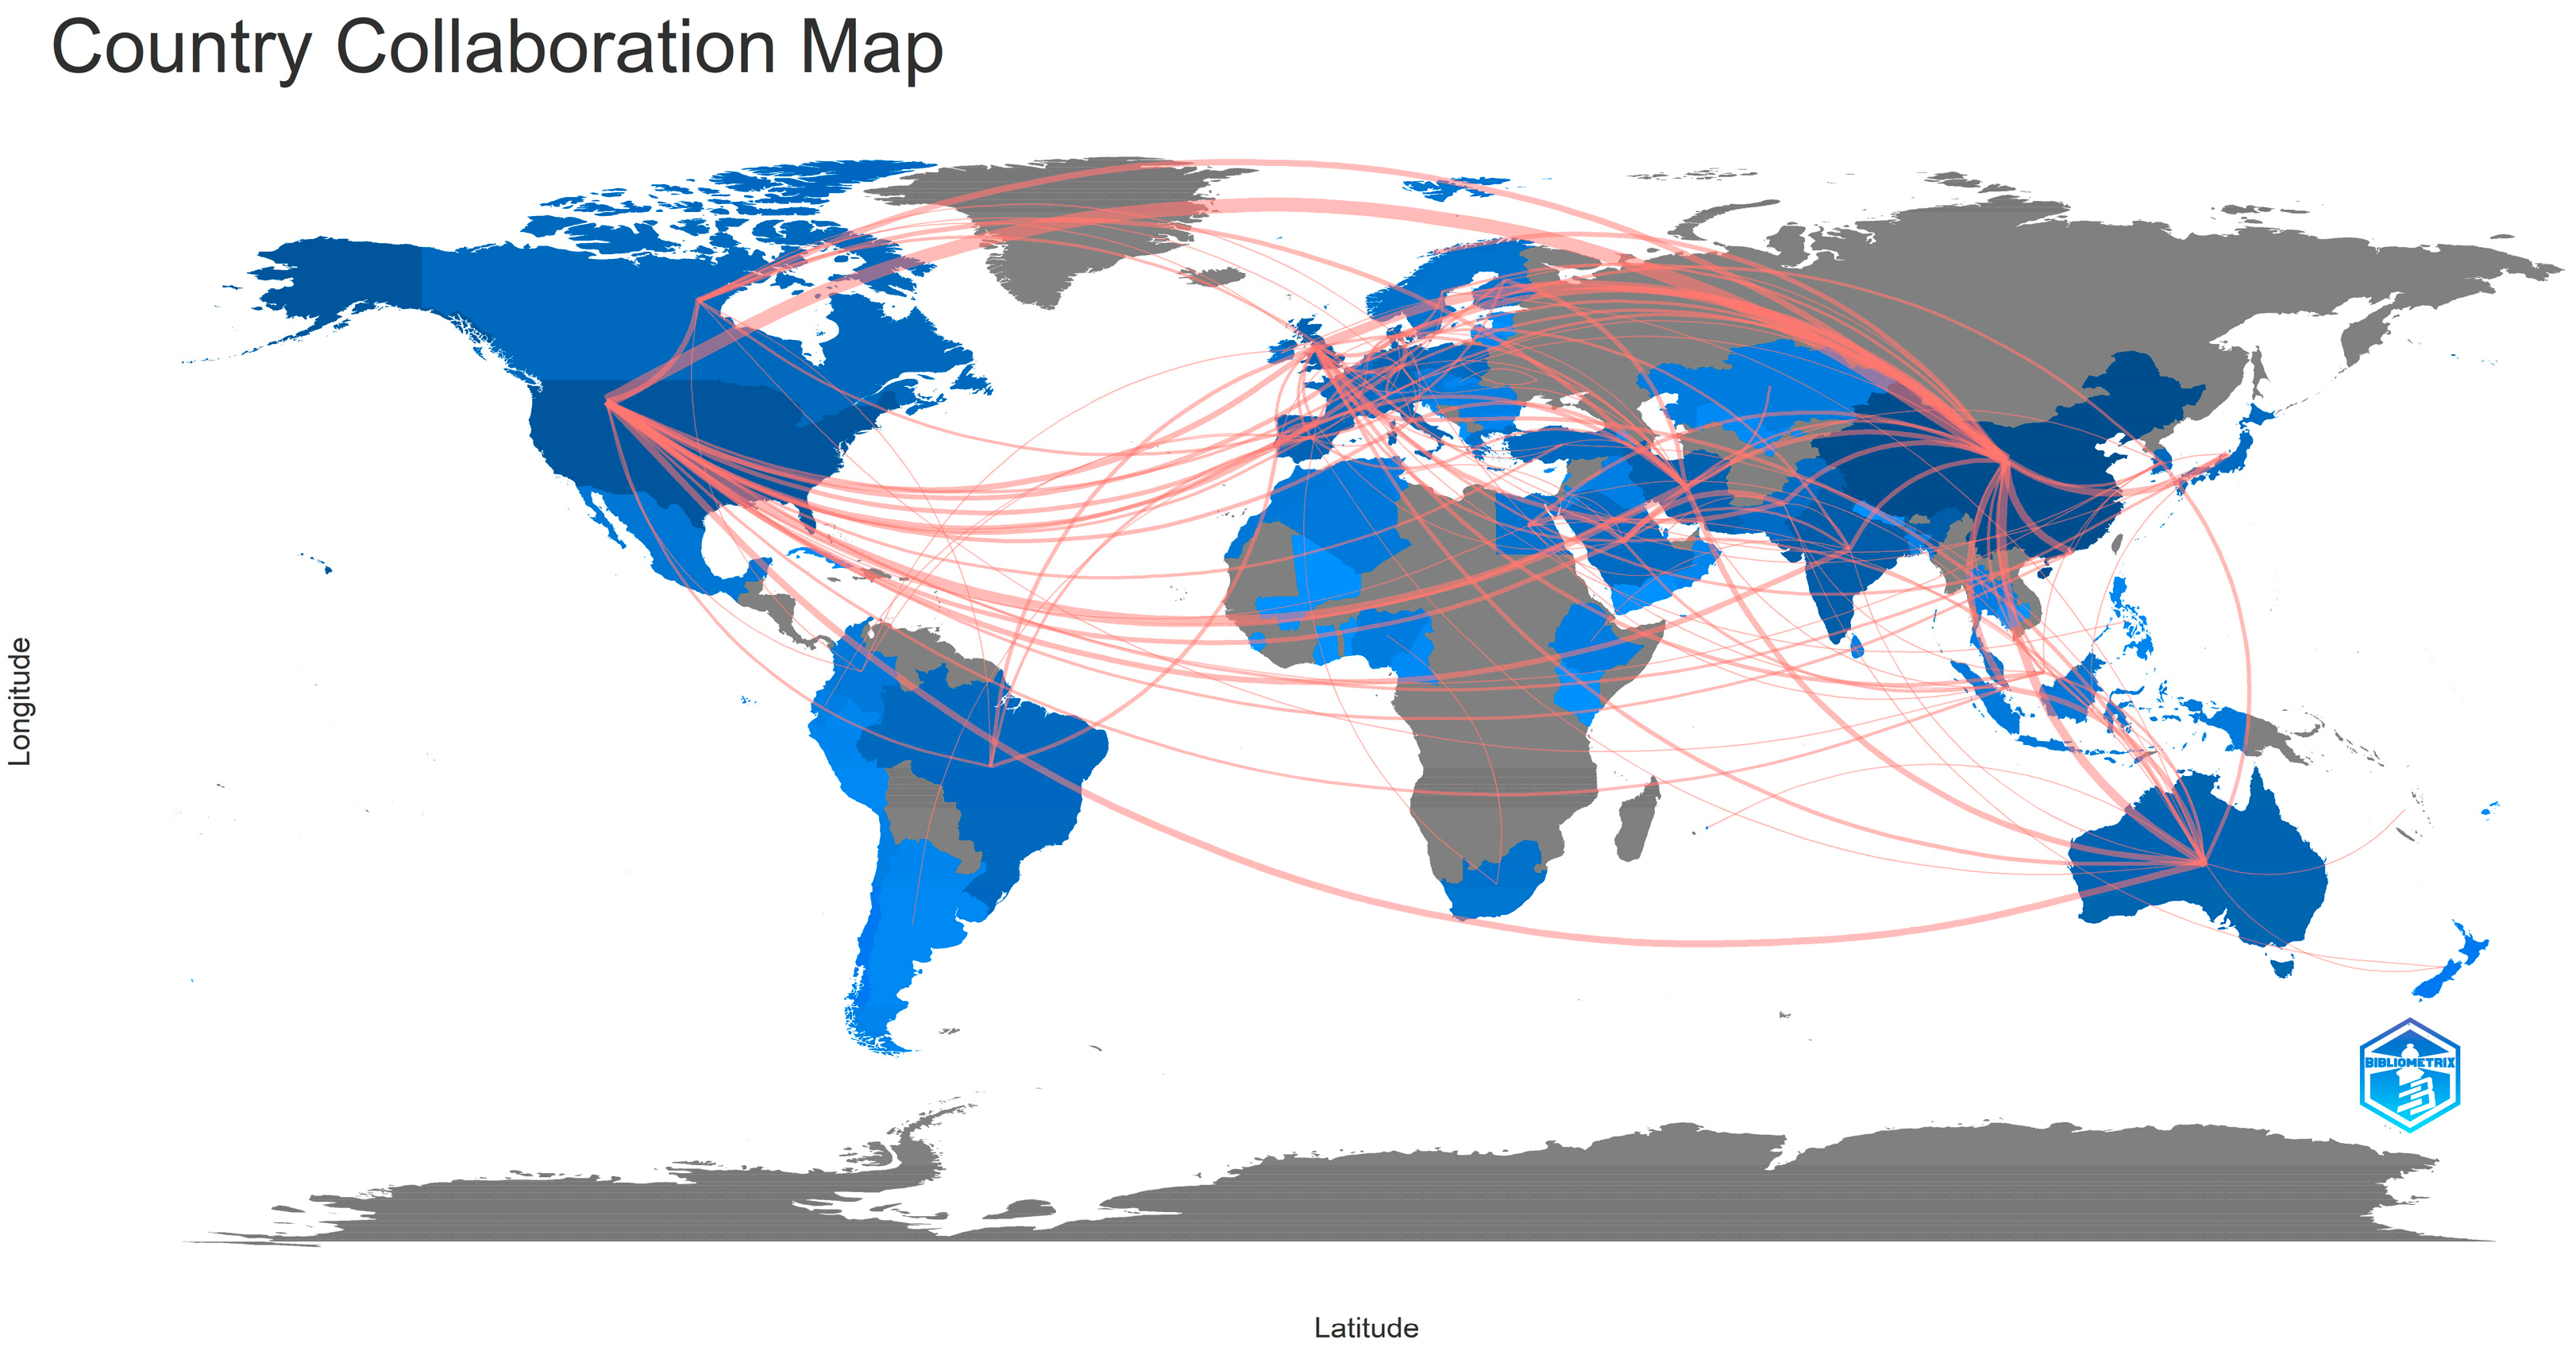
Figure 16 graphically presents, in a world map format, the collaboration networks between countries and their productions, the line red color indicates as there is collaboration occurring in that country, allowing us to identify the countries that collaborate most for the publication of a certain theme.
As
Figure 16 shows, several countries have published articles on wind speed forecasting. Taking into account the affiliations of authors and co-authors (
Figure 16), China stands out with 17 collaborations with Australia, 19 with the United Kingdom, and 43 with the United States, which has 15 collaborations with Iran. This reveals that collaborations among countries will be capable to increase the number of publications, compared to publications of a single country.
5. Conclusions
This study has proven the scarcity of a significant number of documents highlighting wind speed forecasting and future research can fill such gaps in this theme.
The present work had as its objective the bibliometric analysis on the subject of wind speed forecasting, where a search was used considering the terms ("forecast" OR "prevision" ) AND "wind" AND ( "turbine" OR "power" OR "energy" or "velocity" or "speed "), to encompass in the best possible way the works related to wind speed forecasting, to assess the research trends in this area in order to carry out this analysis in the spectrum of publications facing the world context.
For this purpose, the Scopus database was used and, later, an analysis of the data analysis was carried out by Bibliometrix, allowing to identify trends, patterns, and gaps in the scientific production on the subject, in addition to providing relevant information for the formulation of public policies and investments in research and development in this area. In this study, a total of 1,534 documents were analyzed, with 1,484 articles and 50 review papers, distributed from 331 sources and with the participation of 4,376 authors, considering the period from 2019 to April 2023, when the research was carried out.
It is conclusive that, over the years, analyses on the subject have been more widespread and stimulated due to decarbonization pacts that made countries have to look for ways to reduce CO2 production and invest more and more in renewable sources, including wind power, and for that, the study of wind speed forecast is essential for any project. With this, the increase in research is notorious, mainly between China and the USA, countries where renewable energy, including wind energy, has become a fundamental and viable alternative. However, it is clear that much still needs to be researched in this area.
Author Contributions
Conceptualization, P.A.C.R., and C.F.d.A.; methodology, P.A.C.R., and C.F.d.A.; software, C.F.d.A.; ; validation, C.F.d.A.; formal analysis, P.A.C.R., and C.F.d.A.; investigation, P.A.C.R., and C.F.d.A.; resources, C.F.d.A.; data curation, P.A.C.R., and C.F.d.A.; writing—original draft preparation, P.A.C.R., C.F.d.A., A.V.B., F.L.L., and M.L.M.d.O; writing—review and editing, C.F.d.A., P.A.C.R., A.V.B., F.L.L., M.L.M.d.O, J.V.G.T., and B.G.; visualization, P.A.C.R., and C.F.d.A.; supervision, J.V.G.T, and B.G.; project administration, B.G.; funding acquisition, P.A.C.R., C.F.d.A., J.V.G.T., and B.G. All authors have read and agreed to the published version of the manuscript.
Funding
This research was funded by the Conselho Nacional de Desenvolvimento Científico e Tecnológico—Brasil (CNPq), grant no. 307096/2021-1, and grant no. 303585/2022-6, and the Natural Sciences and Engineering Research Council of Canada (NSERC) Alliance, grant No. 401643, in association with Lakes Environmental Software Inc.
Conflicts of Interest
The authors declare no conflict of interest.
References
- Santhosh, M.; Venkaiah, C.; Kumar, D.M.V. Current advances and approaches in wind speed and wind power forecasting for improved renewable energy integration: A review. Eng. Rep. 2020, 2. [Google Scholar] [CrossRef]
- Marndi, A.; Patra, G.K.; Gouda, K.C. Short-term forecasting of wind speed using time division ensemble of hierarchical deep neural networks. Bull. Atmospheric Sci. Technol. 2020, 1, 91–108. [Google Scholar] [CrossRef]
- Han, K.; Choi, J.; Kim, C. Comparison of Statistical Post-Processing Methods for Probabilistic Wind Speed Forecasting. Asia-Pacific J. Atmospheric Sci. 2017, 54, 91–101. [Google Scholar] [CrossRef]
- Berg, L.K.; Liu, Y.; Yang, B.; Qian, Y.; Olson, J.; Pekour, M.; Ma, P.-L.; Hou, Z. Sensitivity of Turbine-Height Wind Speeds to Parameters in the Planetary Boundary-Layer Parametrization Used in the Weather Research and Forecasting Model: Extension to Wintertime Conditions. Boundary-Layer Meteorol. 2018, 170, 507–518. [Google Scholar] [CrossRef]
- Aria, M.; Cuccurullo, C. bibliometrix: An R-tool for comprehensive science mapping analysis. J. Informetr. 2017, 11, 959–975. [Google Scholar] [CrossRef]
- Donthu, N.; Kumar, S.; Mukherjee, D.; Pandey, N.; Lim, W.M. How to conduct a bibliometric analysis: An overview and guidelines. J. Bus. Res. 2021, 133, 285–296. [Google Scholar] [CrossRef]
- Kumar, A.; Mallick, S.; Swarnakar, P. Mapping Scientific Collaboration: A Bibliometric Study of Rice Crop Research in India. J. Sci. Res. 2020, 9, 29–39. [Google Scholar] [CrossRef]
- Zabidin, N.S.; Belayutham, S.; Ibrahim, K.I. A bibliometric and scientometric mapping of Industry 4.0 in construction. J. Inf. Technol. Constr. 2020, 25, 287–307. [Google Scholar] [CrossRef]
- Bornmann, L.; Daniel, H.-D. What do we know about theh index? J. Am. Soc. Inf. Sci. Technol. 2007, 58, 1381–1385. [Google Scholar] [CrossRef]
- Laengle, S.; Merigó, J.M.; Miranda, J.; Słowiński, R.; Bomze, I.; Borgonovo, E.; Dyson, R.G.; Oliveira, J.F.; Teunter, R. Forty years of the European Journal of Operational Research: A bibliometric overview. Eur. J. Oper. Res. 2017, 262, 803–816. [Google Scholar] [CrossRef]
- Singh, U.; Rizwan, M. SCADA system dataset exploration and machine learning based forecast for wind turbines. Results Eng. 2022, 16. [Google Scholar] [CrossRef]
- Nascimento, E.G.S.; de Melo, T.A.; Moreira, D.M. A transformer-based deep neural network with wavelet transform for forecasting wind speed and wind energy. Energy 2023, 278. [Google Scholar] [CrossRef]
- Sun, S.; Liu, Y.; Li, Q.; Wang, T.; Chu, F. Short-term multi-step wind power forecasting based on spatio-temporal correlations and transformer neural networks. Energy Convers. Manag. 2023, 283. [Google Scholar] [CrossRef]
- Liu, X.; Zhang, L.; Wang, J.; Zhou, Y.; Gan, W. A unified multi-step wind speed forecasting framework based on numerical weather prediction grids and wind farm monitoring data. Renew. Energy 2023, 211, 948–963. [Google Scholar] [CrossRef]
- Kar, S.K.; Harichandan, S.; Roy, B. Bibliometric analysis of the research on hydrogen economy: An analysis of current findings and roadmap ahead. Int. J. Hydrogen Energy 2022, 47, 10803–10824. [Google Scholar] [CrossRef]
- Ghazinoory, S.; Ameri, F.; Farnoodi, S. An application of the text mining approach to select technology centers of excellence. Technol. Forecast. Soc. Chang. 2013, 80, 918–931. [Google Scholar] [CrossRef]
- Abdin, Z.; Zafaranloo, A.; Rafiee, A.; Mérida, W.; Lipiński, W.; Khalilpour, K.R. Hydrogen as an energy vector. Renew. Sustain. Energy Rev. 2020, 120, 109620. [Google Scholar] [CrossRef]
- Mirzapour, F.; Lakzaei, M.; Varamini, G.; Teimourian, M.; Ghadimi, N. A new prediction model of battery and wind-solar output in hybrid power system. J. Ambient. Intell. Humaniz. Comput. 2017, 10, 77–87. [Google Scholar] [CrossRef]
- Ahmad, T.; Zhang, D. A critical review of comparative global historical energy consumption and future demand: The story told so far. Energy Rep. 2020, 6, 1973–1991. [Google Scholar] [CrossRef]
- Díaz, H.; Soares, C.G. Review of the current status, technology and future trends of offshore wind farms. Ocean Eng. 2020, 209, 107381. [Google Scholar] [CrossRef]
- Khodayar, M.; Wang, J. Spatio-Temporal Graph Deep Neural Network for Short-Term Wind Speed Forecasting. IEEE Trans. Sustain. Energy 2018, 10, 670–681. [Google Scholar] [CrossRef]
- Demolli, H.; Dokuz, A.S.; Ecemis, A.; Gokcek, M. Wind power forecasting based on daily wind speed data using machine learning algorithms. Energy Convers. Manag. 2019, 198, 111823. [Google Scholar] [CrossRef]
- Zhang, J.; Yan, J.; Infield, D.; Liu, Y.; Lien, F.-S. Short-term forecasting and uncertainty analysis of wind turbine power based on long short-term memory network and Gaussian mixture model. Appl. Energy 2019, 241, 229–244. [Google Scholar] [CrossRef]
- Du, P.; Wang, J.; Yang, W.; Niu, T. A novel hybrid model for short-term wind power forecasting. Appl. Soft Comput. 2019, 80, 93–106. [Google Scholar] [CrossRef]
- Wu, W.; Ma, X.; Zeng, B.; Wang, Y.; Cai, W. Forecasting short-term renewable energy consumption of China using a novel fractional nonlinear grey Bernoulli model. Renew. Energy 2019, 140, 70–87. [Google Scholar] [CrossRef]
- Liu, Z.; Jiang, P.; Zhang, L.; Niu, X. A combined forecasting model for time series: Application to short-term wind speed forecasting. Appl. Energy 2019, 259, 114137. [Google Scholar] [CrossRef]
- Chen, M.-R.; Zeng, G.-Q.; Lu, K.-D.; Weng, J. A Two-Layer Nonlinear Combination Method for Short-Term Wind Speed Prediction Based on ELM, ENN, and LSTM. IEEE Internet Things J. 2019, 6, 6997–7010. [Google Scholar] [CrossRef]
- Hao, Y.; Tian, C. A novel two-stage forecasting model based on error factor and ensemble method for multi-step wind power forecasting. Appl. Energy 2019, 238, 368–383. [Google Scholar] [CrossRef]
- Wang, Y.; Zou, R.; Liu, F.; Zhang, L.; Liu, Q. A review of wind speed and wind power forecasting with deep neural networks. Appl. Energy 2021, 304, 117766. [Google Scholar] [CrossRef]
- Zhang, Z.; Ye, L.; Qin, H.; Liu, Y.; Wang, C.; Yu, X.; Yin, X.; Li, J. Wind speed prediction method using Shared Weight Long Short-Term Memory Network and Gaussian Process Regression. Appl. Energy 2019, 247, 270–284. [Google Scholar] [CrossRef]
- Ahmed, A.; Khalid, M. A review on the selected applications of forecasting models in renewable power systems. Renew. Sustain. Energy Rev. 2018, 100, 9–21. [Google Scholar] [CrossRef]
- Shahid, F.; Zameer, A.; Muneeb, M. A novel genetic LSTM model for wind power forecast. Energy 2021, 223, 120069. [Google Scholar] [CrossRef]
- Zhang, J.; Yan, J.; Infield, D.; Liu, Y.; Lien, F.-S. Short-term forecasting and uncertainty analysis of wind turbine power based on long short-term memory network and Gaussian mixture model. Appl. Energy 2019, 241, 229–244. [Google Scholar] [CrossRef]
- Zhang, Y.; Pan, G.; Chen, B.; Han, J.; Zhao, Y.; Zhang, C. Short-term wind speed prediction model based on GA-ANN improved by VMD. Renew. Energy 2020, 156, 1373–1388. [Google Scholar] [CrossRef]
- Liu, Z.; Jiang, P.; Zhang, L.; Niu, X. A combined forecasting model for time series: Application to short-term wind speed forecasting. Appl. Energy 2019, 259, 114137. [Google Scholar] [CrossRef]
- Hao, Y.; Tian, C. A novel two-stage forecasting model based on error factor and ensemble method for multi-step wind power forecasting. Appl. Energy 2019, 238, 368–383. [Google Scholar] [CrossRef]
- Liu, T.; Tan, Z.; Xu, C.; Chen, H.; Li, Z. Study on deep reinforcement learning techniques for building energy consumption forecasting. Energy Build. 2019, 208, 109675. [Google Scholar] [CrossRef]
- Zhang, Z.; Ye, L.; Qin, H.; Liu, Y.; Wang, C.; Yu, X.; Yin, X.; Li, J. Wind speed prediction method using Shared Weight Long Short-Term Memory Network and Gaussian Process Regression. Appl. Energy 2019, 247, 270–284. [Google Scholar] [CrossRef]
- Liu, Y.; Qin, H.; Zhang, Z.; Pei, S.; Jiang, Z.; Feng, Z.; Zhou, J. Probabilistic spatiotemporal wind speed forecasting based on a variational Bayesian deep learning model. Appl. Energy 2020, 260. [Google Scholar] [CrossRef]
- Nam, K.; Hwangbo, S.; Yoo, C. A deep learning-based forecasting model for renewable energy scenarios to guide sustainable energy policy: A case study of Korea. Renew. Sustain. Energy Rev. 2020, 122, 109725. [Google Scholar] [CrossRef]
- Sridhar, A.; Ponnuchamy, M.; Kumar, P.S.; Kapoor, A.; Xiao, L. Progress in the production of hydrogen energy from food waste: A bibliometric analysis. Int. J. Hydrogen Energy 2021, 47, 26326–26354. [Google Scholar] [CrossRef]
- Sillero, L.; Sganzerla, W.G.; Forster-Carneiro, T.; Solera, R.; Perez, M. A bibliometric analysis of the hydrogen production from dark fermentation. Int. J. Hydrogen Energy 2022, 47, 27397–27420. [Google Scholar] [CrossRef]
- Zhang, J.; Yan, J.; Infield, D.; Liu, Y.; Lien, F.-S. Short-term forecasting and uncertainty analysis of wind turbine power based on long short-term memory network and Gaussian mixture model. Appl. Energy 2019, 241, 229–244. [Google Scholar] [CrossRef]
- Wu, W.; Ma, X.; Zeng, B.; Wang, Y.; Cai, W. Forecasting short-term renewable energy consumption of China using a novel fractional nonlinear grey Bernoulli model. Renew. Energy 2019, 140, 70–87. [Google Scholar] [CrossRef]
- Du, P.; Wang, J.; Yang, W.; Niu, T. A novel hybrid model for short-term wind power forecasting. Appl. Soft Comput. 2019, 80, 93–106. [Google Scholar] [CrossRef]
- Liu, Z.; Jiang, P.; Zhang, L.; Niu, X. A combined forecasting model for time series: Application to short-term wind speed forecasting. Appl. Energy 2019, 259, 114137. [Google Scholar] [CrossRef]
- Catumba, B.D.; Sales, M.B.; Borges, P.T.; Filho, M.N.R.; Lopes, A.A.S.; Rios, M.A.d.S.; Desai, A.S.; Bilal, M.; dos Santos, J.C.S. Sustainability and challenges in hydrogen production: An advanced bibliometric analysis. Int. J. Hydrogen Energy 2023, 48, 7975–7992. [Google Scholar] [CrossRef]
- Khodayar, M.; Wang, J. Spatio-Temporal Graph Deep Neural Network for Short-Term Wind Speed Forecasting. IEEE Trans. Sustain. Energy 2018, 10, 670–681. [Google Scholar] [CrossRef]
- Demolli, H.; Dokuz, A.S.; Ecemis, A.; Gokcek, M. Wind power forecasting based on daily wind speed data using machine learning algorithms. Energy Convers. Manag. 2019, 198, 111823. [Google Scholar] [CrossRef]
- Zhang, J.; Yan, J.; Infield, D.; Liu, Y.; Lien, F.-S. Short-term forecasting and uncertainty analysis of wind turbine power based on long short-term memory network and Gaussian mixture model. Appl. Energy 2019, 241, 229–244. [Google Scholar] [CrossRef]
- Liu, Z.; Jiang, P.; Zhang, L.; Niu, X. A combined forecasting model for time series: Application to short-term wind speed forecasting. Appl. Energy 2019, 259, 114137. [Google Scholar] [CrossRef]
- Mir, M.; Shafieezadeh, M.; Heidari, M.A.; Ghadimi, N. Application of hybrid forecast engine based intelligent algorithm and feature selection for wind signal prediction. Evol. Syst. 2019, 11, 559–573. [Google Scholar] [CrossRef]
- Wang, Y.; Zou, R.; Liu, F.; Zhang, L.; Liu, Q. A review of wind speed and wind power forecasting with deep neural networks. Appl. Energy 2021, 304, 117766. [Google Scholar] [CrossRef]
- Shahid, F.; Zameer, A.; Muneeb, M. A novel genetic LSTM model for wind power forecast. Energy 2021, 223, 120069. [Google Scholar] [CrossRef]
- Tawn, R.; Browell, J. A review of very short-term wind and solar power forecasting. Renew. Sustain. Energy Rev. 2021, 153, 111758. [Google Scholar] [CrossRef]
- Tawn, R.; Browell, J. A review of very short-term wind and solar power forecasting. Renew. Sustain. Energy Rev. 2021, 153, 111758. [Google Scholar] [CrossRef]
- Yan, J.; Möhrlen, C.; Göçmen, T.; Kelly, M.; Wessel, A.; Giebel, G. Uncovering wind power forecasting uncertainty sources and their propagation through the whole modelling chain. Renew. Sustain. Energy Rev. 2022, 165. [Google Scholar] [CrossRef]
- Bjerregård, M.B.; Møller, J.K.; Madsen, H. An introduction to multivariate probabilistic forecast evaluation. Energy AI 2021, 4, 100058. [Google Scholar] [CrossRef]
|
Disclaimer/Publisher’s Note: The statements, opinions and data contained in all publications are solely those of the individual author(s) and contributor(s) and not of MDPI and/or the editor(s). MDPI and/or the editor(s) disclaim responsibility for any injury to people or property resulting from any ideas, methods, instructions or products referred to in the content. |
© 2023 by the authors. Licensee MDPI, Basel, Switzerland. This article is an open access article distributed under the terms and conditions of the Creative Commons Attribution (CC BY) license (http://creativecommons.org/licenses/by/4.0/).
