Submitted:
21 August 2023
Posted:
23 August 2023
You are already at the latest version
Abstract

Keywords:
1. Introduction
2. Materials and Methods
Study delimitation
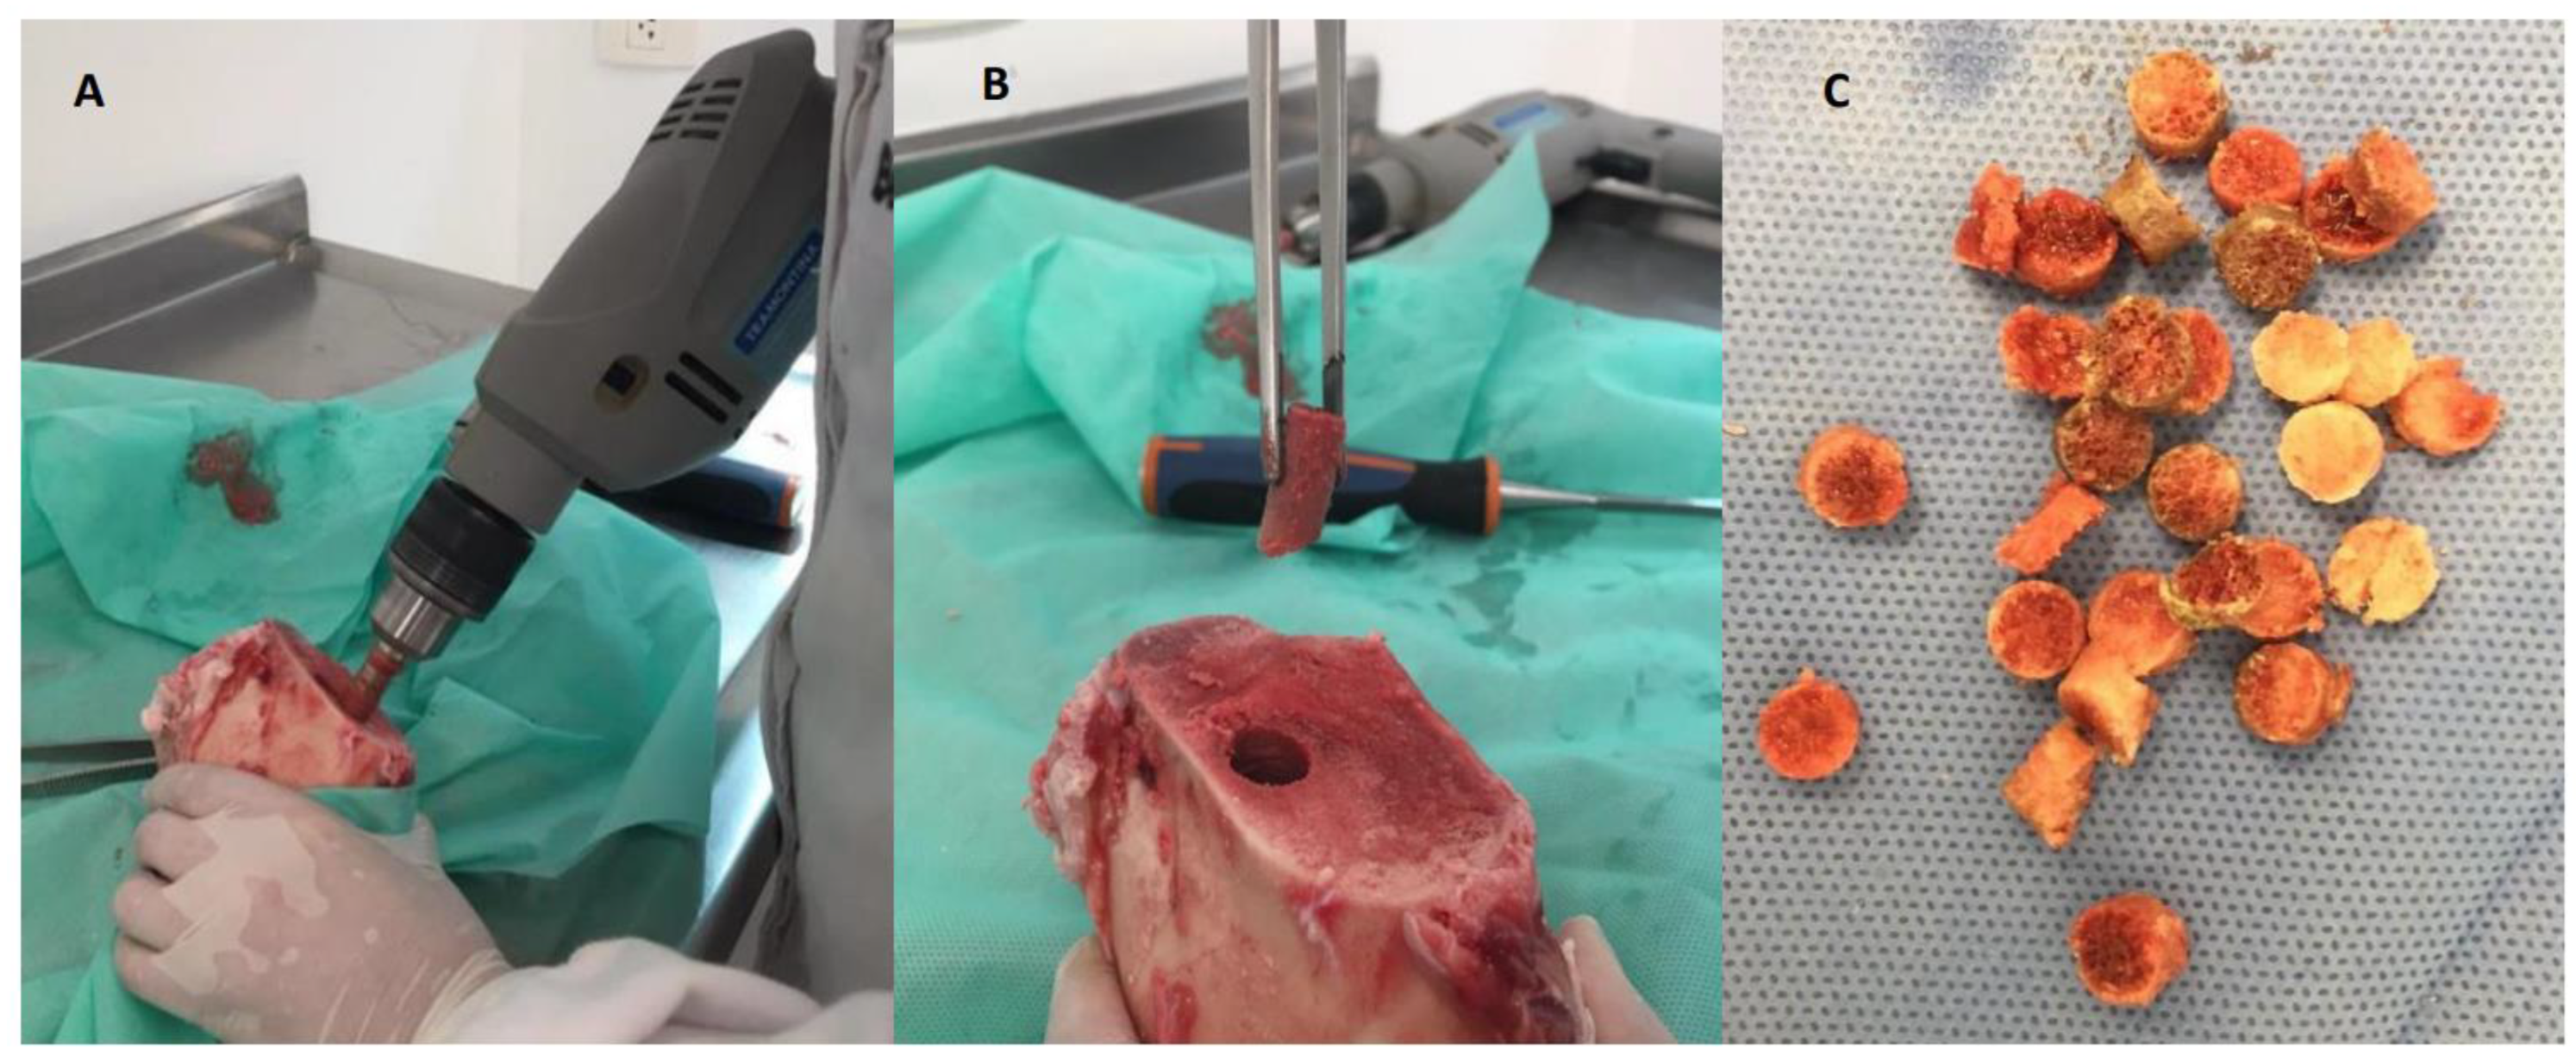
Bone scaffolds processing, nanoparticles synthesis, and AgNPs impregnation
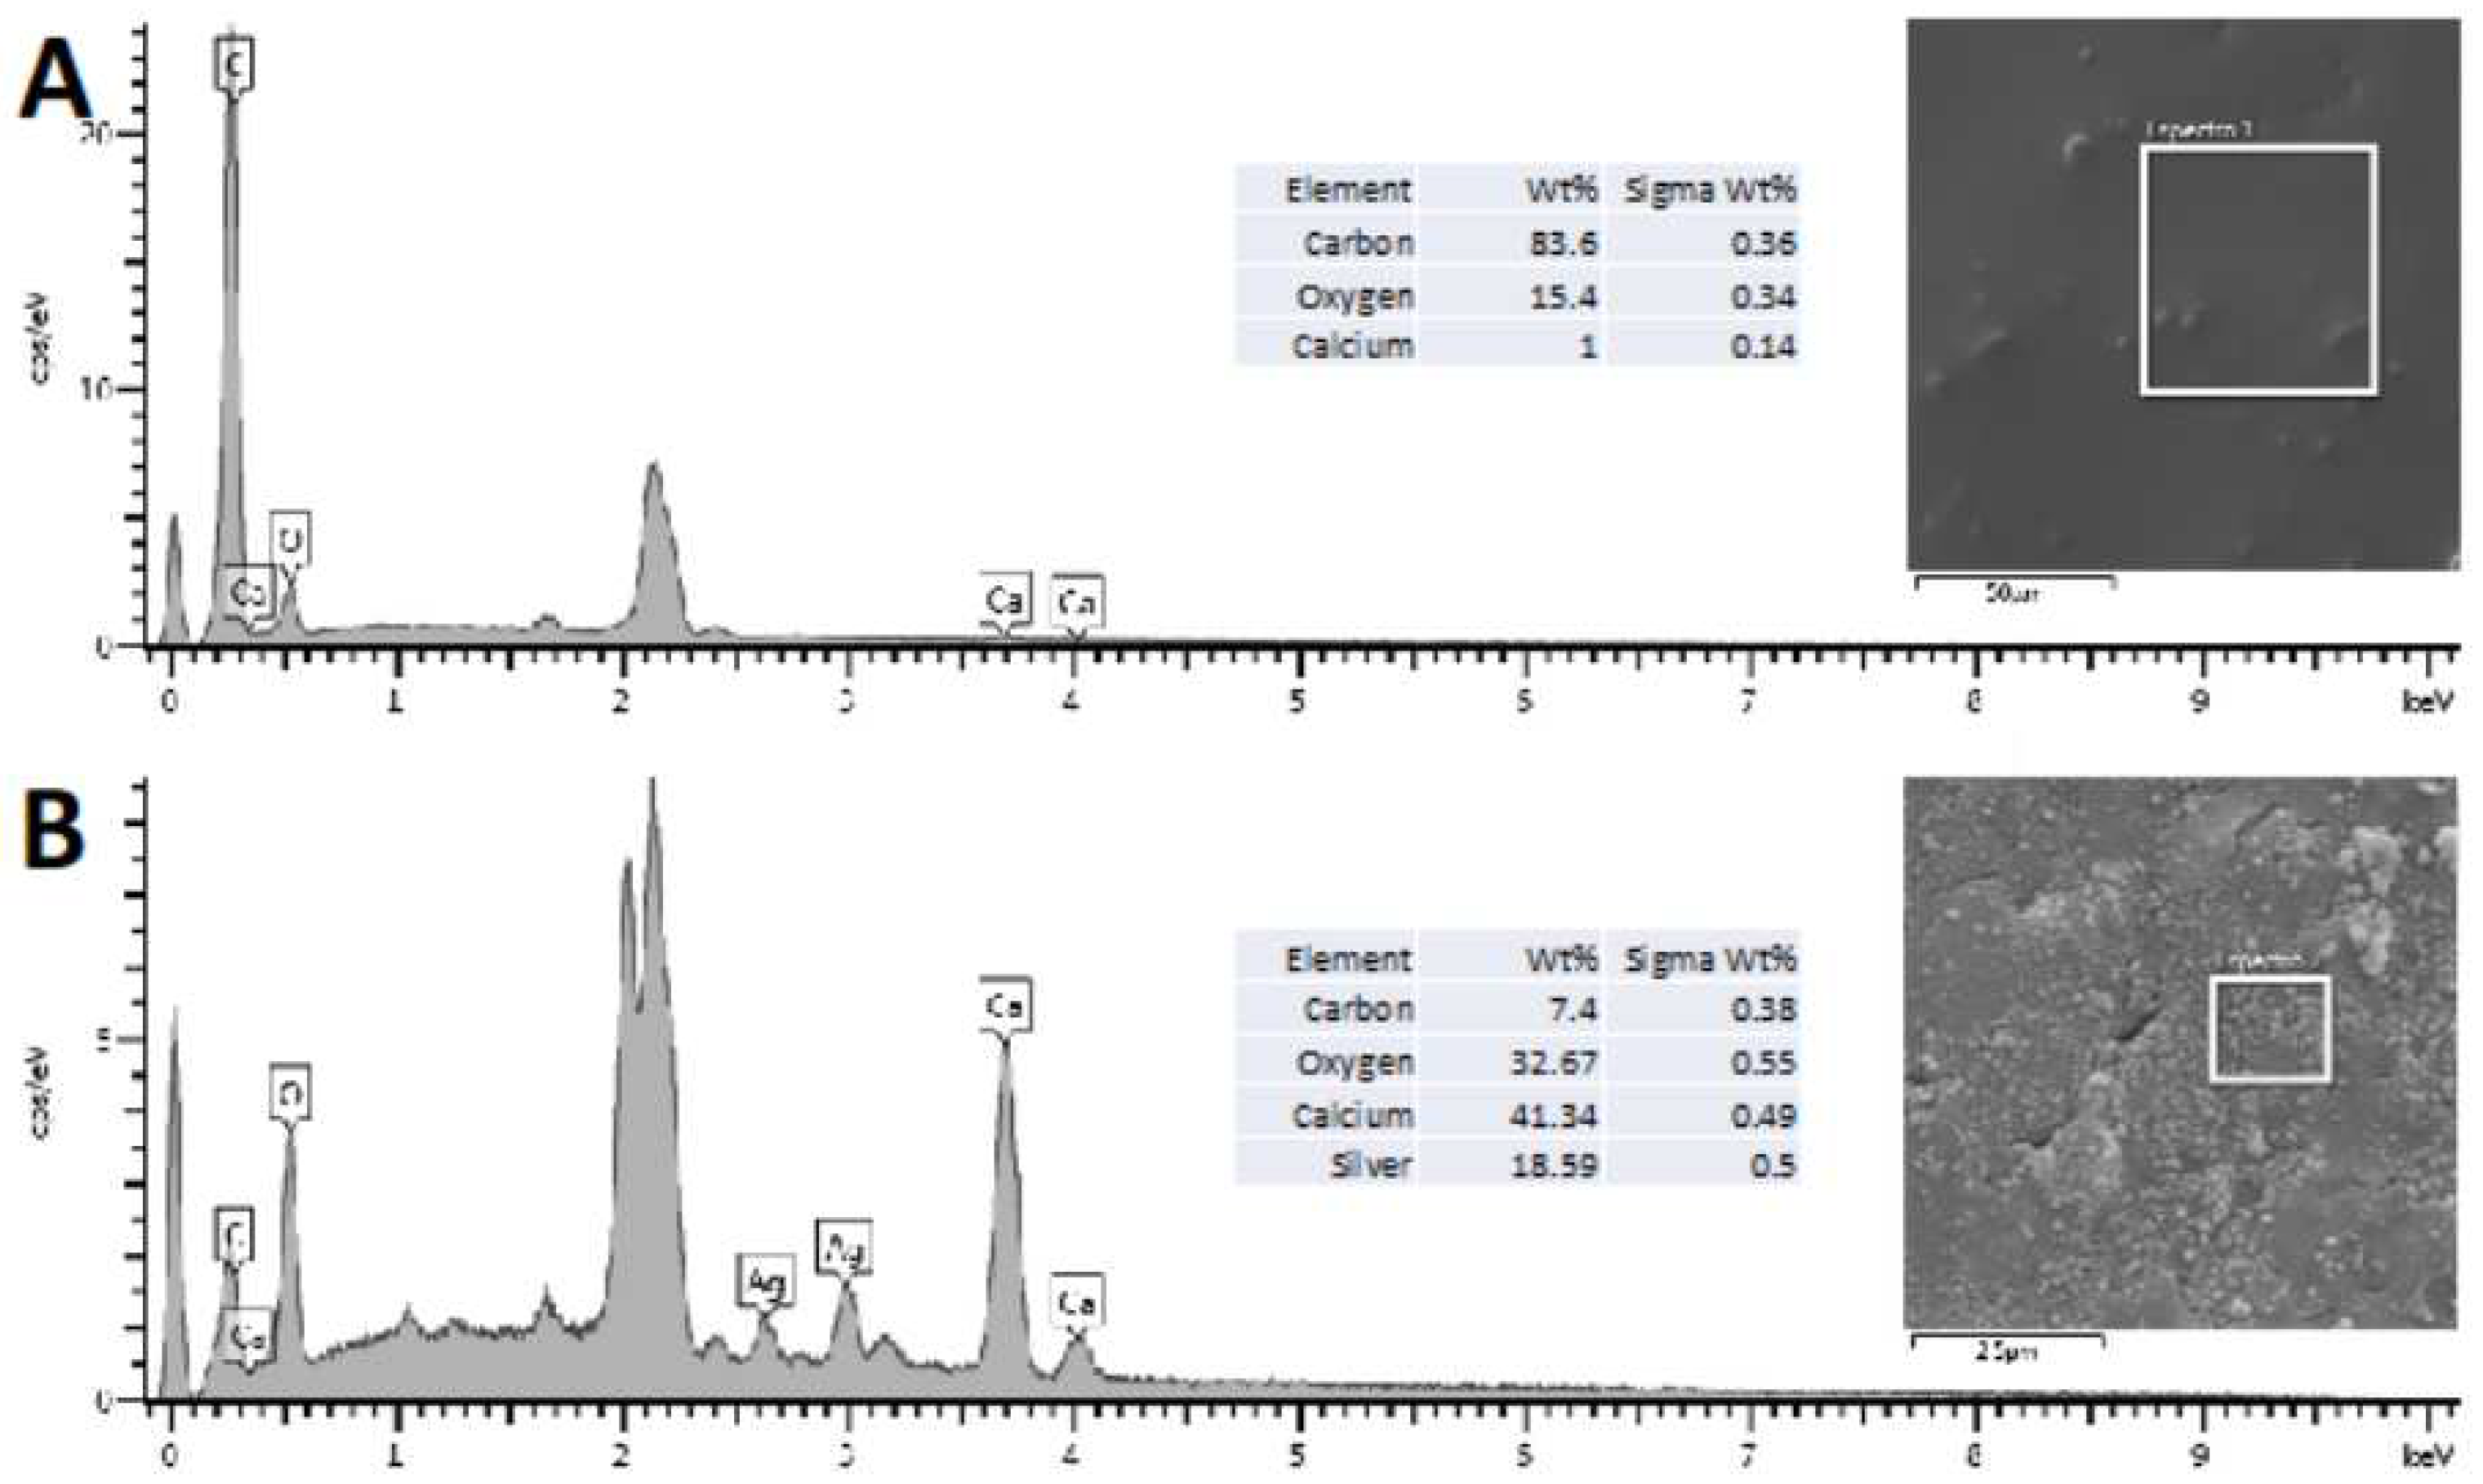
Qualitative bone discs scaffolds analysis through Scanning Electronic Microscopy and Energy Dispersion X-Ray Spectroscopy
3. Results
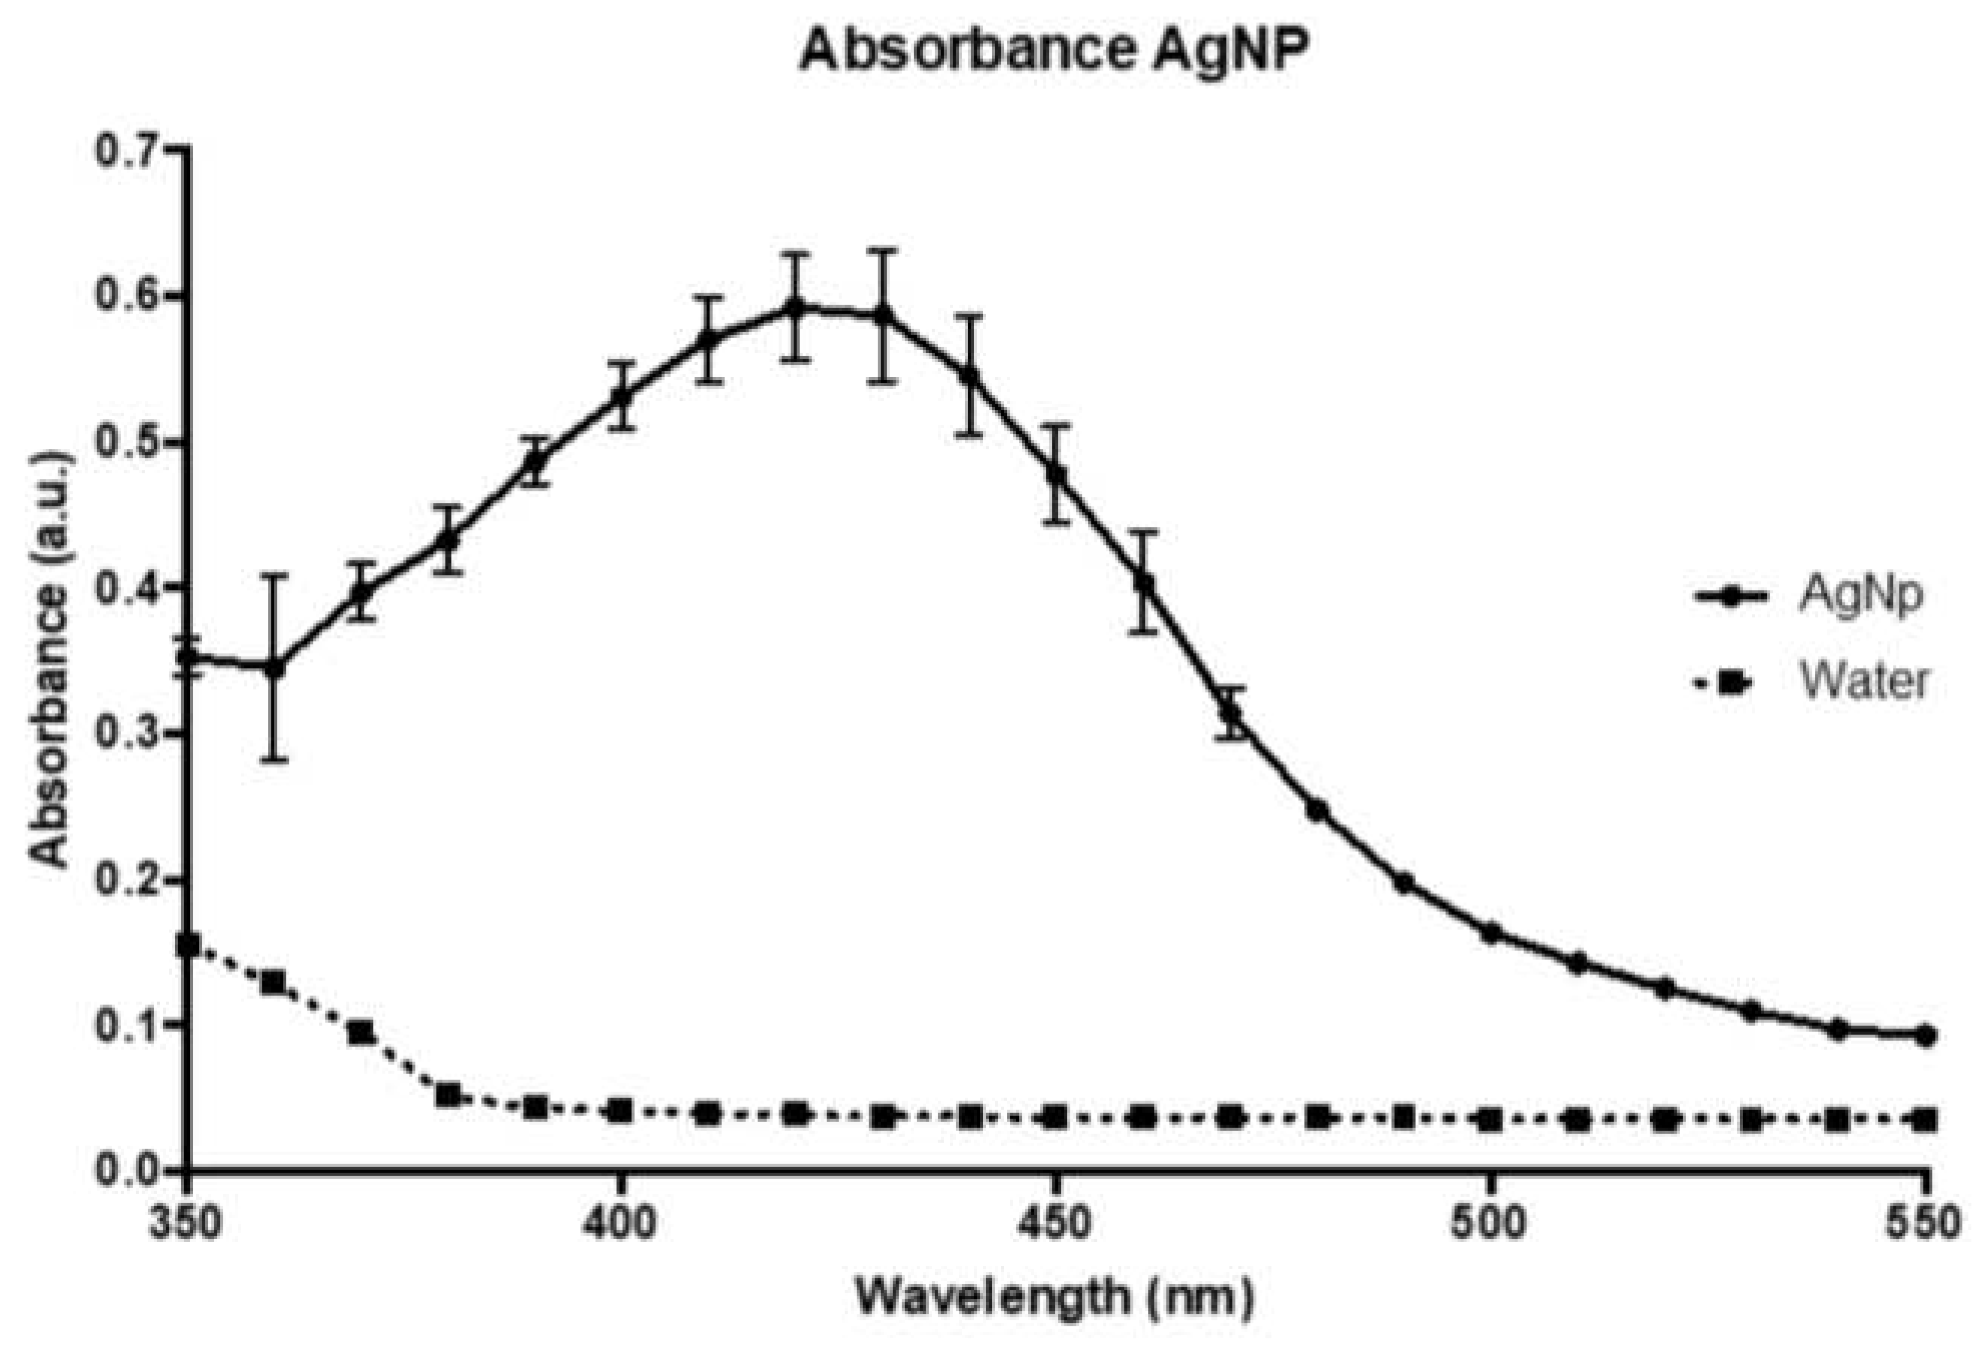
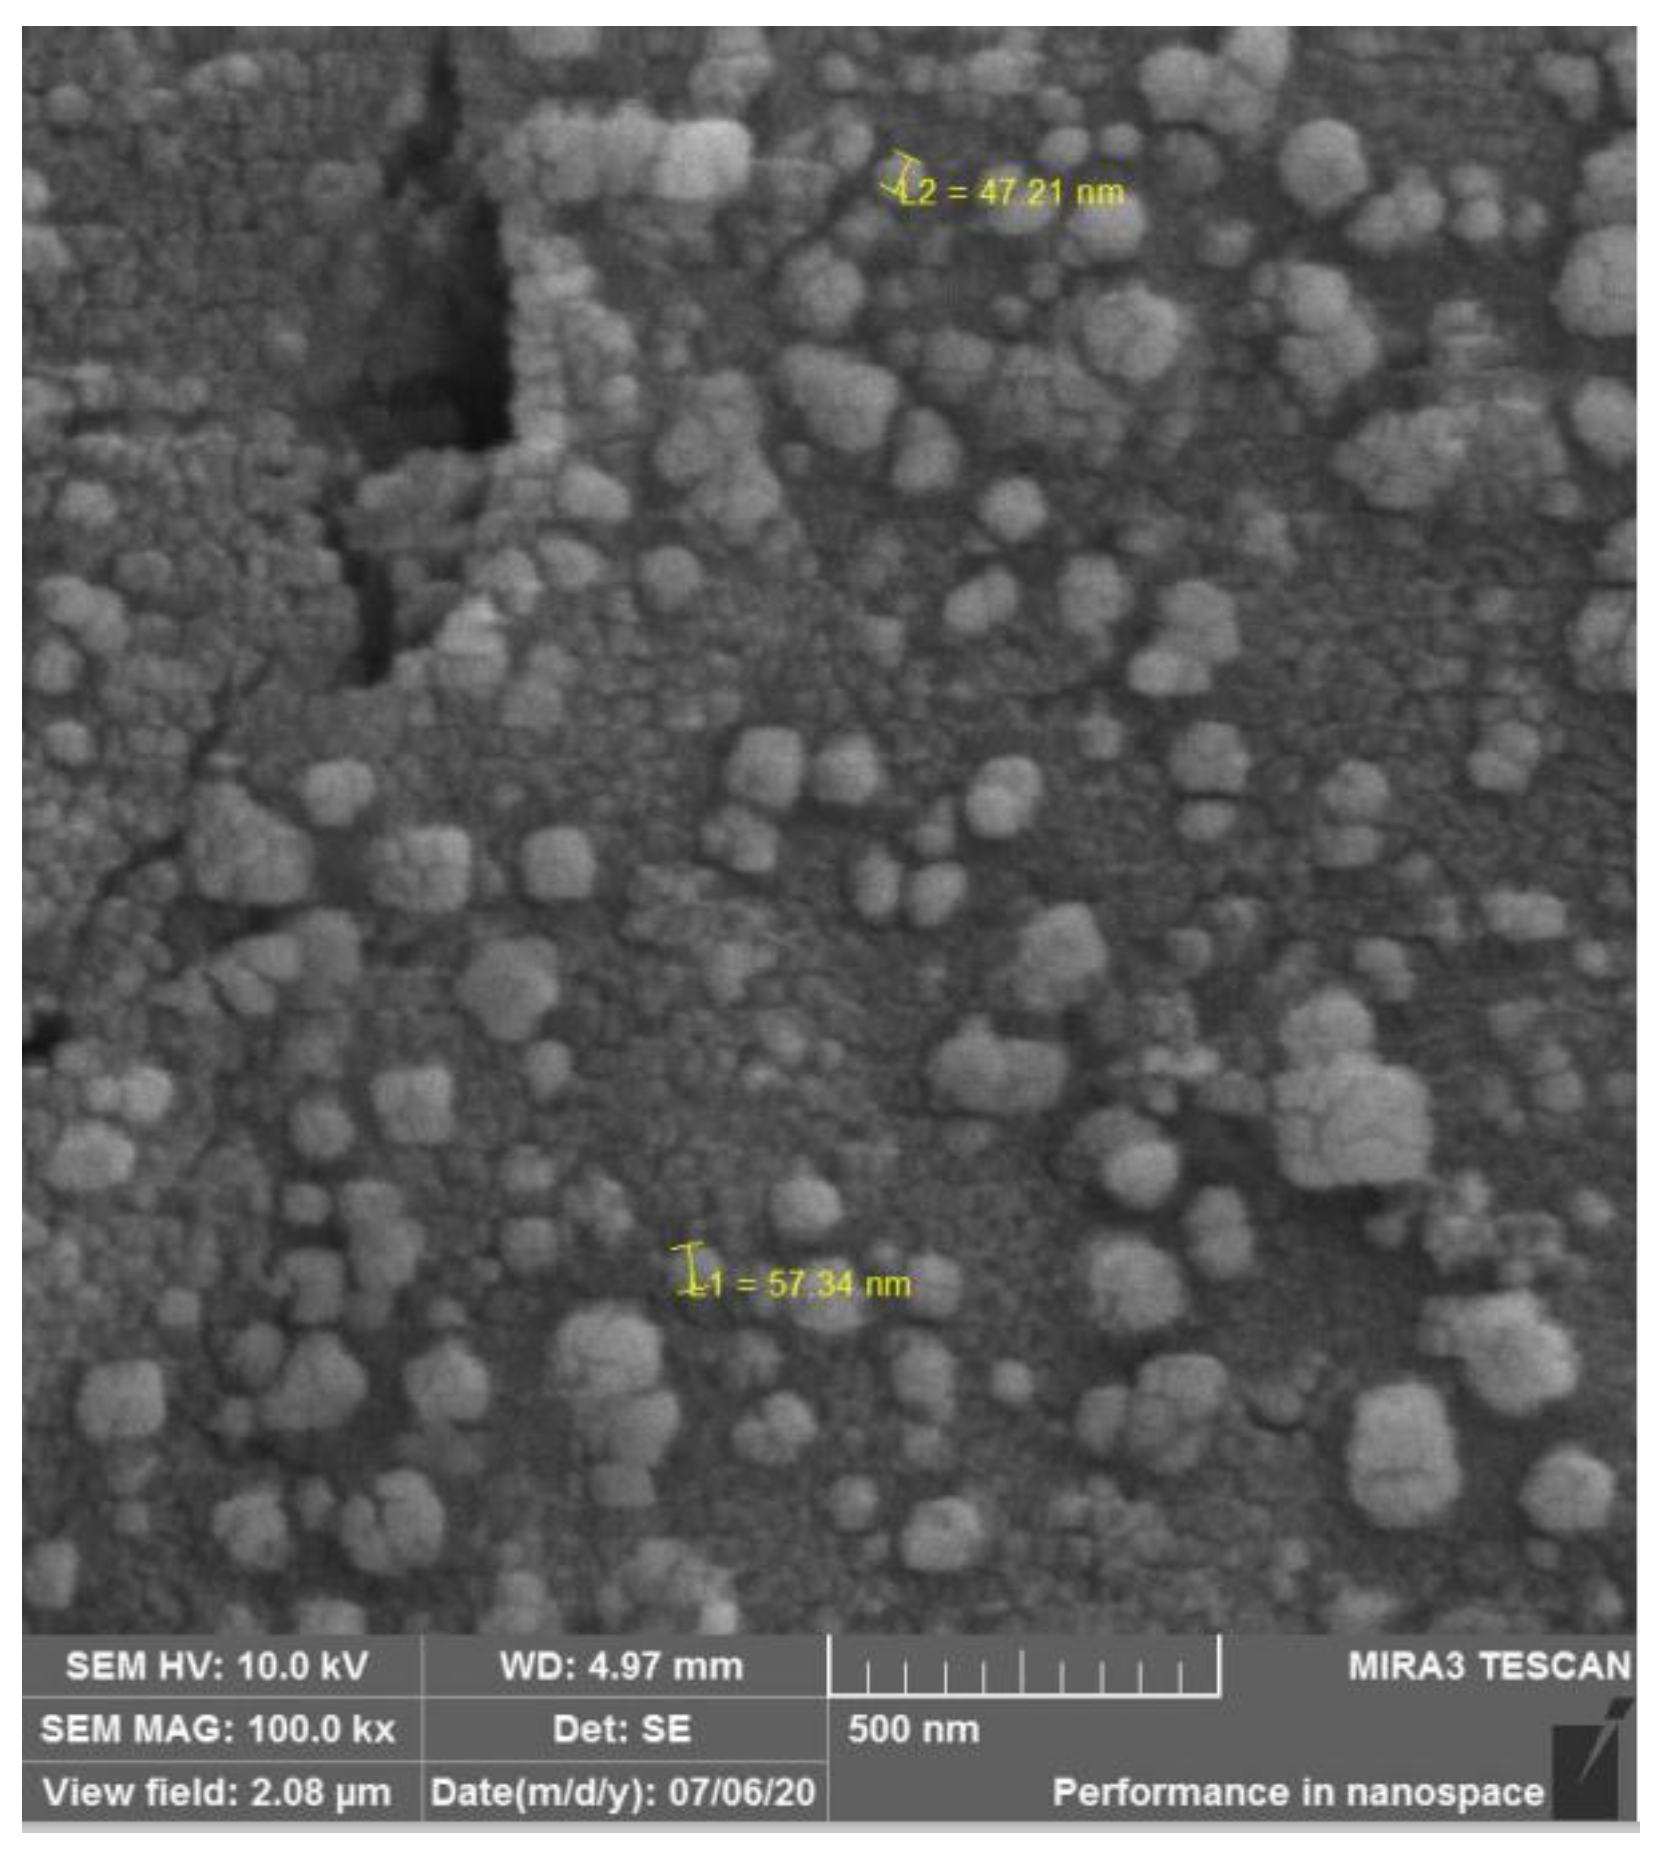
3.1. AgNPs impregnation, Qualitative bone discs scaffolds analysis through Scanning Electronic Microscopy and Energy Dispersion X-Ray Spectroscopy
3.2. Silver nitrate Minimum Inhibitory Concentration (MIC) and Minimal Bactericidal Concentration (MBC), Disc diffusion tests for AgNPs susceptibility, and Biofilm production and evaluation on bone
4. Discussion
5. Conclusions
Author Contributions
Institutional Review Board Statement
Informed Consent Statement
Data Availability Statement
Acknowledgments
Conflicts of Interest
References
- Nordmann P, Poirel L, Walsh TR, Livermore DM. The emerging NDM carbapenemases. Trends Microbiol 2011, 19, 588–595.
- Hansen, G.T. Continuous Evolution: Perspective on the Epidemiology of Carbapenemase Resistance Among Enterobacterales and Other Gram-Negative Bacteria. Infect. Dis. Ther. 2021, 10, 75–92. [Google Scholar] [CrossRef]
- Tuon, F.F.; Rocha, J.L.; Gasparetto, J. Polymyxin B and colistin—the economic burden of nephrotoxicity against multidrug resistant bacteria. J. Med Econ. 2018, 22, 158–162. [Google Scholar] [CrossRef]
- Qureshi R, Qamar MU, Shafique M, Muzammil S, Rasool MH, Ahmad I et al. Antibacterial efficacy of silver nanoparticles against metallo-beta-lactamase (blaNDM, blaVIM, blaOXA) producing clinically isolated Pseudomonas aeruginosa. Pak J Pharm Sci 2021, 34, 237–243.
- Galia CR, Junior GDL, Ávila LM, Rosito R, Macedo CAS Enxerto bovino liofilizado: comportamento histológico após seguimento de 49 meses em seres humanos. Rev Bra Ort 2012, 47, 770–775. [CrossRef]
- Sugihara, S.; van Ginkel, A.D.; Jiya, T.U.; van Royen, B.J.; van Diest, P.J.; Wuisman, P.I.J.M. Histopathology of retrieved allografts of the femoral head. J. Bone Jt. Surg. 1999, 81, 336–341. [Google Scholar] [CrossRef]
- Saikia, K.; Bhattacharya, T.; Bhuyan, S.; Talukdar, D.; Saikia, S.; Jitesh, P. Calcium phosphate ceramics as bone graft substitutes in filling bone tumor defects. Indian J. Orthop. 2008, 42, 169–172. [Google Scholar] [CrossRef]
- Oliveira R, Sicca C, Silva, T. Da Temperatura De Desproteinização No Preparo De Osso Cortical Bovino Microgranular: Avaliação Microscópica E Bioquímica Da Resposta Celular Em Subcutâneo De. Rev Fac Odontol. 1999.
- Iviglia, G.; Kargozar, S.; Baino, F. Biomaterials, Current Strategies, and Novel Nano-Technological Approaches for Periodontal Regeneration. J. Funct. Biomater. 2019, 10, 3. [Google Scholar] [CrossRef]
- Del Pozo, J.L.; Patel, R. Infection Associated with Prosthetic Joints. New Engl. J. Med. 2009, 361, 787–794. [Google Scholar] [CrossRef]
- Frommelt, TL. Principles of systemic antimicrobial therapy in foreign material associated infection in bone tissue, with special focus on periprosthetic infection. Injury 2006, 37, S87–S94. [Google Scholar] [CrossRef]
- Zimmerli, W. Infection and musculoskeletal conditions: Prosthetic-joint-associated infections. Best practice & research. Clin Rheu, 2006; 20(6), 1045-1063.
- Allaker, R. The Use of Nanoparticles to Control Oral Biofilm Formation. J. Dent. Res. 2010, 89, 1175–1186. [Google Scholar] [CrossRef]
- Tian, J.; Wong, K.K.; Ho, C.M.; Lok, C.N.; Yu, W.Y.; Che, C.M.; Cliu, J.F.; Tam, P.K. Topical delivery of silver nanoparticles promotes wound healing. ChemMedChem 2007, 2, 129–136. [Google Scholar] [CrossRef]
- Kose N, Asfuroglu ZM, Kose A, Şahintürk V, Gürbüz M, Doğan A. Silver ion-doped calcium phosphate-based bone-graft substitute eliminates chronic osteomyelitis: An experimental study in animals. J Orthop Res 2021, 39, 1390–1401. [CrossRef]
- Dantas, L.R.; Wollmann, L.C.; Suss, P.H.; Kraft, L.; Ribeiro, V.S.T.; Tuon, F.F. Disinfection protocol for human musculoskeletal allografts in tissue banking using hydrogen peroxide 30%. Cell Tissue Bank. 2021, 22, 643–649. [Google Scholar] [CrossRef] [PubMed]
- Dong HW, D.; Sun, G.; Hinestroza, J. Assembly of Metal Nanoparticles on Electrospun Nylon 6 Nanofibers by Control of Interfacial Hydrogen-Bonding Interactions. Chem Mater 2015, 20, 5. [Google Scholar] [CrossRef]
- Paramelle, D.; Sadovoy, A.; Gorelik, S.; Free, P.; Hobley, J.; Fernig, D.G. A rapid method to estimate the concentration of citrate capped silver nanoparticles from UV-visible light spectra. Anal. 2014, 139, 4855–4861. [Google Scholar] [CrossRef] [PubMed]
- Becerril-Juáres IGM-L, R.A.; Ureña-Nuñez, F.; Arenas-Alatorre, J.A.; Hinestroza, J.P.; Sánchez-Mendieta, V. Silver micro-, submicro- and nano-crystals using bovine bone as template. Formation of a silver/bovine bone composite. Mat Lett 2012; 85: 4.
- Sütterlin, S.; Tano, E.; Bergsten, A.; Tallberg, A.; Melhus, H. Effects of Silver-based Wound Dressings on the Bacterial Flora in Chronic Leg Ulcers and Its Susceptibility In Vitro to Silver. Acta Dermato-Venereologica 2012, 92, 34–39. [Google Scholar] [CrossRef] [PubMed]
- CLSI. Clinical and Laboratory Standards Institute. Methods for Dilution Antimicrobial Susceptibility Tests for Bacteria That Grow Aerobically; Approved Standard-Tenth Edition. 2015; CLSI DOCUMENTE M07-A10.
- Saegeman, V.; Ectors, N.; Lismont, D.; Verduyckt, B.; Verhaegen, J. Bacteriostasis testing on allograft tissue inoculated in Wilkins–Chalgren broth. J. Hosp. Infect. 2008, 70, 278–283. [Google Scholar] [CrossRef] [PubMed]
- Pollini, M.; Paladini, F.; Catalano, M.; Taurino, A.; Licciulli, A.; Maffezzoli, A.; Sannino, A. Antibacterial coatings on haemodialysis catheters by photochemical deposition of silver nanoparticles. J. Mater. Sci. Mater. Med. 2011, 22, 2005–2012. [Google Scholar] [CrossRef]
- Franklin, M.J.; Chang, C.; Akiyama, T.; Bothner, B. New Technologies for Studying Biofilms. Microbiol. Spectr. 2015, 3. [Google Scholar] [CrossRef]
- Cieslinski, J.; Ribeiro, V.S.T.; Kraft, L.; Suss, P.H.; Rosa, E.; Morello, L.G.; Pillonetto, M.; Tuon, F.F. Direct detection of microorganisms in sonicated orthopedic devices after in vitro biofilm production and different processing conditions. Eur. J. Orthop. Surg. Traumatol. 2021, 31, 1113–1120. [Google Scholar] [CrossRef]
- Trampuz, A.; Piper, K.E.; Jacobson, M.J.; Hanssen, A.D.; Unni, K.K.; Osmon, D.R.; Mandrekar, J.N.; Cockerill, F.R.; Steckelberg, J.M.; Greenleaf, J.F.; et al. Sonication of Removed Hip and Knee Prostheses for Diagnosis of Infection. New Engl. J. Med. 2007, 357, 654–663. [Google Scholar] [CrossRef]
- Davido, B.; Noussair, L.; Saleh-Mghir, A.; Salomon, E.; Bouchand, F.; Matt, M.; Lawrence, C.; Bauer, T.; Herrmann, J.; Perronne, C.; et al. Case series of carbapenemase-producing Enterobacteriaceae osteomyelitis: Feel it in your bones. J. Glob. Antimicrob. Resist. 2020, 23, 74–78. [Google Scholar] [CrossRef] [PubMed]
- John, M.S.; Nagoth, J.A.; Ramasamy, K.P.; Ballarini, P.; Mozzicafreddo, M.; Mancini, A.; Telatin, A.; Liò, P.; Giuli, G.; Natalello, A.; et al. Horizontal gene transfer and silver nanoparticles production in a new Marinomonas strain isolated from the Antarctic psychrophilic ciliate Euplotes focardii. Sci. Rep. 2020, 10, 1–14. [Google Scholar] [CrossRef] [PubMed]
- Mathur P, Jha S, Ramteke S, Jain NK. Pharmaceutical aspects of silver nanoparticles. Artif Cells Nanomed Biotechnol 2018; 46: 115-26.
- Bhatia, E.; Banerjee, R. Hybrid silver–gold nanoparticles suppress drug resistant polymicrobial biofilm formation and intracellular infection. J. Mater. Chem. B 2020, 8, 4890–4898. [Google Scholar] [CrossRef]
- Mih, N.; Monk, J.M.; Fang, X.; Catoiu, E.; Heckmann, D.; Yang, L.; Palsson, B.O. Adaptations of Escherichia coli strains to oxidative stress are reflected in properties of their structural proteomes. BMC Bioinform. 2020, 21, 1–23. [Google Scholar] [CrossRef]
- Baker, C.; Pradhan, A.; Pakstis, L.; Pochan, D.; Shah, S.I. Synthesis and Antibacterial Properties of Silver Nanoparticles. J. Nanosci. Nanotechnol. 2005, 5, 244–249. [Google Scholar] [CrossRef]
- Martinez LC, Vadyvaloo V. Mechanisms of post-transcriptional gene regulation in bacterial biofilms. Front Cell Infect Microbiol 2014; 4: 38.
- E Olson, M.; Ceri, H.; Morck, D.W.; Buret, A.G.; Read, R.R. Biofilm bacteria: formation and comparative susceptibility to antibiotics. Can. J. Veter- Res. = Rev. Can. de Rech. Veter- 2002, 66, 86–92. [Google Scholar]
- Zhang, Y.; Pan, X.; Liao, S.; Jiang, C.; Wang, L.; Tang, Y.; Wu, G.; Dai, G.; Chen, L. Quantitative Proteomics Reveals the Mechanism of Silver Nanoparticles against Multidrug-Resistant Pseudomonas aeruginosa Biofilms. J. Proteome Res. 2020, 19, 3109–3122. [Google Scholar] [CrossRef]
- Anuj, S.A.; Gajera, H.P.; Hirpara, D.G.; Golakiya, B.A. Bacterial membrane destabilization with cationic particles of nano-silver to combat efflux-mediated antibiotic resistance in Gram-negative bacteria. Life Sci. 2019, 230, 178–187. [Google Scholar] [CrossRef] [PubMed]

Disclaimer/Publisher’s Note: The statements, opinions and data contained in all publications are solely those of the individual author(s) and contributor(s) and not of MDPI and/or the editor(s). MDPI and/or the editor(s) disclaim responsibility for any injury to people or property resulting from any ideas, methods, instructions or products referred to in the content. |
© 2023 by the authors. Licensee MDPI, Basel, Switzerland. This article is an open access article distributed under the terms and conditions of the Creative Commons Attribution (CC BY) license (http://creativecommons.org/licenses/by/4.0/).


