Preprint
Article

The Molecular Characterization of Lineage-IV Peste Des Petits Ruminants Virus and the Development of In-House IELISA for Its Rapid Detection

Altmetrics

Downloads

167

Views

109

Comments

0

Submitted:

23 August 2023

Posted:

23 August 2023

You are already at the latest version

Alerts
Abstract
Peste des Petits Ruminants (PPR), a highly contagious viral disease, causes significant economic losses in sheep and goats. Laboratory diagnosis is crucial to disease control and eradication. Since PPRVs have recently adopted new hosts, genetic diversity within isolates of the same lineage is more likely than if they were host-specific, sheep and goats most often. ELISA detects antibodies and antigens in serology. However, mishandling, environmental conditions (temperature and humidity), storage, and sensitivity issues of commercially available ELISA kits prevent rapid PPR virus detection in third-world countries like Pakistan. In the 2020-21 outbreaks in Pakistan, 325 blood samples, 19 swabs, and 6 virus tissue samples of sheep and goats were collected from Gilgit, Islamabad, and Fateh Jang. These virus isolates were submitted to NCBI for partial N gene sequencing. Antigen was prepared from indigenous virus Using semi-purified antigen from PPRV, an indirect ELISA for the detection of PPR antibodies in goat and sheep serum was developed using MW600922 grown in Vero cells. Dilutions of 1:200 serums and 1:32 antigens improve antibody detection. The N-gene-based analysis revealed a better understanding of PPRV genetic characterization. This study develops an RT-PCR assay to detect PPRV by targeting the N-protein gene. This assay offers an accurate and affordable diagnostic tool for PPRV and partial genome sequencing. Results described that PPRV isolates from the current study have 99.73% and 99.4% similarity to previously published Lahore and Faisalabad isolates from Pakistan, respectively. Compared to previous isolates from NCBI data, the virus showed high divergence rates with the Turkish strain. The comparative analysis between Commercial kit (c-ELISA) and I-ELISA revealed that the former had a high sensitivity of 90.60% and specificity of 85.23% compared with the cELISA kit. By comparing I-ELISA and VNT, we find that the current assay is 100% specific and 82.14 % sensitive. Based on these results, serological surveys for PPR antibodies, on a larger scale, in small ruminants can be conducted with indirect ELISA rather than competitive ELISA. Furthermore, the cost and storage efficiency was highly significant because the currently developed method has a low production cost, which is much lesser than the commercially available kit. Our findings demonstrated a significant breakthrough in terms of cost-effectiveness and storage efficiency, and they are highly recommended for developing countries.
Keywords: 
Subject: Biology and Life Sciences  -   Virology

1. Introduction

Peste des petits ruminants (PPRV) is a febrile viral disease of small ruminants that primarily affects sheep and goats. The disease PPRV is caused by Small Ruminant’s Morbillivirus that causes PPR belongs to the Paramyxoviridae family [1]. PPRV is characterized by a high fever, conjunctivitis, mucopurulent ocular and nasal discharge, and respiratory mucosa erosions. Bronchopneumonia and diarrhea are fatal in severe cases [2]. This virus has a morbidity and mortality rate of up to 100% [3]. PPRV as initially thought to only affect small ruminant species, such as sheep and goats [4]. However, camels, wildlife species, large ruminants, and unusual hosts have recently shown clinical and pathological signs of PPRV infection, seroconversion, genomic identification, and viral antigen detection [5]. PPRV can potentially spread to new susceptible hosts from infected ones, such as wild animals, small ruminants, and even large ruminants [6]. Camels are not the only animals that have been affected by the disease [7]. According to Hosny and colleagues [8] and others [9], who investigated the recent deaths of camels in Sudan from a fatal respiratory disease that was traced to PPRV, the PPR virus is spreading to new hosts, although sheep and goats are the most common hosts for PPRV.
PPRV was previously discovered in the Ivory Coast [10]. At present, the disease is prevalent in Africa, the Arabian Peninsula, and South-West Asia [11]. PPRV first appeared in Faisalabad, Pakistan [12], where 44% of sheep and 54% of goats were infected, as can be observed from the data collected from reported cases [13,14]. PPRV’s behavior is expected to evolve over time. The F.A.O. (Food and Agriculture Organization) plans to eradicate PPR by the year 2030. Pakistan loses PKR 20.5 billion (USD 0.24 billion) annually as a result of PPRV cases [15,16]. These outbreaks of PPRV are highly damaging to the economy; inflicting varying socio-economic impacts round the year.
A standardized panel of diagnostic assays were developed over the period of time to ensure specific diagnosis of the PPR virus infections. These include agar gel precipitation test (AGPT), virus neutralization test (VNT), enzyme immunoassay, and other antigen-detection-based methods were originally used to diagnose PPRV. Immune-capture ELISA (Ic-ELISA) for antigen detection and monoclonal-antibody-based cELISA for antibody determination purposes are used to diagnose PPRV [6,32,40]. It is evident that successful diagnosis of diseases relies on the application of reliable diagnostic procedures.
As molecular biology has progressed over time, cutting-edge techniques, such as the reverse transcription polymerase chain reaction (RT-PCR) method, have been developed [18,19,20]. The PPRV has six structural and two non-structural proteins and four lineages (I, II, III, and IV) based on N and F genes [17]. Pakistani PPRV was included in the lineage IV category based on the F gene [18]. Most national diagnostic laboratories use conventional RT-PCR techniques with the N-gene-specific primer set NP3/NP4 to diagnose PPRV [18]. However, this primer set was designed using the sequence of vaccine strain Nigeria/75/1, which may not be applicable in the scenarios at present, as multiple lineages of the virus are spreading through single countries or regions, and the problem becomes more difficult to study when a low level of viral infection persists or during the deterioration of viral material during its transportation to laboratories [35].
Heat-sensitive components of commercial kits can easily deteriorate in a tropical climate, such as the climate in Pakistan, resulting in kit spoilage. There is an increasing need in the field to develop an in-house IELISA kit that is cost effective and that may also serve as a suitable replacement for cELISA, due to the changes/mutations in the indigenous strains originating in Pakistan. Numerous laboratories and researchers have developed in-house IELISA kits since commercial kits are very expensive. In the past, a group of scientists developed a polyclonal-antibody-based IELISA kit, and their test results obtained for seroepidemiological studies correlated very well with those of an expensive, commercial cELISA kit [21].
The current study was thus conducted have an insight into the molecular diagnosis of PPRV in the country, on basis of N-gene. The commercial cELISA kits though highly sensitive & specific, however, are cost prohibitive which undermine their potential use in routine serological analysis. Therefore, an efficient Indirect ELISA (IELISA) was developed to screen out the reactors. The effectiveness of the newly developed IELISA was then evaluated by comparing it to a commercial cELISA kit. Additionally, the phylogenic analysis we performed will aid in our understanding of disease spread. In Pakistan, small ruminant outbreaks continue to occur, necessitating further research into the molecular details of circulating field viruses.

2. Materials and Methods

2.1. Clinical Specimen Collection

The suspected outbreaks of PPR reported by resource persons within three different regions including Islamabad territory (33.6844° N, 73.0479°), Fateh Jang (33.8611° N, 72.4140° E), and Gilgit (35.9208° N, 74.3082° E) were attended, during 2020–2021. The affected herds were visited to record the clinical manifestations and clinical specimen were collected following standard procedure [8,9]. The sampled animals had no history of vaccination against PPRV.The sampling locations were presented in (Figure 1).
The oculo-nasal swabs (n = 19) were collected from clinically suspected goats & sheep in viral transport medium containing Dulbecco Minimum Essential Medium (DMEM) with 2% pen-strep antibiotics added (pH 7.2) for antigen detection (Table 1). The blood sample (n = −325) were collected from clinically suspected and apparently healthy contact goats & sheep through jugular vein puncture using sterile needles in vacutainer tubes, without any anticoagulant (B.D. bioscience) for the antibody detection. The serum collected from the sheep/goats blood samples was centrifuged and stored at 4 °C for future research purposes. (Table 1).
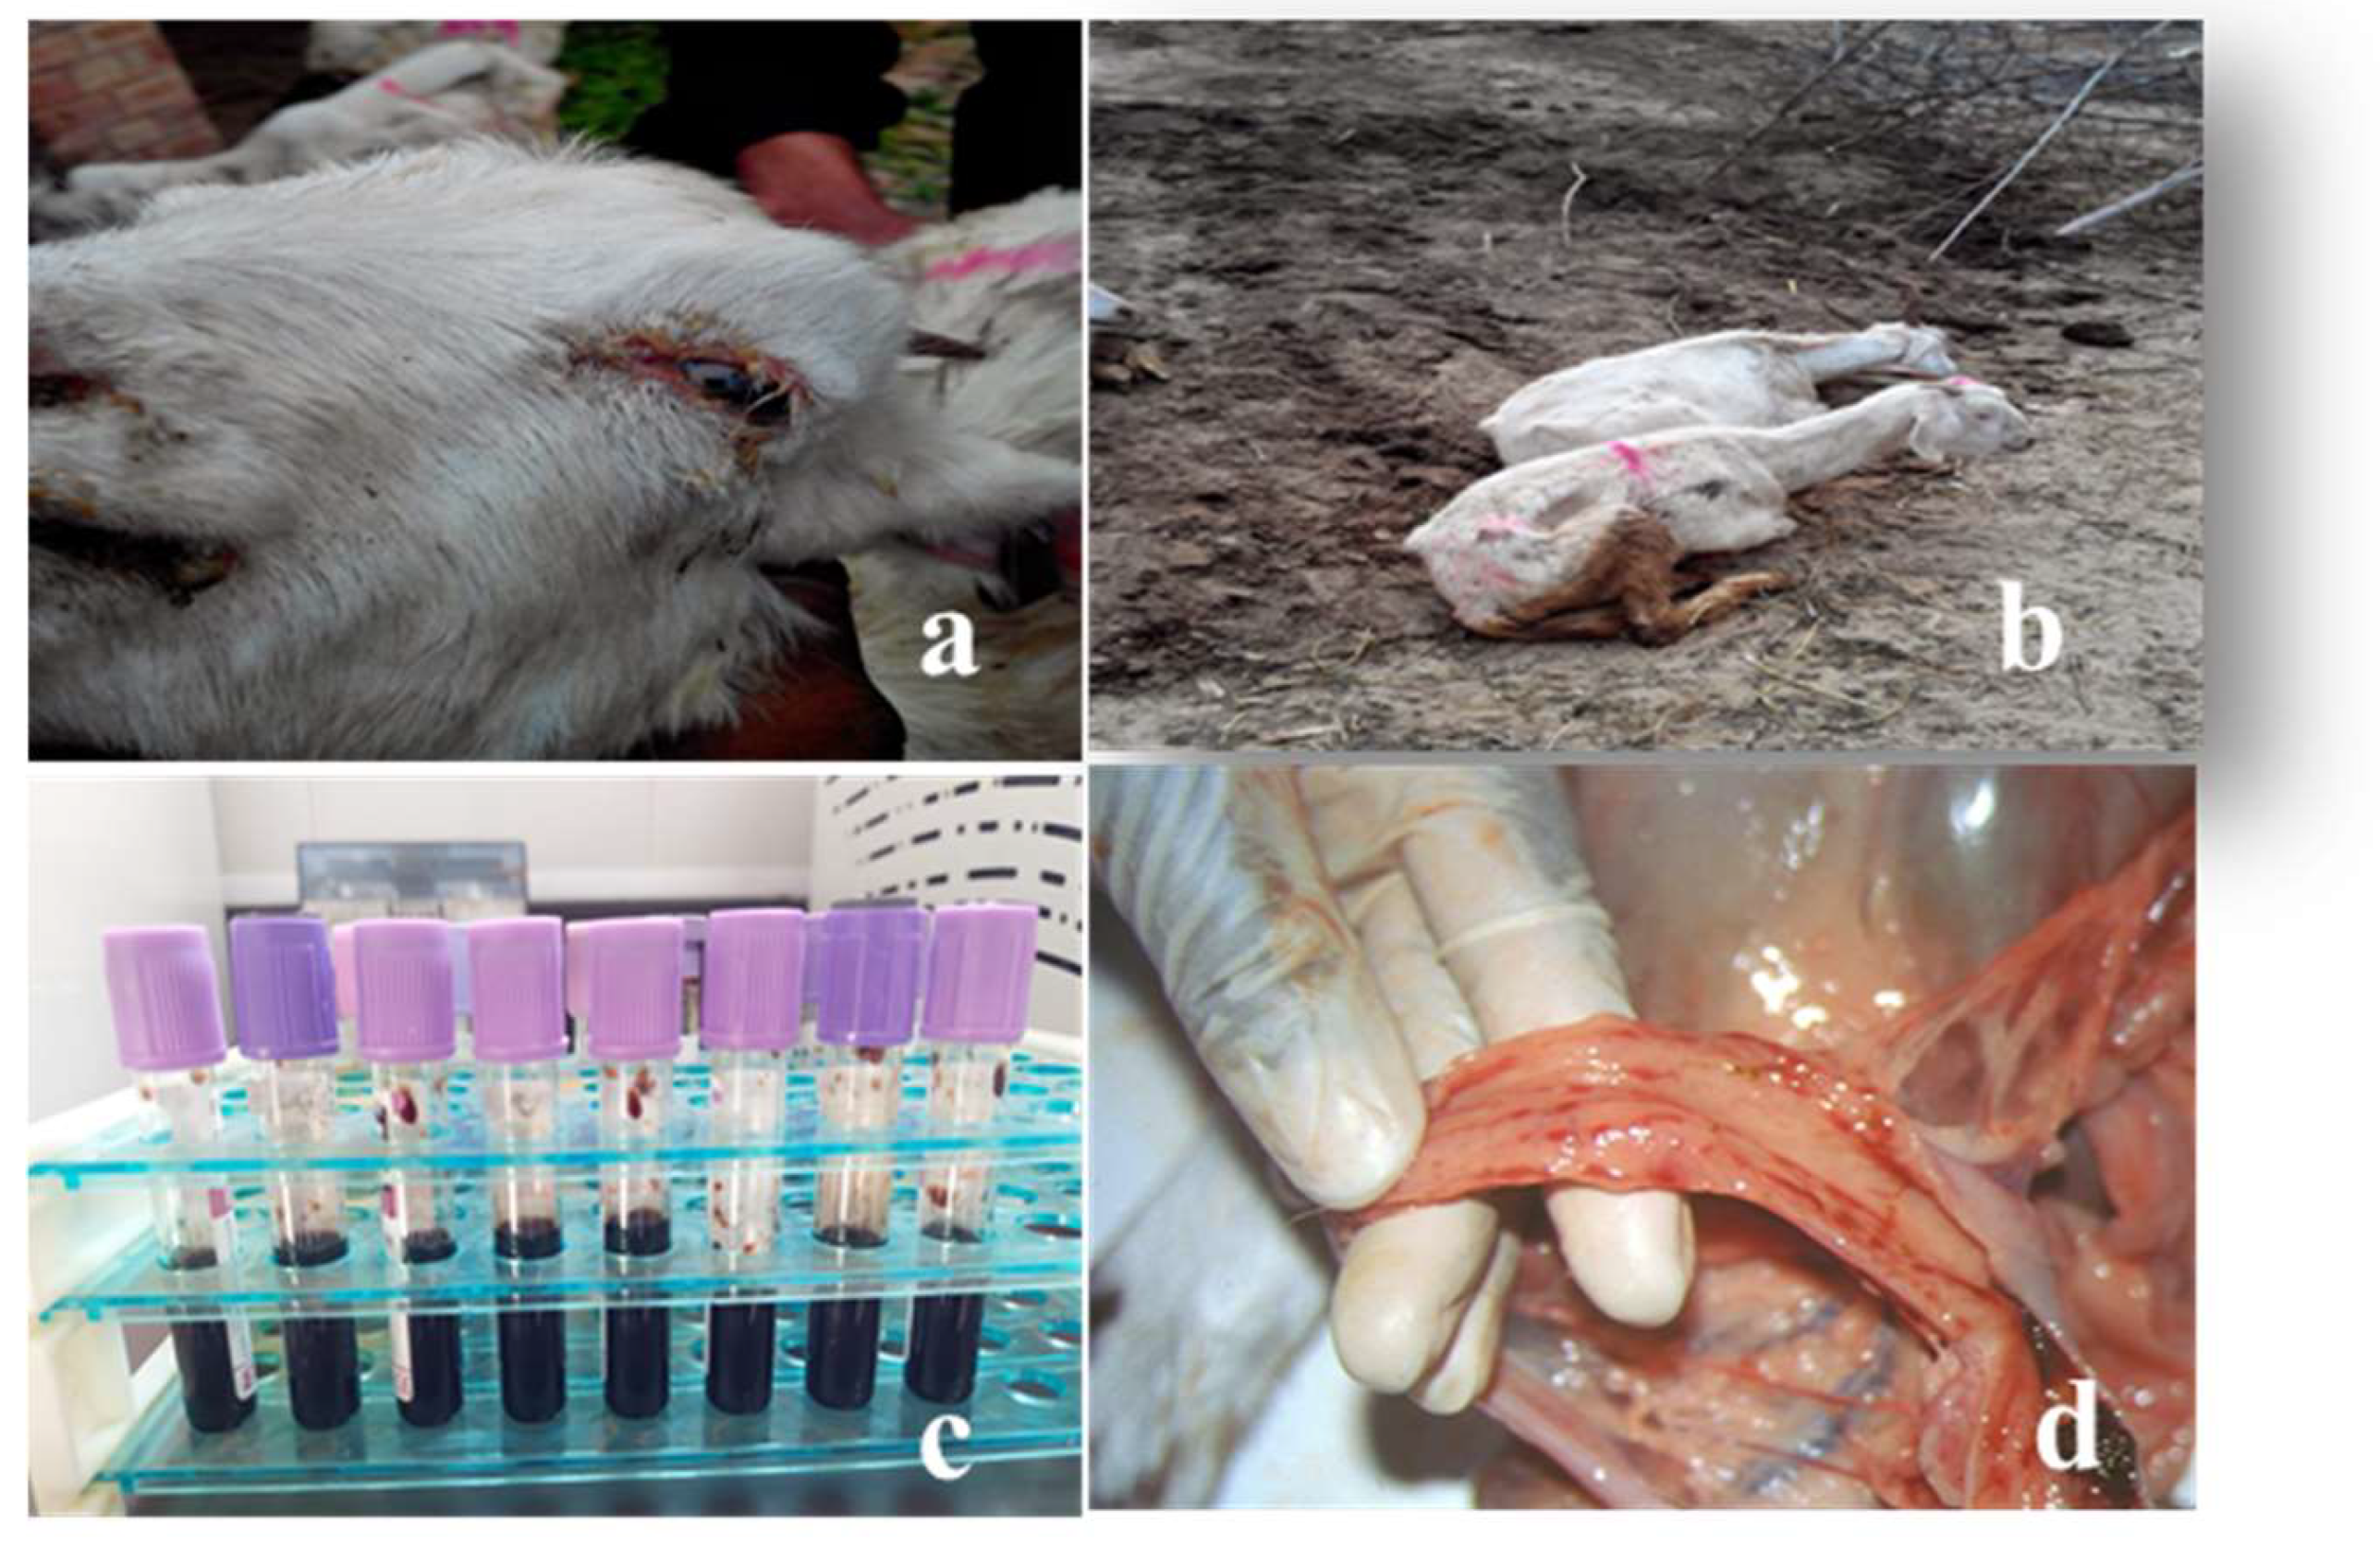
The necropsy was conducted where dead animals were found. These included tissue samples (n = 6: lungs; spleen & mesenteric lymph nodes) were aseptically collected using sterile forceps and scissors (Figure 2). The clinical specimen were transported to the laboratory in cool boxes with frozen gel packs and stored at −80 °C till processed further (Table 2).

2.2. R.N.A Extraction and cDNA Synthesis

Total R.N.A. extraction was performed according to the manufacturer’s instructions using a commercial R.N.A. extraction kit (Ambien Pure Link R.N.A. Mini Kit), from swabs and tissue samples. Reagent contamination was detected using a negative control. A 50 μL addition of nuclease-free water was used to elute the extracted R.N.A., which was then stored at −70 °C. A Nano Drop was used to quantify the R.N.A. (Thermo Scientific, Wilmington, DE, U.S.A.). Then, Thermo-Scientific® Revert Ad First Strand cDNA was produced [22].

2.3. Reverse Transcriptase Polymerase Reaction(RT-PCR)

The GenBank (https://www.ncbi.nlm.nih.gov/tools/primer-blast), was accessed on 15th March, 2018). The CLUSTALX multiple-sequence alignment [23,24,25] identified a highly conserved region within the N- gene, at nucleotides (240–657). These primers were NP-F (forward: 5′-AGTCACCCGGACAACTGATA-3′) and NP-R (reverse: 5′-CTTCTGCAATTCTGTTGCGG-3′), and used as the nested primers [35]. The primer sets NP3/NP4 by Couacy-Hymann and colleagues [18] were utilized in the initial reverse transcriptase polymerase chain reaction RT-PCR test. The weakly positive PCR amplicons, served as the template for the nested PCR, which was performed with the primers pair NP-F and NP-R [7,35].
A total of 20 μL reaction contained 4 μL of 5× PCR buffer, 10 mM dNTPs 0.8 μL, NP3-F (10 pmol/µL) 1.0 μL, and NP3-R (10 pmol/µL) 1.0 μL, 2 μL MgCl2, 1.5 μL template cDNA, 0.5 μL Taq polymerase, and nuclease-free water, used in variable amounts. The RT-PCR cycle conditions were an initial denaturation phase at 94 °C for 10 min, 35 cycles of denaturation at 95 °C for 15 seconds, annealing at 59 °C for 1 minute, extension at 72 °C for 1 min, a final extension at 72 °C for 10 min, and termination at 4 °C. All of the tests were run at least twice.

2.4. Virus Recovery and Propagation

The swabs and tissue samples were processed following the standard procedures [26] and inoculum was prepared for PPR virus recovery. Briefly, sub-cultures were performed using pre-cultured Vero cells (ATCC-USA). Prior to inoculating the Vero cell line, the medium was decanted and inoculum was dispensed (1 mL) after filtering through 0.2 um syringe filters (Millipore). Vero cells (ATCC, USA) were grown in Dulbecco Minimum Essential Medium (DMEM) containing 10% foetal bovine serum (FBS) and 2% pen-strep antibiotics (Corning, USA) [26]. Confluent monolayers of Vero cells were infected with previously processed and filtered tissue and swab samples. These were then incubated at 37°C for two hours prior to being washed with PBS and supplemented with DMEM (maintenance media). The infected Vero cells were maintained at 37 °C for seven days and evaluated daily for any cytopathic effects (C.P.E.). The specimen was regarded as negative when the CPE were not observed after three blind passages. The PPRV isolate were confirmed by on the basis of specific CPE and by using ‘N’ gene based RT-PCR.

2.5. Sequencing and sequence data Analysis of selected isolates

The sequencing was conducted and sequence data analyzed was conducted following standard procedures [23,26]. The BLAST tool from the NCBI database was used to search for sequenced data for gene fragments of PPRV. Sequence alignment was carried out using CLUSTALX software. In addition, sequenced data of Pakistani isolates were compared with other related sequences retrieved from the Gene Bank. The variations among N-gene sequences, the phylogenetic tree (analysis) of PPR isolates used in the current study was constructed using the neighbor-joining technique in Mega-X (10.2.2). Given the expected similar genetic patterns, only three representative samples were randomly selected for sequencing (one from each sample collection area).

2.6. Development of Indirect ELISA (IELISA)

The indirect ELISA was optimized and antigen was prepared by using PPRV local strain recovered during this study(ABP3/PPRV/Islamabad/Pak/2020), as described by [27]. Vero cell cultures infected with this virus isolate (ABP3) and exhibiting >80% C.P.E. The cells were subjected to subsequent freezing (−80 °C) & thawing (37 °C) thrice and supernatant was collected. The cell debris were cleared by 15 minutes of centrifugation at 1500 g. The supernatant was precipitated with PEG 6000 at 8% (w/v) in sodium chloride at 2.3% (w/v). Following overnight incubation at 4 °C, the mixture was centrifuged at 8500 g for 30 minutes. A tenth of the original volume of T.N.E. buffer (10 mmol/L Tris, 150 mmol/L NaCl, 1 mmol/L EDTA at pH 7.4) was used to dissolve the pellet. This partially purified antigen was stored at −80 °C until use [27]. The concentration of the antigen was determined using Bio Spec-Nano spectrophotometers (Shimadzu) and TCID50 quantification [28]. The antigen was later used for analyzing the test sera
Modified ELISA was standardized using a partially purified attenuated PPR virus as the coating antigen [21]. A 96-well flat-bottom ELISA plate (NUNC Maxisorp, Hamburg, Germany) was coated with 100 ul of PPRV virus antigen at an optimal 1:10 dilution (104.8 TCID50/mL/mL) in carbonate–bicarbonate buffer (pH 9.6) and incubated overnight at 4 °C in a humid environment under constant orbital shaking conditions. Unbound antigen was removed by washing plates three times with washing buffer, PBS-T (PBS containing 0.05% Tween-20) at pH 8.0. Every well received 100 μL of blocking buffer (PBS-T containing 5% Bovine serum albumin) to block the remaining sites in each well. After two hours at 37 °C, the plates were washed three times with PBS-T washing buffer.
Each serum sample was diluted individually (1:50) in blocking buffer. The diluted test sample was added in 100 μL volume to individual wells in duplicates, including goat-produced positive antiserum (V.N.T. titer < 1:164) and a negative serum (V.N.T. titer < 1:2) from one of our previous study (unpublished data). These positive and negative controls were implemented as previously described by Balamurugan and colleagues [21]. This was followed by 2 hours of humid incubation conditions at 37 °C. Anti-goat IgG HRPO-conjugated horseradish peroxidase (Abcam, Cambridge, UK), diluted in blocking buffer (1:1000), was added and incubated for 1 h at 37 °C [29,30].
Substrate solution (100 μL tetramethyl benzidine substrate (TMB) (Cambridge, UK)) was added to each well, followed by 15 minutes of dark, room-temperature incubation conditions. The reaction was terminated with 100 μL of 1 M H2SO4 added to each well. ELISA readers measured the absorbance values (OD) at a wavelength of 450 nm. The mean sample/positive ratio (S/P) was calculated using OD values obtained from each tested sample. The results are expressed as a P.P. (percent positivity) ratio, which is calculated according to the formula below:
Negative control (NCx) = Mean of Negative Control
Positive control (PCx) = Mean of Positive Control
S P r a d i o = S a m p l e   O D N C x 2
P P   v a l u e = S a m p l e   O D × 100 M e a n   O D   o f   P o s i t i v e   C o n t r o l   ( P C x )
where O.D. is the optical density; P.P. values greater than 50% were considered positive samples.

2.8. Initial Validation and Data Analysis of both Diagnostic Assays

The validation was carried out as described by [28]. The checkerboard titration was used to optimize the working dilution of antigens and antibodies. As previously described [28], the antigen and serum dilutions that presented the maximum difference between positive and negative absorbance values at 450 nm (P/N) were carefully selected for the investigation of the serum samples. cELISA and IELISA assays were validated using positive sera (V.N.T. titer < 1:164) collected from PPRV-vaccinated animals and negative sera (V.N.T. titer < 1:2) from healthy animals. Two-fold successive dilutions of anti-PPRV antibodies from positive and negative serum samples starting from a 1:2 dilutions were tested to determine the highest detectable serum dilution values in both samples via IELISA and cELISA assays. According to the manufacturer’s instructions, for the cELISA kit, cutoff values of 50 and 60 percent were used for the cELISA kit. In contrast, a cutoff value of 50% positivity was used for the IELISA kit.
The data were analyzed using a two-way contingency table using the statistical package Graph Pad Prism 5.01 [30]. Specificity and sensitivity values were determined for both I-ELISA and c-ELISA assays using the previously mentioned statistical formula [31] to perform a statistical analysis to compare the results. The notations presented above are explained as follows:
a = true positive (T.P.), b = false positive (F.P.), c = false negative (F.N.), d = true negative (T.N.)
The following equations were used to estimate the sensitivity and specificity values of the assays, referring to statistical analysis. [31]:
S e n s i t i v i t y   ( % ) = a / a + c × 100  
S p e c i f i c i t y   ( % ) = d / d + b × 100  

2.9. Commercial ELISA (c-ELISA) Test

PPRV antibodies were detected using a commercial c-ELISA test (ID Vet® for PPR). The manipulation of the c-ELISA test was based on the manufacturer’s instructions. The ELISA microplate was read using an ELISA reader with a 450 nm filter (Bio-Rad, IMarkTM, Microplate reader) [32].

2.10. Virus Neutralization Test (V.N.T.)

The ability of anti-PPV antibodies to neutralize the virus was tested in Vero cells in the manner described in a previous study [27]. Briefly, the serum samples were individually incubated with 100 TCID50 of PPRV viruses in two-fold dilutions. They were incubated at 4 °C for 24 hours prior to being poured onto the Vero cells to determine the virus infectivity rate in duplicate. These cells were then monitored daily to assess their specific cytopathic effects. Final readings were calculated on the seventh post-infection day.

2.11. Ethical considerations

Approval to conduct the study was received from the National Agriculture Research Center (NARC) from the Institutional Biosafety Committee (I.B.C. reference No.: NIGAB/NARC/02/05-01-2021).

3. Results

3.1. Specimen Collection

Detailed necropsy was conducted on 4 goats and two sheep during 2020-2021. Details of these samples can be seen in Table 3.

3.2. Molecular detection of PPRV based on N-genes by RT-PCR
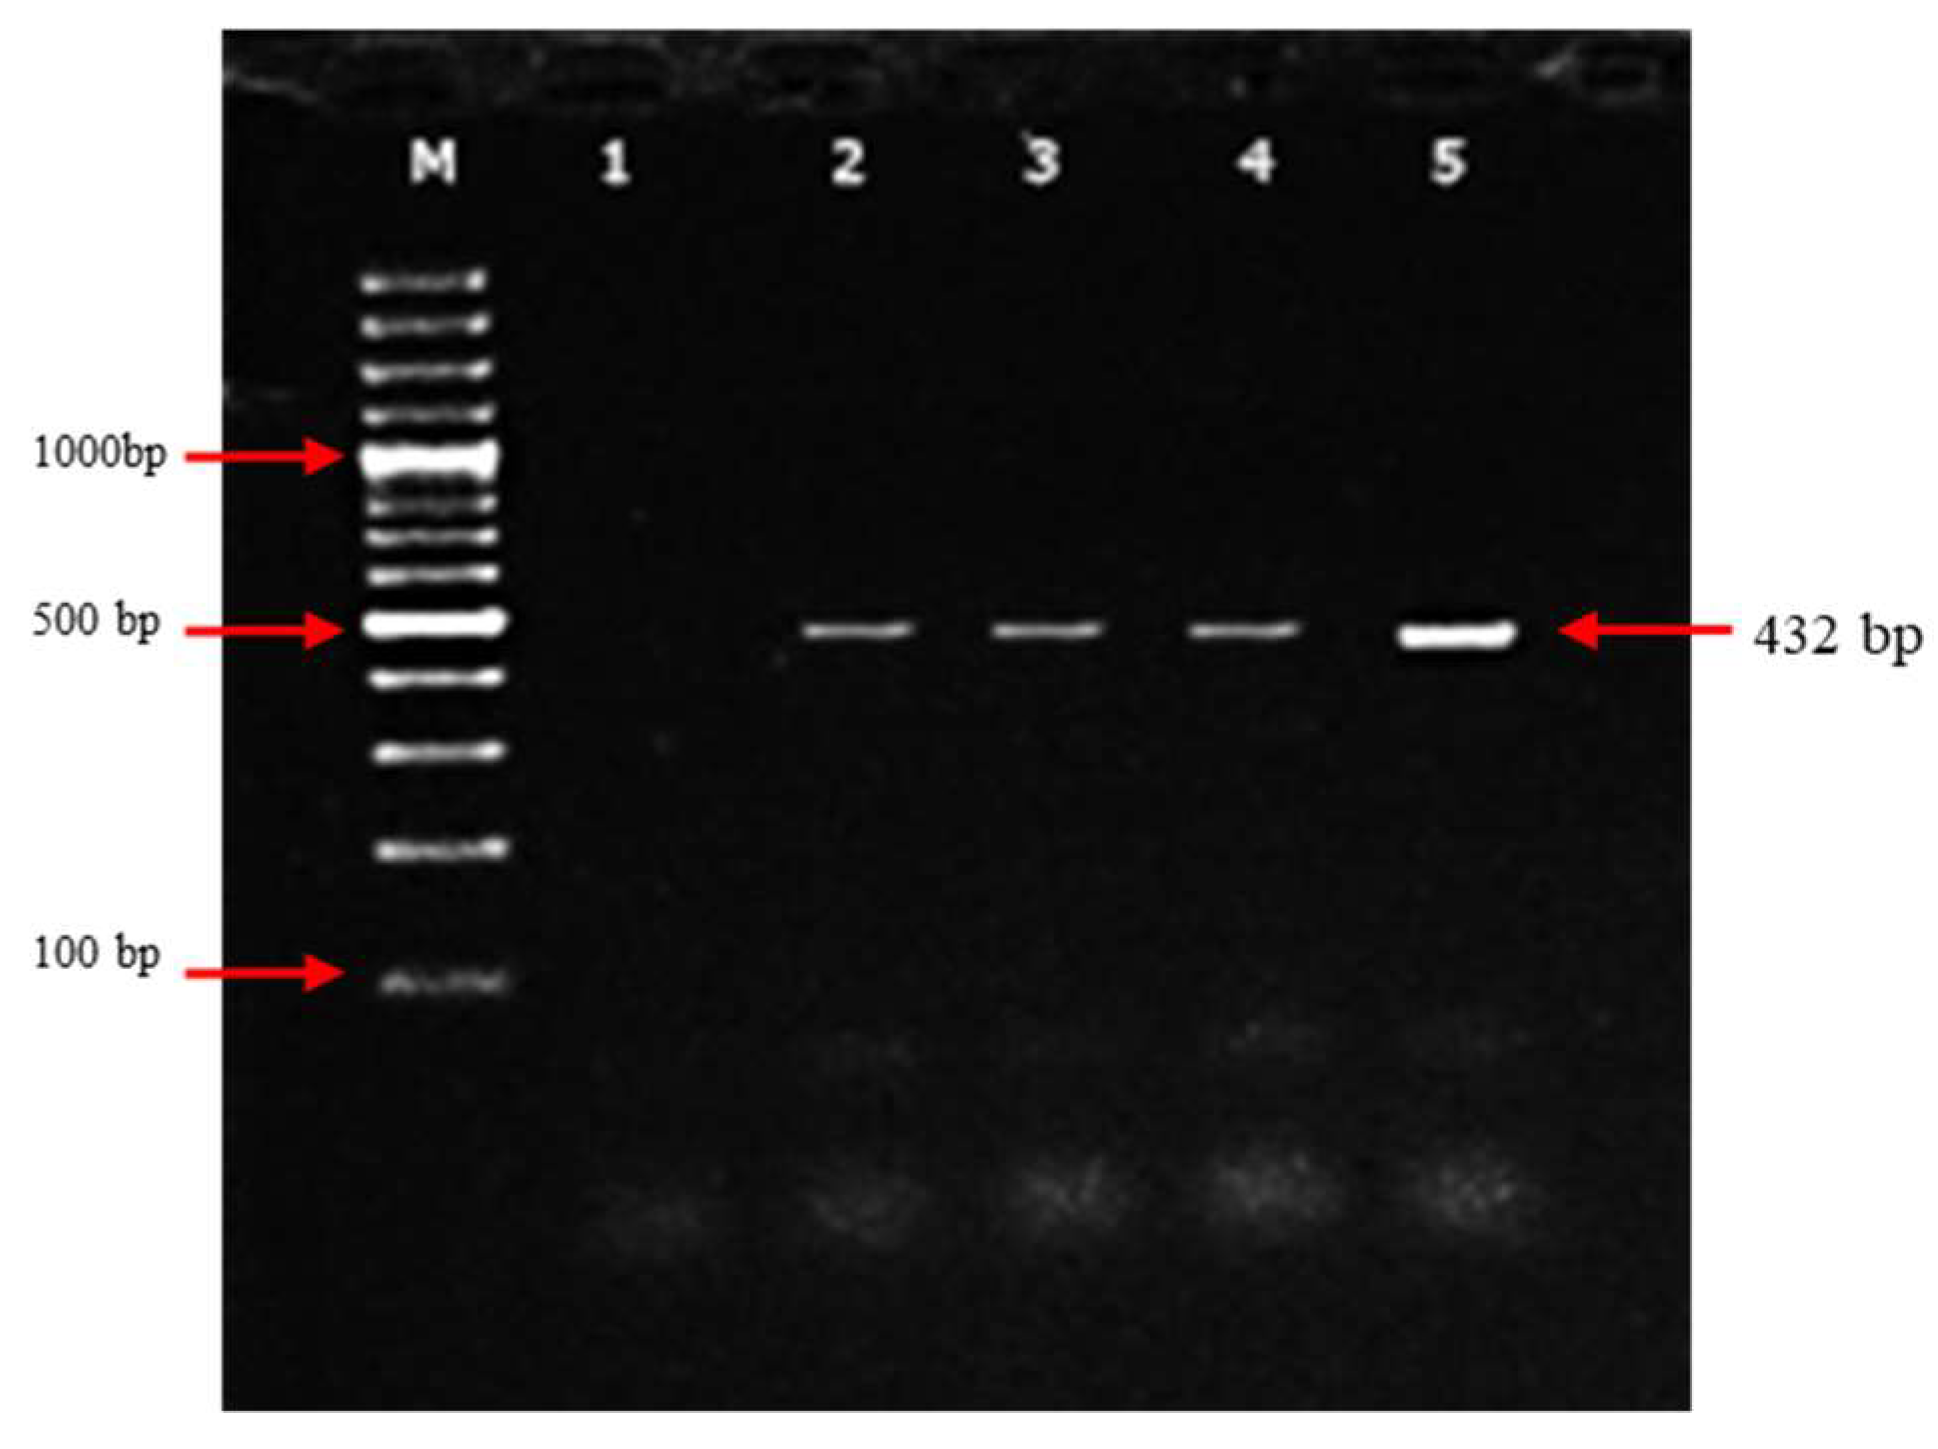
The collected samples were examined for the presence of PPRV, using the reverse transcription-polymerase chain reaction (RT-PCR) assay. Out of 25 clinical samples (swabs and tissues), only four samples were positive for PPRV when N-gene primer amplification was used with a positive rate of 16%, while the remaining 21 samples remained negative, as shown in Table 2. Nucleic acid sequences obtained from PCR products based on the N-gene were aligned with the sequence data obtained from PPRV strains presented in GenBank, which provided further confirmation of these results. However, due to the expected similarity of the genetic pattern, only three representative samples were sent for sequence analysis.
Figure 3. Nested-PCR products from the first round of PCR using the NP3/NP4 primer pair. Second round of Nested PCR using NP3-F and NP3-R primers. Lane M: 1000 bp D.N.A. ladder (Thermo Scientific); lane 1: negative control; lanes 2–4: nested PCR of swab samples obtained from clinically affected animals; lane 5: nested PCR product of PPRV-positive control.
Preprints 83108 g003

3.3. Phylogenetic Analysis of Indigenous Peste des Petits Ruminants Isolates

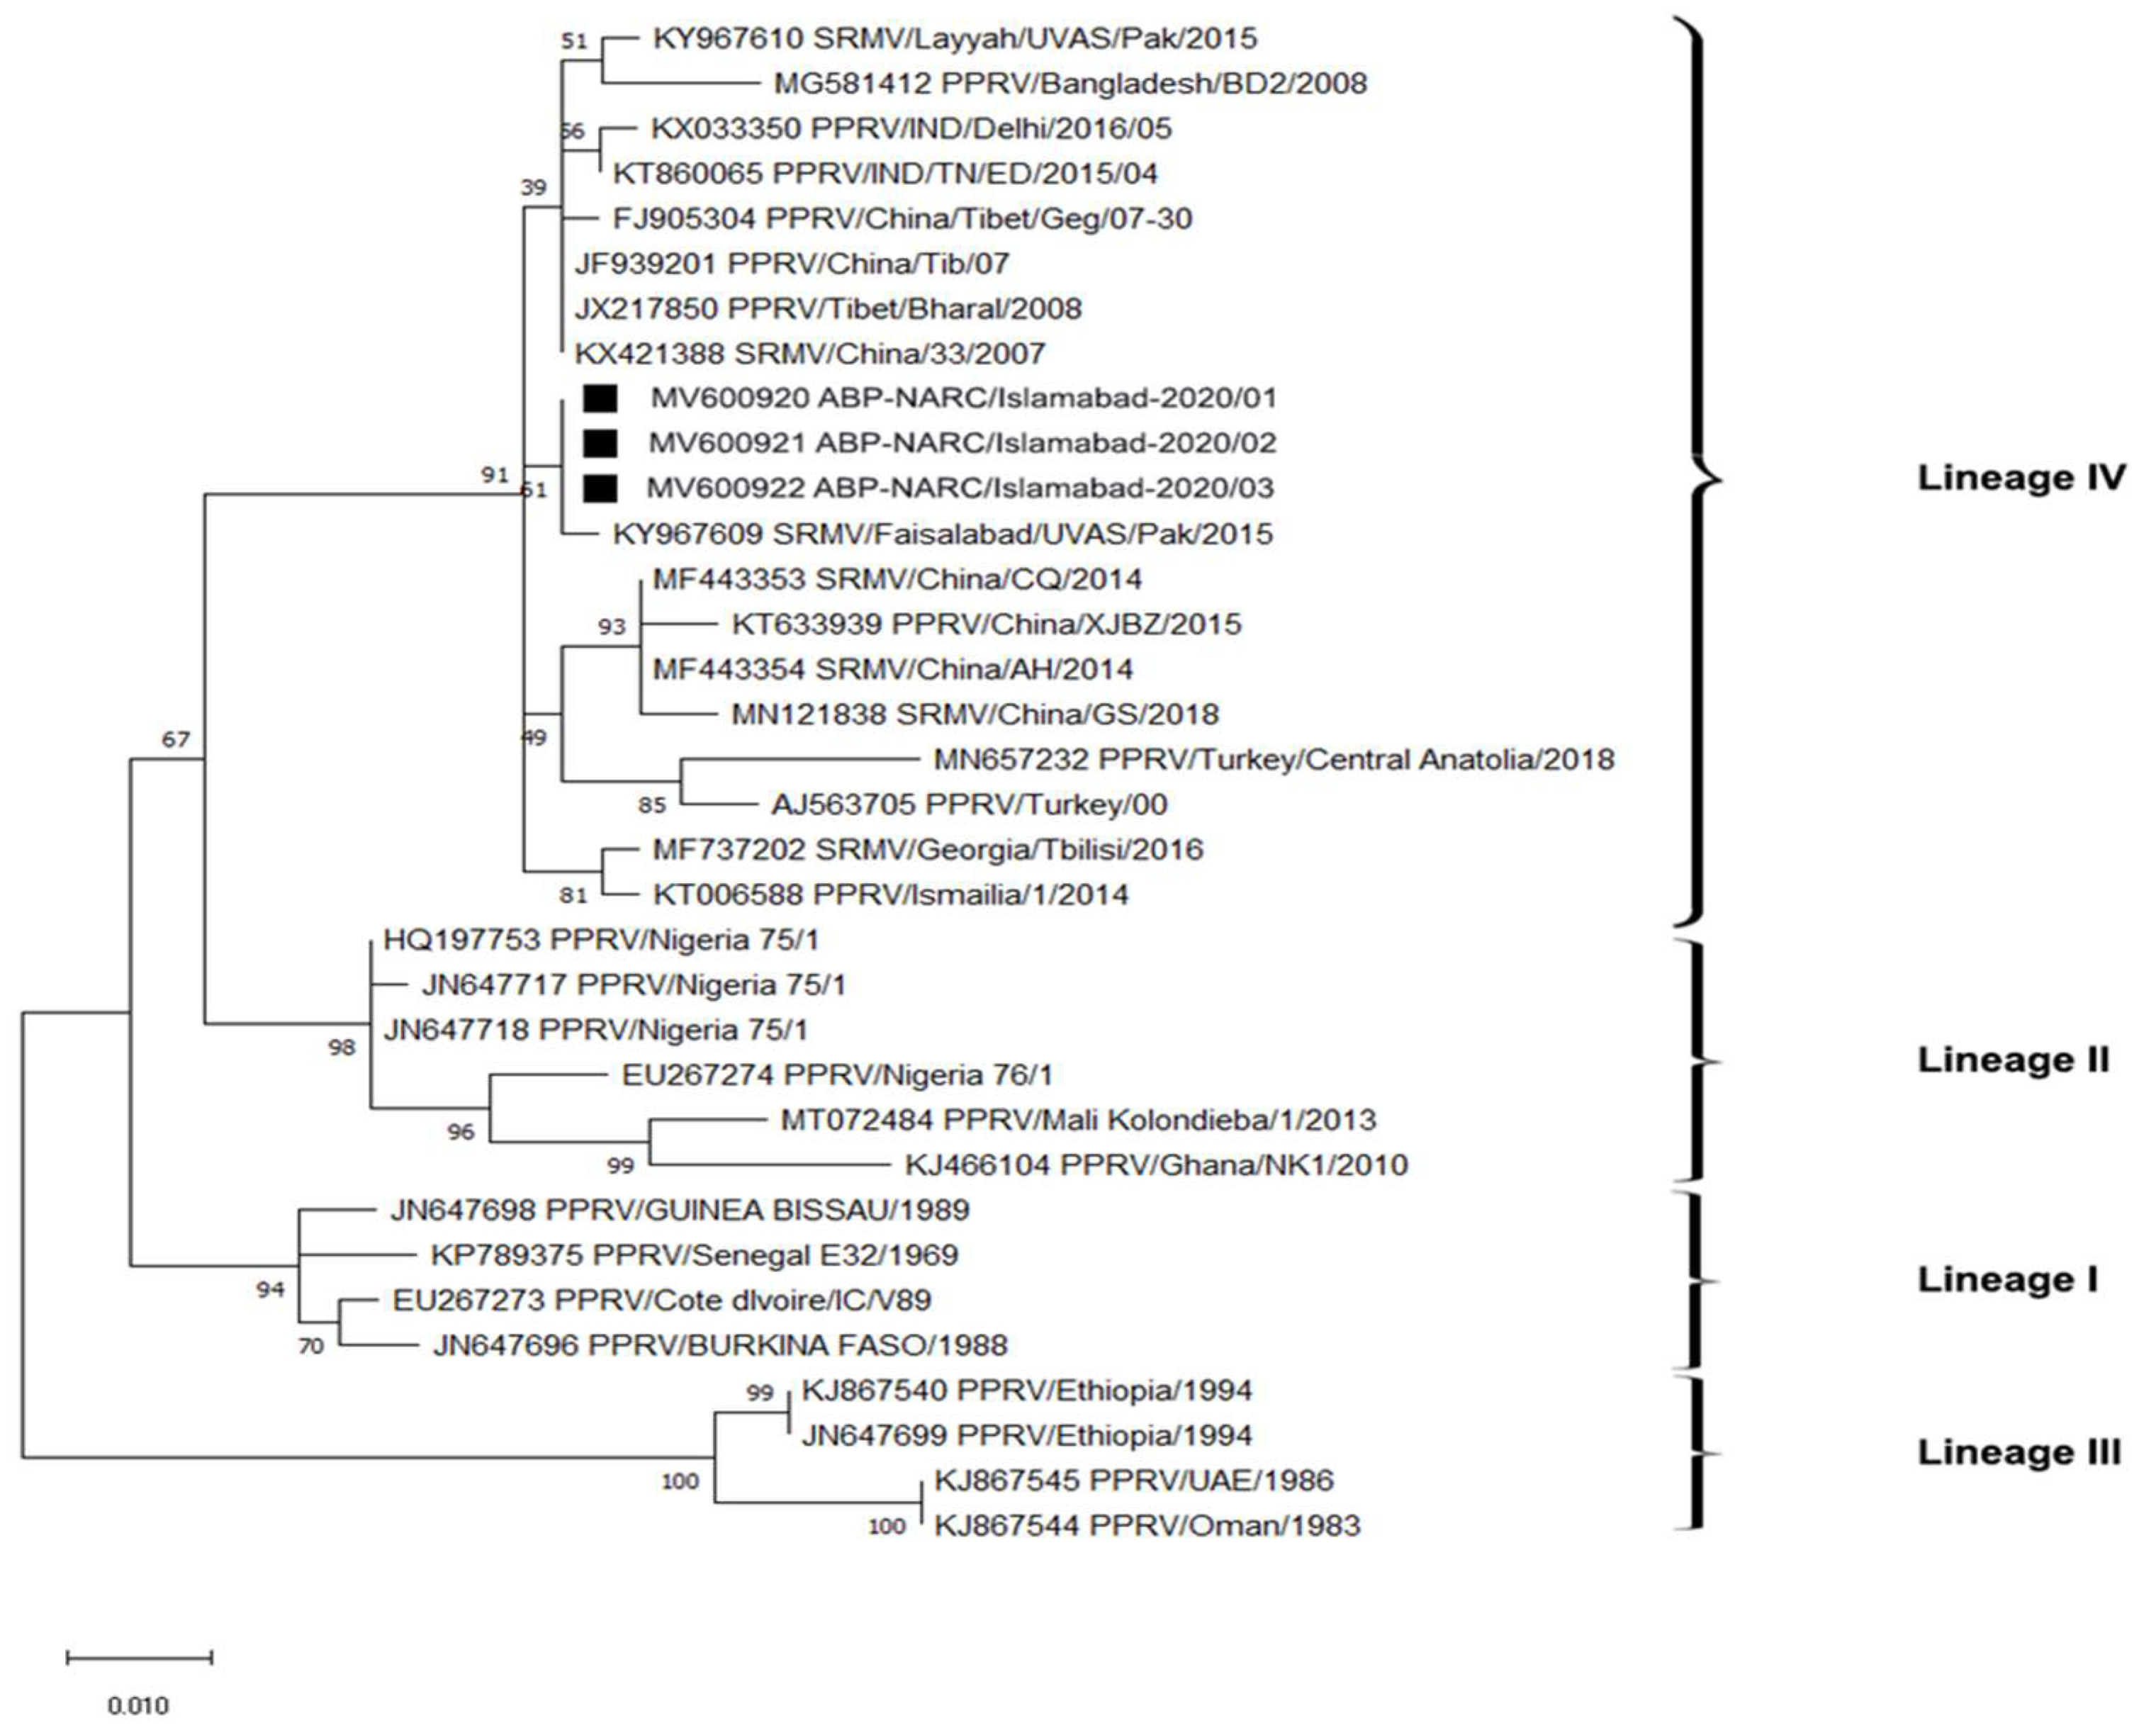
It was found that Pakistani isolates clustered under Lineage IV for N- gene of PPRV and have a close relationship with other recent isolates from China, India, Bangladesh and Turkey. The neighbor-joining technique in Mega (10.2.2) was used to construct the phylogenetic tree (Figure 4) using the Kimura two-parameter model. All the obtained sequences were deposited in GenBank and allocated accession numbers (MW600920, MW600921, and MW600922). The hypervariable region of the N-gene was conserved in Pakistani PPRV strains collected from Gilgit, Islamabad, and Fateh Jang. Lineage differentiation determined mainly by N gene, helps understanding the world wide movement of PPR viruses. In the present study, based on the partial N-gene sequencing method, virus strains obtained from Pakistan, China, India, Bangladesh, and Turkey were grouped under lineage IV. The phylogeny of isolates is presented in Figure 4.

3.4. PPRV Recovery and propagation:

A total three isolates were obtained on the Vero cells. These were identified on the basis of specific CPE including cell rounding, clumping, vacuolation, multinucleated giant cells (syncytia) and detachment from the surface, which manifested 14 days’ post-infection. The details of the isolates are presented Table 4 and CPE are presented in Figure 5. Here the mock (control) flasks did not develop any C.P.E.s as shown in Figure 5. The virus isolates presented in the current study were freeze–thawed, centrifuged, and stored at -80 °C until use.
Table 4. Isolation and propagation of PPR virus on Vero cells depicting C.P.E. for three PPRV isolates.
Isolate names Different cytopathic effects on cells
>Cell rounding >Clumping of cells >Syncytia formation >Detachment from surface >Cells with elongated processes >Vacuolation
ABP-NARC/Islamabad-2020/01 (Gilgit) + + _ + + _
ABP-NARC/Islamabad-2020/02 (Fateh Jang) + _ + + _ +
ABP-NARC/Islamabad-2020/03 (Islamabad) + + + + _ _
Figure 5. Micrograph showing cytopathic effects of PPRV in Vero cells after 14 days: (a) clumping of cells; (b) rounding of cells; (c) mock (negative control) showing no change in morphology of monolayer.
Preprints 83108 g005

3.6. Antigen preparation and development of I-ELISA

A Nano Drop spectrophotometer quantified the antigen as 1.92 OD, whereas the nucleic acid concentration was 455.12 (ng/µL), confirmed through TCID50, and presented 104.8 TCID50/mL.
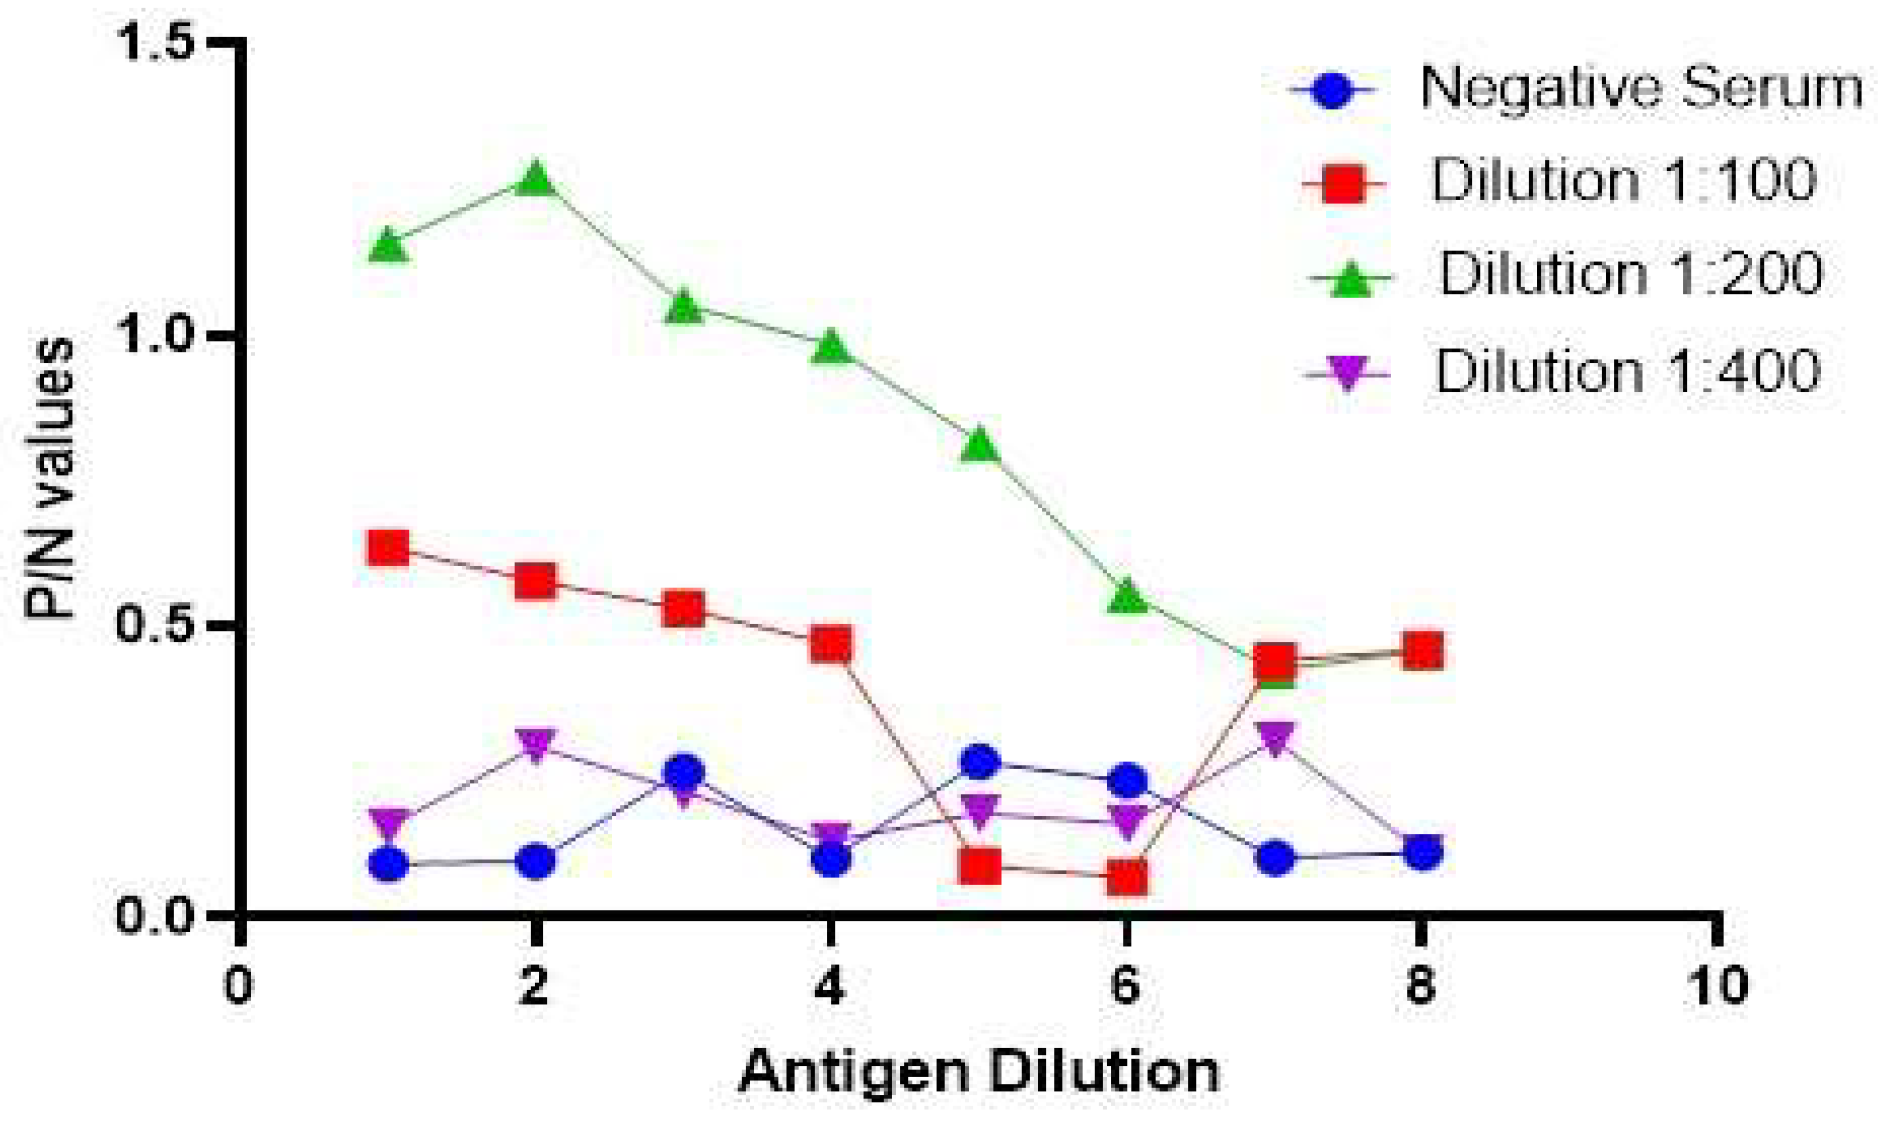
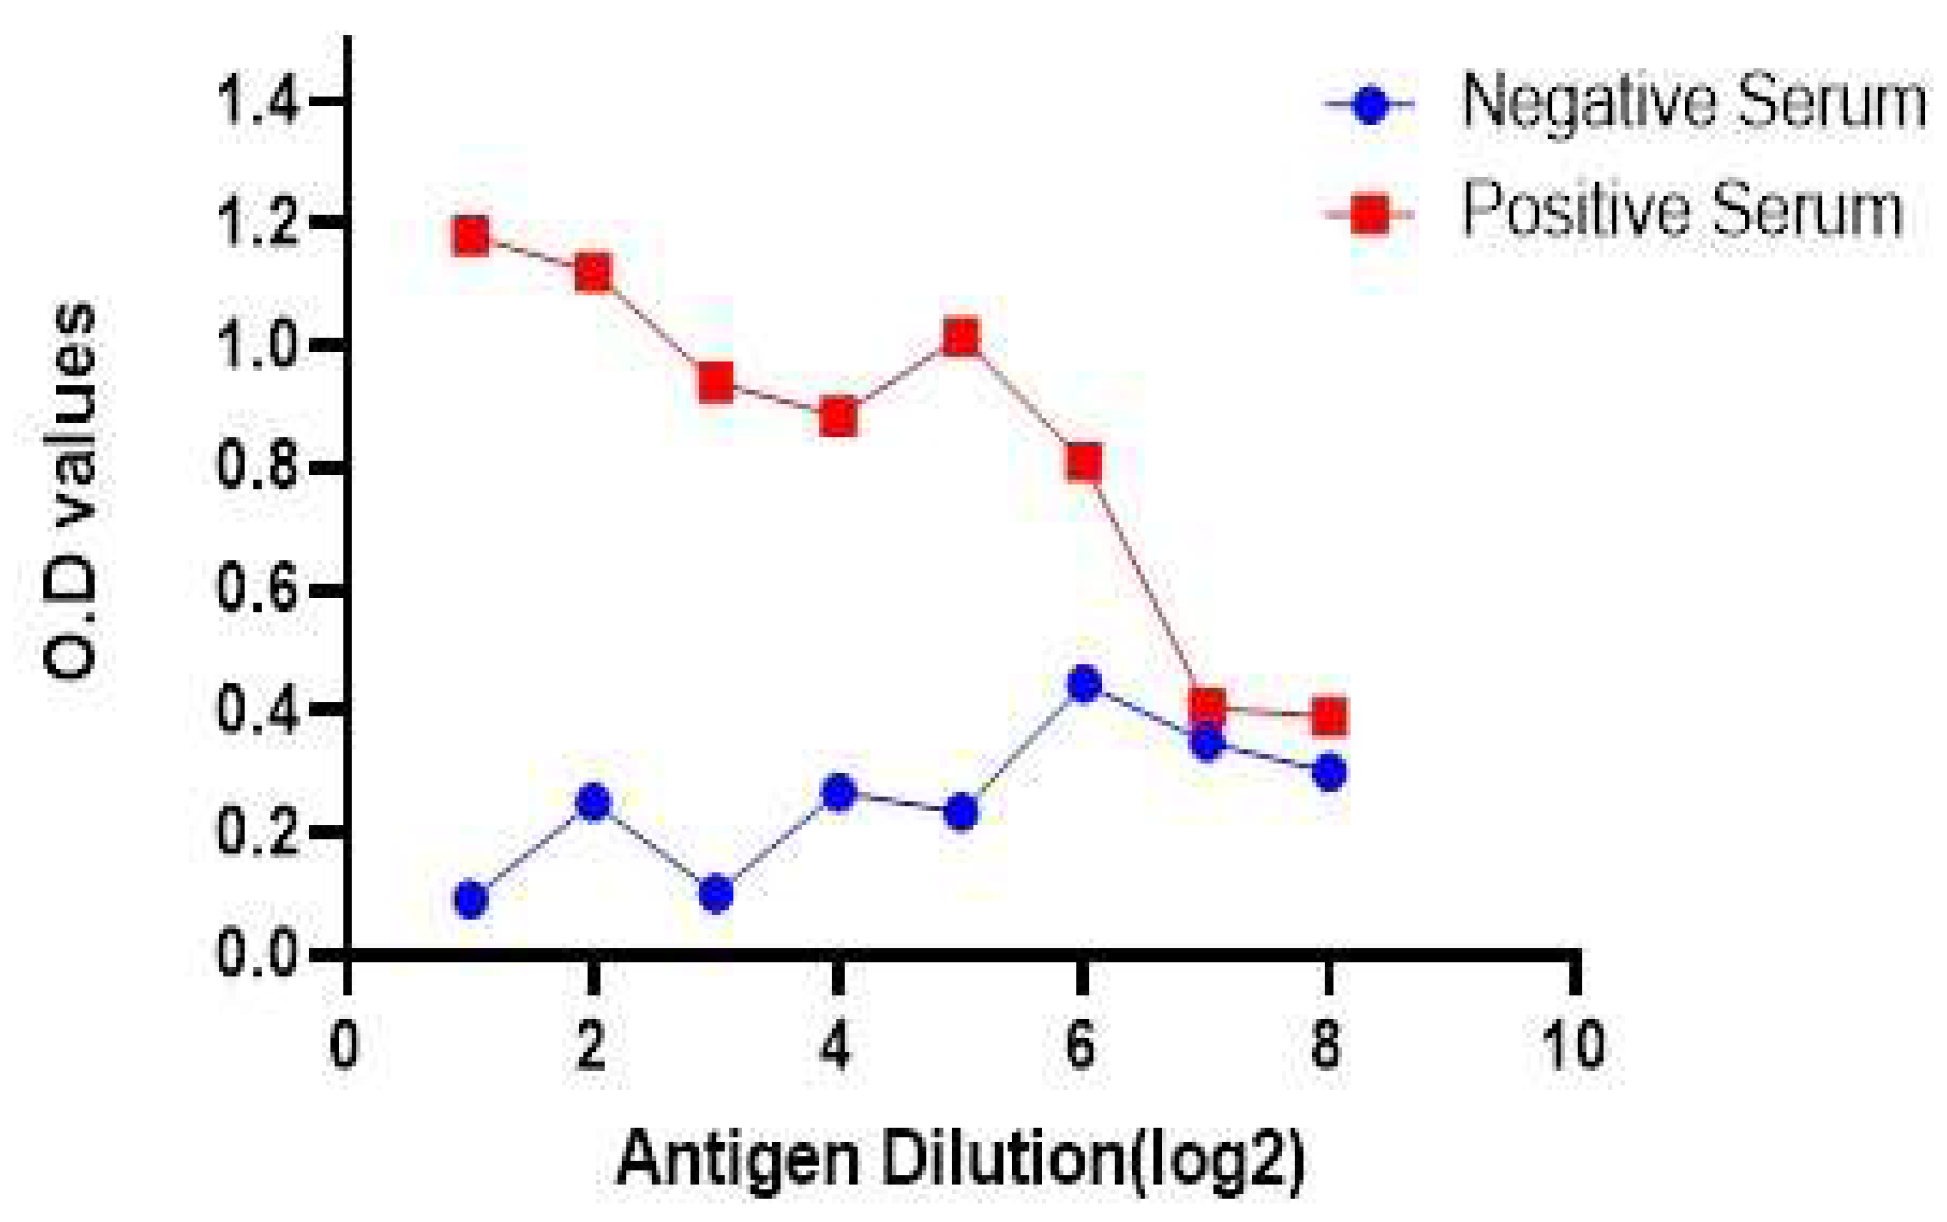
It was necessary to titrate the test serum across two-fold dilutions prior to selecting one dilution to utilize in the assay. Titrating a series of antigen dilutions against varying dilutions of positive serum (V.N.T titer > 164) yielded the optimal antigen dilution amount. Figure 6: shows that the maximum O.D. result was obtained at the optimal working dilution of the antigen, and the antibody breakdown was 1:200 serum and 1:32 antigen, after which the O.D. decreased along with the antigen concentration. The O.D. values measured presented a titration curve for the known positive and negative sera we observed. In this study, we determined that the highest dilution rate of positive serum produced the maximum O.D. For the negative serum at the same dilution rate, the O.D. value served as optimal antigen and antibody working solutions in the ELISA assay (Figure 7).

3.7. Relative Specificity and Sensitivity of the Developed Assay

In the current study, using a two-way contingency table, the performance of the IELISA test, in terms of relative sensitivity and specificity, was compared to that of the cELISA and V.N.T methods. A total of 325 serum samples were used to validate the IELISA, cELISA, and V.N.T. methods. Out of the 176 serum samples that were tested, 150 were observed to be positive via indirect IELISA and compared very well with cELISA, with a high level of specificity at 85.23% (150/176 = 0.8523) and sensitivity at 90.60% (135/149 = 0.9060). In comparison to a commercial kit, the specificity value was 91.43% (150/164 = 0.9143) and the sensitivity value was recorded as 84.00% (135/161 = 0.840), as shown in Table 5. Moreover, the specificity and sensitivity values obtained for IELISA were 100% and 82.14%, respectively, compared to V.N.T. (Table 6).

4. Discussion

PPRV is the is the greatest obstacle to small ruminant productivity in endemic nations. Unchecked trade or illegal migration across borders can spread the disease to non-endemic regions. Due to how the disease affects the economy, its control and eradication are crucial. The F.A.O. and O.I.E. have agreed on a global action plan for the complete eradication of the disease by 2030 worldwide [15,33], which is the most effective method to control the severity of this disease, which causes considerable economic losses [34].
Morbilliviruses are known for their high degree of genetic divergence. As PPRV has been prevailing in Pakistan since 1995 [12]. The genetic viability of PPRV can lead to changes in the viral genome, that affect the target regions, recognized by primers used in RT-PCR assays. There are four distinct genetic lineages of PPRV (I, II, III and IV) circulating globally but in Asia only lineage IV is circulating. A previous study [35] reported that PPR virus primer sets used for PPRV identification vary in sensitivity and specificity, and suggested that new primer sets might be required to assess the virus’s genetic diversity. Another study conducted by Nafea and colleagues in 2019 [7] suggested the need for DIVA diagnostic tests and markers to distinguish between field wild-type and vaccine PPRV strains, since no DIVA tests are available in the research for PPRV detection purposes.
Two types of live-attenuated PPR vaccines provide lifelong immunity. The Nigeria/75/1 vaccine (lineage II) is used worldwide, while India used Sungri/96 (lineage IV). Despite progress, made in controlling the disease, the virus is often reported in new territories. Most outbreaks in the developing world go unreported and uninvestigated. It is well-established in the literature that the Nigeria/75/1 vaccination strain’s sequence served as the basis for the initial design of the NP3/NP4 primer combination [18]. The ability of the PPRVs to adapt to new hosts and change the set of outbreak patterns is influenced by genetic variability as well as climate change. This has resulted in the creation of new viral strains that the existing primer sets might not detect. Also the transportation of clinical materials from the field to the testing laboratory under un appropriate conditions is critical to the outcome of test results, as viral antigen/RNA can deteriorate during the transportation process, making diagnosis difficult.
In developing countries, particularly in Africa and Asia, nearly every national laboratory has the capability to conduct reverse transcriptase polymerase chain reaction (RT-PCR). One of the advantages of RT-PCR is that it can detect the PPR virus in both clinical and subclinical infections. This makes it an important tool for the early detection and management of future outbreaks. It is worth noting that, in addition to being highly conserved, the nuclear capsid (N-protein) is also highly immunogenic [36,37]. The molecular characterization of circulating strains through phylogenetic analysis utilizing the N-gene is the most reliable method for determining the lineage genetics of novel strains [37,38]. This resource is vital for monitoring outbreaks in both PPRV-prone and endemic countries. Such information is helpful for estimating the risks in a herd and determining where and when PPRV spreads, because it exhibits the activity of different strains For the accurate detection of these different strains, new sets of primers that target the evolving regions of the viral genome may be required [35]. The aim of the current study was to successfully characterize indigenous PPR virus isolates During the period 2020–2021, outbreak samples were collected from three designated areas and characterized using RT-PCR followed by N-gene-based analyses.
Nucleotide sequencing and phylogenetic analyses revealed that the PPRV isolates obtained during the period 2020–2021 from Pakistan, were clustered genetically within lineage-IV viruses. The phylogeny of N-gene revealed genetic diversity among PPRV isolates from other regions (FIG:4). Some degree of divergence also existed within the circulating isolates in Pakistan. The current Pakistani isolates show somewhat divergence from earlier Pakistani isolate. This N-gene-based analysis provides a better understanding of PPRV genetic characterization of circulating PPRV isolates.
Pakistani isolates are also segregated into two distinct sub clusters (FIG:4) The isolate KY967610 SRMV/Layyah/UVAS/Pak/2015 can be noticed, distinct from other Pakistani isolates and clustered with an isolate from Bangladesh. It is also evident from phylogenetic tree that PPRV isolates from current study, formed a distinct closely related sub cluster with a previous isolate, KY967609 SRMV/Faisalabad/UVAS/Pak/2015 from Pakistan. These findings would indicate that the N gene of Pakistan is under an evolutionary process [41]. However, isolates from Turkey formed a separate branch under lineage IV [41]. Similar findings were reported in several previous studies [6,36,39]. The three sequenced isolates, from current study, were submitted in GenBank and have allocated accession numbers (MW600920, MW600921, and MW600922). These findings warrant additional molecular epidemiological research.
From our current investigation, one of the characterized indigenous PPRV virus isolates, having GenBank allocated accession number MW600922, was used as a coating antigen to develop an in-house -IELISA assay. We also compared the sensitivity and specificity factors of indirect IELISA and cELISA using a two-way contingency table.
Indirect IELISA, which performed much better than cELISA, presented 150 positives out of 176 serum samples (Table 4). The 90.60% sensitivity and 85.23% specificity (Table 4) rates are consistent with the results presented by Hosny and colleagues in their study [8]. With IELISA, a large number of serum samples can be rapidly and affordably tested. Furthermore, duplicate serum samples (including positive and negative standards) were simultaneously added to three plates. No significant variation was observed in these plates. To assess the diagnostic efficacy of the IELISA assay, 325 serum samples were tested in parallel with the commercially available kit. The efficacy of IELISA was compared with a commercial kit employing all 325 serum samples. In seroepidemiological studies of PPR virus antibodies obtained from sheep and goats, it was determined that IELISA is superior to cELISA [21]. The indirect IELISA described in this study was superior to cELISA for the seroepidemiological study of PPR virus antibodies in small ruminants. Maximum three consecutive blind passages on Vero cells were required to successfully isolate PPRV from field tissue samples; the virus was then identified by its characteristic cytopathic effects (CPE) (O.I.E., 2013) [33]. According to Hosny and colleagues (2021) [8], the PPRV virus is presently spreading to new hosts. Recently, camel deaths occurred in Sudan from a fatal respiratory disease that was traced back to PPRV; however, sheep and goats are the most common hosts for PPRV.
When detecting antibodies or antigens, ELISA is one of the most reliable immunological diagnostic tools currently available. Our assay presented 100% specificity when comparing IELISA to V.N.T., and 82.14% sensitivity (Table 6). The results match those of [21], which observed 100% specificity and 80% sensitivity values. The developed IELISA is a highly sensitive and specific assay, and it is also very easy to use. As shown in the contingency table (Table 5), it is equally effective at detecting positive and negative samples, making it a viable alternative to an expensive commercial kit for seroepidemiological studies of large numbers of samples in the field.
Pakistan’s economy has been affected following the U.S. dollar exchange rate change. An increase of 1% in the exchange rate will cause an increase of almost 70% in the inflation rates as well, it can cause an increase of 68% in annual imports of Pakistan. Our findings show that IELISA is far more cost-effective than expensive commercial cELISA. The costs of the commercial cELISA kit reagents and IELISA assay developed in this study were compared for 92 samples (two tests/each were considered as positive and negative standards). The cost of the 92 samples we obtained was USD 7.81 (USD 0.21 × 92 reactions). For 92 reactions, commercially available cELISA kits cost USD 700–1100. Therefore, IELISA was significantly less expensive than the commercially available kit.
Therefore, IELISA could be a more cost-effective method in the long-term, if the relevant laboratory has a stable supply of reagents. Several factors were considered when comparing the cost of developed IELISA and commercially available cELISA kit for PPRV virus. Reagents, labor, time, and test accuracy were main factors. Depending on reagent availability, in-house IELISA may be cheaper, over time. Nevertheless, the choice between using IELISA and a commercial cELISA kit may entirely depend on the laboratory’s specific requirements and available resources.

5. Conclusions

The current study’s successful molecular diagnosis and virus isolation confirm the endemic distribution of PPRV in sheep and goat populations in three reported areas. The partial N-gene analysis provided a clearer image of lineage-IV PPRV isolates. The isolates of Turkey, formed a separate branch under lineage IV. Commercial ELISA kits are more expensive than IELISA. For any seroepidemiological survey, a large number of PPRV serum samples can be rapidly and affordably analyzed. A vigilant monitoring strategy can be established with two highly accurate, rapid, and cost-effective diagnostic tools: RT-PCR and IELISA. Both assays have the ability to identify the hotspots of PPRV persistence in Pakistan. In the next phase of the research, we will evaluate unusual hosts, such as camels, cattle, and deer, for PPRV diagnoses.

Author Contributions

Conceptualization, Tahira Rana; Data curation, Amir-bin- Zahoor; Formal analysis, Amman Ullah; Funding acquisition, Ghulam Ali; Methodology, Tahira Rana and Murtaza Andrabi; Resources, Amman Ullah and Ghulam Ali; Supervision, Saeed-Ul-Hassan Khan; Visualization, Fariha Hassan; Writing—original draft, Tahira Rana; Writing—review & editing, Saeed-Ul-Hassan Khan, Fariha Hassan and Amir-bin- Zahoor.

Funding

This research was funded by the Agricultural Linkages Programme (A.L.P.) AS-029: Pakistan Agricultural Research Center (PARC), Pakistan.

Data Availability Statement

Supplementary data files are attached to the manuscript.

Acknowledgments

The authors are grateful to the cell culture laboratory at the National Institute of Genomics and Advanced Biotechnology (NIGAB), Islamabad.

Conflicts of Interest

The authors have no conflicts of interest.

References

  1. Van Regenmortel, M.H.; Fauquet, C.M.; Bishop, D.H.; Carstens, E.; Estes, M.; et al. Virus taxonomy: Classification and nomenclature of viruses. Seventh report of the International Committee on Taxonomy of Viruses; Academic Press, 2000. [Google Scholar]
  2. Radostits, O.M.; Gay, C.; Hinchcliff, K.W.; Constable, P.D. The Diseases Of Cattle, Horses, Sheep, Pigs, And Goats. Veterinary Medicine 2007, 10, 2045–2050. [Google Scholar]
  3. Lefèvre, P.C.; Diallo, A. Peste Des Petits Ruminants. 1990, 9, 935–941. [Google Scholar] [CrossRef] [PubMed]
  4. Banyard, A.C.; Parida, S.; Batten, C.; Oura, C.; Kwiatek, O.; Libeau, G. Global distribution of peste des petits ruminants virus and prospects for improved diagnosis and control. Journal of general virology 2010, 91, 2885–2897. [Google Scholar] [CrossRef]
  5. Rahman, A.U.; Dhama, K.; Ali, Q.; Hussain, I.; Oneeb, M.; Chaudhary, U.; Wensman, J.J.; Shabbir, M.Z. Peste des petits ruminants in large ruminants, camels, and unusual hosts. Veterinary Quarterly 2020, 40, 35–42. [Google Scholar] [CrossRef] [PubMed]
  6. Munir, M.; Zohari, S.; Saeed, A.; Khan, Q.; Abubakar, M.; LeBlanc, N.; et al. Detection and phylogenetic analysis of peste des petits ruminants virus isolated from outbreaks in Punjab, Pakistan. Transboundary and emerging diseases 2012, 59, 85–93. [Google Scholar] [CrossRef] [PubMed]
  7. Nafea, M.R.; Elbakry, M.; Shahein, M.; Farag, G.K.; Abdallah, F.; Ali, A.A.H. Virological and molecular studies on peste des petits ruminants virus (PPRV) in small ruminants and camels in Egypt between 2017 and 2018. Adv. Anim. Vet. Sci. 2019, 7, 12–18. [Google Scholar] [CrossRef]
  8. Hosny, W.; Baheeg, E.; Hassanein, S.; Mohamed, S. Preparation of a house ELISA kit for detecting Peste des petits ruminants Virus (PPRV) antibodies. BenhaVeterinary Medical Journal 2021, 41, 24–28. [Google Scholar] [CrossRef]
  9. Balamurugan, V.; Vinod, K.K.; Dheeraj, R.; Kurli, R.; Suresh, K.P.; Govindaraj, G.; Roy, P.J.V. Temporal and Spatial Epidemiological Analysis Of Peste Des Petits Ruminants. Outbreaks from The Past 25 Years In Sheep And Goats And Its Control In India. Viruses 2021, 13, 480. [Google Scholar] [CrossRef]
  10. Gargadennec, L.; Lalanne, A. La peste des petits ruminants. Bull. Serv. Zoo. AOF 1942, 5, 15–21. [Google Scholar]
  11. Taylor, W. The Distribution And Epidemiology Of Peste Des Petits Ruminants. Preventive Veterinary Medicine 1984, 2, 157–166. [Google Scholar] [CrossRef]
  12. Athar, M.; Muhammad, G.; Azim, F.; Shakoor, A. An Outbreak Of Peste Des Petits Ruminants-Like Disease Among Goats In Punjab (Pakistan). Pakistan Veterinary Journal 1995, 15, 140–140. [Google Scholar]
  13. Zahur, A.B.; Ullah, A.; Hussain, M.; Irshad, H.; Hameed, A.; Jahangir, M.; Farooq, M.S. Sero-Epidemiology Of Peste Des Petits Ruminants (PPR) In Pakistan. Preventive Veterinary Medicine 2011, 102, 87–92. [Google Scholar] [CrossRef]
  14. Balamurugan, V.; Vinod, K.K.; Dheeraj, R.; Kurli, R.; Suresh, K.P.; Govindaraj, G.; Roy, P.J.V. Temporal and Spatial Epidemiological Analysis Of Peste Des Petits Ruminants Outbreaks From The Past 25 Years In Sheep And Goats And Its Control In India. Viruses 2021, 13, 480. [Google Scholar] [CrossRef] [PubMed]
  15. Food and Agriculture Organization Of The United Nations. Peste Des Petitis Ruminant(Ppr)In Moroco. 2008. Available online: Https://Www.Fao.Org/Fileadmin/User_Upload/Newsroom/Docs/Aj120e00.Pdf.
  16. Kabir, A.; Mirani, A.H.; Kashif, J.; Manzoor, S.; Iqbal, A.; Khan, I.U.; Abubakar, M. Serological detection and confirmation of PPR among sheep and goats were kept under different production systems. Pakistan Journal of Zoology 2020, 52, 1137. [Google Scholar] [CrossRef]
  17. Abubakar, M.; Irfan, M.; Manzoor, S. Peste Des Petits Ruminants In Pakistan; Past, Present And Future Perspectives. Journal Of Animal Science And Technology 2015, 5, 1–8. [Google Scholar] [CrossRef]
  18. Couacy-Hymann, E.; Roger, F.; Hurard, C.; Guillou, J.P.; Libeau, G.; Diallo, A. Rapid and sensitive detection of peste des petits ruminants virus by a polymerase chain reaction assay. J. Virol. Methods 2002, 100, 17–25. [Google Scholar] [CrossRef] [PubMed]
  19. Kinimi, E.; Odongo, S.; Muyldermans, S.; Kock, R.; Misinzo, G. A paradigm shift in the diagnosis of peste des petits ruminants: A scoping review. Acta Vet Scand. 2020, 62, 7. [Google Scholar] [CrossRef]
  20. Balamurugan, V.; Sen, A.; Saravanan, P.; Singh, R.P.; Singh, R.K.; Rasool, T.J.; Bandyopadhyay, S.K. One-step multiplex RT-PCR for detection of PPR virus in clinical samples. Vet. Res. Commun. 2006, 30, 655–666. [Google Scholar] [CrossRef]
  21. Balamurugan, V.; Singh, R.; Saravanan, P.; Sen, A.; Sarkar, J.; Sahay, B.; et al. Development of an indirect ELISA for the detection of antibodies against the Peste-des-petits-ruminants virus in small ruminants. Veterinary research communications 2007, 31, 355–364. [Google Scholar] [CrossRef]
  22. Chomczynski, P.; Sacchi, N. Single-step method of R.N.A. isolation by acid guanidinium thiocyanate-phenol-chloroform extraction. Analytical biochemistry 1987, 162, 156–159. [Google Scholar] [CrossRef]
  23. Thompson, J.D.; Gibson, T.; Higgins, D.G. Multiple sequence alignment using ClustalW and ClustalX. Curr. Protoc. Bioinform. 2002, 1, 2–3. [Google Scholar] [CrossRef] [PubMed]
  24. Forster, P.; Torroni, A.; Renfrew, C.; Röhl, A. Phylogenetic star contraction applied to Asian and Papuan mtDNA evolution. Molecular Biology and Evolution 2001, 18, 1864–1881. [Google Scholar] [CrossRef] [PubMed]
  25. Bandelt, H.-J.; Forster, P.; Röhl, A. Median-joining networks for inferring intraspecific phylogenies. Molecular Biology and Evolution 1999, 16, 37–48. [Google Scholar] [CrossRef]
  26. Kumar, N.; Chaubey, K.K.; Chaudhary, K.; Singh, S.V.; Sharma, D.K.; Gupta, V.K.; Mishra, A.K.; Sharma, S. Isolation, identification and characterization of a Peste des Petits Ruminants virus from an outbreak in Nanakpur, India. Journal of virological methods 2013, 189, 388–392. [Google Scholar] [CrossRef] [PubMed]
  27. Ahmad, M.-U.-D.; Burgess, G.W. Production and characterization of monoclonal antibodies to fowl adenoviruses. Avian Pathology 2001, 30, 457–463. [Google Scholar] [CrossRef]
  28. Singh, R.P.; Sreenivasa, B.P.; Dhar, P.; Roy, R.N.; Bandyopadhyay, S.K. Development and evaluation of a monoclonal antibody-based competitive enzyme-linked immunosorbent assay for the detection of rinderpest virus antibodies. Revue Scientifique et Technique-Office International des Epizooties. Revue Scientifique et Technique-Office International des Epizooties 2000, 19, 754–763. [Google Scholar] [CrossRef]
  29. Spearman, C. The method of right and wrong cases (constant stimuli) without Gauss’s formulae. British Journal of Psychology 1908, 2, 227. [Google Scholar] [CrossRef]
  30. Engvall, E.; Perlmann, P. Enzyme-linked immunosorbent assay (ELISA) quantitative assay of immunoglobulin G. Immunochemistry 1971, 8, 871–874. [Google Scholar] [CrossRef]
  31. Samad, A.; Awaz, K.B.; Sarkate, L. Diagnosis of Bovine Traumatic Reticulo-Peritonitis I: Strength of Clinical Signs in Predicting Correct Diagnosis. Journal of Applied Animal Research 1994, 6, 13–18. [Google Scholar] [CrossRef]
  32. Libeau, G.; Prehaud, C.; Lancelot, R.; Colas, F.; Guerre, L.; Bishop, D.H.L.; Diallo, A. Development of a competitive ELISA for detecting antibodies to the peste des petits ruminants virus using a recombinant nucleoprotein. Research in Veterinary Science 1995, 58, 50–55. [Google Scholar] [CrossRef]
  33. OIE. Manual of Diagnostic Tests and Vaccines for Terrestrial Animals; World Organization for Animal Health: Paris, France, 2013. [Google Scholar]
  34. Elhaig, M.M.; Selim, A.; Mandour, A.S.; Schulz, C.; Hoffmann, B. Prevalence and molecular characterization of peste des petits ruminants virus from Ismailia and Suez, Northeastern Egypt, 2014–2016. Small ruminant research 2018, 169, 94–98. [Google Scholar] [CrossRef]
  35. Mahapatra, M.; Neto, M.M.; Khunti, A.; Njeumi, F.; Parida, S. Development and Evaluation of a Nested PCR for Improved Diagnosis and Genetic Analysis of Peste des Petits Ruminants Virus (PPRV) for Future Use in Nascent PPR Eradication Programme. Animals 2021, 11, 3170. [Google Scholar] [CrossRef] [PubMed]
  36. Usman, M.; Ahsan, A.; Rasheed, T.; Farooq, U.; Ameen, M.K.; Zahur, A.B. Genetic characterization of peste des petits ruminants virus circulating in different regions of Pakistan based on nucleocapsid gene sequence. Japanese Journal of Veterinary Research 2019, 67, 139–144. [Google Scholar]
  37. Francki, R.I.; Fauquet, C.M.; Knudson, D.L.; Brown, F. (Eds.) Classification and nomenclature of viruses: Fifth report of the international committee on taxonomy of viruses. Virology division of the international union of microbiological societies; Springer Science & Business Media: Berlin/Heidelberg, Germany, 2012. [Google Scholar]
  38. Shaila, M.S.; Shamaki, D.; Forsyth, M.A.; Diallo, A.; Goatley, L.; Kitching, R.P.; Barrett, T. Geographic distribution and epidemiology of peste des petits ruminants viruses. Virus research 1996, 43, 149–153. [Google Scholar] [CrossRef]
  39. Anees, M.; Shabbir, M.Z.; Muhammad, K.; Nazir, J.; Shabbir, M.A.; Wensman, J.J.; Munir, M. Genetic analysis of peste des petits ruminants virus from Pakistan. BMC Veterinary Research 2013, 9, 1–5. [Google Scholar] [CrossRef]
  40. Sharma, K.K.; Kshirsagar, D.P.; Kalyani, I.H.; Patel, D.R.; Vihol, P.D.; Patel, J.M. Diagnosis of peste des petits ruminants infection in small ruminants through in-house developed indirect ELISA: Practical considerations. Veterinary world 2015, 8, 443. [Google Scholar] [CrossRef] [PubMed]
  41. Rahman, M.M.; Parvin, R.; Bhuiyan, A.R.; Giasuddin, M.; Chowdhury, S.M.Z.H.; Islam, M.R.; Chowdhury, E.H. Genetic characterization of Peste des petits ruminants virus circulating in Bangladesh. British Journal of Virology 2016, 3, 115–122. [Google Scholar] [CrossRef]
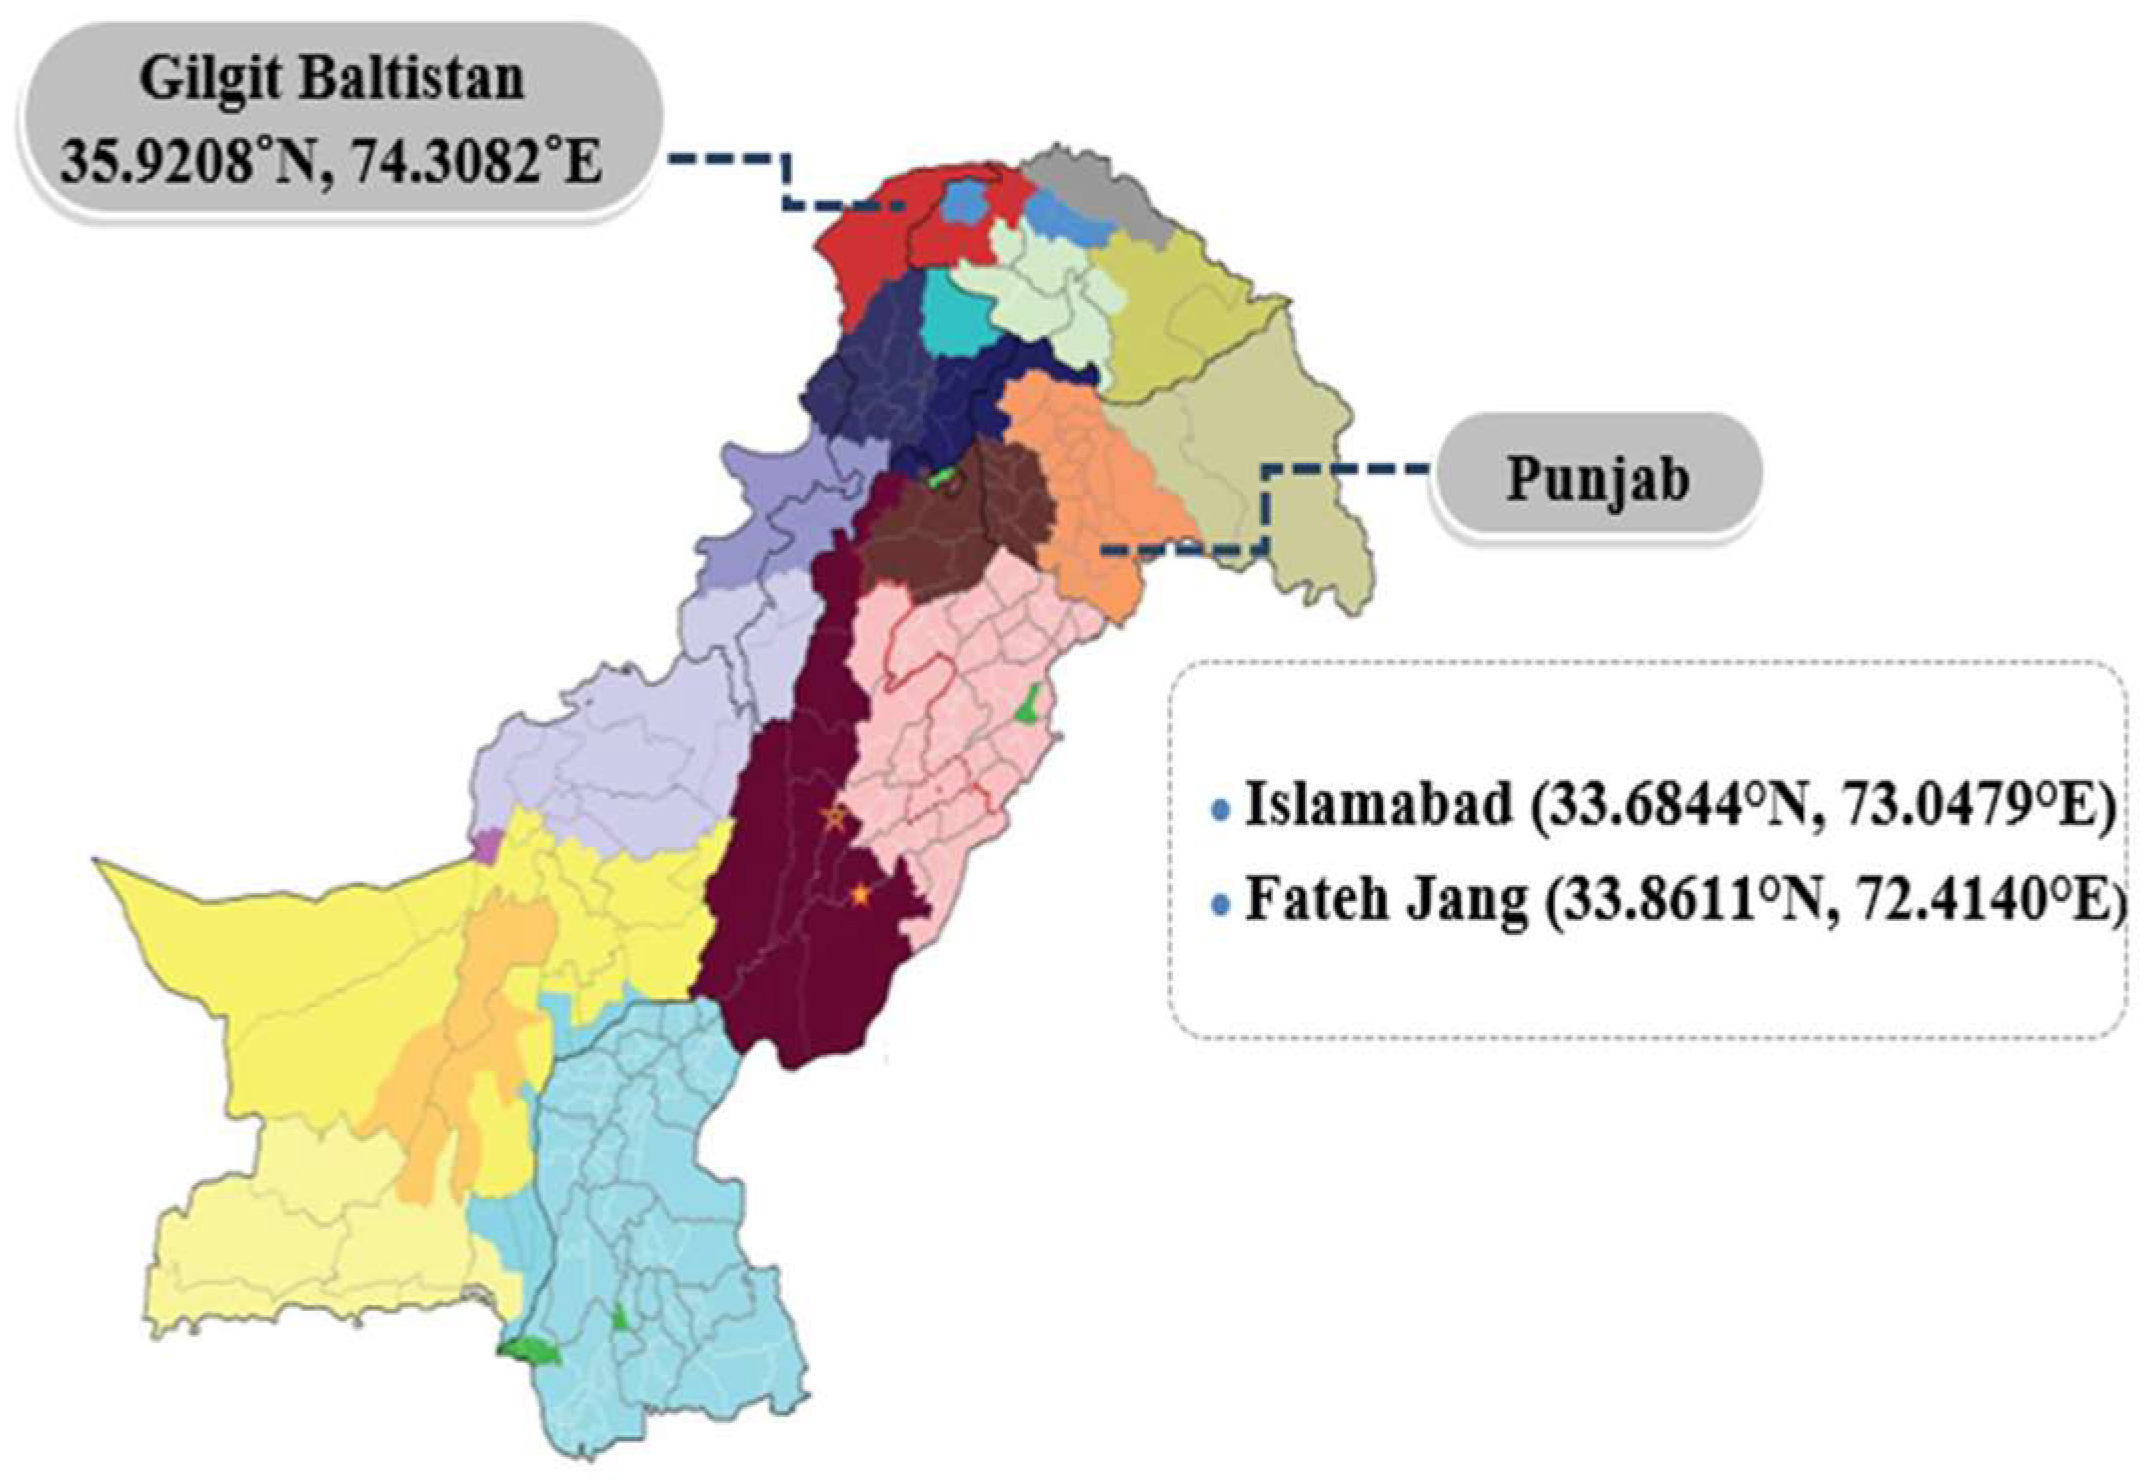
Figure 1. Locations of serum sample collections for sheep and goats during active outbreaks of PPRV reported from Pakistan, in 2020–2021 (colors indicates different divisions under provinces).
Preprints 83108 g001
Figure 2. Animals presenting clinical signs of PPRV disease: (a) inflamed eye membranes; (b) goats from the outbreak area, displaying respiratory distress; (c) blood samples from affected goats; (d) evidence of “zebra striping” in the large intestine.
Preprints 83108 g002
Figure 4. Neighbor-joining technique from N-gene sequences generated using Kimura 2 parameter model with Mega version 10.2.2, displaying 1000 replicate bootstrap results. The samples sequenced in this study are denoted by a black square (■).
Preprints 83108 g004
Figure 6. Graphical representation showing PPRV antigen reactivity of serially diluted positive serum samples. The optimal working dilutions of antigen and antibody are 1:200 serum and 1:32 antigen.
Preprints 83108 g006
Figure 7. Graphical representation of positive and negative serum reactivity values at 1:200 with PPRV antigen at various dilutions. The O.D. value decreases with the decreasing concentration of the antigen.
Preprints 83108 g007
Table 1. Details of PPR serum samples collected from selected locations.
Sr. No. Location No. of serum samples collected from goats No. of serum samples collected from sheep Total no. of serum samples
1 Fateh Jang 52 42 94
2 Islamabad (I.C.T.) 109 57 166
3 Gilgit 44 21 65
Total 205 120 325
Table 2. Sample collection from different sources for the isolation of PPR virus.
Sample sources Total samples Positive samples Negative samples
Swabs 19 2 17
Tissue 6 2 4
Table 3. PPRV virus Isolates from selected locations of Pakistan, sent for sequencing during (2020–2021).
Sr. No. Sample I.D. Date of collection Area Source Nature of Sample Farm Name Apparent Animal status Virus Isolate
1 Pak-ICT-1350/NARC 22-10-2020 Islamabad Goat Tissue Pakrozgar Goat Farm Apparently Healthy No
2 Pak-ICT-1349/NARC 23-10-2020 Islamabad Goat Tissue Madina Goat Farms Apparently Healthy No
3 Pak-ICT-1346/NARC 23-10-2020 Islamabad Goat Tissue Madina Goat Farms Diseased yes
4 Pak-ICT-1347/NARC 10/11/2020 Islamabad Sheep Tissue Pure breed Farms Diseased No
5 Pak-ICT-1344/NARC 10/11/2020 Islamabad Sheep Tissue Pure breed Farms Apparently Healthy No
6 Pak-ICT-1348/NARC 10/11/2020 Islamabad Goat Tissue Pakrozgar Goat Farm Apparently Healthy No
7 Pak-GIL-1326/NARC 15-10-2020 Gilgit Baltistan Goat Swab Hunza Farms Diseased yes
8 Pak-FJ-1336/NARC 5/10/2020 Fateh Jang Goat Swab AlBarka Farms Diseased yes
Table 5. Relative sensitivity and specificity values of IELISA in comparison to a commercial kit.
I-ELISA Commercial kit Total
Positive Negative
Positive 135(a) 26(d) 161
Negative 14(b) 150(c) 164
Total 149 176 325
Relative specificity of assay = 150 of 176, (85.23%). Relative sensitivity of assay = 135 of 149, (90.60%). Correlation = a + c/a + b + c + d × 100 = 135 + 150/325 × 100 = 87.69%.
Table 6. Relative sensitivity and specificity values of IELISA in comparison to V.N.T.
I-ELISA V.N.T. Assay Total
Positive Negative
Positive 161(a) 0(d) 161
Negative 35(b) 129(c) 164
Total 196 129 325
Relative specificity of assay = 129 of 129, (100%). Relative sensitivity of assay = 161 of 196, (82.14%). Correlation = a + c/a + b + c + d × 100 = 161 + 129/325 × 100 = 89.23%.
Disclaimer/Publisher’s Note: The statements, opinions and data contained in all publications are solely those of the individual author(s) and contributor(s) and not of MDPI and/or the editor(s). MDPI and/or the editor(s) disclaim responsibility for any injury to people or property resulting from any ideas, methods, instructions or products referred to in the content.
Copyright: This open access article is published under a Creative Commons CC BY 4.0 license, which permit the free download, distribution, and reuse, provided that the author and preprint are cited in any reuse.
Prerpints.org logo

Preprints.org is a free preprint server supported by MDPI in Basel, Switzerland.

Subscribe

© 2024 MDPI (Basel, Switzerland) unless otherwise stated