1. Introduction
Base Stations (UAVs) can be deployed to provide wireless connectivity to ground devices. Due to their ability to provide access to different altitudes, UAVs are interesting for the flexible deployment of air stations. (UAV-BS) [
3]. We are experiencing the deployment of fifth generation networks [
12]. UAVs are mobile and dynamic access points that are deployed when ground base stations are overloaded or temporary power outages, caused by disasters or excessive user flow at specific times [
1,
2,
24]. Thus, the use of drones embarking network equipment is being used to assist mobile network demands, due to its advantages and flexibility regarding its deployment [
27].
The work [
18] addresses the use of air base stations to provide access to users on the ground, as an alternative to traditional networks. Thus the use of UAVs helps ground based radio stations in providing signal coverage and high data rates [
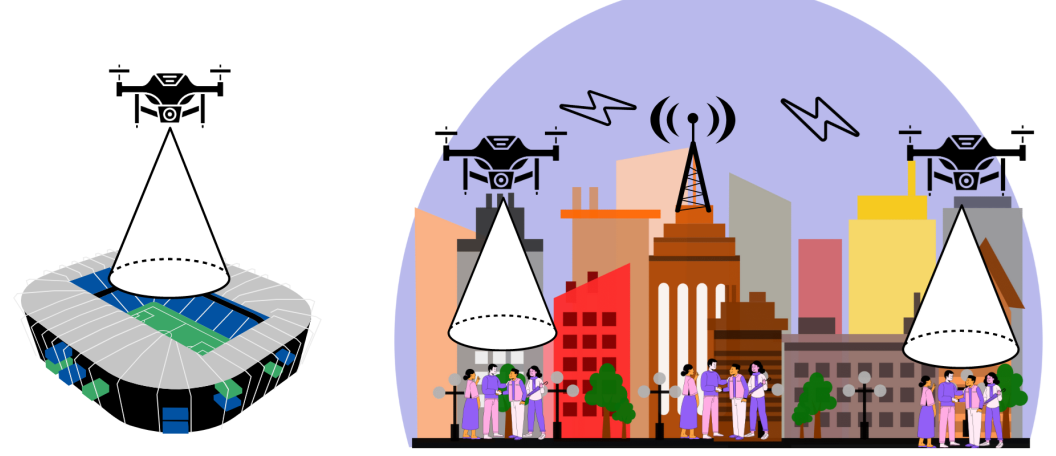
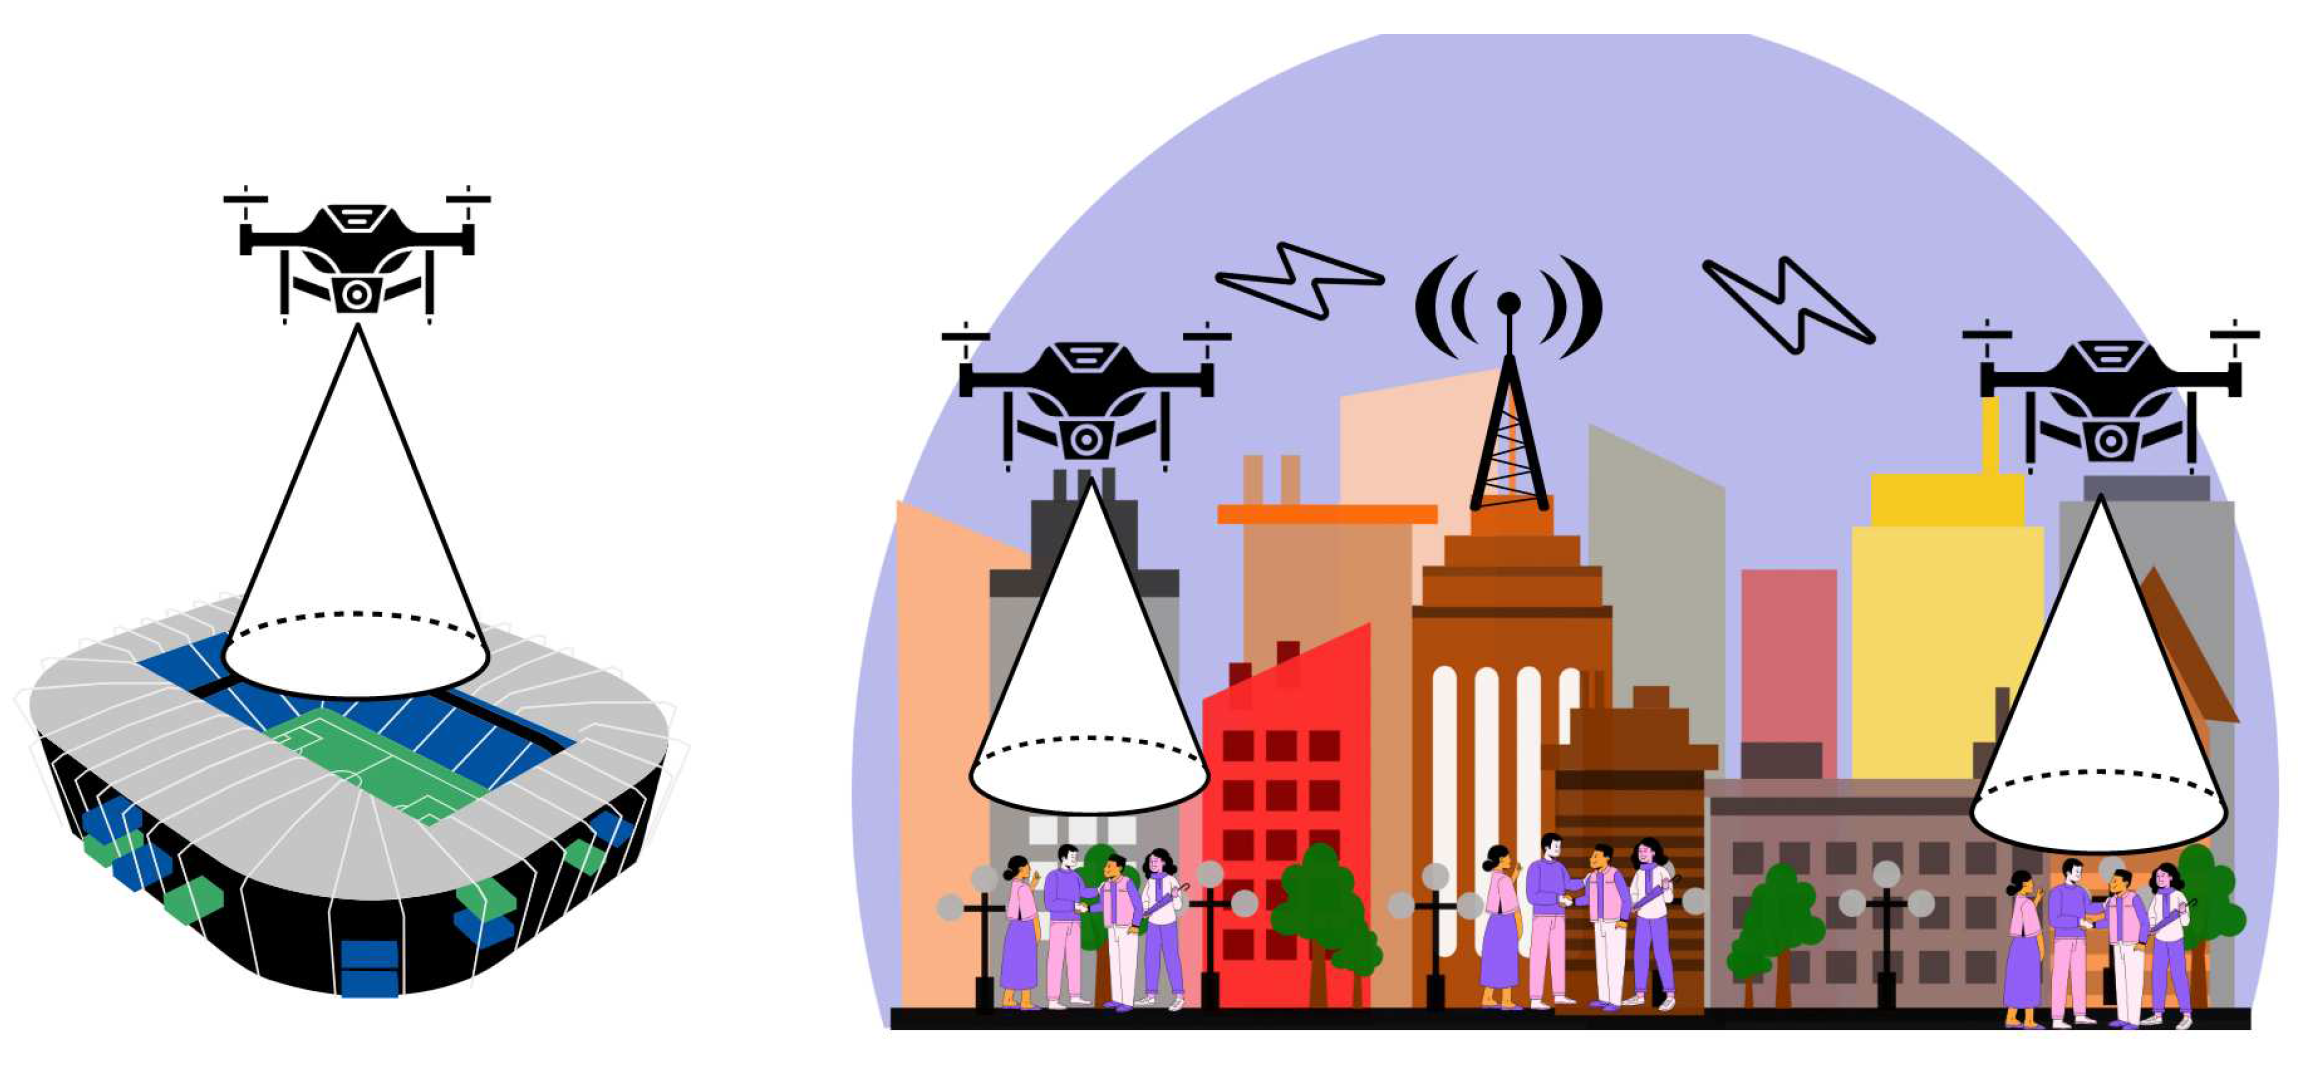
28], especially in situations where this excess demand occurs in a way that is quite difficult to predict, according to the
Figure 1.
According to the work [
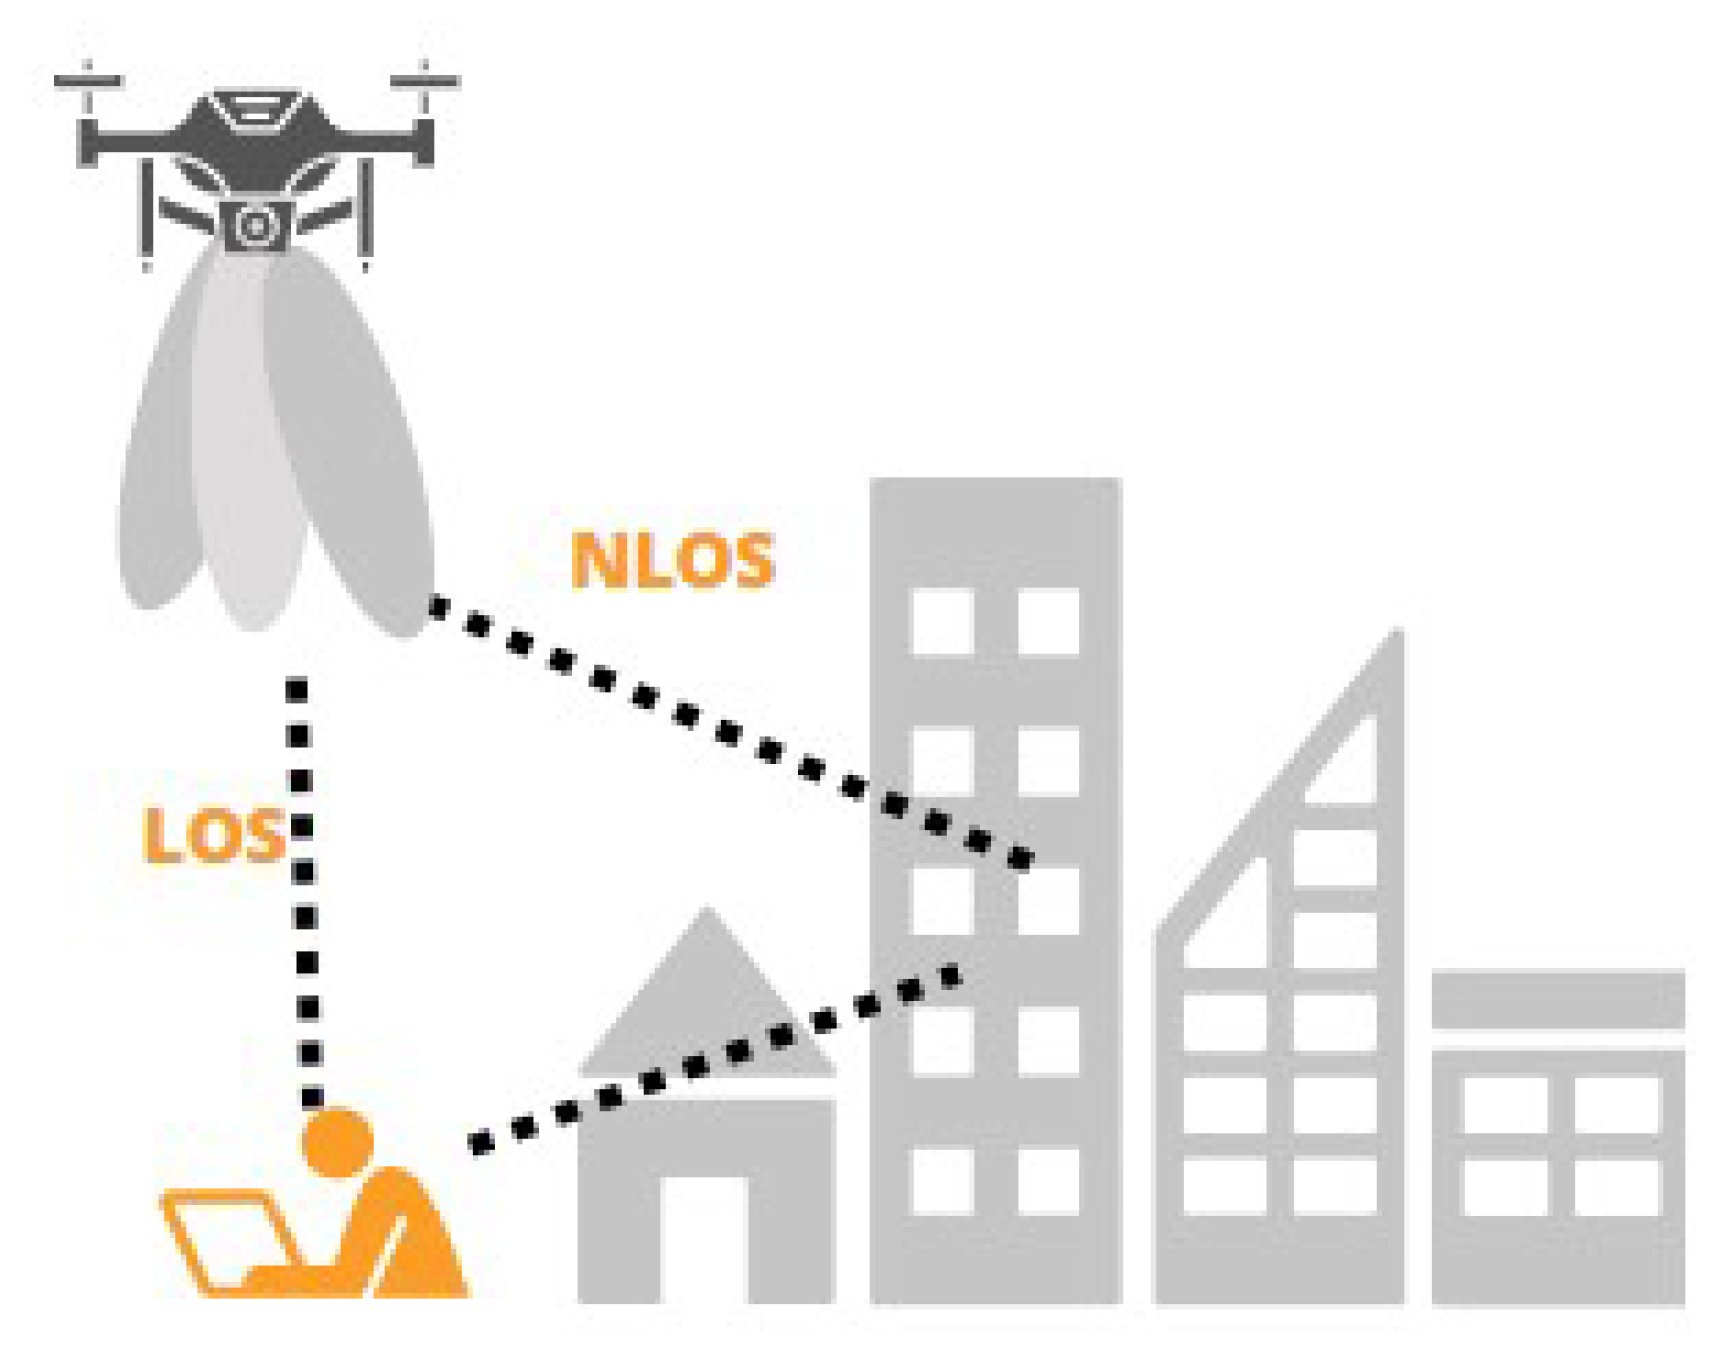
7] the drone has a directional antenna that provides wireless coverage for a certain area. Signal propagation considers line-of-sight (LOS) and non-line-of-sight (NLOS) for ground users.
This electromagnetic propagation suffers losses along the path, thus facing several problems related to transmission, such as: attenuation, fading and distortion [
7]. Therefore, it is necessary to find the ideal altitude to have coverage that guarantees QoS (Quality of Service) for users on the ground.
The positioning and its altitude are still challenging, because they directly impact the signal coverage and the data rate perceived by users on the ground [
23]. The quality of the transmission is related to the altitude of the drone [
21]
Considering the related problems in positioning drones to improve cellular mobile coverage of users on the ground. The article proposes a solution to determine the optimal placement of multiple UAVs. An algorithm for allocation of mobile air stations is proposed, taking into account the vertical and horizontal positioning of the UAV-BS. The proposed model was able to provide network access, ensuring signal coverage, QoS and energy efficiency. The solution was compared with another strategy and the results demonstrate better energy efficiency.
This article is divided as follows. in section II are the related works. In Section III the model of the proposed system. Section IV presents the simulation and results. While Section IV concludes the article.
2. Related work
UAVs are being used in several telecommunication scenarios due to the flexibility in their deployment. In recent work [
4] address a proposal with many mobile air stations, to cover large areas with the least possible number of UAVs. Some UAV implementations use a directional antenna, in order to assess signal coverage, the work of [
29] studying connectivity in networks covered only by mobile air stations.
The work [
5] investigates the use of UAVs for data collection in an IoT scenario and considers choosing the best path. Thus, using a reinforcement learning technique that aims to find the ideal transfer rate and trajectory in an environment. In other work [
16] they use a cooperative technique to use UAV networks and traditional networks. In order to improve and expand the coverage of the signal, they chose the technique of machine learning reinforcement learning.
The work [
17] covers scenarios that use UAVs to cover natural disaster areas. To validate their hypothesis, the researchers use computer simulation tools and methods using benchmark bases to evaluate their algorithms for signal coverage. In the article [
19], uses optimization to minimize the energy consumption of UAVs taking into account connected users, allocation of network services, route planning, processed by edge computing. To validate their research, they used numerical simulation and compared their results with other works found in the literature.
Below is a summary of the articles found on the problem of allocating drones in different situations that help mobile networks in disaster situations or network overload.
Table 1.
Articles found.
| Article |
Problem |
Technique used |
| [3] |
Connectivity problem of aerial users served by drones 3D placement |
Algorithm proposed |
| [5] |
Resource allocation UAV-assisted Internet of Things (IoT) |
Deep reinforcement learning |
| [16] |
Deployment of UAVs in the post-disaster area |
Reinforcement learning |
| [17] |
Base stations decentralized deployment |
Algorithm proposed |
| [19] |
Power control, allocation, and location planning in the BS |
Fuzzy means clustering |
| [29] |
Integrating drone-BSs to cellular networks |
Heuristic algorithm |
Unlike the works found, this proposal uses a 3D positioning strategy for UAVs. Here highlighting the main points:
A proposal for positioning uav base stations
A proposal for better coverage for mobile users based on QoS
Energy savings compared to other strategies
Analysis of the flight time performance of drones
3. Methodology for UAVbs
In this section, the proposed strategy is presented, as well as the stages of development of the research method are detailed.
3.1. UAVbs
Some parameters related to the study of UAVBS are taken into account. Signal propagation, considering the line of sight (LOS) and line of sight (NLOS). Where f is the carrier frequency, d is the distance, c is the speed of light [
7].
This is illustrated the a directional antenna in figure bellow, where is the wireless coverage, H is the height, and R is the coverage radius [
35],
Figure 2.
The wireless signal is characterized by air-to-ground propagation and has Line of Sight (LOS) and No Line of Sight (NLOS) between transmitter and receiver. The prediction of channel model the UAV is given by:
In is work[
8] , he studies the quality of wireless signal transmission between transmitter and receiver.
Given the transmission capacity of the Bw (Bandwidth) of the channel, the information collection rate of a terrestrial client can be communicated using the Shannon equation:
Where B is bandwidth, p is energy power,and N is signal to noise ratio.
Thus, the use of 3d allocation is rightly used to improve users SINR. Channel models use a log-distance path-loss model [
22]:
Where PL(d) is the path-loss in dB at a given distance d from the BS.
Another model at [
26] demonstrates how to calculate the horizontal distance and elevation angle of the user on the ground relative to the transmitter in the air. To do this, use the formulas below:
Knowing that altitude affects the quality of service for ground users, we propose a sub-optimal optimization solution to find the ideal altitude for UAVs [
31]. These considerations are important for successful deployment of air base stations. In our proposal two steps are used for this.
3.2. Problem Model
Finding the optimal placement of a transmit antenna, or in this case, the vertical and horizontal placement of the drone is modeled as optimization, because of its complexity. So the drones, are positioned to serve several users on the ground, guaranteeing the minimum of QoS for all. The problem is non-convex, thus having multiple local optimal. The mathematical modeling implemented is the solver, which is actually the implementation of the objective function, which minimizes the all drones in relation by users on the ground, use the formulas below:
Problem: Minimization of the Number of Transmission UAVS
Where:
Z is the objective function that seeks to minimize the total number of uav.
represents the number of uav to be installed in sector i.
represents the height of the uav in sector i.
n is the total number of sectors.
is the number of users in sector j.
is the capacity of a uav, i.e., the maximum number of users that a uav can serve.
The algorithm tests the minimum data rate required by each user in the cluster, this value is used to guarantee the QoS of all users allocated by a UAVBS. The UAVs must should be deployed in area at a certain height, signal strength and communication radius.
3.3. Proposed of a New Heuristics
For uav allocation, a heuristic was developed. The heuristic determines the minimum number of drones needed and the height of each one to serve the users on the ground. The algorithm performs several iterations incrementing the number of drones to find a solution. The heuristic ends when it satisfies all constraints and allocates drones to users, algorithm 01.
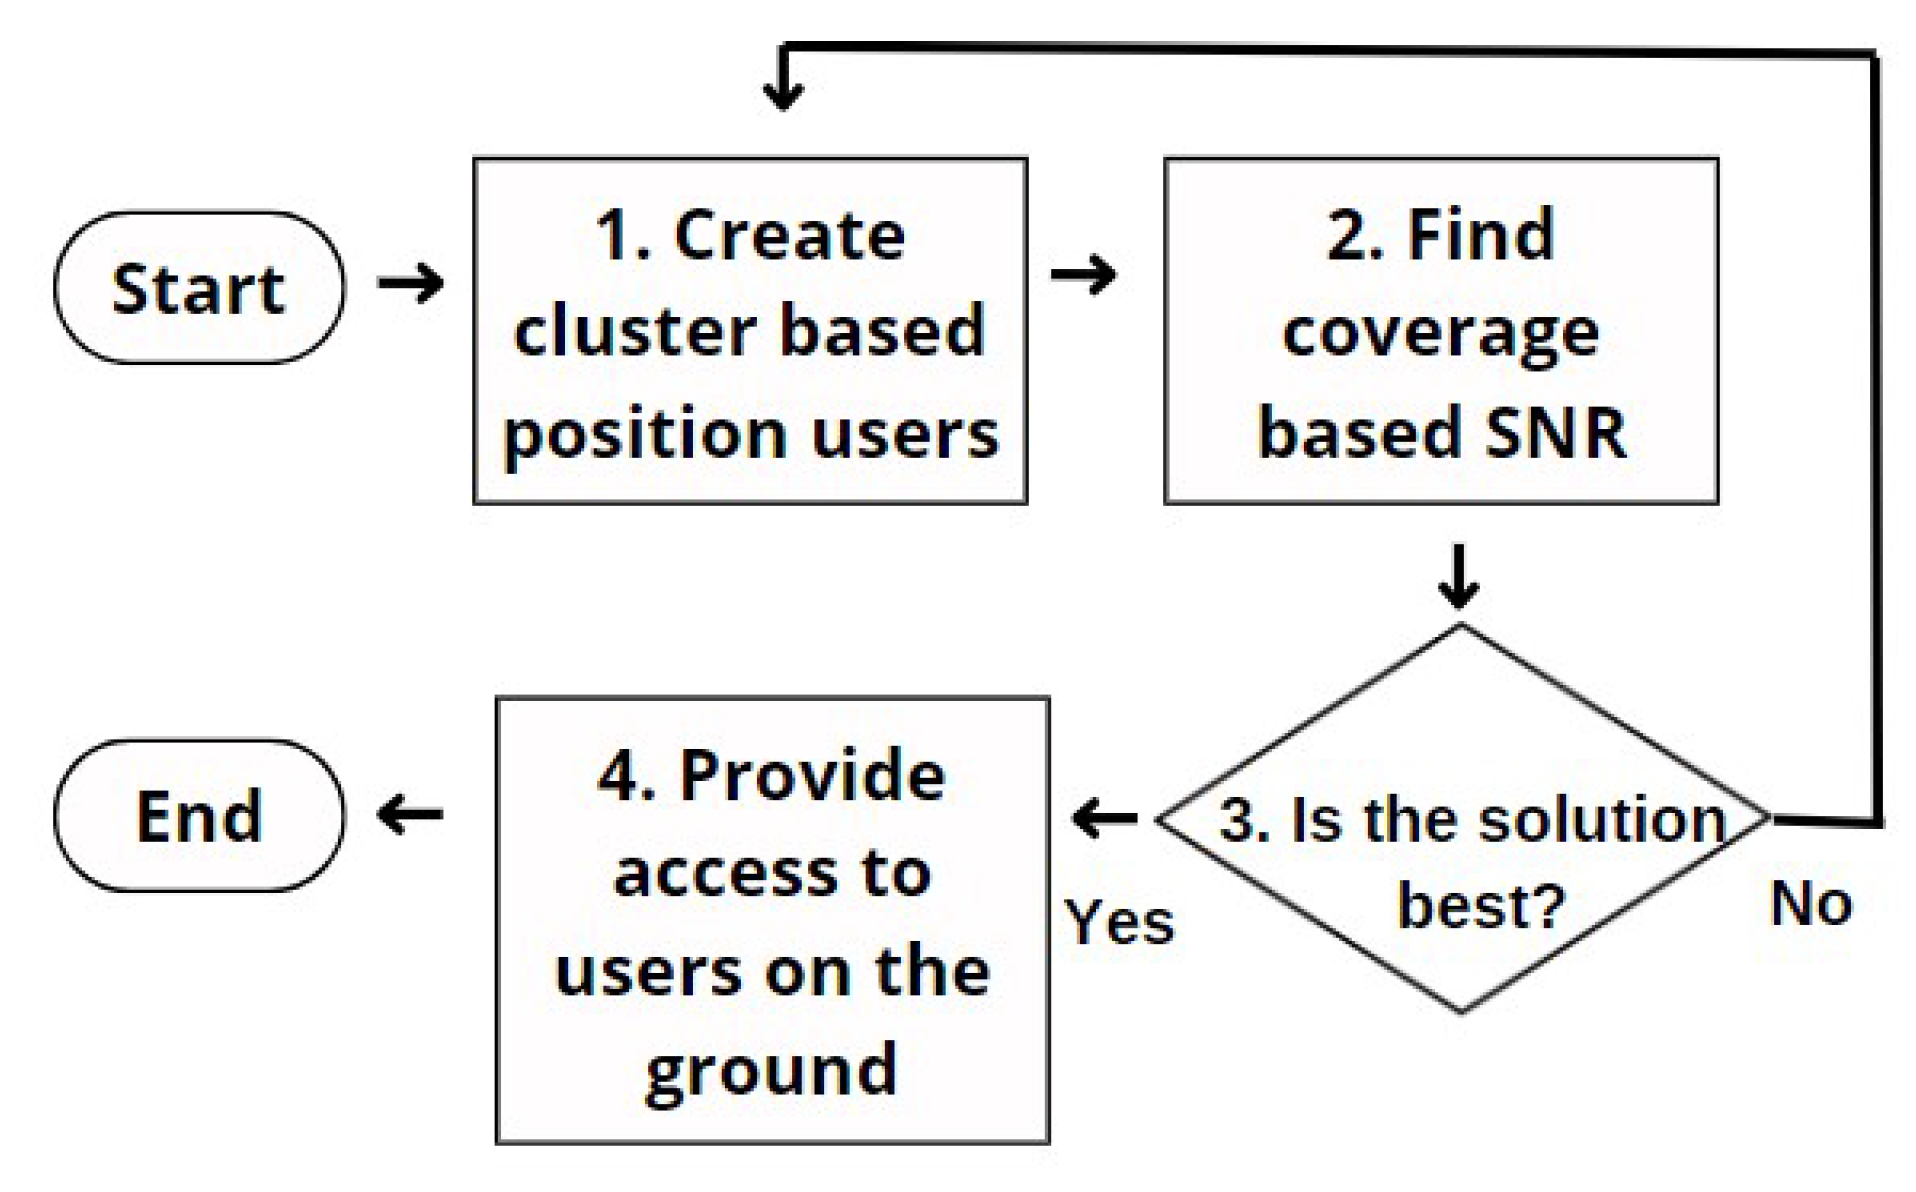
The algorithm consists of 4 steps: (1) Clustering of the users using machine learning k-means. (2) Coverage the users based QoS. (3) Check which was the best solution based in the number of users served and (4) Provide access to users on the ground, according to the
Figure 3.
3.3.1. Cluster
The algorithm I groups users into clusters, in order to find the best positioning of the UAVBS. This approach uses the k-means algorithm. Lets you find placement at the center of the user. This is valid since it allows covering the largest possible number of users on the ground. The k-means algorithm is one of the most used machine learning algorithms for clustering classes. Due to its ease of implementation and its computational performance [
15]. Next, the ideal height, coverage radius and signal strength are found for each cluster. The algorithm ends when a solution satisfies the objective function.
To use k-means it is necessary to randomly choose k centroids, where k is the number of clusters or groups of data. Then the algorithm tries to find the center of a cluster. To distribute users into different groups, the following strategy was used. initially they were separated into sets. The set of mobile users are arranged in u = {1,2..u }. The clustering set in g = {1,2..g } and the drone set d = {1,2..d}. Then the users are grouped, after being grouped they are served by a nearest drone.
3.3.2. Coverage
The height is adjusted according to the power received by users and the coverage area of each cluster, this ensures that the signal quality is maintained. The optimum solution of the UAVs is used algorithm II. Several parameters are used as input, for example: number of users, number of cluster, Tx power, Rx power, channel, bandwidth, resource blocks, NRs.
|
Algorithm 1 ALLOCATION UAVBS |
- 1:
- 2:
- 3:
best, bestAtual = 0 - 4:
solution = 0 - 5:
rounds = 300 - 6:
Create Position User - 7:
User=randon(x,y) - 8:
while
do
- 9:
create cluster for position uav center of the cluster - 10:
cluster=kmeans(Users) - 11:
Calculate maximun distance users - 12:
for i = 1 to do
- 13:
MaxDistance = Maximun Distance all Users to Cluster - 14:
end for
- 15:
try allocate in the each cluster - 16:
for i = 1 to do
- 17:
for j = 1 to do
- 18:
if and then
- 19:
allocate user in the uavbs - 20:
- 21:
end if
- 22:
end for
- 23:
end for
- 24:
totalUser = sum(UsersAllocationNetwork) - 25:
if then
- 26:
- 27:
best = totalUser - 28:
end if
- 29:
= + 1 - 30:
end while - 31:
Plot solution search |
Evaluates each user’s signal in relation to the drone’s within each cluster. This is repeated for each cluster. If the average QoS is achieved, the optimum height of the UAV for land users is found.
3.3.3. Best Solution
In this step, the solution is verified. If the solution is not satisfied, a loop is executed that calls step 01, incrementing the number of clusters. It then calls step 02, which searches for other parameter the network for the UAV. This is repeated until the constraints of the problem are satisfied.
We will have all the drones covering the regions with their sub-optimal found. Users have a QoS requirement that needs to be maintained, minimum Mbps per cluster coordinated by a drone. To allocate each user, a calculation is performed based on the SINR and blocks of resources available in the UAVBs. If the UAV does not have enough resources, the user will not be served.
3.3.4. Provide Access
if the solution that satisfies all restrictions is found, the algorithm will position the drones over the users on the ground, guaranteeing access to the network according to the required QoS.
The steps of the algorithm to find the ideal amount of drones to cover the intended area. Initially, it starts with only 01 drone and increases according to the values found. For this, kmeans is run in each round to find the center of the cluster. Then it tries to cover all users on the ground, for that, it takes into account the signal-to-noise ratio values of the users. Not achieving the best fitness, the algorithm increments one more drone and repeats the process.
3.4. Scenario
In our experiments numerical simulation was used to evaluate the work proposal. Several parameters were used to create the test environment. The simulation took place in 40 repetitions, with random seeds and each simulation took place in 100 seconds. The simulation are performed in Matlab®2022.
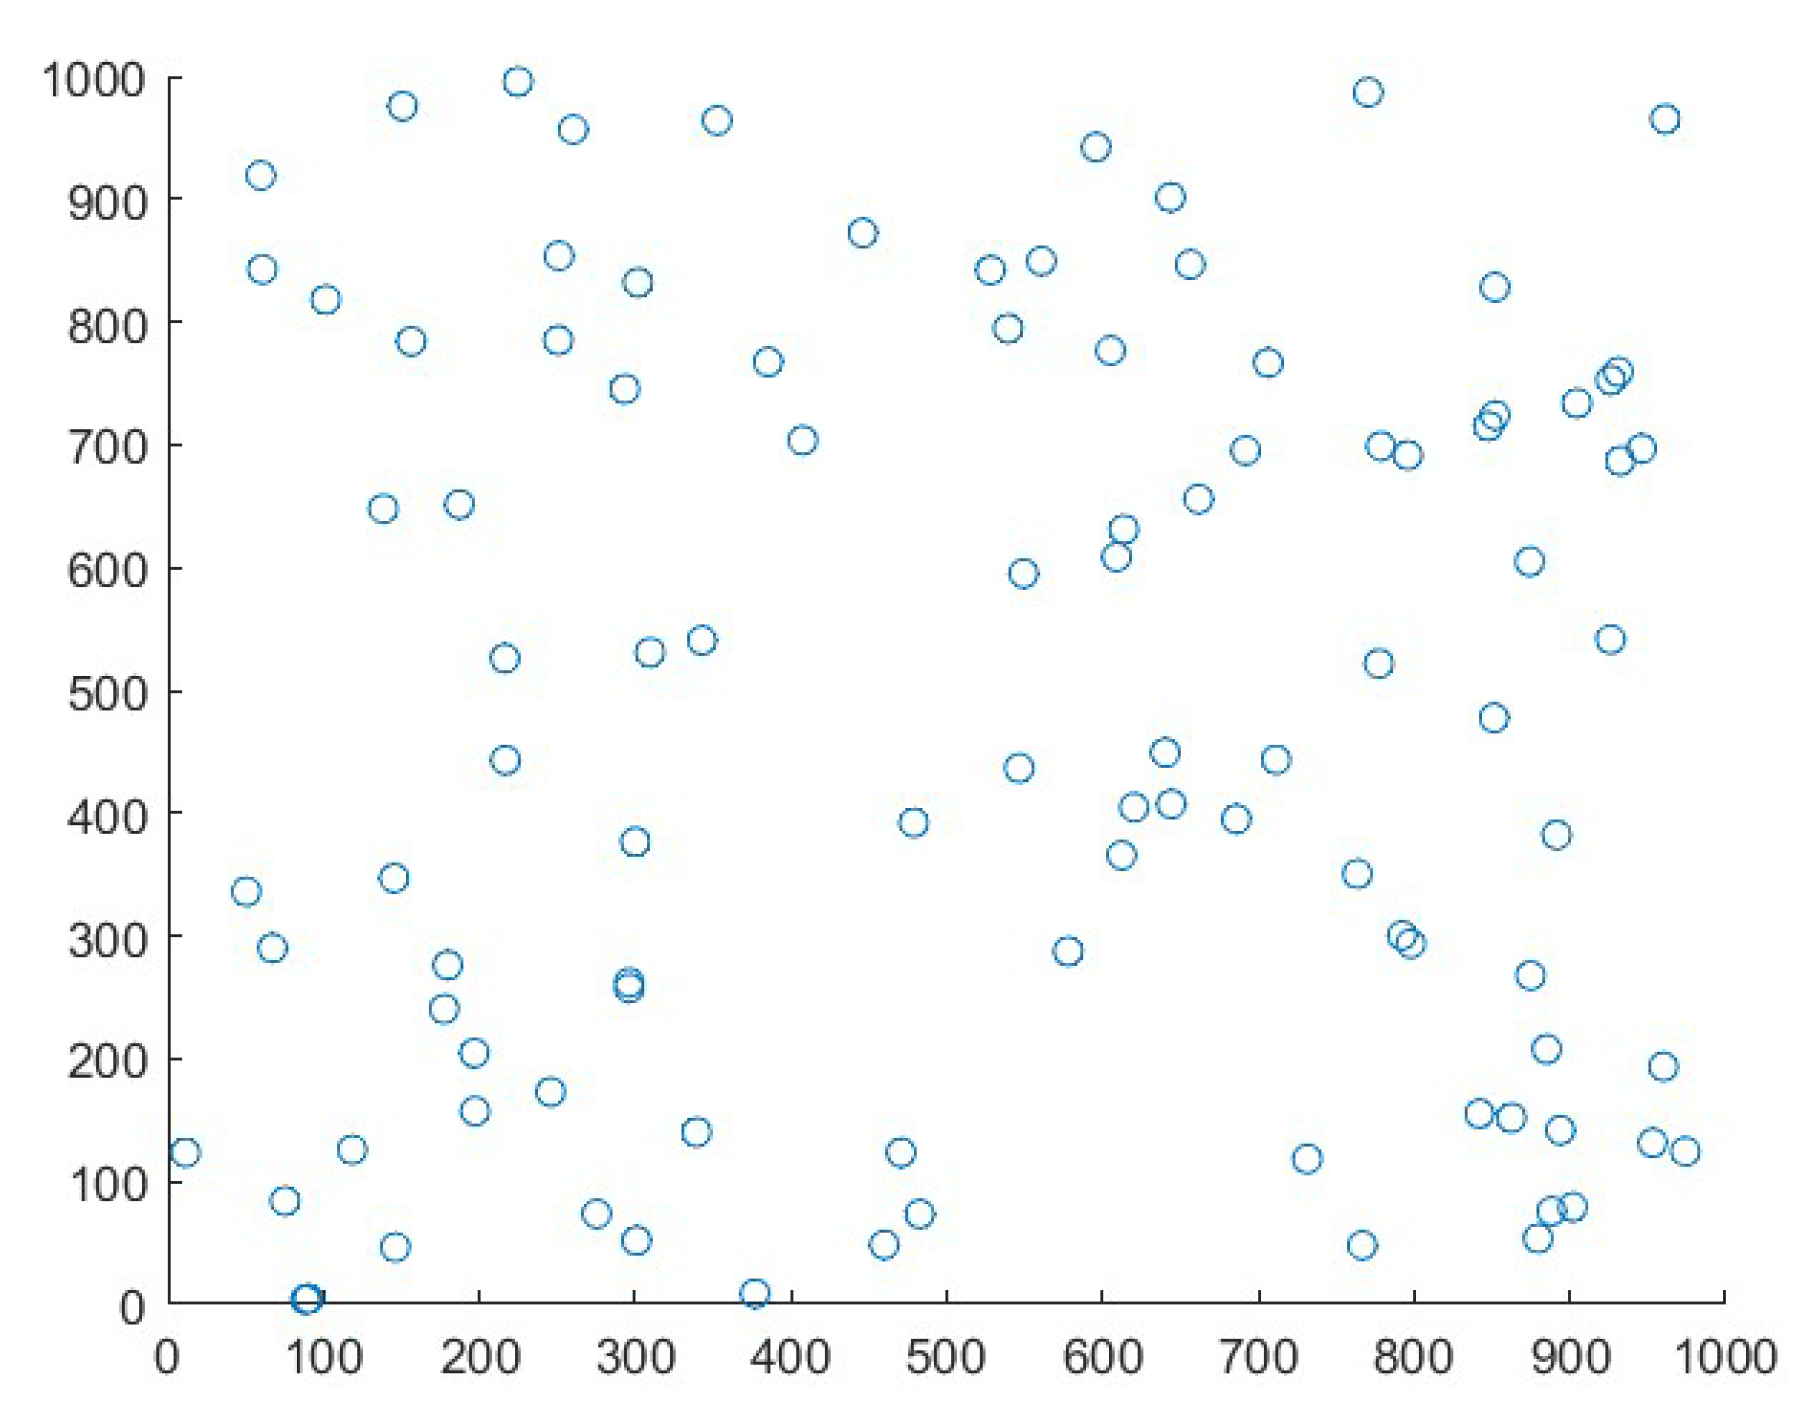
For the simulation, the scenario chosen is a failure in the ERB, caused by by natural disasters, thus making it impossible for mobile users to access the network. It is taken into account that users have a uniform distribution, move from 0 to 10 m/s and have network requirements of 1 to 3 mbps to use resources, allocated taking into account the SNR ratio. It was considered scenarios that there are 100 stationary users in the specified geographical area of 1000x1000.
For the simulation of the study scenario, some steps were used. Initially, users with defined lat/log position and their required data rate were started. Then the drones were configured with parameters of band, frequency, height and available resources. Then the kmeans cluster sets the height, defines the coverage, distance and positions itself in the center. Then the QoS is evaluated to ensure the maximum number of users serviced by the drone. Finally, the solution found is then used, as shown in the
Figure 4.
The network used is the LTE standard and the drones have a bandwidth of 20 mhz with blocks of resources limited to 100. Each drone can connect the macro-cell at 40 Mbps. All parameters used are show in the
Table 1.
To evaluate the flight time of the drones, some parameters were configured. Values are shown in
Table 2.
3.5. Performance metric
To validate the proposal of the article, three strategies were evaluated: (a) random , (b) fixed and (c) Dynamics proposal. Each strategy tries to cover an area with landless user in the best way, for that, it uses positioning, height and coverage radius of the drone:
In (a) Random, the drones use the height and coverage radius randomly throughout the simulation.
In (b) Fixed , the drones maintain the pre-configured height and coverage radius throughout the simulation.
Different from the other proposals (a) Random [
36] and (b) Fixed [
37] that leave the height or fixed when simulating the flight of the drone. In our proposal (c) Dynamics, the height and coverage radius of the drones are dynamically adjusted by the proposed algorithm throughout the simulation. This is intended to best position the drone in relation to users on the ground.
4. Results and Discussion
In this section, the results of the research carried out and their considerations are presented.
4.1. Performance metric
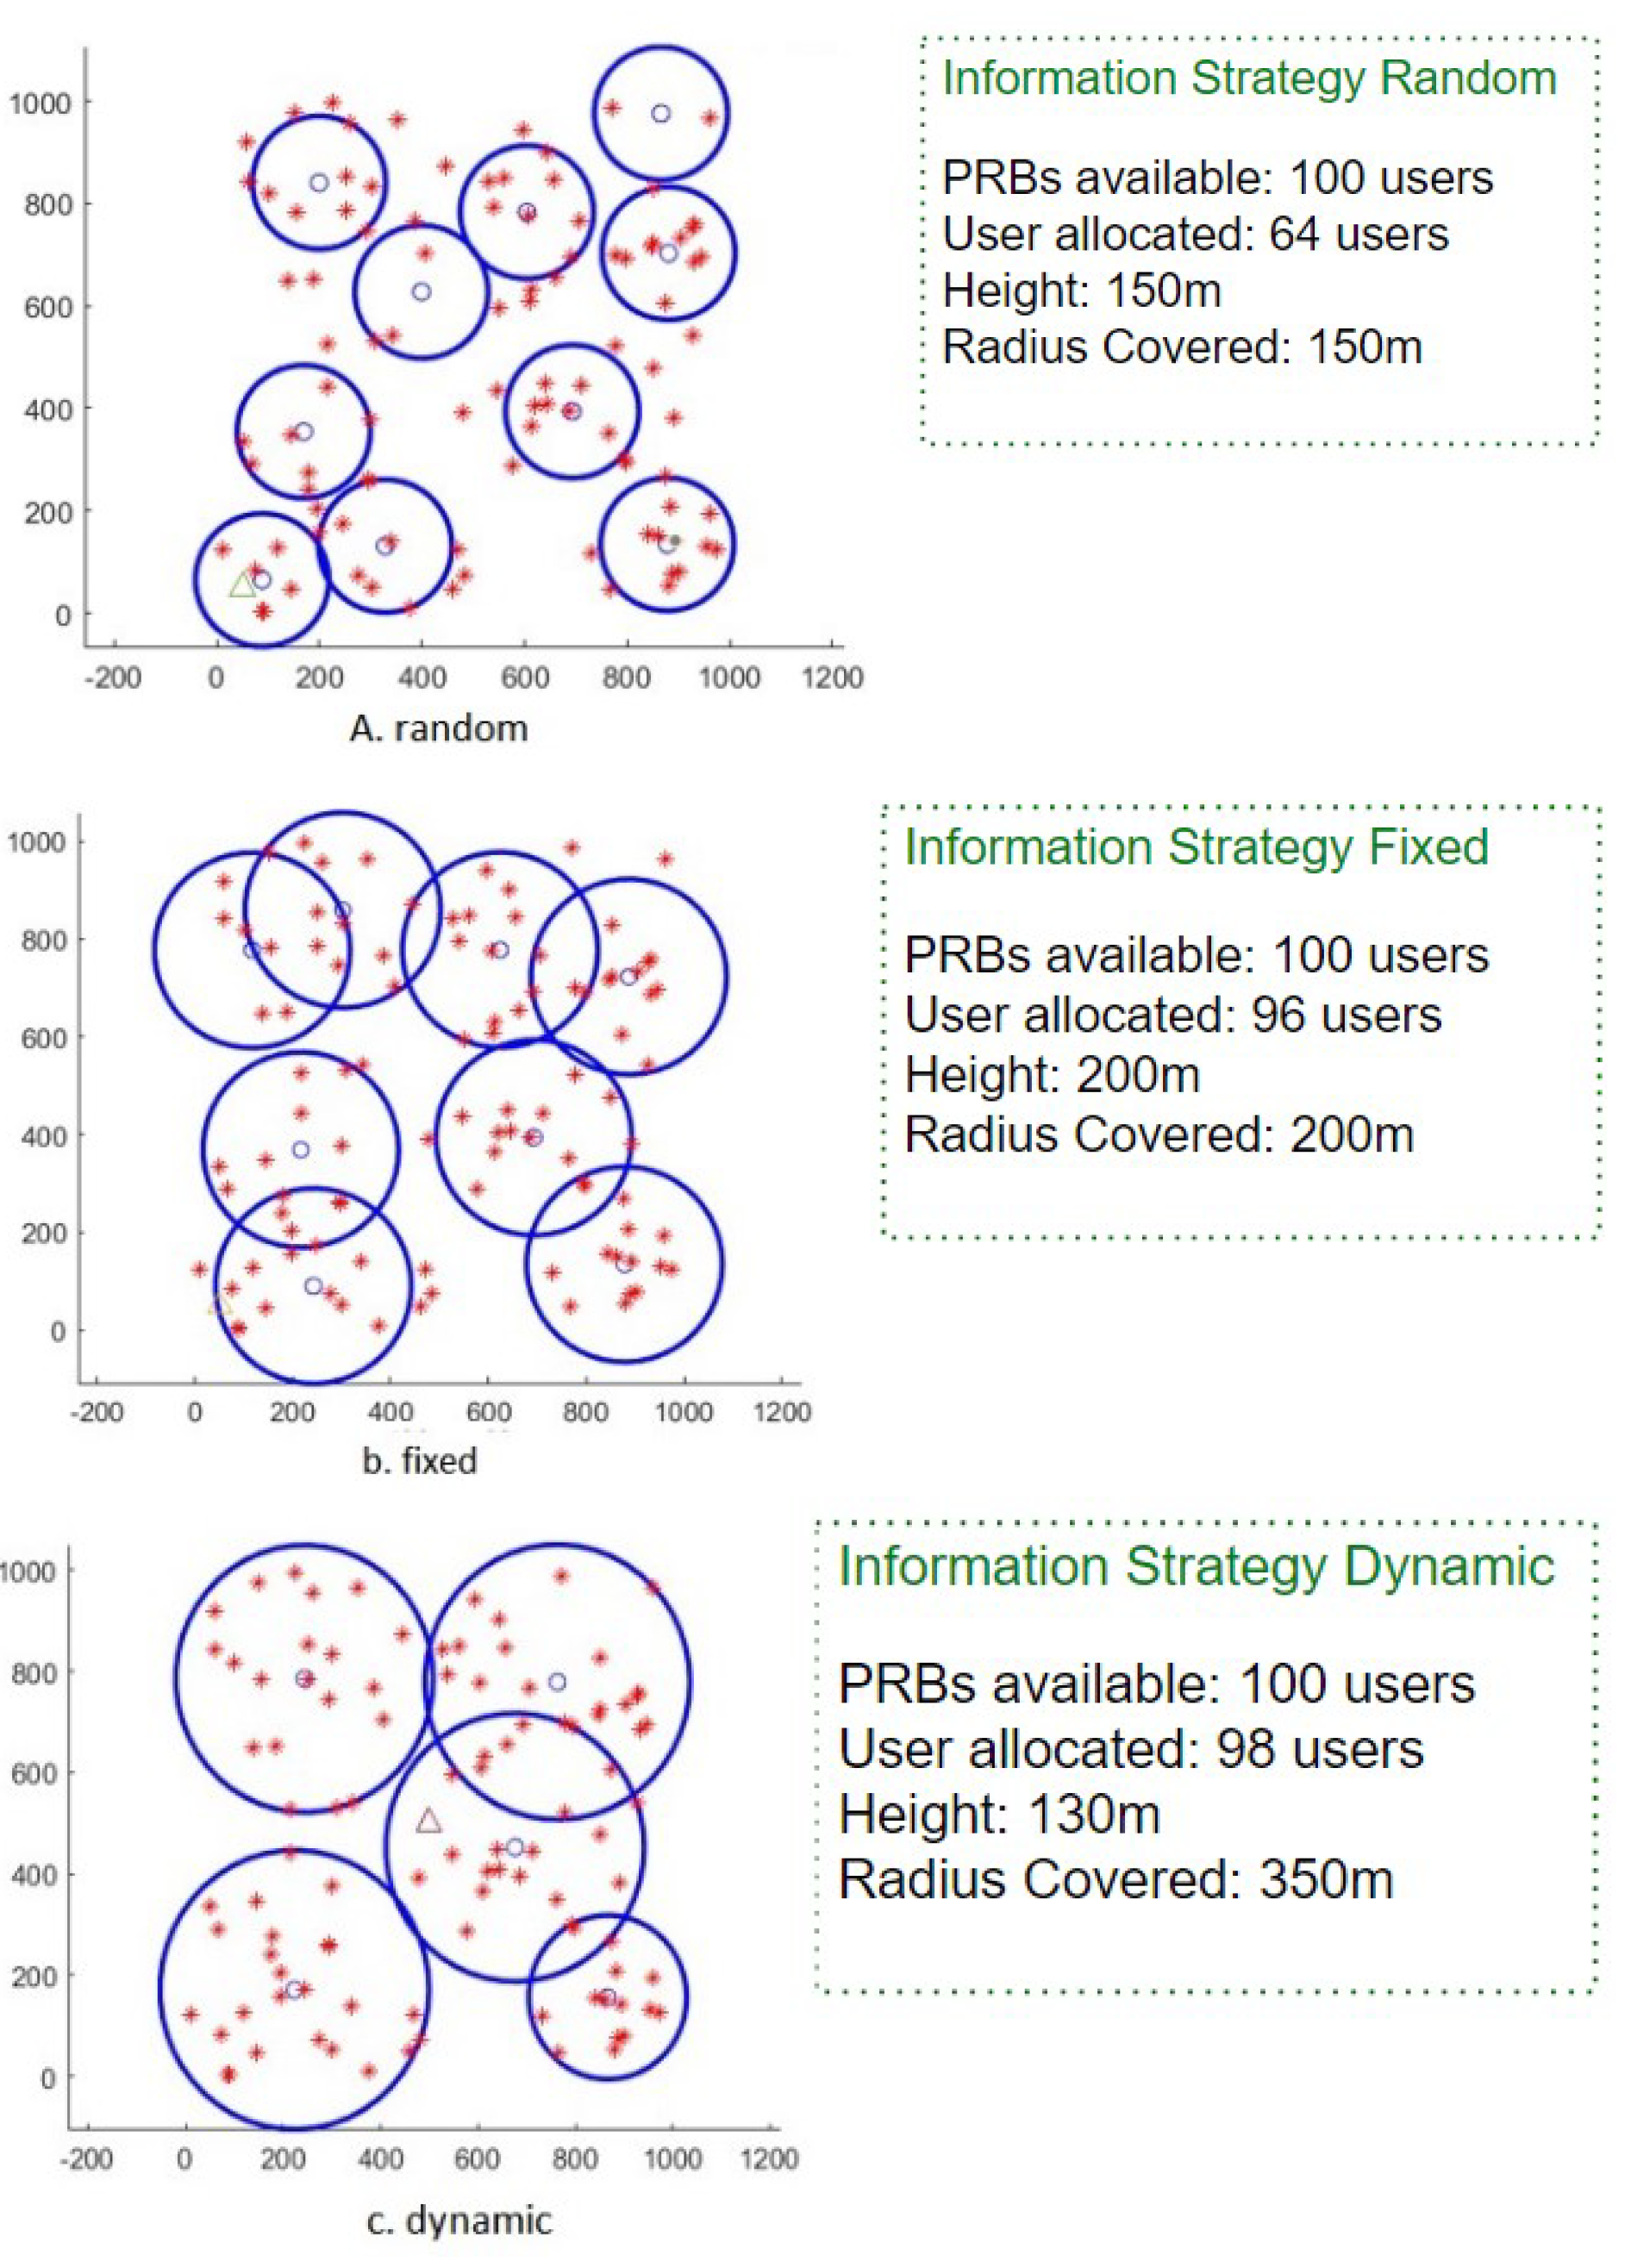
Are presented the number of cluster allocated to each strategy, this is shown in the
Figure 5. In each scenario it is possible to observe the number of drones and how they were distributed in each scenario.
Note that in (a) random, all drones were used, even so not getting good coverage, since there are still users without communication. In (b) 8 drones were used and distributed in the scenario, reaching a total of 96 assisted users. Finally we have (c) Dynamics proposal which with only 5 drones can cover an area sufficient to serve 98 users on the ground.
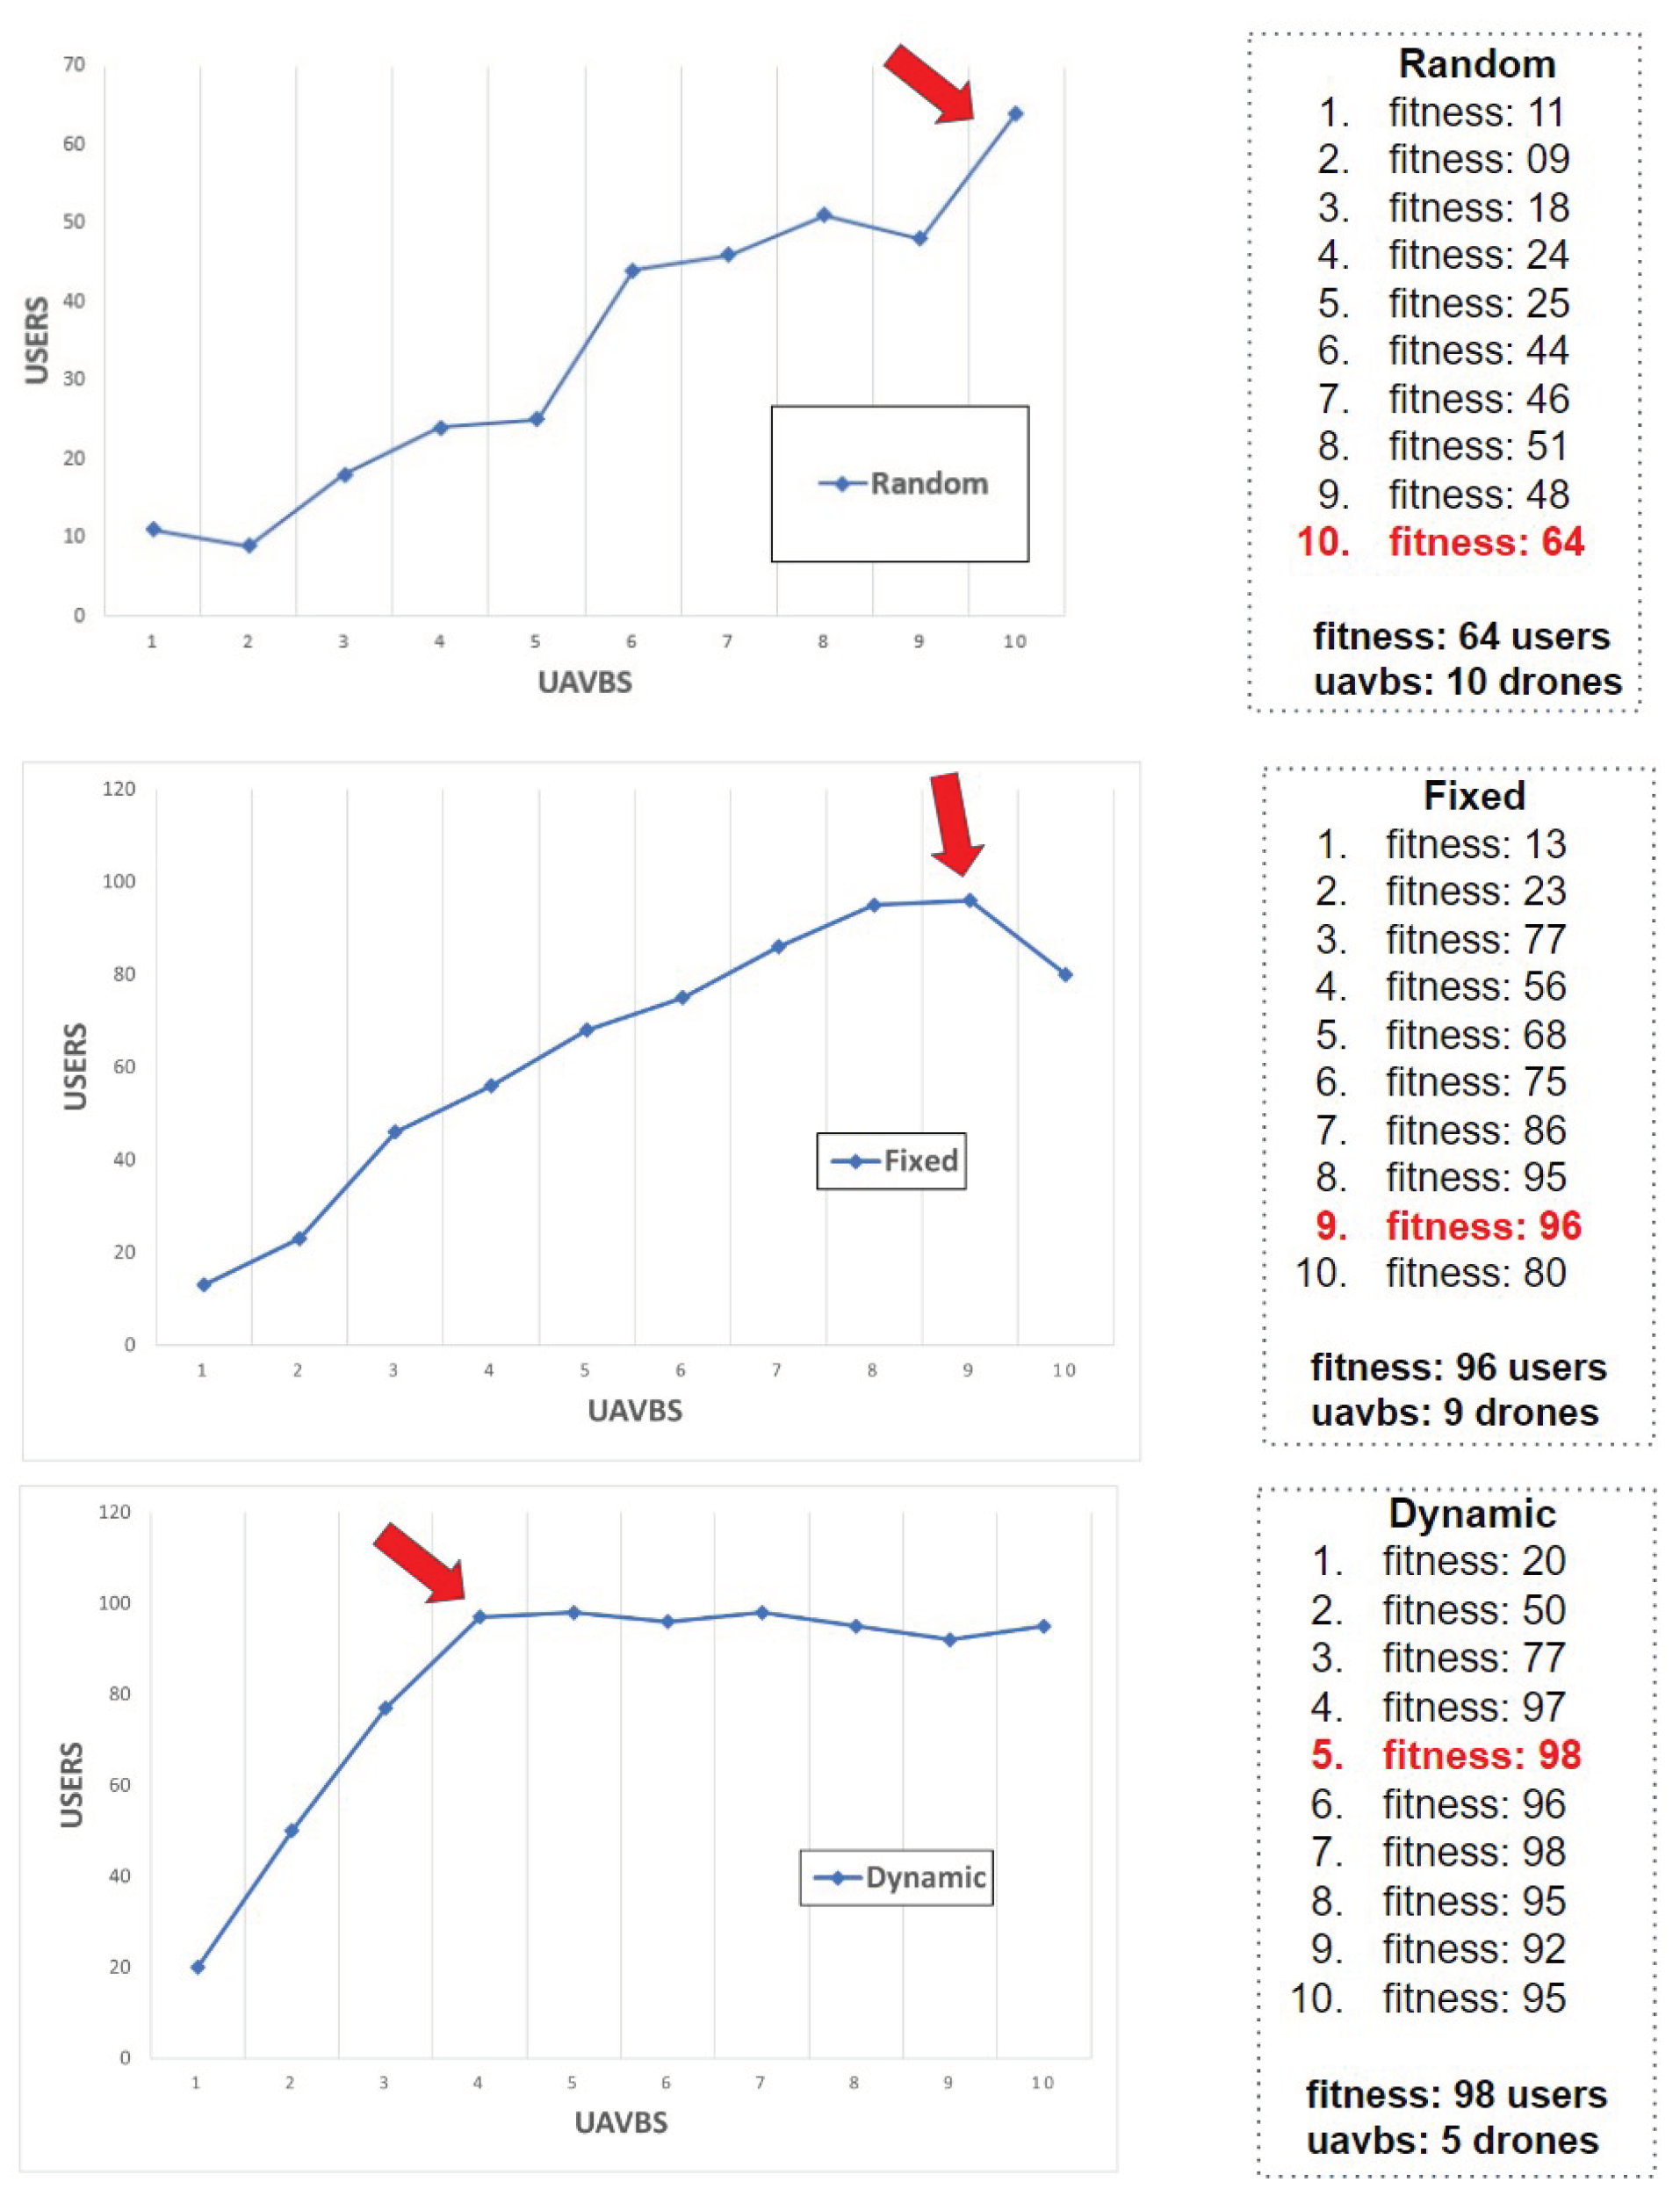
In this step, the time that the algorithm takes to find the best solution in each strategy is analyzed. Note that at each interaction it is possible to evaluate fitness: with 10 drones, 05 drones and 09 drones, respectively. As shown in
Figure 6
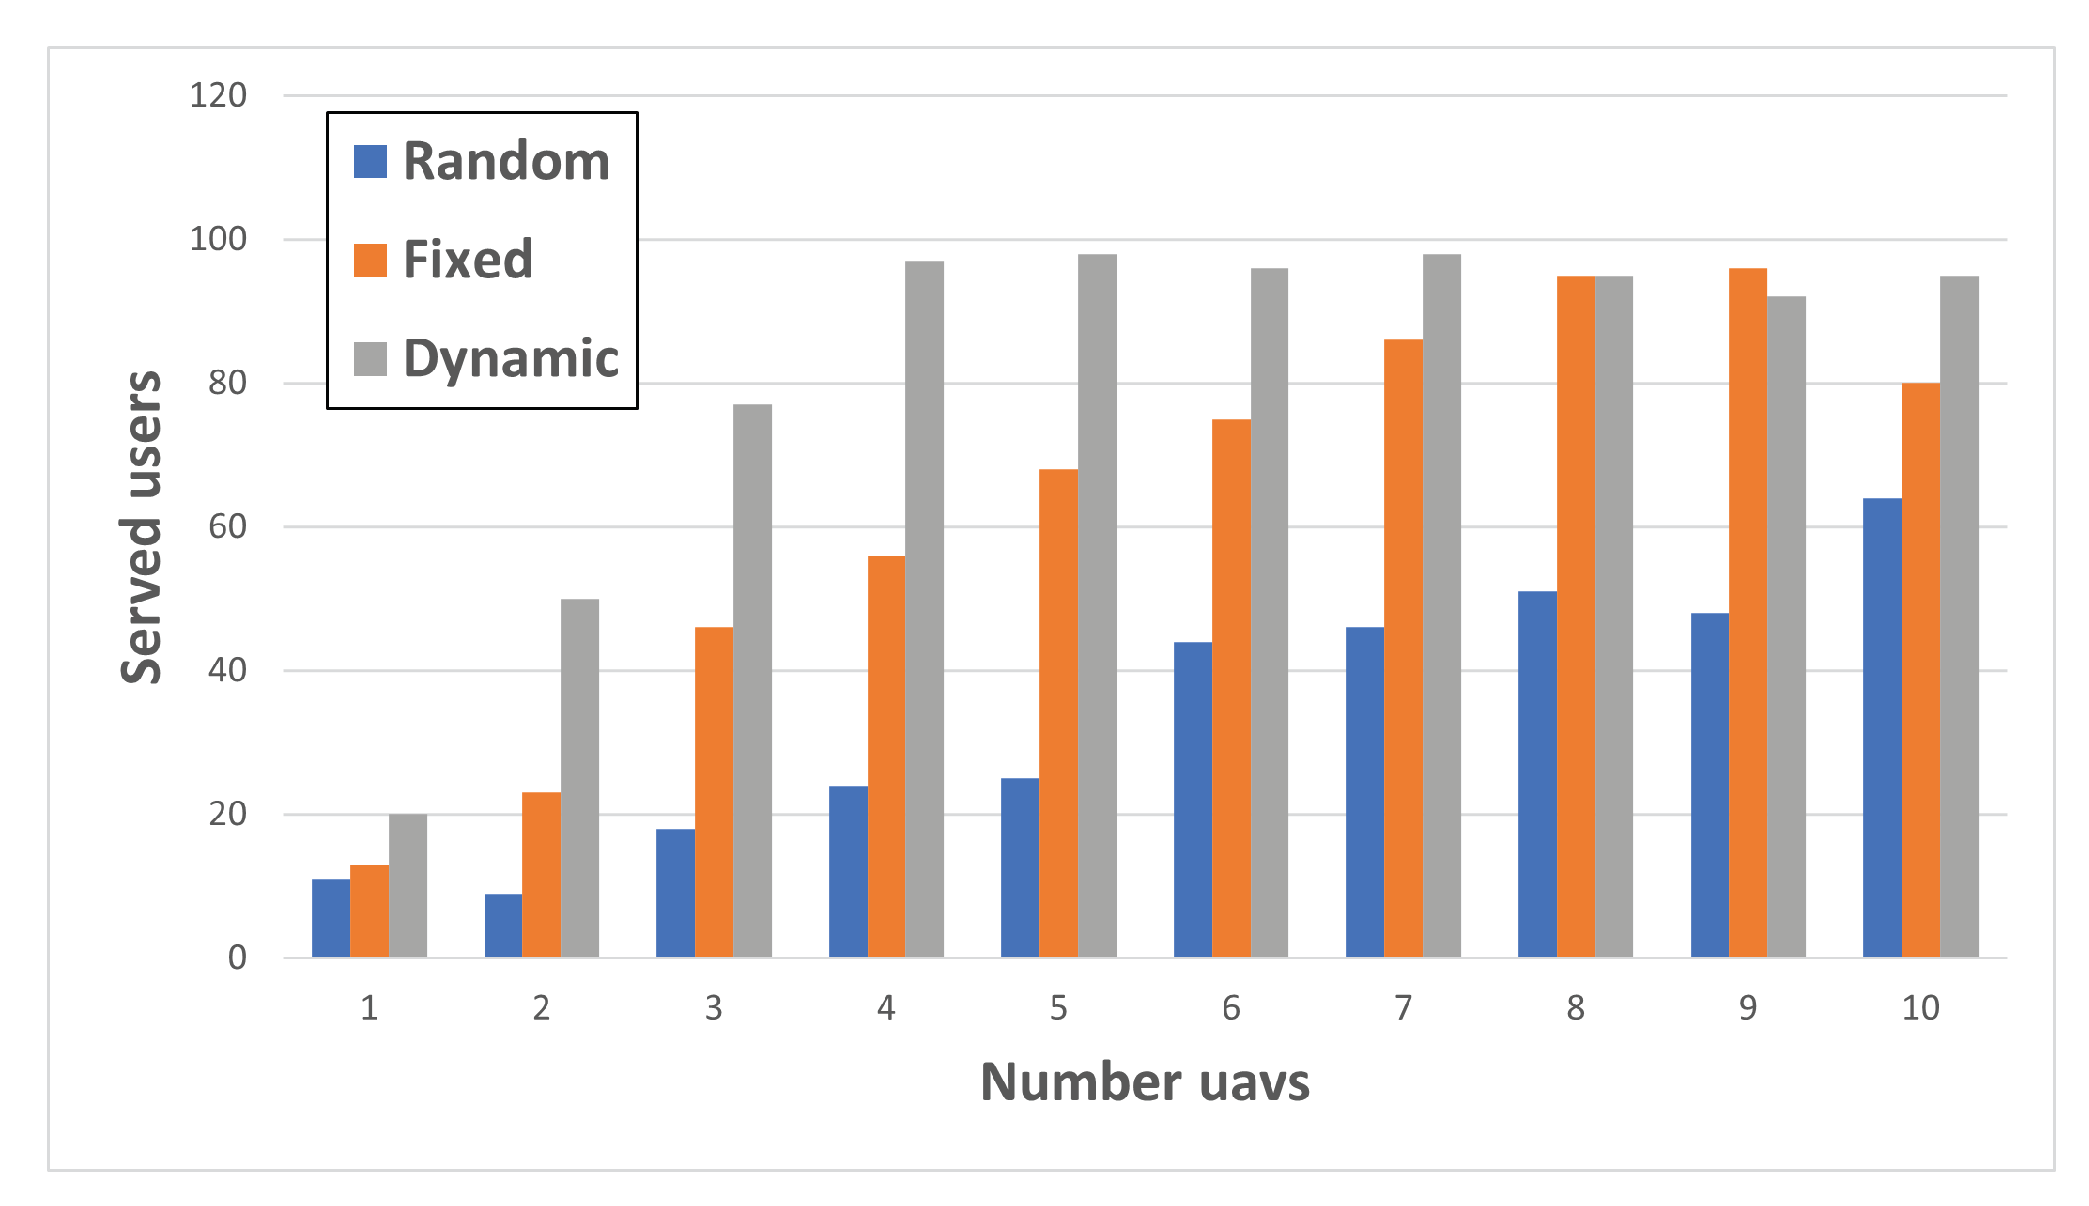
The number of users served was also compared. Note that (a) random has the worst result, failing to allocate a number of users. The (b) fixed one, although it manages to allocate almost the maximum number of users, does it in 10 steps. The best was (c) dynamic proposal, which manages to allocate the maximum number of users in the shortest computational time. Note that among the (c) dynamic, (b) fixed and (a) random strategies, it managed to provide access to 98, 96 and 64 users respectively. This is shown in the
Figure 7.
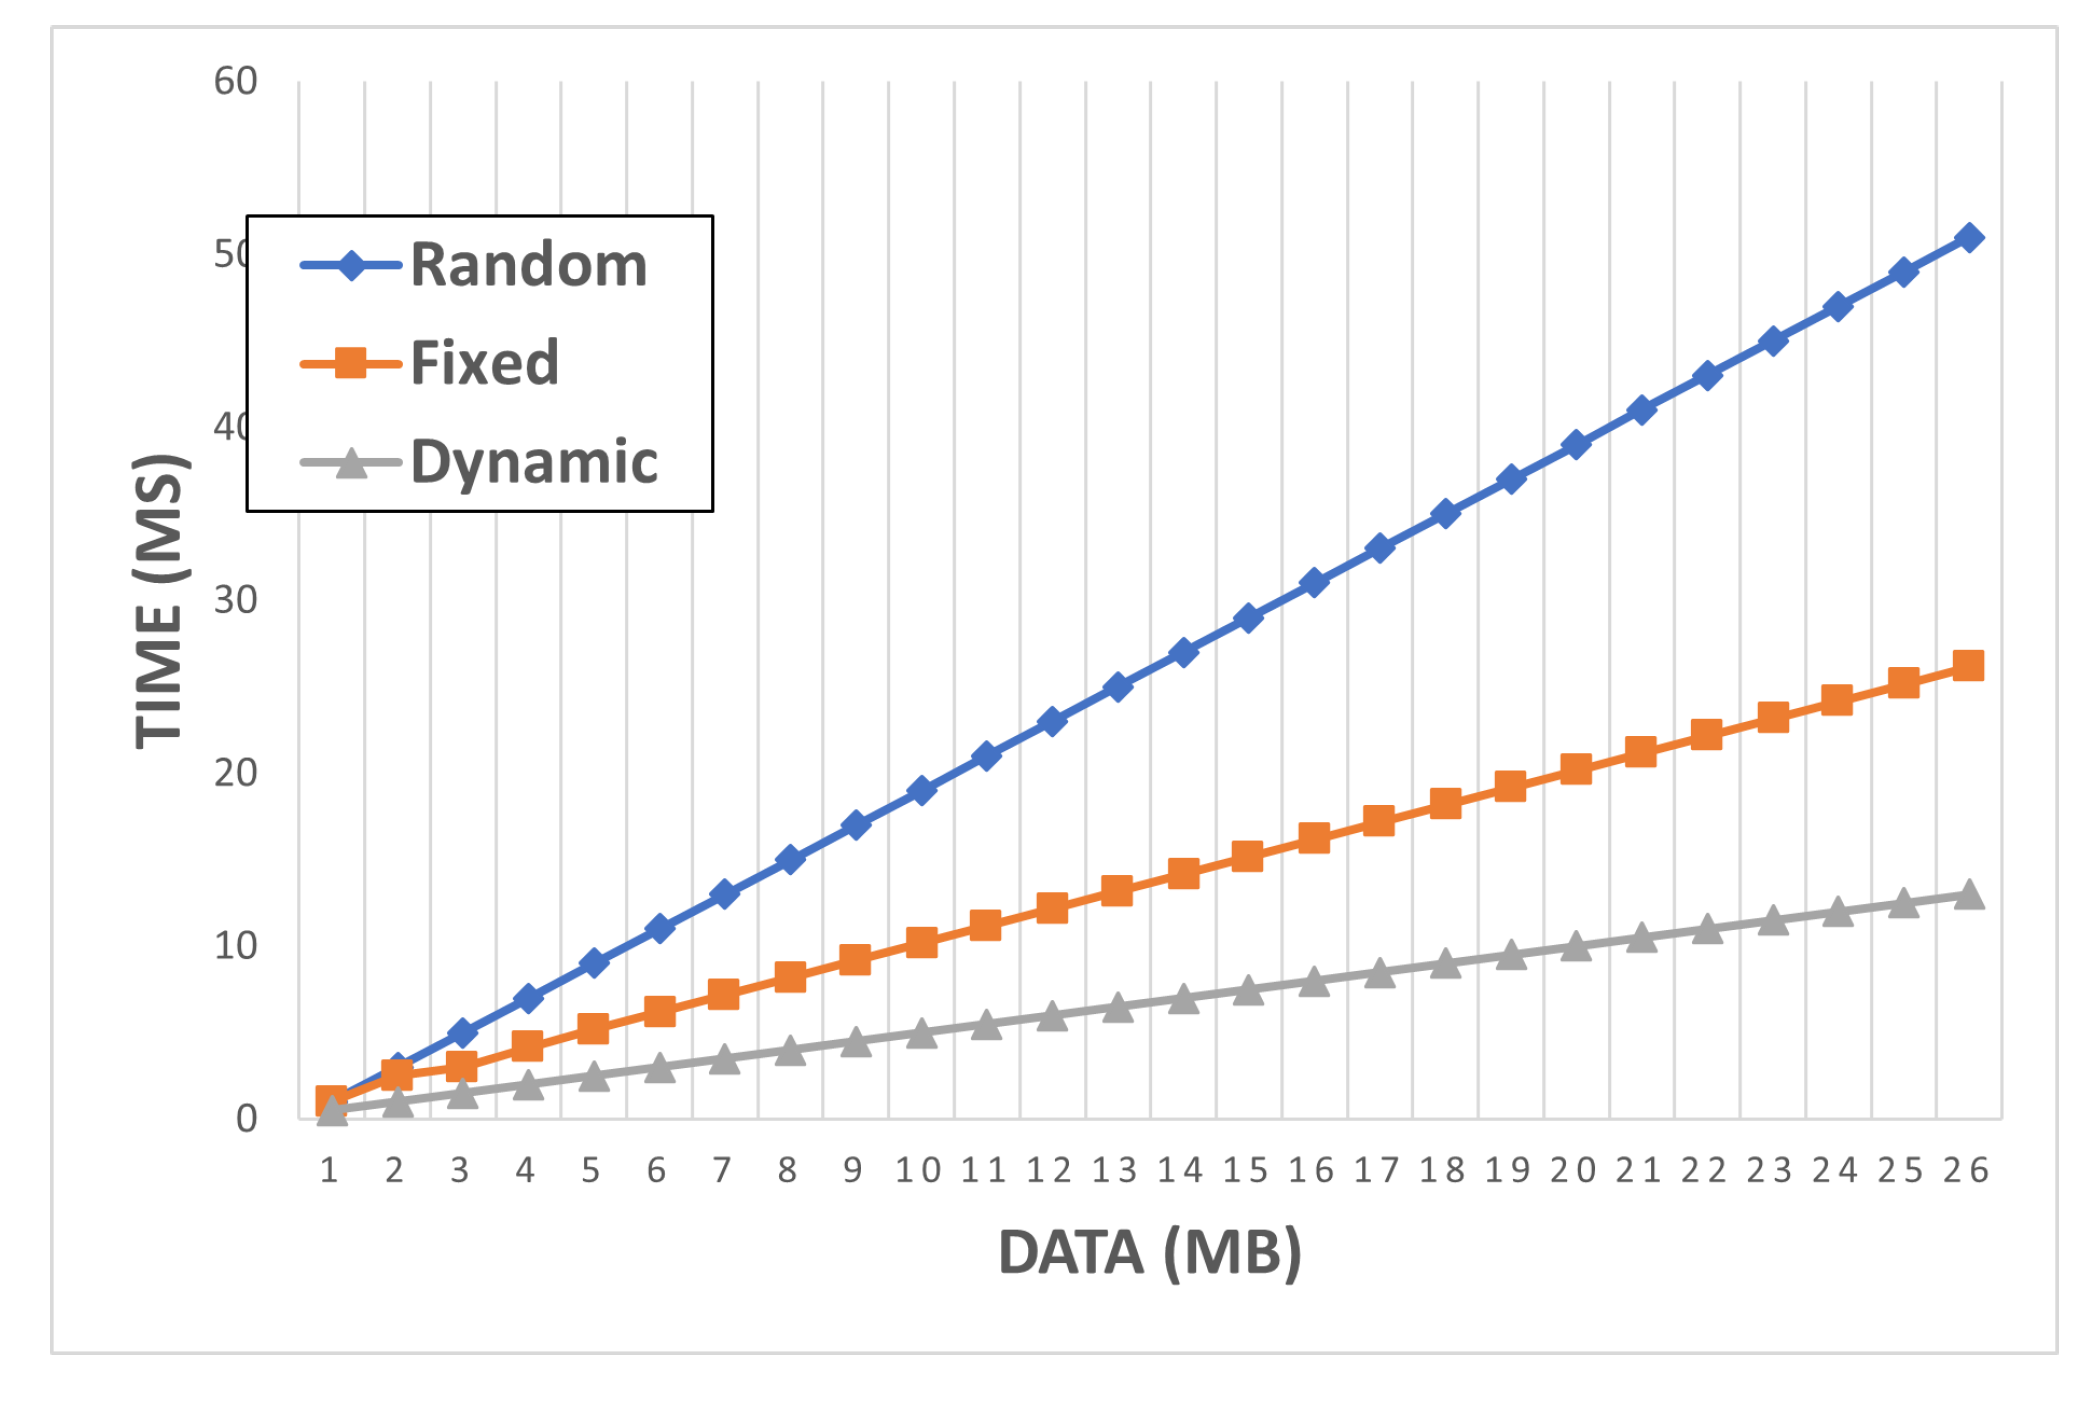
The time spent by the algorithm to find the suboptimal solution is also evaluated. Their solutions are expected to be found in polynomial time. The solutions present resolution considered OlogN. Note that among the strategies (c) dynamic, (b) fixed and (a) random, obtained computational time respectively: bad, good, excellent. This is shown in
Figure 8.
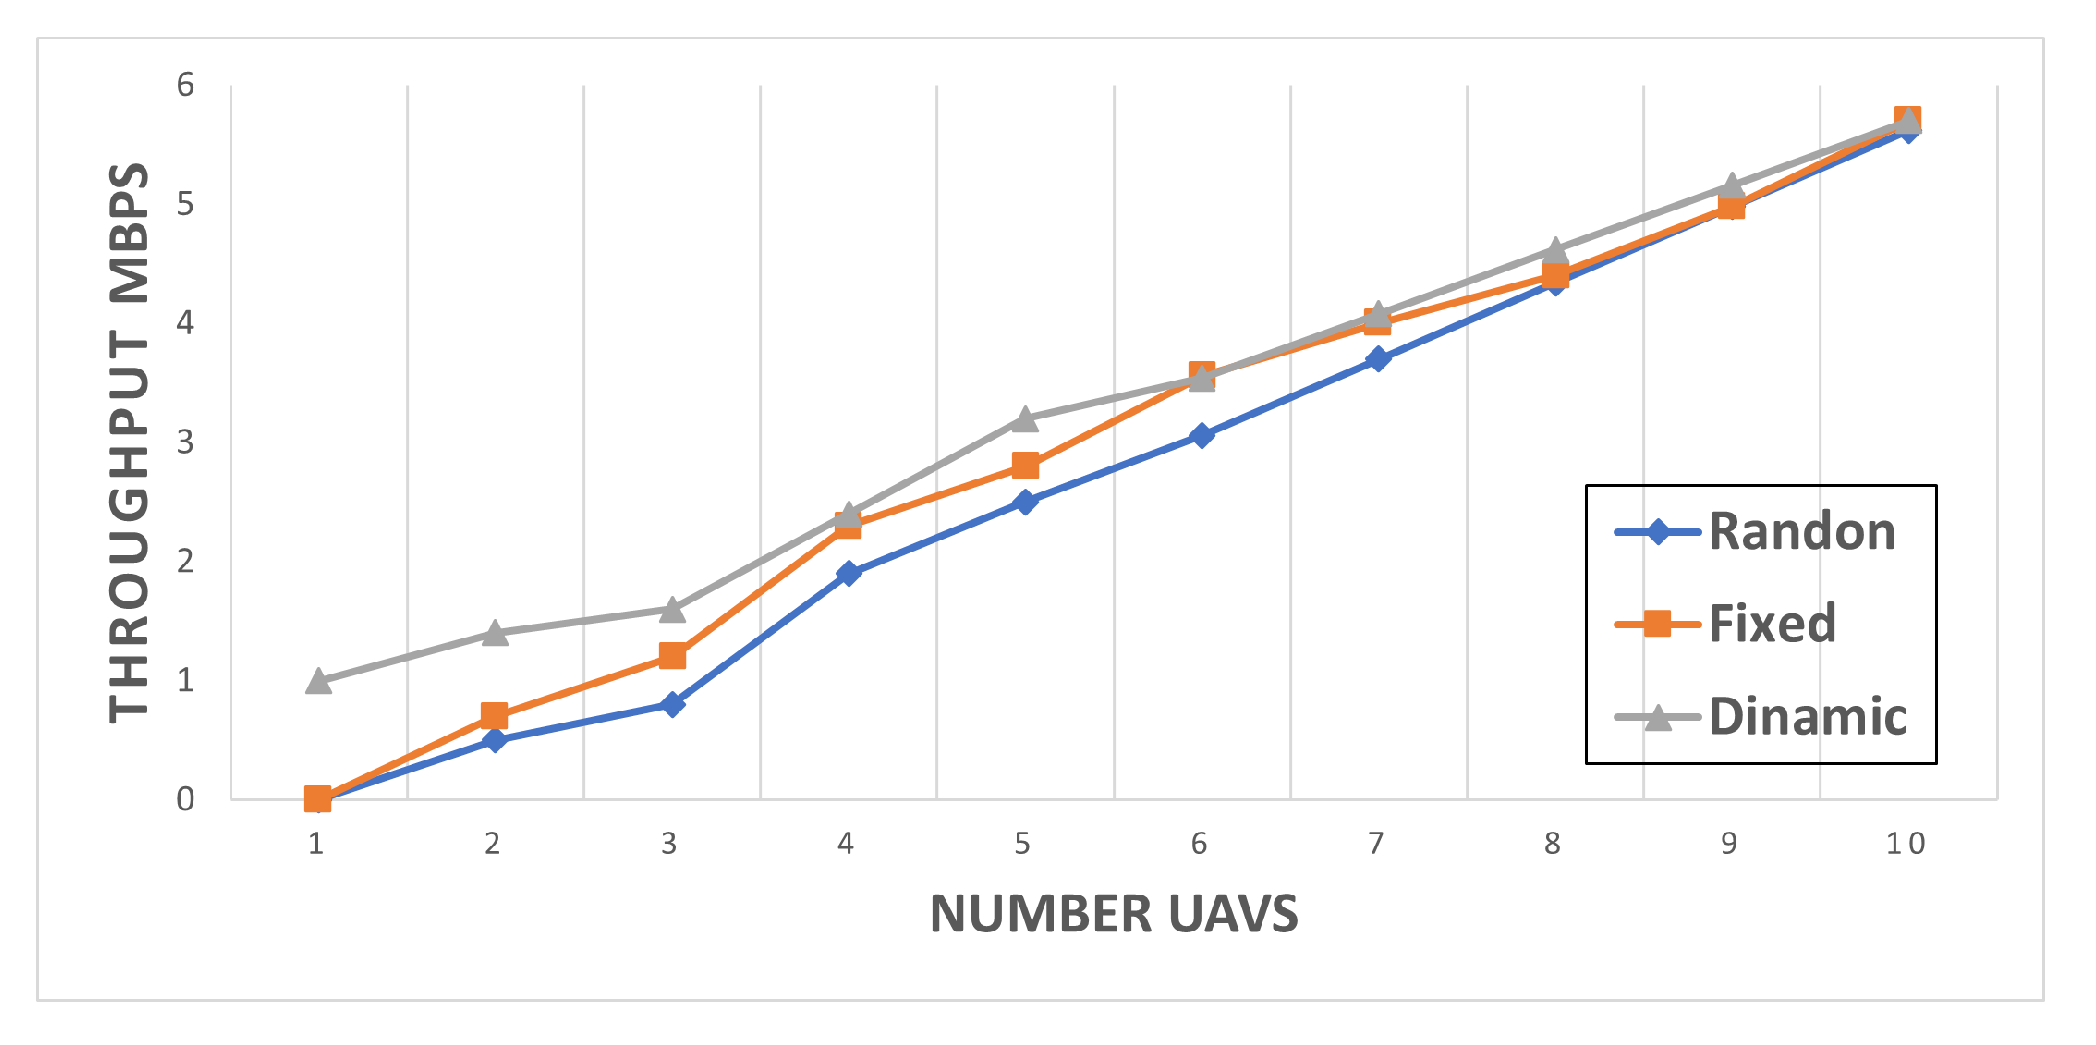
Another comparison was performed to evaluate the throughput. It was observed that the (c) dynamic strategy outperforms the (b) fixed and also the (a) random positioning in relation to the network throughput, this is shown in figure
Figure 9.
Realize that the best use of available resources, in this case the drones, causes network optimization to occur, ensuring that you have the maximum number of satisfied users with the minimum resource used. Below we have the parameters used in the positioning and allocation of UAVBS in a given scenario. Note that some are active as they managed to be serviced by a nearby drone and others that are blocked by QoS factors,
Table 3.
4.2. Energy efficiency
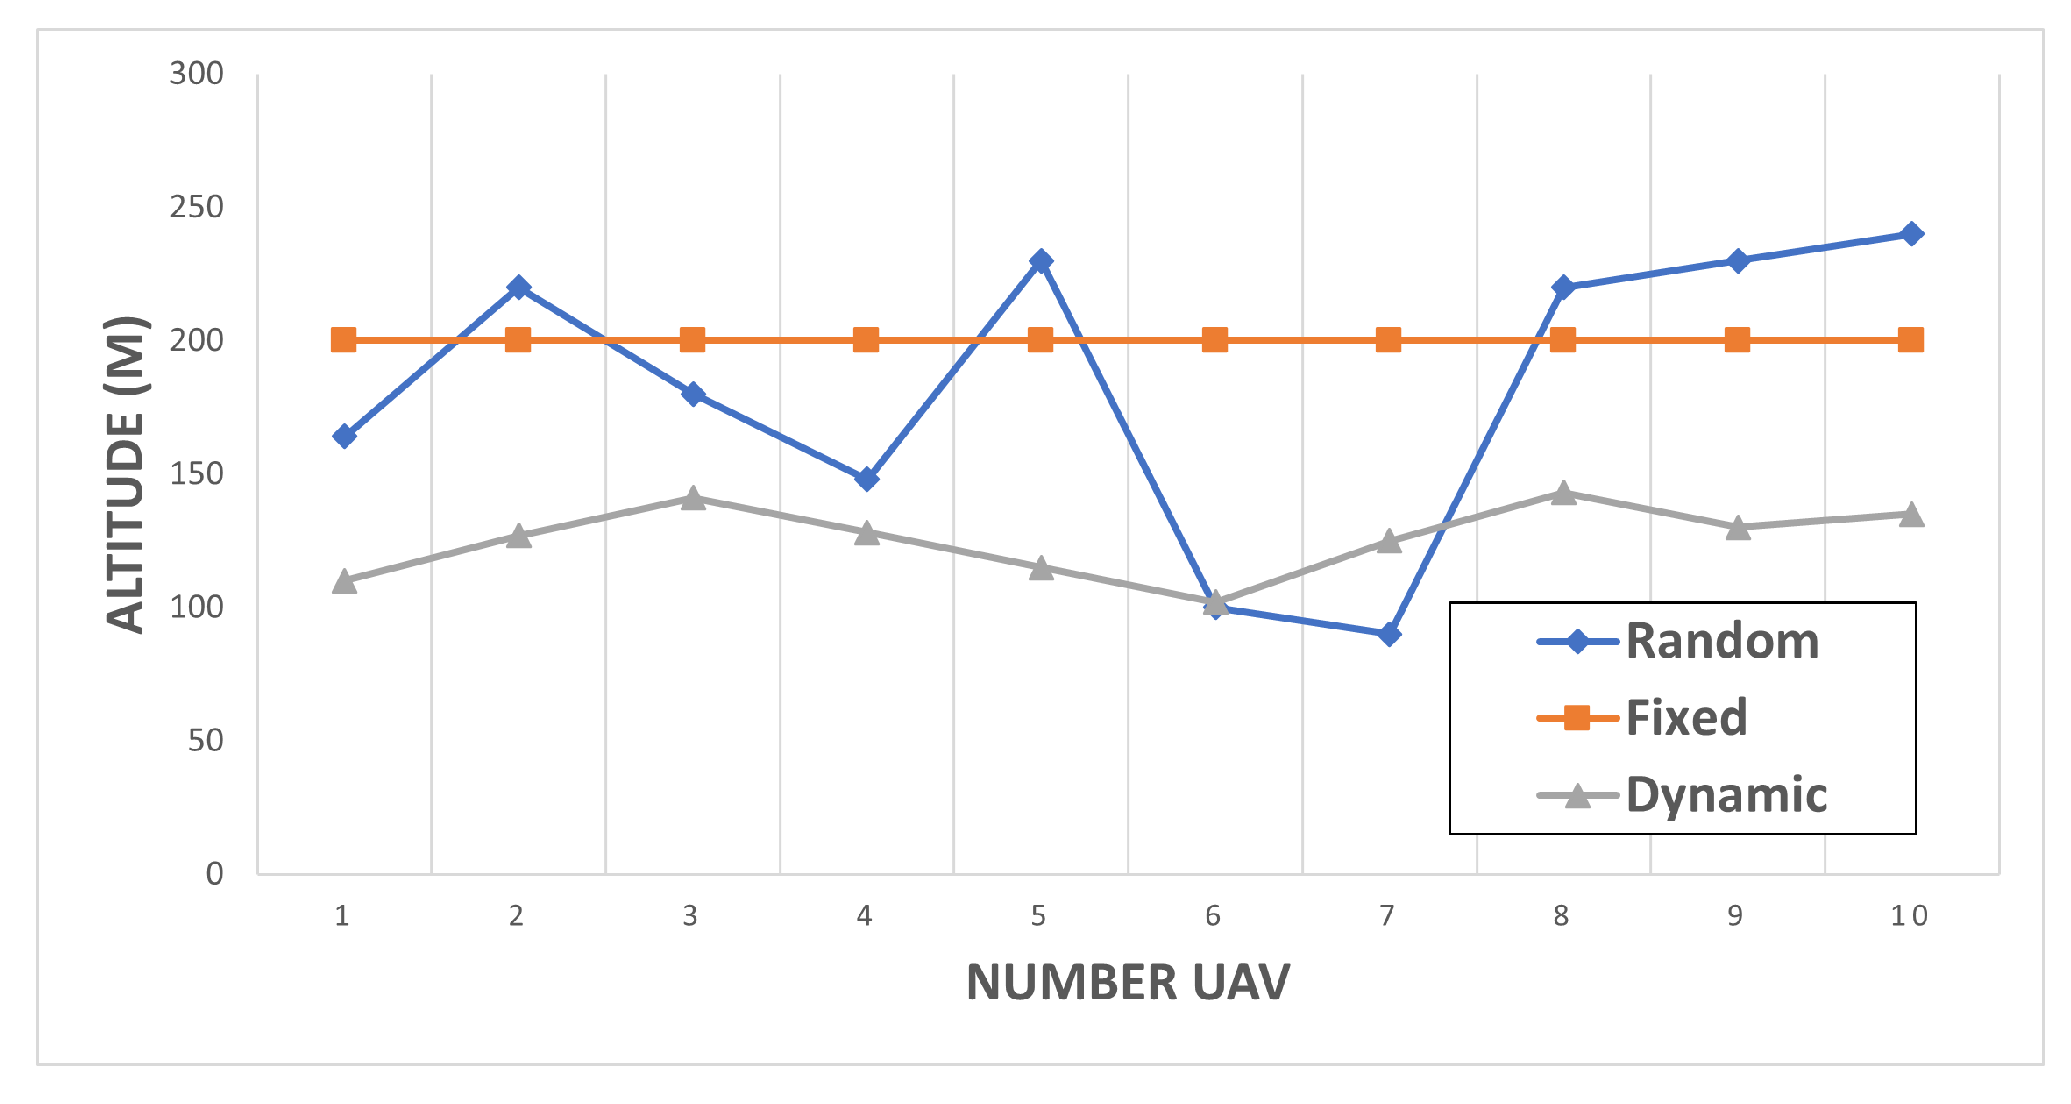
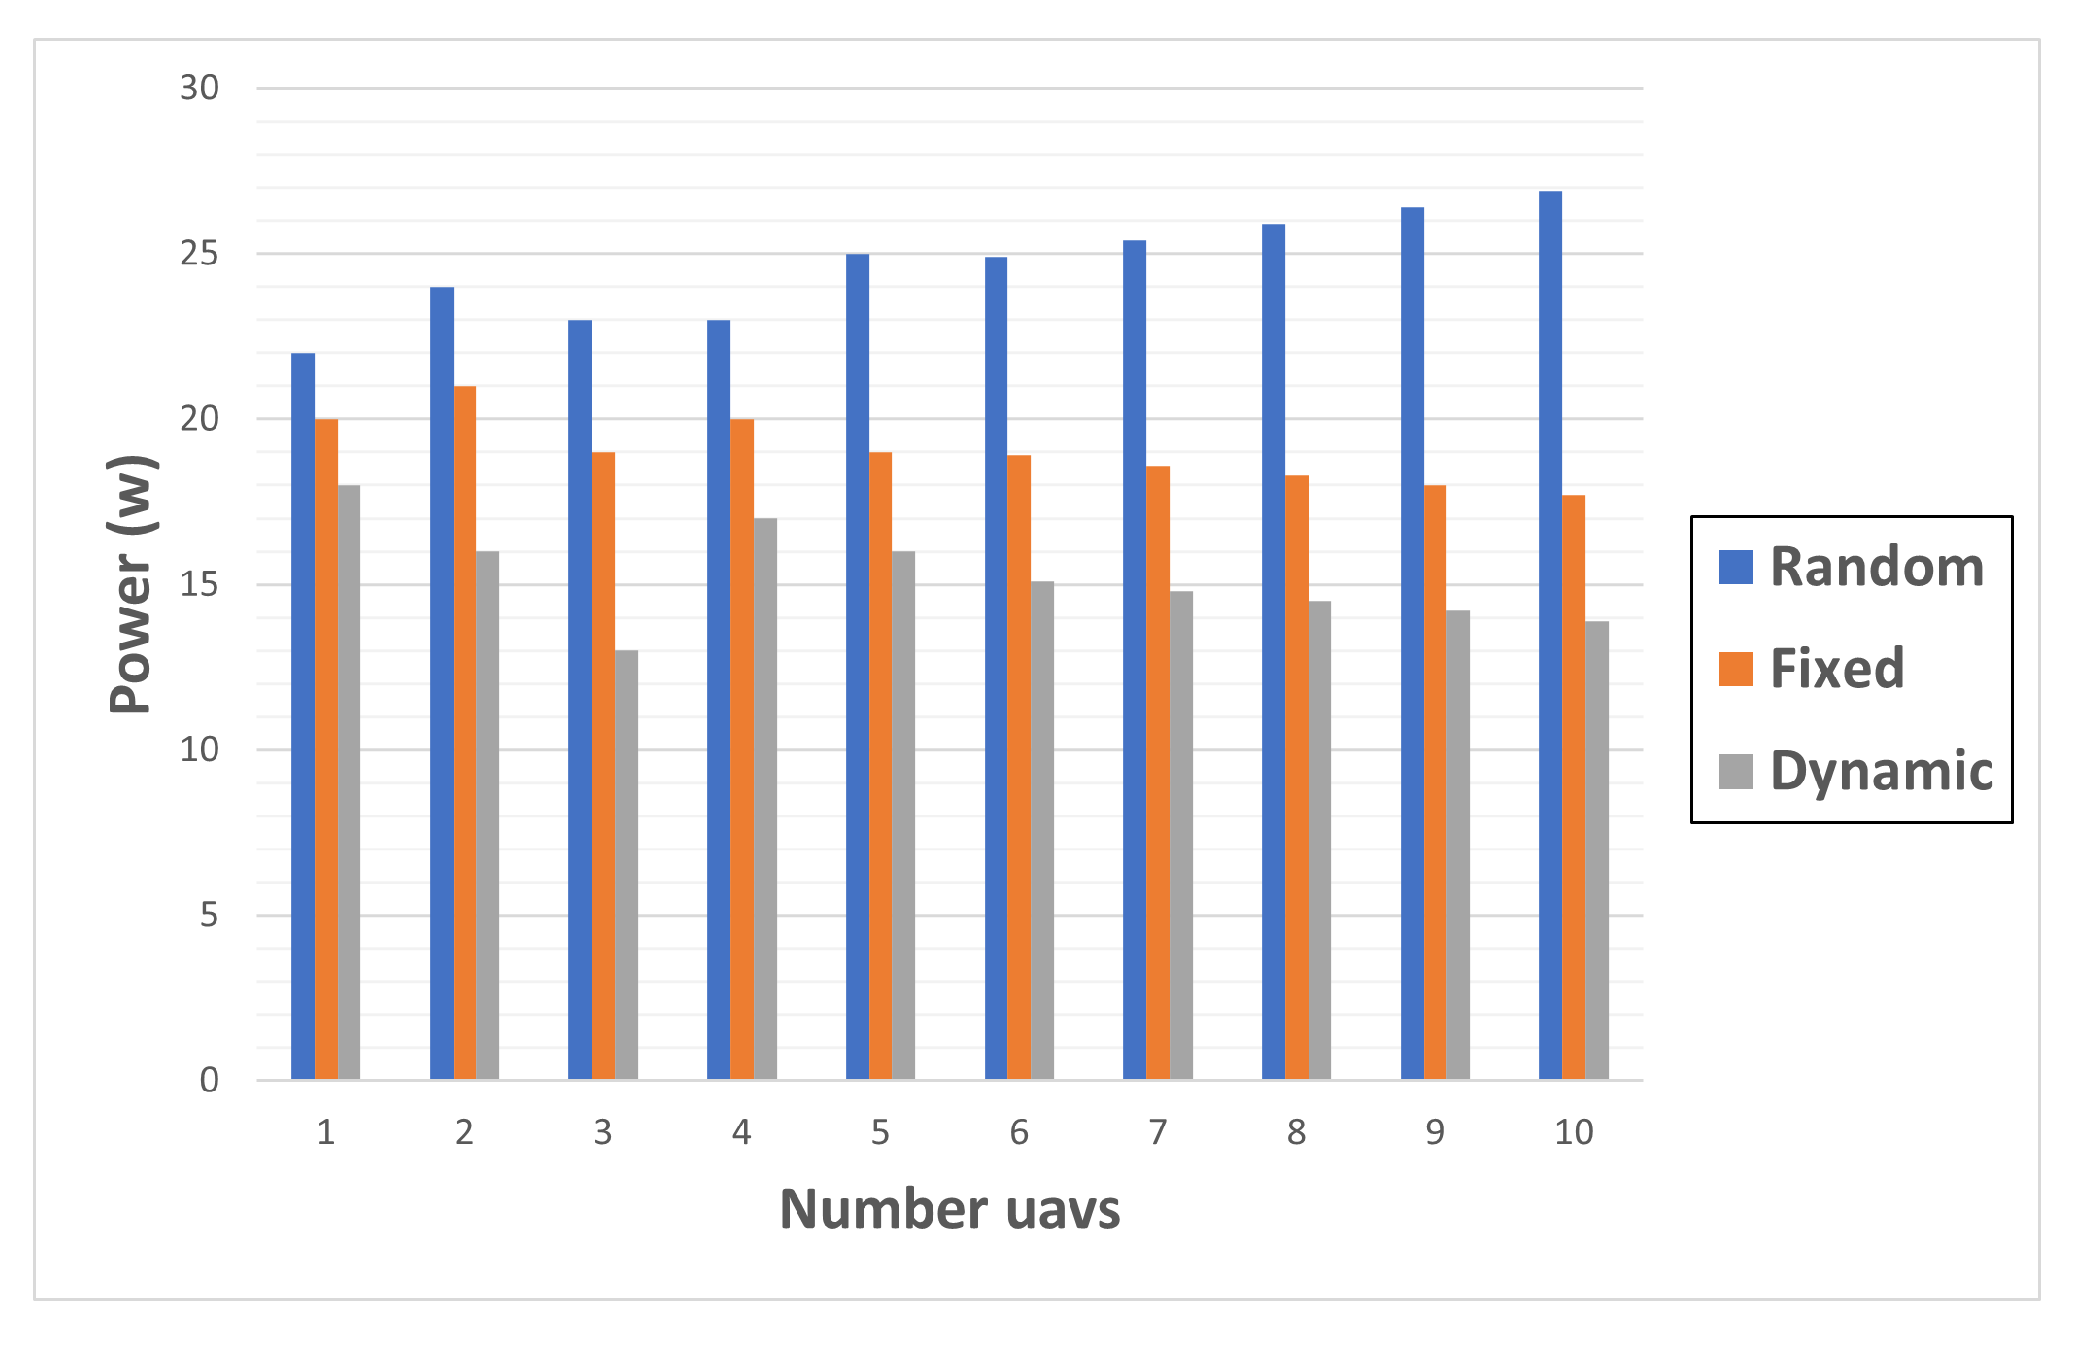
Energy consumption is compared in both strategies. The values are found separately for each UAVBS during the simulation. The total consumption of drones takes into account several parameters. Some are related to drone movements, such as: taking off to the established height, hovering over the desired point, communicating with users on the ground and landing. Others related to the environment, such as: rain, winds, altitude.
Altitude is too considered a decisive factor for energy savings in drones, as stated by [
31,
32,
33]. Below is shown the telemetry values average obtained of the altitude and battery in the flight simulation. The average altitude and energy consumption of each strategy is shown, using was using tool pydrone. This is shown in the figure
Figure 10.
Below it is possible to visualize the positioning of each uav and its energy expenditure during the simulation. Note that the dynamic strategy is better than the others. This is shown in the
Figure 11.
It is also possible to observe that the dynamic strategy was able to have a greater number of users served by the wireless network. The proposed algorithm is able to better adjust the parameters and improve the service to users. This is possible, since it manages to guarantee the maximum number of users served on the ground, using the minimum of available resources (drones).
After the simulations, the final results related to the two strategies are presented, according to Table 3.
Table 5.
Energy saving
| Random |
Fixed |
Dynamic |
| 64 % |
94% |
98% |
In this way, it is possible to save energy, since the UAVBS have better use of resources. Note that the optimized strategy achieves greater energy savings compared to the fixed strategy, a saving of 14.93 %.
4.3. 3d uavbs dynamic
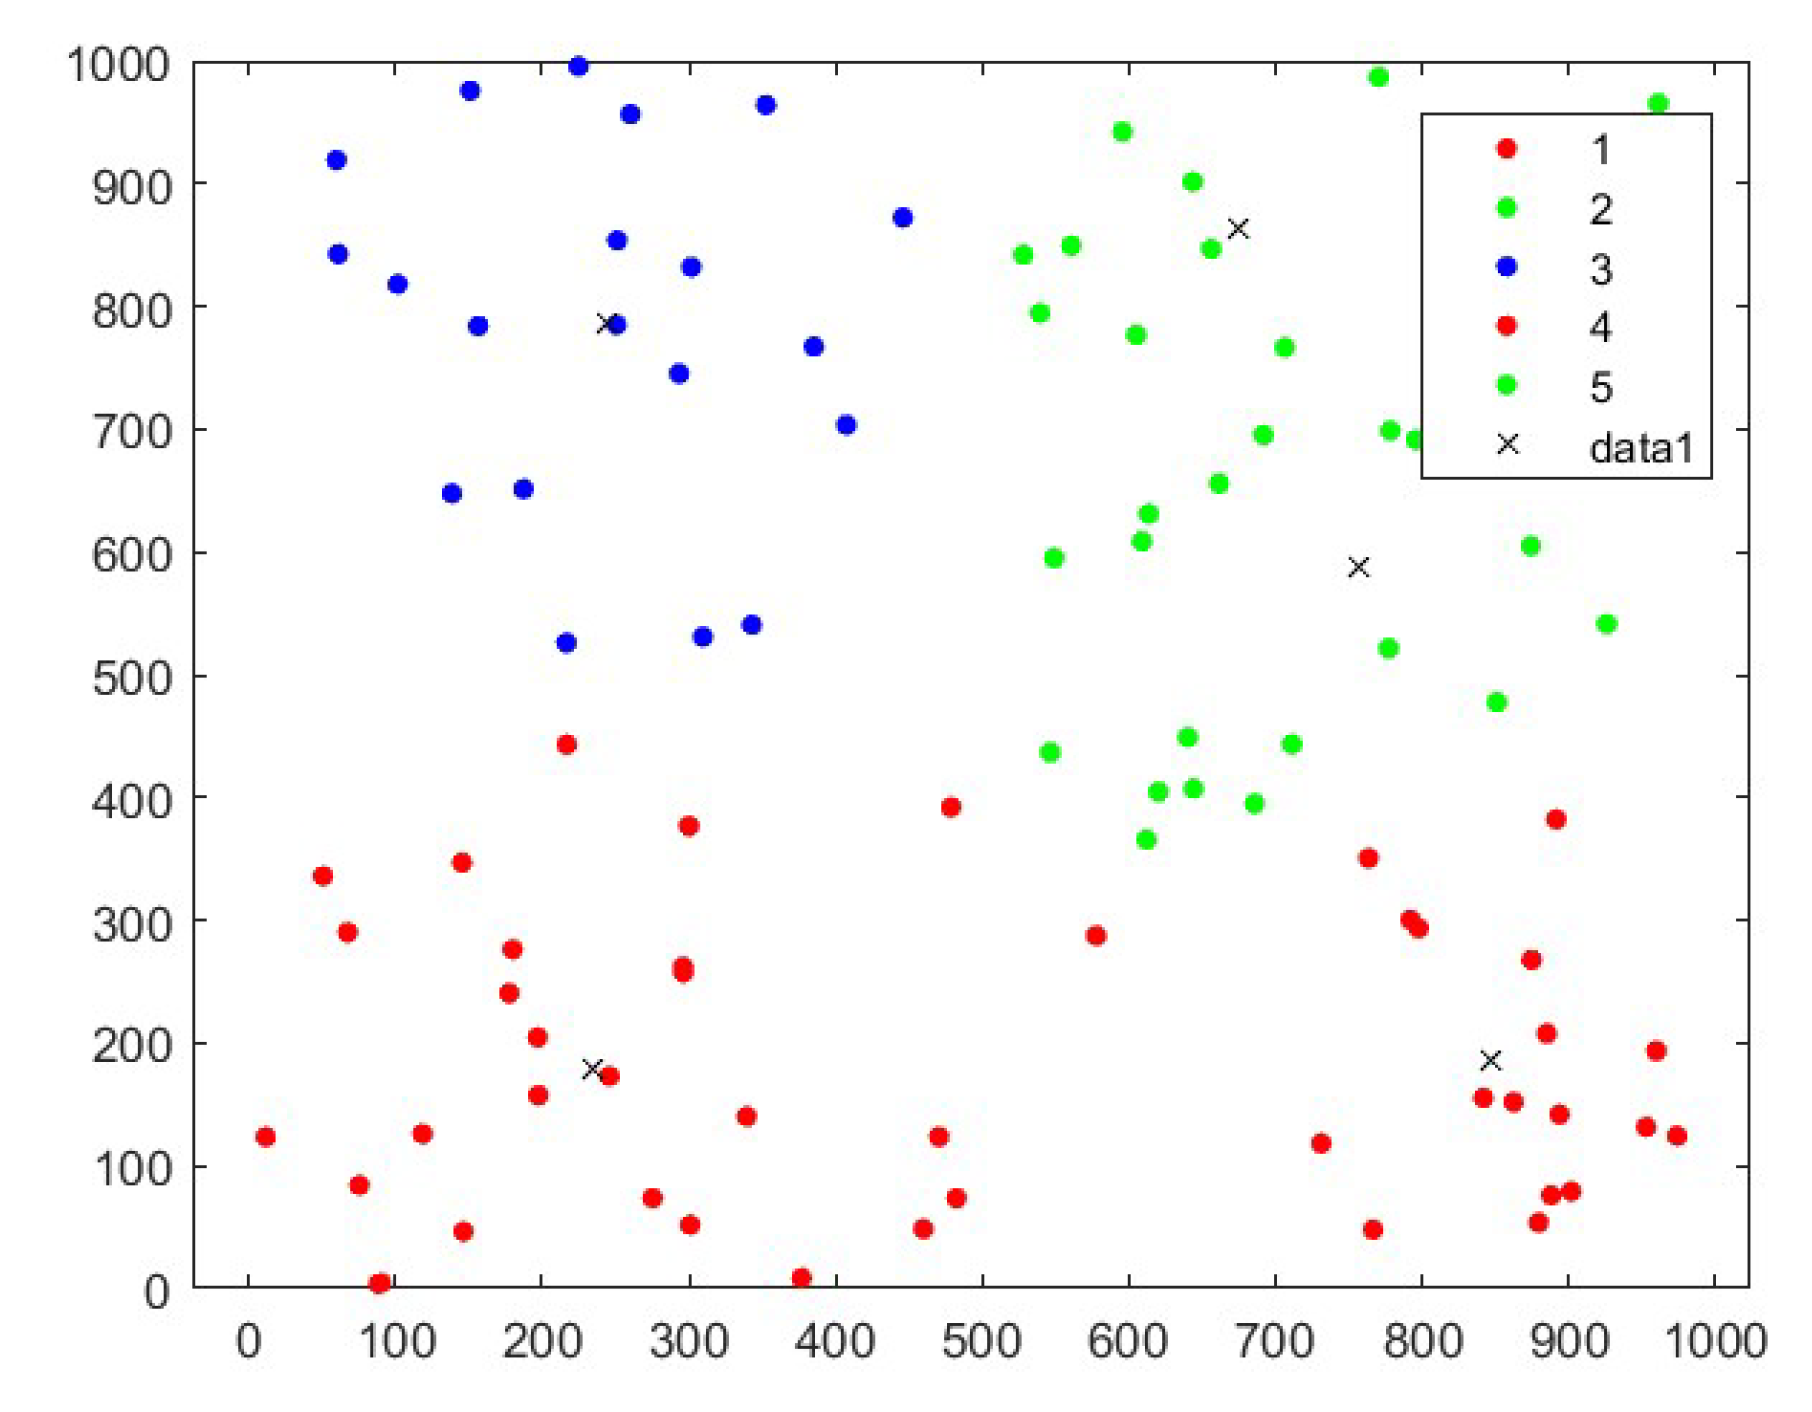
Finally, the proposed strategy dynamic was implemented with mobile users are randomly distributed in a space. The algorithm position the UAv-BS horizontally and 2d deployment of the allocation. As you can see in the
Figure 12.
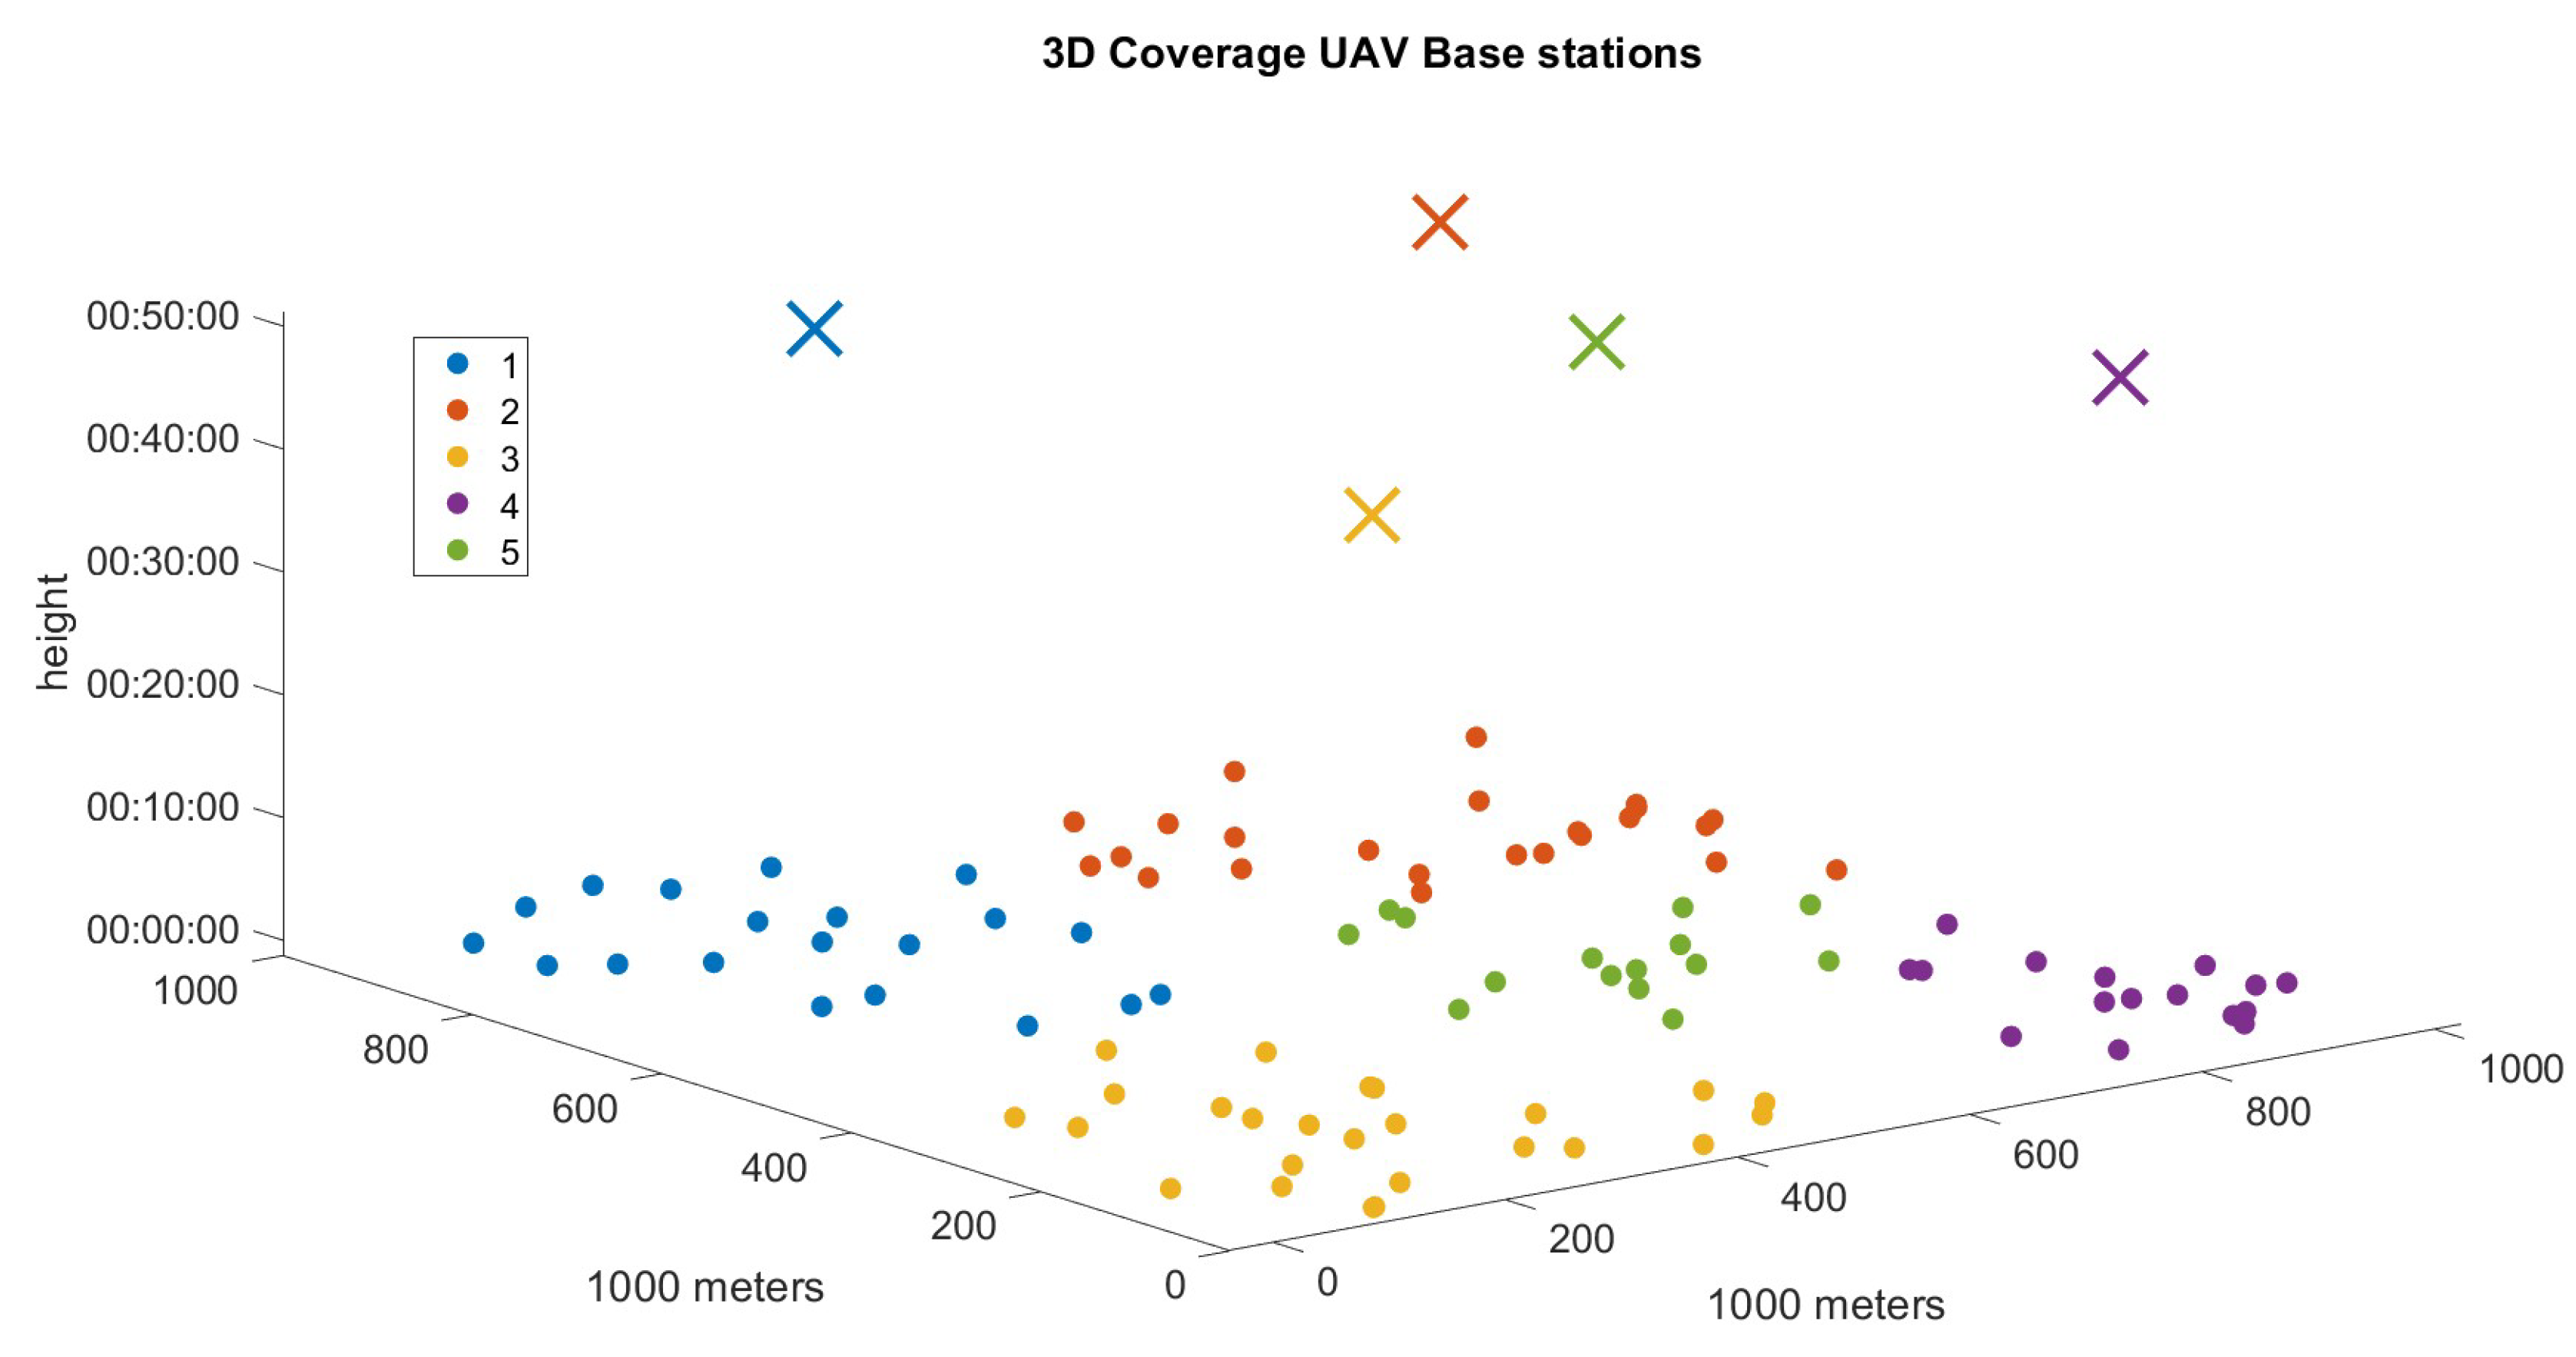
The algorithm was used to group mobile users, which allows positioning the UAVsBS. The algorithm found 05 clusters. There is a central BS that provides the backhall for the UAVs. Each UAV BS provides wireless signal to distributed users,
Figure 13.
It is possible to observe the uavs 3D flying over the mobile users in the scenarios. Note that each uavbs are numbered and have different colors. Each Uavbs is at the center of the group of its users mobiles, flying over at a certain height, radius and power signal average,
Figure 14.
5. Conclusions
In this article, a allocation of BS UAVs aiming energy savings was proposed. The numerical simulation results demonstrate that the proposed algorithm can achieve a significant improvement compared to the simple scheme. Three strategies were evaluated: random, fixed and Dynamics proposal. The algorithm dynamics proposal to find the ideal height power, coverage for multiple UAVBS. The results demonstrate that the flight time of the drones in the dynamic strategy would be greater than the others. The performance of the algorithm was evaluated. It was compared strategy the dynamic with the fixed and show energy savings of up to 14 % and that the proposed strategy was able to provide network access to 97 % of users. Model numerical demonstrate that the proposed achieved better allocation of UAVS BS to ground users and at the same time managed to save energy. A dynamic strategy is proposed to adjust the transmission power, according to altitude and coverage radius. That way consumption will be lower and you will have more flight time. To future works it will be verified if this solution is valid for other networking scenarios.
Author Contributions
Sosftware, Simulation, Methodology, Writing—review and editing, W.S.; review and editing: R. T and D. C.; Supervision. All authors have read and agreed to the published version of the manuscript. All authors have read and agreed to the published version of the manuscript.
Institutional Review Board Statement
Not applicable.
Informed Consent Statement
Not applicable
Data Availability Statement
Not applicable.
Acknowledgments
Thanks to the Federal Institute of Education, Science and Technology of Pará (IFPA) and the Operational Research Laboratory (LPO), Graduate Program in Electrical Engineering (PPGEE) at Federal University of Pará (UFPA) to supporting the research.
Conflicts of Interest
The authors declare no conflict of interest.
References
- Malkawi W, Shakhatreh H, and Musa A (2021). 3D placements of drones in a millimeter-wave network to maximize the lifetime of wireless devices. International Journal of Advanced and Applied Sciences, 8(11): 119-128.
- M. Ozturk, J. P. B. Nadas, P. H. V. Klaine, S. Hussain and M. A. Imran, "Clustering Based UAV Base Station Positioning for Enhanced Network Capacity," 2019 International Conference on Advances in the Emerging Computing Technologies (AECT), 2020, pp. 1-6. [CrossRef]
- B. Omoniwa, B. Galkin and I. Dusparic, "Energy-aware optimization of UAV base stations placement via decentralized multi-agent Q-learning," 2022 IEEE 19th Annual Consumer Communications & Networking Conference (CCNC), 2022, pp. 216-222. [CrossRef]
- N. Cherif, W. Jaafar, H. Yanikomeroglu and A. Yongacoglu, "On the Optimal 3D Placement of a UAV Base Station for Maximal Coverage of UAV Users," GLOBECOM 2020 - 2020 IEEE Global Communications Conference, Taipei, Taiwan, 2020, pp. 1-6. [CrossRef]
- K. K. Nguyen, T. Q. Duong, T. Do-Duy, H. Claussen and L. Hanzo, "3D UAV Trajectory and Data Collection Optimisation Via Deep Reinforcement Learning," in IEEE Transactions on Communications, vol. 70, no. 4, pp. 2358-2371, April 2022. [CrossRef]
- Teeluck, R., Bassoo, V. A swapping mechanism for the uninterrupted coverage of UAV base stations. J Ambient Intell Human Comput (2022). [CrossRef]
- M. Ozturk, J. P. B. Nadas, P. H. V. Klaine, S. Hussain and M. A. Imran, "Clustering Based UAV Base Station Positioning for Enhanced Network Capacity," 2019 International Conference on Advances in the Emerging Computing Technologies (AECT), 2020, pp. 1-6. [CrossRef]
- Wa’ed Malkawi *, Hazim Shakhatreh, Ahmed Musa.3D placements of drones in a millimeter-wave network to maximize the lifetime of wireless devices. Volume 8, Issue 11 (November 2021), Pages: 119-128.
- N. L. Prasad, C. A. Ekbote and B. Ramkumar, "Optimal Deployment Strategy for Relay Based UAV Assisted Cooperative Communication for Emergency Applications," 2021 National Conference on Communications (NCC), 2021, pp. 1-6. [CrossRef]
- T. M. Shami, D. Grace and A. Burr, "Load Balancing and Control Using Particle Swarm Optimisation in 5G Heterogeneous Networks," 2018 European Conference on Networks and Communications (EuCNC), 2018, pp. 1-9. [CrossRef]
- T. M. Shami, D. Grace and A. Burr, "Load Balancing and Control Using Particle Swarm Optimisation in 5G Heterogeneous Networks," 2018 European Conference on Networks and Communications (EuCNC), 2018, pp. 1-9. [CrossRef]
- X. Zhang, Q. Zhu and H. V. Poor, "Average Coverage Probability for Base-Station-to-UAV Communications Over 6G Multiple Access Wireless Networks," 2022 IEEE International Symposium on Information Theory (ISIT), 2022, pp. 748-753. [CrossRef]
- Tehrani, Kayvan & Zhang, Yiwen & Shen, Ping & Kner, Peter. (2017). Adaptive optics stochastic optical reconstruction microscopy (AO-STORM) by particle swarm optimization. Biomedical Optics Express. 8. 5087. [CrossRef]
- https://www.mathworks.com/help/stats/kmeans.html.
- K. P. Sinaga and M. -S. Yang, "Unsupervised K-Means Clustering Algorithm," in IEEE Access, vol. 8, pp. 80716-80727, 2020. [CrossRef]
- Z. Shiye, O. Kaoru , D. Mianxiong. UAV Base Station Trajectory Optimization Based on Reinforcement Learning in Post-disaster Search and Rescue Operations. arXiv, 2022. [CrossRef]
- H. Huang and A. V. Savkin, "Deployment of Heterogeneous UAV Base Stations for Optimal Quality of Coverage," in IEEE Internet of Things Journal, vol. 9, no. 17, pp. 16429-16437, 1 Sept.1, 2022. [CrossRef]
- Teeluck, R., Bassoo, V. A swapping mechanism for the uninterrupted coverage of UAV base stations. J Ambient Intell Human Comput (2022). [CrossRef]
- Z. Yang, C. Pan, K. Wang and M. Shikh-Bahaei, "Energy Efficient Resource Allocation in UAV-Enabled Mobile Edge Computing Networks," in IEEE Transactions on Wireless Communications, vol. 18, no. 9, pp. 4576-4589, Sept. 2019. [CrossRef]
- Silva M.V. ; Kasmaei M. P. ; Mantovani J.R.S. "Development of a convex programming model for the optimal power flow problem". Proceedings of the Brazilian Symposium on Operational Research". Proceedings of the Brazilian Symposium on Operational Research, 2018,Rio de Janeiro. Electronic analytics. Campinas, Galoá, 2018.
- Y. Shi, R. Enami, J. Wensowitch and J. Camp, "Measurement-based characterization of LOS and NLOS drone-to-ground channels," 2018 IEEE Wireless Communications and Networking Conference (WCNC), Barcelona, Spain, 2018, pp. 1-6. [CrossRef]
- A. Al-Hourani and K. Gomez, "Modeling Cellular-to-UAV Path-Loss for Suburban Environments," in IEEE Wireless Communications Letters, vol. 7, no. 1, pp. 82-85, Feb. 2018. [CrossRef]
- N. H. Z. Lim, Y. L. Lee, M. L. Tham, Y. C. Chang, A. G. H. Sim and D. Qin, "Coverage Optimization for UAV Base Stations using Simulated Annealing," 2021 IEEE 15th Malaysia International Conference on Communication (MICC), Malaysia, 2021, pp. 43-48. [CrossRef]
- M. Javidsharifi, H. P. Arabani, T. Kerekes, D. Sera and J. M. Guerrero, "PV-Powered Base Stations Equipped by UAVs in Urban Areas," 2022 IEEE 96th Vehicular Technology Conference (VTC2022-Fall), London, United Kingdom, 2022, pp. 1-4. [CrossRef]
- Q. Zhu and J. Zheng, "Coverage Recovery Analysis of UAV Base Station Networks," GLOBECOM 2020 - 2020 IEEE Global Communications Conference, Taipei, Taiwan, 2020, pp. 1-6. [CrossRef]
- Z. Xiao, H. Dong, L. Bai, D. O. Wu and X. -G. Xia, "Unmanned Aerial Vehicle Base Station (UAV-BS) Deployment With Millimeter-Wave Beamforming," in IEEE Internet of Things Journal, vol. 7, no. 2, pp. 1336-1349, Feb. 2020. [CrossRef]
- Li, T.; Mao, M.; Xu, M.; He, Y.; Feng, Y.; Shi, R. IRS-Based UAV-Assisted Low-Altitude Passive Relaying: SER Performance Analysis of Optimal Deployment. Electronics 2022, 11, 3306. [CrossRef]
- Li, T.; Mao, M.; Xu, M.; He, Y.; Feng, Y.; Shi, R. IRS-Based UAV-Assisted Low-Altitude Passive Relaying: SER Performance Analysis of Optimal Deployment. Electronics 2022, 11, 3306. [CrossRef]
- E. Kalantari, H. Yanikomeroglu, and A. Yongacoglu, On the Number and 3D Placement of Drone Base Stations in Wireless Cellular Networks, arXiv [cs.NI]. 2018.
- N. Cherif, W. Jaafar, H. Yanikomeroglu, and A. Yongacoglu, On the Optimal 3D Placement of a UAV Base Station for Maximal Coverage of UAV Users, arXiv [eess.SP]. 2020.
- Zhang, Ting & Yang, Zheng & Li, Bin & Wu, Yi. (2020). Altitude and number optimization for UAV-enabled wireless communications. IET Communications. 14. [CrossRef]
- Dhulkefl, Elaf & Durdu, Akif. (2019). Path Planning Algorithms for Unmanned Aerial Vehicles. International Journal of Trend in Scientific Research and Development. Volume-3. 359-362. [CrossRef]
- Tseng, Chien-Ming & Chau, Chi-Kin & Elbassioni, Khaled & Khonji, Majid. (2017). Flight Tour Planning with Recharging Optimization for Battery-operated Autonomous Drones.
- Umair, M., Joung, J. and Cho, Y.S. (2020), Transmission power and altitude design for energy-efficient mission completion of small-size unmanned aerial vehicle. Electron. Lett., 56: 1219-1222. [CrossRef]
- Tatar Mamaghani, Milad & Hong, Yi. (2019). On the Performance of Low-Altitude UAV-Enabled Secure AF Relaying with Cooperative Jamming and SWIPT. IEEE Access. 7. 1-1. [CrossRef]
- A. Fotouhi, M. Ding and M. Hassan, "Flying Drone Base Stations for Macro Hotspots," in IEEE Access, vol. 6, pp. 19530-19539, 2018. [CrossRef]
- J. Li, D. Lu, G. Zhang, J. Tian and Y. Pang, "Post-Disaster Unmanned Aerial Vehicle Base Station Deployment Method Based on Artificial Bee Colony Algorithm," in IEEE Access, vol. 7, pp. 168327-168336, 2019. [CrossRef]
|
Disclaimer/Publisher’s Note: The statements, opinions and data contained in all publications are solely those of the individual author(s) and contributor(s) and not of MDPI and/or the editor(s). MDPI and/or the editor(s) disclaim responsibility for any injury to people or property resulting from any ideas, methods, instructions or products referred to in the content. |
© 2023 by the authors. Licensee MDPI, Basel, Switzerland. This article is an open access article distributed under the terms and conditions of the Creative Commons Attribution (CC BY) license (http://creativecommons.org/licenses/by/4.0/).
