
Submitted:
23 August 2023
Posted:
25 August 2023
You are already at the latest version
Abstract
Postprandial hyperlipidemia showing postprandial increase in serum triglyceride (TG) is atherogenic and associated with the development of coronary artery disease (CAD). To diagnose postprandial hyperlipidemia, the oral fat loading test (OFLT) should be performed, however, this test is very time-consuming and is difficult to perform. Ele-vated serum TG levels reflect an increase in TG-rich lipoproteins (TRL) such chylomi-crons (CM), very low-density lipoproteins (VLDL) and their remnants (CM remnant [CMR] and VLDL remnant [VLDLR]). Understanding of elevation in CMR and/or VLDLR can lead us to understand the existence of postprandial hyperlipidemia. The measurements of apo B48 which is a constituent of CM and CMR, non-fasting TG which includes TG content in all lipoproteins including CM and CMR, non-high-density lipoprotein-cholesterol (non-HDL-C) which includes TRL and low-density lipoprotein, and remnant cholesterol, are useful to suspect the existence of postprandial hyperlipidemia. Postprandial hyperlipidemia is observed in patients with familial type III hyperlipoproteinemia, familial combined hyperlipidemia, chronic kidney disease, metabolic syndrome and type 2 diabetes. Postprandial hyperlipidemia is closely related to postprandial hyperglycemia, and insulin resistance may be an in-ducing and enhancing factor for both postprandial hyperlipidemia and postprandial hyperglycemia. Remnant lipoproteins and metabolic disorders associated with post-prandial hyperlipidemia have various atherogenic properties such as induction of in-flammation and endothelial dysfunction. A healthy diet, calorie restriction, weight loss and exercise, positively impact postprandial hyperlipidemia. Anti-hyperlipidemic drugs such pemafibrate, bezafibrate, ezetimibe and eicosapentaenoic acid have shown to improve postprandial hyperlipidemia. Anti-diabetic drugs including metformin, alpha-glucosidase inhibitors, pioglitazone, dipeptidyl-peptidase-4 inhibitors and glu-cagon like peptide 1 analogues, have shown to ameliorate postprandial hyperlipidemia. Although sodium glucose cotransporter-2 inhibitors have not been proven to reduce postprandial hyperlipidemia, they reduced fasting apo B48 and remnant lipoprotein cholesterol. In conclusion, it is important to appropriately understand the existence of postprandial hyperlipidemia and to connect it to optimal treatments.
Keywords:
apo B48
; cardiovascular disease
; insulin resistance
; postprandial hyperlipidemia
; remnant cholesterol
; small-dense LDL
1. Introduction
Postprandial serum triglyceride (TG) fluctuates greatly depending on the content of the meal and the time elapsed after the meal. Therefore, postprandial blood sampling results in higher TG levels than in the fasting state, making it difficult to diagnose dyslipidemia. For this reason, fasting TG values have been evaluated as the definition of dyslipidemia for a long time. Since Zilversmit pointed out the relationship between postprandial hyperlipidemia and atherosclerosis in 1979, an attention has been paid to postprandial hyperlipidemia [1]. Several studies which compared patients who had coronary artery disease (CAD) with controls have demonstrated a significant elevation in postprandial TG after an oral fat loading test (OFLT) in CAD patients [2], and that the postprandial TG concentration was an independent predictor of CAD in multivariate analysis [3]. To diagnose postprandial hyperlipidemia, the OFLT should be performed, however, there is no consensus about the time at which the study should start such as the postprandial test begin in the morning, or in the afternoon, or at night [3,4,5,6]. This test is very time-consuming, and is difficult to perform. In healthy participants, serum TG levels reach at peak at 3-4 hours after the meal and slowly return to initial levels at 6-8 hours after the meal [7], therefore, the bed rest over 6 hours is required [8]. The energy and fat load are high in the OFLT, making the study of postprandial hyperlipidemia using the OFLT a very non-physiologic situation. In addition, such energy and fat overload cause nausea, vomiting, and diarrhea in subjects. Therefore, a method to appropriately evaluate the postprandial hyperlipidemia without using the OFLT has been expected.
Serum TG levels are known to be a surrogate for TG-rich lipoproteins (TRL) such chylomicrons (CM), very low-density lipoproteins (VLDL) and their remnants. TRL are significantly increased in the postprandial plasma and are known to predict the risk of CAD [9,10], independent of elevated low-density lipoprotein-cholesterol (LDL-C) or reduced high-density lipoprotein-cholesterol (HDL-C).
Zilversmit first proposed that the postprandial CM is the most common risk factor for atherogenesis in persons who do not have familial hyperlipoproteinemia [1]. CM and CM remnant (CMR) have been thought to be the major lipoproteins in the postprandial hyperlipidemia until recently. Studies using an immune-separation method which enables the direct isolation of remnant lipoproteins as remnant-like lipoprotein particles (RLP) from the postprandial plasma demonstrated that the major remnant lipoproteins associated with postprandial hyperlipidemia are not CMR, but VLDL remnant (VLDLR) [11,12].
CMR and VLDLR have multiple atherogenic properties and increased concentrations of remnant cholesterol were associated with increased all-cause mortality in patients with ischemic heart disease and the development of CAD, after adjusting for other major risk factors [13].
Here, we discuss on diagnosis, causative diseases, mechanisms to develop, atherogenic properties and the therapeutic approaches for postprandial hyperlipidemia.
2. Evaluation of Postprandial Hyperlipidemia
2.1. OFLT
Masuda, D. et al. studied the effect of ezetimibe which inhibits the Niemann-Pick C1-Like 1 (NPC1L1) protein, an intestinal cholesterol transporter, on postprandial hyperlipidemia in patients with type IIb hyperlipidemia, by performing OFLT [14]. After an overnight fast for 12 hours, OFLT cream which was prepared from milk and adjusted to contain 35% fat without sugar (JOMO Foods, Gunma, Japan) was loaded to each patient sufficient to provide a fat load of 30 g fat/m2 (body surface area). Blood samples were drawn before and 1, 2, 3, 4, 6 and 8 hours after OFL and concentrations of total cholesterol (TC), TG, apo B48, free fatty acid (FFA), remnant lipoprotein cholesterol (RemL-C) and apo B100 were measured.
2.2. Contribution of Remnant Lipoproteins to Postprandial Hyperlipidemia
In the study by Masuda, D. et al, serum TG levels reach at peak at 3-4 hours after OFL and slowly return to initial levels at 6-8 hours after OFL in patients with type IIb hyperlipidemia when they did not take ezetimibe [7]. In this study and the previous study, apo B48 levels reach at peak at 3-4 hours after OFL and slowly return to initial levels at 6-8 hours after OFL. Since apo B48 is a constituent of CM and CMR, the peak of TG at 3-4 hours after OFL may be made partially by the peak of CM or CMR. RemL-C levels also reached at peak at 3-4 hours after OFL, supporting a contribution of CMR to the postprandial TG peak. Measurement of apo B48 is useful to evaluate CMR.
In the study which investigated postprandial hyperlipidemia in patients with type 2 diabetes, serum levels of VLDL-TG, VLDL-apo B100 reached at peak at 3-4 hours after the ingestion of test meal and slowly return to initial levels after 6-8 hours [15]. In the study by Nakajima, K. et al, remnant-like lipoprotein particles (RLP) apo B100, but not RLP apoB48, increased significantly when the plasma TG increased after OFL despite the increase of plasma apoB48. The results show that the major lipoproteins which were increased in postprandial plasma were VLDLR, not CMR. [16].
Serum TG levels reach at peak at 3-4 hours after the meal and slowly return to initial levels at 6-8 hours after the meal in healthy subjects. Serum TG levels are abnormally elevated after a meal and the peak is delayed or protracted in patients with postprandial hyperlipidemia. An elevation in TG after the meal may be induced by an increase in TRL such as CM, CMR, VLDL and VLDLR.
2.3. Evaluation of Remnant Lipoproteins in the Clinical Setting
Characteristics of lipoproteins including TRL which are the main players in postprandial hyperlipidemia and the methods to evaluate TRL were shown in Figure 1. TRL are the main players in postprandial hyperlipidemia. To understand adequately evaluate postprandial hyperlipidemia, how the change in TRL is grasped is important.
2.3.1. Fasting TG
Since serum TG levels vary greatly depending on the content of meals and postprandial time, serum TG levels in a fasting state have been evaluated for a long time to diagnose dyslipidemia. As seen in Figure 1, the measurement of fasting TG cannot detect the elevation in CM and CMR.
2.3.2. Non-Fasting TG
Non-fasting TG includes TG content in all lipoproteins including CM and CMR. The epidemiological study in Japan have shown that the risk of developing CAD increased due to elevated non-fasting TG levels and that a 1 mmol/L (88.6 mg/dL) increase in non-fasting TG increased the CAD risk by 1.29 times in men and 1.42 times in women [17]. In this study, the CAD risk was increased at non-fasting TG of 115 mg/dL or higher, and the risk was more than tripled at 167 mg/dL or higher, even after adjusting for HDL-C [17]. In the sub-analysis of the Multiple Risk Factor Intervention Trial (MRFIT), compared with TG levels less than 200 mg/dL, risk factor-adjusted hazard ratios for coronary heart disease (CHD) mortality for hypertriglyceridemia were 1.24 (p = 0.09) for fasting and 1.26 (p = 0.07) for non-fasting [18]. For nonfatal or fatal CHD, fasting and non-fasting TG levels were similarly predictive with hazard ratios of 1.64 (p = 0.004) for fasting and 1.46 (p = 0.03) for non-fasting. Non-fasting TG levels was suggested to be more useful than fasting measurement for CHD risk stratification, because of greater ease of obtaining, greater prevalence and similarly increased risk with CHD as compared with fasting TG levels. After that, the optimal diagnostic threshold for non-fasting TG values for incident cardiovascular (CV) events was determined by using baseline non-fasting samples from 6391 participants in the Women’s Health Study who were followed prospectively for 17 years [19]. The optimal threshold of 175 mg/dL (1.98 mmol/L) was statistically better than the American Heart Association (AHA) cut-point of 200 mg/dL [19]. In the United States, persistent non-fasting serum TG of 175 mg/dL or higher is considered to be a risk-enhancing factor for atherosclerotic CV disease (ASCVD), and in Europe, non-fasting serum TG of 175 mg/dL or higher is set as the cut-off value for clinical diagnosis of dyslipidemia [20,21]. And then, fasting serum TG of 150 mg/dL or higher and non-fasting serum TG of 175 mg/dL or higher have been adopted as diagnostic criteria for dyslipidemia in Japan [22]. An increase in non-fasting TG may reflect an elevation in CMR and VLDLR.
2.3.3. Non-HDL-C
Since non-fasting non-HDL-C is an index that increases with an increase in both LDL-C and TRL including CMR and VLDLR. When non-HDL-C increases and LDL-C level is within the normal range, an increase in TRL is suspected in such cases.
2.3.4. Fasting Serum Apo B48
Ten male normolipidemic subjects were loaded with a high-fat or standard meal, and the lipids, apolipoproteins and lipoprotein profiles were analyzed after each meal [23]. Serum TG, apo B48, RLP-C and RLP-TG levels were increased and their levels were significantly higher after intake of the high-fat meal than the standard meal. Fasting apo B48 levels were strongly correlated with the incremental area under the curve (iAUC) of TG after intake of the high-fat meal, but not the standard meal. Measurement of fasting serum apo B48 may be a simple and useful method for assessment of the existence of postprandial hyperlipidemia.
2.3.5. RLP-Cholesterol (RLP-C)
To evaluate remnant such as CMR and VLDLR, remnant-cholesterol can be measured by RLP-cholesterol (RLP-C) and RemL-C method. Nakajima, K., et al. have developed a simple, rapid assay method for apo E-rich lipoproteins (d < 1.006 g/ml), using an immunoaffinity gel mixture of anti-apo B100 and apo AI antibodies coupled to Sepharose 4B [24]. The immunoaffinity mixed gels adsorb normal lipoproteins containing apo AI quantitatively as well as most lipoproteins containing apo B100. Unbound lipoproteins are quantified by assay of cholesterol. Characterization of the unbound lipoproteins of d < 1.006 g/mL has shown that they represent CM-RLP and VLDL-RLP [25]. In this method, CM and HDL are bound and removed by solid phase extracted with apo AI antibody, and nascent VLDL and LDL are bound and removed by solid phase extracted with apo B100 antibody, RLP is separated into unbound fractions, and their cholesterol concentrations are measured. Since anti-human apo B100 monoclonal antibody used in this method has an epitope that recognizes the apo B51 position of the apo B100 protein, it does not bind to lipoprotein particles carrying apo B48. Since CM has apo B48 but also has apo AI, CM are not detected in the RLP fraction. CM present in the RLP fraction is considered to be CMR because it does not have apo AI because CM without apo AI is considered to be CMR [26]. Apo E-rich VLDL, which accounts for about one-third of VLDL containing apo B100, is isolated as RLP because it does not react with the anti-apo B100 antibody used in this method. The RLP-C values measured by this method is the sum of cholesterol of CMR without apo AI and apo B100, and VLDLR which has apo B100 and is apo E-rich. RLP is apo CIII-rich as well as apo E-rich, and the idea that apo CIII-rich is also important as well as apo E-rich as the characteristic for remnant lipoproteins [27].
2.3.6. RemL-C
RemL-C utilizes surfactant and phospholipase-D, which selectively solubilize and degrade remnant lipoproteins [28]. Released cholesterol was then measured enzymatically. RemL-C was significantly and positively correlated with RLP-C (R = 0.95, p < 0.0001) [29]. Unlike RLP-C, this assay can be run on an automated clinical analyzer, thereby allowing quick and high throughput measurement. The correlations and data validation between RemL-C and RLP-C was evaluated in 83 subjects (49 men and 34 women) without diabetes, hypertension and medications for hyperlipidemia, diabetes, and hypertension [30]. A positive and significant correlation was found between the two methods (R = 0.853, p < 0.0001). There were several data dissociations between the RemL-C and RLP-C. The high-performance liquid chromatography (HPLC) showed high concentrations of CM-cholesterol in serum samples with RemL-C level < RLP-C level, but high concentrations of IDL-cholesterol in samples with RemL-C level > RLP-C level. RemL-C significantly correlated with IDL-cholesterol, but not RLP-C. RemL-C assay is likely to reflect VLDLR more closely than RLP-C.
3. Pathological Factors Which Induce Postprandial Hyperlipidemia
Elevated remnant lipoproteins associated with postprandial hyperlipidemia, is also associated with hypertriglyceridemia, low HDL-C levels, and increased small-dense LDL (Sd-LDL). Elevated remnant lipoproteins is observed in patients with familial type III hyperlipoproteinemia, familial combined hyperlipidemia (FCHL), chronic kidney disease (CKD), metabolic syndrome and type 2 diabetes.
3.1. Familial Type III Hyperlipoproteinemia
Familial type III hyperlipoproteinemia is a genetic disorder characterized by accumulation of remnant lipoproteins in the plasma and development of premature atherosclerosis [31]. Although receptor binding-defective forms of apo E (E2/E2) are the common denominator, other pathogenic factors still exist. Hypercholesterolemia is caused by impaired receptor-mediated clearance, whereas hypertriglyceridemia is caused primarily by impaired lipolytic processing of remnant lipoproteins and increased VLDL production associated with increased levels of apo E. Therefore, an elevation in CMR and IDL (VLDLR) is observed in patients with familial type III hyperlipoproteinemia. In such patients, serum TG levels reach at peak at 6-8 hours after the OFL and did not return to initial levels even after 8 hours [32], suggesting that familial type III hyperlipoproteinemia causes postprandial hyperlipidemia.
Familial type III hyperlipoproteinemia is mainly found in homozygous carriers of apo E2. Only a small percentage (< 5%) of these apo E2 homozygotes develops hyperlipidemia, indicating that additional environmental and genetic factors contribute to the development of familial type III hyperlipoproteinemia. de Beer, F.; et al. demonstrated that compared with normocholesterolemic E2/2 subjects, type III hyperlipoproteinemic patients had a significantly increased body mass index (BMI) and prevalence of hyperinsulinemia, suggesting that the expression of type III hyperlipoproteinemia in E2/2 subjects is associated with insulin resistance [33].
3.2. FCHL
FCHL was previously reported to be caused by a single gene, whose inheritance exhibits autosomal dominant inheritance, increases both blood cholesterol and TG levels, and FCHL was proposed as primary hyperlipidemia, which is common in patients with a history of myocardial infarction [34]. Type IIb is the basic phenotype of FCHL, but type IIa and IV phenotypes can occur depending on diet and age. The first relative has hyperlipidemia with either type IIb, IIa, or IV, and at least one person, including the subject, has type IIb or type IIa hyperlipidemia. The diagnosis of FCHL requires Apo B/LDL-C > 1.0 or the presence of Sd-LDL.
FCHL patients showed an abnormal postprandial TG characterized by longer-persisting elevated postprandial TG in plasma and CM [35]. Compared with controls, the 24-hour TG in plasma, CM, and non-CM fractions were higher in FCHL patients. The clearance of CM and CMR, assessed by the area under the 24-hour retinyl palmitate curve was delayed in FCHL patients compared with controls. Postprandial CMR clearance was studied in six patients with FCHL and seven control subjects by using the OFLT. The CMR clearance was delayed in FCHL subjects compared with control subjects [36]. Delayed elimination of atherogenic CMR may contribute to the increased risk of premature atherosclerosis in FCHL. In FCHL patients, postprandial apo B100 remained unchanged vs. baseline in TG-rich particles and in remnant fractions, suggesting hypersecretion of VLDL [37]. In FCHL subjects, apo B100 hypersecretion and increased fasting plasma apo B48 levels were observed. Overproduction of VLDL is the major characteristic of subjects with FCHL. The postprandial free fatty acids (FFA) AUC was higher in FCHL subjects than in control subjects [38]. The postprandial increase in ketone bodies was almost four times higher in FCHL patients. As ketogenesis occurs predominantly in hepatocytes, these findings suggest that during the postprandial period in FCHL, an increased flux of FFA to the liver occurs, possibly because of inadequate incorporation of FFA into TG in adipocytes. Impaired metabolism of postprandial FFA may contribute to hepatic VLDL overproduction in FCHL subjects. Patients with FCHL have 2-fold elevated plasma RLP-C levels, which adds to the atherogenic lipid profile and contributes to the increased risk for CVD [39].
FCHL accounts for an additional 10-20% of premature CAD. FCHL exhibits features similar to the metabolic syndrome in addition to a disproportionate elevation of apo B levels [40]. Genetic studies have yielded little evidence of single gene determinants of FCHL [41]. DNA sequencing shows that rare large-effect variants in genes such as LDL receptor (LDL-R) and lipoprotein lipase (LPL) are found in some FCHL patients, explaining the elevated LDL-C and TG, respectively. In addition, diet, obesity, fatty liver or diabetes further modulate the expression of the biochemically defined FCHL phenotype [41]. FCHL may be conceptualized as a phenotype with a final common clinical presentation but variable predisposing causes, similar to other predominantly polygenic conditions such as type 2 diabetes.
3.3. CKD
In patients with CKD and proteinuria, a loss of apo CII, an activator of LPL, into urine impairs catabolism of VLDL [42]. In patients with CKD and reduced glomerular filtration rate (GFR), hepatic VLDL production is not elevated, and the catabolism of VLDL is impaired. Further, serum apo CIII, an inhibitor of LPL, is increased and hepatic lipase (HL) activity is reduced [43,44]. Therefore, serum VLDLR (IDL) levels increase in patients with CKD. HDL-C levels decrease and serum levels of IDL-C and VLDL-C increase in hemodialysis (HD) patients as compared with healthy individuals [45].
The OFLT was performed in patients with chronic renal failure (CRF) on HD [46]. Mean fasting serum TG levels in CRF patients were elevated compared to normal controls. Six patients had type IV hyperlipidemia patterns and 2 patients showed type IIb hyperlipidemia. The OFLT in all CRF patients showed delayed appearance of serum TG and CM. Serum TG and CM levels in CRF did not decrease by 5 hours after the OFL. Several abnormalities in lipoprotein protein and lipids: enrichment of IDL and LDL with TG; the presence of apo B48 in VLDL; an increased concentration of apoprotein AIV (a protein related to CM transport); the presence of AIV in VLDL, IDL, and LDL were observed in patients with CRF who are undergoing peritoneal dialysis or HD [47]. These findings strongly suggest an elevation of CMR and VLDLR in CRF patients.
3.4. Metabolic Syndrome and Type 2 Diabetes
3.4.1. The Effects of Insulin Resistance on TRL Metabolism
Metabolic syndrome and type 2 diabetes develop due to insulin resistance. Here, we think about the effects of insulin resistance on postprandial hyperlipidemia and TRL (Figure 2). Our previous studies showed that the characteristics in dyslipidemia due to insulin resistance is reduced HDL-C, and increased IDL-C (VLDLR-C) and VLDL-C, which is further deteriorated by complication with obesity [48,49,50,51,52]. The metabolism of FFA is altered in insulin resistance. The enzymes LPL and hormone-sensitive lipase (HSL) are rate-limiting steps for the turnover of FFA in adipose tissue, because LPL hydrolyzes extracellular TG in lipoproteins and HSL hydrolyzes intracellular TG in adipocytes. Relative insulin deficiency due to insulin resistance increases HSL activity and expression in adipose tissue, which catalyzes the breakdown of TG, releasing FFA [53]. Hepatic insulin resistance reduces apo B100 degradation [54]. Insulin resistance increases expression of microsomal TG transfer protein (MTP), a key enzyme involved in VLDL assembly [55]. In an insulin-resistant-state, an increased FFA entry to liver, reduced degradation of apoB100 and enhanced expression of MTP may elevate hepatic production of VLDL. Insulin resistance also causes an increased expression of sterol regulatory element binding protein 1c (SREBP-1c), which increases FA synthesis [56].
The VLDL receptor binds TRL but not LDL, and functions as a peripheral remnant lipoproteins receptor. The VLDL receptor is expressed abundantly in FA metabolism-active tissues such as heart, skeletal muscle and adipose tissue. It is likely that VLDL receptor functions in concert with LPL, which hydrolyses TG in VLDL and CM. In contrast to the LDL receptor, the gene therapy of VLDL receptor into the liver showed a benefit effect for lipoprotein metabolism in both LDL receptor knockout and apo E mutant mice [57]. The VLDL receptor mRNA and protein levels were significantly decreased in skeletal muscle and adipose tissue in hypercholesterolemic, hypertriglyceridemic diabetic rats compared with normal rats [58]. And in vitro, in 3T3-L1 adipocytes, insulin-induced insulin resistance significantly decreased VLDL-R mRNA expression.
Insulin resistance also reduces LPL activity. LPL is the rate-limiting enzyme for the catabolism of TRL such as CM, VLDL and IDL [59]. Therefore, the reduced LPL activity decrease the catabolism of TRL such as VLDL.
Apo CIII is produced in the liver and small intestine and has an inhibitory effect for LPL activity. Overexpression of apo CIII in the plasma of transgenic mice results in hypertriglyceridemia, with up to a 20-fold elevation in plasma TG [60]. Total apo B100 levels are similar in transgenic and normal plasma, but apoB48 levels are increased in transgenic mice, which was corrected by the addition of exogenous apo E. The rate of clearance of CMR in apo CIII-transgenic mice was about half that in non-transgenic mice. The lipoprotein alterations are accompanied by up to a 5-fold increase in FFA, which may be the cause of increased hepatic TG production observed in the apo CIII-transgenic mice. Apo CIII modulates the apo E-mediated clearance of TG-rich lipoproteins.
Overweight individuals with reduced insulin sensitivity often have mild to moderate hypertriglyceridemia. Increased hepatic production of VLDL apo CIII is characteristic of subjects with higher body weights and lower levels of insulin sensitivity and is strongly related to the plasma concentration and level of production of VLDL-TG [61].
A significant and positive correlation was present between the plasma HDL-C level and LPL activity in adipose tissue, suggesting that the activity of LPL in adipose tissue and the rate of catabolism of TRL might be one of the factors that determine the concentration of HDL in plasma [62]. In conditions with increased atherosclerotic risk, HL activity is often high. HL activity increases with the degree of insulin-resistance in type 2 diabetes and with omental fat mass in women [63,64]. In FCHL and type 2 diabetes, HL may contribute to the development of the atherogenic lipid profile, characterized by low HDL-C levels and the presence of Sd-LDL [63,65]. HL plays a central role in LDL and HDL remodeling. High HL activity is associated with increased Sd-LDL and with reduced HDL-C levels [66]. HL activity is determined by visceral obesity with insulin resistance. The dyslipidemia with high HL activity is a potentially proatherogenic lipoprotein profile in the metabolic syndrome, in type 2 diabetes, and in FCHL.
Insulin modulates LDL-R expression and activity. The inactivity of insulin represses LDL-R transcription [67], however, the association of reduced LDL-R with postprandial hyperlipidemia remains unknown. NPC1L1 plays a pivotal role in intestinal cholesterol absorption. CM and VLDL are abnormally increased in patients with diabetes. The expression of NPC1L1 and MTP was investigated in non-diabetic rats and diabetic cholesterol-fed rats [68]. There was a positive correlation between intestinal NPC1L1 mRNA and CM cholesterol. The diabetic rats had significantly higher CM and VLDL-C, TG, and apo B-48 and B-100 levels compared with control rats. They had significantly increased NPC1L1 and MTP mRNA in both liver and intestine. Levels of NPC1L1 and MTP mRNA were measured in duodenal biopsies of type 2 diabetic and non-diabetic patients [69]. Diabetic patients had more NPC1L1 mRNA than the control subjects. MTP expression was increased in diabetic patients. There was a positive correlation between NPLC1L1 and MTP mRNA. Increased expression of NPC1L1 and MTP is highly associated with postprandial hyperlipidemia. Postprandial hyperlipidemia is characterized by an increase of CMR. Apo B48 exists exclusively in CM and CMR, and fasting plasma levels of apo B48 may reflect high postprandial levels of such lipoproteins. Apo B48 was significantly higher in men and women with than without metabolic syndrome [70]. Fasting apo B48 levels were raised in individuals with metabolic syndrome. Another study showed that fasting apo B48 concentration was 40 % higher in subjects with metabolic syndrome than those without metabolic syndrome [71].
The LDL receptor-related protein 1 (LRP1) is an endocytic and signaling receptor that is expressed in several tissues. It is involved in the clearance of CMR from circulation [72]. LRP1 is involved in insulin receptor trafficking and intracellular signaling activity, which have an impact on the regulation of glucose homeostasis in adipocytes, muscle cells, and brain [72]. Insulin stimulates the translocation of hepatic LRP1 from intracellular vesicles to the plasma membrane, which correlates with an increased uptake of LRP1-specific ligands [73]. In wild-type mice, a glucose-induced insulin response increased the hepatic uptake of LRP1 ligands while in obese mice with hepatic insulin resistance, insulin-inducible LRP1 ligand uptake was abolished. An impaired hepatic LRP1 translocation can contribute to the postprandial hyperlipidemia in insulin resistance. Apo B-containing lipoprotein particles are secreted and cleared by the liver. Insulin plays a key role in the regulation of apo B. Insulin decreases apo B secretion by promoting apo B degradation in the hepatocyte [74]. Insulin also promotes clearance of circulating apo B particles by the liver via the LDL-R and LRP1 [74]. The insulin-resistant state is associated with increased secretion and decreased clearance of apo B.
3.4.2. Postprandial Hyperlipidemia in Patients with Obesity and/or Type 2 Diabetes
The OFLT demonstrated that patients with type 2 diabetes showed larger AUC of TG (873.3 ± 527.8 vs. 647.0 ± 218.6 mmol/L), CM-rich TG (CM or CMR) (440.9 ± 317.5 vs. 230.8 ± 125.4) and CM-poor TG (VLDL or VLDLR) (479.5 ± 235.7 vs. 363.7 ± 122.9) than healthy subjects [75]. In both healthy and type 2 diabetic subjects, total AUC of TG was significantly correlated with fasting TG levels.
The OFLT was performed in 12 type 2 diabetic obese, 15 non-diabetic obese, and 12 non-diabetic non-obese (control) adolescents [76]. The TG-AUC was significantly greater in the diabetes group than in the other two groups. Incremental TG response in the diabetes group was significantly higher than that in the control group. The homeostasis model assessment (HOMA) was greater in the diabetes group than in the obese and control groups. The delta TG in the subgroup with high fasting TG was substantially greater than in the subgroup with normal fasting TG. The TG-AUC was much greater in the high than normal fasting TG subgroup. HOMA was greater in the high than normal fasting TG subgroup. The degree of insulin resistance determined the degree of postprandial hyperlipidemia.
Serum levels of RLP-C and RLP-TG were measured in 541 subjects [77]. After matching for sex, age, and body weight, serum RLP-C in normal, impaired glucose tolerance (IGT), and diabetic groups were 4.2 ± 1.7, 6.2 ± 3.4, and 6.2 ± 4.2 mg/dl, respectively. The corresponding RLP-TG values were 16.7 ± 9.2, 28.0 ± 19.1, and 29.0 ± 27.2 mg/dl. RLP-C and RLP-TG values were significantly higher in the IGT and diabetic groups compared with the normal group (p < 0.001). Further, the incidence of remnant hyperlipoproteinemia in normocholesterolemic subjects was up to four times higher in IGT and diabetic groups compared with the normal group.
4. Postprandial Hyperglycemia and Postprandial Hyperlipidemia
4.1. Abnormal Postprandial Glucose Metabolism in Postprandial Hyperglycemia
Postprandial glucose metabolism in healthy individuals and patients with type 2 diabetes were shown in Figure 3. When a meal is ingested, plasma glucose level rises first due to the absorption of nutrients. Increased insulin secretion occurs promptly in response to an increase in plasma glucose, and an increase in insulin concentration in the portal vein decreases endogenous hepatic glucose output (HGO) and increases hepatic glucose uptake (HGU). Increased peripheral plasma glucose due to glucose from the liver causes an increase in glucose uptake by muscle and adipose tissue, resulting in a return of plasma glucose levels to pre-prandial levels. When glucose is taken orally, insulin secretion is stimulated much more than it is when glucose is infused intravenously, which is called the incretin effect and is estimated to be responsible for 50 to 70% of the insulin response to glucose. This incretin effect is caused mainly by the two intestinal insulin-stimulating hormones, glucagon-like peptide-1 (GLP-1) and glucose-dependent insulinotropic polypeptide (GIP) [78]. GLP-1 increases insulin secretion and decreases glucagon secretion.
Postprandial hyperglycemia in type 2 diabetes is thought to be caused by an increase in splanchnic glucose output (SGO), which is the glucose that enters into the systemic circulation without being taken up by the liver. Insufficient suppression of HGO and decreased HGU are involved in the development of postprandial hyperglycemia in type 2 diabetes [79]. The reasons for the decrease in HGU in type 2 diabetes are that the portal vein insulin concentration does not increase despite the increase in the portal vein glucose concentration; and a sufficient difference in glucose concentration between the postprandial portal vein and the systemic circulation cannot be obtained due to high pre-prandial plasma glucose level [80]. Hepatic insulin resistance due to fat accumulation may also contribute to the decrease in HGU in type 2 diabetes [80]. Glucose that passes through the liver causes peripheral hyperglycemia, however, it is difficult to be up-taken by muscle and adipocytes due to decreased insulin action, and postprandial hyperglycemia is prolonged. In patients with type 2 diabetes, the incretin effect is greatly impaired, which induces insufficient insulin secretion and insufficient suppression of glucagon secretion, resulting in postprandial hyperglycemia [78].
4.2. Abnormal FFA and TRL Metabolism in Postprandial Hyperlipidemia
Postprandial FFA and TRL metabolism in healthy individuals and patients with type 2 diabetes were shown in Figure 4. While glucose acts as an important messenger in postprandial hyperglycemia, FFA acts as an important messenger in postprandial hyperlipidemia. CM is synthesized by the small intestine. After the release from the intestine into the lymphatic system, newly secreted CM enter the systemic circulation via the thoracic duct. TG in CM is hydrolyzed by LPL, and TG is hydrolyzed to FFA, which is used in skeletal muscles as an energy source and/or is stored in adipose tissue in the form of TG. Reduction of TG in CM by LPL makes the CM remnant, which is taken up by the liver via LRP1. VLDL is taken-up and used by skeletal muscles and adipose tissue via VLDL-R.
In patients with type 2 diabetes, CM production increases due to increased expression of NPC1L1. Reduced activity of LPL and LRP1 decrease the clearance of CMR. Insulin resistance activates HSL and increase FFA release from adipose tissue, and increased FFA enter into the liver, which increases hepatic VLDL production. Reduced activity of LPL reduces degradation of VLDL. Defective function of VLDL-R in skeletal muscles and adipose tissue further increases serum VLDL. Over production and reduced clearance of CM and VLDL may contribute to the development of postprandial hyperlipidemia.
4.3. The association between Postprandial Hyperglycemia and Postprandial Hyper-Lipidemia
Postprandial hyperglycemia is commonly observed in patients with metabolic syndrome and type 2 diabetes. Postprandial hyperglycemia is also observed in patients with FCHL [81,82]. However, a postprandial increase in plasma glucose was much larger in patients with type 2 diabetes than in patients with FCHL. The FCHL subjects with BMI ≥ 27 kg/m2 showed significantly higher blood glucose and insulin levels following oral glucose tolerance test than those with BMI < 27 kg/m2 [83]. Plasma insulin values were positively related to serum TG. Obesity exacerbates the hyperglycemia, hyperinsulinemia in the FCHL subjects. Insulin resistance may enhance postprandial hyperglycemia.
Young subjects with impaired glucose tolerance/impaired fasting glucose (IGT/IFG) are at higher risk of developing CKD [84]. Children with CKD are at a high risk of glucose intolerance including postprandial hyperglycemia [85]. Postprandial hyperglycemia and hyperinsulinemia are associated with renal arterio-arteriolosclerosis in CKD [86].
The effects of hyperglycemia and hyperinsulinemia on postprandial RLP concentrations in newly diagnosed type 2 diabetics was evaluated [87]. Patients with type 2 diabetes were divided on the basis of their plasma insulin response to oral glucose into hyper-insulinemic and normo-insulinemic groups. Plasma TG, RLP-TG and RLP-C concentrations peaked 2 h after the fat load in the control group, returning to baseline within 4 h. In contrast, concentrations of such variables increased throughout the 4-h study in both groups of patients with type 2 diabetes. Total integrated plasma RLP-TG and RLP-C responses above baseline after the OFL were significantly higher in the hyper-insulinemic group compared with the control (p = 0.019 and 0.009, respectively) or normo-insulinemic (p = 0.026 and 0.029, respectively) groups. Hyperinsulinemia and/or insulin resistance may largely contribute to postprandial increase in remnant lipoproteins in patients with type 2 diabetes.
Postprandial hyperlipidemia is closely related to postprandial hyperglycemia, and insulin resistance may be an enhancing factor for both postprandial hyperlipidemia and postprandial hyperglycemia.
5. The Atherogenic Properties of Remnant Lipoproteins and Metabolic Disorders Associated with Postprandial Hyperlipidemia
The atherogenic properties of remnant lipoproteins and metabolic disorders associated with postprandial hyperlipidemia are shown in Figure 5. Compared with CM or VLDL, CMR and VLDLR become enriched in apo E [13]. While CM and VLDL are prohibited from transcytosis by virtue of their size, remnant lipoproteins can penetrate the artery wall. Distinct from LDL, which is deficient in apo E and requires oxidation for uptake, remnant lipoproteins do not need oxidation to facilitate accumulation in macrophages due to their apo E enrichment. Remnant lipoproteins increase rolling and adhesion of monocytes on endothelial cells and transmigration between endothelial cells. Remnant lipoproteins are implicated in inflammation, platelet activation and endothelial dysfunction, by activating transcription factors such as NF-κB in endothelial cells and monocytes. In dysfunctional endothelial cells, plasminogen activator inhibitor-1 (PAI-1) expression increases, which reduces fibrinolysis, resulting in prothrombotic state. Reduced Nitric oxide (NO) in endothelial cells induces vasoconstriction. Remnant lipoproteins stimulate NAD(P)H oxidase-dependent superoxide formation in endothelial cells via the activation of the lectin-like oxidized LDL receptor-1 (LOX-1). Such oxidative stress increases the production of oxidized LDL, and oxidized LDL induces the formation of foam cells via scavenger receptors.
In the pathological condition that develops postprandial hyperlipidemia, HDL decreases due to decreased LPL activity, resulting in reduced cholesterol efflux from atherosclerotic plaque. High level of remnant lipoproteins is likely to be accompanied by increased Sd-LDL. An increased atherogenic potential of Sd-LDL is suggested by its greater propensity for transport into the subendothelial space, increased binding to arterial proteoglycans, and susceptibility to oxidative modification [13]. Sd-LDL is cleared more slowly from plasma than LDL because LDL-R cannot recognize Sd-LDL.
5. The Treatments for Postprandial Hyperglycemia
5.1. The Modification of Life-Style Including Diet and Exercise
A diet high in minimally processed, high-fiber, plant-based foods such as vegetables and fruits, whole grains, legumes, and nuts will markedly improve postprandial hyperlipidemia [91]. Lean protein, vinegar, fish oil, tea, cinnamon, calorie restriction, weight loss, exercise, and low- to moderate-dose alcohol consumption positively impact postprandial hyperlipidemia [91].
5.2. Anti-Hyperlipidemic Drugs
5.2.1. Pemafibrate
Pemfibrate is a selective peroxisome proliferator-activated receptor alpha (PPARα) modulator, and promising drug for postprandial hyperlipidemia. The meal tolerance test demonstrated that the AUCs of postprandial TG, apo B48, RemL-C levels significantly decreased after the pemafibrate treatment [92]. The iAUC for postprandial TG level was significantly reduced following the pemafibrate treatment (−39.7 ± 71.2%, p = 0.004). The peaks of the postprandial TG, apoB-48, and RemL-C levels after pemafibrate treatment occurred earlier than those at baseline and after placebo treatment [92]. Our previous study showed that pemafibrate significantly reduced both non-fasting TG and non-HDL-C levels at 3, 6 and 12 months after the start of pemafibrate [93], suggesting a possible beneficial effect of pemafibrate on postprandial hyperlipidemia.
5.2.2. Bezafibrate
The cookie test showed that bezafibrate, PPARα agonist, significantly suppressed postprandial elevation of TG (iAUC: 544 ± 65 vs. 1158 ± 283 mg h/dl, p = 0.02) and remnant lipoprotein cholesterol (iAUC: 27.9 ± 3.5 vs. 72.3 ± 14.1 mg h/dl, p < 0.01) [94]. Postprandial TG content of CM and VLDL was significantly lower in the bezafibrate group than in the control group (p < 0.05) [94].
5.2.3. Ezetimibe
The effects of ezetimibe on postprandial hyperlipidemia and hyperinsulinemia were assessed in obese metabolic syndrome patients with CAD, by using OFLT. Serum TG and insulin levels (2 h after the loading dose) were significantly higher in metabolic syndrome patients than in control patients [95]. The iAUCs for TG and insulin levels decreased significantly after ezetimibe treatment in metabolic syndrome patients. When metabolic syndrome patients were divided into two groups based on the median insulin iAUC reduction rate (higher group ≥ 34%, n = 14; lower group < 34%, n = 13), those in the higher group showed a significantly higher rate of change in the iAUCs of TG than those in the lower group (TG, 31.0% vs. 10.8%; p = 0.033). These results suggest that ezetimibe may reverse insulin resistance, reducing lipid dysmetabolism after a meal in metabolic syndrome patients with CAD.
5.2.4. Eicosapentaenoic Acid (EPA)
The cookie meal test showed EPA, n-3 FA, significantly decreased the incremental TG peak, AUC for postprandial TG, incremental glucose peak, AUC for postprandial glucose [96].
5.3. Anti-Diabetic Drugs
5.3.1. Metformin
In the nine glucose intolerant subjects, metformin reduced postprandial insulin AUC after OFLT from 389 to 245 mU/ml (p < 0.01), and also reduced CM and non-CM retinyl palmitate AUC by 56% and 32%, respectively [97].
5.3.2. Alpha-Glucosidase Inhibitors
Acarbose inhibited the postprandial increase of both plasma glucose and serum insulin [98]. Acarbose also significantly suppressed the increase of serum TG at 60, 90, and 120 min (p < 0.05 to p < 0.01), and the increase of serum RLP-C at 60 and 120 min (p < 0.05). Acarbose inhibited the postprandial decline of apolipoprotein CII, and decreased the postprandial serum apolipoprotein CIII level. Alpha-glucosidase inhibitors may improve postprandial hyperlipidemia as well as postprandial hyperglycemia in patients with type 2 diabetes.
5.3.3. Pioglitazone
Insulin resistance and both fasting and postprandial TG and RLP-TG levels decreased significantly by pioglitazone in insulin-resistant smokers [99]. The postprandial accumulation of RLP-C is increased in insulin-resistant smokers and is likely to contribute to the increased CVD risk in such individuals. Pioglitazone administration provides a possible therapeutic approach to decreasing postprandial hyperlipidemia and CVD risk in insulin-resistant smokers.
The effects of pioglitazone and glibenclamide (sulfonylurea) on insulin resistance, postprandial hyperglycemia, postprandial hyperlipidemia were examined in type 2 diabetic patients [100]. Pioglitazone produced a significant decrease in fasting plasma glucose (FPG), HbA1c, HOMA-R, and TG levels in the subjects compared to baseline. In contrast, glibenclamide significantly decreased FPG and HbA1c levels, while not affecting HOMA-R and TG. The meal tolerance test (MTT) showed that glucose, TG, and RLP-TG levels before and 1, 2, 4, and 6 h after MTT were significantly decreased after the pioglitazone treatment compared to baseline. A significant decrease in fasting and 2 h, postprandial glucose values compared to baseline MTT levels was observed after the glibenclamide treatment, however, fasting and postprandial TG and RLP-TG levels remained unchanged compared to baseline.
5.3.4. Dipeptidyl-Peptidase-4 Inhibitors (DPP4i)
DPP4i have been demonstrated to improve glycemic control, in particular postprandial hyperglycemic control, in patients with type 2 diabetes. A standard meal loading test showed that alogliptin treatment significantly suppressed the postprandial elevation in serum TG (iAUC; 279 ± 31 vs. 182 ± 32 mg h/dl, p = 0.01), apoB-48 (iAUC; 15.4 ± 1.7 vs. 11.7 ± 1.1 μg h/ml, p = 0.04), and RLP-C (iAUC: 29.3 ± 3.2 vs. 17.6 ± 3.3 mg h/dl, p = 0.01) in non-diabetic subjects [101]. Vildagliptin showed a better effect on postprandial hyperlipidemia and hyperinsulinemia compared to glimepiride in patients with type 2 diabetes [102].
5.3.5. Glucagon like Peptide 1 Analogues (GLP1A)
Liraglutide reduced apo B48 synthesis in CM by 60% (p < 0.0001), and VLDL-TG secretion (p = 0.017) in parallel with reduced liver fat in patients with type 2 diabetes [103]. CM-apo B48 production was related to insulin sensitivity (p = 0.015). A standardized fat-rich meal load test showed that liraglutide significantly reduced postprandial TG and apo B48 AUC than placebo by 28% and 35%, respectively [104]. Liraglutide treatment significantly reduced postprandial excursions of TG and apo B48 after a fat-rich meal, independently of gastric emptying, in patients with type 2 diabetes. The 51-Week exenatide treatment resulted in a significant reduction of prandial glucose, TG, apo B48, VLDL-C, FFA and the marker for oxidative stress, malondialdehyde (MDA) excursions whereas Insulin Glargine predominantly reduced fasting glucose, FFA and MDA [105]. Changes in markers of oxidative stress were related to changes in postprandial glucose and TG excursions, independent of treatment arm. Our previous studies showed that subcutaneous dulaglutide and oral semaglutide reduced non-HDL-C [106,107], supporting a beneficial effect of GLP-1A on postprandial hyperlipidemia.
5.3.6. Sodium Glucose Cotransporter-2 Inhibitors (SGLT2i)
The 8 week-tofogliflozin (SGLT2i) treatment caused an improvement of postprandial glucose metabolism, however, did not show an improvement of considerable postprandial lipid metabolism, in Japanese men with type 2 diabetes [108]. Although the OFLT showed that the 12 week-dapagliflozin treatment did not affect fasting or postprandial plasma cholesterol and TG, fasting apo B48 was decreased by dapagliflozin [109]. Empagliflozin decreased RLP-C and HOMA-IR in type 2 diabetic patients with insulin resistance [110]. The change in RLP-C significantly correlated with the change in HOMA-IR (Pearson correlation coefficient, 0.503; 95%CI, 0.199 to 0.719; p = 0.00241). Our previous study showed that SGLT2i significantly reduced non-HDL-C at 3 months after the start of SGLT2i, suggesting a promising therapeutic effect for postprandial hyperlipidemia [111,112]. Reduced levels of fating apo B48, RLP-C and non-HDL-C by SGLT2i suggest a possible beneficial effect of SGLT2i on postprandial hyperlipidemia.
6. Conclusions
Postprandial hyperlipidemia is atherogenic and associated with the development of CAD. It is important to appropriately understand the existence of postprandial hyperlipidemia and to connect it to optimal treatments.
Author Contributions
H.Y., M.H., H.A. and H. K. conceived the review; H. Y. wrote the paper; H. K. edited the paper and provided critical guidance. All authors read and approved the final version of this paper.
Funding
This review research received no external funding.
Conflicts of Interest
The authors declare no conflict of interest in relation to the present review paper.
References
- Zilversmit, D.B. Atherogenesis: A postprandial phenomenon. Circulation. 1979, 60, 473–485. [Google Scholar] [CrossRef] [PubMed]
- Nikkilä, M.; Solakivi, T.; Lehtimäki, T.; Koivula, T.; Laippala, P.; Aström, B. Postprandial plasma lipoprotein changes in relation to apolipoprotein E phenotypes and low density lipoprotein size in men with and without coronary artery disease. Atherosclerosis. 1994, 106, 149–157. [Google Scholar] [CrossRef] [PubMed]
- Patsch, J.R.; Miesenböck, G.; Hopferwieser, T.; Mühlberger, V.; Knapp, E.; Dunn, J.K.; Gotto, A.M. Jr.; Patsch, W. Relation of triglyceride metabolism and coronary artery disease. Studies in the postprandial state. Arterioscler. Thromb. 1992, 12, 1336–1345. [Google Scholar] [CrossRef] [PubMed]
- Durlach, V.; Attia, N.; Zahouani, A.; Leutenegger, M.; Girard-Globa, A. Postprandial cholesteryl ester transfer and high density lipoprotein composition in normotriglyceridemic non-insulin-dependent diabetic patients. Atherosclerosis. 1996, 120, 155–165. [Google Scholar] [CrossRef] [PubMed]
- Chen, Y.D.; Skowronski, R.; Coulston, A.M.; Pietarinen, J.; Hollenbeck, C.B.; Reaven, G.M. Effect of acute variations in dietary fat and carbohydrate intake on retinyl ester content of intestinally derived lipoproteins. J. Clin. Endocrinol. Metab. 1992, 74, 28–32. [Google Scholar]
- Zampelas, A.; Peel, A.S.; Gould, B.J.; Wright, J.; Williams, C.M. Polyunsaturated fatty acids of the n-6 and n-3 series: Effects on postprandial lipid and apolipoprotein levels in healthy men. Eur. J. Clin. Nutr. 1994, 48, 842–848. [Google Scholar]
- Nakamura, K.; Miyoshi, T.; Yunoki, K.; Ito, H. Postprandial hyperlipidemia as a potential residual risk factor. J. Cardiol. 2016, 67, 335–339. [Google Scholar] [CrossRef]
- Aldred, H.E.; Perry, I.C.; Hardman, A.E. The effect of a single bout of brisk walking on postprandial lipemia in normolipidemic young adults. Metabolism. 1994, 43, 836–841. [Google Scholar] [CrossRef]
- Havel, R.J. Postprandial hyperlipidemia and remnant lipoproteins. Curr. Opin. Lipidol. 1994, 5, 102–109. [Google Scholar] [CrossRef]
- Havel, R.J. Remnant lipoproteins as therapeutic targets. Curr. Opin. Lipidol. 2000, 11, 615–620. [Google Scholar] [CrossRef]
- Nakajima, K.; Saito, T.; Tamura, A.; Suzuki, M.; Nakano, T.; Adachi, M.; Tanaka, A.; Tada, N.; Nakamura, H.; Campos, E.; et al. Cholesterol in remnant-like lipoproteins in human serum using monoclonal anti apo B-100 and anti apo A-I immunoaffinity mixed gel. Clin. Chim. Acta. 1993, 223, 53–71. [Google Scholar] [CrossRef]
- Nakajima, K.; Nakano, T.; Tokita, Y.; Nagamine, T.; Inazu, A.; Kobayashi, J.; Mabuchi, H.; Stanhope, K.L.; Havel, P.J.; Okazaki, M.; et al. Postprandial lipoprotein metabolism: VLDL vs chylomicrons. Clin. Chim. Acta. 2011, 412, 1306–1318. [Google Scholar] [CrossRef] [PubMed]
- Yanai, H.; Adachi, H.; Hakoshima, M.; Katsuyama, H. Atherogenic Lipoproteins for the Statin Residual Cardiovascular Disease Risk. Int. J. Mol. Sci. 2022, 23, 13499. [Google Scholar] [CrossRef] [PubMed]
- Masuda, D.; Nakagawa-Toyama, Y.; Nakatani, K.; Inagaki, M.; Tsubakio-Yamamoto, K.; Sandoval, J.C.; Ohama, T.; Nishida, M.; Ishigami, M.; Yamashita, S. Ezetimibe improves postprandial hyperlipidaemia in patients with type IIb hyperlipidaemia. Eur. J. Clin. Investig. 2009, 39, 689–698. [Google Scholar] [CrossRef]
- Kahri, J.; Fruchart-Najib, J.; Matikainen, N.; Fruchart, J.C.; Vakkilainen, J.; Taskinen, M.R. The increase of apolipoprotein A-V during postprandial lipemia parallels the response of triglyceride-rich lipoproteins in type 2 diabetes: No relationship between apoA-V and postheparin plasma lipolytic activity. Diabetes. Care. 2007, 30, 2083–2085. [Google Scholar] [CrossRef]
- Nakajima, K.; Nakano, T.; Tokita, Y.; Nagamine, T.; Yatsuzuka, S.; Shimomura, Y.; Tanaka, A.; Sumino, H.; Nara, M.; Machida, T.; et al. The characteristics of remnant lipoproteins in the fasting and postprandial plasma. Clin. Chim. Acta. 2012, 413, 1077–1086. [Google Scholar] [CrossRef] [PubMed]
- Iso, H.; Naito, Y.; Sato, S.; Kitamura, A.; Okamura, T.; Sankai, T.; Shimamoto, T.; Iida, M.; Komachi, Y. Serum triglycerides and risk of coronary heart disease among Japanese men and women. Am. J. Epidemiol. 2001, 153, 490–499. [Google Scholar] [CrossRef]
- Eberly, L.E.; Stamler, J.; Neaton, J.D. ; Multiple Risk Factor Intervention Trial Research Group. Relation of triglyceride levels, fasting and nonfasting, to fatal and nonfatal coronary heart disease. Arch Intern Med. 2003, 163, 1077–1083. [Google Scholar] [PubMed]
- White, K.T.; Moorthy, M.V.; Akinkuolie, A.O.; Demler, O.; Ridker, P.M.; Cook, N.R.; Mora, S. Identifying an Optimal Cutpoint for the Diagnosis of Hypertriglyceridemia in the Nonfasting State. Clin. Chem. 2015, 61, 1156–1163. [Google Scholar] [CrossRef] [PubMed]
- Grundy, S.M.; Stone, N.J.; Bailey, A.L.; Beam, C.; Birtcher, K.K.; Blumenthal, R.S.; Braun, L.T.; de Ferranti, S.; Faiella-Tommasino, J.; Forman, D.E.; et al. 2018 AHA/ACC/AACVPR/AAPA/ABC/ACPM/ADA/AGS/APhA/ASPC/NLA/PCNA Guideline on the Management of Blood Cholesterol: A Report of the American College of Cardiology/American Heart Association Task Force on Clinical Practice Guidelines. Circulation. 2019, 139, e1082–e1143. [Google Scholar]
- Nordestgaard, B.G.; Langsted, A.; Mora, S.; Kolovou, G.; Baum, H.; Bruckert, E.; Watts, G.F.; Sypniewska, G.; Wiklund, O.; Borén, J.; et al. Fasting is not routinely required for determination of a lipid profile: Clinical and laboratory implications including flagging at desirable concentration cut-points-a joint consensus statement from the European Atherosclerosis Society and European Federation of Clinical Chemistry and Laboratory Medicine. Eur. Heart. J. 2016, 37, 1944–1958. [Google Scholar]
- Japan Atherosclerosis Society (JAS). Guidelines for Prevention of Atherosclerotic Cardiovascular Diseases 2022.
- Masuda, D.; Sakai, N.; Sugimoto, T.; Kitazume-Taneike, R.; Yamashita, T.; Kawase, R.; Nakaoka, H.; Inagaki, M.; Nakatani, K.; et al. Fasting serum apolipoprotein B-48 can be a marker of postprandial hyperlipidemia. J. Atheroscler. Thromb. 2011, 18, 1062–1070. [Google Scholar] [CrossRef]
- Nakajima, K.; Saito, T.; Tamura, A.; Suzuki, M.; Nakano, T.; Adachi, M.; Tanaka, A.; Tada, N.; Nakamura, H.; Campos, E.; et al. Cholesterol in remnant-like lipoproteins in human serum using monoclonal anti apo B-100 and anti apo A-I immunoaffinity mixed gels. Clin. Chim. Acta. 1993, 223, 53–71. [Google Scholar] [CrossRef] [PubMed]
- Campos, E.; Nakajima, K.; Tanaka, A.; Havel, R.J. Properties of an apolipoprotein E-enriched fraction of triglyceride-rich lipoproteins isolated from human blood plasma with a monoclonal antibody to apolipoprotein B-100. J. Lipid. Res. 1992, 33, 369–380. [Google Scholar] [CrossRef] [PubMed]
- Vigne, J.L.; Havel, R.J. Metabolism of apolipoprotein A-I of chylomicrons in rats and humans. Can. J. Biochem. 1981, 59, 613–618. [Google Scholar] [CrossRef]
- Marcoux, C.; Tremblay, M.; Nakajima, K.; Davignon, J.; Cohn, J.S. Characterization of remnant-like particles isolated by immunoaffinity gel from the plasma of type III and type IV hyperlipoproteinemic patients. J. Lipid. Res. 1999, 40, 636–647. [Google Scholar] [CrossRef] [PubMed]
- Miyauchi, K.; Kayahara, N.; Ishigami, M.; Kuwata, H.; Mori, H.; Sugiuchi, H.; Irie, T.; Tanaka, A.; Yamashita, S.; Yamamura, T. Development of a homogeneous assay to measure remnant lipoprotein cholesterol. Clin. Chem. 2007, 53, 2128–2135. [Google Scholar] [CrossRef] [PubMed]
- Nakada, Y.; Kurosawa, H.; Tohyama, J.; Inoue, Y.; Ikewaki, K. Increased remnant lipoprotein in patients with coronary artery disease--evaluation utilizing a newly developed remnant assay, remnant lipoproteins cholesterol homogenous assay (RemL-C). J. Atheroscler. Thromb. 2007, 14, 56–64. [Google Scholar] [CrossRef] [PubMed]
- Yoshida, H.; Kurosawa, H.; Hirowatari, Y.; Ogura, Y.; Ikewaki, K.; Abe, I.; Saikawa, S.; Domitsu, K.; Ito, K.; Yanai, H.; et al. Characteristic comparison of triglyceride-rich remnant lipoprotein measurement between a new homogenous assay (RemL-C) and a conventional immunoseparation method (RLP-C). Lipids. Health. Dis. 2008, 7, 18. [Google Scholar] [CrossRef] [PubMed]
- Mahley, R.W.; Huang, Y.; Rall, S.C. Jr. Pathogenesis of type III hyperlipoproteinemia (dysbetalipoproteinemia). Questions, quandaries, and paradoxes. J. Lipid. Res. 1999, 40, 1933–1949. [Google Scholar] [CrossRef] [PubMed]
- Heidemann, B.E.; Koopal, C.; Roeters van Lennep, J.E.; Stroes, E.S.G.; Riksen, N.P.; Mulder, M.T.; van der Zee, L.C.V.V.; Blackhurst, D.M.; Marais, A.D.; Visseren, F.L.J. Effect of evolocumab on fasting and post fat load lipids and lipoproteins in familial dysbetalipoproteinemia. J. Clin. Lipidol. 2023, 17, 112–123. [Google Scholar] [CrossRef] [PubMed]
- de Beer, F.; Stalenhoef, A.F.; Hoogerbrugge, N.; Kastelein, J.J.; Gevers Leuven, J.A.; van Duijn, C.M.; Havekes, L.M.; Smelt, A.H. Expression of type III hyperlipoproteinemia in apolipoprotein E2 (Arg158 --> Cys) homozygotes is associated with hyperinsulinemia. Arterioscler. Thromb. Vasc. Biol. 2002, 22, 294–299. [Google Scholar] [CrossRef] [PubMed]
- Goldstein, J.L.; Schrott, H.G.; Hazzard, W.R.; Bierman, E.L.; Motulsky, A.G. Hyperlipidemia in coronary heart disease. II. Genetic analysis of lipid levels in 176 families and delineation of a new inherited disorder, combined hyperlipidemia. J. Clin. Investig. 1973, 52, 1544–1568. [Google Scholar] [CrossRef]
- Cabezas, M.C.; de Bruin, T.W.; Kock, L.A.; Kortlandt, W.; Van Linde-Sibenius Trip, M.; Jansen, H.; Erkelens, D.W. Simvastatin improves chylomicron remnant removal in familial combined hyperlipidemia without changing chylomicron conversion. Metabolism. 1993, 42, 497–503. [Google Scholar] [CrossRef] [PubMed]
- Cabezas, M.C.; de Bruin, T.W.; Jansen, H.; Kock, L.A.; Kortlandt, W.; Erkelens, D.W. Impaired chylomicron remnant clearance in familial combined hyperlipidemia. Arterioscler. Thromb. 1993, 13, 804–814. [Google Scholar] [CrossRef] [PubMed]
- Castro Cabezas,M. ; Erkelens, D.W.; Kock, L.A.; De Bruin, T.W. Postprandial apolipoprotein B100 and B48 metabolism in familial combined hyperlipidaemia before and after reduction of fasting plasma triglycerides. Eur. J. Clin. Investig. 1994, 24, 669–678. [Google Scholar] [CrossRef] [PubMed]
- Meijssen, S.; Cabezas, M.C.; Twickler, T.B.; Jansen, H.; Erkelens, D.W. In vivo evidence of defective postprandial and postabsorptive free fatty acid metabolism in familial combined hyperlipidemia. J. Lipid. Res. 2000, 41, 1096–1102. [Google Scholar] [CrossRef]
- de Graaf, J.; van der Vleuten, G.M.; ter Avest, E.; Dallinga-Thie, G.M.; Stalenhoef, A.F. High plasma level of remnant-like particles cholesterol in familial combined hyperlipidemia. J. Clin. Endocrinol. Metab. 2007, 92, 1269–1275. [Google Scholar] [CrossRef]
- Carr, M.C.; Brunzell, J.D. Abdominal obesity and dyslipidemia in the metabolic syndrome: Importance of type 2 diabetes and familial combined hyperlipidemia in coronary artery disease risk. J. Clin. Endocrinol. Metab. 2004, 89, 2601–2607. [Google Scholar] [CrossRef] [PubMed]
- Brahm, A.J.; Hegele, R.A. Combined hyperlipidemia: Familial but not (usually) monogenic. Curr. Opin. Lipidol. 2016, 27, 131–140. [Google Scholar] [CrossRef]
- Shoji, T.; Emoto, M.; Kawagishi, T.; Kimoto, E.; Yamada, A.; Tabata, T.; Ishimura, E.; Inaba, M.; Okuno, Y.; Nishizawa, Y. Atherogenic lipoprotein changes in diabetic nephropathy. Atherosclerosis. 2001, 156, 425–433. [Google Scholar] [CrossRef] [PubMed]
- Pandya, V.; Rao, A.; Chaudhary, K. Lipid abnormalities in kidney disease and management strategies. World. J. Nephrol. 2015, 4, 83–91. [Google Scholar] [CrossRef] [PubMed]
- Shoji, T.; Abe, T.; Matsuo, H.; Egusa, G.; Yamasaki, Y.; Kashihara, N.; Shirai, K.; Kashiwagi, A. Committee of Renal and Peripheral Arteries, Japan Atherosclerosis Society. Chronic kidney disease, dyslipidemia, and atherosclerosis. J. Atheroscler. Thromb. 2012, 19, 299–315. [Google Scholar] [CrossRef] [PubMed]
- Hirowatari, Y.; Yoshida, H.; Fueki, Y.; Ito, M.; Ogura, Y.; Sakurai, N.; Miida, T. Measurement of cholesterol concentrations of major serum lipoprotein classes in haemodialysis patients by anion-exchange chromatography. Ann. Clin. Biochem. 2008, 45, 571–574. [Google Scholar] [CrossRef] [PubMed]
- Drukker, A.; Levy, E.; Bronza, N.; Stankiewicz, H.; Goldstein, R. Impaired intestinal fat absorption in chronic renal failure. Nephron. 1982, 30, 154–160. [Google Scholar] [CrossRef]
- Nestel, P.J.; Fidge, N.H.; Tan, M.H. Increased lipoprotein-remnant formation in chronic renal failure. N. Engl. J. Med. 1982, 307, 329–333. [Google Scholar] [CrossRef]
- Yanai, H.; Yoshida, H.; Tomono, Y.; Hirowatari, Y.; Kurosawa, H.; Matsumoto, A.; Tada, N. Effects of diacylglycerol on glucose, lipid metabolism, and plasma serotonin levels in lean Japanese. Obesity (Silver Spring). 2008, 16, 47–51. [Google Scholar] [CrossRef]
- Ito, K.; Yoshida, H.; Yanai, H.; Kurosawa, H.; Sato, R.; Manita, D.; Hirowatari, Y.; Tada, N.; et al. Relevance of intermediate-density lipoprotein cholesterol to Framingham risk score of coronary heart disease in middle-aged men with increased non-HDL cholesterol. Int. J. Cardiol. 2013, 168, 3853–3858. [Google Scholar] [CrossRef]
- Yoshida, H.; Hirowatari, Y.; Kurosawa, H.; Manita, D.; Yanai, H.; Ito, K.; Tada, N. Estimation of lipoprotein profile in patients with type II diabetes and its relevance to remnant lipoprotein cholesterol levels. Atherosclerosis. 2012, 222, 541–544. [Google Scholar] [CrossRef]
- Yanai, H.; Hamasaki, H.; Adachi, H.; Moriyama, S.; Hirowatari, Y. Effects of liraglutide, a human glucagon-like peptide-1 analog, on glucose/lipid metabolism, and adipocytokines in patients with type 2 diabetes. J. Endocrinol. Metab. 2011, 1, 149–151. [Google Scholar] [CrossRef]
- Yanai, H.; Hirowatari, Y.; Ito, K.; Kurosawa, H.; Tada, N.; Yoshida, H. Understanding of Diabetic Dyslipidemia by Using the Anion-Exchange High Performance Liquid Chromatography Data. J. Clin. Med. Res. 2016, 8, 424–426. [Google Scholar] [CrossRef]
- Sztalryd, C.; Kraemer, F.B. Regulation of hormone-sensitive lipase in streptozotocin-induced diabetic rats. Metabolism. 1995, 44, 1391–1396. [Google Scholar] [CrossRef]
- Fisher, E.A. The degradation of apolipoprotein B100: Multiple opportunities to regulate VLDL triglyceride production by different proteolytic pathways. Biochim. Biophys. Acta. 2012, 1821, 778–781. [Google Scholar] [CrossRef] [PubMed]
- Taghibiglou, C.; Carpentier, A.; Van Iderstine, S.C.; Chen, B.; Rudy, D.; Aiton, A.; Lewis, G.F.; Adeli, K. . Mechanisms of hepatic very low density lipoprotein overproduction in insulin resistance. Evidence for enhanced lipoprotein assembly, reduced intracellular ApoB degradation, and increased microsomal triglyceride transfer protein in a fructose-fed hamster model. J. Biol. Chem. 2000, 275, 8416–8425. [Google Scholar] [PubMed]
- Avramoglu, R.K.; Basciano, H.; Adeli, K. Lipid and lipoprotein dysregulation in insulin resistant states. Clin. Chim. Acta. 2006, 368, 1–19. [Google Scholar] [CrossRef]
- Takahashi, S.; Sakai, J.; Fujino, T.; Hattori, H.; Zenimaru, Y.; Suzuki, J.; Miyamori, I.; Yamamoto, T.T. The very low-density lipoprotein (VLDL) receptor: Characterization and functions as a peripheral lipoprotein receptor. J. Atheroscler. Thromb. 2004, 11, 200–208. [Google Scholar] [CrossRef] [PubMed]
- Yuan, G.; Liu, Y.; Sun, T.; Xu, Y.; Zhang, J.; Yang, Y.; Zhang, M.; Cianflone, K.; Wang, D.W. The therapeutic role of very low-density lipoprotein receptor gene in hyperlipidemia in type 2 diabetic rats. Hum. Gene. Ther. 2011, 22, 302–312. [Google Scholar] [CrossRef] [PubMed]
- Nikkila, E.A.; Huttunen, J.K.; Ehnholm, C. Postheparin plasma lipoprotein lipase and hepatic lipase in diabetes mellitus. Relationship to plasma triglyceride metabolism. Diabetes. 1977, 26, 11–21. [Google Scholar] [CrossRef]
- de Silva, H.V.; Lauer, S.J.; Wang, J.; Simonet, W.S.; Weisgraber, K.H.; Mahley, R.W.; Taylor, J.M. Overexpression of human apolipoprotein C-III in transgenic mice results in an accumulation of apolipoprotein B48 remnants that is corrected by excess apolipoprotein E. J. Biol. Chem. 1994, 269, 2324–2335. [Google Scholar] [CrossRef]
- Cohn, J.S.; Patterson, B.W.; Uffelman, K.D.; Davignon, J.; Steiner, G. Rate of production of plasma and very-low-density lipoprotein (VLDL) apolipoprotein C-III is strongly related to the concentration and level of production of VLDL triglyceride in male subjects with different body weights and levels of insulin sensitivity. J. Clin. Endocrinol. Metab. 2004, 89, 3949–3955. [Google Scholar] [CrossRef] [PubMed]
- Nikkila, E.A.; Taskinen, M.R.; Kekki, M. Relation of plasma high-density lipoprotein cholesterol to lipoprotein-lipase activity in adipose tissue and skeletal muscle of man. Atherosclerosis. 1978, 29, 497–501. [Google Scholar] [CrossRef]
- Baynes, C.; Henderson, A.D.; Anyaoku, V.; Richmond, W.; Hughes, C.L.; Johnston, D.G.; Elkeles, R.S. The role of insulin insensitivity and hepatic lipase in the dyslipidaemia of type 2 diabetes. Diabet. Med. 1991, 8, 560–566. [Google Scholar] [CrossRef]
- Carr, M.C.; Hokanson, J.E.; Zambon, A.; Deeb, S.S.; Barrett, P.H.; Purnell, J.Q.; Brunzell, J.D. The contribution of intraabdominal fat to gender differences in hepatic lipase activity and low/high density lipoprotein heterogeneity. J. Clin. Endocrinol. Metab. 2001, 86, 2831–2837. [Google Scholar] [CrossRef] [PubMed]
- Allayee, H.; Dominguez, K.M.; Aouizerat, B.E.; Krauss, R.M.; Rotter, J.I.; Lu, J.; Cantor, R.M.; de Bruin, T.W.; Lusis, A.J. Contribution of the hepatic lipase gene to the atherogenic lipoprotein phenotype in familial combined hyperlipidemia. J. Lipid. Res. 2000, 41, 245–252. [Google Scholar] [CrossRef] [PubMed]
- Deeb, S.S.; Zambon, A.; Carr, M.C.; Ayyobi, A.F.; Brunzell, J.D. Hepatic lipase and dyslipidemia: Interactions among genetic variants, obesity, gender, and diet. J. Lipid. Res. 2003, 44, 1279–1286. [Google Scholar] [CrossRef] [PubMed]
- Chandra, N.C. A comprehensive account of insulin and LDL receptor activity over the years: A highlight on their signaling and functional role. J. Biochem. Mol. Toxicol. 2021, 35, e22840. [Google Scholar] [CrossRef] [PubMed]
- Lally, S.; Owens, D.; Tomkin, G.H. Genes that affect cholesterol synthesis, cholesterol absorption, and chylomicron assembly: The relationship between the liver and intestine in control and streptozotosin diabetic rats. Metabolism. 2007, 56, 430–438. [Google Scholar] [CrossRef] [PubMed]
- Lally, S.; Tan, C.Y.; Owens, D.; Tomkin, G.H. Messenger RNA levels of genes involved in dysregulation of postprandial lipoproteins in type 2 diabetes: The role of Niemann-Pick C1-like 1, ATP-binding cassette, transporters G5 and G8, and of microsomal triglyceride transfer protein. Diabetologia. 2006, 49, 1008–1016. [Google Scholar] [CrossRef]
- Kinoshita, M.; Ohnishi, H.; Maeda, T.; Yoshimura, N.; Takeoka, Y.; Yasuda, D.; Kusano, J.; Mashimo, Y.; Saito, S.; Shimamoto, K.; et al. Increased serum apolipoprotein B48 concentration in patients with metabolic syndrome. J. Atheroscler. Thromb. 2009, 16, 517–522. [Google Scholar] [CrossRef]
- Irawati, D.; Mamo, J.C.; Dhaliwal, S.S.; Soares, M.J.; Slivkoff-Clark, K.M.; James, A.P. Plasma triglyceride and high density lipoprotein cholesterol are poor surrogate markers of pro-atherogenic chylomicron remnant homeostasis in subjects with the metabolic syndrome. Lipids. Health. Dis. 2016, 15, 169. [Google Scholar] [CrossRef]
- Actis Dato, V.; Chiabrando, G.A. The Role of Low-Density Lipoprotein Receptor-Related Protein 1 in Lipid Metabolism, Glucose Homeostasis and Inflammation. Int. J. Mol. Sci. 2018, 19, 1780. [Google Scholar] [CrossRef] [PubMed]
- Laatsch, A.; Merkel, M.; Talmud, P.J.; Grewal, T.; Beisiegel, U.; Heeren, J. Insulin stimulates hepatic low density lipoprotein receptor-related protein 1 (LRP1) to increase postprandial lipoprotein clearance. Atherosclerosis. 2009, 204, 105–111. [Google Scholar] [CrossRef]
- Haas, M.E.; Attie, A.D.; Biddinger, S.B. The regulation of ApoB metabolism by insulin. Trends. Endocrinol. Metab. 2013, 24, 391–397. [Google Scholar] [CrossRef] [PubMed]
- Carstensen, M.; Thomsen, C.; Hermansen, K. Incremental area under response curve more accurately describes the triglyceride response to an oral fat load in both healthy and type 2 diabetic subjects. Metabolism. 2003, 52, 1034–1037. [Google Scholar] [CrossRef]
- Umpaichitra, V.; Banerji, M.A.; Castells, S. Postprandial hyperlipidemia after a fat loading test in minority adolescents with type 2 diabetes mellitus and obesity. J. Pediatr. Endocrinol. Metab. 2004, 17, 853–864. [Google Scholar] [CrossRef] [PubMed]
- Watanabe, N.; Taniguchi, T.; Taketoh, H.; Kitagawa, Y.; Namura, H.; Yoneda, N.; Kurimoto, Y.; Yamada, S.; Ishikawa, Y. Elevated remnant-like lipoprotein particles in impaired glucose tolerance and type 2 diabetic patients. Diabetes. Care. 1999, 22, 152–156. [Google Scholar] [CrossRef]
- Vilsbøll, T.; Holst, J.J. Incretins, insulin secretion and Type 2 diabetes mellitus. Diabetologia. 2004, 47, 357–366. [Google Scholar] [CrossRef]
- DeFronzo, R.A. Pathogenesis of type 2 (non-insulin dependent) diabetes mellitus: A balanced overview. Diabetologia. 1992, 35, 389–397. [Google Scholar] [CrossRef]
- Kawamori, R. The biology of insulin action in diabetes. In Turke, J.R.; et al. Diabetes in the New Millennium; Wiley: Hoboken, NJ, USA, 1999; pp. 73–84. [Google Scholar]
- de Vries, M.A.; Alipour, A.; Klop, B.; van de Geijn, G.J.; Janssen, H.W.; Njo, T.L.; van der Meulen, N.; Rietveld, A.P.; Liem, A.H.; Westerman, E.M.; et al. Glucose-dependent leukocyte activation in patients with type 2 diabetes mellitus, familial combined hyperlipidemia and healthy controls. Metabolism. 2015, 64, 213–217. [Google Scholar] [CrossRef] [PubMed]
- Vakkilainen, J.; Porkka, K.V.; Nuotio, I.; Pajukanta, P.; Suurinkeroinen, L.; Ylitalo, K.; Viikari, J.S.; Ehnholm, C.; Taskinen, M.R. Glucose intolerance in familial combined hyperlipidaemia. EUFAM study group. Eur. J. Clin. Investig 1998, 28, 24–32. [Google Scholar] [CrossRef]
- Ascaso, J.F.; Sales, J.; Merchante, A.; Real, J.; Lorente, R.; Martinez-Valls, J.; Carmena, R. Influence of obesity on plasma lipoproteins, glycaemia and insulinaemia in patients with familial combined hyperlipidaemia. Int. J. Obes. Relat. Metab. Disord. 1997, 21, 360–366. [Google Scholar] [CrossRef] [PubMed]
- Jadhakhan, F.; Marshall, T.; Ryan, R.; Gill, P. Risk of chronic kidney disease in young adults with impaired glucose tolerance/impaired fasting glucose: A retrospective cohort study using electronic primary care records. BMC. Nephrol. 2018, 19, 42. [Google Scholar] [CrossRef] [PubMed]
- Canpolat, N.; Caliskan, S.; Sever, L.; Guzeltas, A.; Kantarci, F.; Candan, C.; Civilibal, M.; Kasapcopur, O.; Arisoy, N. Glucose intolerance: Is it a risk factor for cardiovascular disease in children with chronic kidney disease? Pediatr. Nephrol. 2012, 27, 627–635. [Google Scholar] [CrossRef] [PubMed]
- Ikee, R.; Honda, K.; Ishioka, K.; Oka, M.; Maesato, K.; Moriya, H.; Hidaka, S.; Ohtake, T.; Kobayashi, S. Postprandial hyperglycemia and hyperinsulinemia associated with renal arterio-arteriolosclerosis in chronic kidney disease. Hypertens. Res. 2010, 33, 499–504. [Google Scholar] [CrossRef] [PubMed]
- Ai, M.; Tanaka, A.; Ogita, K.; Sekinc, M.; Numano, F.; Numano, F.; Reaven, G.M. Relationship between plasma insulin concentration and plasma remnant lipoprotein response to an oral fat load in patients with type 2 diabetes. J. Am. Coll. Cardiol. 2001, 38, 1628–1632. [Google Scholar] [CrossRef] [PubMed]
- Costantino, S.; Paneni, F.; Battista, R.; Castello, L.; Capretti, G.; Chiandotto, S.; Tanese, L.; Russo, G.; Pitocco, D.; Lanza, G.A.; et al. Impact of Glycemic Variability on Chromatin Remodeling, Oxidative Stress, and Endothelial Dysfunction in Patients With Type 2 Diabetes and With Target HbA1c Levels. Diabetes. 2017, 66, 2472–2482. [Google Scholar] [CrossRef] [PubMed]
- Akasaka, T.; Sueta, D.; Tabata, N.; Takashio, S.; Yamamoto, E.; Izumiya, Y.; Tsujita, K.; Kojima, S.; Kaikita, K.; Matsui, K.; et al. Effects of the Mean Amplitude of Glycemic Excursions and Vascular Endothelial Dysfunction on Cardiovascular Events in Nondiabetic Patients With Coronary Artery Disease. J. Am. Heart. Assoc. 2017, 6, e004841. [Google Scholar] [CrossRef]
- Zhang, X.G.; Zhang, Y.Q.; Zhao, D.K.; Wu, J.X.; Zhao, J.; Jiao, X.M.; Chen, B.; Lv, X.F. Relationship between blood glucose fluctuation and macrovascular endothelial dysfunction in type 2 diabetic patients with coronary heart disease. Eur. Rev. Med. Pharmacol. Sci. 2014, 18, 3593–3600. [Google Scholar]
- O'Keefe, J.H.; Gheewala, N.M.; O'Keefe, J.O. Dietary strategies for improving post-prandial glucose, lipids, inflammation, and cardiovascular health. J. Am. Coll. Cardiol. 2008, 51, 249–255. [Google Scholar] [CrossRef] [PubMed]
- Yamashita, S.; Arai, H.; Yokote, K.; Araki, E.; Suganami, H.; Ishibashi, S.; K-877 Study Group. Effects of pemafibrate (K-877) on cholesterol efflux capacity and postprandial hyperlipidemia in patients with atherogenic dyslipidemia. J. Clin. Lipidol. 2018, 12, 1267–1279. [Google Scholar] [CrossRef]
- Yanai, H.; Katsuyama, H.; Hakoshima, M. Effects of a Novel Selective Peroxisome Proliferator-Activated Receptor α Modulator, Pemafibrate, on Metabolic Parameters: A Retrospective Longitudinal Study. Biomedicines. 2022, 10, 401. [Google Scholar] [CrossRef] [PubMed]
- Ohno, Y.; Miyoshi, T.; Noda, Y.; Oe, H.; Toh, N.; Nakamura, K.; Kohno, K.; Morita, H.; Ito, H. Bezafibrate improves postprandial hypertriglyceridemia and associated endothelial dysfunction in patients with metabolic syndrome: A randomized crossover study. Cardiovasc. Diabetol. 2014, 13, 71. [Google Scholar] [CrossRef] [PubMed]
- Nakamura, A.; Sato, K.; Kanazawa, M.; Kondo, M.; Endo, H.; Takahashi, T.; Nozaki, E. Impact of decreased insulin resistance by ezetimibe on postprandial lipid profiles and endothelial functions in obese, non-diabetic-metabolic syndrome patients with coronary artery disease. Heart. Vessels. 2019, 34, 916–925. [Google Scholar] [CrossRef]
- Sawada, T.; Tsubata, H.; Hashimoto, N.; Takabe, M.; Miyata, T.; Aoki, K.; Yamashita, S.; Oishi, S.; Osue, T.; Yokoi, K.; et al. Effects of 6-month eicosapentaenoic acid treatment on postprandial hyperglycemia, hyperlipidemia, insulin secretion ability, and concomitant endothelial dysfunction among newly-diagnosed impaired glucose metabolism patients with coronary artery disease. An open label, single blinded, prospective randomized controlled trial. Cardiovasc. Diabetol. 2016, 15, 121. [Google Scholar]
- Weintraub, M.S.; Charach, G.; Grosskopf, I. Effects of fibric acid derivatives and metformin on postprandial lipemia. Atherosclerosis. 1998, 141, S71–S75. [Google Scholar] [CrossRef] [PubMed]
- Kado, S.; Murakami, T.; Aoki, A.; Nagase, T.; Katsura, Y.; Noritake, M.; Matsuoka, T.; Nagata, N. Effect of acarbose on postprandial lipid metabolism in type 2 diabetes mellitus. Diabetes. Res. Clin. Pract. 1998, 41, 49–55. [Google Scholar] [CrossRef]
- Abbasi, F.; Lamendola, C.; Leary, E.T.; Reaven, G.M. Pioglitazone decreases postprandial accumulation of remnant lipoproteins in insulin-resistant smokers. Diabetes. Obes. Metab. 2009, 11, 779–785. [Google Scholar] [CrossRef]
- Mori, Y.; Itoh, Y.; Obata, T.; Tajima, N. Effects of pioglitazone vs glibenclamide on postprandial increases in glucose and triglyceride levels and on oxidative stress in Japanese patients with type 2 diabetes. Endocrine. 2006, 29, 143–148. [Google Scholar] [CrossRef]
- Noda, Y.; Miyoshi, T.; Oe, H.; Ohno, Y.; Nakamura, K.; Toh, N.; Kohno, K.; Morita, H.; Kusano, K.; Ito, H. Alogliptin ameliorates postprandial lipemia and postprandial endothelial dysfunction in non-diabetic subjects: A preliminary report. Cardiovasc. Diabetol. 2013, 12, 8. [Google Scholar] [CrossRef]
- Derosa, G.; Bonaventura, A.; Bianchi, L.; Romano, D.; Fogari, E.; D'Angelo, A.; Maffioli, P. Vildagliptin compared to glimepiride on post-prandial lipemia and on insulin resistance in type 2 diabetic patients. Metabolism. 2014, 63, 957–967. [Google Scholar] [CrossRef] [PubMed]
- Taskinen, M.R.; Björnson, E.; Matikainen, N.; Söderlund, S.; Pietiläinen, K.H.; Ainola, M.; Hakkarainen, A.; Lundbom, N.; Fuchs, J.; Thorsell, A.; et al. Effects of liraglutide on the metabolism of triglyceride-rich lipoproteins in type 2 diabetes. Diabetes. Obes. Metab. 2021, 23, 1191–1201. [Google Scholar] [CrossRef] [PubMed]
- Hermansen, K.; Bækdal, T.A.; Düring, M.; Pietraszek, A.; Mortensen, L.S.; Jørgensen, H.; Flint, A. Liraglutide suppresses postprandial triglyceride and apolipoprotein B48 elevations after a fat-rich meal in patients with type 2 diabetes: A randomized, double-blind, placebo-controlled, cross-over trial. Diabetes. Obes. Metab. 2013, 15, 1040–1048. [Google Scholar] [CrossRef] [PubMed]
- Bunck, M.C.; Cornér, A.; Eliasson, B.; Heine, R.J.; Shaginian, R.M.; Wu, Y.; Yan, P.; Smith, U.; Yki-Järvinen, H.; Diamant, M.; et al. One-year treatment with exenatide vs. insulin glargine: Effects on postprandial glycemia, lipid profiles, and oxidative stress. Atherosclerosis. 2010, 212, 223–229. [Google Scholar] [CrossRef]
- Katsuyama, H.; Hakoshima, M.; Umeyama, S.; Iida, S.; Adachi, H.; Yanai, H. Real-World Efficacy of Glucagon-like Peptide-1 (GLP-1) Receptor Agonist, Dulaglutide, on Metabolic Parameters in Japanese Patients with Type 2 Diabetes: A Retrospective Longitudinal Study. Biomedicines. 2023, 11, 869. [Google Scholar] [CrossRef]
- Yanai, H.; Hakoshima, M.; Adachi, H.; Katsuyama, H. A Significant Effect of Oral Semaglutide on Cardiovascular Risk Factors in Patients With Type 2 Diabetes. Cardiol. Res. 2022, 13, 303–308. [Google Scholar] [CrossRef]
- Kakuda, H.; Kobayashi, J.; Sakurai, M.; Kakuda, M.; Takekoshi, N. The Effect of Tofogliflozin Treatment on Postprandial Glucose and Lipid Metabolism in Japanese Men With Type 2 Diabetes: A Pilot Study. J. Clin. Med. Res. 2017, 9, 403–409. [Google Scholar] [CrossRef]
- Burggraaf, B.; Pouw, N.M.C.; Fernández Arroyo, S.; van Vark-van der Zee, L.C.; van de Geijn, G.M.; Birnie, E.; Huisbrink, J.; van der Zwan, E.M.; de Herder, W.W.; Mulder, M.T.; et al. Effects of dapagliflozin on postprandial lipid metabolism in type 2 diabetes mellitus. Eur. J. Endocrinol. 2022, 186, 597–605. [Google Scholar] [CrossRef]
- Hattori, S. Empagliflozin decreases remnant-like particle cholesterol in type 2 diabetes patients with insulin resistance. J. Diabetes. Investig. 2018, 9, 870–874. [Google Scholar] [CrossRef]
- Yanai, H.; Hakoshima, M.; Adachi, H.; Kawaguchi, A.; Waragai, Y.; Harigae, T.; Masui, Y.; Kakuta, K.; Hamasaki, H.; Katsuyama, H.; et al. Effects of Six Kinds of Sodium-Glucose Cotransporter 2 Inhibitors on Metabolic Parameters, and Summarized Effect and Its Correlations With Baseline Data. J. Clin. Med. Res. 2017, 9, 605–612. [Google Scholar] [CrossRef]
- Yanai, H.; Hakoshima, M.; Adachi, H.; Katsuyama, H. Multi-Organ Protective Effects of Sodium Glucose Cotransporter 2 Inhibitors. Int. J. Mol. Sci. 2021, 22, 4416. [Google Scholar] [CrossRef] [PubMed]
Figure 1.
Characteristics of lipoproteins including TG-rich lipoproteins which are the main players in postprandial hyperlipidemia and the methods to evaluate TG-rich lipoproteins. The apoproteins possessed by each lipoprotein exhibited only characteristic apoproteins. CM, chylomicron; CMR, CM remnant; HDL, high-density lipoprotein; Rem-C, remnant lipoprotein cholesterol; RLP-C, remnant-like lipoprotein particles cholesterol; TG, triglyceride; VLDL, very-low-density lipoprotein; VLDLR, VLDL remnant.
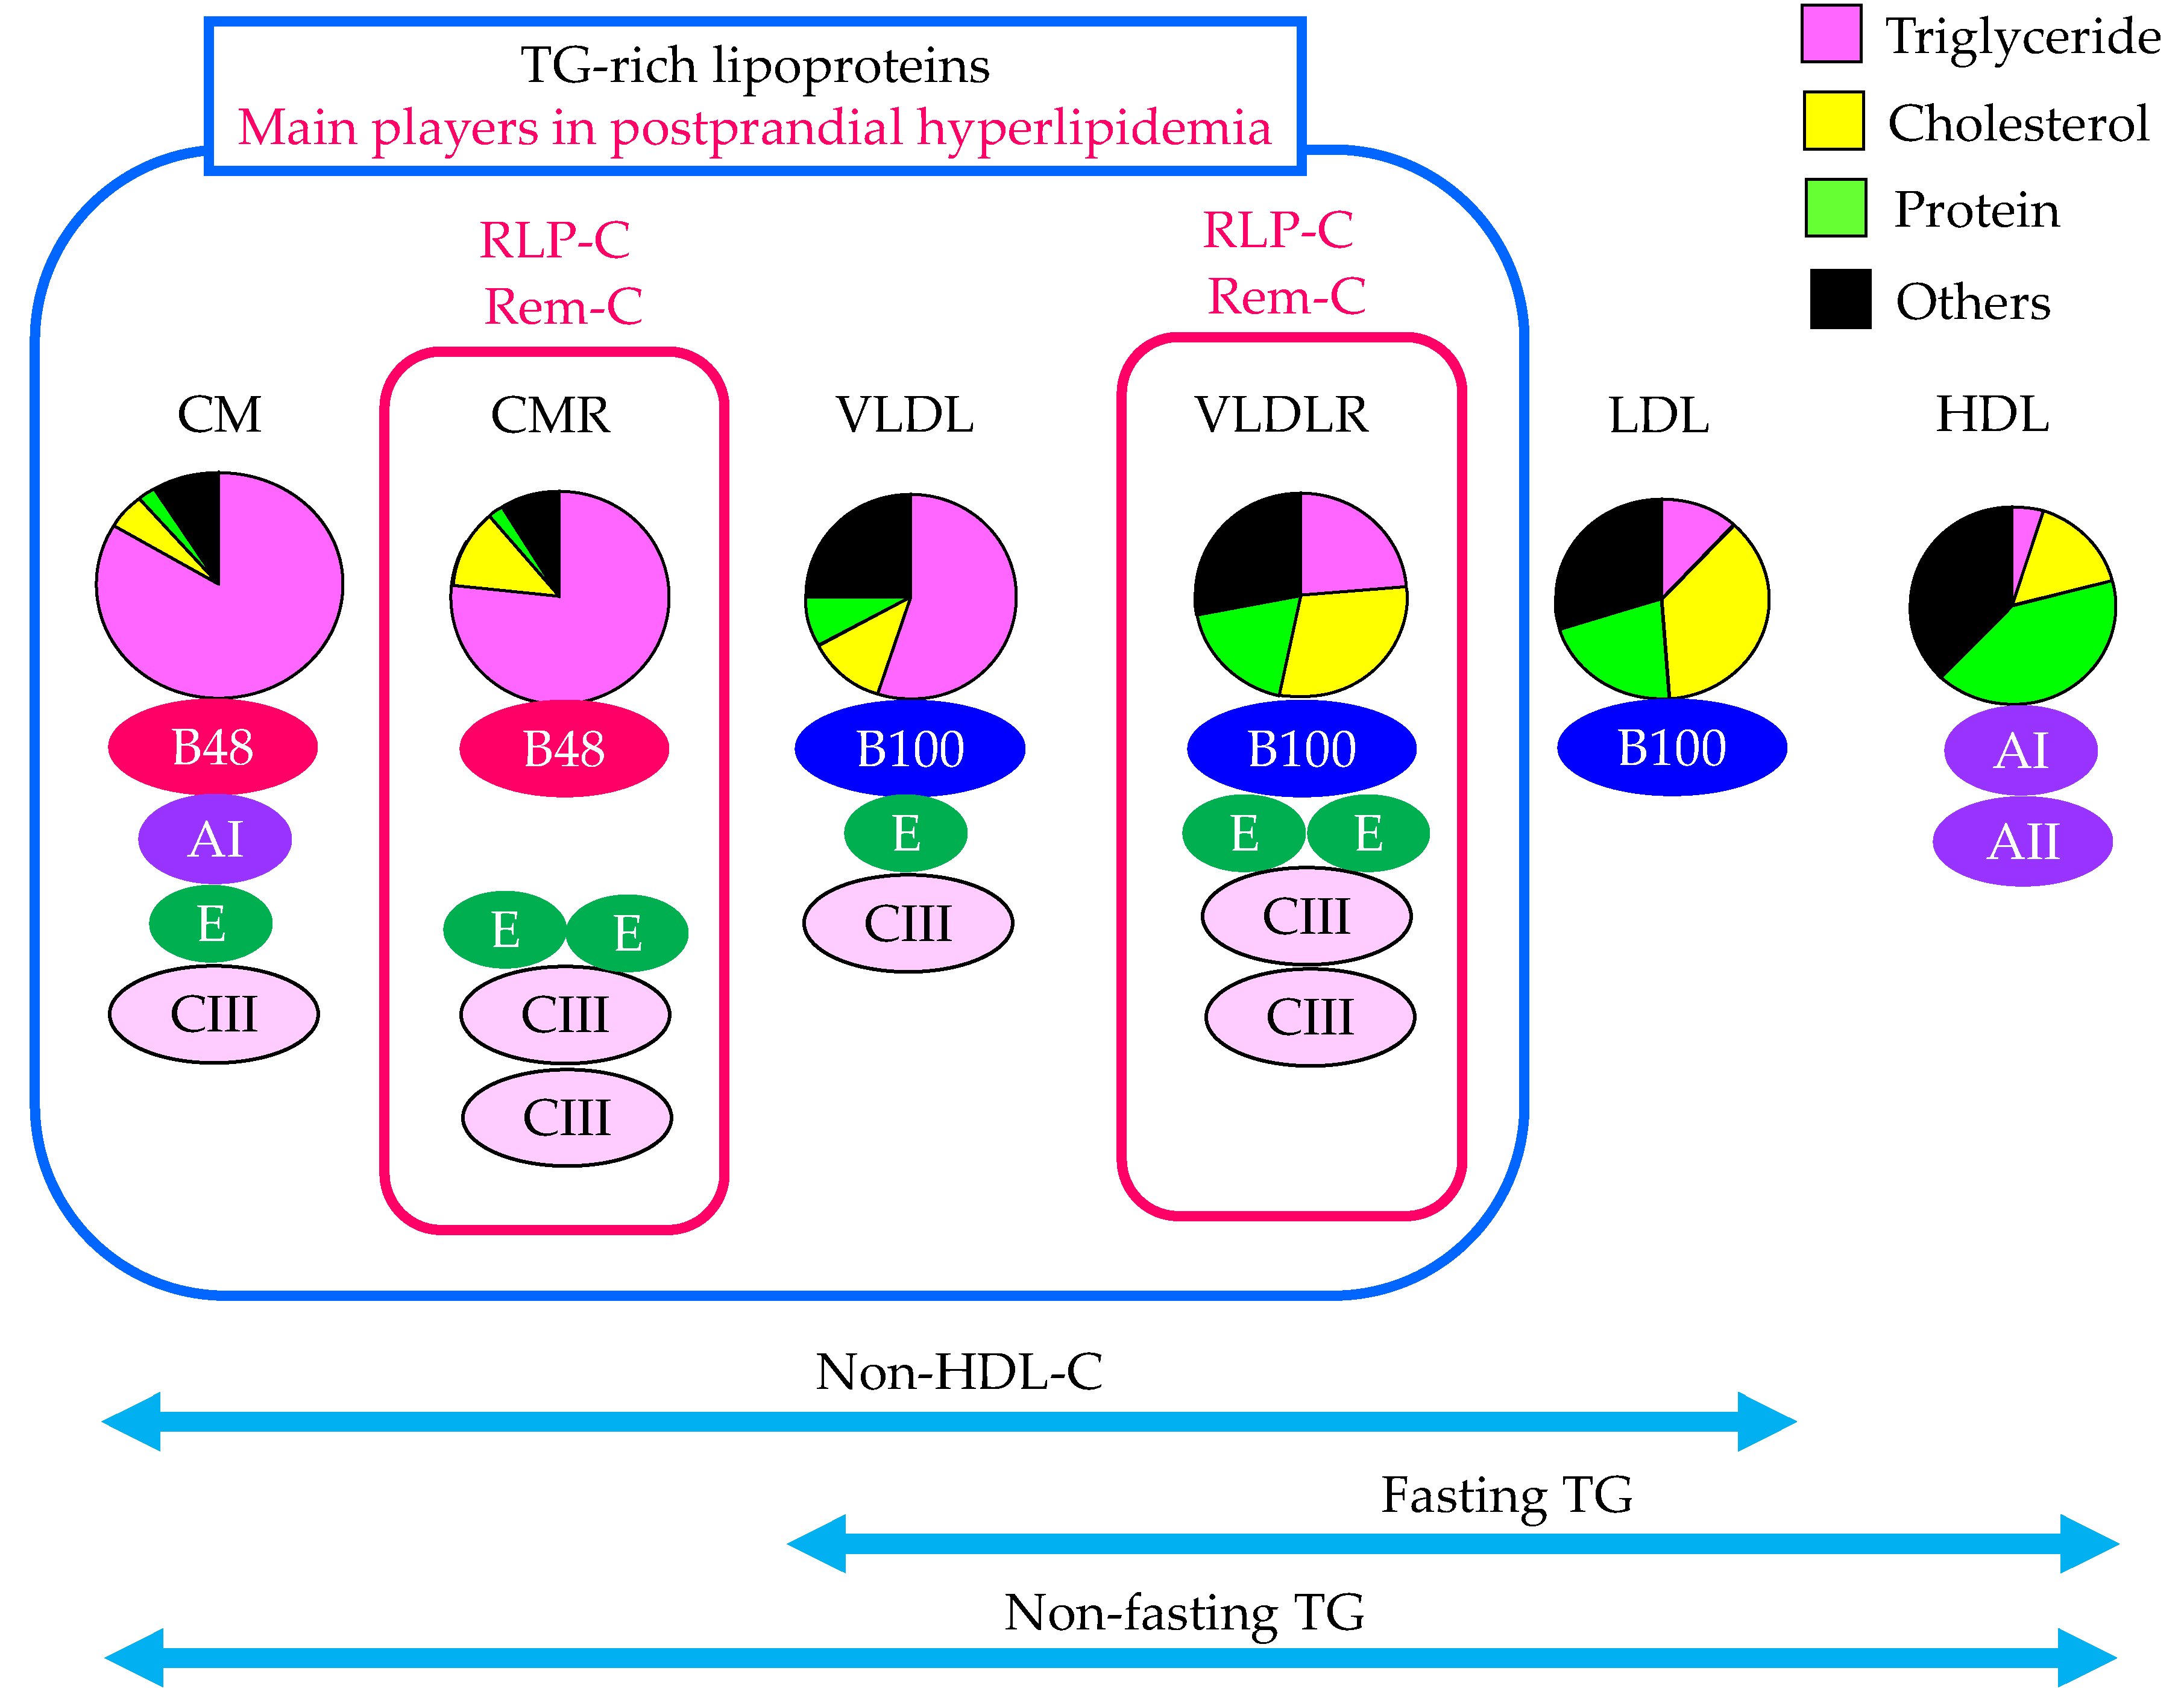
Figure 2.
The effects of insulin resistance on TG-rich lipoproteins metabolism. Solid black and dotted lines indicate the flow of substances and effects of metabolic changes, respectively. Red and blue arrows indicate increase and decrease in activity or expression of metabolic factors, respectively. C, cholesterol; CM, chylomicron; CMR, chylomicron remnant; FFA, free fatty acid; HDL, high-density lipoprotein; HL, hepatic lipase; HSL, hormone sensitive lipase; LDL, low-density lipoprotein; LDL-R, LDL receptor; LRP1, LDL receptor-related protein 1; LPL, lipoprotein lipase; MTP, microsomal triglyceride transfer protein; NPC1L1, Niemann-Pick C1-Like 1; Sd-LDL, small dense LDL; SREBP-1c, sterol regulatory element binding protein 1c; TG, triglyceride; VLDL, very-low-density lipoprotein; VLDLR, VLDL remnant; VDLD-R, VLDL receptor.
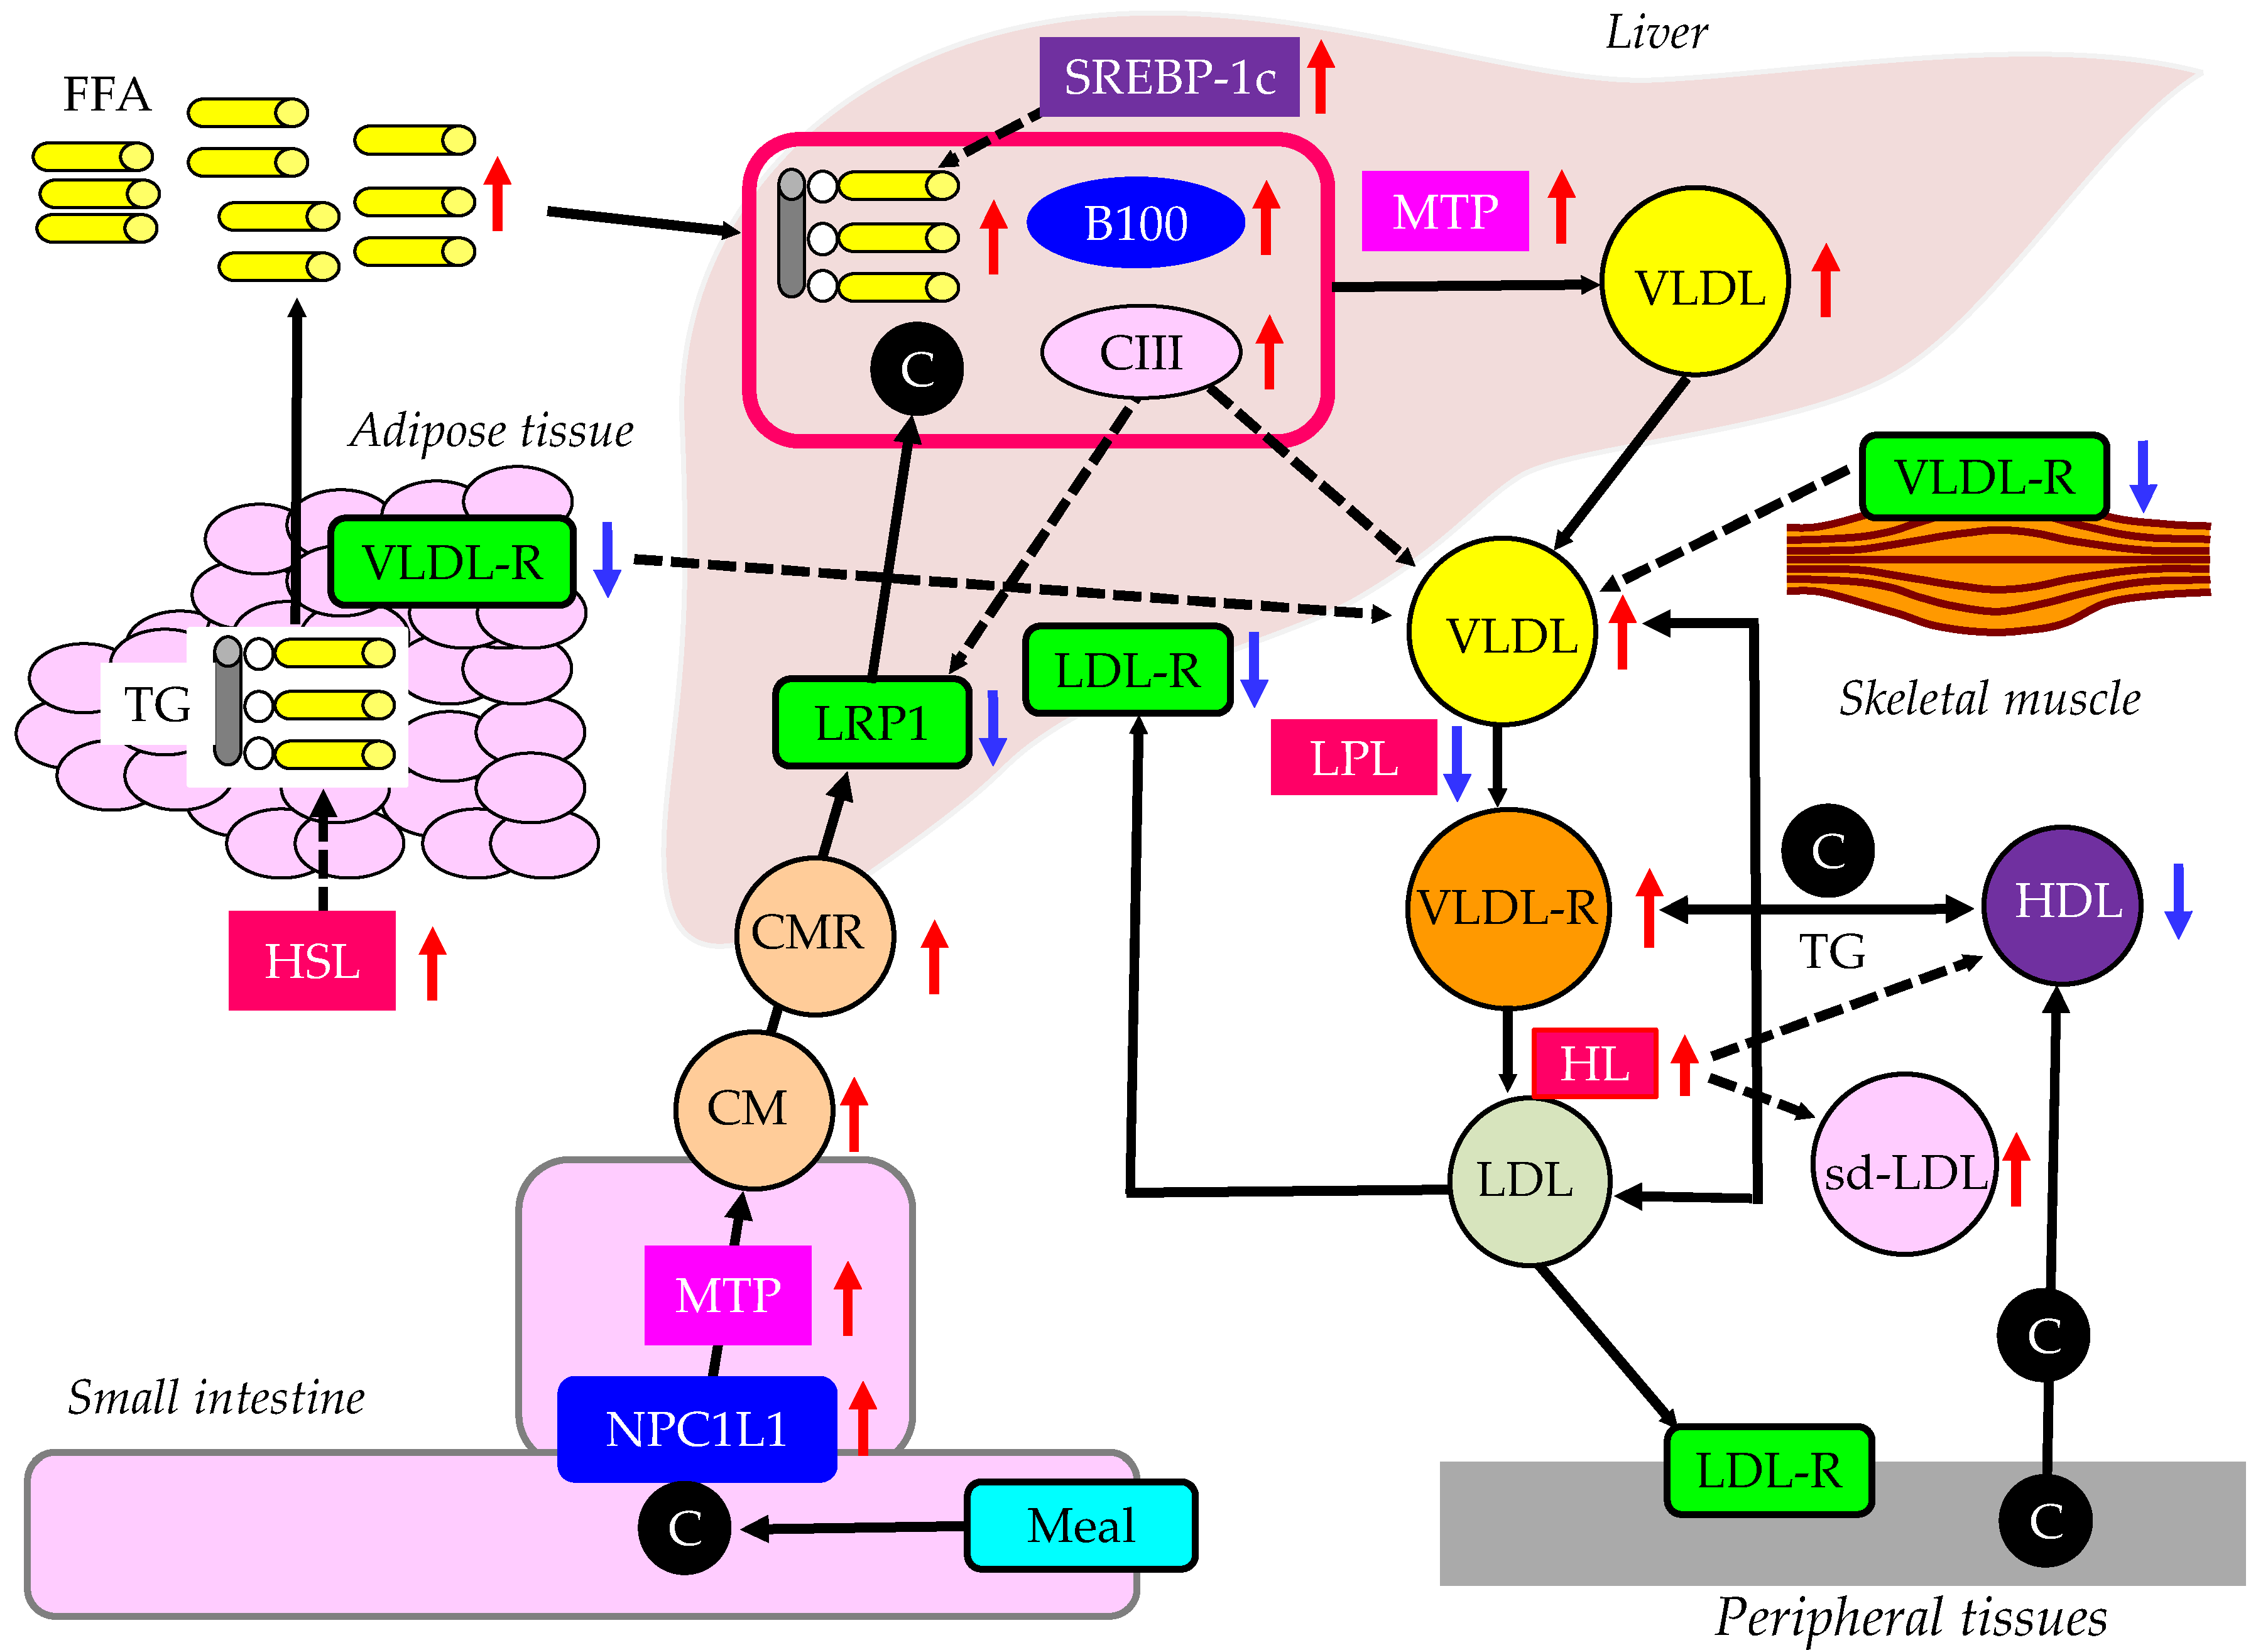
Figure 3.
Postprandial glucose metabolism in healthy individuals and patients with type 2 diabetes. Solid black lines indicate the flow of glucose. Solid blue lines indicate the effects of incretin, insulin and glucagon on glucose metabolism in healthy individuals. Solid purple lines indicate the effects of abnormal metabolic factors on glucose metabolism in patients with type 2 diabetes. Black arrows indicate increase (upward) or decrease (downward) of each factor. G, glucose.
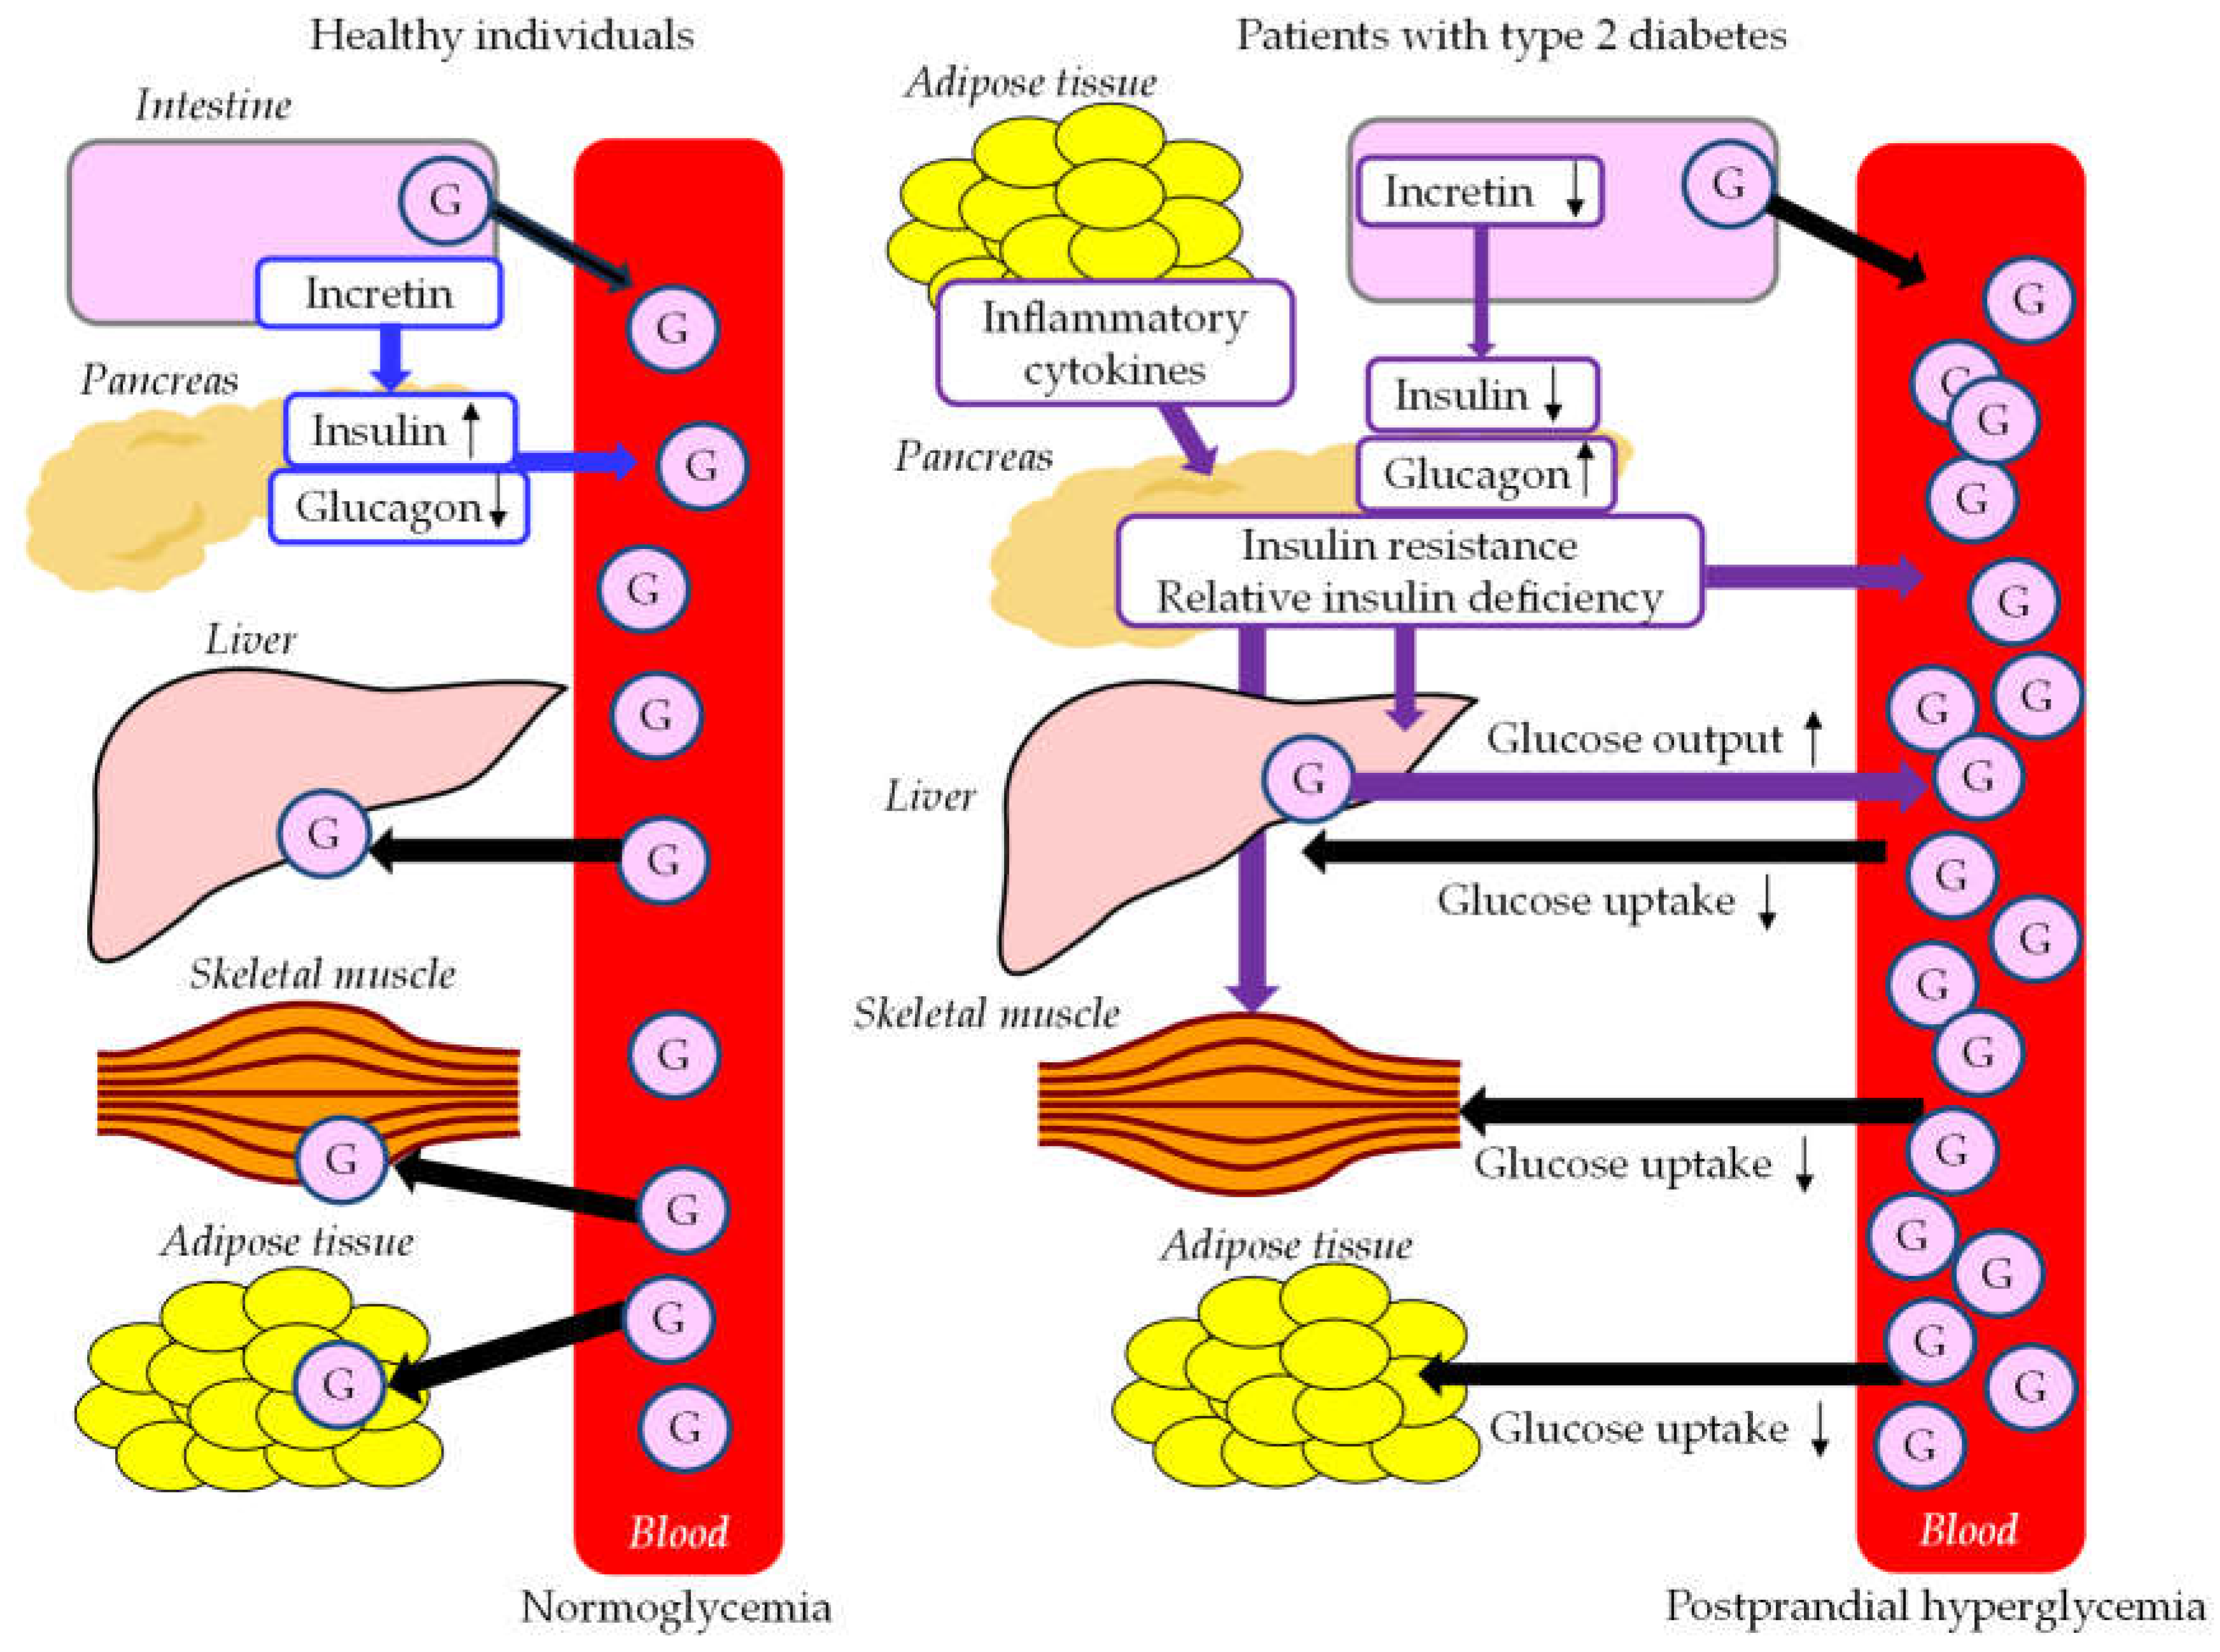
Figure 4.
Postprandial FFA and TG-rich lipoproteins metabolism in healthy individuals and patients with type 2 diabetes. Solid black lines indicate the flow of FFA and TG-rich lipoproteins. Solid purple lines indicate the effects of abnormal metabolic factors on FFA and TG-rich lipoproteins metabolism in patients with type 2 diabetes. Black arrows indicate increase (upward) or decrease (downward) of each factor. CM, chylomicron; CMR, chylomicron remnant; FFA, free fatty acid; LRP1, LDL receptor-related protein 1; LPL, lipoprotein lipase; NPC1L1, Niemann-Pick C1-Like 1; TG, triglyceride; VLDL, very-low-density lipoprotein; VLDLR, VLDL remnant; VDLD-R, VLDL receptor.
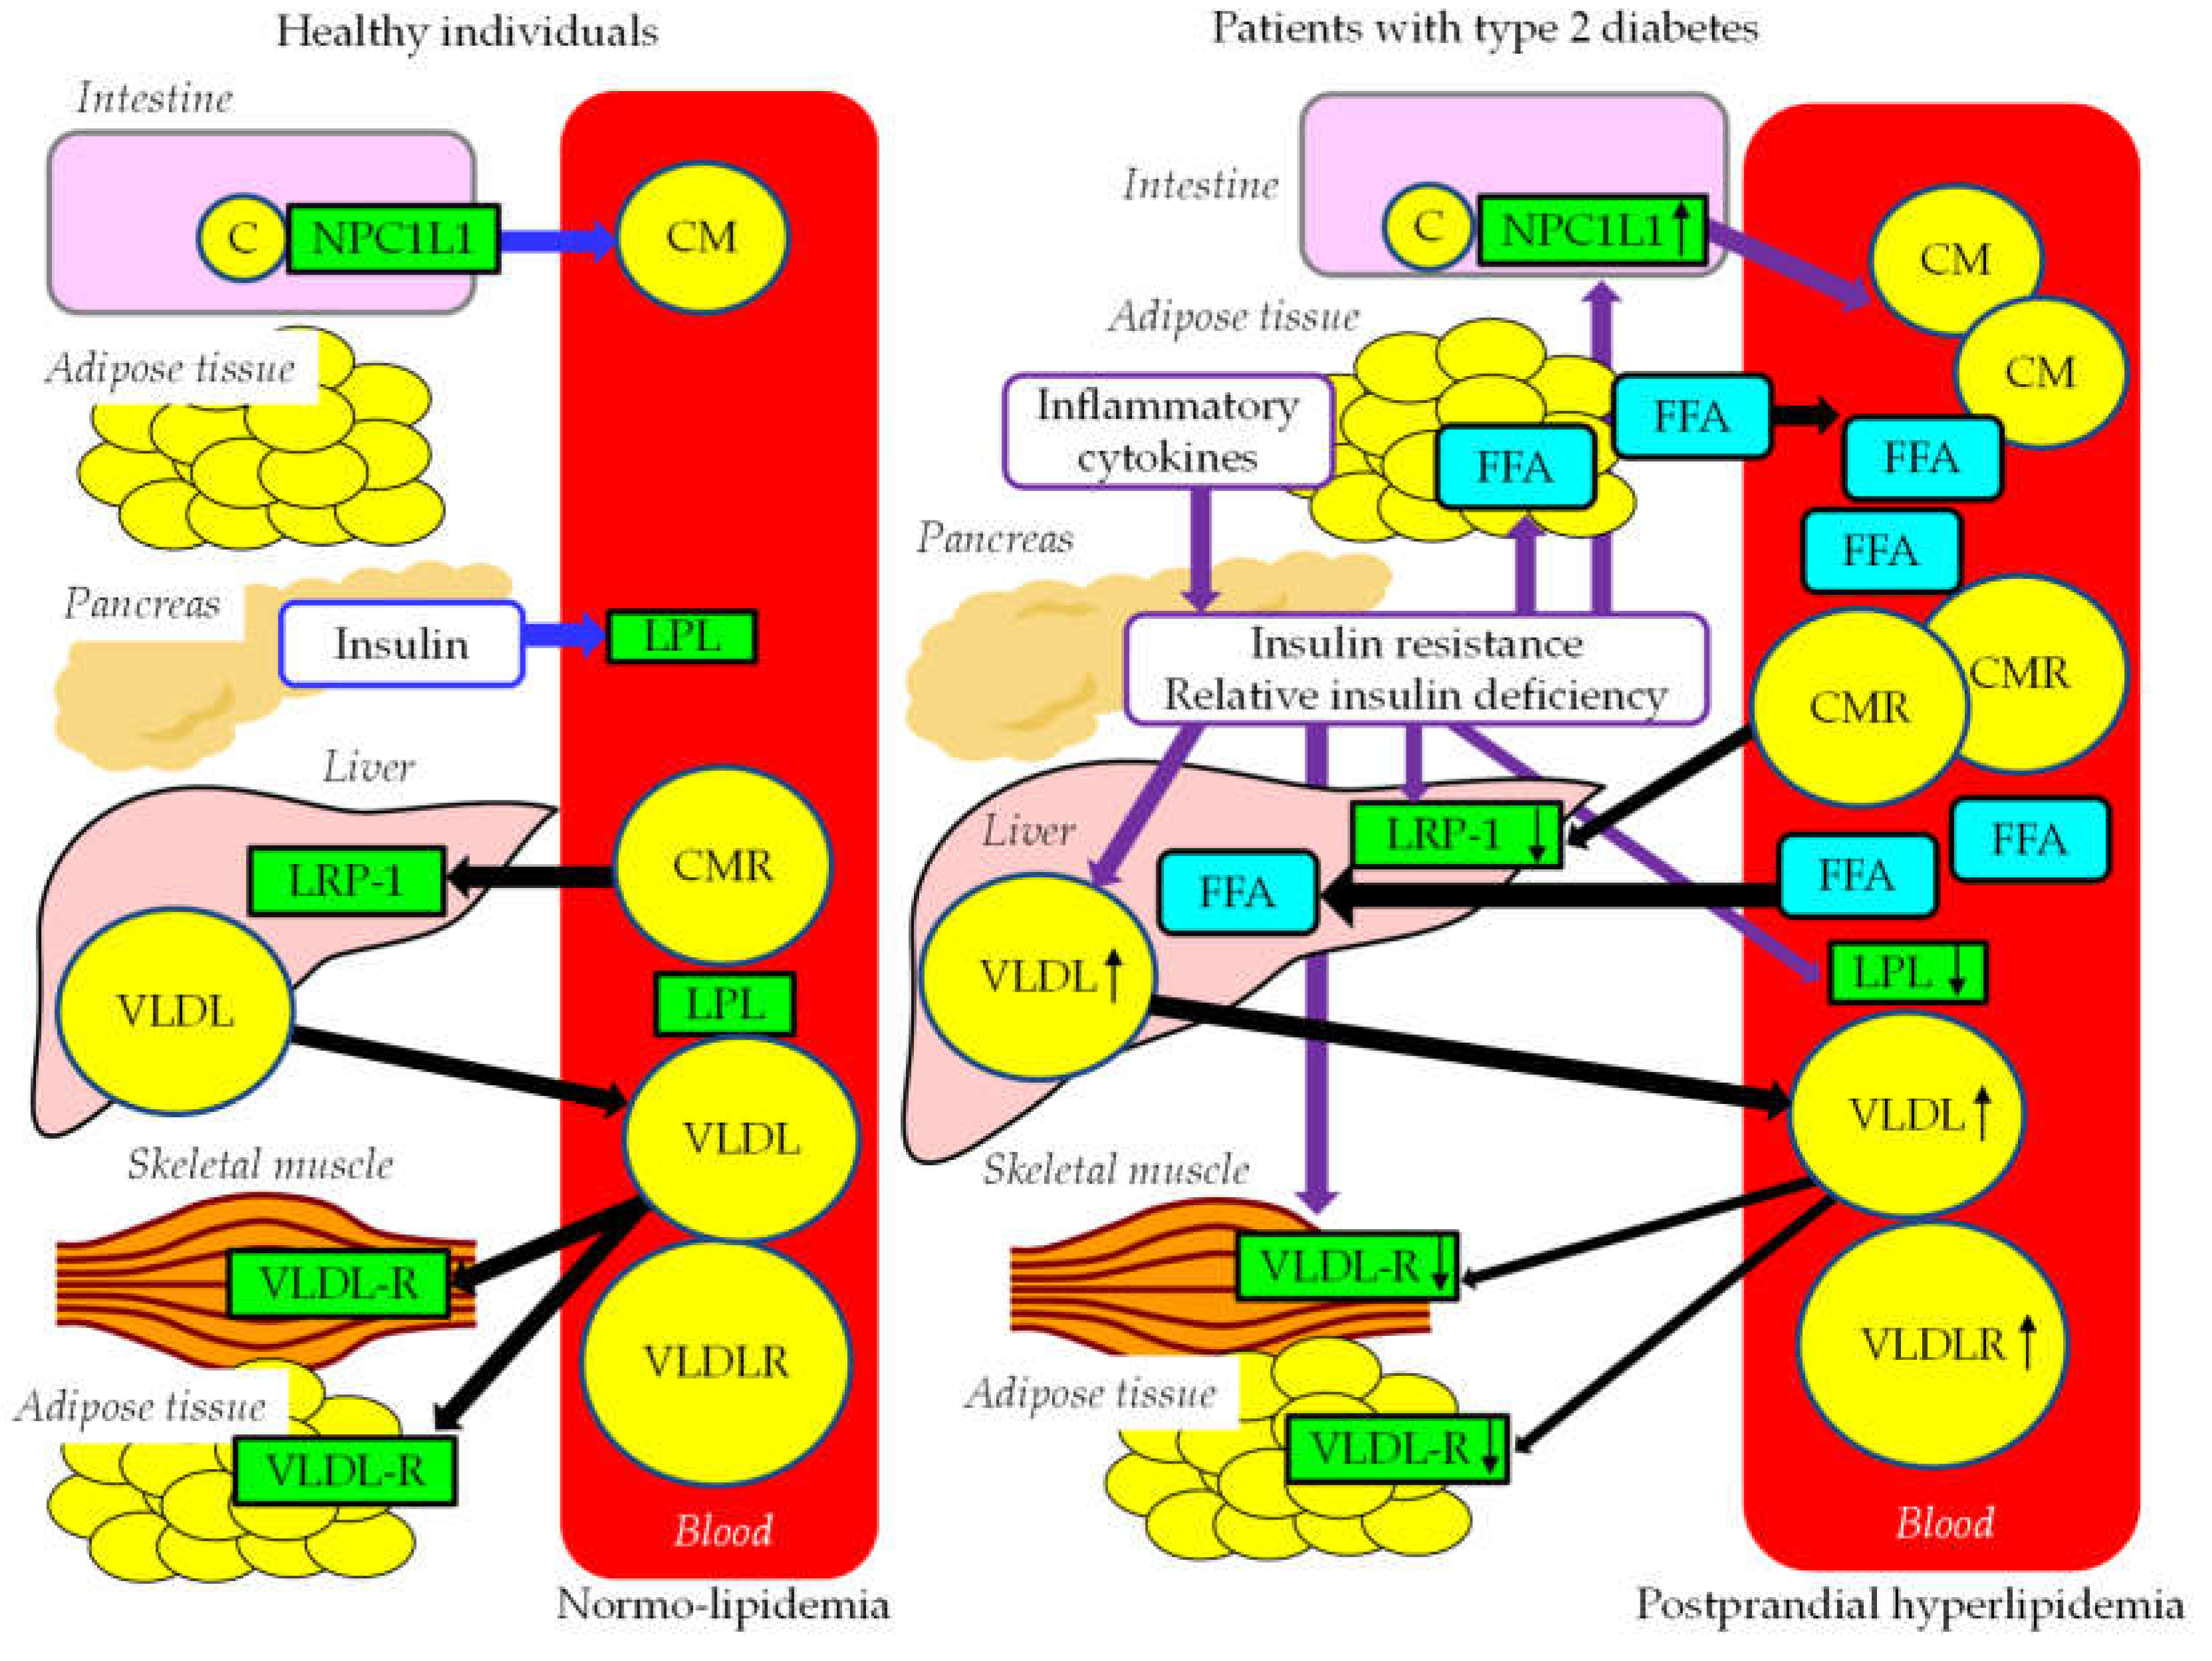
Figure 5.
The atherogenic properties of remnant lipoproteins and metabolic disorders associated with postprandial hyperlipidemia. Solid purple bold lines indicate the flow of substances and cells. Solid blue lines indicate the abnormal effects induced by remnant lipoproteins. Dotted blue lines indicate the abnormal effects induced by metabolic disorders associated with postprandial hyperlipidemia. Red, white and black upward and downward arrows indicate an increase or a decrease of each factor, respectively. E, apo E; HDL, high-density lipoprotein; LDL, low-density lipoprotein; LOX-1, lectin-like oxidized LDL receptor-1; LPL, lipoprotein lipase; NO, nitric oxide; PAI-1, plasminogen activator inhibitor-1; Rem, remnant lipoproteins; Sd-LDL, small dense LDL; SR, scavenger receptor.
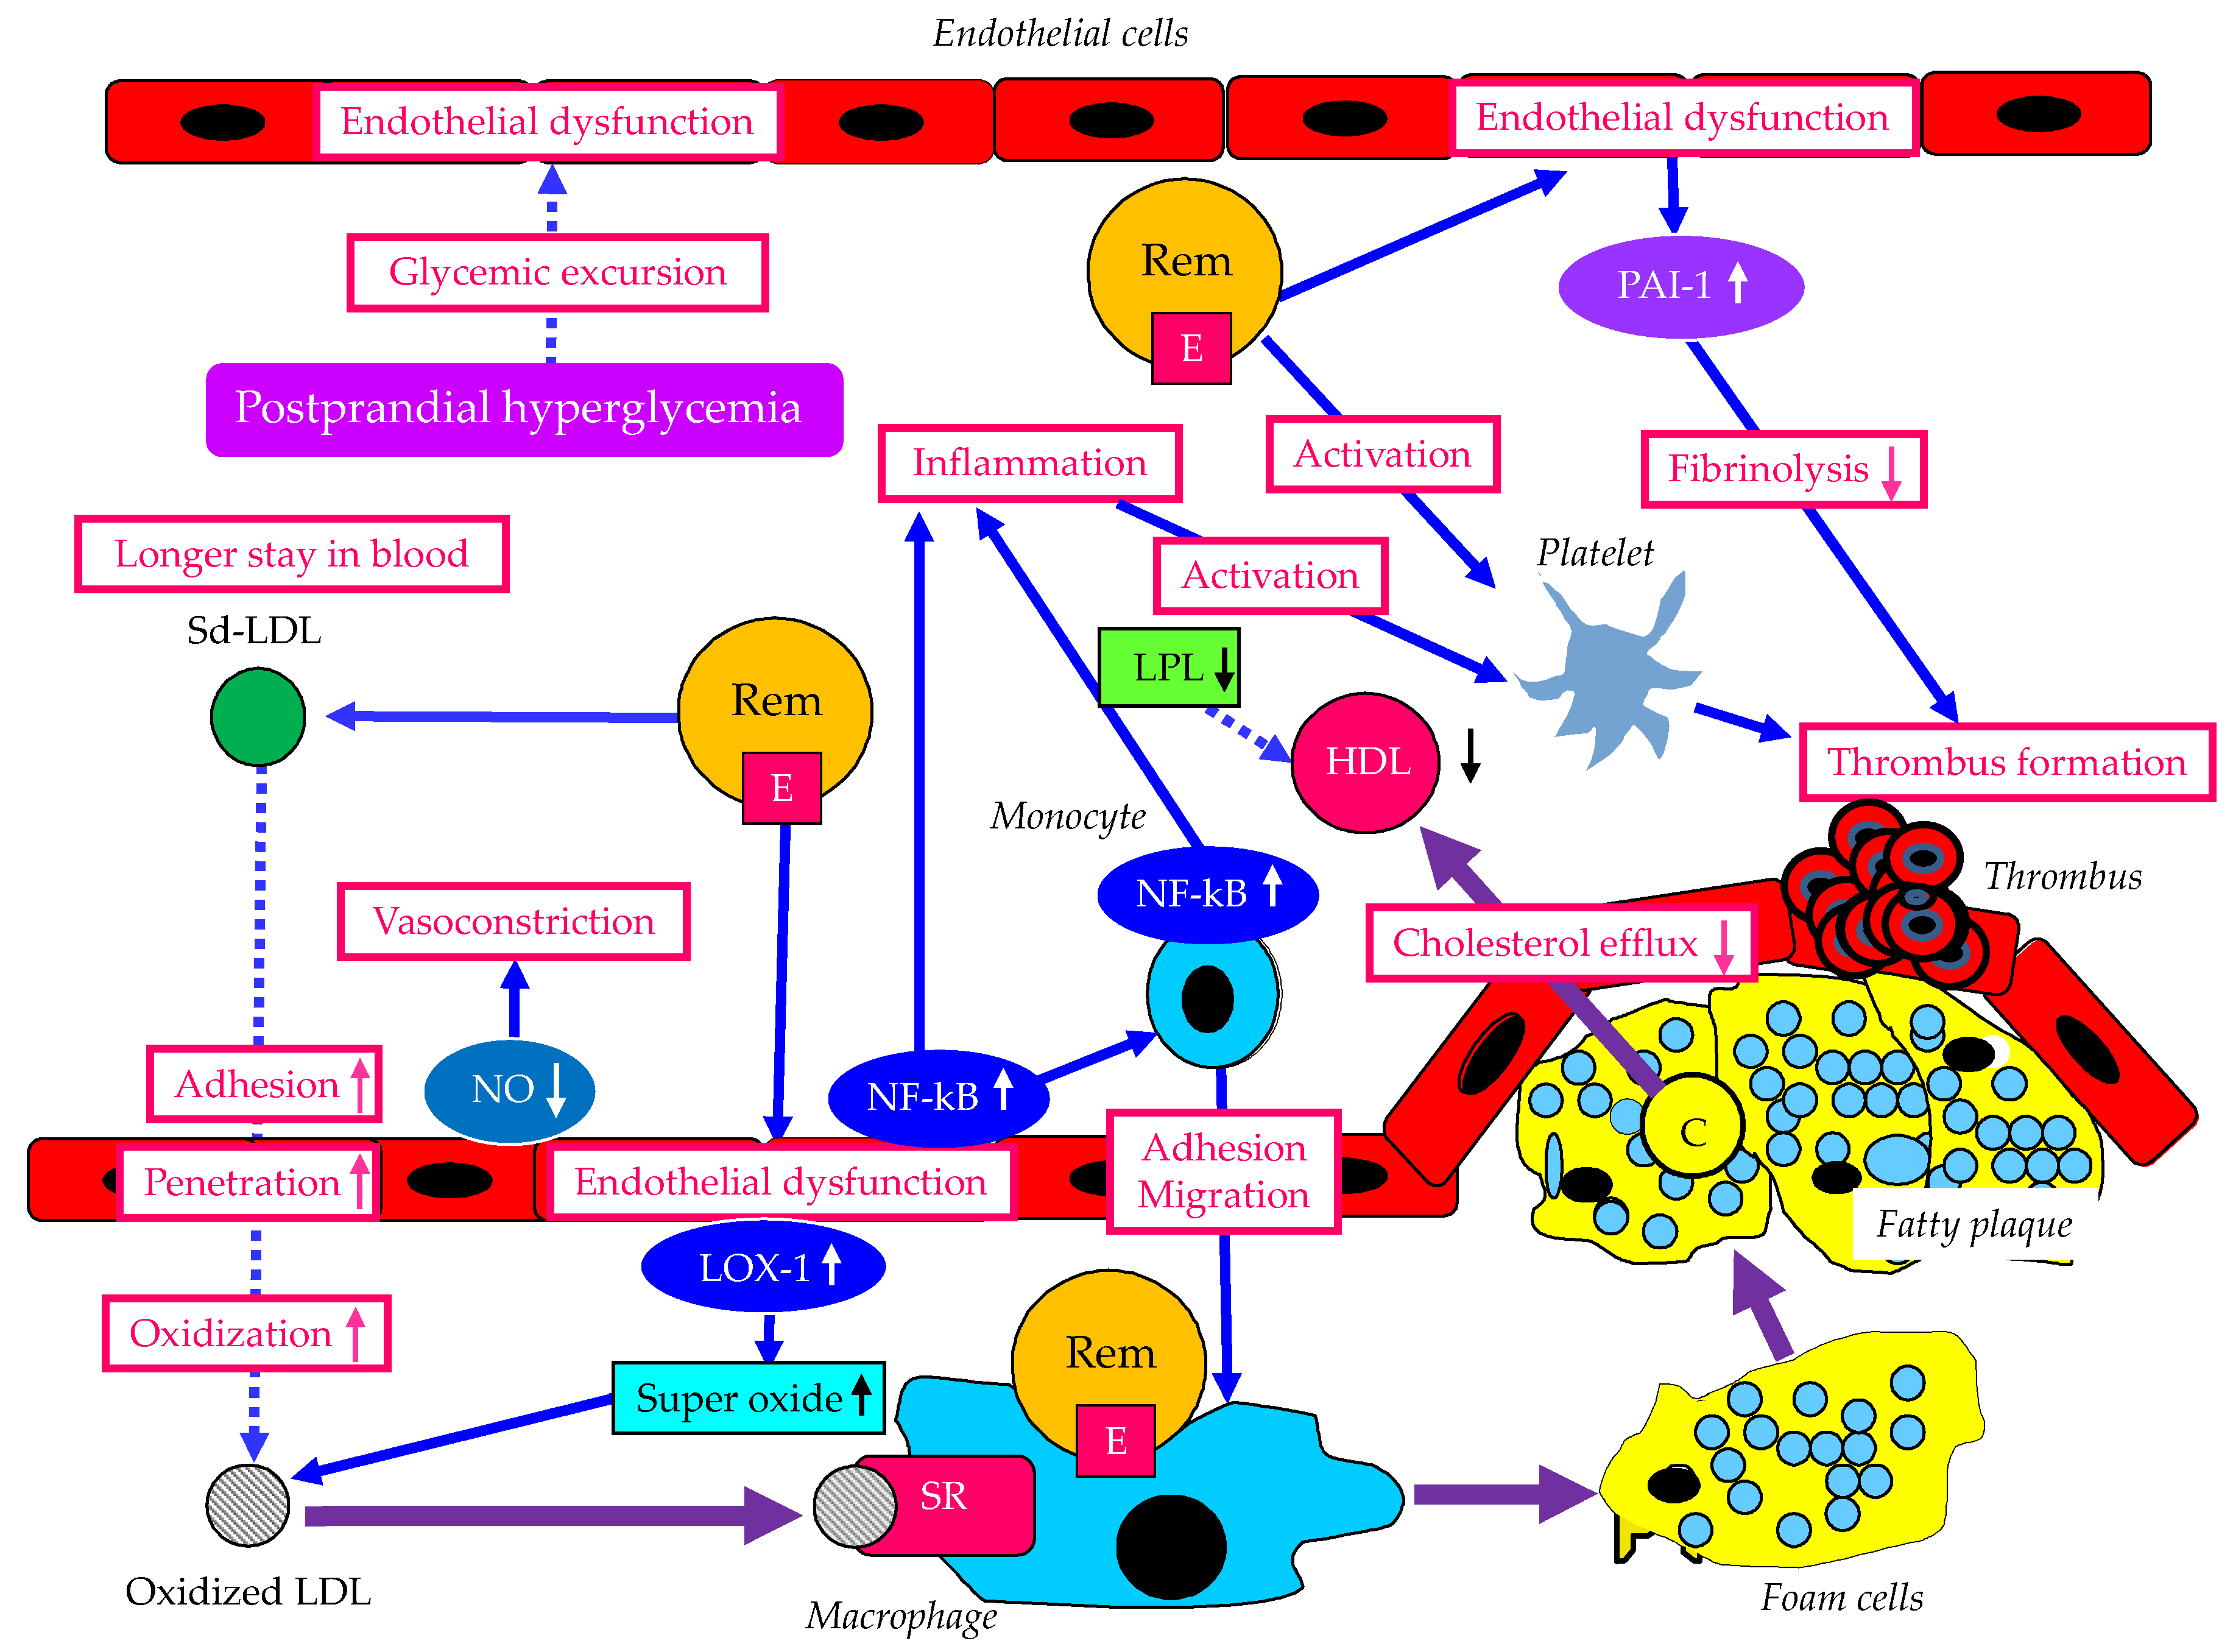
Disclaimer/Publisher’s Note: The statements, opinions and data contained in all publications are solely those of the individual author(s) and contributor(s) and not of MDPI and/or the editor(s). MDPI and/or the editor(s) disclaim responsibility for any injury to people or property resulting from any ideas, methods, instructions or products referred to in the content. |
© 2023 by the authors. Licensee MDPI, Basel, Switzerland. This article is an open access article distributed under the terms and conditions of the Creative Commons Attribution (CC BY) license (http://creativecommons.org/licenses/by/4.0/).
Copyright: This open access article is published under a Creative Commons CC BY 4.0 license, which permit the free download, distribution, and reuse, provided that the author and preprint are cited in any reuse.


