Submitted:
25 August 2023
Posted:
29 August 2023
You are already at the latest version
Abstract
Keywords:
1. Introduction
2. Materials and Methods
2.1. Instrumentation
2.1.1. Personal Exposure Monitor
2.1.2. Reference Instrumentation
2.2. Sites and Measurement Periods
2.2.1. Indoor site measurements periods
2.2.2. Roadside site measurement period
2.2.3. NERC Supersite and measurement period
2.3. Statistical Analysis
3. Results and Discussion
3.1. Indoor Monitoring
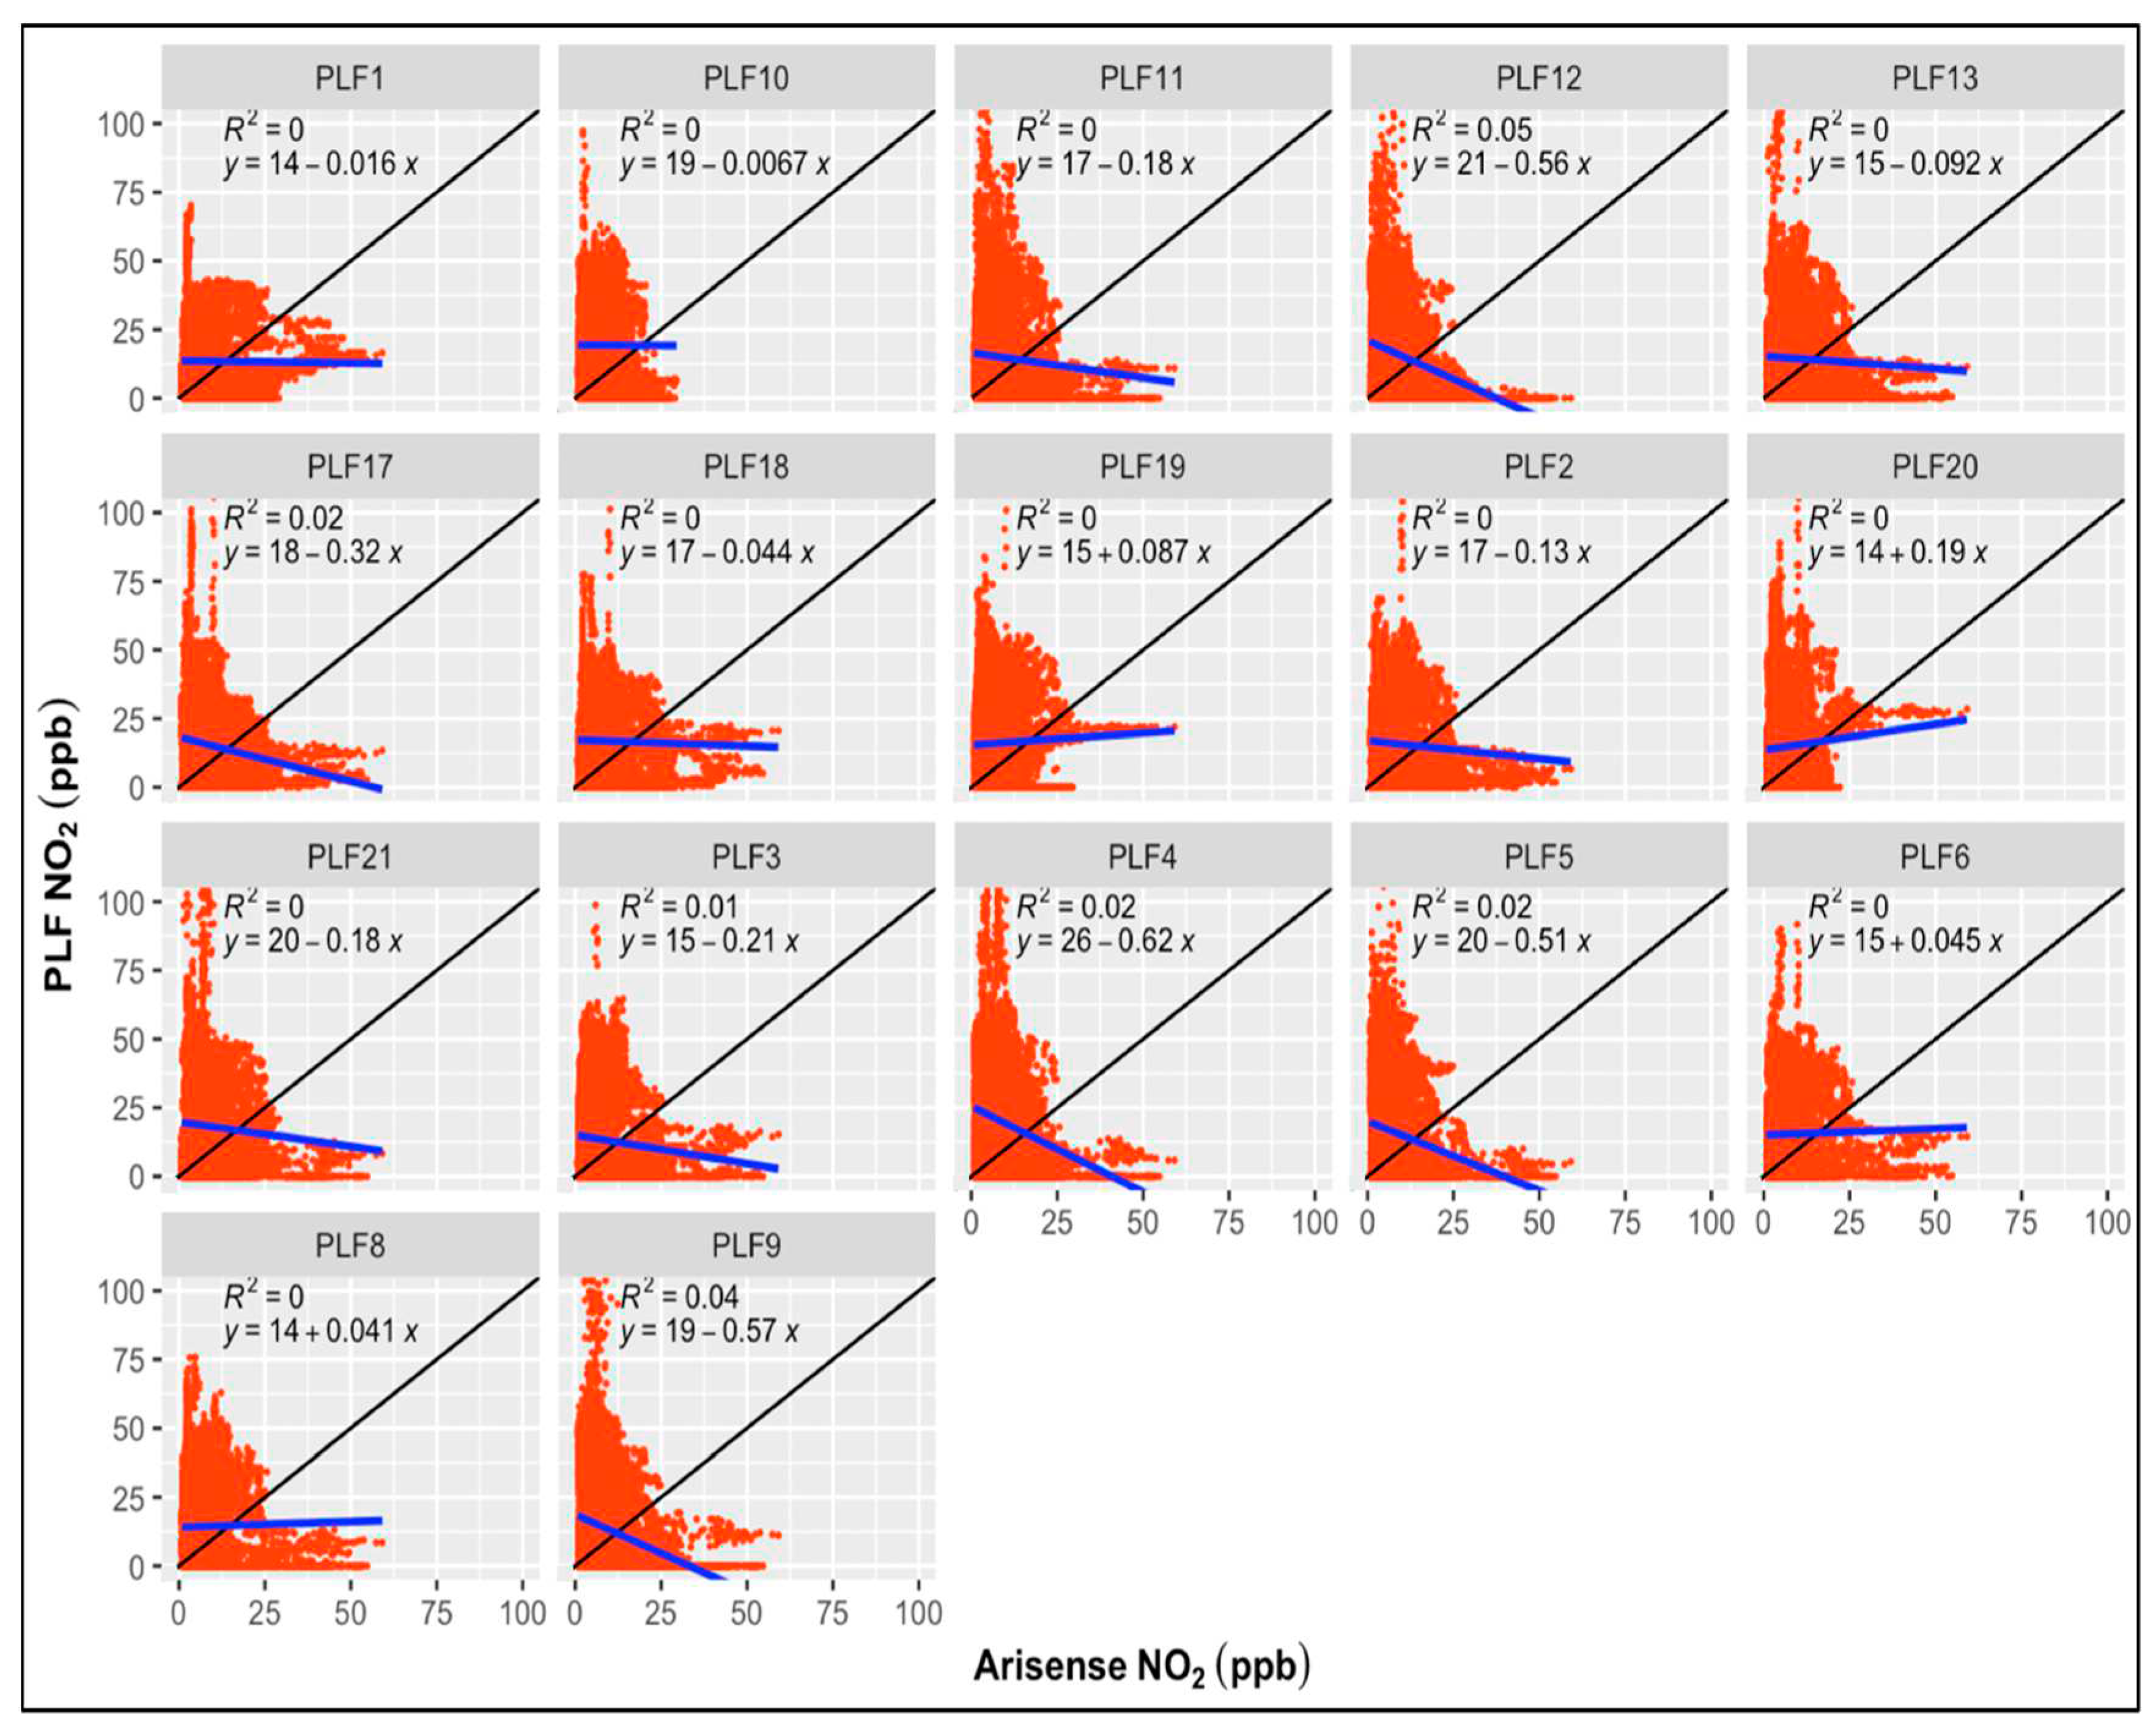
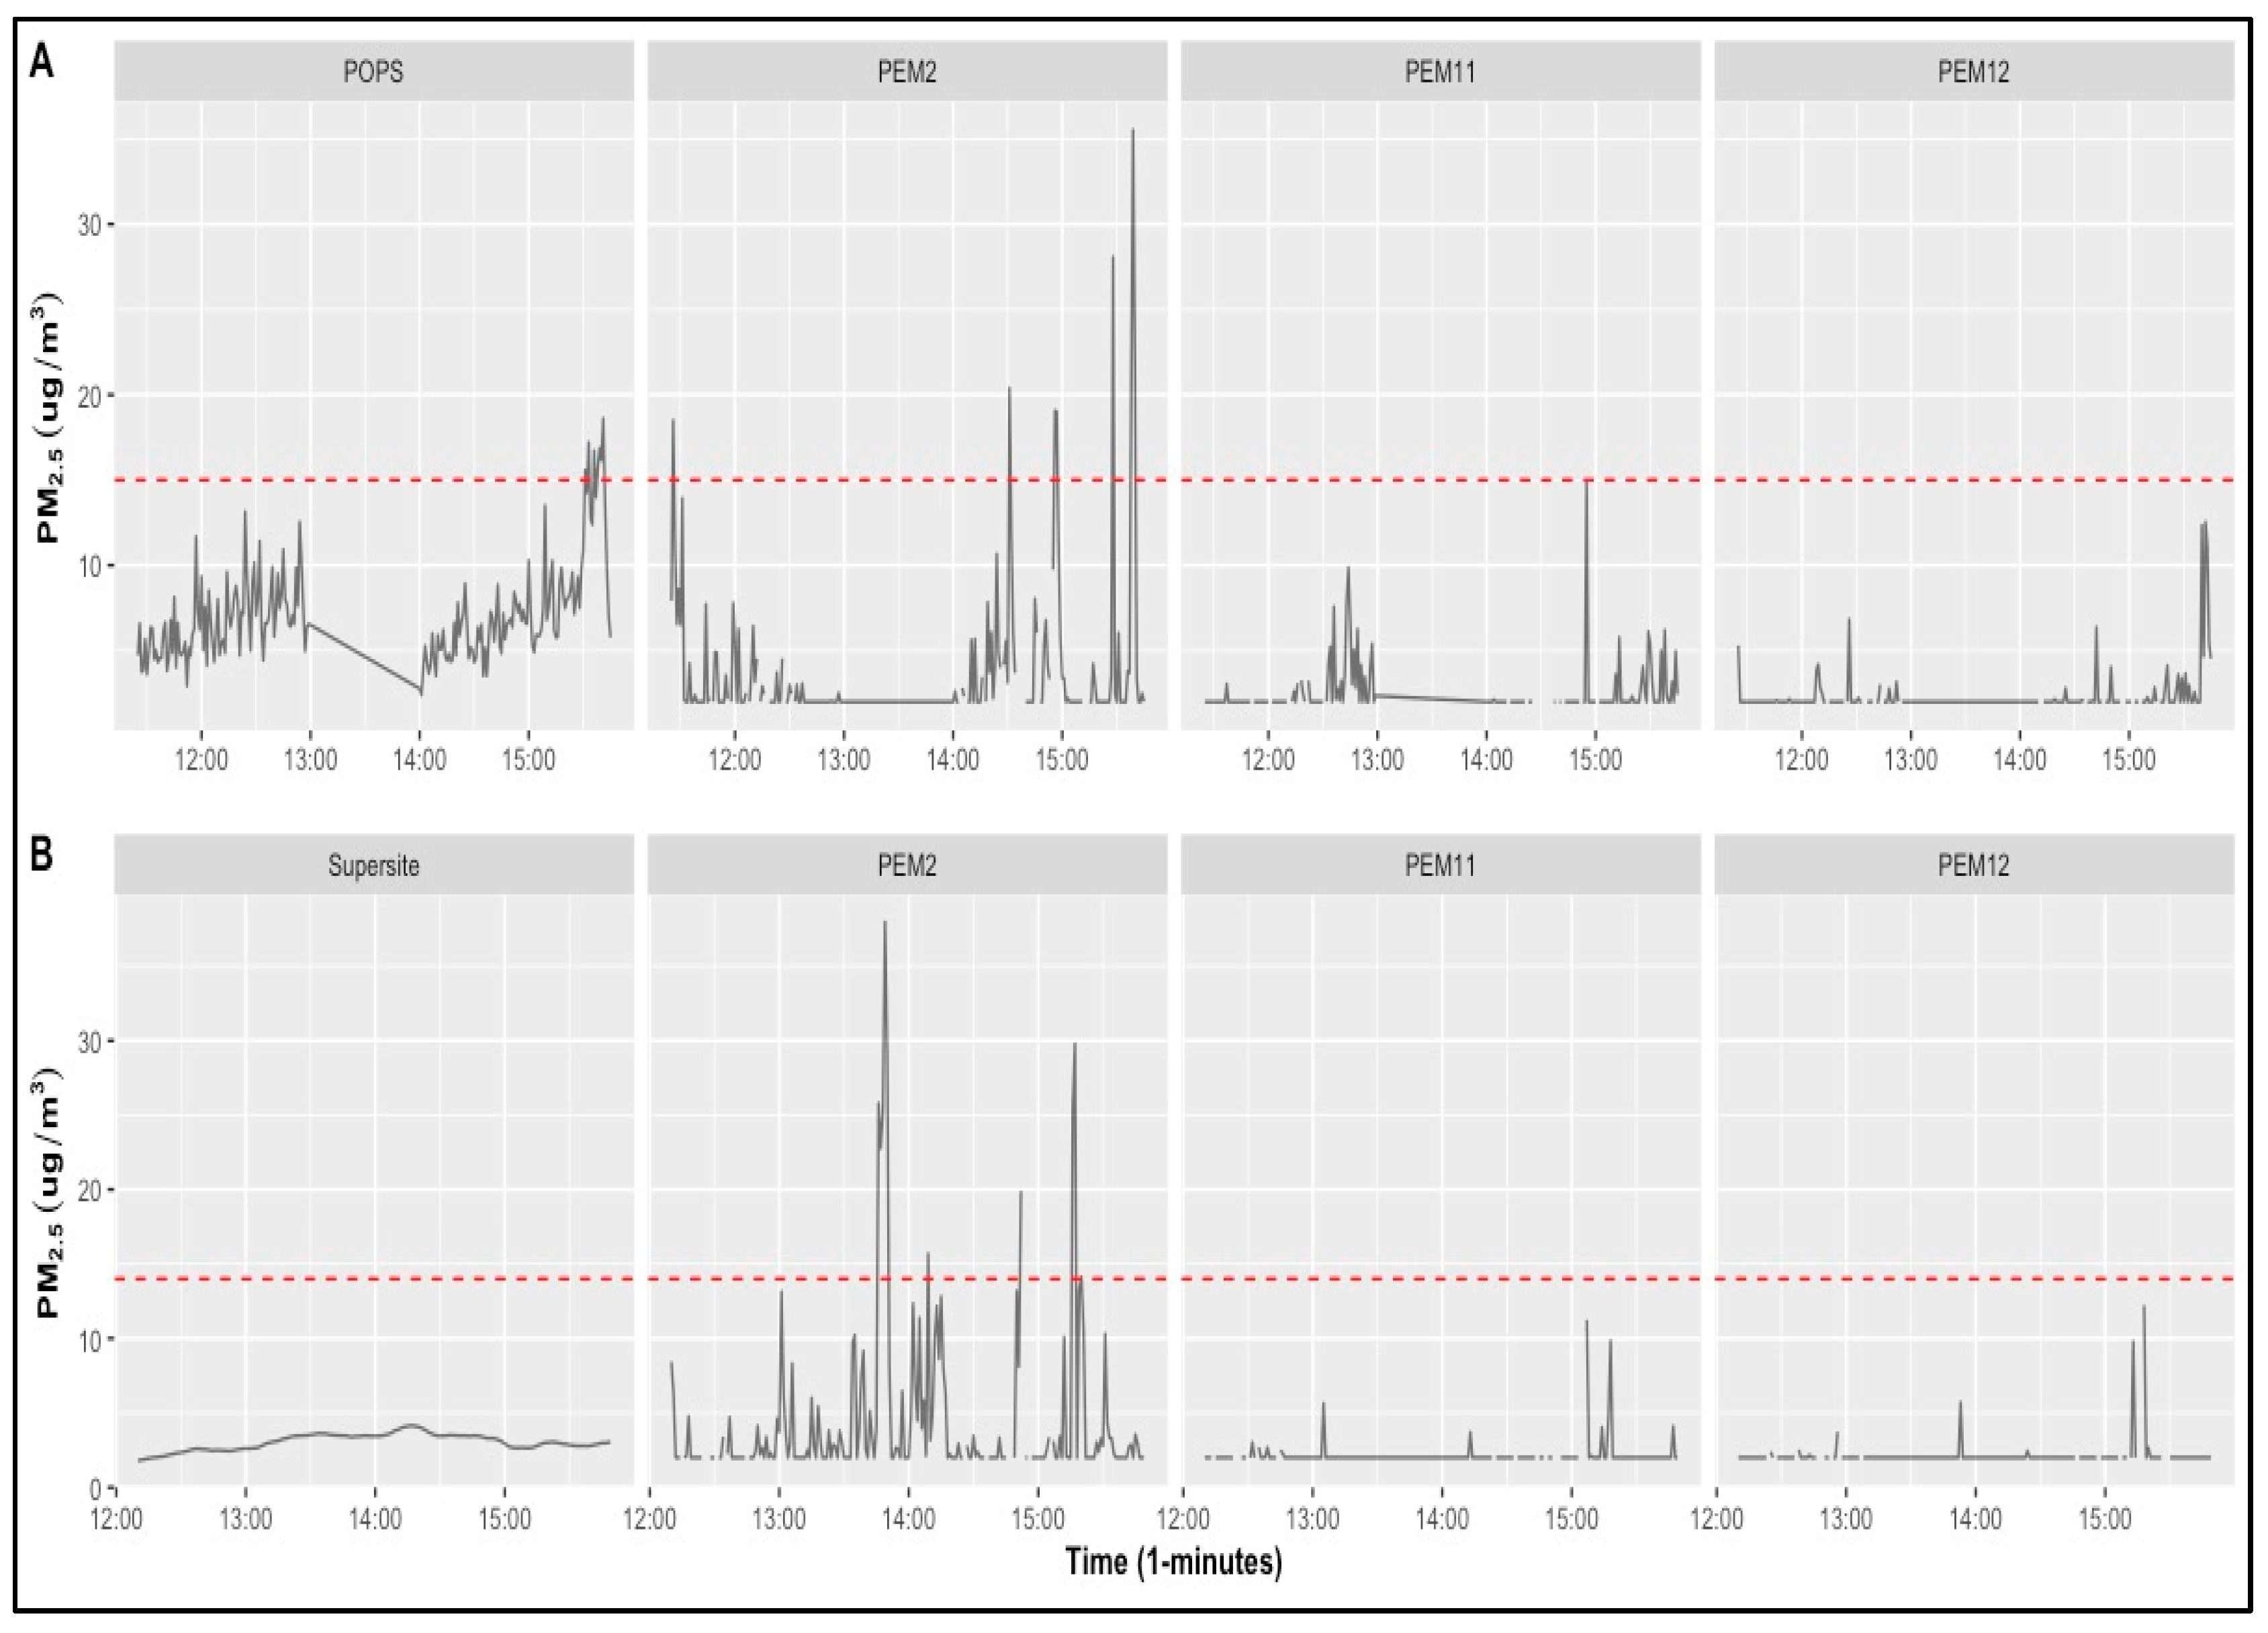
3.2. Roasdside and supersite intercomparison
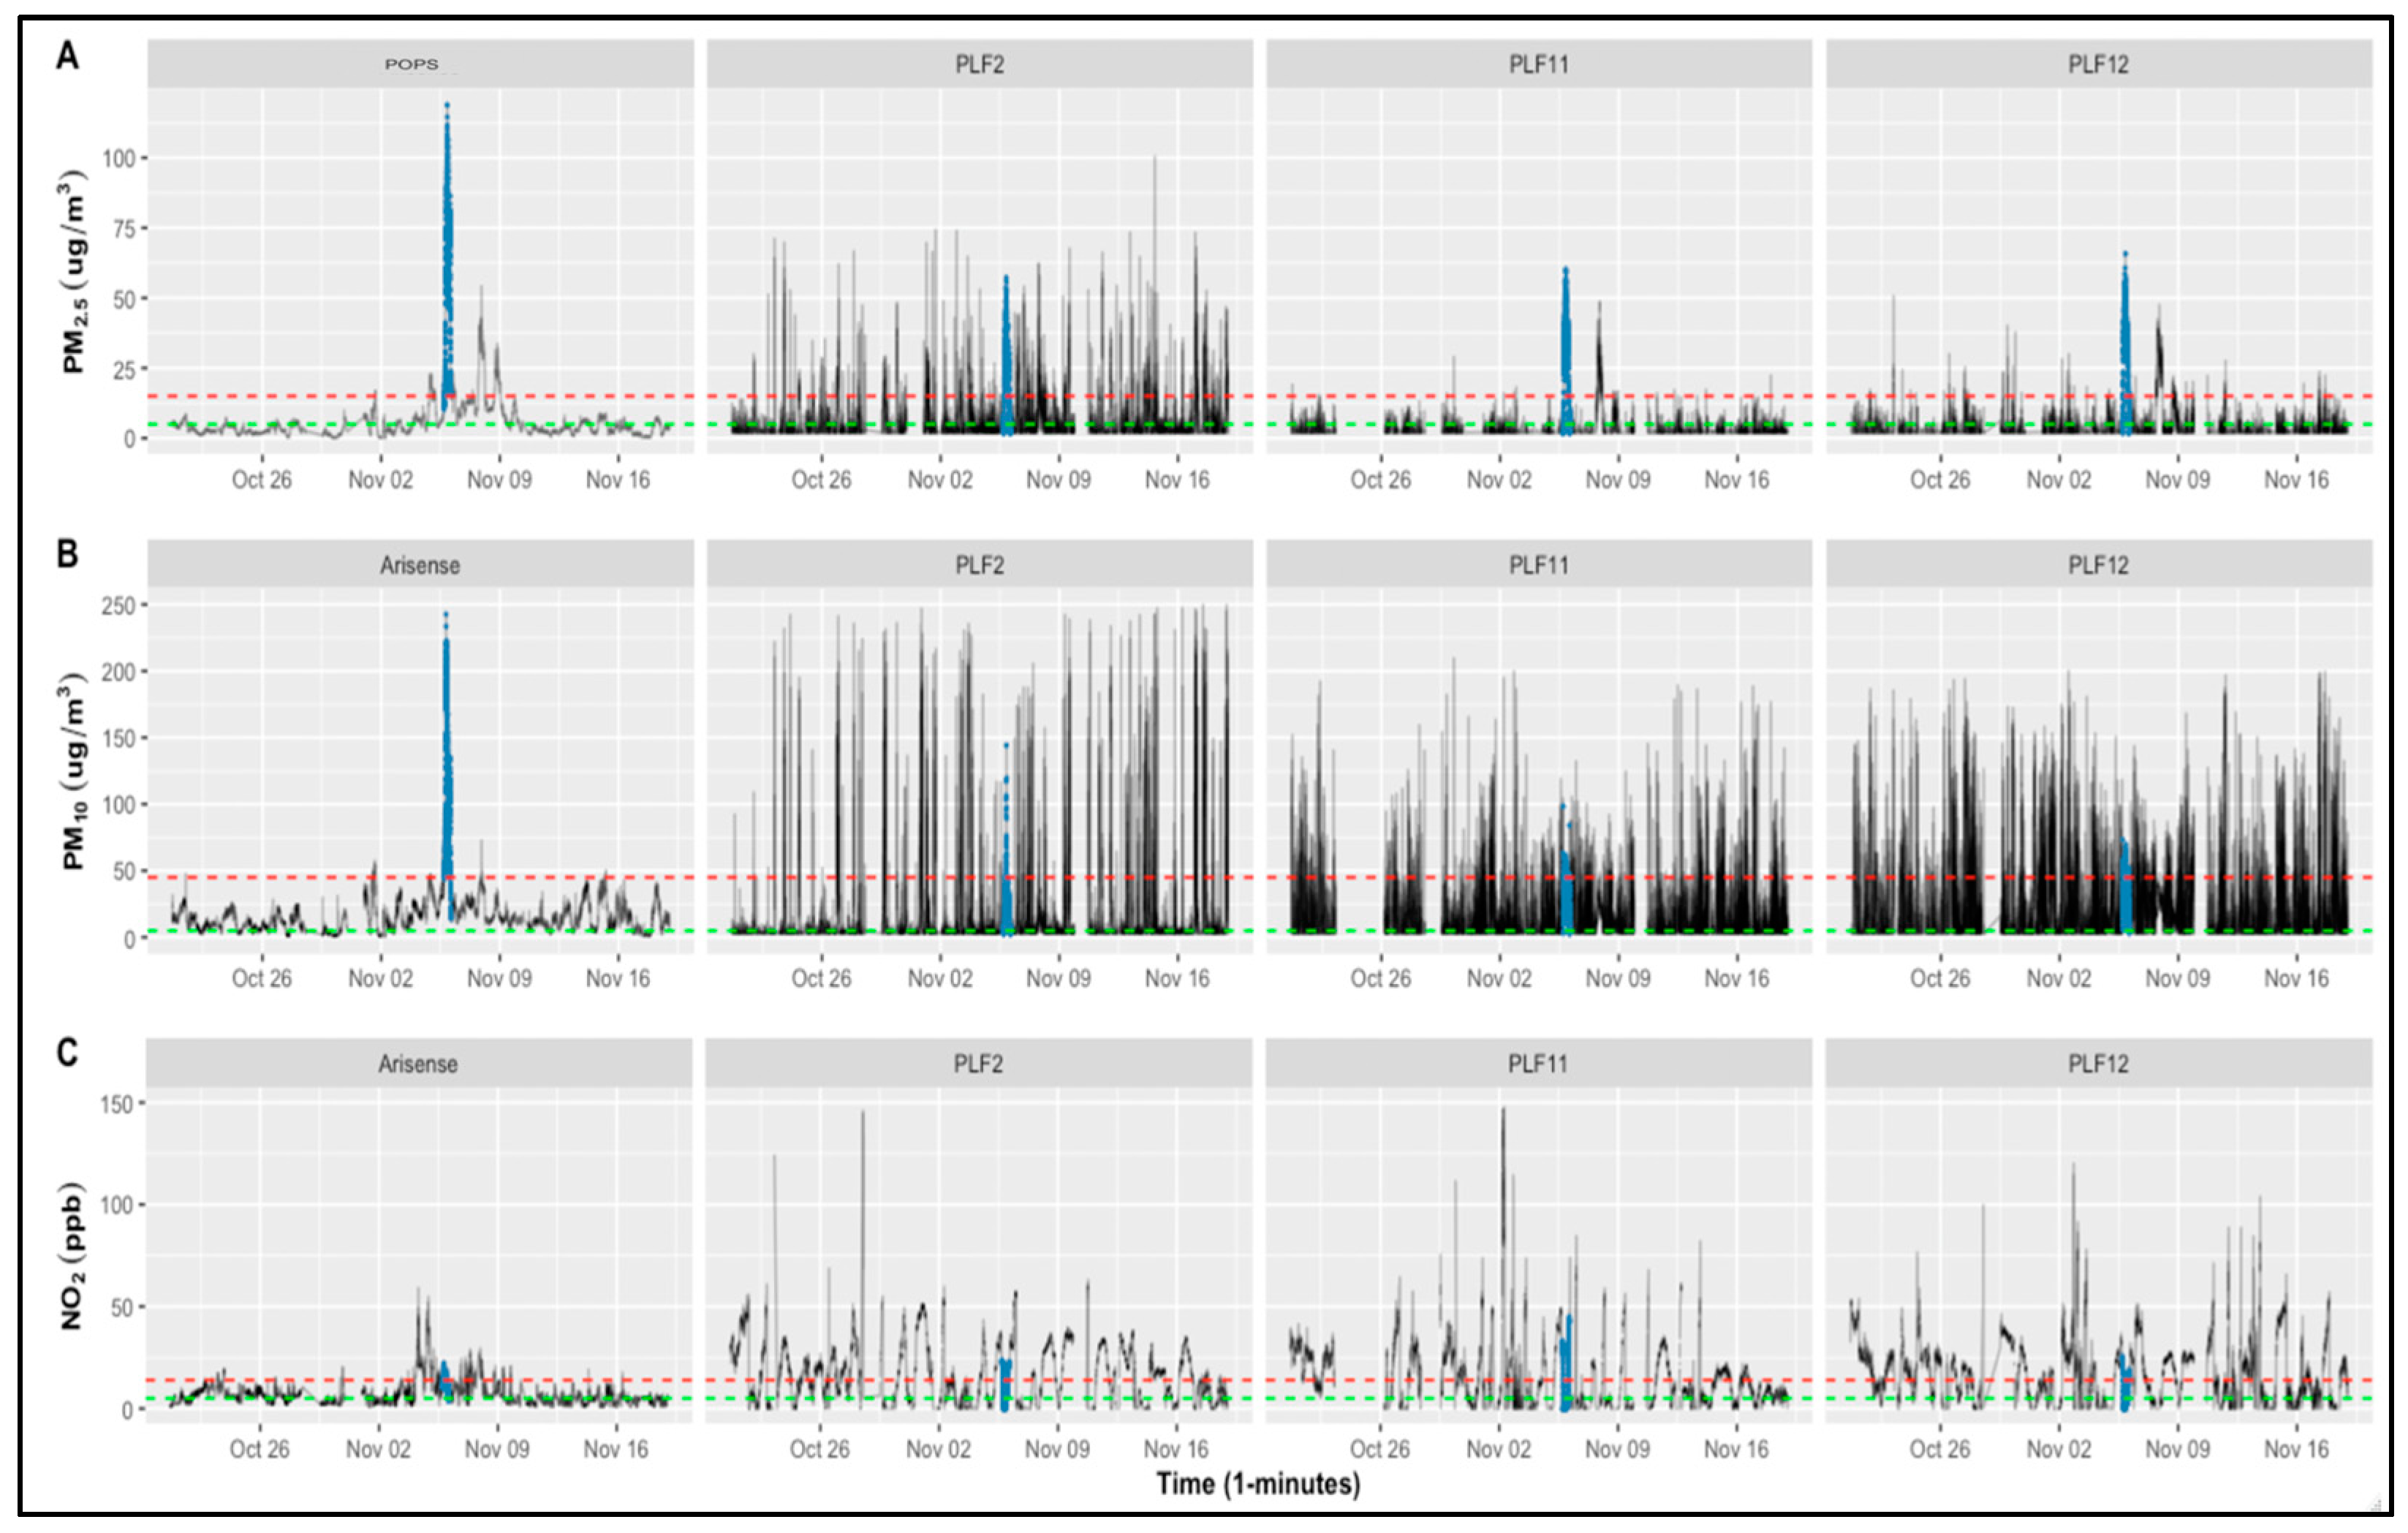
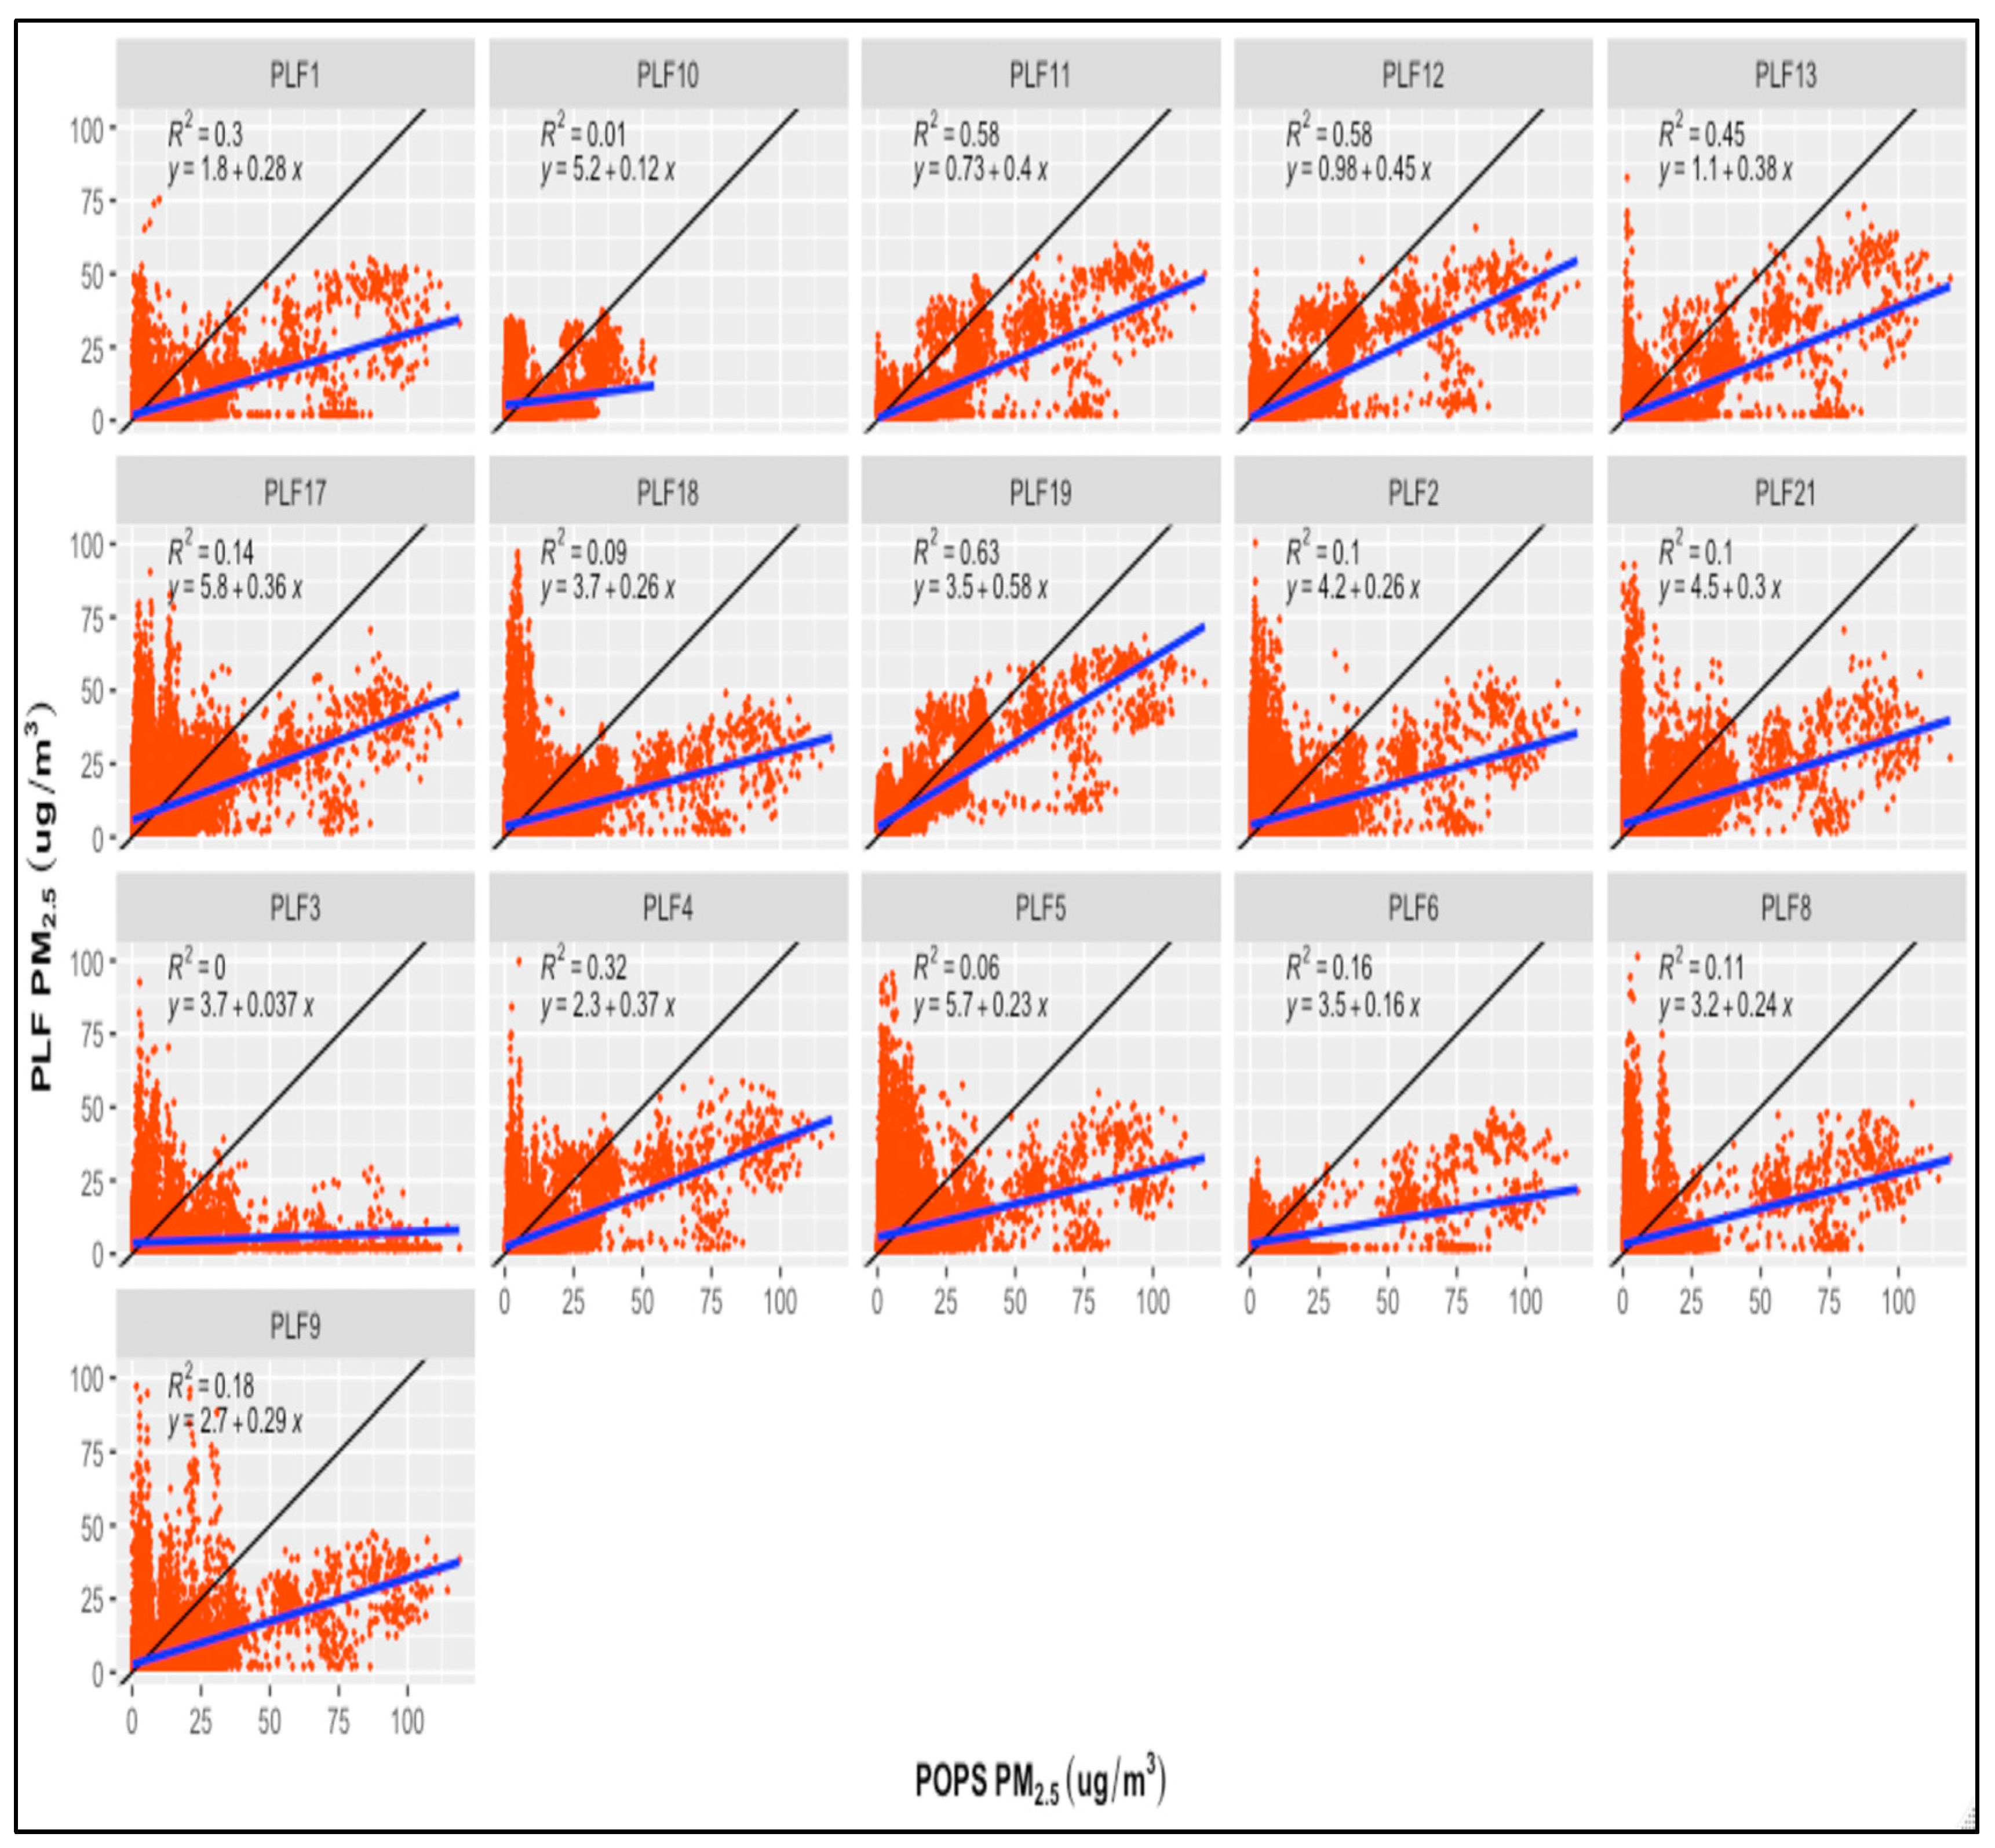
4. Conclusions
Supplementary Materials
Author Contributions
Funding
Institutional Review Board Statement
Data Availability Statement
Acknowledgments
Conflicts of Interest
References
- Li, X.; Huang, S.; Jiao, A.; Yang, X.; Yun, J.; Wang, Y.; Xue, X.; Chu, Y.; Liu, F.; Liu, Y.; et al. Association between Ambient Fine Particulate Matter and Preterm Birth or Term Low Birth Weight: An Updated Systematic Review and Meta-Analysis. Environ. Pollut. 2017, 227, 596–605. [Google Scholar] [CrossRef] [PubMed]
- Manisalidis, I.; Stavropoulou, E.; Stavropoulos, A.; Bezirtzoglou, E. Environmental and Health Impacts of Air Pollution: A Review. Front Public Health 2020, 8, 14. [Google Scholar] [CrossRef] [PubMed]
- Cohen, A.J.; Brauer, M.; Burnett, R.; Anderson, H.R.; Frostad, J.; Estep, K.; Balakrishnan, K.; Brunekreef, B.; Dandona, L.; Dandona, R.; et al. Estimates and 25-Year Trends of the Global Burden of Disease Attributable to Ambient Air Pollution: An Analysis of Data from the Global Burden of Diseases Study 2015. Lancet 2017, 389, 1907–1918. [Google Scholar] [CrossRef] [PubMed]
- Lin, X.; Luo, J.; Liao, M.; Su, Y.; Lv, M.; Li, Q.; Xiao, S.; Xiang, J. Wearable Sensor-Based Monitoring of Environmental Exposures and the Associated Health Effects: A Review. Biosensors 2022, 12, 1131. [Google Scholar] [CrossRef] [PubMed]
- Hoek, G. Methods for Assessing Long-Term Exposures to Outdoor Air Pollutants. Curr Environ Health Rep 2017, 4, 450–462. [Google Scholar] [CrossRef] [PubMed]
- Zou, B.; Wilson, J.G.; Zhan, F.B.; Zeng, Y. Air Pollution Exposure Assessment Methods Utilized in Epidemiological Studies. J Environ Monit 2009, 11, 475–490. [Google Scholar] [CrossRef]
- Monn, C. Exposure Assessment of Air Pollutants: A Review on Spatial Heterogeneity and Indoor/Outdoor/Personal Exposure to Suspended Particulate Matter, Nitrogen Dioxide and Ozone. Atmospheric Environment 2001, 35, 1–32. [Google Scholar] [CrossRef]
- Duan, N.; Mage, D.T. Combination of Direct and Indirect Approaches for Exposure Assessment. J Expo Anal Environ Epidemiol 1997, 7, 439–470. [Google Scholar]
- Watson, A.Y.; Bates, R.R.; Kennedy, D. Assessment of Human Exposure to Air Pollution: Methods, Measurements, and Models; National Academies Press (US), 1988.
- Wu, J.; Jiang, C.; Liu, Z.; Houston, D.; Jaimes, G.; McConnell, R. Performances of Different Global Positioning System Devices for Time-Location Tracking in Air Pollution Epidemiological Studies. Environ Health Insights 2010, 4, 93–108. [Google Scholar] [CrossRef]
- Liu, M.; Barkjohn, K.K.; Norris, C.; Schauer, J.J.; Zhang, J.; Zhang, Y.; Hu, M.; Bergin, M. Using Low-Cost Sensors to Monitor Indoor, Outdoor, and Personal Ozone Concentrations in Beijing, China. Environ. Sci.: Processes Impacts 2020, 22, 131–143. [Google Scholar] [CrossRef]
- Borghi, F.; Spinazzè, A.; Rovelli, S.; Campagnolo, D.; Del Buono, L.; Cattaneo, A.; Cavallo, D.M. Miniaturized Monitors for Assessment of Exposure to Air Pollutants: A Review. Int J Environ Res Public Health 2017, 14, 909. [Google Scholar] [CrossRef] [PubMed]
- Chambliss, S.E.; Pinon, C.P.R.; Messier, K.P.; LaFranchi, B.; Upperman, C.R.; Lunden, M.M.; Robinson, A.L.; Marshall, J.D.; Apte, J.S. Local- and Regional-Scale Racial and Ethnic Disparities in Air Pollution Determined by Long-Term Mobile Monitoring. PNAS 2021, 118. [Google Scholar] [CrossRef] [PubMed]
- Gaskins, A.J.; Hart, J.E. The Use of Personal and Indoor Air Pollution Monitors in Reproductive Epidemiology Studies. Paediatr Perinat Epidemiol 2020, 34, 513–521. [Google Scholar] [CrossRef] [PubMed]
- Ong, H.; Holstius, D.; Li, Y.; Seto, E.; Wang, M. Air Pollution and Child Obesity: Assessing the Feasibility of Measuring Personal PM2.5 Exposures and Behaviours Related to BMI in Preschool-Aged Children in China. Obesity Medicine 2019, 16, 100149. [Google Scholar] [CrossRef]
- Chen, L.-W.A.; Olawepo, J.O.; Bonanno, F.; Gebreselassie, A.; Zhang, M. Schoolchildren’s Exposure to PM2.5: A Student Club–Based Air Quality Monitoring Campaign Using Low-Cost Sensors. Air Qual Atmos Health 2020, 13, 543–551. [Google Scholar] [CrossRef]
- Mead, M.I.; Popoola, O.A.M.; Stewart, G.B.; Landshoff, P.; Calleja, M.; Hayes, M.; Baldovi, J.J.; McLeod, M.W.; Hodgson, T.F.; Dicks, J.; et al. The Use of Electrochemical Sensors for Monitoring Urban Air Quality in Low-Cost, High-Density Networks. Atmospheric Environment 2013, 70, 186–203. [Google Scholar] [CrossRef]
- Cattaneo, A.; Garramone, G.; Taronna, M.; Peruzzo, C.; Cavallo, D.M. Personal Exposure to Airborne Ultrafine Particles in the Urban Area of Milan. J. Phys.: Conf. Ser. 2009, 151, 012039. [Google Scholar] [CrossRef]
- Castell, N.; Dauge, F.R.; Schneider, P.; Vogt, M.; Lerner, U.; Fishbain, B.; Broday, D.; Bartonova, A. Can Commercial Low-Cost Sensor Platforms Contribute to Air Quality Monitoring and Exposure Estimates? Environ Int 2017, 99, 293–302. [Google Scholar] [CrossRef]
- Snyder, E.G.; Watkins, T.H.; Solomon, P.A.; Thoma, E.D.; Williams, R.W.; Hagler, G.S.W.; Shelow, D.; Hindin, D.A.; Kilaru, V.J.; Preuss, P.W. The Changing Paradigm of Air Pollution Monitoring. Environ. Sci. Technol. 2013, 47, 11369–11377. [Google Scholar] [CrossRef]
- Morawska, L.; Thai, P.K.; Liu, X.; Asumadu-Sakyi, A.; Ayoko, G.; Bartonova, A.; Bedini, A.; Chai, F.; Christensen, B.; Dunbabin, M.; et al. Applications of Low-Cost Sensing Technologies for Air Quality Monitoring and Exposure Assessment: How Far Have They Gone? Environ Int 2018, 116, 286–299. [Google Scholar] [CrossRef]
- Crnosija, N.; Levy Zamora, M.; Rule, A.M.; Payne-Sturges, D. Laboratory Chamber Evaluation of Flow Air Quality Sensor PM2.5 and PM10 Measurements. Int J Environ Res Public Health 2022, 19, 7340. [Google Scholar] [CrossRef] [PubMed]
- South Coast. Available online: https://www.aqmd.gov/aq-spec/sensors (accessed on 18 March 2023).
- Leung, D.Y.C. Outdoor-Indoor Air Pollution in Urban Environment: Challenges and Opportunity. Front. Environ. Sci. 2015, 2, 69. [Google Scholar] [CrossRef]
- Cross, E.S.; Williams, L.R.; Lewis, D.K.; Magoon, G.R.; Onasch, T.B.; Kaminsky, M.L.; Worsnop, D.R.; Jayne, J.T. Use of Electrochemical Sensors for Measurement of Air Pollution: Correcting Interference Response and Validating Measurements. Atmospheric Measurement Techniques 2017, 10, 3575–3588. [Google Scholar] [CrossRef]
- Gao, R.S.; Telg, H.; McLaughlin, R.J.; Ciciora, S.J.; Watts, L.A.; Richardson, M.S.; Schwarz, J.P.; Perring, A.E.; Thornberry, T.D.; Rollins, A.W.; et al. A Light-Weight, High-Sensitivity Particle Spectrometer for PM2.5 Aerosol Measurements. Aerosol Science and Technology 2016, 50, 88–99. [Google Scholar] [CrossRef]
- Barker, P.A.; Allen, G.; Flynn, M.; Riddick, S.; Pitt, J.R. Measurement of Recreational N2O Emissions from an Urban Environment in Manchester, UK. Urban Climate 2022, 46, 101282. [Google Scholar] [CrossRef]
- Dales, R.; Liu, L.; Wheeler, A.J.; Gilbert, N.L. Quality of Indoor Residential Air and Health. CMAJ 2008, 179, 147–152. [Google Scholar] [CrossRef]
- Levy Zamora, M.; Xiong, F.; Gentner, D.; Kerkez, B.; Kohrman-Glaser, J.; Koehler, K. Field and Laboratory Evaluations of the Low-Cost Plantower Particulate Matter Sensor. Environ. Sci. Technol. 2019, 53, 838–849. [Google Scholar] [CrossRef]
| Device ID | PM2.5 | PM10 | NO2 | ||||||||||||
|---|---|---|---|---|---|---|---|---|---|---|---|---|---|---|---|
| a | b | R2 | RMSE | #data points | a | b | R2 | RMSE | #data points | a | b | R2 | RMSE | #data points | |
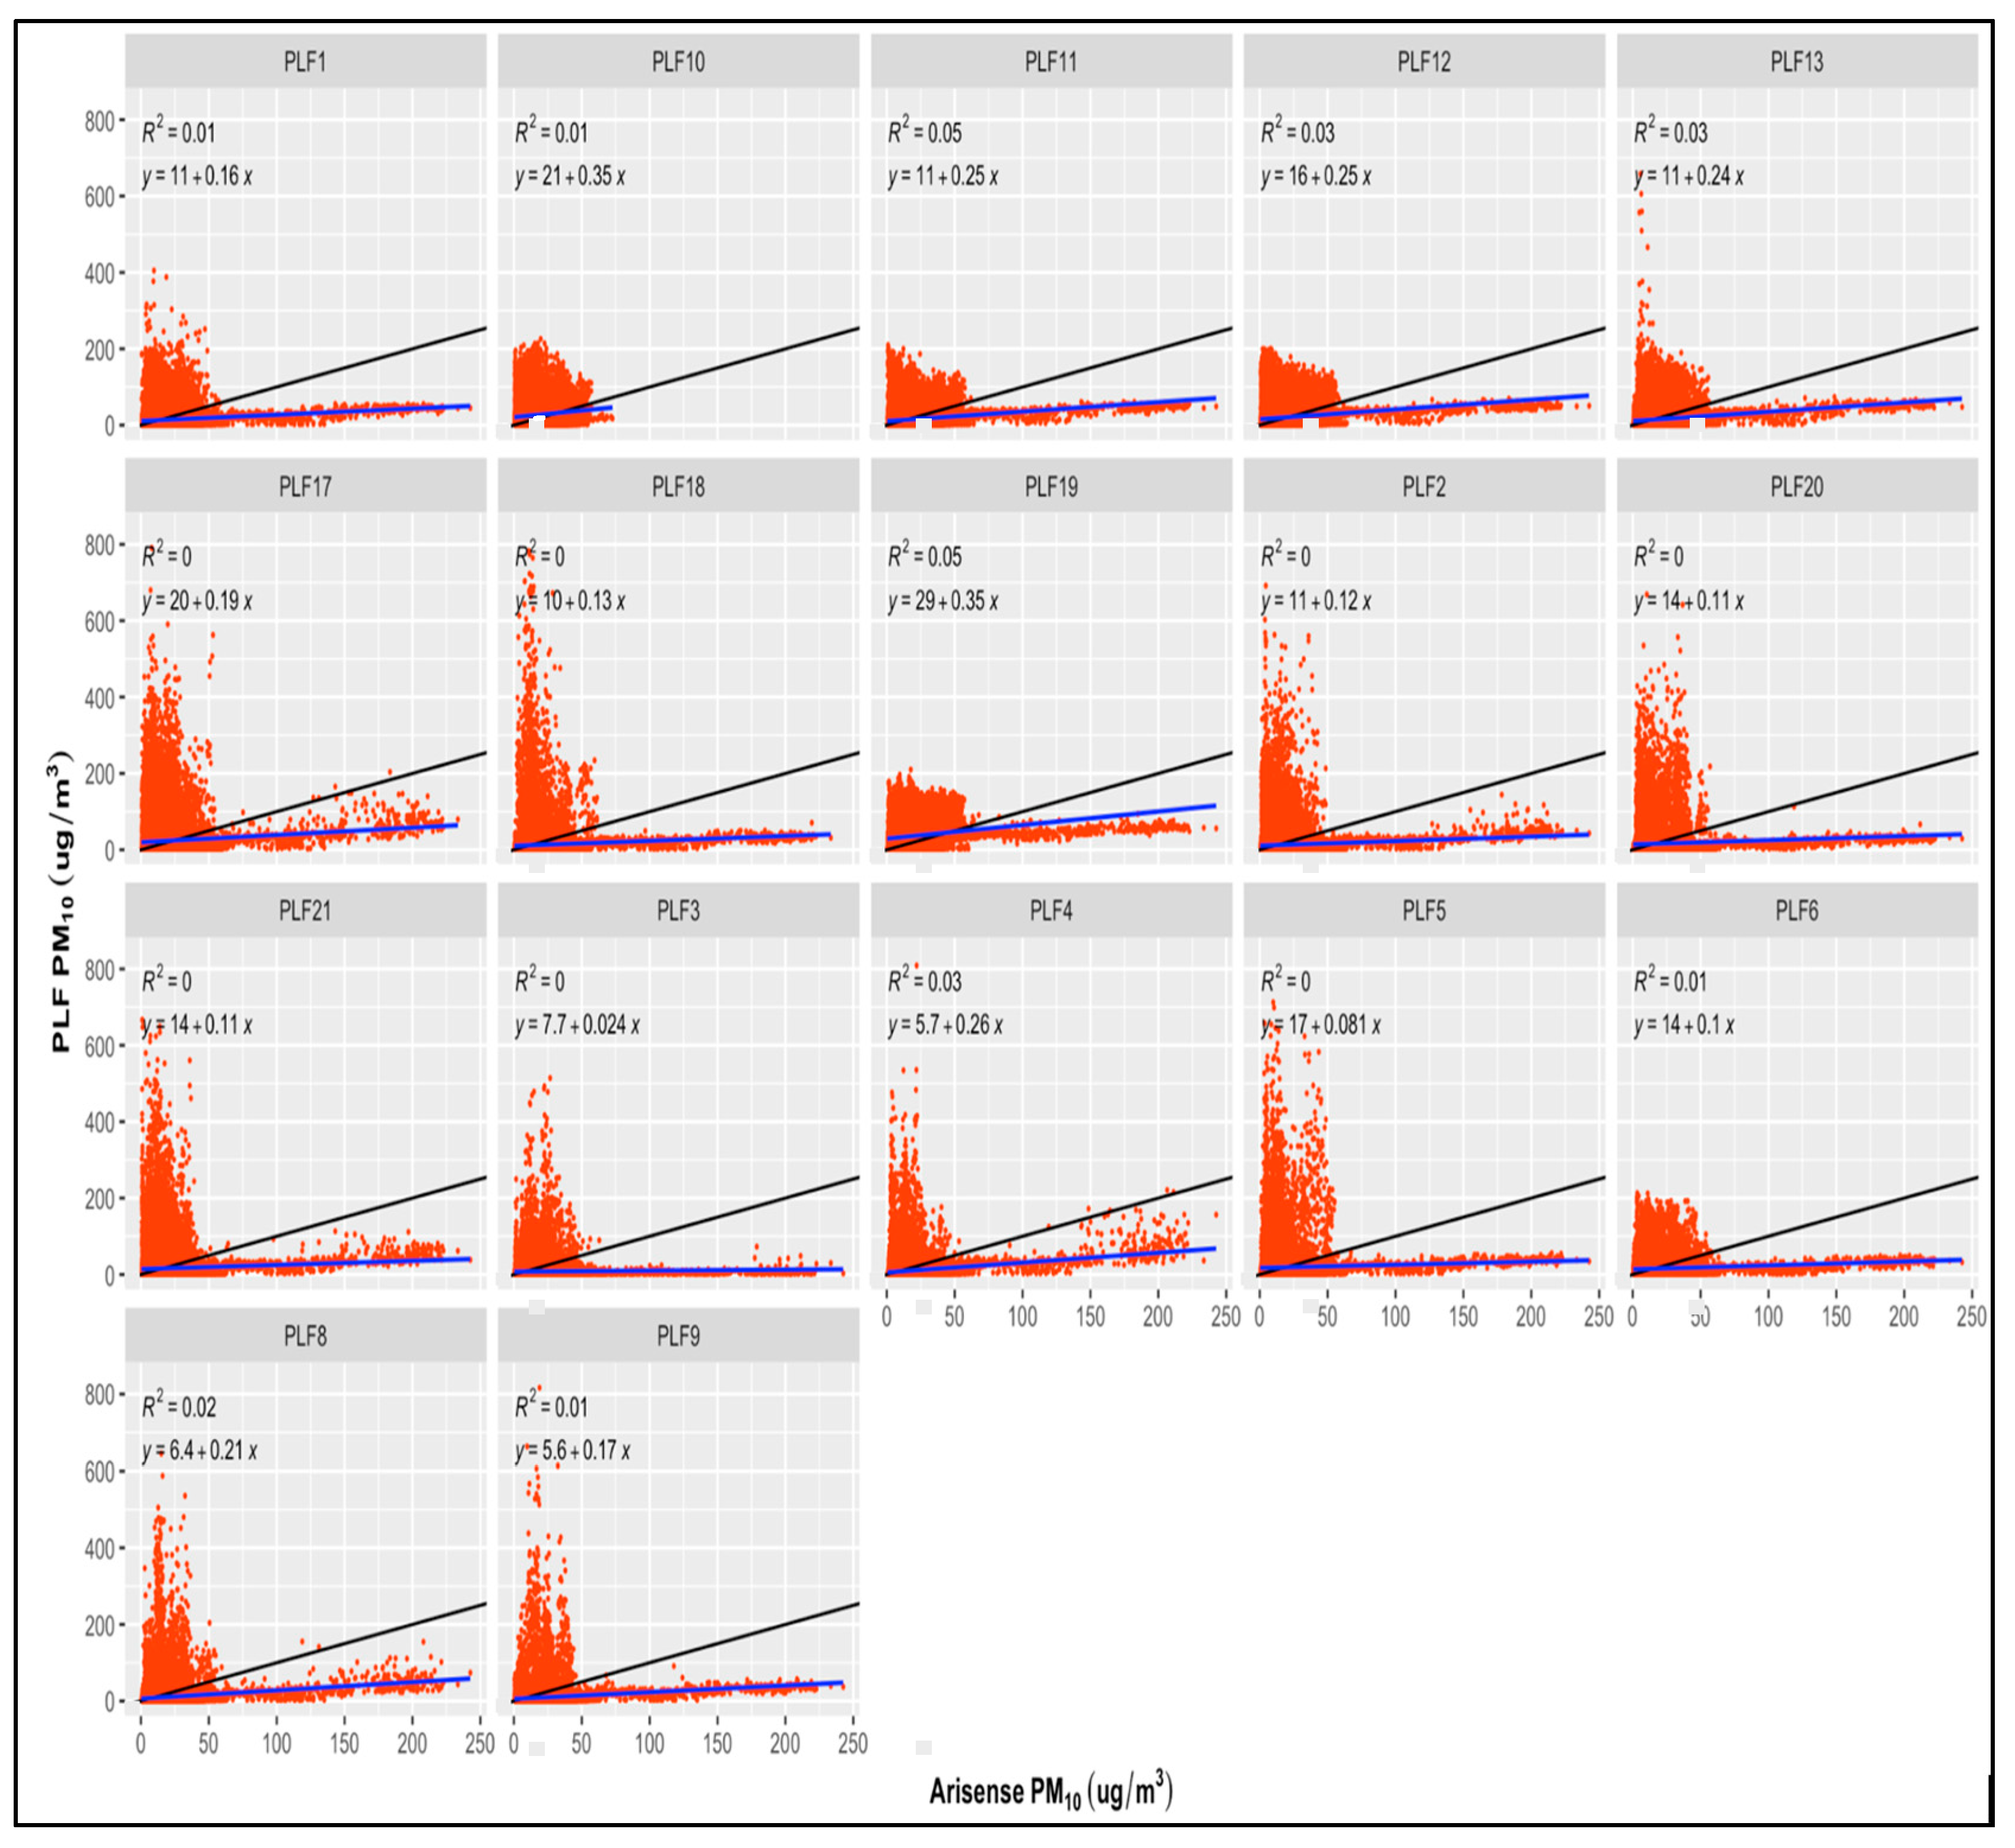
| PLF 1 | 1.82 | 0.28 | 0.29 | 4.14 | 31725 | 11.07 | 0.16 | 0.01 | 24.01 | 31725 | 13.63 | -0.02 | 0.00 | 13.63 | 31191 |
| PLF 2 | 4.16 | 0.26 | 0.09 | 7.62 | 33665 | 10.9 | 0.12 | 0.01 | 35.23 | 33665 | 16.96 | -0.13 | 0.002 | 15.79 | 33047 |
| PLF 3 | 3.73 | 0.04 | 0.004 | 5.20 | 31474 | 7.74 | 0.02 | 0.001 | 23.21 | 31474 | 15.03 | -0.21 | 0.01 | 13.78 | 30911 |
| PLF 4 | 2.32 | 0.37 | 0.32 | 5.21 | 31404 | 5.74 | 0.26 | 0.03 | 27.36 | 31404 | 25.51 | -0.62 | 0.02 | 28.7 | 30804 |
| PLF 5 | 5.66 | 0.23 | 0.06 | 8.82 | 33572 | 17.47 | 0.08 | 0.001 | 47.24 | 33572 | 20.04 | -0.51 | 0.02 | 18.80 | 32957 |
| PLF 6 | 3.45 | 0.16 | 0.16 | 3.28 | 31968 | 13.74 | 0.10 | 0.01 | 20.98 | 31968 | 15.11 | 0.04 | 0.001 | 14.84 | 31520 |
| PLF 8 | 3.23 | 0.24 | 0.11 | 6.42 | 30898 | 6.36 | 0.21 | 0.02 | 30.03 | 30900 | 14.15 | 0.04 | 0.00 | 15.57 | 30512 |
| PLF 9 | 2.74 | 0.29 | 0.18 | 6.11 | 32596 | 5.61 | 0.17 | 0.01 | 26.64 | 32596 | 18.8 | 0.57 | 0.04 | 15.59 | 32003 |
| PLF 10 | 5.21 | 0.12 | 0.008 | 7.38 | 29973 | 20.91 | 0.35 | 0.01 | 31.67 | 29973 | 19.38 | -0.01 | 0.00 | 17.64 | 29624 |
| PLF 11 | 0.73 | 0.4 | 0.58 | 3.41 | 30255 | 10.71 | 0.25 | 0.05 | 20.26 | 30255 | 16.54 | -0.18 | 0.00 | 22.73 | 29640 |
| PLF 12 | 0.98 | 0.45 | 0.58 | 3.68 | 33775 | 15.71 | 0.25 | 0.03 | 26.14 | 33775 | 20.97 | -0.56 | 0.05 | 14.02 | 33172 |
| PLF 13 | 1.1 | 0.38 | 0.45 | 4.04 | 32780 | 10.91 | 0.24 | 0.03 | 24.86 | 32780 | 15.36 | -0.09 | 0.001 | 15.78 | 32178 |
| PLF 17 | 5.8 | 0.36 | 0.14 | 8.52 | 33692 | 19.74 | 0.19 | 0.005 | 47.5 | 33692 | 18.27 | -0.32 | 0.02 | 13.20 | 33077 |
| PLF 18 | 3.71 | 0.26 | 0.09 | 7.67 | 33415 | 10.44 | 0.13 | 0.003 | 41.52 | 33415 | 17.25 | -0.04 | 0.001 | 13.05 | 32799 |
| PLF 19 | 3.47 | 0.58 | 0.63 | 4.23 | 32702 | 29.25 | 0.35 | 0.05 | 27.03 | 32702 | 15.42 | 0.09 | 0.001 | 17.81 | 32162 |
| PLF 20 | 4.05 | 0.19 | 0.07 | 6.50 | 27349 | 14.06 | 0.10 | 0.003 | 39.94 | 27349 | 13.59 | 0.19 | 0.004 | 14.55 | 26978 |
| PLF 21 | 4.46 | 0.3 | 0.10 | 8.51 | 33338 | 14.27 | 0.11 | 0.002 | 42.28 | 33338 | 19.83 | -0.18 | 0.004 | 17.15 | 32672 |
| Device ID | 3 weeks sampling period | |||||||||||
|---|---|---|---|---|---|---|---|---|---|---|---|---|
| 1-min | 1-hour | |||||||||||
| PM2.5 | PM10 | NO2 | PM2.5 | PM10 | NO2 | |||||||
| R2 | RMSE | R2 | RMSE | R2 | RMSE | R2 | RMSE | R2 | RMSE | R2 | RMSE | |
| PLF 1 | 0.3 | 4.1 | 0.01 | 24.0 | 0.00 | 13.6 | 0.001 | 1.8 | 0.05 | 14.5 | 0.01 | 13.7 |
| PLF 2 | 0.1 | 7.6 | 0.01 | 35.2 | 0.002 | 15.7 | 0.001 | 5.3 | 0.001 | 23.1 | 0.00 | 14.1 |
| PLF 3 | 0.00 | 5.2 | 0.001 | 23.2 | 0.01 | 13.7 | 0.03 | 2.4 | 0.00 | 10.0 | 0.01 | 12.7 |
| PLF 4 | 0.18 | 5.2 | 0.03 | 27.3 | 0.02 | 28.7 | 0.04 | 2.9 | 0.004 | 19.0 | 0.00 | 26.5 |
| PLF 5 | 0.06 | 8.8 | 0.001 | 47.2 | 0.02 | 18.8 | 0.005 | 5.1 | 0.01 | 26.7 | 0.00 | 24.9 |
| PLF 6 | 0.16 | 3.2 | 0.01 | 20.9 | 0.001 | 14.8 | 0.17 | 1.4 | 0.03 | 12.9 | 0.02 | 15.1 |
| PLF 8 | 0.11 | 6.4 | 0.02 | 30.0 | 0.00 | 15.5 | 0.001 | 3.8 | 0.02 | 13.7 | 0.01 | 15.0 |
| PLF 9 | 0.18 | 6.1 | 0.01 | 26.6 | 0.04 | 15.5 | 0.06 | 4.3 | 0.00 | 16.4 | 0.06 | 17.5 |
| PLF 10 | 0.01 | 7.3 | 0.01 | 31.6 | 0.00 | 17.6 | 0.004 | 4.0 | 0.01 | 19.5 | 0.00 | 16.4 |
| PLF 11 | 0.58 | 3.4 | 0.05 | 20.2 | 0.00 | 22.7 | 0.23 | 0.8 | 0.09 | 10.4 | 0.00 | 16.1 |
| PLF 12 | 0.58 | 3.6 | 0.03 | 26.1 | 0.05 | 14.0 | 0.43 | 1.1 | 0.05 | 13.1 | 0.03 | 14.8 |
| PLF 13 | 0.51 | 4.0 | 0.03 | 24.8 | 0.001 | 15.7 | 0.01 | 1.6 | 0.04 | 9.8 | 0.003 | 16.3 |
| PLF 17 | 0.14 | 8.5 | 0.005 | 47.5 | 0.02 | 13.2 | 0.06 | 5.4 | 0.00 | 32.0 | 0.00 | 13.3 |
| PLF 18 | 0.09 | 7.6 | 0.003 | 41.5 | 0.001 | 13.1 | 0.01 | 3.6 | 0.00 | 16.9 | 0.04 | 11.8 |
| PLF 19 | 0.63 | 4.2 | 0.05 | 27.0 | 0.001 | 17.8 | 0.69 | 1.5 | 0.19 | 12.3 | 0.004 | 12.4 |
| PLF 20 | 0.07 | 6.5 | 0.003 | 39.9 | 0.004 | 14.5 | 0.02 | 3.9 | 0.01 | 23.9 | 0.00 | 14.2 |
| PLF 21 | 0.1 | 8.5 | 0.002 | 42.2 | 0.004 | 17.1 | 0.00 | 6.4 | 0.00 | 29.1 | 0.007 | 15.2 |
|
Total PLFs (average) |
0.22 | 5.9 | 0.01 | 24.0 | 0.01 | 16.6 | 0.10 | 3.25 | 0.03 | 17.8 | 0.01 | 15.8 |
| Device ID | 5 days sampling period | |||||||||||
|---|---|---|---|---|---|---|---|---|---|---|---|---|
| 1-min | 1-hour | |||||||||||
| PM2.5 | PM10 | NO2 | PM2.5 | PM10 | NO2 | |||||||
| R2 | RMSE | R2 | RMSE | R2 | RMSE | R2 | RMSE | R2 | RMSE | R2 | RMSE | |
| PLF 1 | 0.56 | 15.9 | 0.05 | 22.7 | 0.02 | 13.8 | 0.66 | 15.2 | 0.03 | 27.0 | 0.01 | 13.7 |
| PLF 2 | 0.35 | 15.9 | 0.03 | 28.8 | 0.00 | 16.7 | 0.54 | 14.4 | 0.05 | 18.9 | 0.01 | 16.4 |
| PLF 3 | 0.00 | 21.3 | 0.00 | 35.2 | 0.02 | 17.6 | 0 | 20.1 | 0.001 | 15.2 | 0.02 | 17.2 |
| PLF 4 | 0.59 | 14.1 | 0.25 | 19.5 | 0.16 | 38.5 | 0.71 | 13.1 | 0.11 | 15.4 | 0.19 | 38.1 |
| PLF 5 | 0.19 | 17.3 | 0.00 | 47.9 | 0.17 | 21.9 | 0.38 | 15.4 | 0.00 | 33.0 | 0.2 | 21.2 |
| PLF 6 | 0.54 | 18.9 | 0.02 | 23.1 | 0.02 | 19.8 | 0.63 | 18.1 | 0.00 | 32.9 | 0.03 | 19.6 |
| PLF 8 | 0.21 | 19.3 | 0.01 | 49.6 | 0.03 | 19.7 | 0.36 | 17.4 | 0.00 | 56.1 | 0.04 | 19.5 |
| PLF 9 | 0.25 | 16.8 | 0.004 | 42.7 | 0.16 | 18.7 | 0.45 | 15.1 | 0.00 | 67.2 | 0.22 | 18.1 |
| PLF 10 | 0.65 | 9.5 | 0.01 | 22.6 | 0.04 | 18.2 | 0.76 | 9 | 0.01 | 25.1 | 0.07 | 17.6 |
| PLF 11 | 0.69 | 13.9 | 0.17 | 15.7 | 0.02 | 19.7 | 0.75 | 13.2 | 0.08 | 16.6 | 0.03 | 18.6 |
| PLF 12 | 0.68 | 13.1 | 0.06 | 21.5 | 0.22 | 20.9 | 0.75 | 12.3 | 0.09 | 18.1 | 0.27 | 20.2 |
| PLF 13 | 0.68 | 14 | 0.08 | 22.0 | 0.01 | 17.7 | 0.75 | 13.2 | 0.03 | 24.3 | 0.01 | 17 |
| PLF 17 | 0.23 | 16.2 | 0.01 | 50.1 | 0.04 | 13.8 | 0.38 | 13.9 | 0.002 | 47.0 | 0.06 | 13.3 |
| PLF 18 | 0.29 | 16.6 | 0.01 | 37.5 | 0.08 | 17.2 | 0.49 | 15.2 | 0.06 | 16.7 | 0.1 | 16.8 |
| PLF 19 | 0.71 | 11 | 0.01 | 28.6 | 0.00 | 17.9 | 0.78 | 9.8 | 0.01 | 28.4 | 0.00 | 16.8 |
| PLF 20 | 0.48 | 21.1 | 0.02 | 28.3 | 0.03 | 14.4 | 0.72 | 19.8 | 0.00 | 39.4 | 0.03 | 13.6 |
| PLF 21 | 0.31 | 15.8 | 0.02 | 39.3 | 0.06 | 27.4 | 0.54 | 13.9 | 0.00 | 38.9 | 0.08 | 27.5 |
|
Total PLFs (average) |
0.41 | 15.9 | 0.04 | 31.48 | 0.06 | 14.6 | 0.56 | 19.6 | 0.03 | 30.6 | 0.08 | 19.1 |
Disclaimer/Publisher’s Note: The statements, opinions and data contained in all publications are solely those of the individual author(s) and contributor(s) and not of MDPI and/or the editor(s). MDPI and/or the editor(s) disclaim responsibility for any injury to people or property resulting from any ideas, methods, instructions or products referred to in the content. |
© 2023 by the authors. Licensee MDPI, Basel, Switzerland. This article is an open access article distributed under the terms and conditions of the Creative Commons Attribution (CC BY) license (http://creativecommons.org/licenses/by/4.0/).


