Submitted:
28 August 2023
Posted:
28 August 2023
You are already at the latest version
Abstract
Keywords:
1. Introduction
2. Experimental
2.1. Materials
2.2. Solution and Sample Preparation Procedures
2.3. WBE Experiments
2.4. SVET Experiments
2.5. SECM Experiments
2.6. Optical Macroscopy Investigations
2.7. SEM-EDS Characterisations
3. Results and Discussion
3.1. WBE Investigations on the Millimetre Scale
3.2. SVET and SECM Investigations on the Micro-Meter Scale
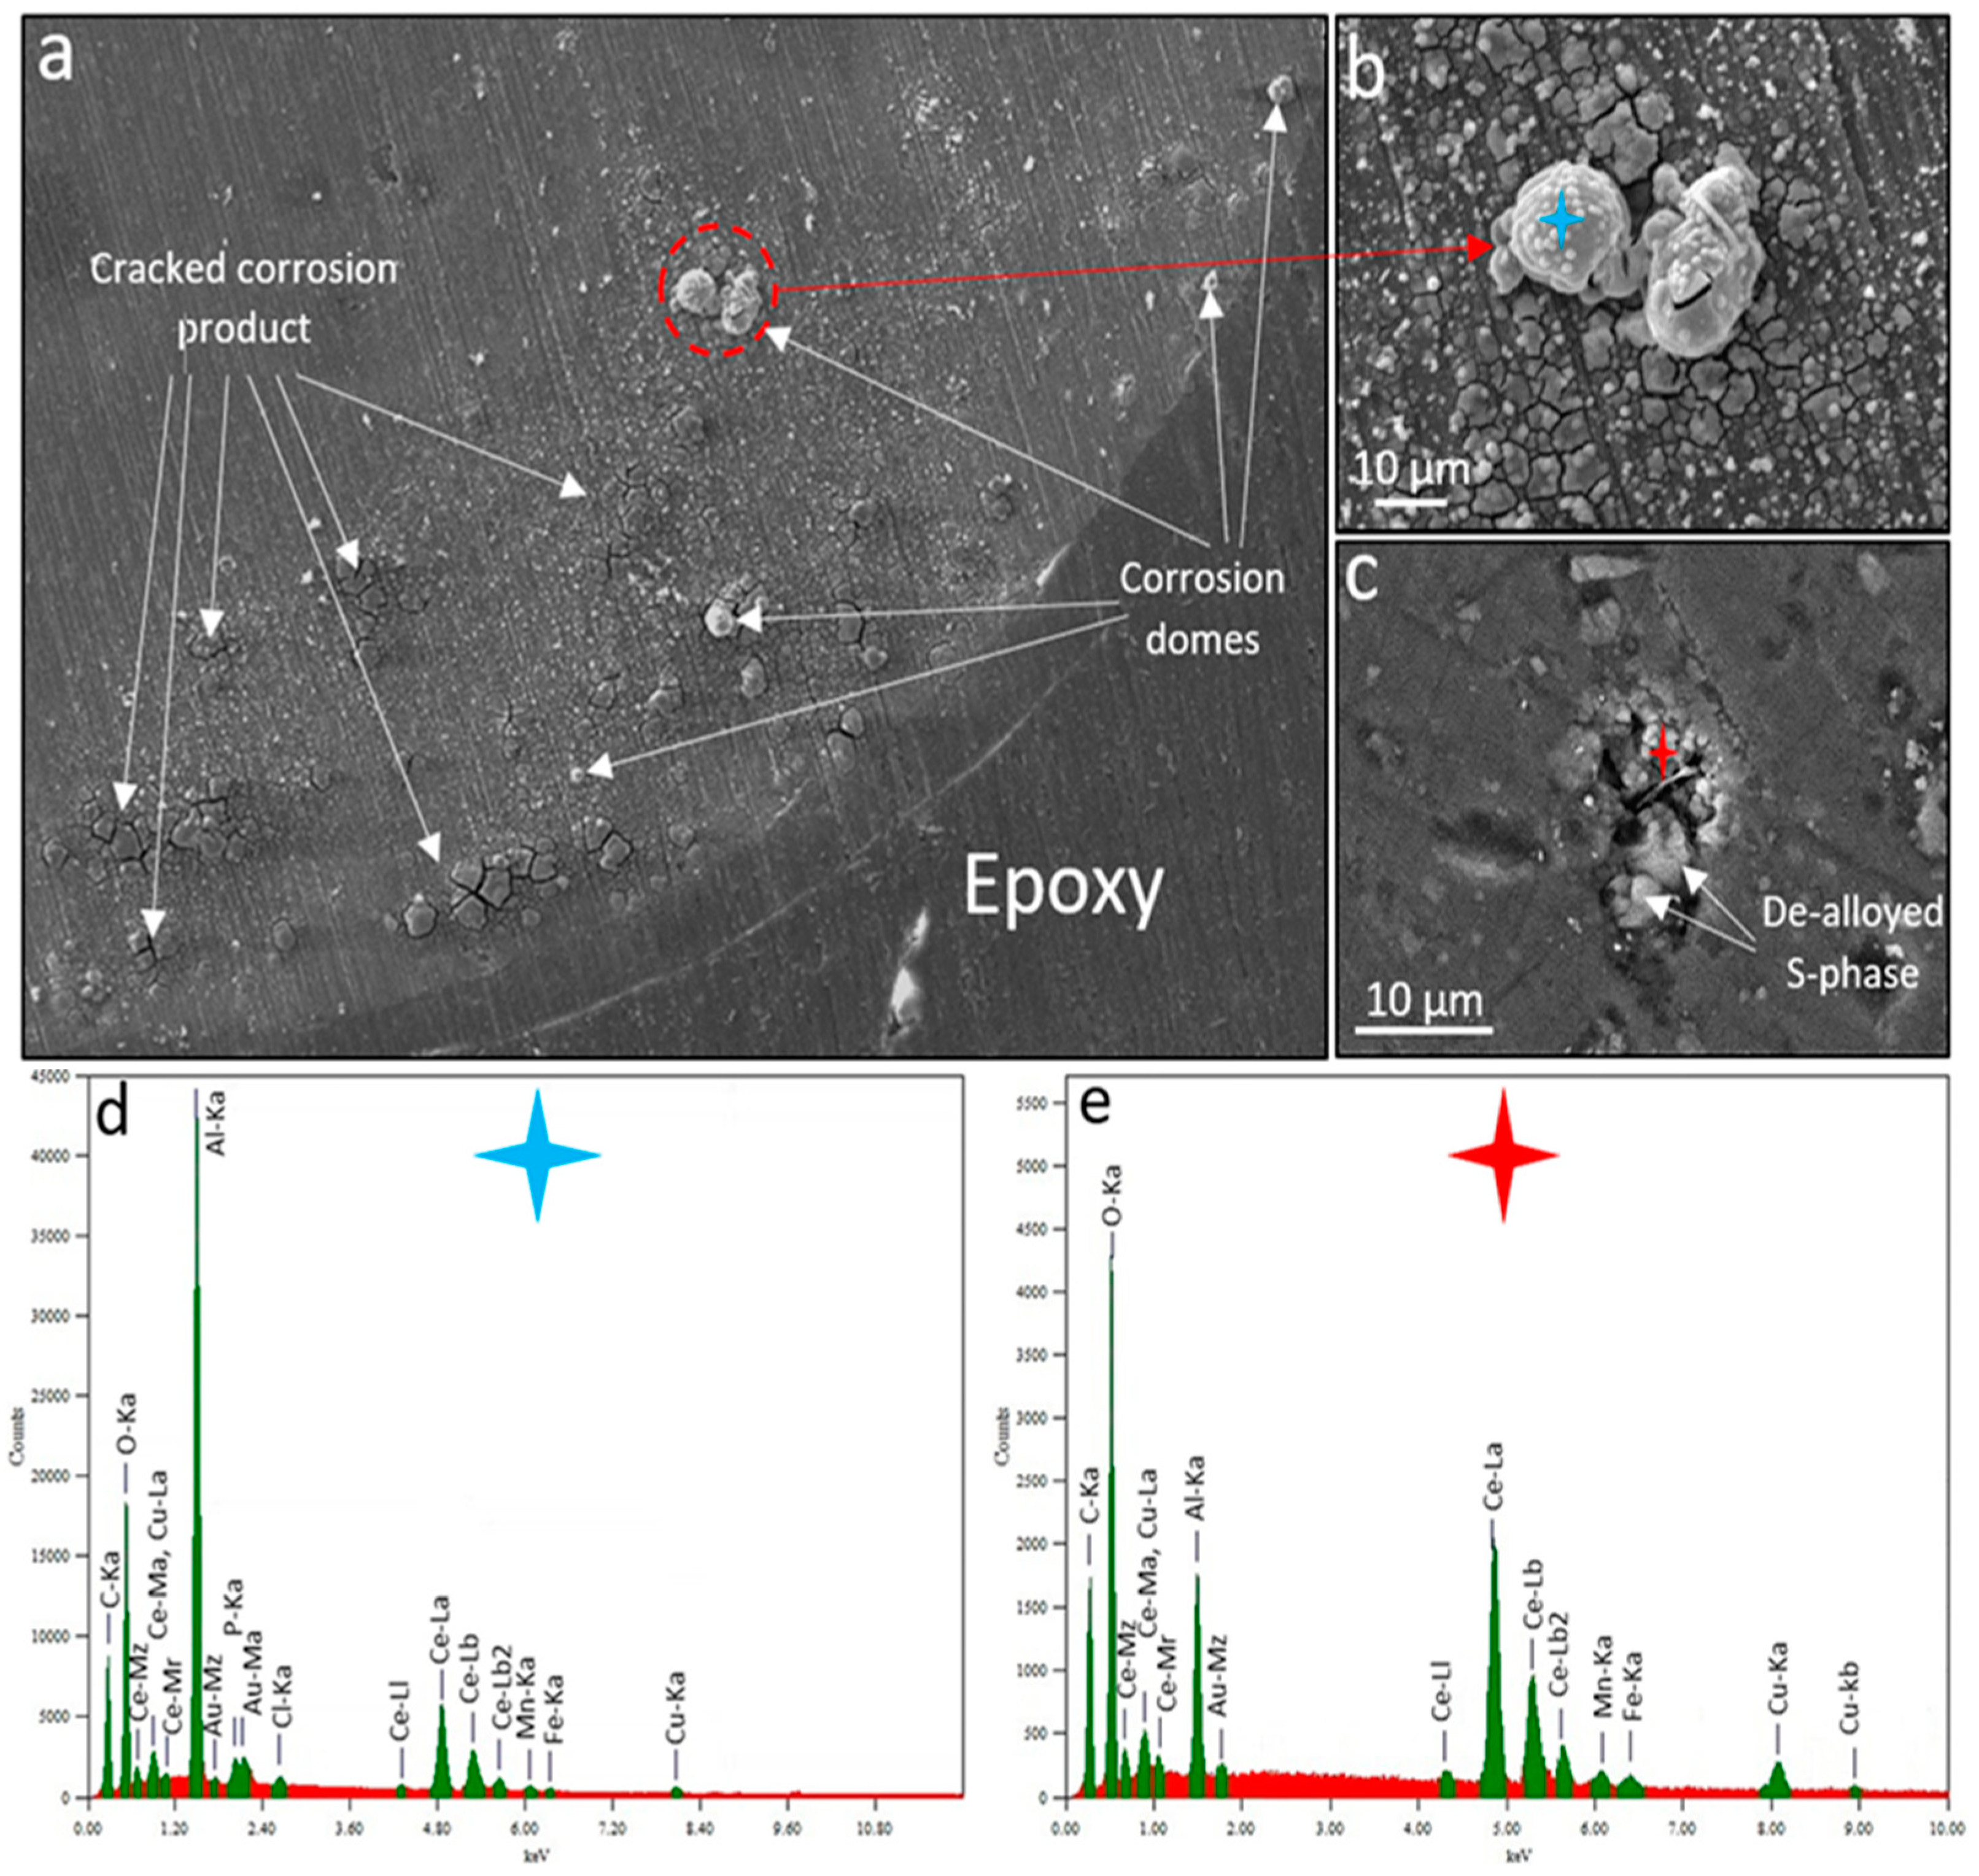
3.3. Discussion on Multiscale Inhibition by Integrating WBE, SVET and SECM Data
- 1)
- Increase in hydrogen ion activity due to consumption of hydrogen ions in the protonation of dpp anion in the acidic anolyte solution.
- 2)
- Reaction of dpp with aluminiuim ions in the electrolyte at the anodes.
- 3)
- Reaction of Ce with hydroxyl ions in solution (i.e. generation of Ce(OH)n3-n) near cathodic sites thus increasing the activity for oxygen reduction over cathodes.
- 4)
- Formation of other cerium species such as peroxo complexes during oxygen reduction over cathodes. These may facilitate superoxide or peroxide generation and increase the rate of these first steps in reduction of oxygen in a fashion similar to conversion coatings [98].
5. Conclusions
Data Availability Statement
Conflicts of Interest
References
- Kosari, A.; et al. In-situ nanoscopic observations of dealloying-driven local corrosion from surface initiation to in-depth propagation. Corrosion Science 2020, 177, 108912. [Google Scholar] [CrossRef]
- Kosari, A.; et al. Dealloying-driven local corrosion by intermetallic constituent particles and dispersoids in aerospace aluminium alloys. Corrosion Science 2020, 177, 108947. [Google Scholar] [CrossRef]
- Parvizi, R.; et al. Probing corrosion initiation at interfacial nanostructures of AA2024-T3. Corrosion Science 2017, 116, 98–109. [Google Scholar] [CrossRef]
- Zhang, B.; et al. Direct observation of atomic-scale origins of local dissolution in Al-Cu-Mg alloys. Scientific Reports 2016, 6, 39525. [Google Scholar] [CrossRef]
- Birbilis, N.; et al. A closer look at constituent induced localised corrosion in Al-Cu-Mg alloys. Corrosion Science 2016, 113, 160–171. [Google Scholar] [CrossRef]
- Parvizi, R. A.E. Hughes, and M.Y.J. Tan, New approach to probing localised corrosion processes over wide length and time scales using integrated multi-scale electrode arrays. Corrosion Science 2021, 181, 109238. [Google Scholar] [CrossRef]
- Yasakau, K.A.; et al. 8 - Novel and self-healing anticorrosion coatings using rare earth compounds, in Rare Earth-Based Corrosion Inhibitors. 2014, Woodhead Publishing. pp. 233–266.
- Hughes, A.E.; et al. 7 - Coatings for corrosion prevention based on rare earths, in Rare Earth-Based Corrosion Inhibitors. 2014, Woodhead Publishing. pp. 186–232.
- De Nicolò, A.; et al. Cerium conversion coating and sol-gel multilayer system for corrosion protection of AA6060. Surface and Coatings Technology 2016, 287, 33–43. [Google Scholar] [CrossRef]
- Mohammadi, I. et al. , Cerium/diethyldithiocarbamate complex as a novel corrosion inhibitive pigment for AA2024-T3. Scientific reports 2020, 10, 5043–5043. [Google Scholar]
- Bastos, A.C.; et al. Localised Measurements of pH and Dissolved Oxygen as Complements to SVET in the Investigation of Corrosion at Defects in Coated Aluminum Alloy. Electroanalysis 2010, 22, 2009–2016. [Google Scholar] [CrossRef]
- Frankel, G.S. Pitting Corrosion of Metals: A Review of the Critical Factors. Journal of The Electrochemical Society 1998, 145, 2186–2198. [Google Scholar] [CrossRef]
- Leblanc, P. G.S. Frankel, A Study of Corrosion and Pitting Initiation of AA2024-T3 Using Atomic Force Microscopy. Journal of The Electrochemical Society 2002, 149, B239–B247. [Google Scholar] [CrossRef]
- Markley, T.A. M. Forsyth, and A.E. Hughes, Corrosion protection of AA2024-T3 using rare earth diphenyl phosphates. Electrochimica Acta 2007, 52, 4024–4031. [Google Scholar] [CrossRef]
- Markley, T.A.; et al. Chromate replacement in coatings for corrosion protection of aerospace aluminium alloys. Materials and Corrosion 2011, 62, 836–840. [Google Scholar] [CrossRef]
- Muster, T.H. A.E. Hughes, and G.E. Thompson, Copper distributions in aluminium alloys, in Corrosion Research Trends, I.S. Wang, Editor. 2007, Nova Science Publishers: New York. pp. 35−106.
- Muster, T.H.; et al. A combinatorial matrix of rare earth chloride mixtures as corrosion inhibitors of AA2024-T3: Optimisation using potentiodynamic polarisation and EIS. Electrochimica Acta 2012, 67, 95–103. [Google Scholar] [CrossRef]
- Schmutz, P. and G.S. Frankel, Characterization of AA2024-T3 by Scanning Kelvin Probe Force Microscopy. Journal of The Electrochemical Society 1998, 145, 2285–2295. [CrossRef]
- Schmutz, P. and G.S. Frankel, Corrosion Study of AA2024-T3 by Scanning Kelvin Probe Force Microscopy and In Situ Atomic Force Microscopy Scratching. Journal of The Electrochemical Society 1998, 145, 2295–2306. [CrossRef]
- Zhang, W. and G.S. Frankel, Anisotropy of Localized Corrosion in AA2024-T3. Electrochemical and Solid-State Letters 2000, 3, 268–270.
- Zhang, W. and G.S. Frankel, Localized Corrosion Growth Kinetics in AA2024 Alloys. Journal of The Electrochemical Society 2002, 149, B510–B519. [CrossRef]
- Mouanga, M.; et al. A localized approach to study the effect of cerium salts as cathodic inhibitor on iron/aluminum galvanic coupling. Corrosion Science 2015, 90, 491–502. [Google Scholar] [CrossRef]
- Paussa, L.; et al. Investigation of AA2024-T3 surfaces modified by cerium compounds: A localized approach. Corrosion Science 2014, 78, 215–222. [Google Scholar] [CrossRef]
- Andreatta, F.; et al. Volta potential of clad AA2024 aluminium after exposure to CeCl3 solution. Corrosion Science 2014, 86, 189–201. [Google Scholar] [CrossRef]
- Li, J., B. Hurley, and R. Buchheit, Microelectrochemical characterization of the effect of rare earth inhibitors on the localized corrosion of AA2024-T3. Journal of the Electrochemical Society 2015, 162, C563–C571. [CrossRef]
- Hinton, B.R.W. D.R. Arnott, and N.E. Ryan, THE INHIBITION OF ALUMINUM-ALLOY CORROSION BY CEROUS CATIONS. Metals Forum 1984, 7, 211–217. [Google Scholar]
- Garcia, S.J.; et al. Unravelling the corrosion inhibition mechanisms of bi-functional inhibitors by EIS and SEM–EDS. Corrosion Science 2013, 69, 346–358. [Google Scholar] [CrossRef]
- Markley, T.A.; et al. Influence of Praseodymium: Synergistic Corrosion Inhibition in Mixed Rare-Earth Diphenyl Phosphate Systems. Electrochemical and Solid-State Letters 2007, 10, C72–C75. [Google Scholar] [CrossRef]
- Zhang, W. and G. S. Frankel, Transitions between pitting and intergranular corrosion in AA2024. Electrochimica Acta 2003, 48, 1193–1210. [Google Scholar]
- Blanc, C. S. Gastaud, and G. Mankowski Mechanistic Studies of the Corrosion of 2024 Aluminum Alloy in Nitrate Solutions. Journal of The Electrochemical Society 2003, 150, B396–B404. [Google Scholar]
- Catubig, R.; et al. The use of cerium and praseodymium mercaptoacetate as thiol-containing inhibitors for AA2024-T3. Corrosion Science 2014, 81, 45–53. [Google Scholar] [CrossRef]
- Catubig, R.; et al. The influence of rare earth mercaptoacetate on the initiation of corrosion on AA2024-T3 Part I: Average statistics of each intermetallic composition. Corrosion Science 2015, 95, 22–39. [Google Scholar] [CrossRef]
- Catubig, R.; et al. The influence of rare earth mercaptoacetate on the initiation of corrosion on AA2024-T3 Part II: The influence of intermetallic compositions within heavily attacked sites. Corrosion Science 2015, 95, 40–50. [Google Scholar] [CrossRef]
- Catubig, R.A.; et al. An Al-Cu Multielectrode Model for Studying Corrosion Inhibition with Praseodymium Mercaptoacetate at Intermetallic Particles in AA2024. Journal of The Electrochemical Society 2021, 168, 071501. [Google Scholar] [CrossRef]
- Gobara, M.; et al. Corrosion protection mechanism of Ce4+/organic inhibitor for AA2024 in 3.5% NaCl. RSC Advances 2020, 10, 2227–2240. [Google Scholar] [CrossRef] [PubMed]
- Shi, H. E.-H. Han, and F. Liu, Corrosion protection of aluminium alloy 2024-T3 in 0.05 M NaCl by cerium cinnamate. Corrosion Science 2011, 53, 2374–2384. [Google Scholar] [CrossRef]
- García, S.J.; et al. The influence of pH on corrosion inhibitor selection for 2024-T3 aluminium alloy assessed by high-throughput multielectrode and potentiodynamic testing. Electrochimica Acta 2010, 55, 2457–2465. [Google Scholar] [CrossRef]
- Ho, D.; et al. Cerium Dibutylphosphate as a Corrosion Inhibitor for AA2024-T3 Aluminum Alloys. Journal of The Electrochemical Society 2006, 153, B392–B401. [Google Scholar] [CrossRef]
- Coelho, L.B. D. Cossement, and M.G. Olivier, Benzotriazole and cerium chloride as corrosion inhibitors for AA2024-T3: An EIS investigation supported by SVET and ToF-SIMS analysis. Corrosion Science 2018, 130, 177–189. [Google Scholar] [CrossRef]
- Machkova, M.; et al. Effect of the anionic part of various Ce(III) salts on the corrosion inhibition efficiency of AA2024 aluminium alloy. Corrosion Science 2013, 69, 396–405. [Google Scholar] [CrossRef]
- Matter, E.A.; et al. Electrochemical studies on the corrosion inhibition of AA2024 aluminium alloy by rare earth ammonium nitrates in 3.5% NaCl solutions. Materials and corrosion 2013, 64, 408–414. [Google Scholar] [CrossRef]
- Matter, E.A.; et al. Comparison between the inhibition efficiencies of Ce(III) and Ce(IV) ammonium nitrates against corrosion of AA2024 aluminum alloy in solutions of low chloride concentration. Corrosion Science 2012, 62, 22–33. [Google Scholar] [CrossRef]
- Arnott, D.R. B.R.W. Hinton, and N.E. Ryan, Cationic-Film-Forming Inhibitors for the Protection of the AA 7075 Aluminum Alloy Against Corrosion in Aqueous Chloride Solution. Corrosion 1989, 45, 12–18. [Google Scholar] [CrossRef]
- Bethencourt, M.; et al. Lanthanide compounds as environmentally-friendly corrosion inhibitors of aluminium alloys: a review. Corrosion Science 1998, 40, 1803–1819. [Google Scholar] [CrossRef]
- Birbilis, N.; et al. Inhibition of AA2024-T3 on a Phase-by-Phase Basis Using an Environmentally Benign Inhibitor, Cerium Dibutyl Phosphate. Electrochemical and Solid-State Letters 2005, 8, C180–C183. [Google Scholar] [CrossRef]
- Lamaka, S.V.; et al. High effective organic corrosion inhibitors for 2024 aluminium alloy. Electrochimica Acta 2007, 52, 7231–7247. [Google Scholar] [CrossRef]
- Forsyth, M.; et al. New ‘Green’ Corrosion Inhibitors Based on Rare Earth Compounds. Australian Journal of Chemistry 2011, 64, 812–819. [Google Scholar] [CrossRef]
- Hughes, A.E. J.M.C. Mol, and I.S. Cole, 10 - The cost and availability of rare earth-based corrosion inhibitors, in Rare Earth-Based Corrosion Inhibitors. 2014, Woodhead Publishing. p. 291-305.
- Markley, T.; et al. 4 - Multifunctional rare earth organic corrosion inhibitors, in Rare Earth-Based Corrosion Inhibitors. 2014, Woodhead Publishing. p. 117-142.
- Oliveira, M.; et al. Corrosion Inhibition and Acceleration by Rare Earth Ions in Galvanic Couples. Journal of The Electrochemical Society 2020, 166, C642–C648. [Google Scholar] [CrossRef]
- Mardel, J.; et al. The characterisation and performance of Ce(dbp)3-inhibited epoxy coatings. Progress in Organic Coatings 2011, 70, 91–101. [Google Scholar] [CrossRef]
- Forsyth, M.; et al. Inhibition of Corrosion on AA2024-T3 by New Environmentally Friendly Rare Earth Organophosphate Compounds. Corrosion 2008, 64, 191–197. [Google Scholar] [CrossRef]
- Hill, J.-A.; et al. Corrosion inhibition of 7000 series aluminium alloys with cerium diphenyl phosphate. Journal of Alloys and Compounds 2011, 509, 1683–1690. [Google Scholar] [CrossRef]
- Blin, F.; et al. The corrosion inhibition mechanism of new rare earth cinnamate compounds — Electrochemical studies. Electrochimica Acta 2007, 52, 6212–6220. [Google Scholar] [CrossRef]
- Scholes, F.H.; et al. Interaction of Ce(dbp)3 with surface of aluminium alloy 2024-T3 using macroscopic models of intermetallic phases. Corrosion Engineering, Science and Technology 2009, 44, 416–424. [Google Scholar] [CrossRef]
- Paussa, L.; et al. Study of the effect of cerium nitrate on AA2024-T3 by means of electrochemical micro-cell technique. Electrochimica Acta 2012, 70, 25–33. [Google Scholar] [CrossRef]
- Andreatta, F.; et al. Localized corrosion inhibition by cerium species on clad AA2024 aluminium alloy investigated by means of electrochemical micro-cell. Corrosion Science 2012, 65, 376–386. [Google Scholar] [CrossRef]
- Paussa, L.; et al. Inhibition effect of cerium in hybrid sol-gel films on aluminium alloy AA2024. Surface and Interface Analysis 2010, 42, 299–305. [Google Scholar] [CrossRef]
- Muster, T.H.; et al. A rapid screening multi-electrode method for the evaluation of corrosion inhibitors. Electrochimica Acta 2009, 54, 3402–3411. [Google Scholar] [CrossRef]
- White, P.A.; et al. High-throughput channel arrays for inhibitor testing: Proof of concept for AA2024-T3. Corrosion Science 2009, 51, 2279–2290. [Google Scholar] [CrossRef]
- Garcia, S.J.; et al. Validation of a fast scanning technique for corrosion inhibitor selection: influence of cross-contamination on AA2024-T3. Surface and Interface Analysis 2010, 42, 205–210. [Google Scholar] [CrossRef]
- White, P.A.; et al. A new high-throughput method for corrosion testing. Corrosion Science 2012, 58, 327–331. [Google Scholar] [CrossRef]
- Murer, N. and R.G. Buchheit, Stochastic modeling of pitting corrosion in aluminum alloys. Corrosion Science 2013, 69, 139–148. [Google Scholar] [CrossRef]
- Battocchi, D.; et al. Emulation and study of the corrosion behavior of Al alloy 2024-T3 using a wire beam electrode (WBE) in conjunction with scanning vibrating electrode technique (SVET). Corrosion Science 2005, 47, 1165–1176. [Google Scholar] [CrossRef]
- Laurino, A.; et al. Corrosion Behavior of 6101 Aluminum Alloy Strands for Automotive Wires. Journal of The Electrochemical Society 2013, 160, C569–C575. [Google Scholar] [CrossRef]
- Tan, Y. and T. Liu, Inhibiting Localized Corrosion of Aluminum and Aluminum Alloy by Rare Earth Metal Compounds: Behaviors and Characteristics Observed Using an Electrochemically Integrated Multi-Electrode Array. Journal of The Electrochemical Society 2013, 160, C147–C158. [Google Scholar] [CrossRef]
- Mouanga, M., et al., A localized approach to study the effect of cerium salts as cathodic inhibitor on iron/aluminum galvanic coupling. Corrosion Science 2014.
- Parvizi, R.; et al. Atom probe tomography study of the nanoscale heterostructure around an Al20Mn3Cu2 dispersoid in aluminum alloy 2024. Langmuir 2014, 30, 14817–14823. [Google Scholar] [CrossRef] [PubMed]
- Parvizi, R.; et al. Role of microstructure in corrosion initiation of a highly-deformed AA2024 wire. Corrosion Science 2018, 144, 184–197. [Google Scholar] [CrossRef]
- Tan, Y.-J. Wire beam electrode: a new tool for studying localised corrosion and other heterogeneous electrochemical processes. Corrosion Science 1998, 41, 229–247. [Google Scholar] [CrossRef]
- Naing Aung, N. and Y.-J. Tan, A new method of studying buried steel corrosion and its inhibition using the wire beam electrode. Corrosion Science 2004, 46, 3057–3067. [Google Scholar] [CrossRef]
- Tan, Y.-J. An experimental comparison of three wire beam electrode based methods for determining corrosion rates and patterns. Corrosion Science 2005, 47, 1653–1665. [Google Scholar] [CrossRef]
- Tan, Y. N.N. Aung, and T. Liu, Evaluating localised corrosion intensity using the wire beam electrode. Corrosion Science 2012, 63, 379–386. [Google Scholar] [CrossRef]
- Tan, Y.J. and N.N. Aung, Quantifying the efficiency and understanding the mechanism of localised corrosion inhibition using the wire beam electrode. Materials and Corrosion, 2012: p. n/a-n/a.
- Izquierdo, J.; et al. A novel microelectrochemical strategy for the study of corrosion inhibitors employing the scanning vibrating electrode technique and dual potentiometric/amperometric operation in scanning electrochemical microscopy: Application to the study of the cathodic inhibition by benzotriazole of the galvanic corrosion of copper coupled to iron. Electrochimica Acta 2011, 58, 707–716. [Google Scholar]
- Akid, R. and M. Garma, Scanning vibrating reference electrode technique: a calibration study to evaluate the optimum operating parameters for maximum signal detection of point source activity. Electrochimica Acta 2004. 49, 2871–2879.
- Bastos, A.C., M.C. Quevedo, and M.G.S. Ferreira, The influence of vibration and probe movement on SVET measurements. Corrosion Science 2015, 92, 309–314. [CrossRef]
- Amemiya, S.; et al. Scanning Electrochemical Microscopy. Annual Review of Analytical Chemistry 2008, 1, 95–131. [Google Scholar] [CrossRef] [PubMed]
- Sun, P., F.O. Laforge, and M.V. Mirkin, Scanning electrochemical microscopy in the 21st century. Physical Chemistry Chemical Physics 2007, 9, 802–823. [CrossRef] [PubMed]
- González-García, Y.; et al. A combined redox-competition and negative-feedback SECM study of self-healing anticorrosive coatings. Electrochemistry Communications 2011, 13, 1094–1097. [Google Scholar] [CrossRef]
- Glenn, A.M.; et al. Corrosion of AA2024-T3 Part III: Propagation. Corrosion Science 2011, 53, 40–50. [Google Scholar] [CrossRef]
- Hughes, A.E.; et al. Corrosion of AA2024-T3 Part II: Co-operative corrosion. Corrosion Science 2011, 53, 27–39. [Google Scholar] [CrossRef]
- Luo, C.; et al. Continuous and discontinuous localized corrosion of a 2xxx aluminium–copper–lithium alloy in sodium chloride solution. Journal of Alloys and Compounds 2016, 658, 61–70. [Google Scholar] [CrossRef]
- Ma, Y.; et al. Localised corrosion in AA 2099-T83 aluminium-lithium alloy: The role of grain orientation. Corrosion Science 2016, 107, 41–48. [Google Scholar] [CrossRef]
- Markley, T.A. Corrosion mitigation of aerospace alloys using rare earth diphenyl phosphates. 2008.
- Zhou, X.; et al. Study of localized corrosion in AA2024 aluminium alloy using electron tomography. Corrosion Science 2012, 58, 299–306. [Google Scholar] [CrossRef]
- King, P.C.; et al. FIB/SEM study of AA2024 corrosion under a seawater drop, part II. Corrosion Science 2012, 55, 116–125. [Google Scholar] [CrossRef]
- King, P.C.; et al. FIB/SEM study of AA2024 corrosion under a seawater drop: Part I. Corrosion Science 2011, 53, 1086–1096. [Google Scholar] [CrossRef]
- Hughes, A.; et al. Co-operative corrosion phenomena. Corrosion Science 2010, 52, 665–668. [Google Scholar] [CrossRef]
- Boag, A.; et al. Stable pit formation on AA2024-T3 in a NaCl environment. Corrosion Science 2010, 52, 90–103. [Google Scholar] [CrossRef]
- Boag, A.; et al. How complex is the microstructure of AA2024-T3? Corrosion Science 2009, 51, 1565–1568. [Google Scholar] [CrossRef]
- Jakab, M.A. D.A. Little, and J.R. Scully, Experimental and Modeling Studies of the Oxygen Reduction Reaction on AA2024-T3. Journal of The Electrochemical Society 2005, 152, B311–B320. [Google Scholar] [CrossRef]
- Garcia, S.J.; et al. Unravelling the corrosion inhibition mechanisms of bi-functional inhibitors by EIS and SEM–EDS. Corrosion Science 2013, 69, 346–358. [Google Scholar] [CrossRef]
- Parvizi, R. Electrochemical and interfacial characterisation of localised corrosion at heterogeneous structures in AA2024. 2017, Deakin University. p. 314.
- Erich, S.J.F. H.P. Huinink, and O.C.G. Adan, Dissolution properties of cerium dibutylphosphate corrosion inhibitors AU - van Soestbergen, M. Corrosion Engineering, Science and Technology 2013, 48, 234–240. [Google Scholar]
- Arnott, D.R., et al., Auger and XPS studies of cerium corrosion inhibition on 7075 aluminum alloy. Applications of Surface Science 1985, 22–23, 236–251.
- Kendig, M.W. and R.G. Buchheit, Corrosion Inhibition of Aluminum and Aluminum Alloys by Soluble Chromates, Chromate Coatings, and Chromate-Free Coatings. CORROSION 2003, 59, 379–400. [Google Scholar] [CrossRef]
- Scholes, F.H.; et al. The role of hydrogen peroxide in the deposition of cerium-based conversion coatings. Applied Surface Science 2006, 253, 1770–1780. [Google Scholar] [CrossRef]
- Hinton, B.R.W. Corrosion inhibition with rare earth metal salts. Journal of Alloys and Compounds 1992, 180, 15–25. [Google Scholar] [CrossRef]
- Mansfeld, F. Use of rare earth metal salt solutions for corrosion protection of aluminum alloys and mild steel. Russian Journal of Electrochemistry 2000, 36, 1063–1071. [Google Scholar] [CrossRef]
- Mishra, A.K. and R. Balasubramaniam, Corrosion inhibition of aluminium by rare earth chlorides. Materials Chemistry and Physics 2007, 103, 385–393. [Google Scholar] [CrossRef]
- Mishra, A.K. and R. Balasubramaniam, Corrosion inhibition of aluminum alloy AA 2014 by rare earth chlorides. Corrosion Science 2007, 49, 1027–1044. [Google Scholar] [CrossRef]
- Muster, T.H.; et al. An investigation of rare earth chloride mixtures: combinatorial optimisation for AA2024-t3 corrosion inhibition. Surface and Interface Analysis 2010, 42, 170–174. [Google Scholar] [CrossRef]
- Yasakau, K.A.; et al. Mechanism of Corrosion Inhibition of AA2024 by Rare-Earth Compounds. The Journal of Physical Chemistry B 2006, 110, 5515–5528. [Google Scholar] [CrossRef]
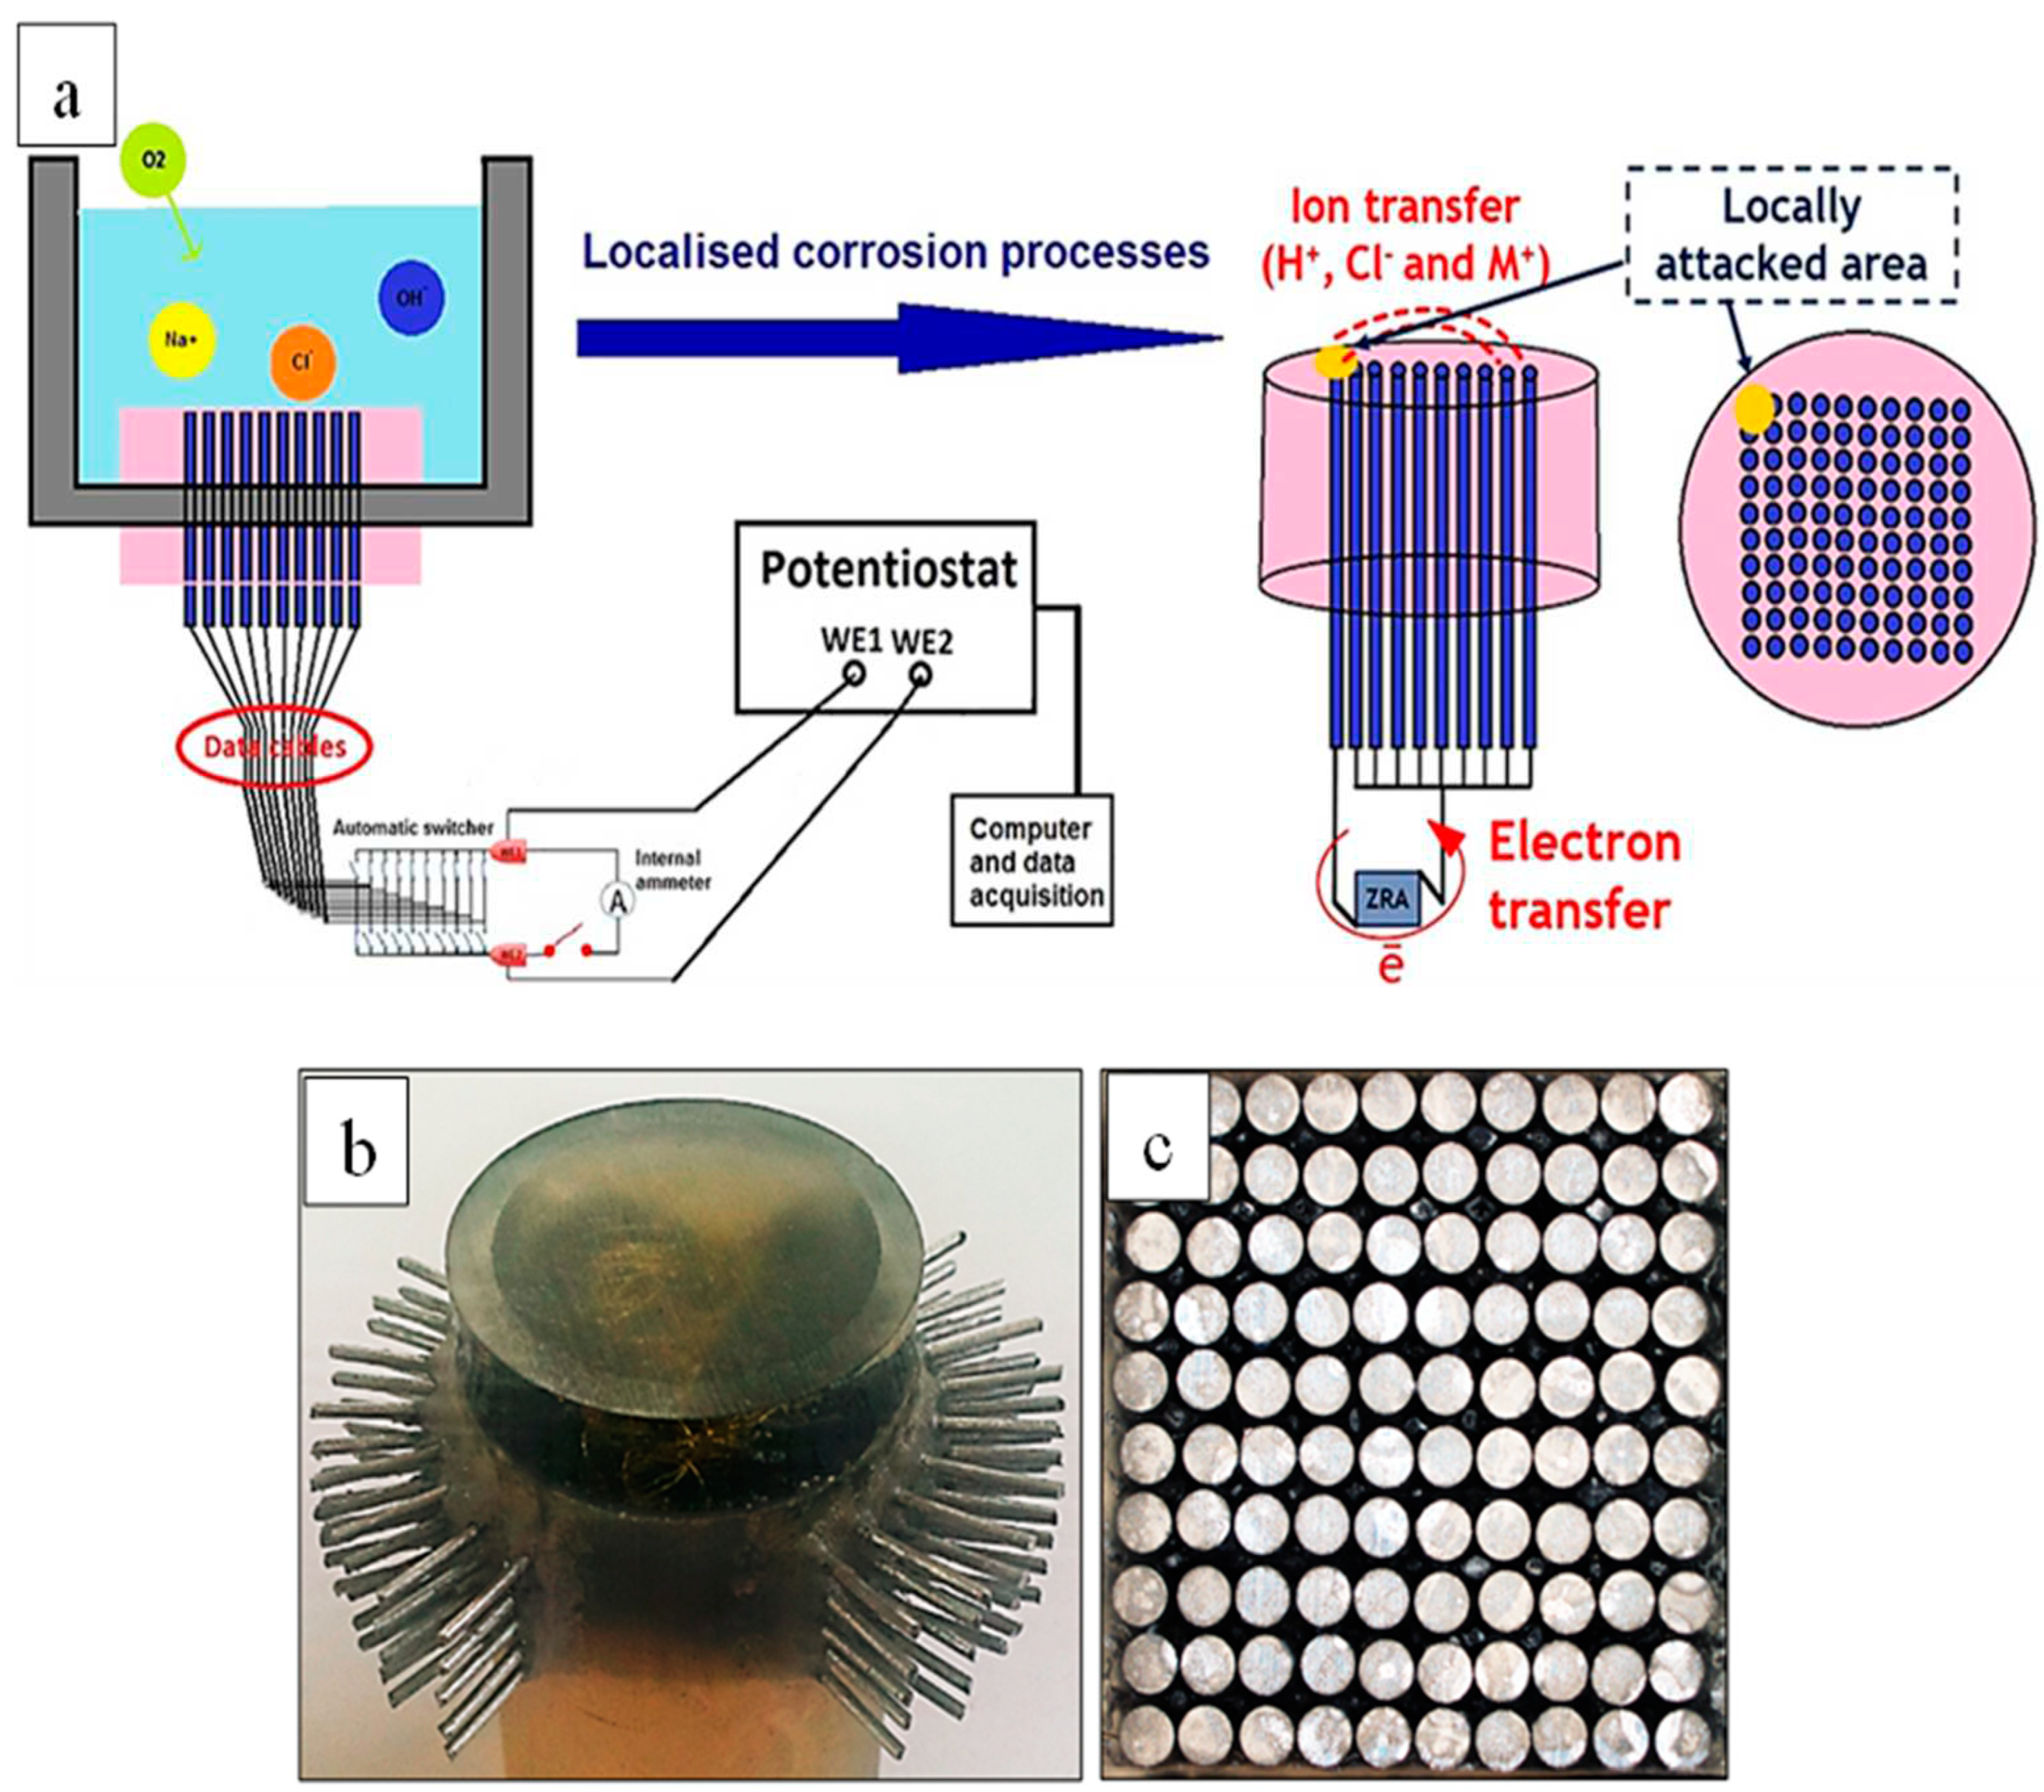
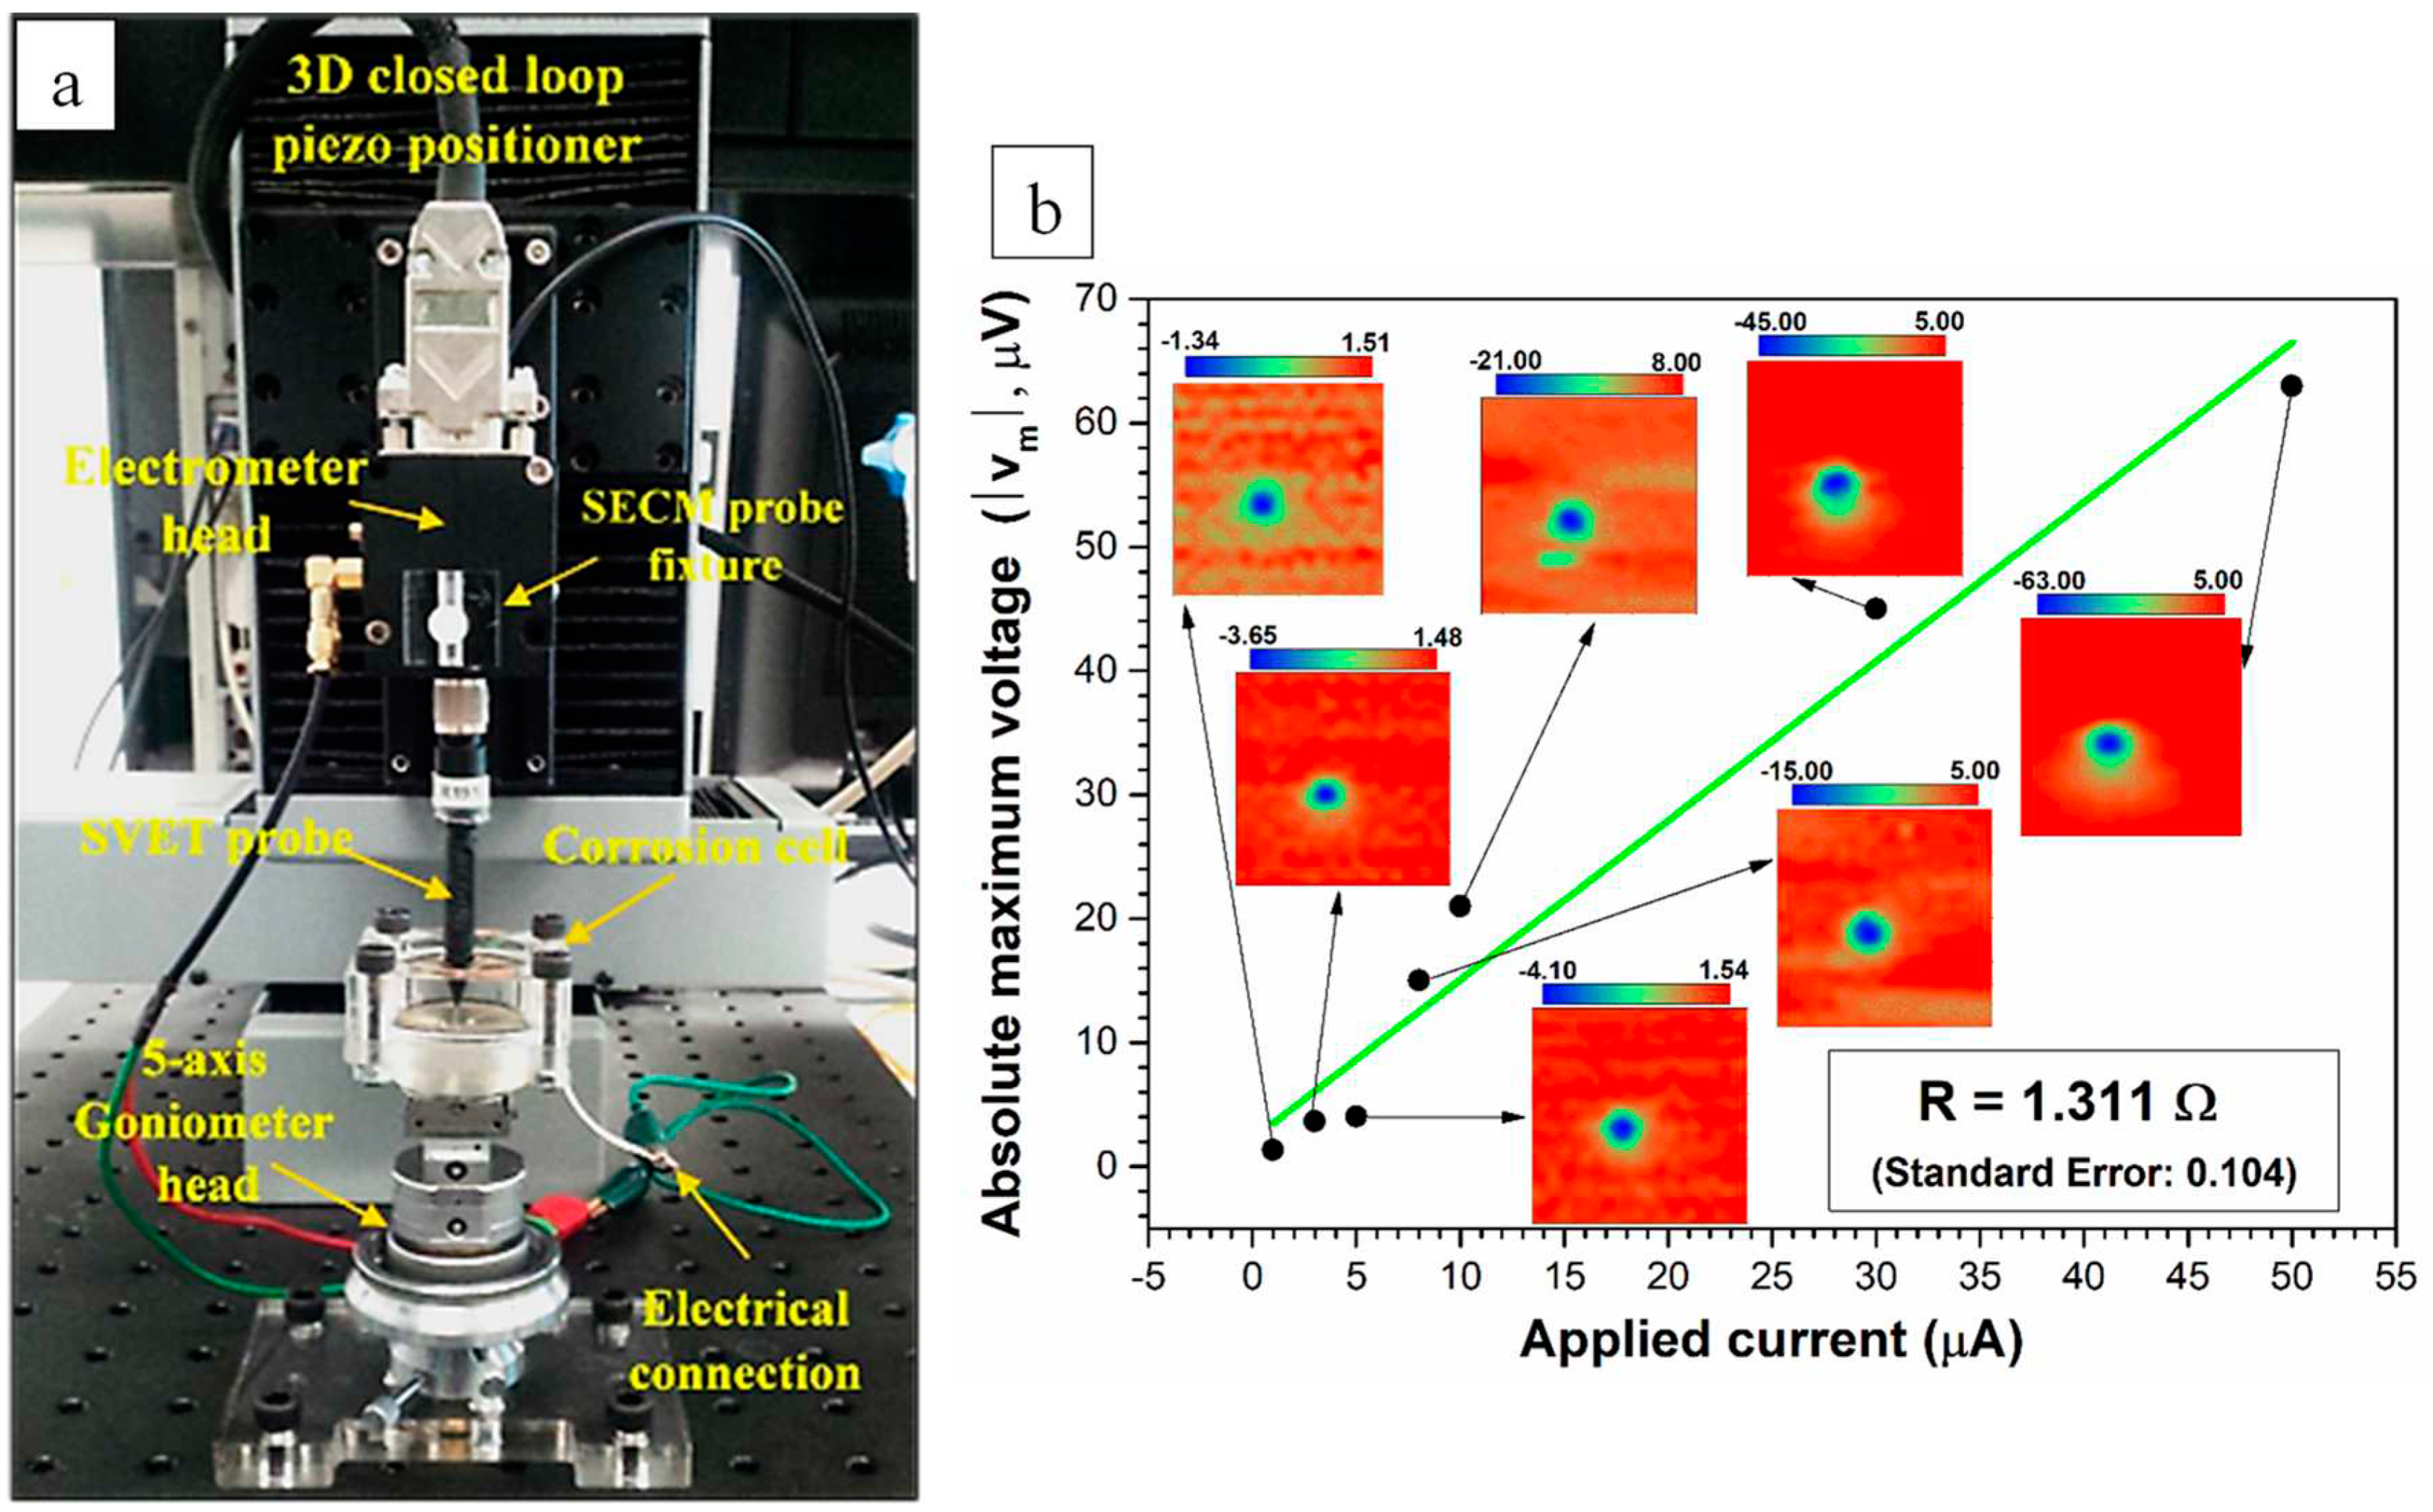
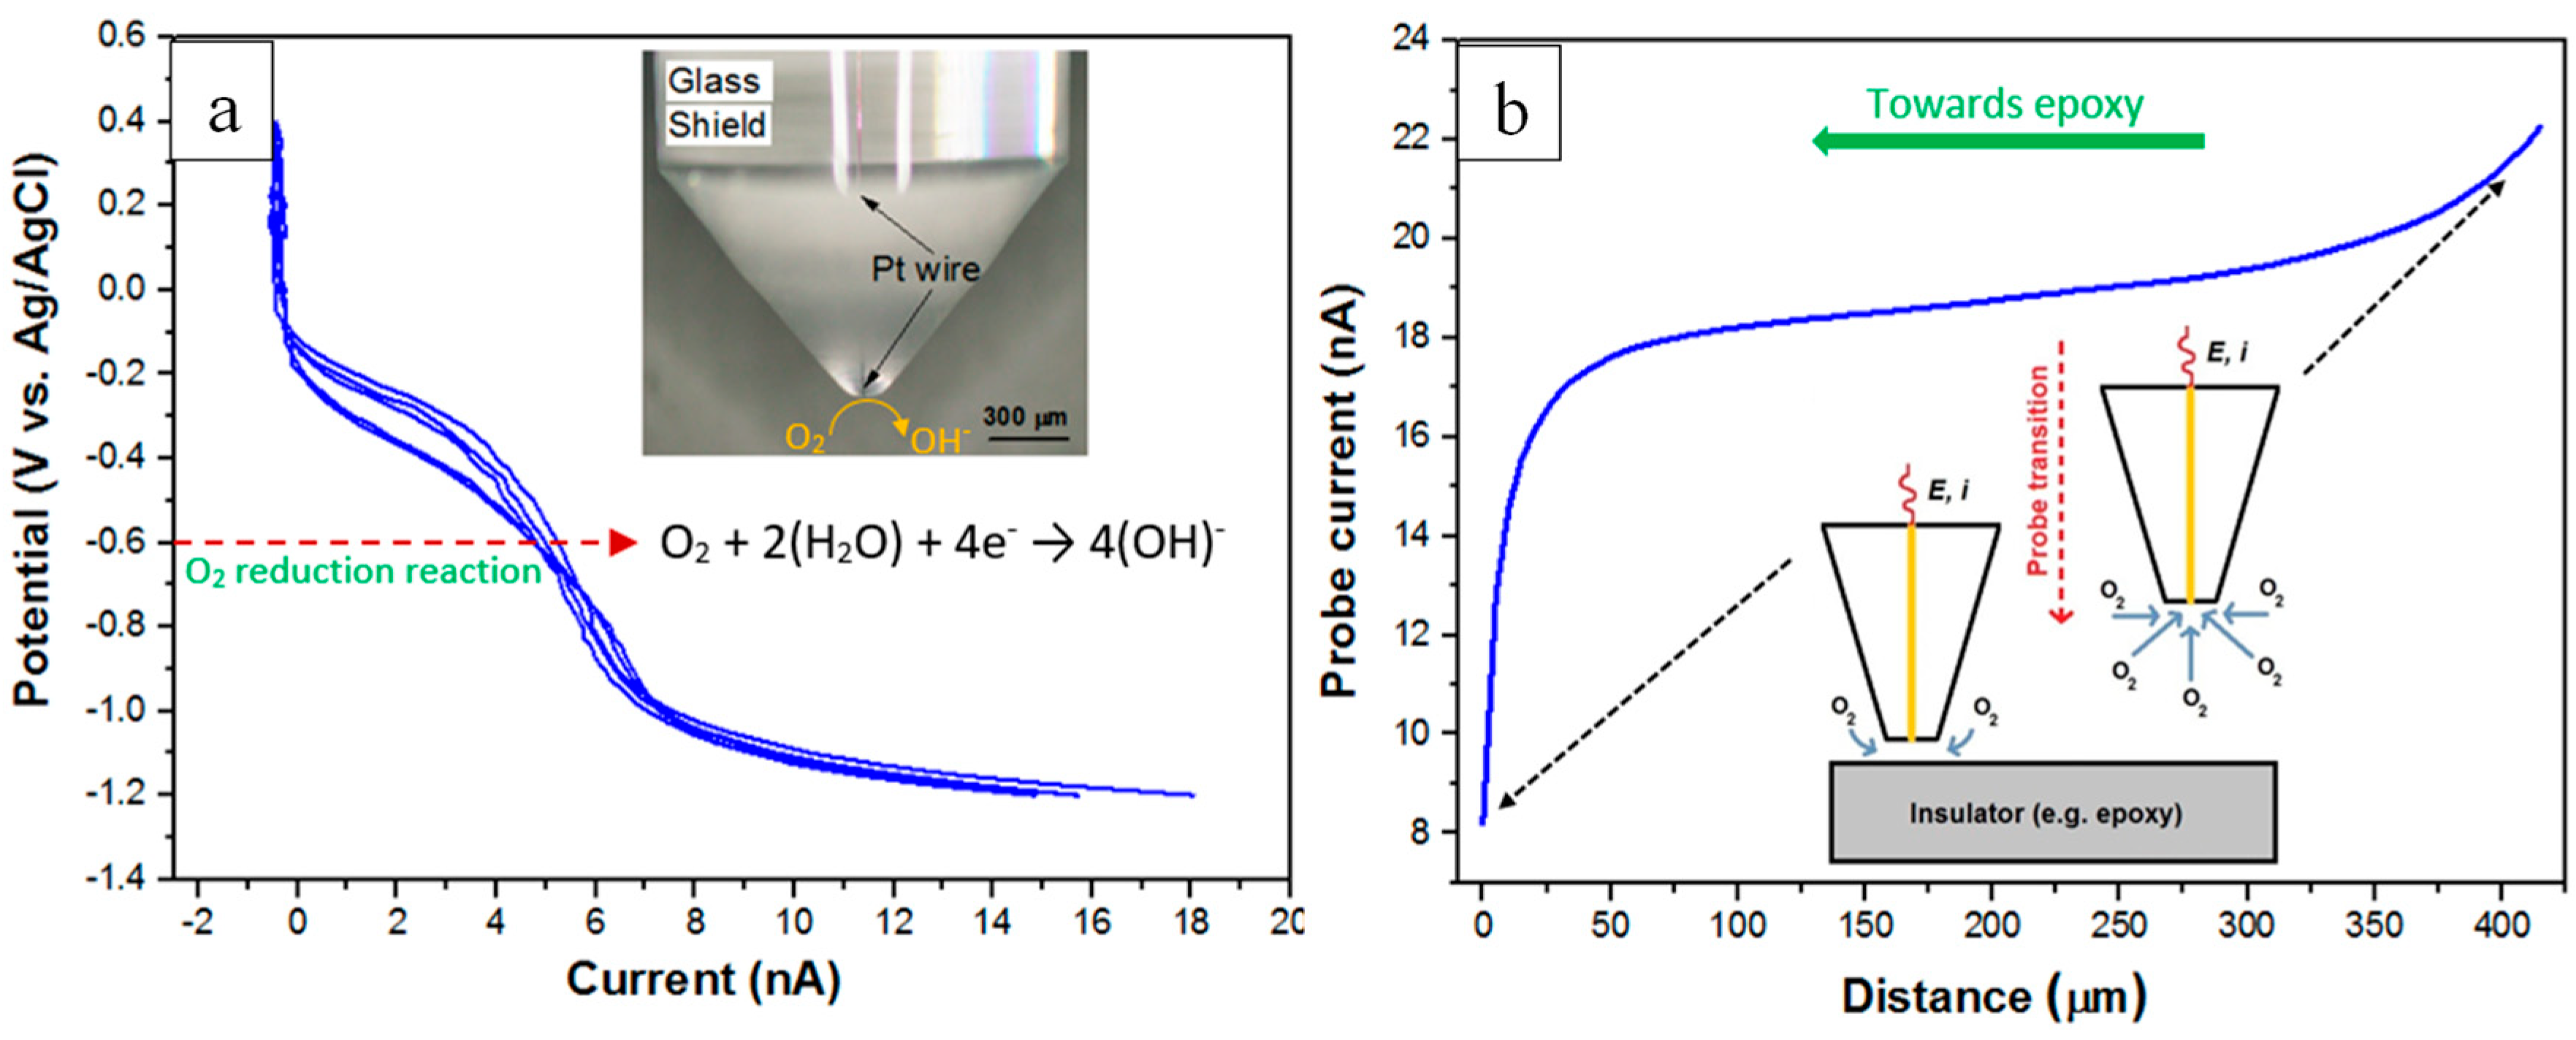

| Inhibitor type | Solution | Immersion time | Inhibitor concentration | Ecorr (mV) | icorr (µA/cm2) | Inhibition mechanism | Ref. |
|---|---|---|---|---|---|---|---|
| Ce(MAcet)3 | Open to air 0.1 M NaCl, pH=6 | 24 h | 10-4 M | -501, SEC | 400 | Mixed anodic/cathodic inhibition | [31,32,33] |
| Pr(MAcet)3 | Open to air 0.1 M NaCl, pH=6 | 24 h | 10-4 M | -686, SCE | 50 | Mixed anodic/cathodic inhibition | [31,32,33,34] |
| Ce: melamine | Open to air 3.5%NaCl | pdp | 5ppm each | 615-629 | 0.5-5.2 | Mixed anodic/cathodic inhibition/Ce-precipitate | [35] |
| Ce(dbp)3 | Quiescent 0.05 M NaCl | 24 h | 10-4 M | -700, Ag/AgCl | N/A | Ce oxide formation on Cu-rich areas and dbp precipitation on the overall surface | [27] |
| Ce(cin)3 | 0.05 M NaCl | 24 h | 0.86 M | -800, SCE | 0.2 | Initially anodic and then cathodic inhibition by cinnamate and Ce-oxide/hydroxide formation | [36] |
| Ce(dbp)3 | 0.1M NaCl, pH=9 | 30 mins | 10-4 M | -610, SCE | 0.2 | Inhibition by Ce hydroxide | [37] |
| Ce(dpp)3 | 0.1 M NaCl | 30 mins | 2x 10⁻⁴ M | −580, SCE | 0.08 | Predominant cathodic inhibition | [28] |
| Pr(dpp)3 | 0.1 M NaCl | 30 mins | 2x 10⁻⁴ M | −583, SCE | 0.1 | Formation of high-pH stable products | [28] |
| Ce(dpp)3 | 0.1 M NaCl | 30 mins | 2x 10⁻⁴ M | -651, SCE | 0.8 | Cathodic inhibition of cathodic particles | [14] |
| Ce(dpp)3 | 0.1 M NaCl | 1 h | 200 ppm | -440, SCE | 1 | Mixed inhibition by sub-micron (bimetallic) oxide/hydroxide formation | [38] |
| Ce:Benzotriazole | 0;05M NaCl | ≤ 14 d | Up to 10 mM | EIS | EIS | No PDP to assess performance | [39] |
| (NH4)2Ce(NO3)5Ce2(SO4)3 | 0.01 M NaCl | Up to 600h | 10-5 to 10-2 M | -0.6 – 0.9 v SSC | 10 – 0.1 | Mixed with time and concentration | [40] |
| (NH4)2Ce(NO3)5 (NH4)2Ce(NO3)6. | 3.5% NaCl | 10-5 to 10-2 M | -0.68 – 0.98 v SSC | 1 – 0.1 | Largely cathodic inhibtion at lower concentration | [41,42] |
| Time After Inhibitor Addition | 60 mins | 70 mins | 100 mins | 130 mins | 160 mins | 190 mins | 220 mins |
|---|---|---|---|---|---|---|---|
| Efficiency (%) | 0 ppm | 50 ppm | 50 ppm | 100 ppm | 100 ppm | 200 ppm | 200 ppm |
| ηa | 0 | -5.5 | -24.5 | -83.5 | 6.5 | 7.4 | 51.8 |
| ηc | 0 | -36.7 | -35.5 | -64.8 | -33.9 | 25.8 | 49.0 |
| Technique | Pits | Rings | Plumes | Domes | ||
|---|---|---|---|---|---|---|
| WBE | 2.56 (100 ppm) | 6.24 (50 ppm) | Yes | Yes | Yes | Yes |
| SVET | 1.10 (200 ppm) | 1.05 (200 ppm) | Yes | Yes | No | Yes |
| SECM | -------------------------------- | -------------------------------- | Yes | No | Yes | No |
Disclaimer/Publisher’s Note: The statements, opinions and data contained in all publications are solely those of the individual author(s) and contributor(s) and not of MDPI and/or the editor(s). MDPI and/or the editor(s) disclaim responsibility for any injury to people or property resulting from any ideas, methods, instructions or products referred to in the content. |
© 2023 by the authors. Licensee MDPI, Basel, Switzerland. This article is an open access article distributed under the terms and conditions of the Creative Commons Attribution (CC BY) license (https://creativecommons.org/licenses/by/4.0/).


