Preprint
Article

Lateral Ultimate Capacity of Monopile Foundations for Offshore Wind Turbines: Effects of Monopile Geometry and Soil Stiffness Properties

Altmetrics

Downloads

181

Views

54

Comments

0

A peer-reviewed article of this preprint also exists.

Submitted:

27 August 2023

Posted:

29 August 2023

You are already at the latest version

Alerts
Abstract
Offshore Wind Turbines (OWT) with increasingly higher energy output are being developed to meet energy demand, posing challenges for their foundation design. Several foundation types are used to support these turbines with monopiles (MP) accounting for 80% of the installed capacity. In this study, three-dimensional (3D) nonlinear finite element models (FEM) were employed to investigate the behaviour of monopile foundation supporting a 5MW wind turbine when subjected to lateral loading. Results indicate that the MP behavior depending on the pile length to diameter (L/D) ratio and the soil shear strength. Inspection of bending moment profiles at the lateral ultimate capacity indicated the monopiles can behave in flexible manner even with low L/D ratio. The L/D ratio affected the MP normalized lateral ultimate capacity at varying degrees and the biggest effect was for soft clays, amounting to around 5 folds increase for L/D values of 3.33 to 13.33. Lesser effects were found for stiff clays.
Keywords: 
Subject: Engineering  -   Civil Engineering

1. Introduction

Sustainable energy sources such as wind, hydro and solar are critical and under utilized. Global warming and increasing CO2 in the atmosphere and the fears of increasing frequency and severity of natural disasters such as extreme weather, flooding and tsunamis have driven government bodies, research institutes and the industry to move at a higher pace towards cultivating more energy from these sources in a bid to reduce dependency on fossil fuels. Specifically, exponential growth of wind energy has been achieved from onshore and offshore wind farms (OWF) with offshore wind turbines (OWTs) reaching a capacity of 14MW already available on the market (Alsharedah et al., 2023). Figure 1 shows the energy output from offshore wind farms in Europe between 2000-2016. This increase in capacity is realized by using heavier and taller turbines, often leading to very large foundation systems which can consume up to 40% of the total cost (Alsharedah et al., 2022; Prendergast and Igoe, 2022).
Different foundation systems are employed to support wind turbines such as fixed gravity base foundations (GBF), tripod structures, jackets, suction caissons, monopiles (MP), and buoyant fixed structures (Abdelkader, 2016; Poulos, 2016; El-Marassi, 2011; Byrne and Houlsby, 2003). Figure 2 presents some of the foundation systems used to support OWT. The foundation design process is iterative in nature and begins with estimate of the lateral applied loads from wind, waves and currents in addition to aerodynamic forces. Since the geometry of the foundation is unknown, it is usually assumed, and the foundation response is evaluated. If the assumed foundation geometry is insufficient to meet the ultimate limit state or serviceability limit state, a new geometry is assumed. This loop repeats itself until a suitable foundation geometry is found (Alsharedah, 2022).
Strong records of performance of monopiles from other offshore structures, such as oil platforms, helped engineers with the design of early developments of OWFs. For these piles, the design is based on the famous p-y approach (Byrne et al., 2015, Wang et al., 2017; Biosi and Halder, 2014; Jeanjean, 2009). In this approach, the soil layers are replaced by independent springs each having a different load-displacement curve, called the p-y curve. This approach was firstly proposed by McClelland and Focht (1955) and validated by Matlock (1970) for the case of slender pile in soft soil and then by Reese (1975) who proposed p-y formulae for stiff soil. However, a few issues are raised when applying this method to offshore wind turbines. Firstly, the p-y approach was validated by Matlock (1970) by testing slender piles in soft soil with a diameter of 0.32m and a length of 12.8m, giving L/D ratio of 39.5; however, a typical offshore wind turbine has an order of magnitude larger diameters monopiles with lower L/D ratios. Numerous researchers pointed out that diameter effects were not included in the original method (e.g., Lai et al., 2020; Zhu et al., 2017, Byrne et al, 2015a; Byrne et al., 2015b; Lau, 2015). Other deficiencies arise from the fact that the tested pile has only experienced 20 cycles of loading whereas expected cycles of loads the OWT experiences in its lifetime can be of the order of 107. Thirdly, the ratio of vertical loads to lateral loads in the oil platforms is much higher than the wind turbines, making direct application of API recommendations for monopile design questionable. Finally, the effect of cyclic loading is treated uniformly across pile depth with a reduction factor A of 0.9 irrespective of load level (Haigh, 2014). Improved p-y formulae have since been focused on closing these gaps in literature such as the recent PISA project. The PISA project is an improved version of the p-y approach where additional resistance is added by the side and the base friction (Zhu et al., 2017; Byrne et al., 2015a; Byrne et al, 2015b). For instance, Lau (2015) conducted 9 centrifuge tests on monopiles installed in kaolin clay and subjected to monotonic and cyclic loading. The results demonstrated that the API p-y curves of Matlock (1970) underestimated the stiffness properties of the monopiles, and that the displacement and rotation under cyclic loading depend on number of load cycles and cyclic loads amplitude, which is not accounted for in the API p-y approach. Zhu et al. (2017) conducted field tests on large diameter open ended driven piles in soft clay offshore China. Their tests involved driving 2 monopiles of 2.2 diameter in soft clay and were subjected to both monotonic and low frequency cyclic lateral loading. Their results showed the API p-y curves underestimated both initial stiffness and ultimate capacity, possibly due to reconsolidation from pile driving, which is in line with results from Lau (2015). They proposed a hyperbolic function for p-y curves which provided excellent match to field tests. Additionally, their p-y curves included a degradation factor, t, as a function of depth and cyclic load level. Other methods to obtain the lateral ultimate capacity and deflection at mudline of monopiles include physical testing, FE modelling or Bender’s approach (e.g., Heyer et al (2019) : Gerolymos et al. (2019); Wang et al. (2018); Hong et al. (2017); Abdelkader (2016); Cherchia (2014); Heidari et al. (2014); Klinkvort and Hededal (2014); El-Marassi (2011); Lahane et at. (2010); Powrie and Daly (2007); Murph and Hamilton, 1993; O’Neill et al. (1987); Brown (1978)).
While monopiles lateral behavior has been investigated widely, there is no available easy way to deduce pile capacity. Hence, using a new normalization approach for monopiles for OWTs, the authors are hopeful the new approach can be beneficial and insightful for OWTs monopile design. The results obtained from this study can verify the results from Beam on Nonlinear Winkler Foundation (BNWF) analyses and benchmark new FEM results.

1.1. Methodology

The aim of this research is to establish quick method for estimating monopiles lateral ultimate capacity based on few soil parameters and design inputs. This is done by the study the monopile behavior under eccentric lateral loading similar to that of a 5MW wind turbine in a medium depth water. To do so, several prototype dimensions of MP models were established. A series of finite element models employing displacement-controlled loading were conducted. Models’ responses were evaluated for their bending behavior and lateral ultimate capacity. A new normalization study examines whether the lateral capacity can be described by only the L/D ratio, a combination of L/D and normalized stiffness of monopile. The effects of footing rigidity on the lateral ultimate capacity of monopiles foundation is studied, by changing the ground conditions, and generic curves are established relating the ultimate lateral capacity of the foundation with respect to L/D and the foundation normalized stiffness Ep* given by:
E p * = E p I p I s c p
Ep*: normalized stiffness; Ep: pile Young’s modulus; Es: soil elastic modulus; Ip: pile moment of inertia; Iscp: moment of inertia of a solid cross-section pile of same diameter as actual pile.
Specifically, we investigate the mode of contribution to by normalization procedure of the ultimate capacity of monopiles considering the effects of soil profile and pile/soil relative rigidity given by Ep*/E50, where Ep* is the foundation normalized stiffness and E50 is the soil Youngs modulus at 50% of qf, where qf is the ultimate deviatoric load causing failure of soil specimen in a triaxial apparatus, and by normalizing lateral ultimate capacity by soil shear strength and pile’s diameter. Design charts are established to develop MP lateral ultimate capacity considering L/D and Ep*/Es ratios for the given eccentricity. Finally, predictive equations are proposed to calculate MP lateral ultimate capacity based on best fit data from FE results. The normalization method used paves the way for use of same framework with other eccentricities.
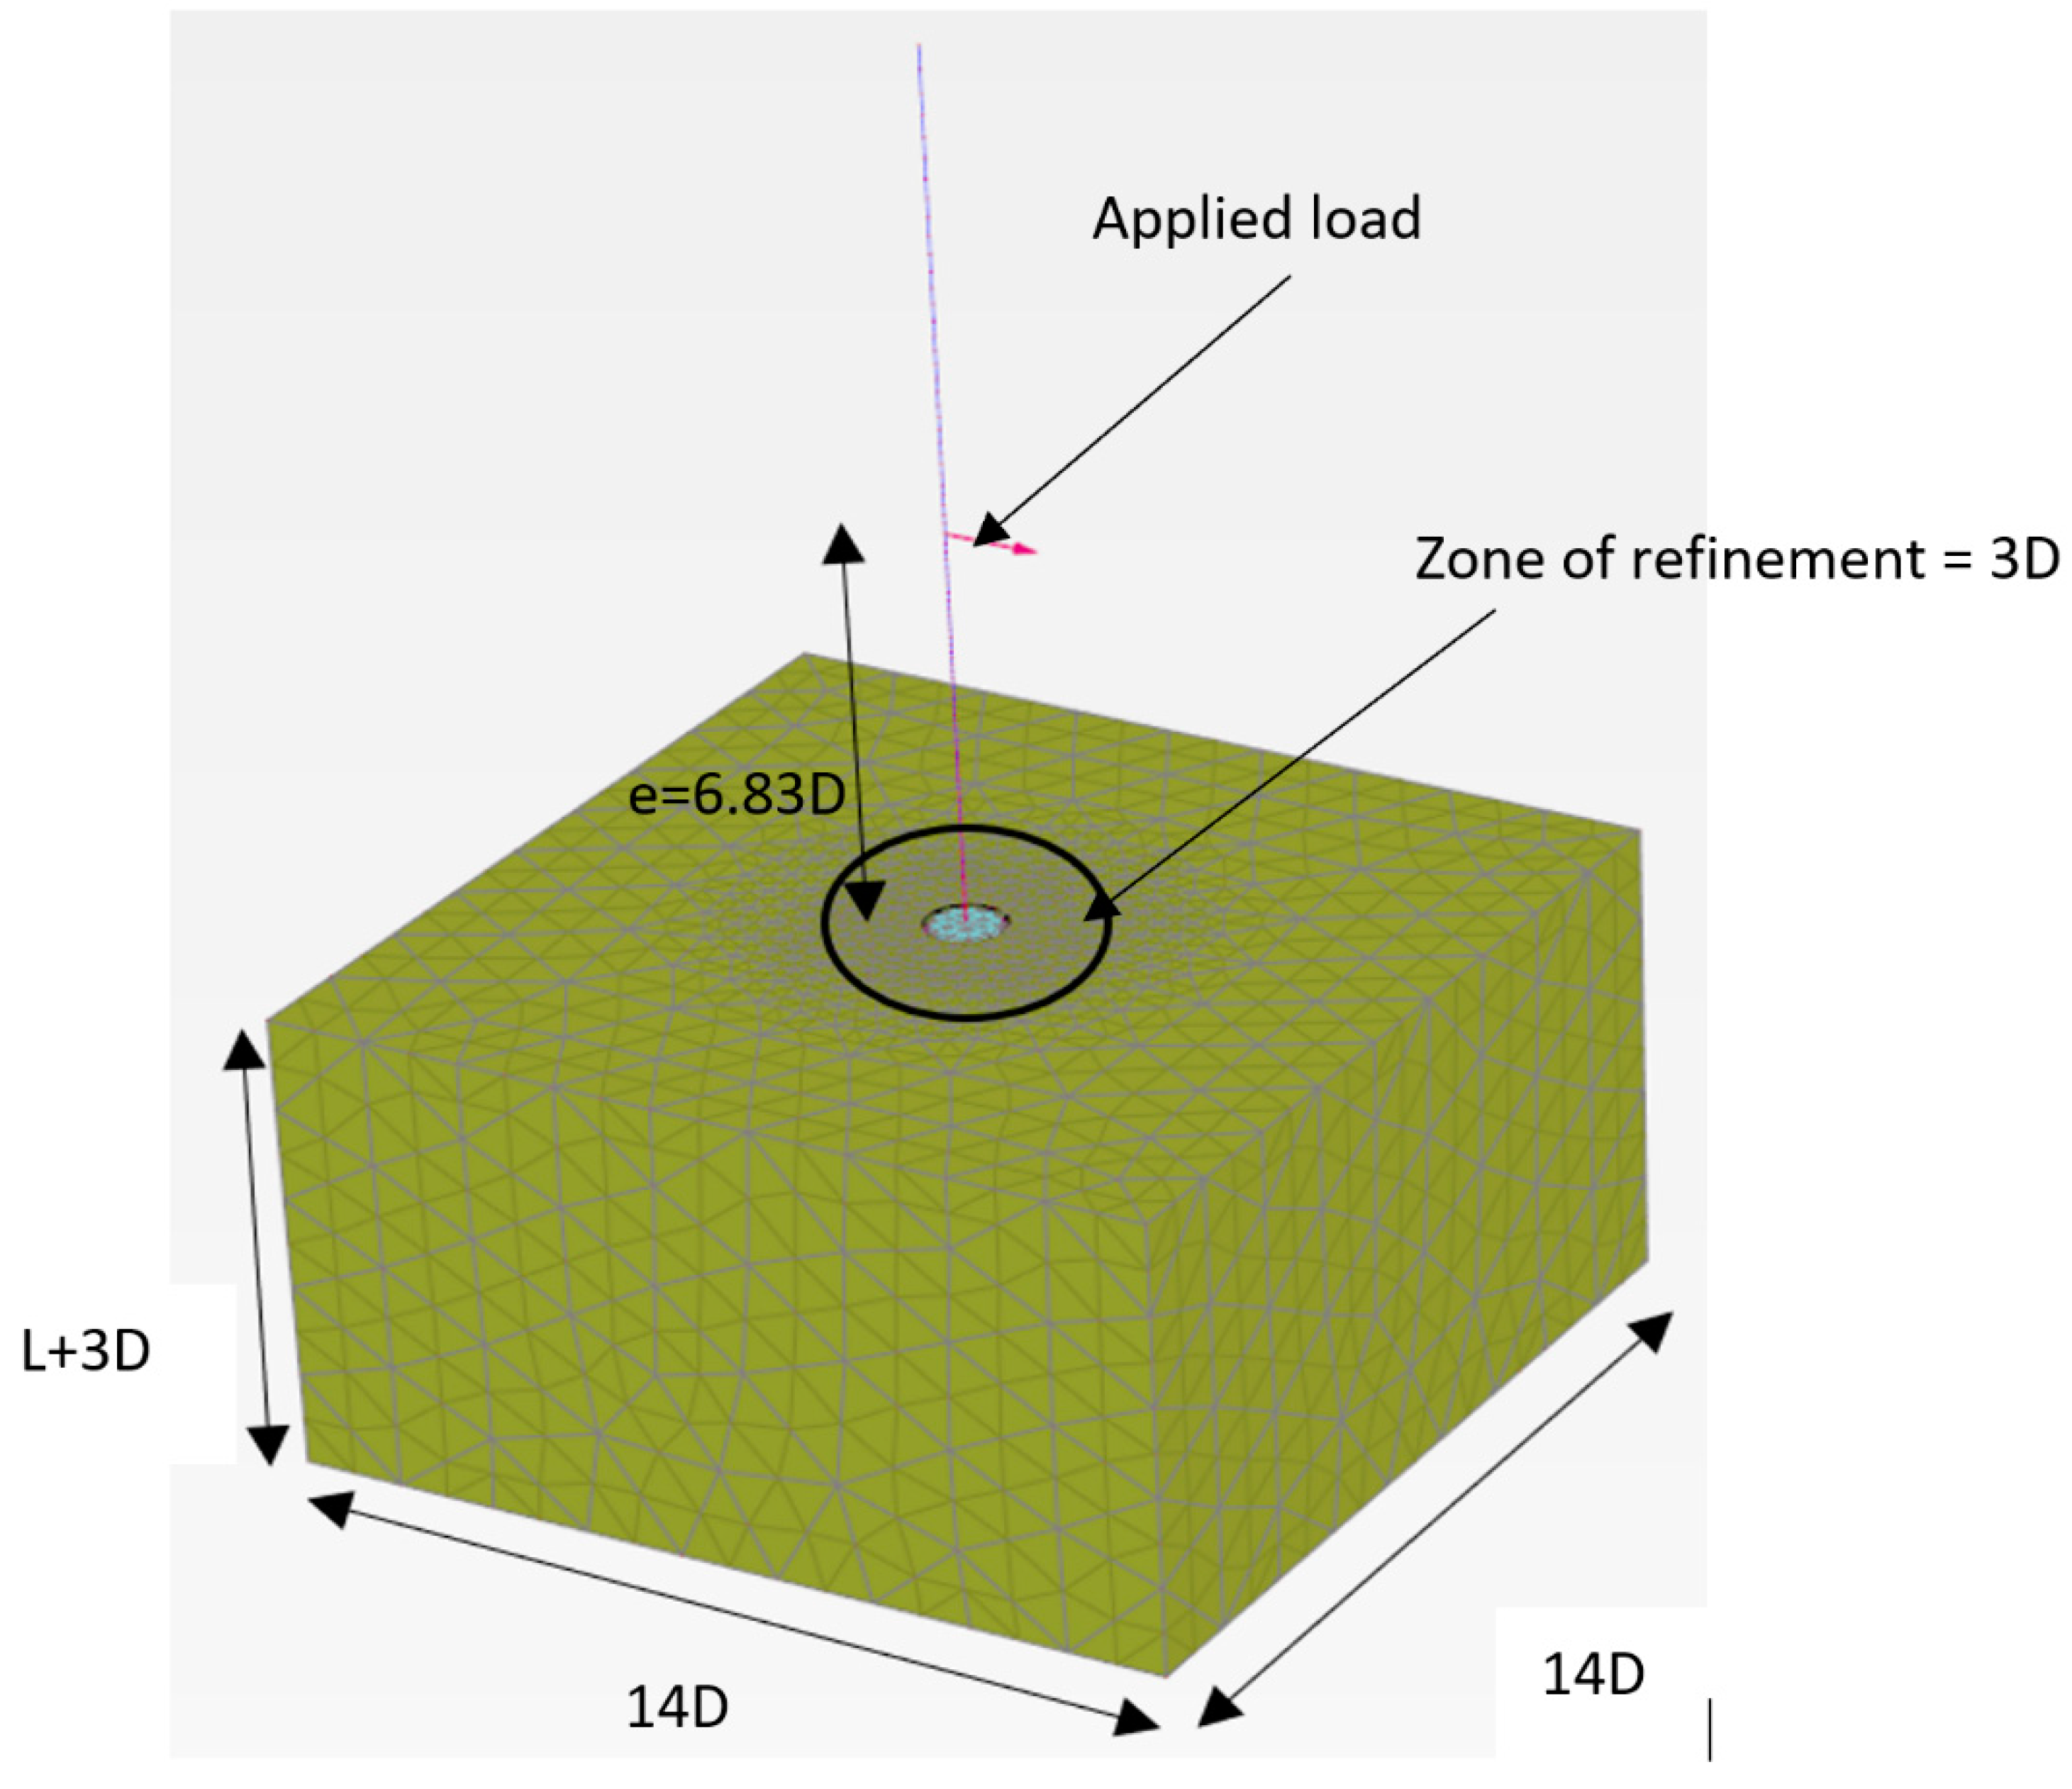
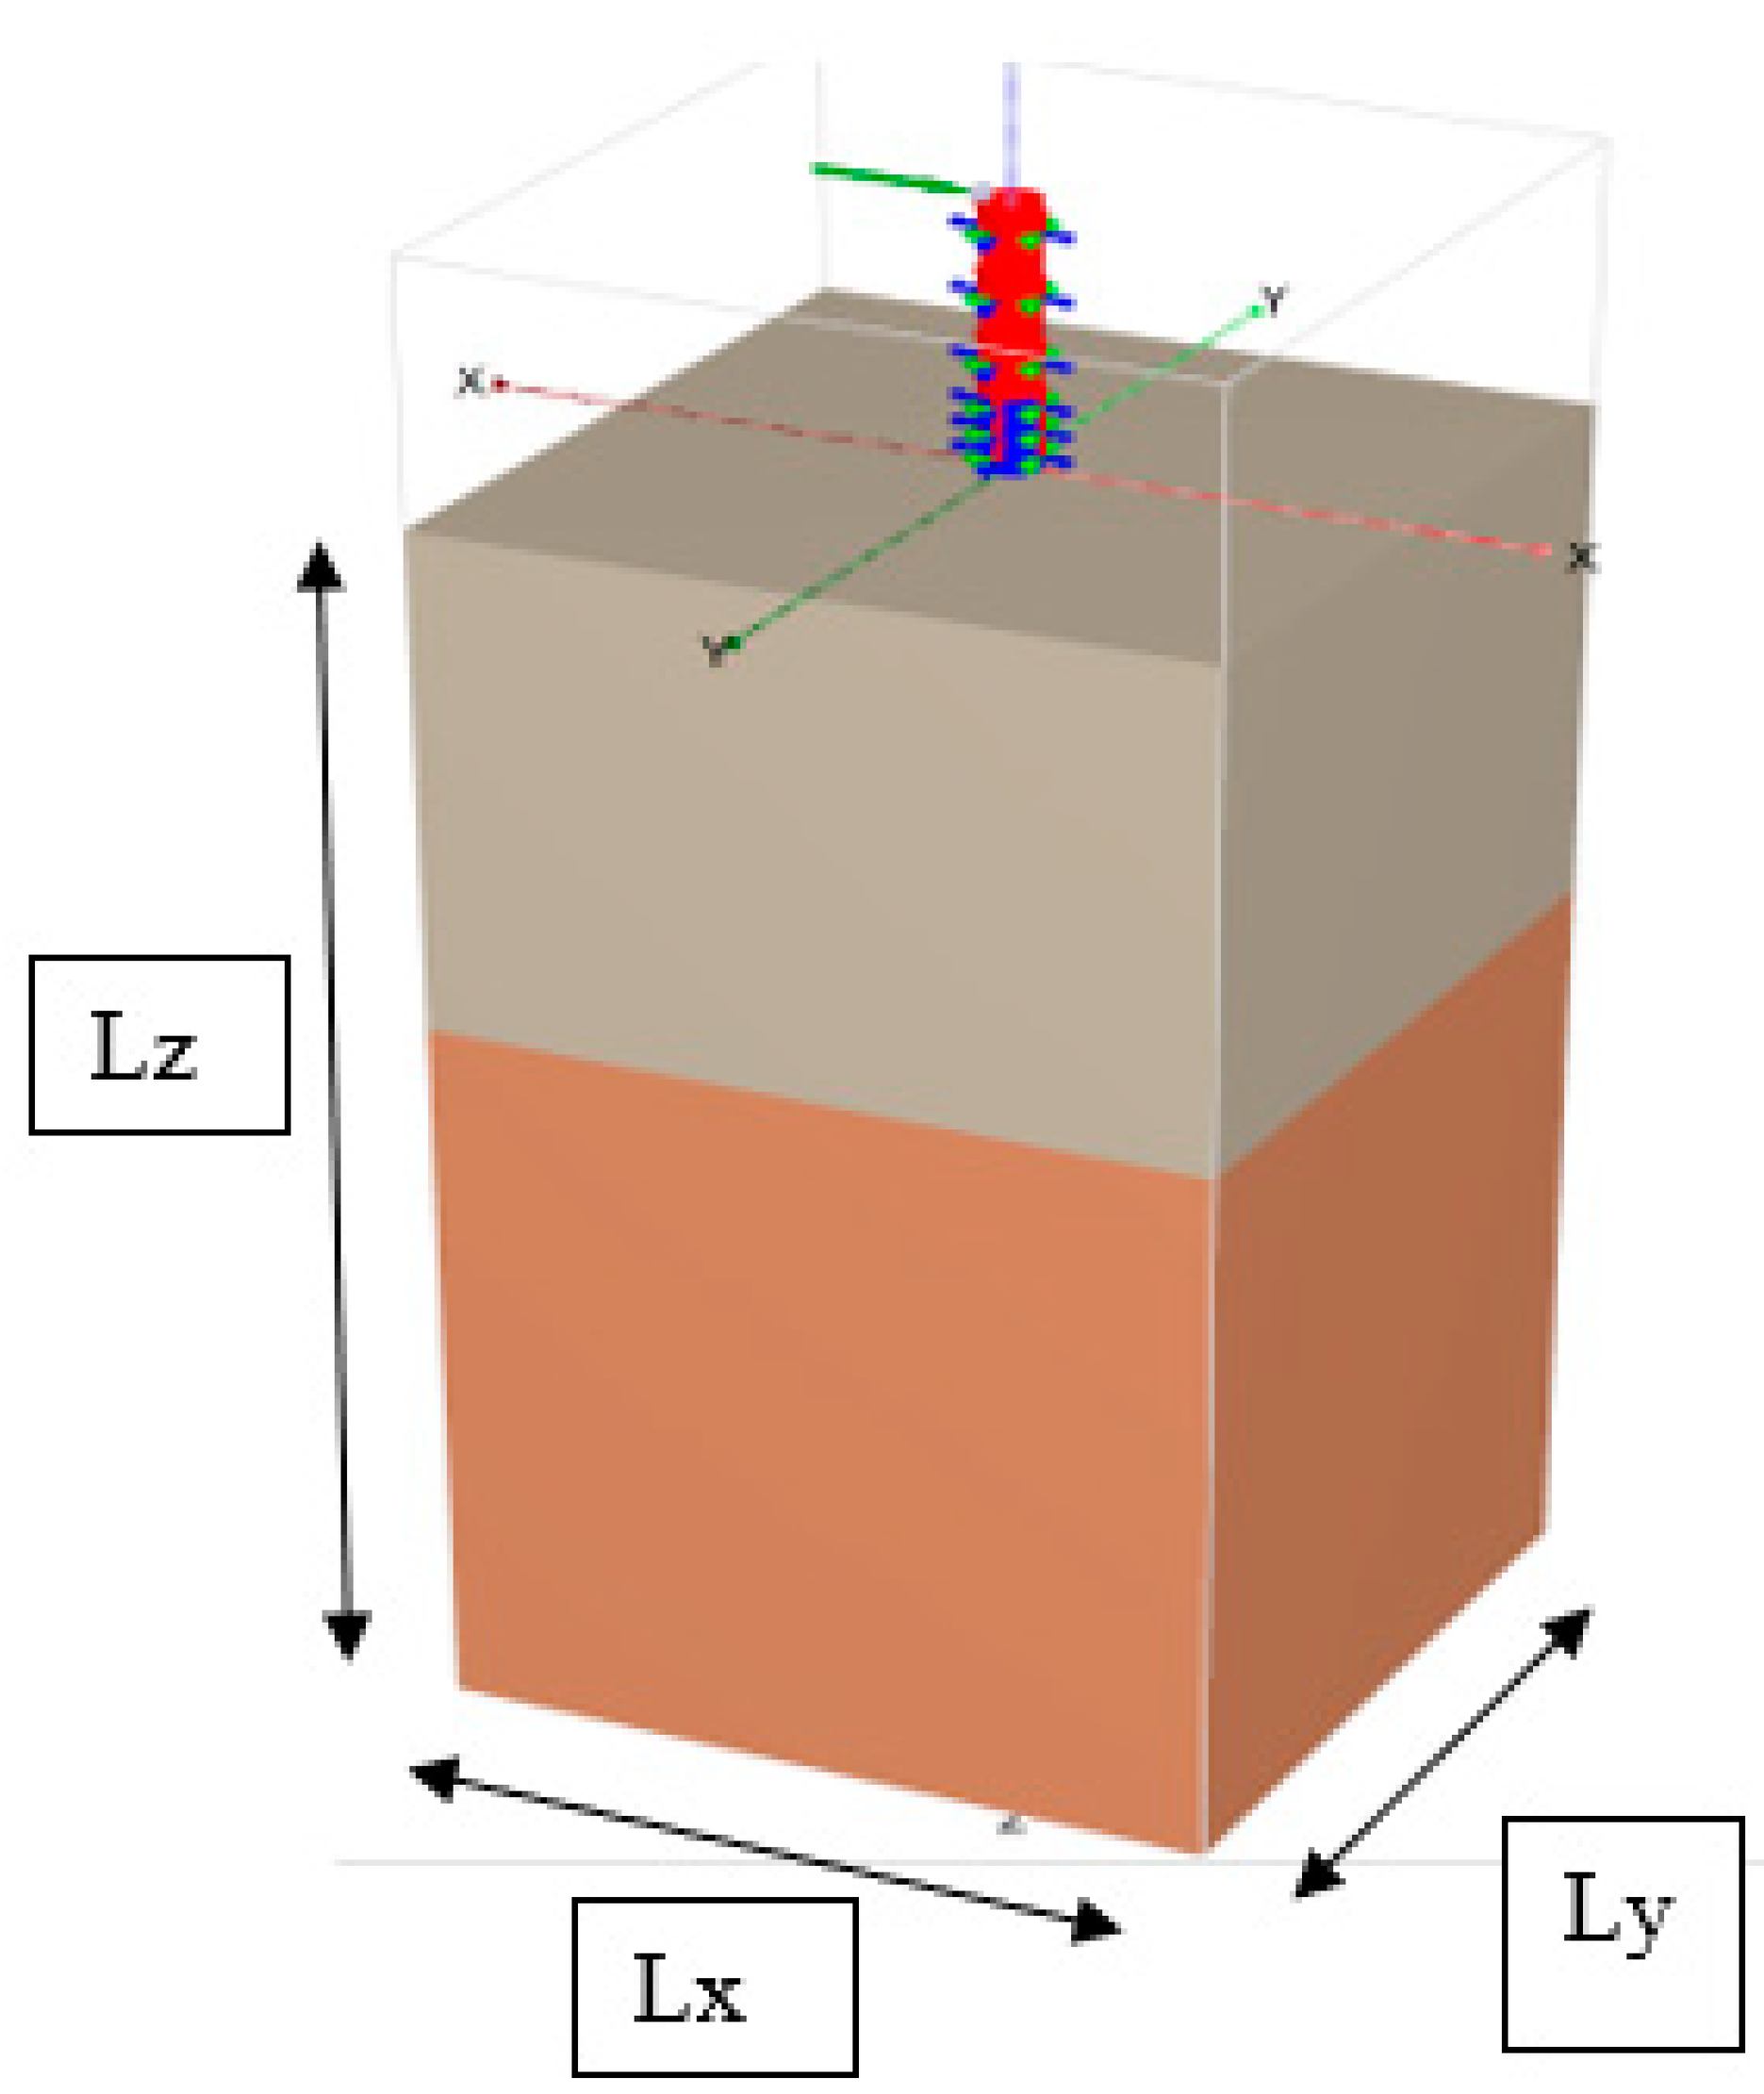
Three-dimensional (3D) finite element models (FEMs) were conducted to simulate the MP foundations. Tetrahedron 10 node elements were used to discretize the soil while plate elements were used to discretize the tower and the pile. The FEM was validated against the results of field tests by Zhu et al. (2017), and the pile was simulated using embedded beam elements confined with solid elements instead of plate elements to enable evaluating the structural forces. To account for slippage and gap formation, 6 node interface elements were used to simulate contact between solids (pile) zone and soil. The strength of the interface elements was defined through a reduction factor, Rint, applied to the soil properties, which varied between 1 and 0.3 for soft and stiff soils, respectively. The tower was simulated as a beam element having unit weight, diameter, E and thickness of 77kN/m3, 6m, 200GPa and 0.035m, respectively. It is rigidly connected to surrounding solid elements to ensure the load is transferred uniformly over the pile area. In all models, x and y boundaries were set at 7D from model center and restricted to move horizontally while allowed to move vertically. The bottom, z, boundary was fixed and placed at least 3D below pile tip to avoid any boundary effects and to model rotational stiffness correctly. The FEM had on average 25000 elements.
The soil behaviour was simulated employing the hardening soil (HS) model obeying Mohr-Coulomb (MC) failure criterion (Schanz 1998). The HS model can simulate the behaviour of both soft and stiff soils. It accounts for the stiffness stress dependency, allows plastic straining due to deviatoric and primary compression loading and can simulate the unloading stiffness being higher than loading stiffness, hence accounting for plastic straining before failure is reached. The clay behavior is accounted for by considering effects of two strain hardening; namely volumetric hardening (cap) and shear where contraction and densification cause the yield surface to expand. The soil stiffness parameters in the HS model can be determined as follows.
E oed = E oed , ref ( C c o s ϕ σ 3 ' k o N C s i n ϕ c c o s ϕ + p r e f ' s i n ϕ ) m
E 50 = E 50 , ref ( C c o s ϕ σ 3 ' s i n ϕ c c o s ϕ + p r e f ' s i n ϕ ) m
E ur = E ur , ref ( C c o s ϕ σ 3 ' s i n ϕ c c o s ϕ + p r e f ' s i n ϕ ) m
The analysis involved four stages, including: Initial stage (initiation of geostatic stresses) in which equilibrium is established based on lateral earth pressure coefficient at rest, ko; Construction stage in which all structures and interface elements are activated; Loading stages: where displacement-controlled loading is applied until failure is reached; and finally, the output stage at which the structural forces and soil deformation are examined to establish the failure load. In the FE model calculations, the lateral ultimate capacity was determined as either the maximum reached load at 3m displacement at tower head or the load causing yield stresses in the structural elements.

1.1.1. Validation

The FEM model was bench marked using a case study of field tests carried out on a 2.2 m diameter open ended pile driven offshore China (Zhu et al., 2017). The pile has a thickness of 0.03m and a depth of 57.4 m below seabed. Soil was characterised by mechanical cone penetrometer (CPT) equipped with soundings for shear wave velocity. Tip resistance was converted to Su values using equation 5.
S u = 0.07 q c + 2
Undrained shear strength profile was checked with the equation by retrieving soil samples and doing CIUC tests and results plot well on the Su profile validating the use of the equation 5. Figure 5 shows the Su profile and OCR with depth while Figure 6 shows ko with depth.
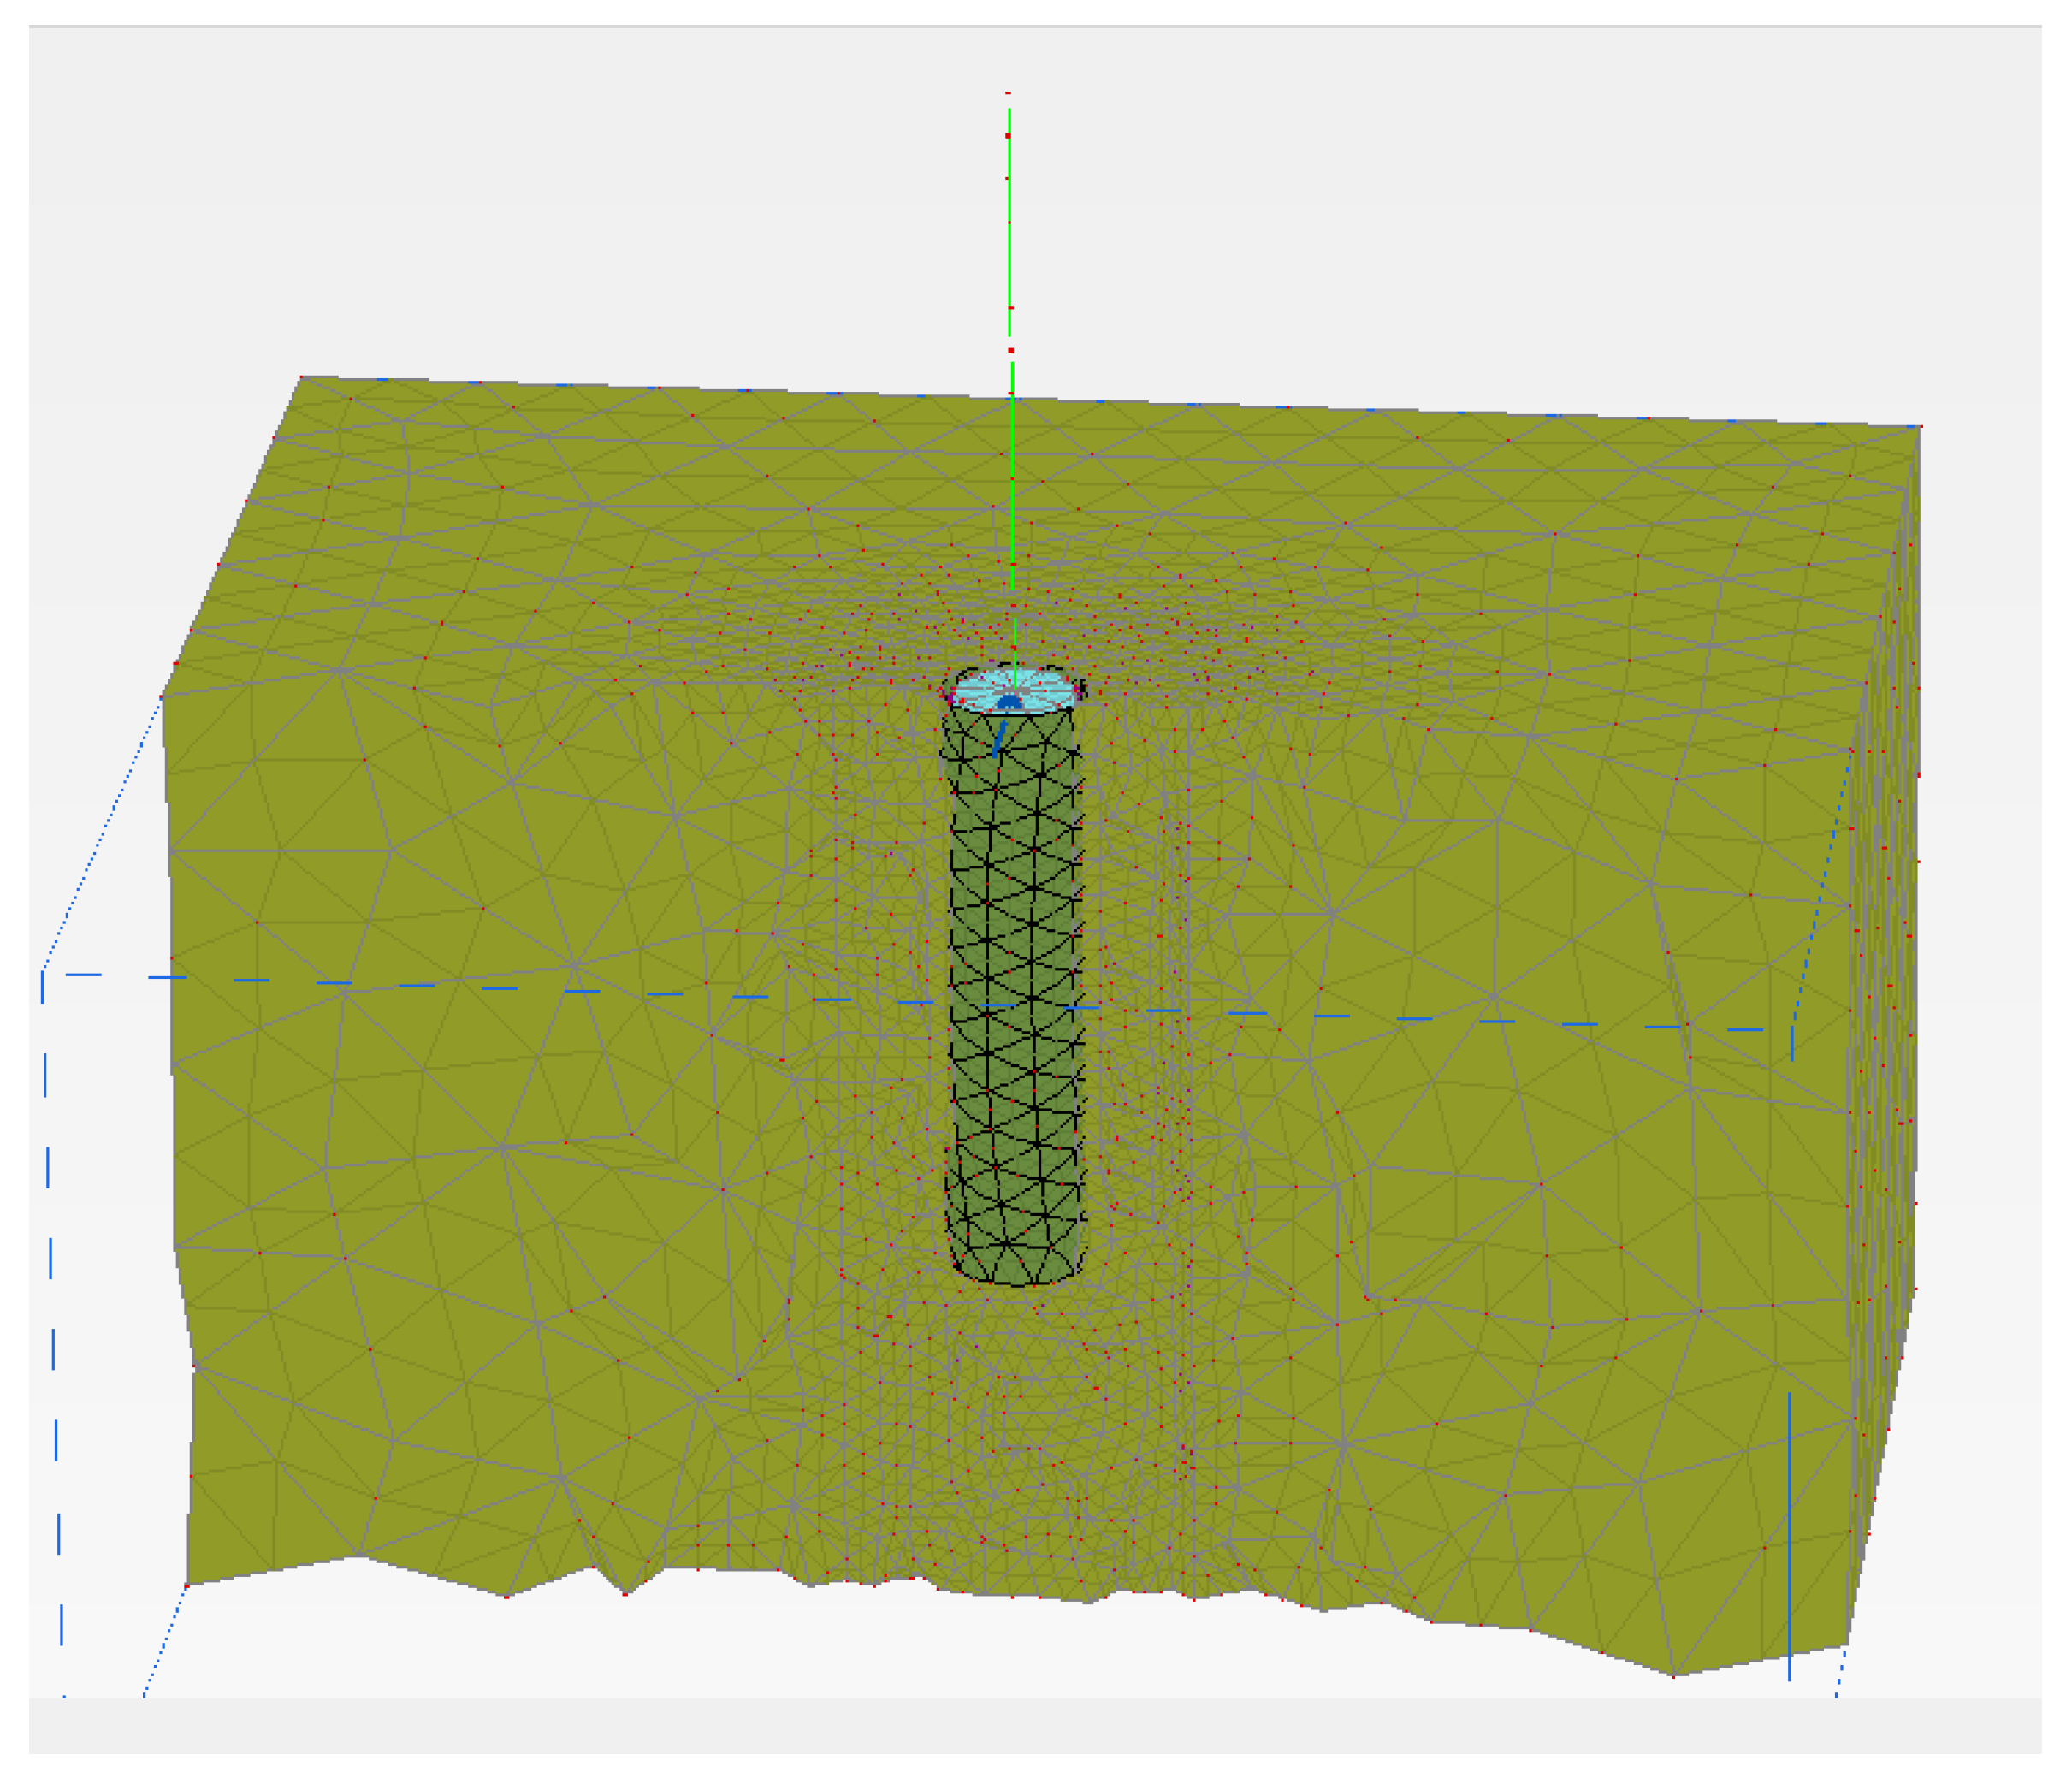
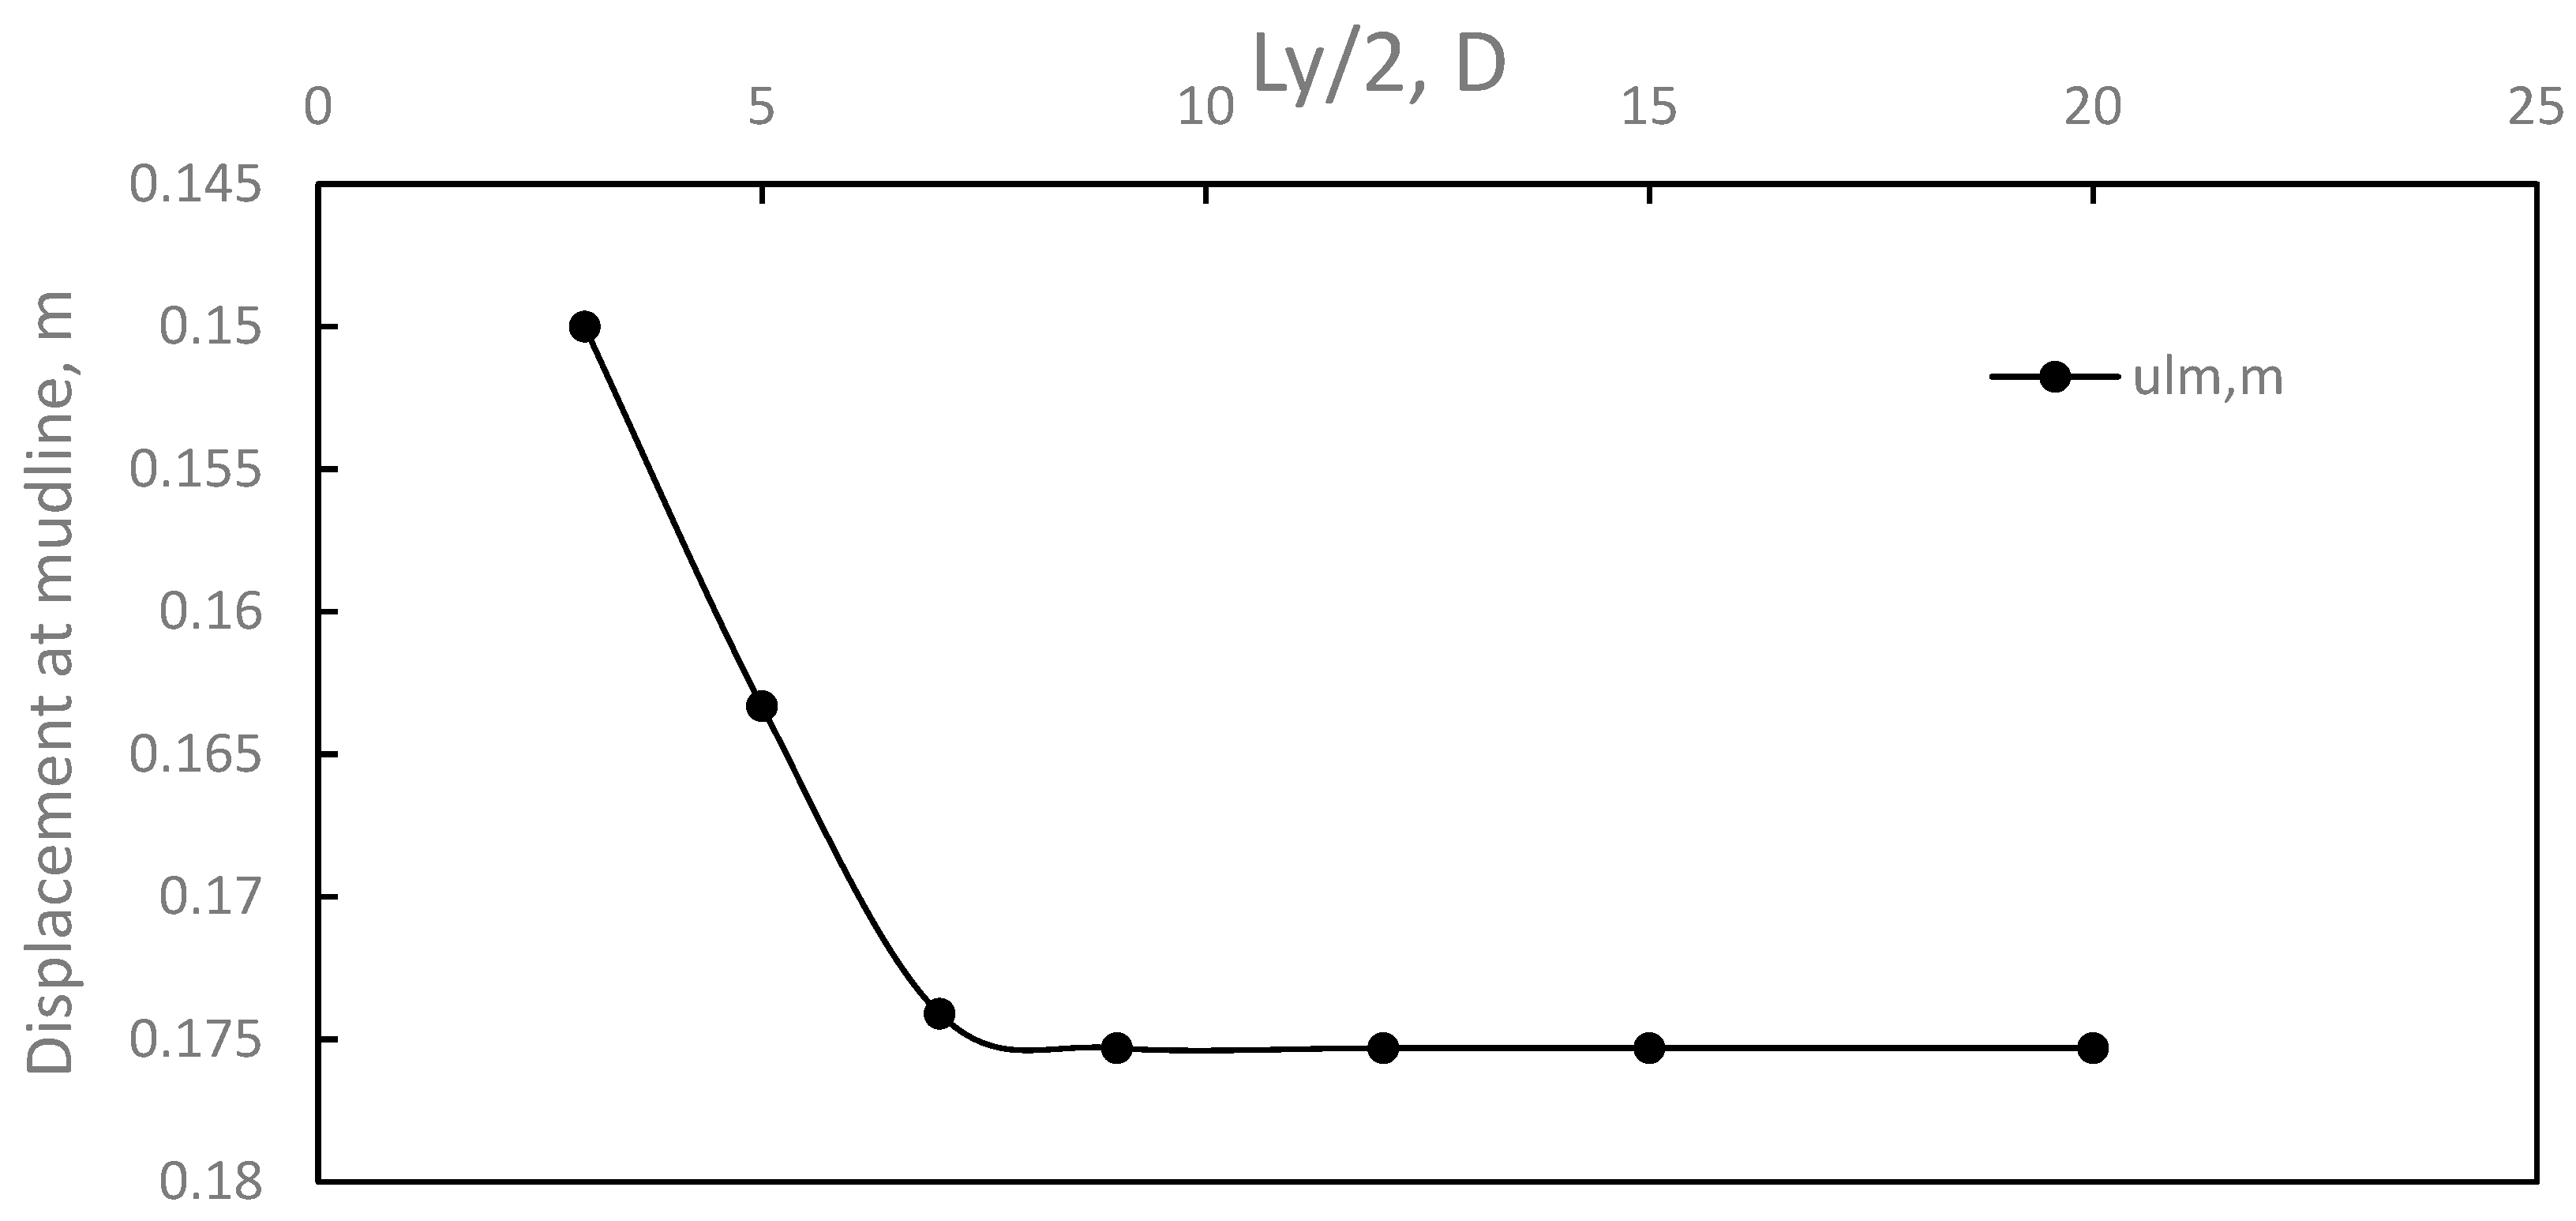
Table 1 presents the soil properties established from the SCPT sounding and the model parameters utilized in the FEM of the filed test. A convergence analysis was conducted to establish proper locations of model boundaries to minimize the effects of the rigid boundary on the stress and strain distributions. The vertical boundaries were paced at 7D from the center of the model and the bottom boundary was placed more than (3D) below the pile tip. The vertical boundaries were restricted horizontally and allowed to move vertically while the bottom boundary was fixed in all directions (i.e., x, y, and z). A medium mesh size was considered after performing the sensitivity analysis, in which the FEM comprised 25000 elements approximately. The mesh was refined within a zone of 3D adjacent to the pile to increase accuracy of results. Figure 3 and Figure 4 show the developed mesh.
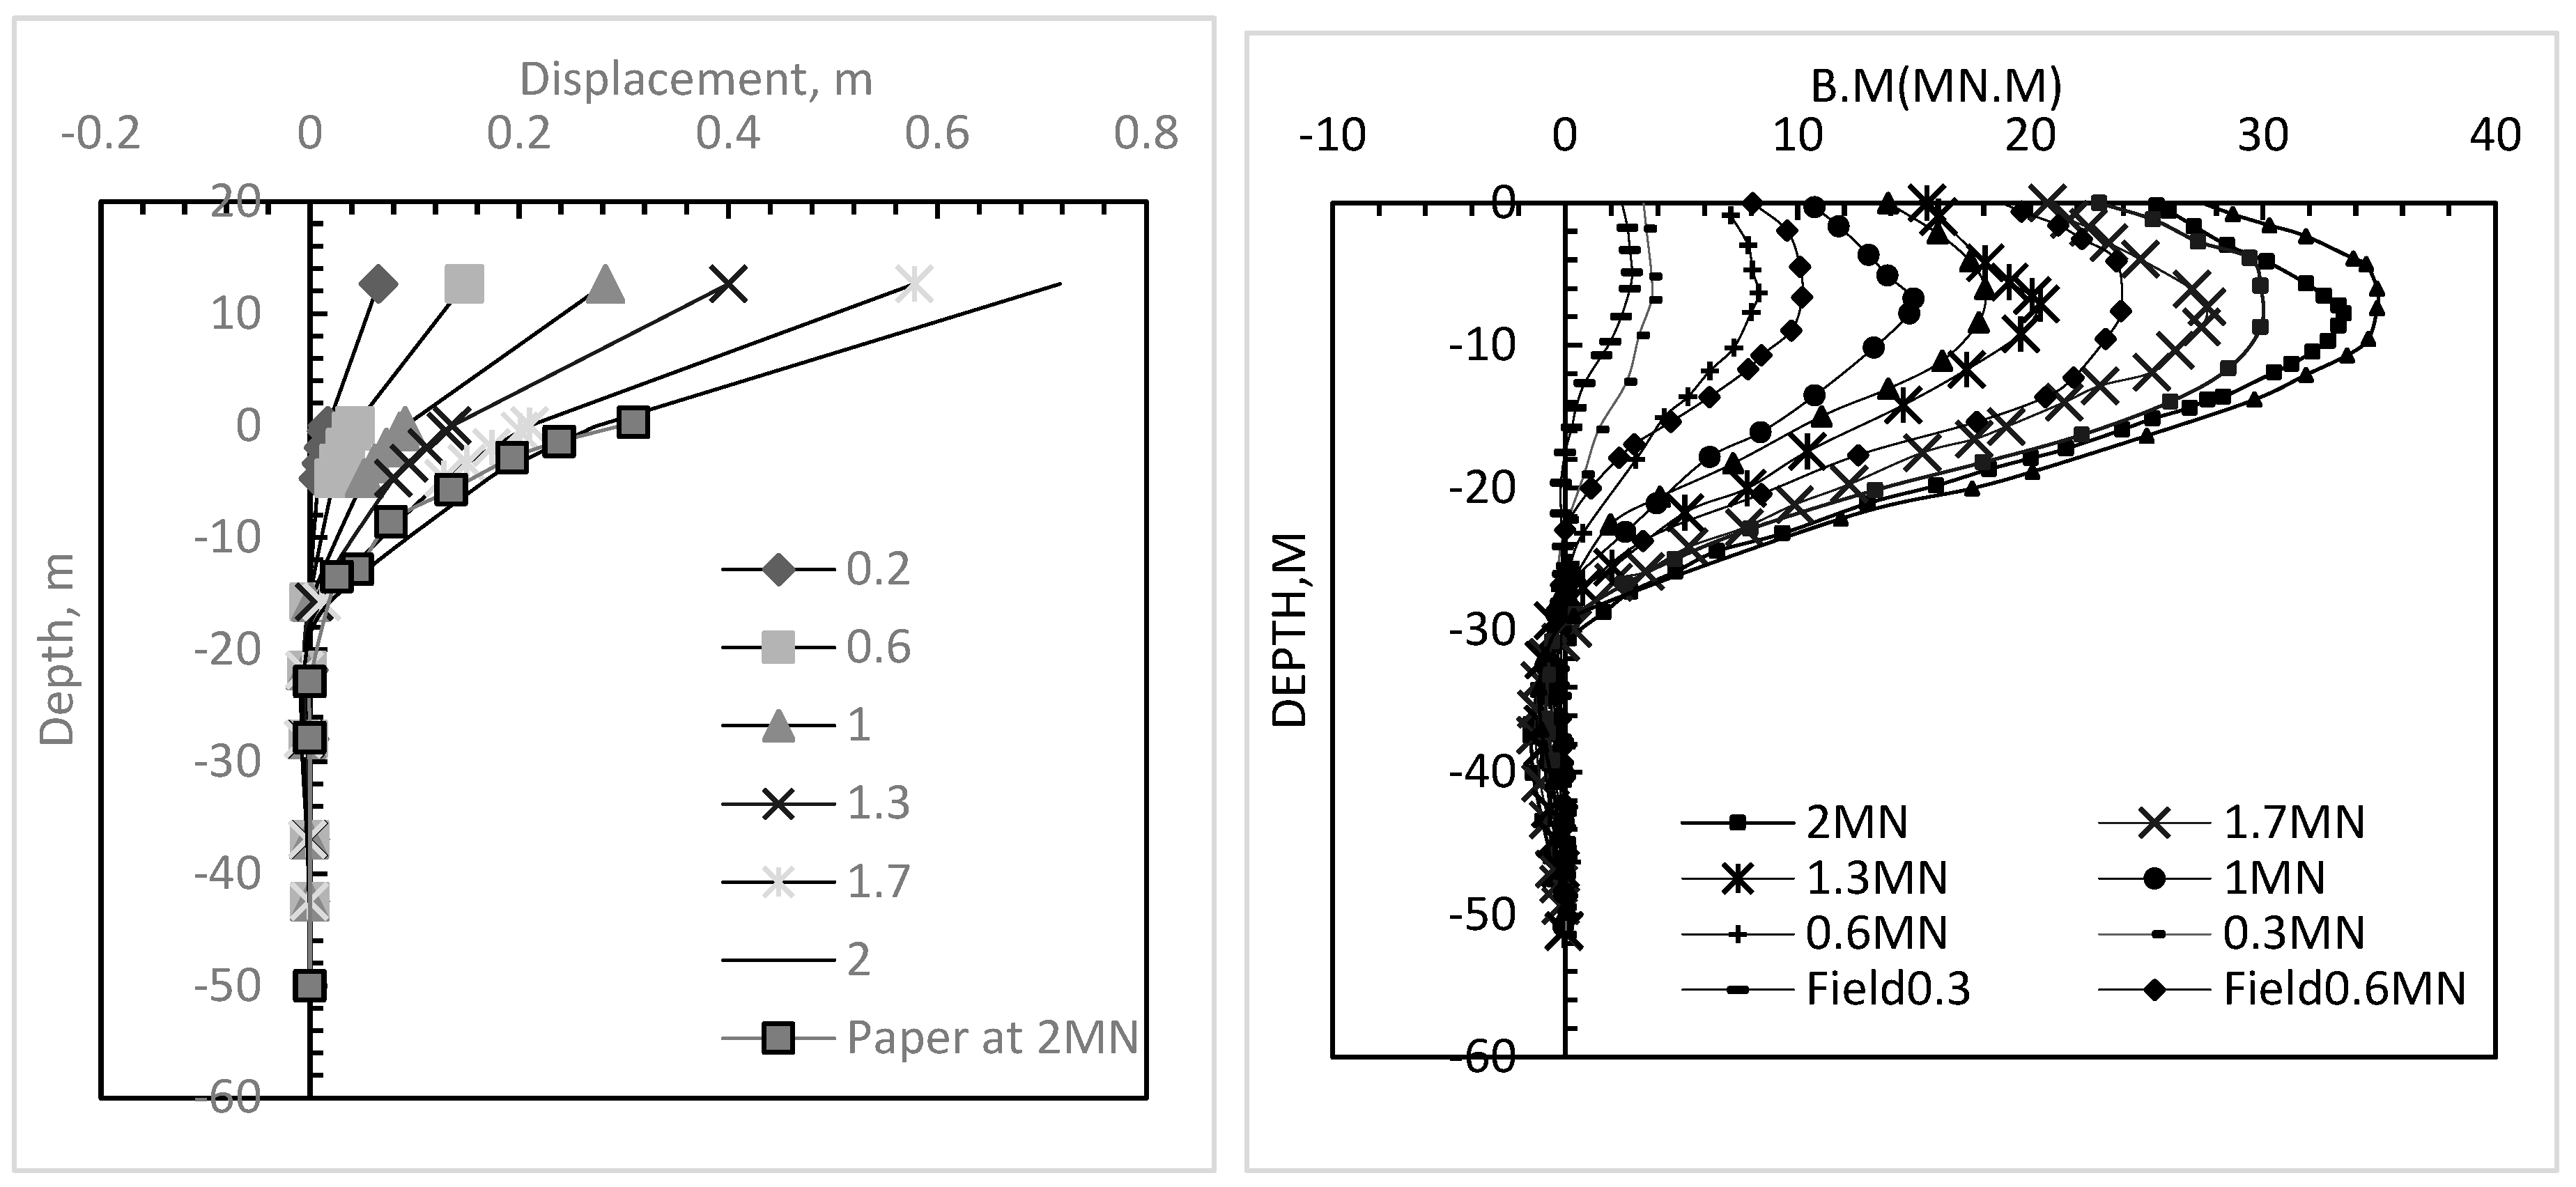
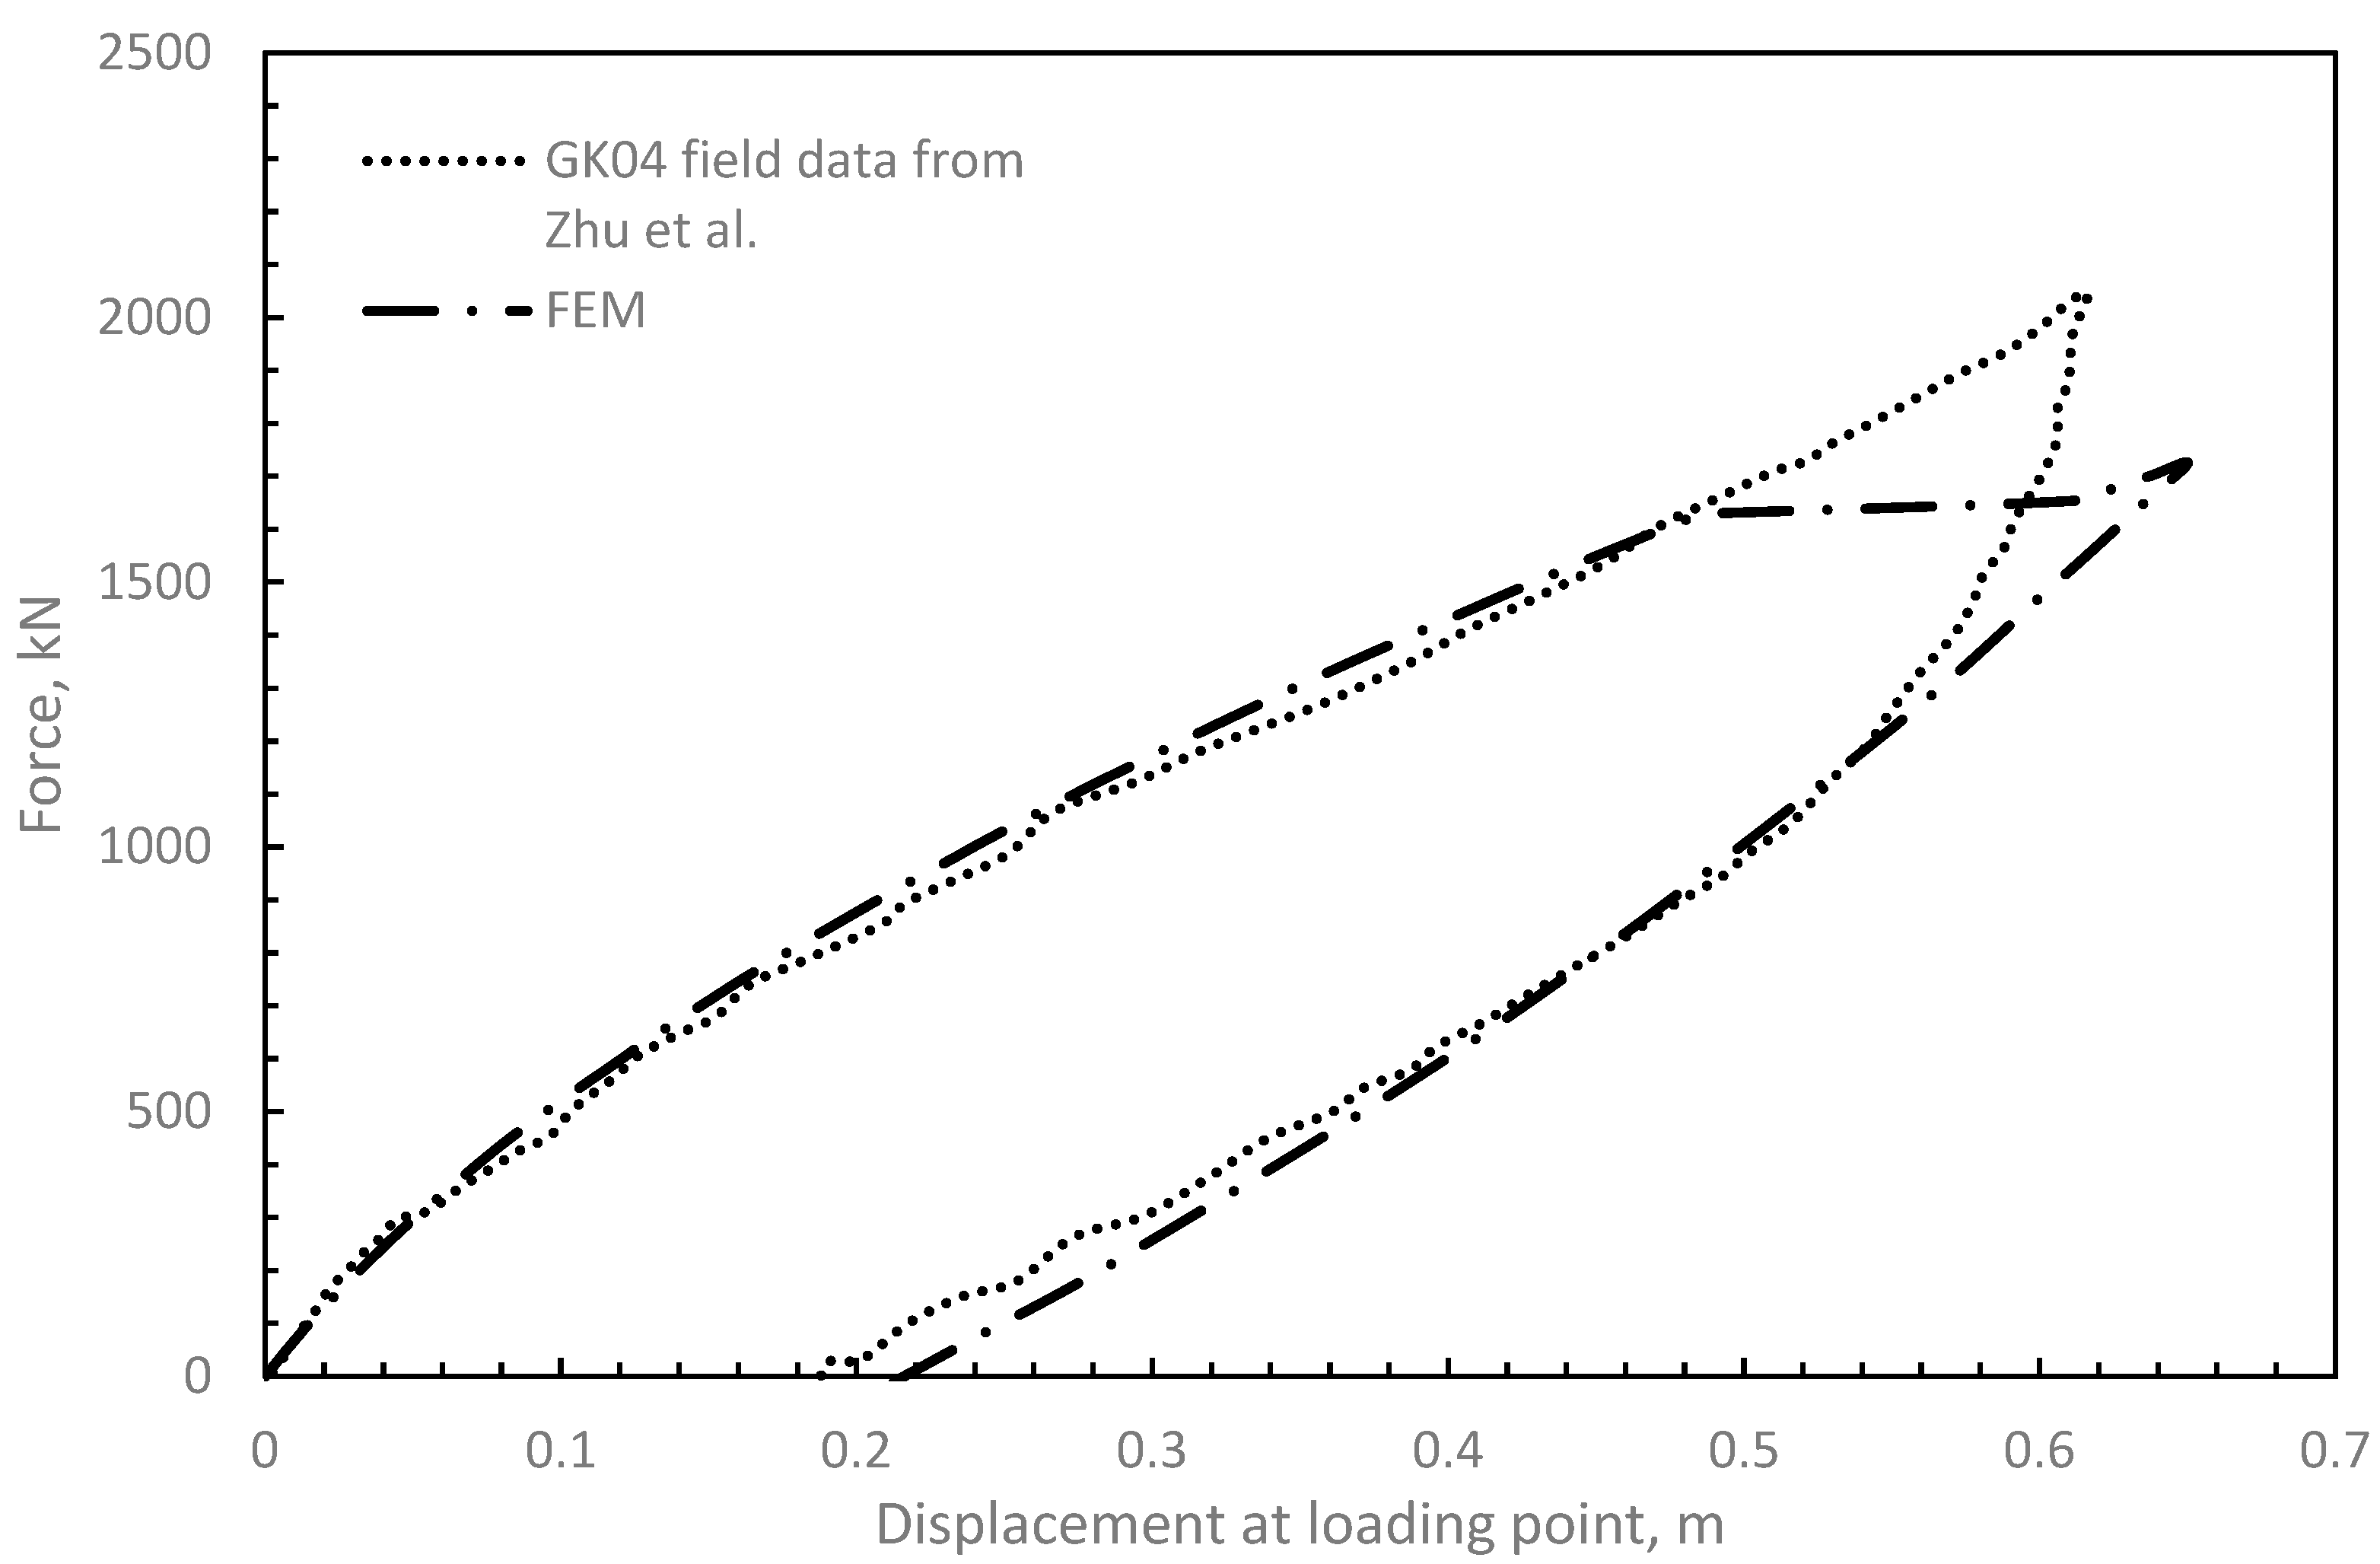
The load-displacement curve obtained from the FE analysis is plotted in Figure 5 along with the field data. Figure 5 demonstrates that there is excellent agreement between the calculated and measured load-displacement curves, validating the ability of the developed finite element model to simulate the behaviour of large diameter piles installed cohesive soil. Bending moment and inclinometer data are also compared and excellent agreement is obtained as shown in Figure 6.
The load-displacement curve obtained from the FE analysis is plotted in Figure 7 along with the tested data. Figure 7 demonstrates that there is excellent agreement between the calculated FEM and measured load-displacement curves from centrifuge testing, validating the ability of the developed finite element model to simulate the behaviour of large diameter piles installed cohesive soil. Bending moments data are also compared across various stages of testing and excellent agreement was obtained as shown in Figure 8.
Figure 6. Displacement and bending moment data (dots) versus FE data (solid line).
Preprints 83394 g006

1.1.2. Convergence study

Once the final set of soil parameters were defined, the convergence analysis was carried out. The purpose of this was to test the FE sensitivity to the model boundary conditions and increase accuracy of results and to define the reference geometry and mesh size that will be followed in the parametric analysis. Figure 7 explains the dimensions studied herein while Figure 8 displays the effects of model dimensions on displacement at mudline. In all analyses considered, the global element size was chosen to be medium, a refinement zone of 3D, 5D, and 7D were conducted with changing coarseness factor, cf. Based on the convergence analyses, the selected boundary conditions are 7D in x,y from pile centerline in all directions with refinement zone of 3D and refinement factor of 0.2 yielding approximately 25000 elements. This range in good agreement with data reported by Lai et al. (2020).

2. Parameter study

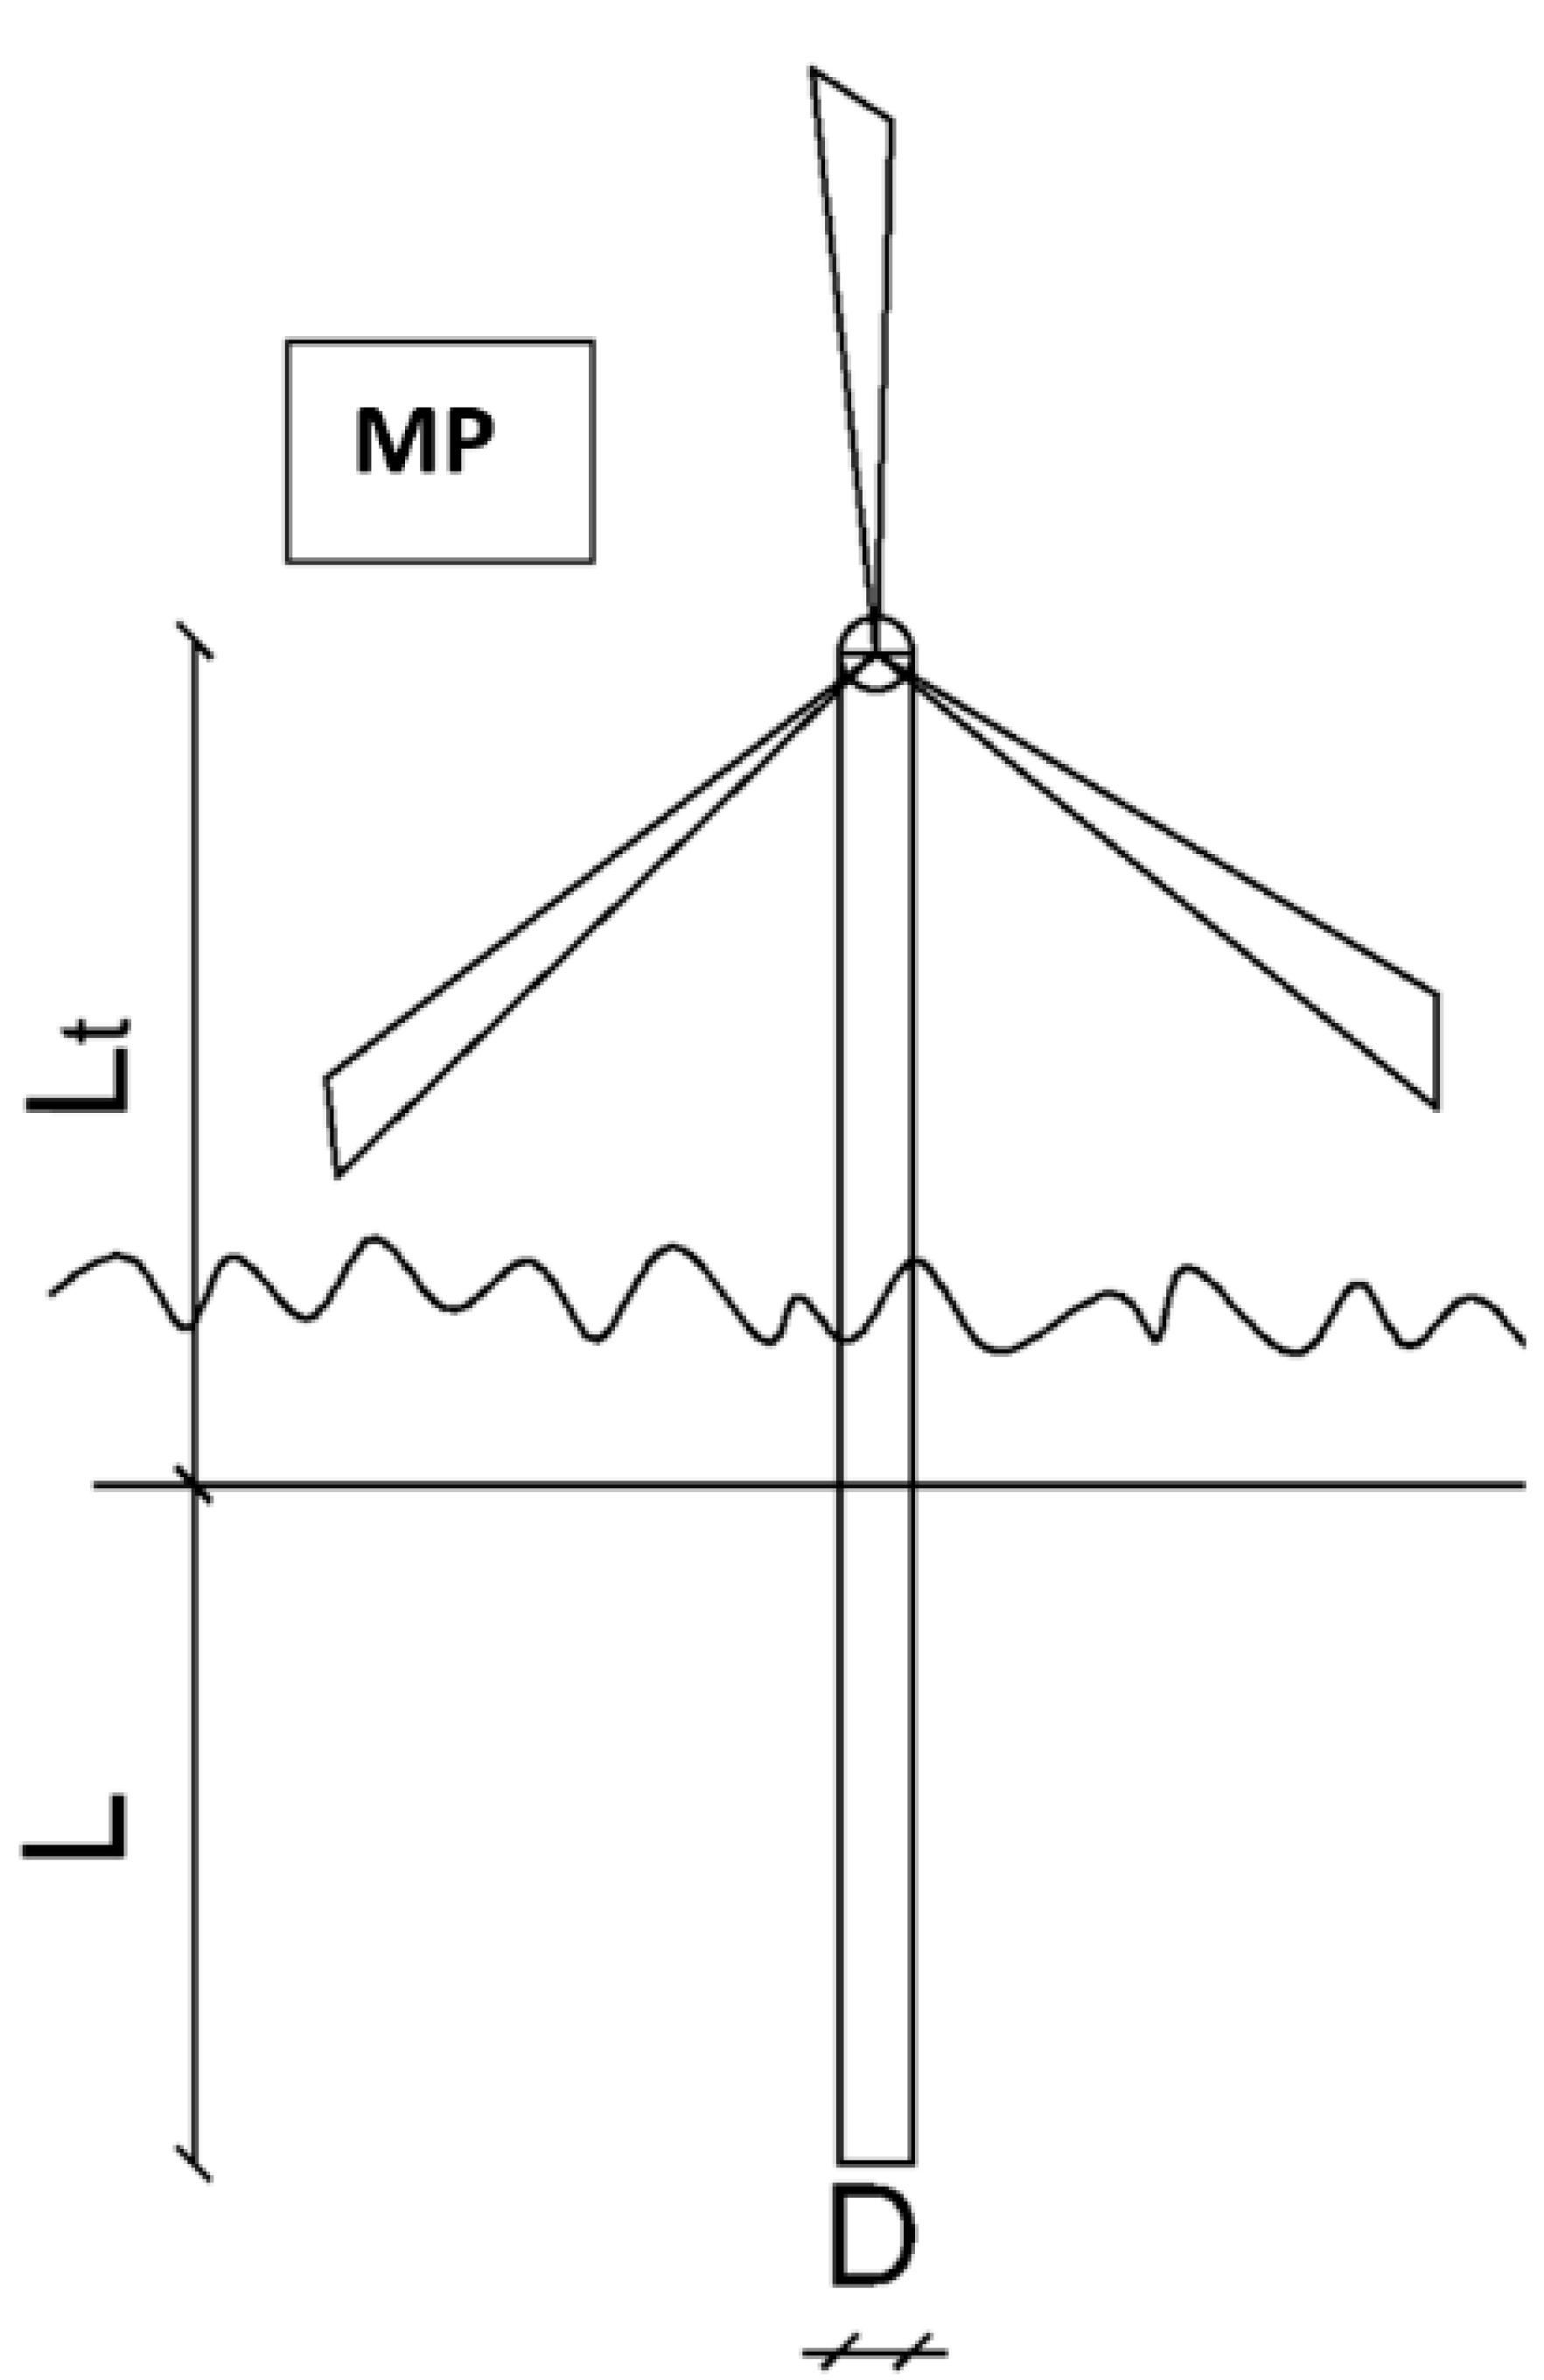
The lateral ultimate capacity of monopile (MP) foundation system is studied in different clayey beds and pile geometry. All systems were studied under similar loading eccentricity and diameter of tower to thickness ratio, Dp/t, of 85. The vertical loads on the MP comprised rotor and nacelle assembly mass, RNA, and tower own weight. The tower thickness was 0.035m and its dimeter was considered constant at 6m throughout its 90 m height. The tower was considered to be rigidly conected to the monopile. the MP diameter was selected to be 6 m while its length was varied from 20-80 m. Figure 9 shows the foundation system under consideration. Displacement controlled loading was applied until either geotechnical or structural failure has happened. In total, 42 finite element models were carried out utilizing the commercial code PLAXIS 3D. Six types of soils were considered covering a wide range of soils encountered in practise as listed in Table 2. Table 3 shows the details of parameter studies. In all cases, the load is applied above the seabed elevation with eccentricity e = 6.8 Dt where Dt is the tower diameter.

2.1.1. Monopile lateral ultimate capacity

The monopiles’ lateral ultimate capacity may be governed by either soil resistance or pile’s structural capacity. Hence it was important to model the correct behavior of soil and pile elements. In Plaxis 3D, the pile can be modelled using either plate elements or embedded beam elements. However, both are assumed to behave elastically. While volume elements do not provide information on structural forces, embedded beam elements do provide structural forces and can be used to check whether yield strength of structural elements is reached. Dao (2011) indicated that by incorporating a solid zone around the pile, the embedded beam elements within solid elements behaved like volume piles. Correspondingly, embedded beam elements within solid elements were utilized to simulate the piles to enable proper evaluation of its ultimate capacity. The combined rigidity of both the solid elements and embedded beam elements was equivalent to that of the open-ended pile. To ensure beam elements would deflect with the solid elements, their E modulus was divided by 106. The resulting bending moment was then multiplied by 106 to calculate the correct bending moment value. Failure was determined to be either geotechnical or structural after examining output data and checking whether the applied load causes yielding conditions at mudline. The lateral ultimate capacity is taken as the linear average between the two values on either side of the value that caused structural capacity failure.

3. Results

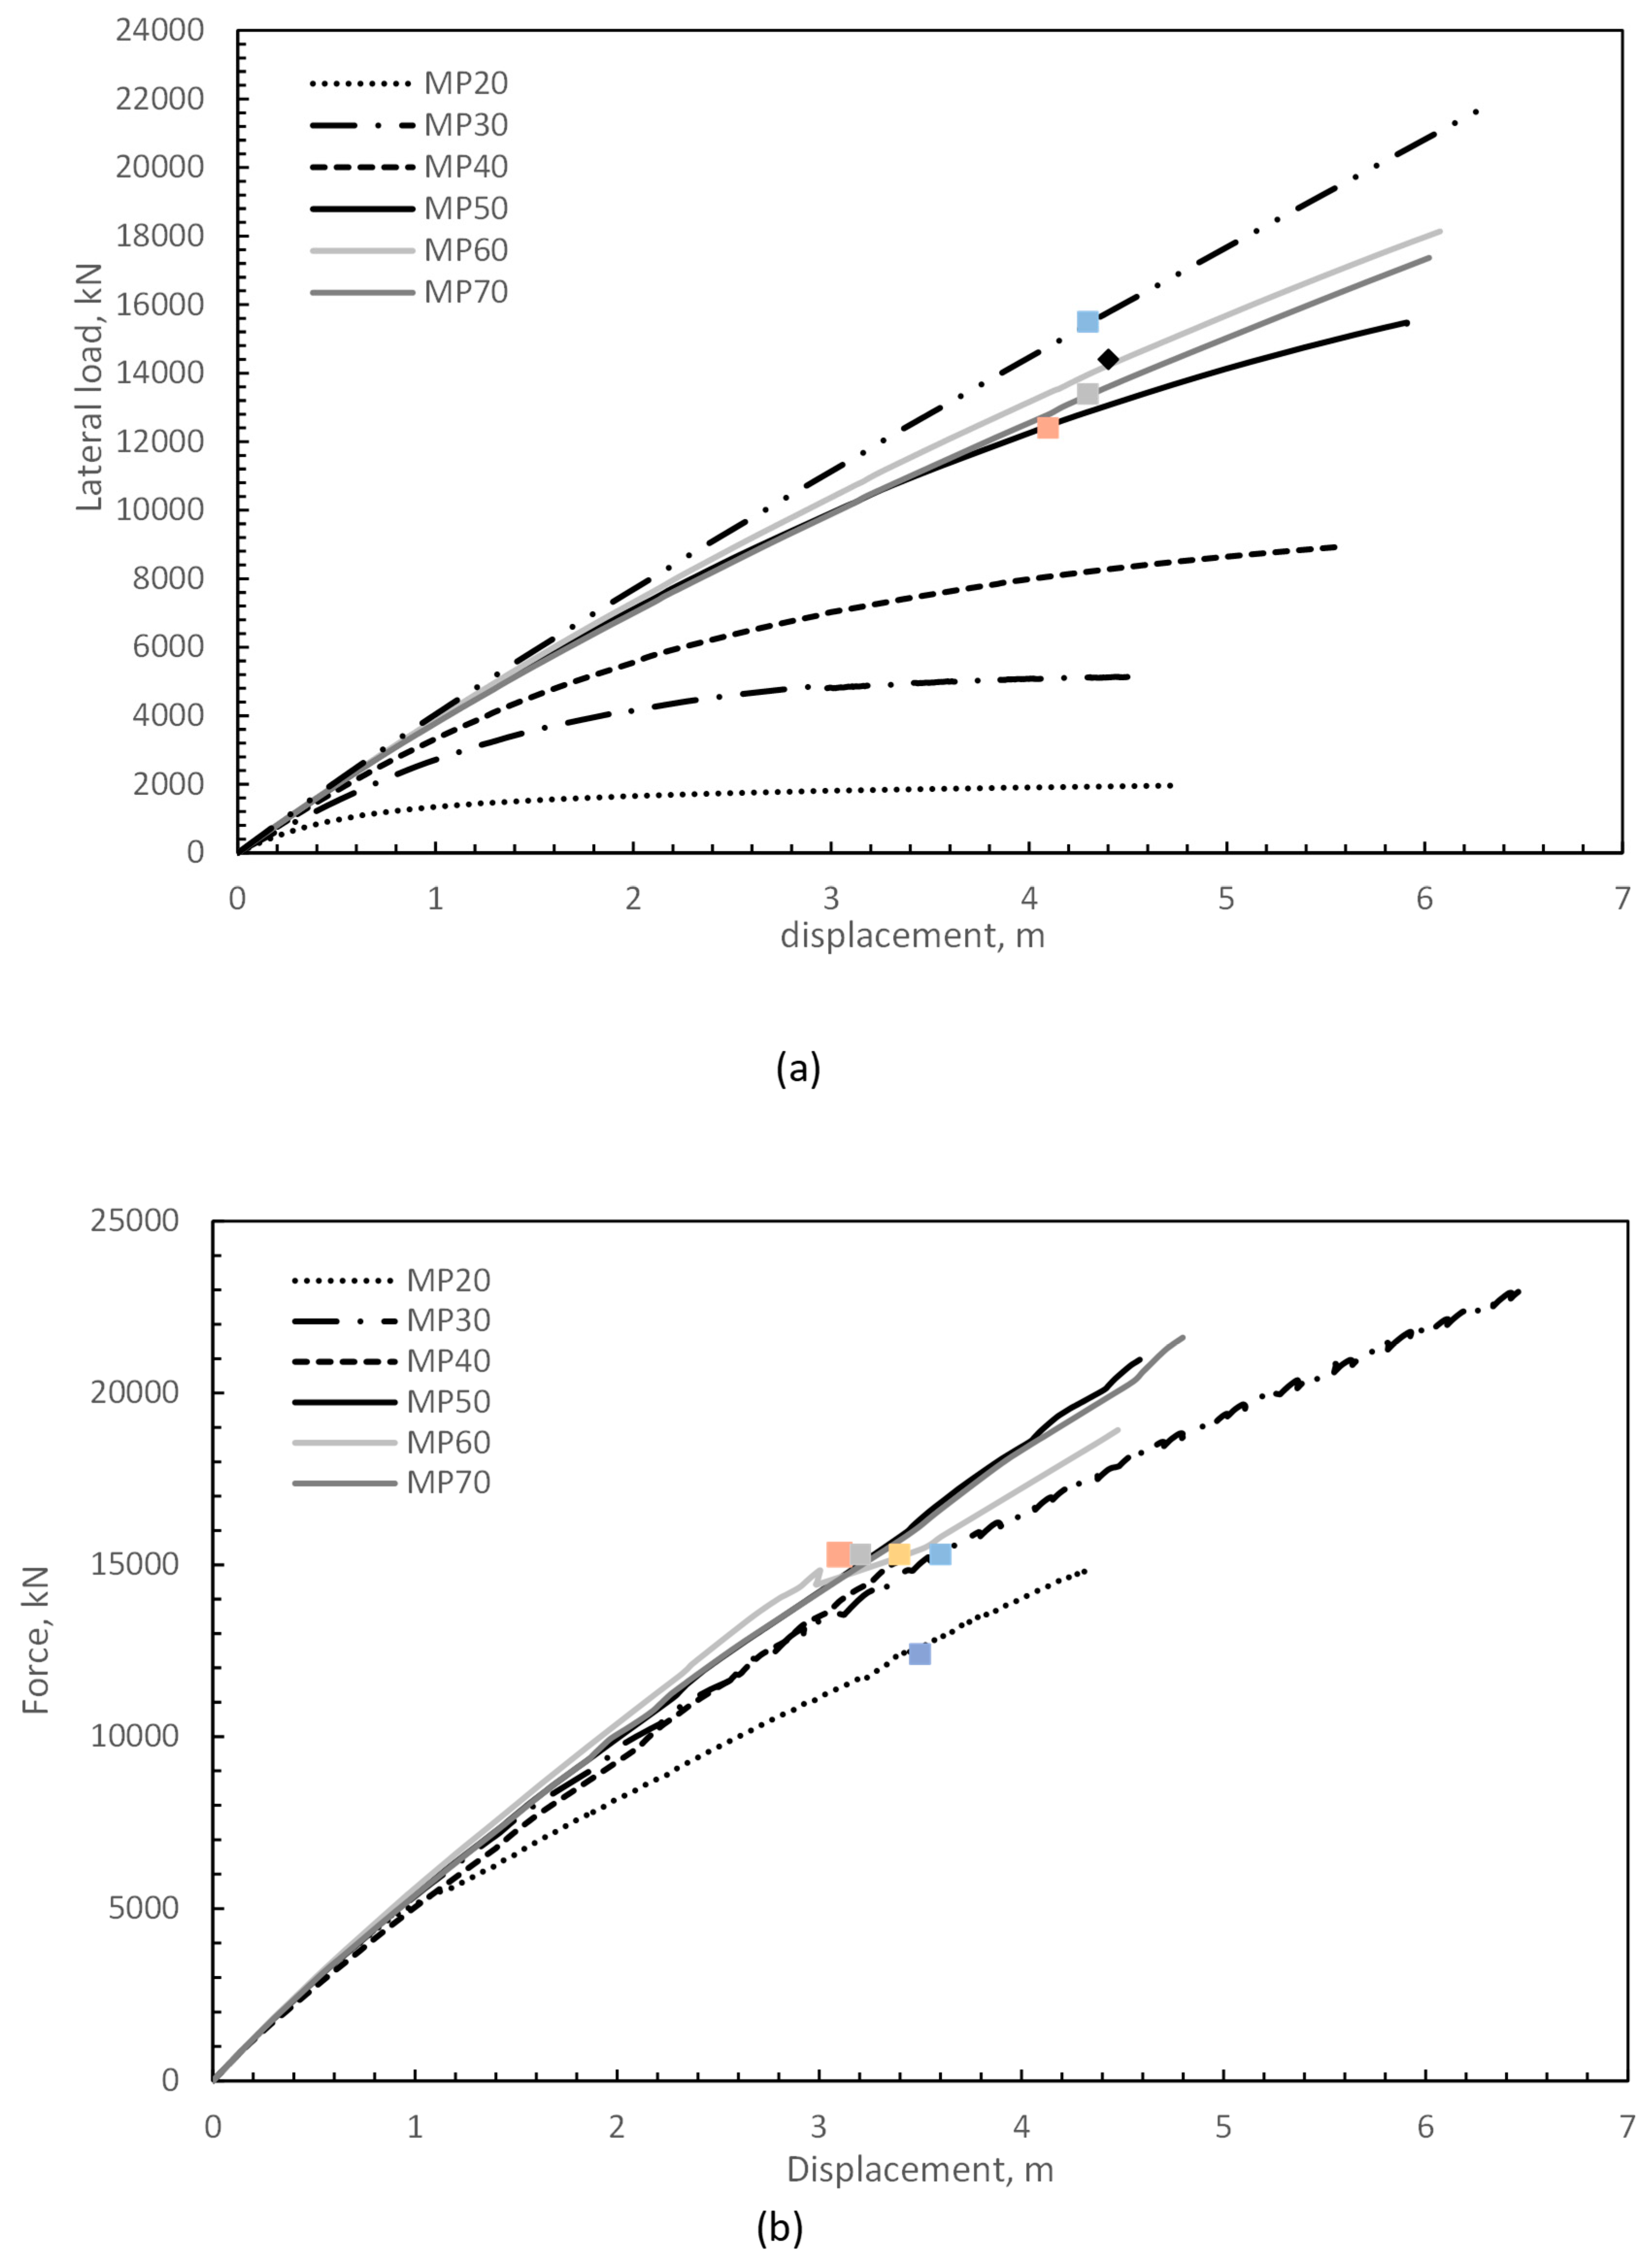
The load displacement curves for monopiles in soft clay (Clay1) and hard clay (Clay 6) are displayed in Figure 10. It can be seen that both stiffness and strength increased with increasing the L/D ratio in the soft clay indicating rigid pile behavior, Figure 10a. In the hard clay, a less discernible increase in stiffness in realized when using longer monopiles and the strength gain is also minimal due to the flexibility of the pile with respect to the soil, Figure 10b. Since the pile elements are considered to behave elastically, the load displacement curve is capped at the points where the flexural bending capacity is reached within the monopile, i.e., the load displacement curve is not valid beyond these points (shown in Figure 10 as square and diamond points). It can be noticed that in both clays this phenomenon happened, although at lesser extent in the soft clay.

4. Discussion

4.1. Discussion of lateral ultimate capacity

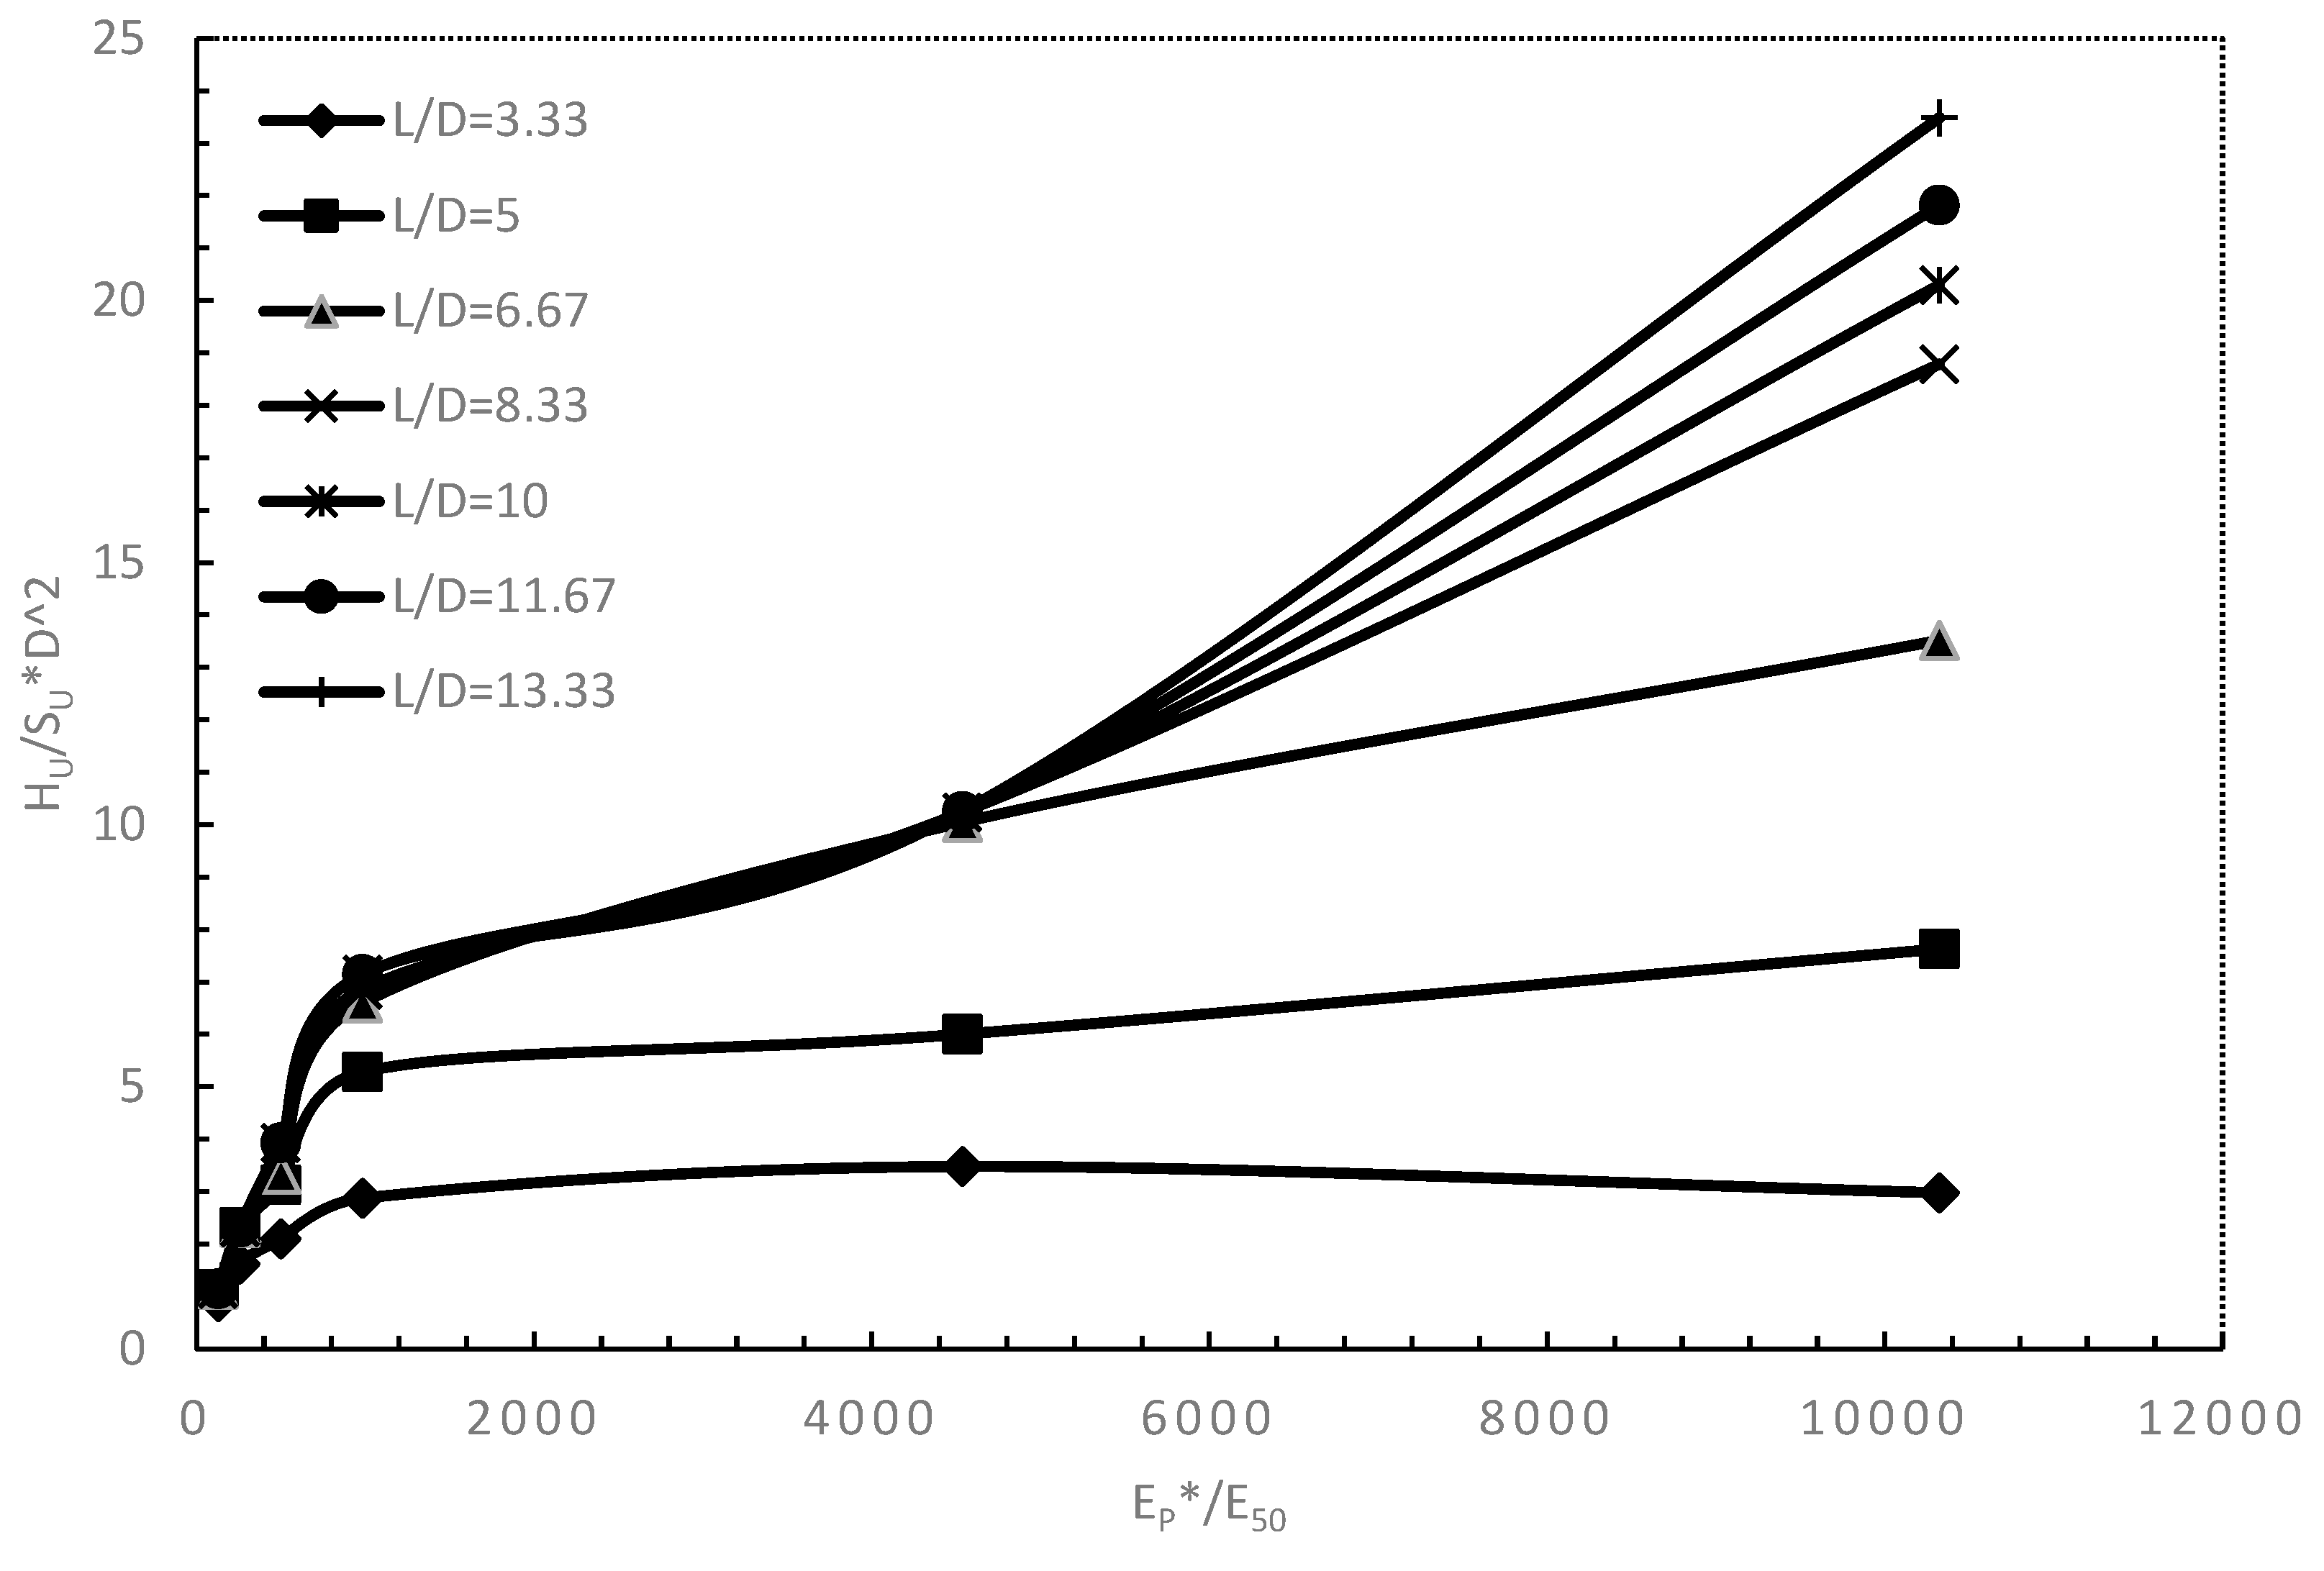
Figure 11 presents the normalized ultimate capacity versus the normalized stiffness for the monopile models. The normalized ultimate capacity varies linearly with increase in normalize stiffness and reaches a plateau at Ep*/E50 of 984 for cases of L/D ≤5. For cases with L/D > 5, the normalized ultimate capacity showed trilinear trajectory.
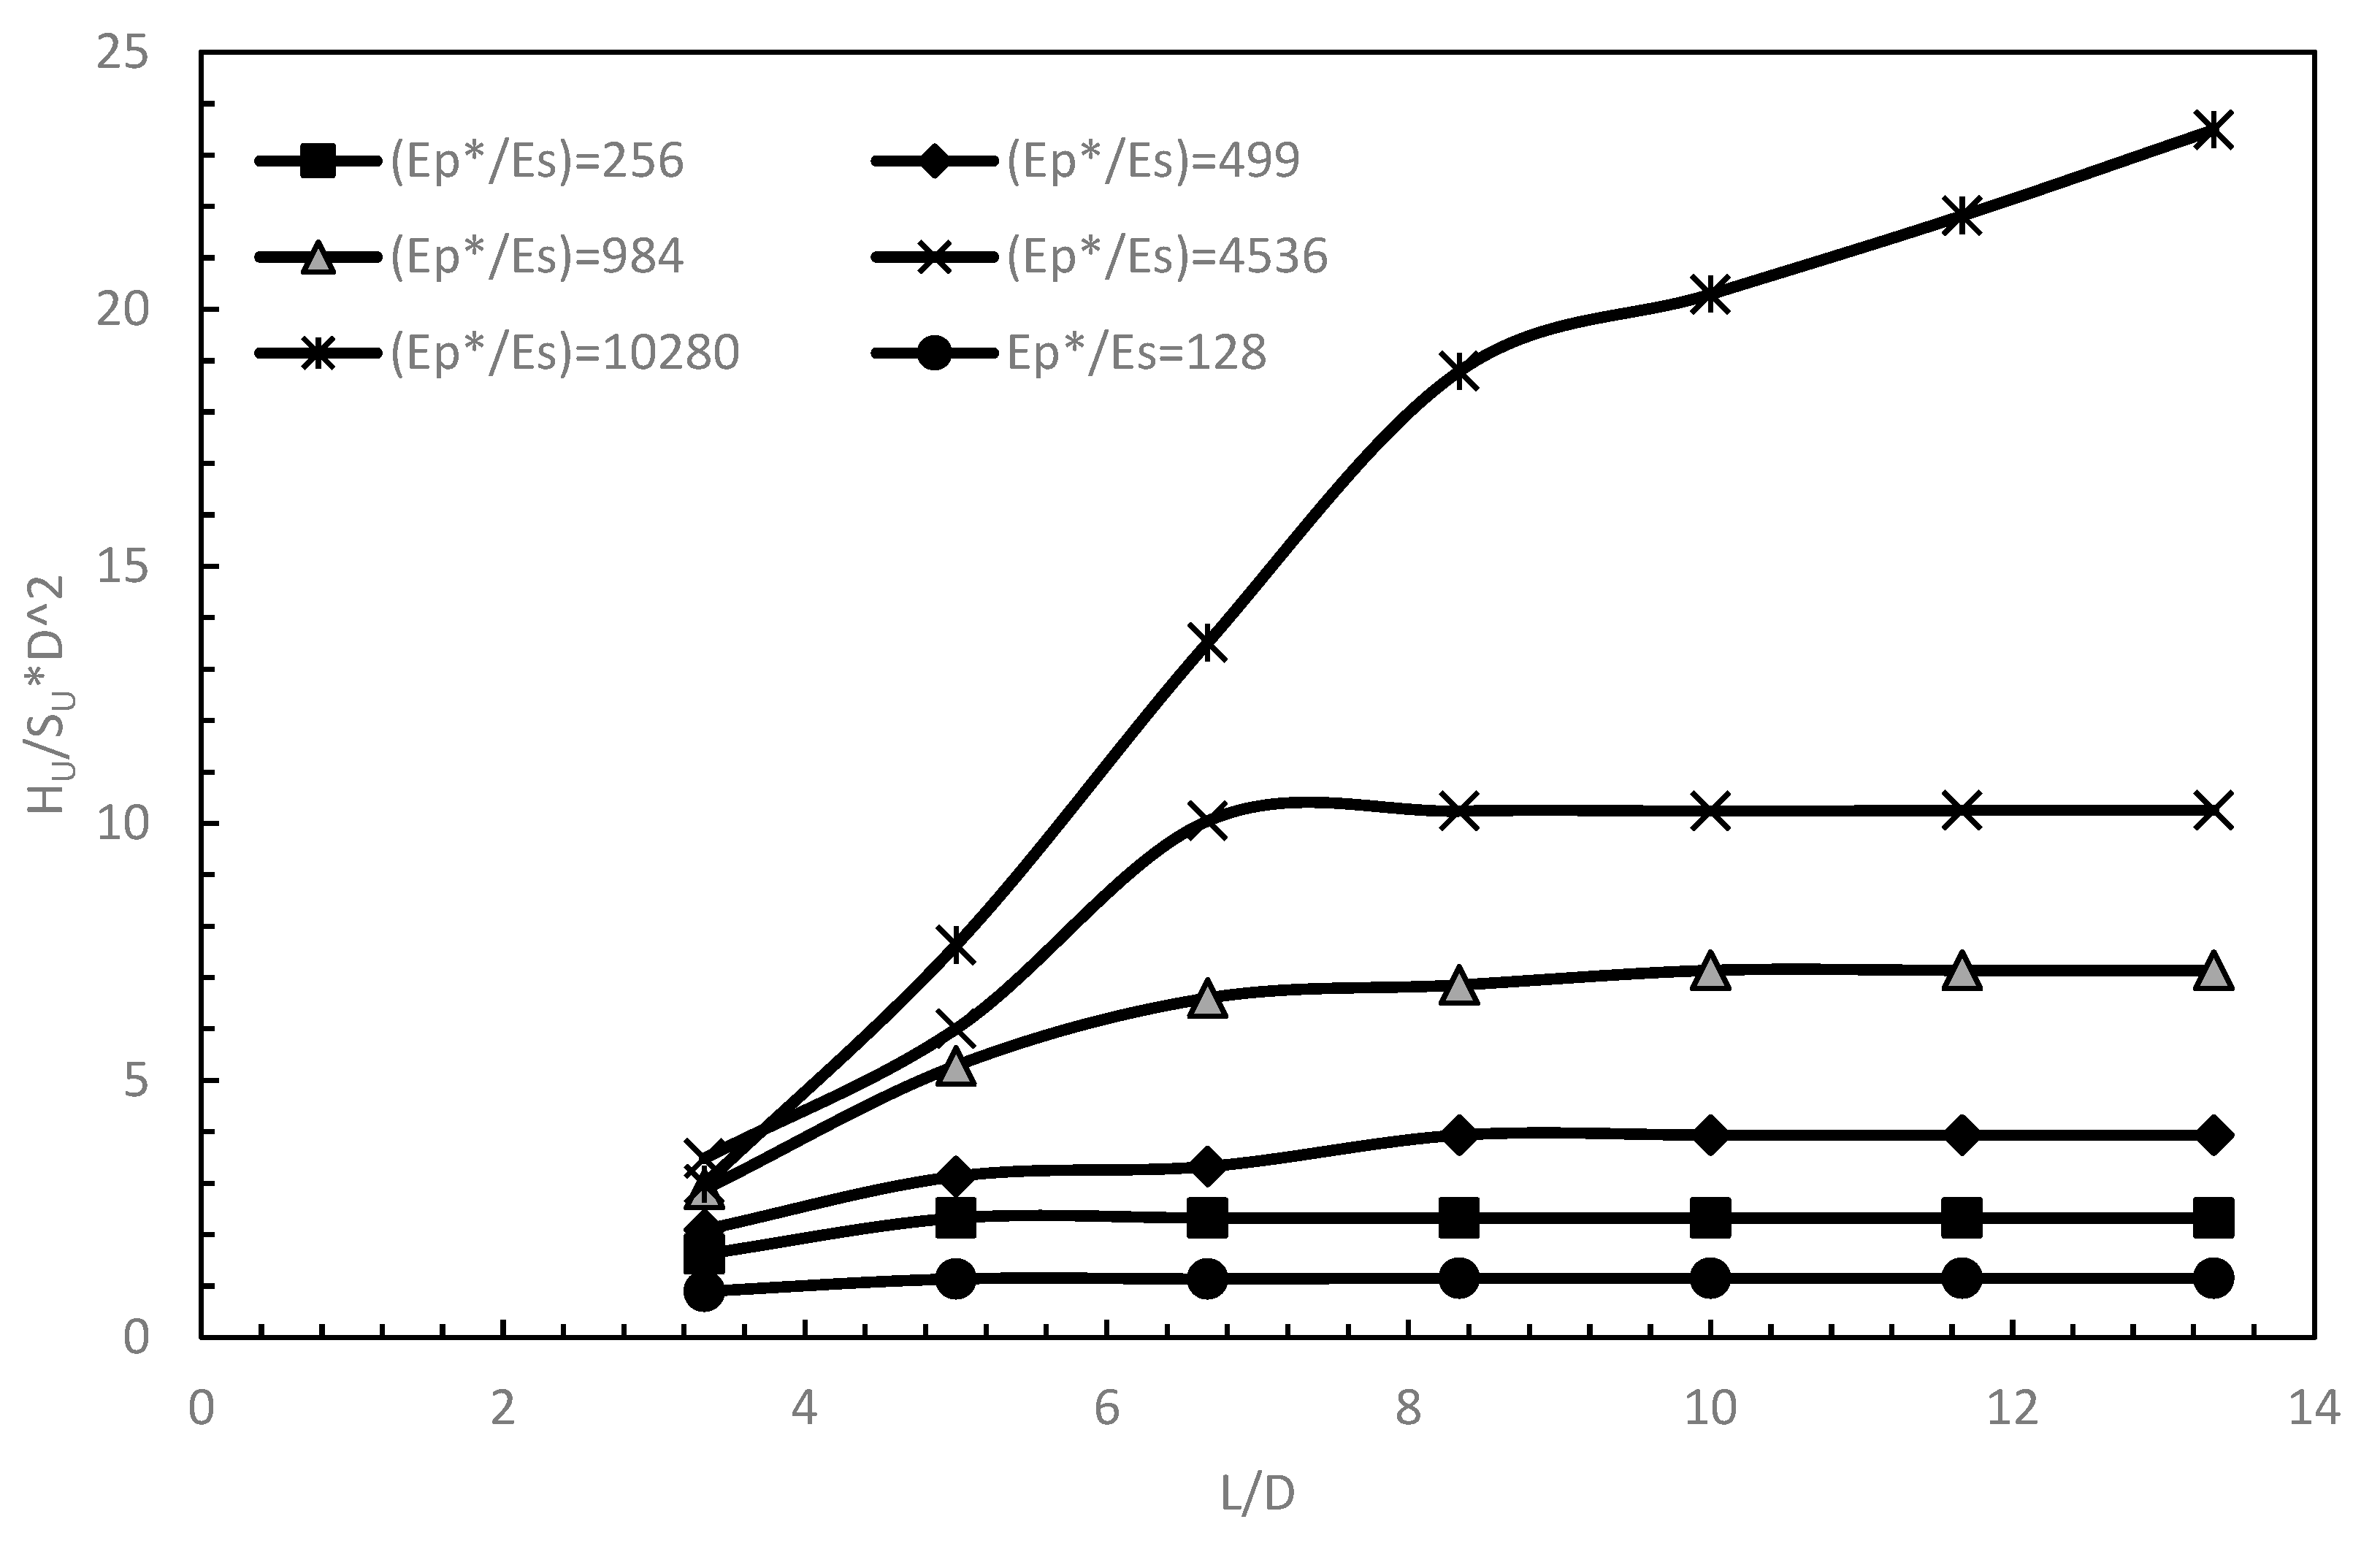
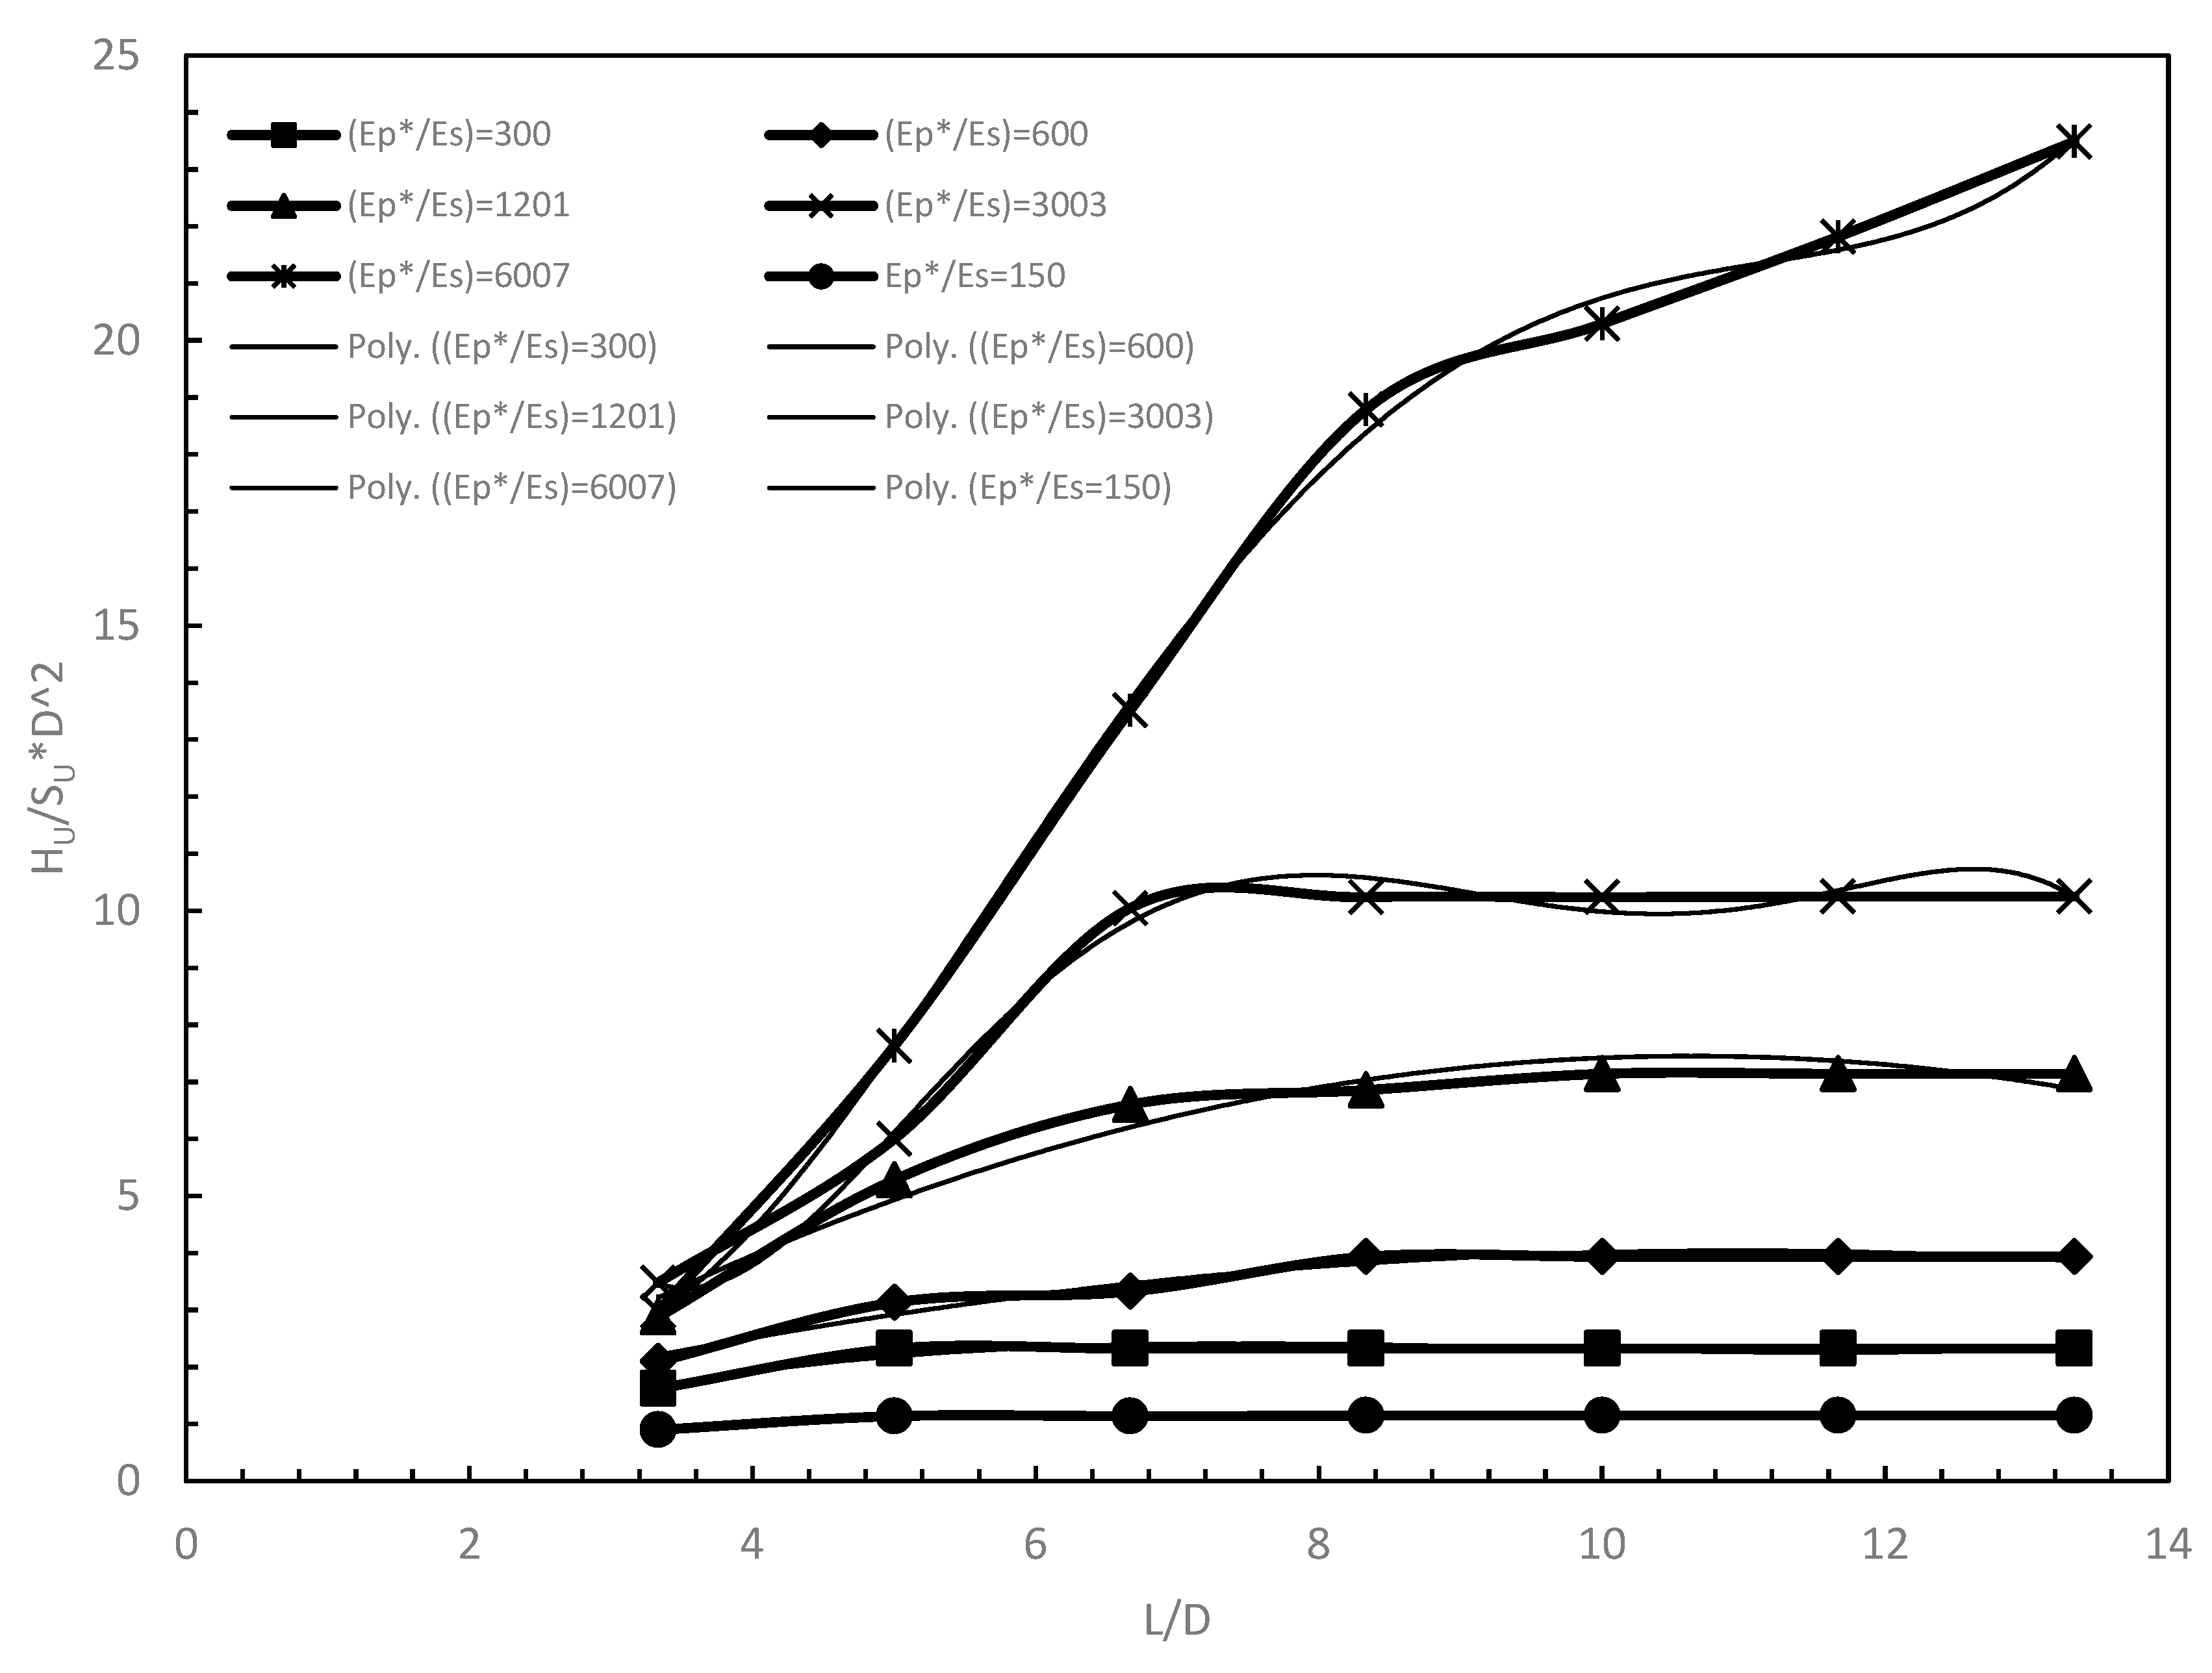
For a given Ep*/E50 ratio, the variation of normalized ultimate capacity with different L/D ratio differs significantly between Ep*/E50 of 10250 where ‘rigid’ response was observed for all L/D ratio and for Ep*/E50 value of 127 where flexible pile response was observed. This can be explained by inspecting the variation of normalized ultimate capacity versus L/D ratio for all soil profiles considered. Figure 11 shows that for a stiff to hard clay site (Ep*/E50 of less than 499), the pile lateral capacity reached a maximum at L/D ratio of between 5-8. For soft clay sites, the capacity continues to increase as L/D increases, Figure 12.

4.1.1. Monopile bending moment at lateral ultimate capacity

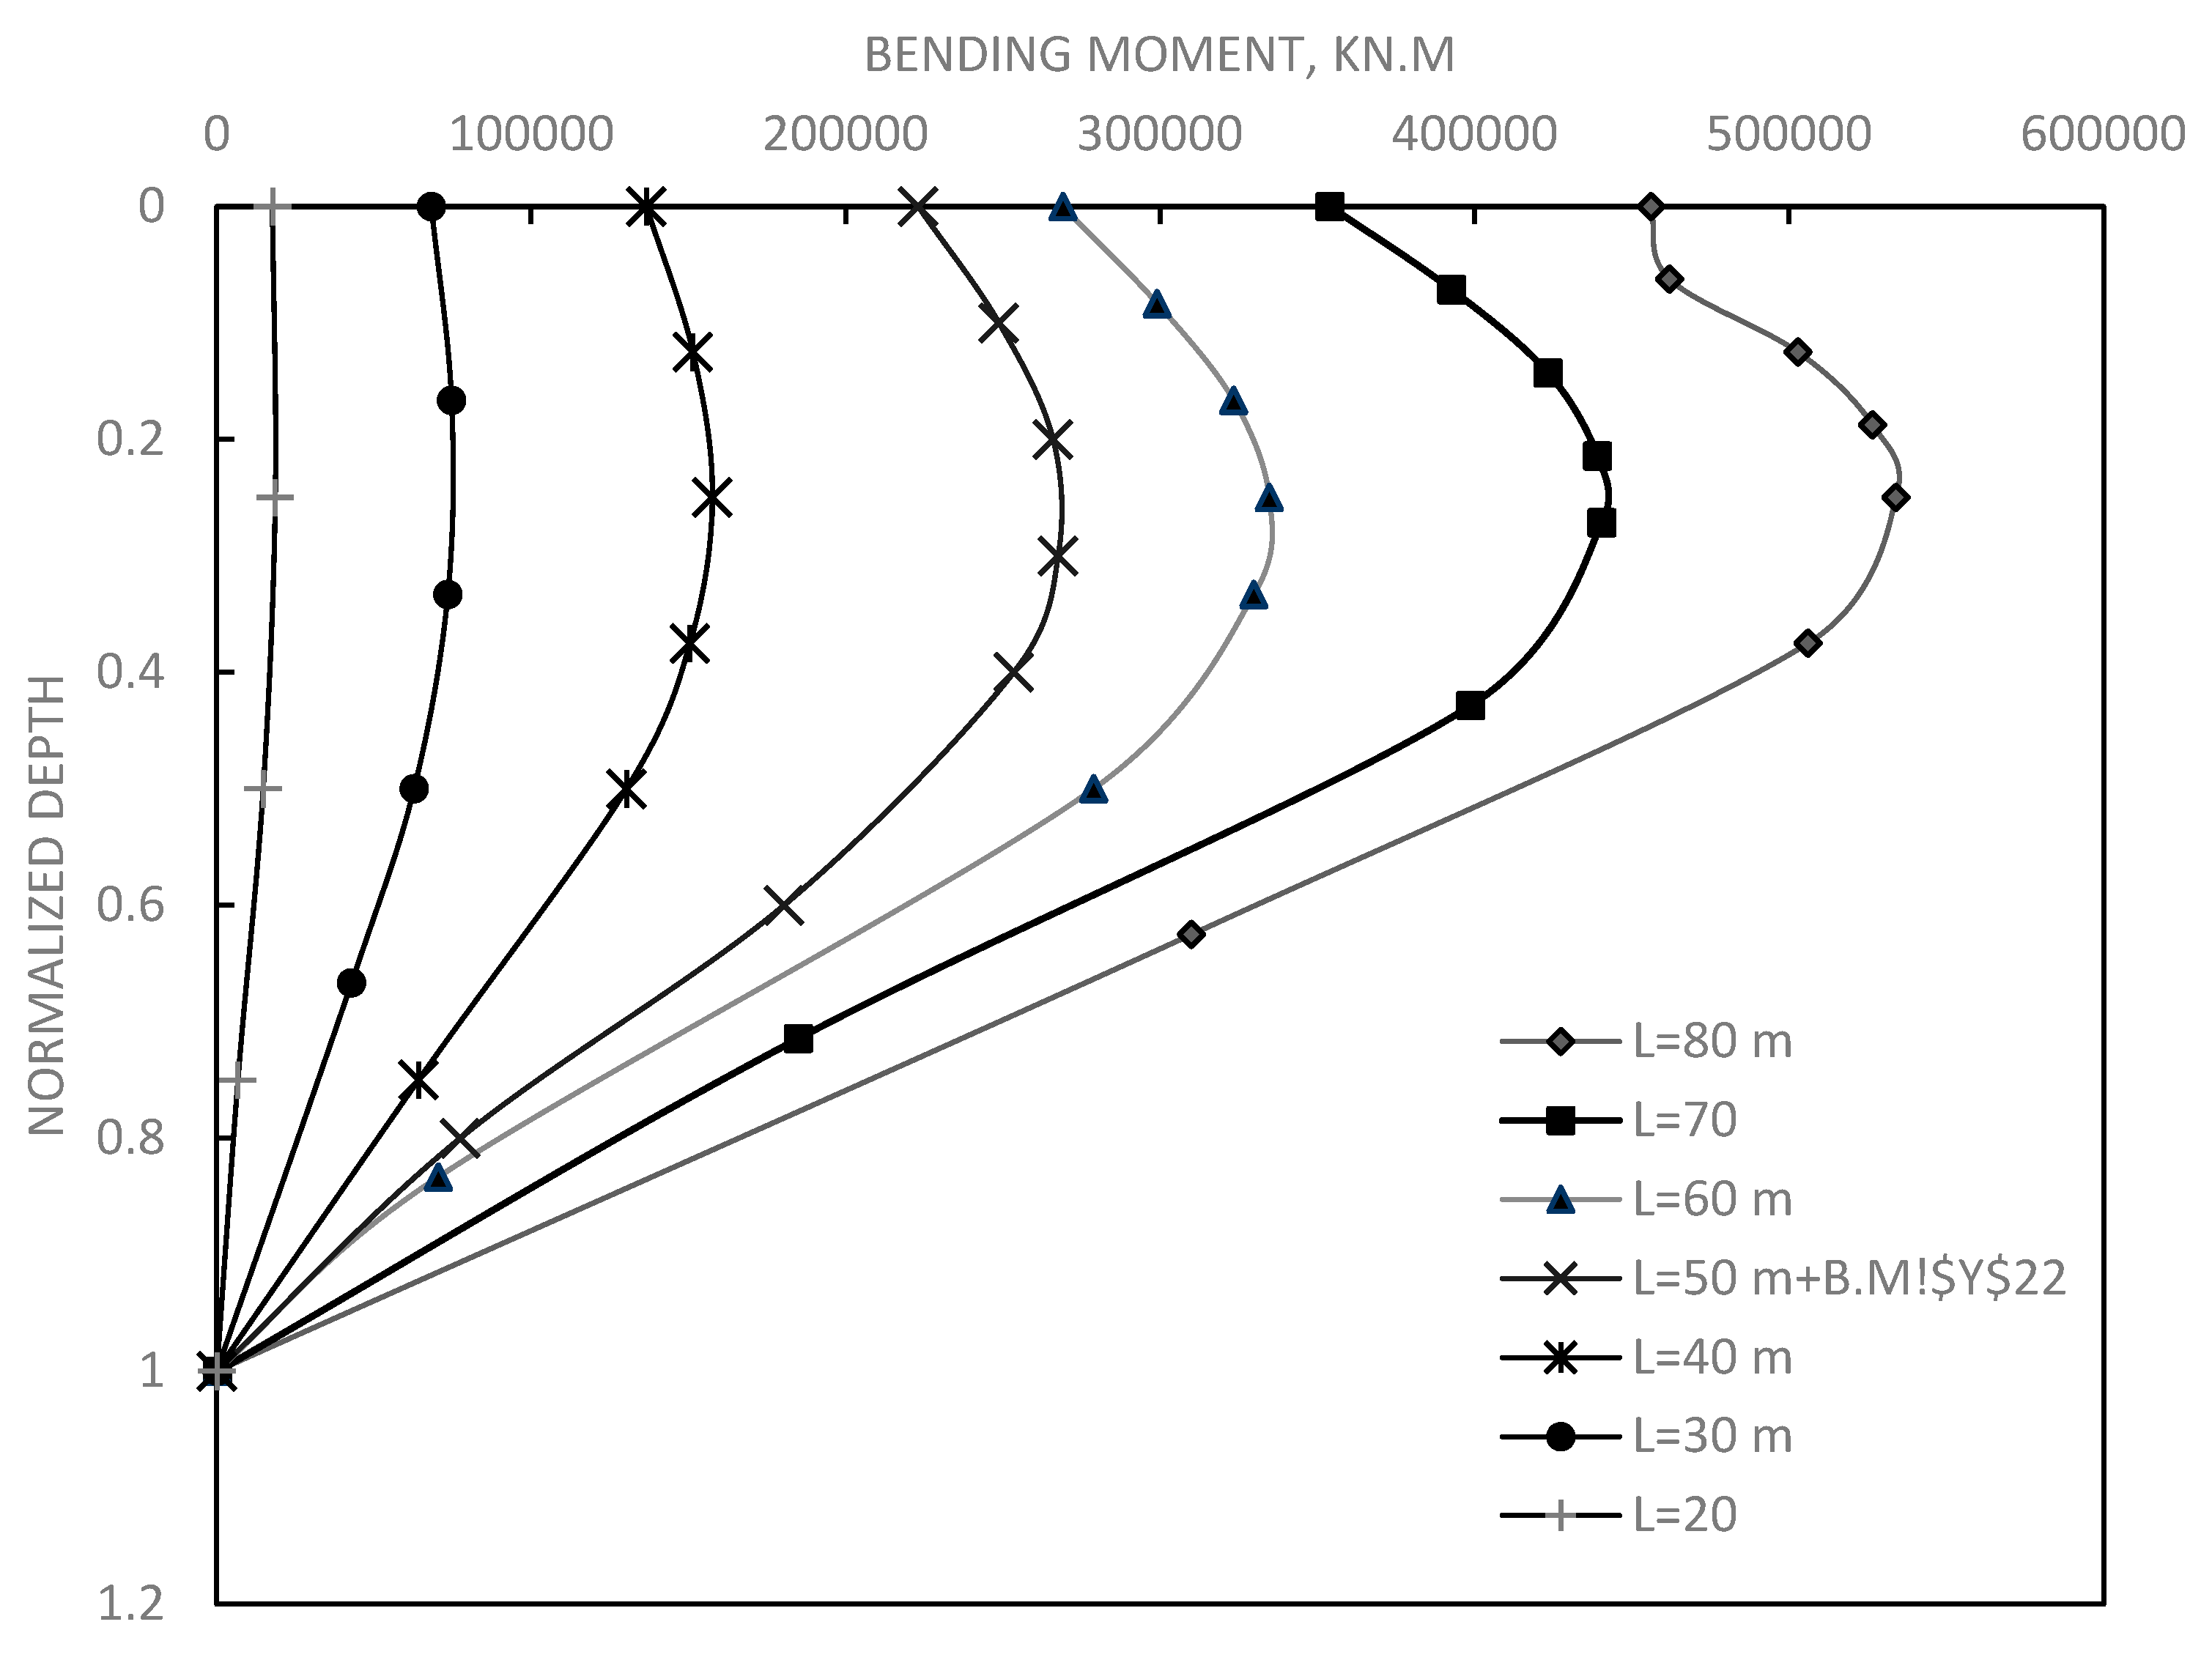
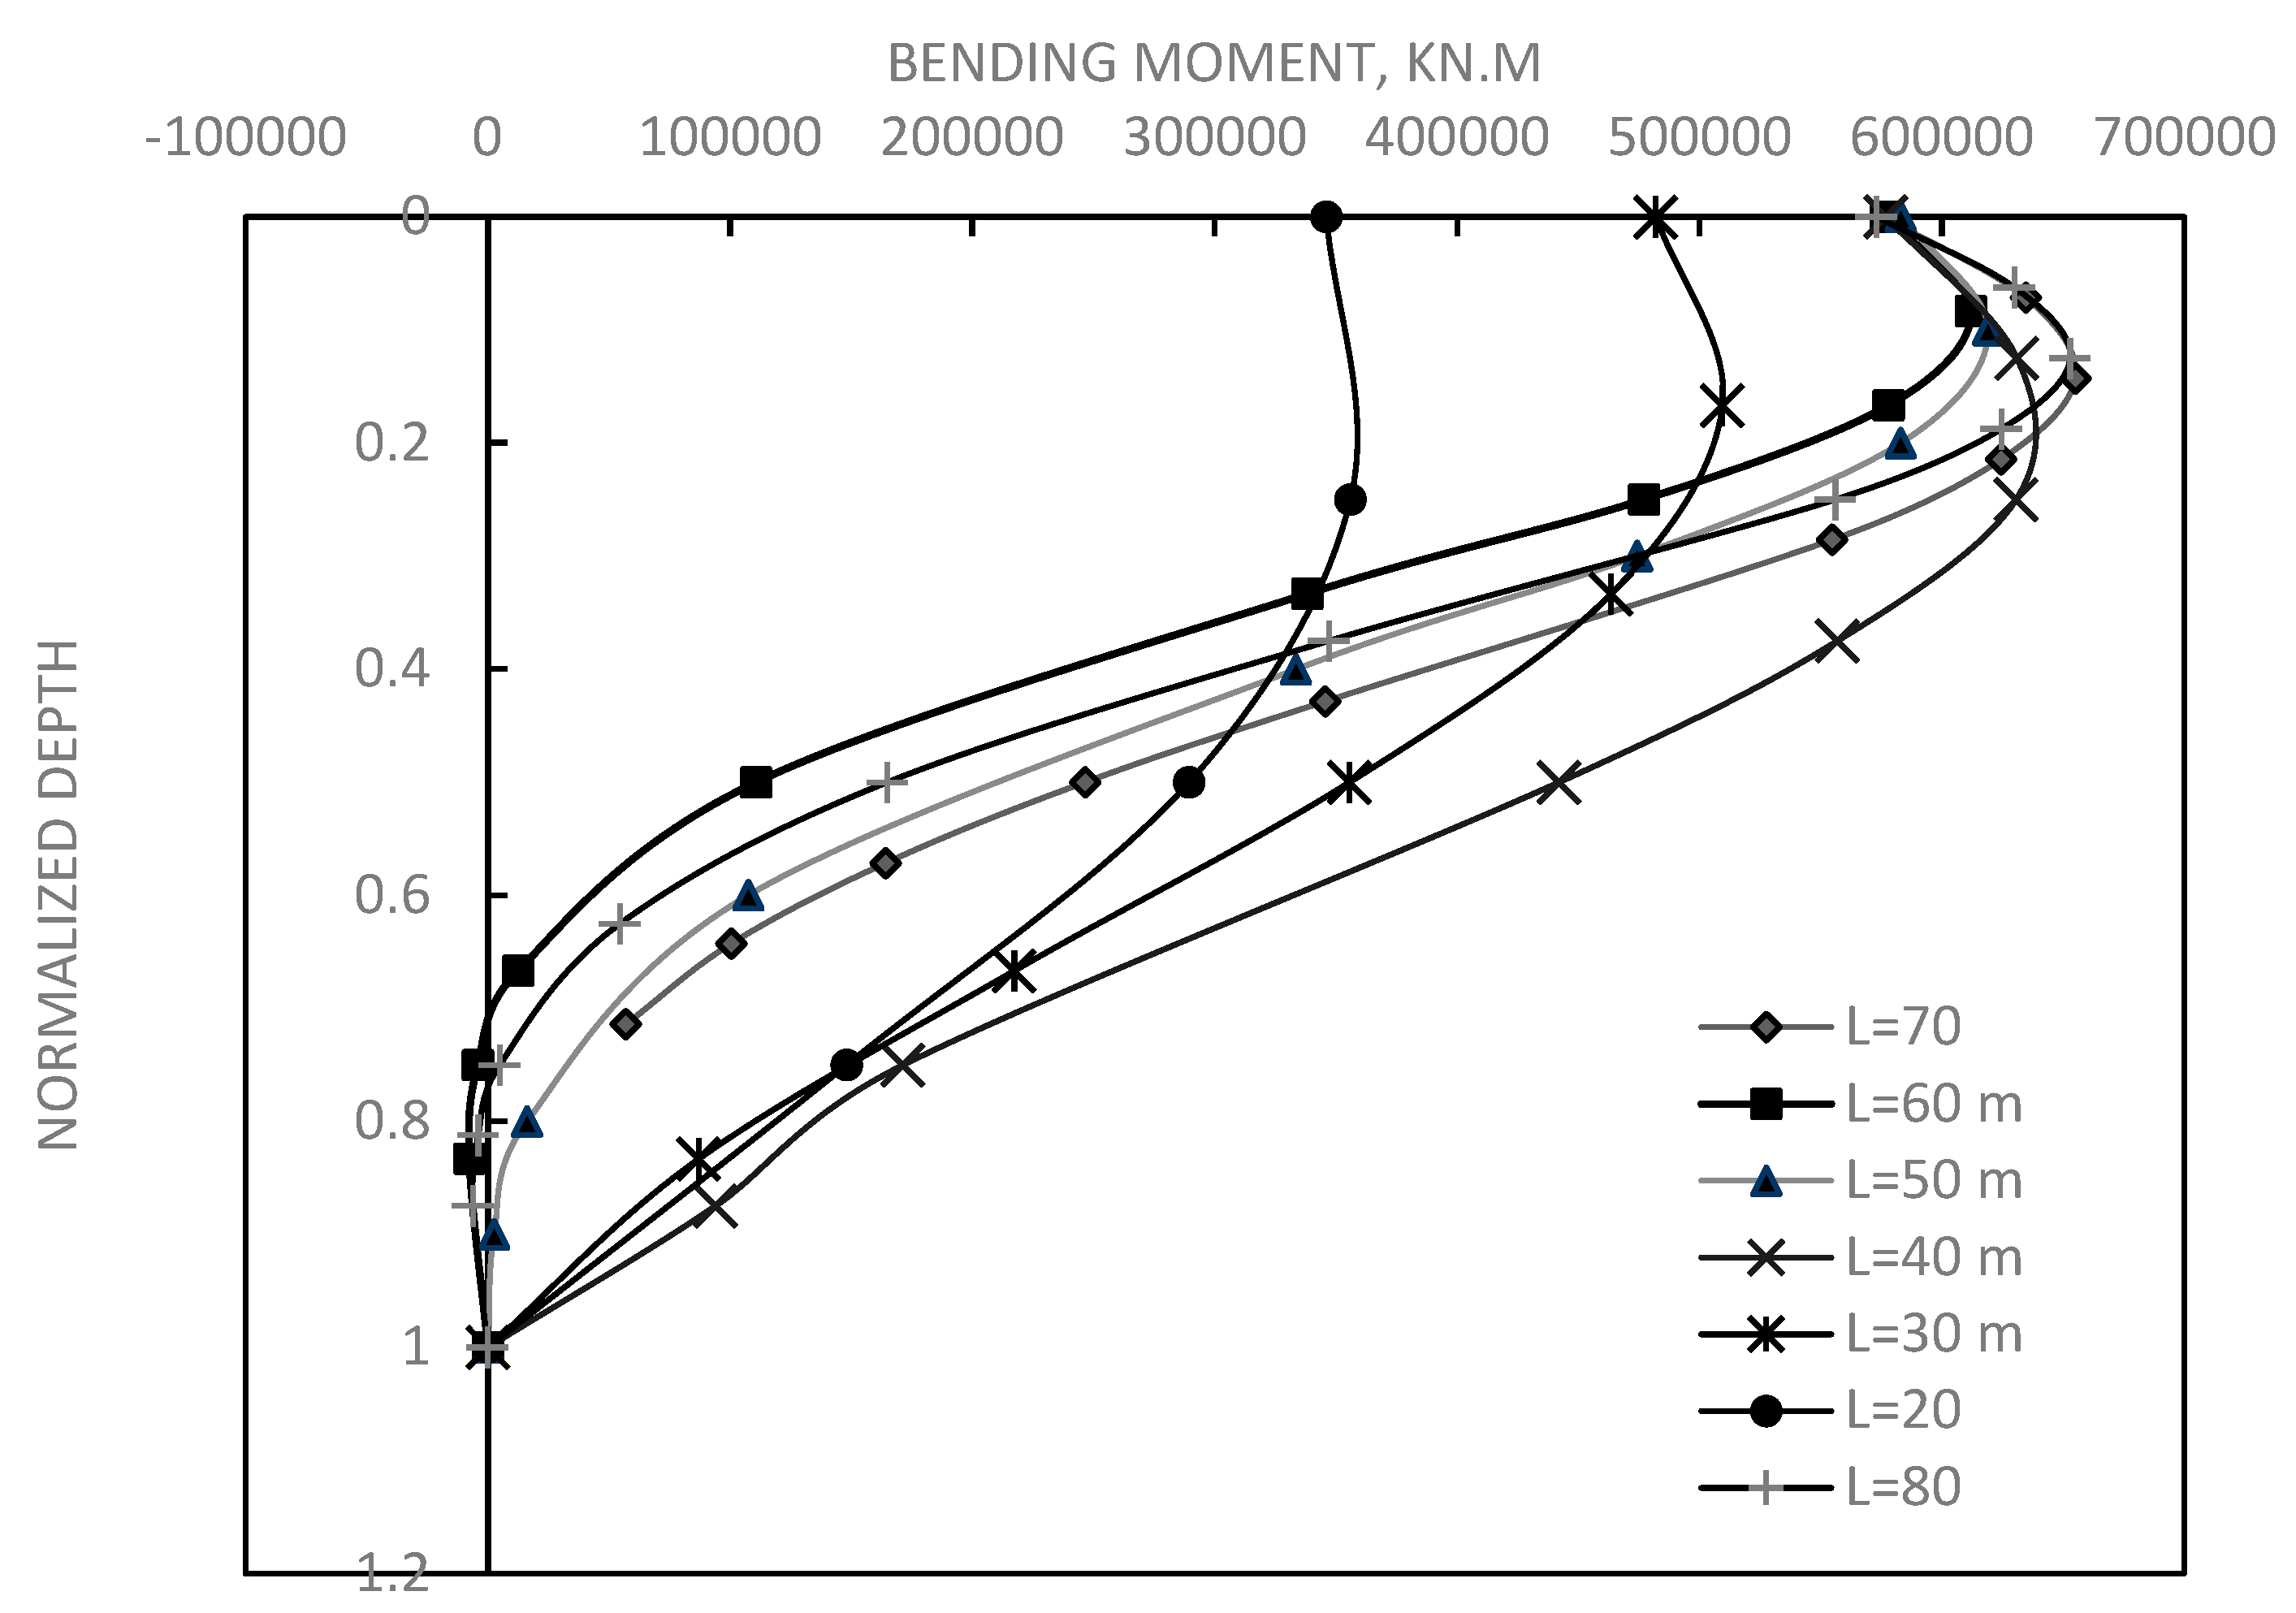
Examining bending moment (B.M.) profiles for MP at lateral ultimate capacity can aid in assessing pile behaviour and determining structural failure. Figure 13 and Figure 14 display the bending moment profiles for two soils, namely soil 1 and 6. Figure 13 presents the BM profile against normalized depth for different pile lengths in soft clay at maximum loads (Suo =4.2 kPa). As expected, the pile behaves rigidly in all cases with pile showing toe kick in behavior and zero BM at pile tow. In contrast, the pile behaves rigidly for small L/D rations up to 6.67 and starts to show negative moment when the soil profile is stiff as shown in Figure 14 (Suo = 354 kPa).

4.1.2. Predictive equations for determining lateral ultimate capacity for monopiles

By curve fitting the data in Figure 11, equations are obtained for determining the lateral ultimate capacity of monopiles for various Ep*/E50 ratios between 10280 and 128 and L/D ratio between 3.33 and 13.33 for the case of e/d of 6.83. Second order and third order polynomial were chosen based on the regression analyses. Equations 6 to 11 describe ultimate capacity of MP in clayey medium under eccentric loading of e/Dt=6.83 representative of medium depth water. Figure 15 demonstrates excellent agreement between the predicted ultimate capacity employing Equations 6-11 and those calculated from FE analysis (0.91<R2<0.999).
For (Ep*/E50 = 10280):
H u S u D 2   =   0.1897 * ( L D ) 2   +   5.2326 * ( L D ) 12.823 ( R 2 = 0.9916 )
For (Ep*/E50 = 4536):
H u S u D 2   =   - 0.1421 * ( L D ) 2   +   2.9891 * ( L D ) + 4.8175 ( R 2 = 0.949 )
For (Ep*/E50 = 984):
H u S u D 2   =   - 0.0796 * ( L D )   2   +   1.6913 * ( L D ) 1.5355 ( R 2 = 0.9583 )
For (Ep*/E50 = 499):
H u S u D 2   =   - 0.0315 * ( L D ) 2   +   0.6905 * ( L D ) + 0.256 ( R 2 = 0.9633 )
For (Ep*/E50 = 256):
H u S u D 2   =   -   0.1203 * ( L D ) 2   +   1.0909 * ( L D ) ( R 2 = 0.9165 )
For (Ep*/E50 = 128):
H u S u D 2   =   - 0.0014 * ( L D ) 2   -   0.04 * ( L D ) + 0.3667 ( R 2 = 0.9229 )

5. Conclusion

Monopile foundations utilisation for OWT’s plays important role for supporting development of green electricity alternative. Further development of OWT farms is expected to have bigger and heavier turbines to add more electricity in addition to being moved to deeper water locations, hence increasing loads on foundations and requiring massive foundation elements. A typical foundation system for OWTs can consume up to 40% of the initial cost with monopiles diameter and depth reaching 7.8m and 80m, respectively. Therefore, critical review of foundation design is needed and optimization and innovation in this field is necessary. Few studies exist on the lateral ultimate capacity for monopile foundations and therefore the aim was to close this gap in literature by studying their lateral ultimate capacity in cohesive soils under eccentric loading typical for offshore locations.
Different soils conditions were considered, and a validated FE model was employed using Hs constitutive relationship with parameters calibrated and verified from field tests. Typical procedure involved Ko stage followed by installation stage which was then used to apply displacement-controlled loading, from which generic curves and best fit equations were established to obtain ultimate lateral capacity for the considered system. Several conclusions were drawn and are listed as follows:
  • The normalized ultimate capacity versus normalized stiffness of MP showed three distinct slopes, the normalized ultimate capacity was observed to increase significantly for Ep*/E50 values less than 984 for all L/D ratio. At normalized stiffness values of more than 2000, the effects of increasing the stiffness for a given L/D ratio was small for L/D ratios less than 6 and was considerable for higher L/D ratio.
  • The normalized lateral ultimate capacity increase against L/D ratio was dependent on the normalized stiffness (Ep*/E50) values. At large Ep*/E50 values, the piles behaved as rigid piles and linear growth of normalized lateral ultimate capacity was observed for L/D ratios considered herein. As normalized stiffness (Ep*/E50) values decrease below 984, the effects of L/D ratio on lateral ultimate capacity diminish around L/D values of 5-8. These findings are better understood by inspection of bending moment profiles for clay 1 and 6.
  • Higher L/D ratios had increased normalized lateral capacity for clay 1-5. In clay 6, no effects were observed of L/D on the normalized lateral capacity.
  • For clay 1, increasing L/D ratio from 3.3 to 13.3 gave substantial increase in normalized lateral ultimate capacity of more than 700%. For clay 2, similar observation was made, however at lower magnitude.
  • For clays 3-4, the effects of L/D ratio on the normalized lateral ultimate capacity was noticeable, amounting to 100%. However, the increase ceased after L/D value of 8.3.
  • For clays 5-6, the effects of L/D ratio on the normalized lateral ultimate capacity were negligible due to flexibility of monopile.
  • Predictive polynomials showed excellent match with FE data giving promising results and paving the way for more FE based charts for preliminary estimate of monopile lateral ultimate capacity.

Acknowledgments

The researchers would like to thank the Deanship of Scientific Research, Qassim University for funding the publication of this project.

References

  1. Abdelkader, Ahmed Mohamed Reda, Investigation of Hybrid Foundation System for Offshore Wind Turbine (Scholarship@Western). 2016.
  2. Alsharedah, Yazeed A., "Behavior of Hybrid and Monopile Foundation Systems for OWT: Centrifuge testing and Numerical Modelling" (2022). Electronic Thesis and Dissertation Repository. 8580. https://ir.lib.uwo.ca/etd/8580.
  3. Alsharedah, Y. Black, J.A, Newson, T and El Naggar M.H (2023). Centrifuge Testing of Improved Monopile Foundation for Offshore Wind Turbines. Ocean Engineering, V2, 285.
  4. Alsharedah, Y. Black, J.A, Newson, T and El Naggar M.H (2022). Monopile and Hybrid Foundation Comparisons under Lateral Loading. International Conference on Physical Modelling in Geotechnics, ICPMG 2022.
  5. API, 1993. Recommended practice for planning, designing, and Constructing fixed offshore platforms. API, RPT2A-WSD. American Petroleum Institute (API), Washington, D.C.
  6. Association EWE. The European Offshore Wind Industry–Key Trends and Statistics.
  7. 2016; January; 2017.
  8. Bayton, S., Black, J.., & Klinkvort, R.. (2018). Centrifuge modelling of long term cyclic lateral loading on monopiles. In Physical Modelling in Geotechnics (1st ed., pp. 689–694). Routledge. [CrossRef]
  9. Bisoi, S., and S. Haldar. 2014. “Dynamic analysis of offshore wind turbine in clay considering soil-monopile-tower interaction.” Soil Dyn. Earthquake Eng. 63: 19–35. [CrossRef]
  10. Broms, B. B. (1964b). Lateral Resistance of Piles in Cohesive Soils. Journal of the Soil.
  11. Mechanics and Foundations, 90(2): 27-64.
  12. Brown, D. A. (2007). Rapid lateral load testing of deep foundations. DFI Journal - the Journal of the Deep Foundations Institute, 1(1), 54-62. [CrossRef]
  13. Byrne, B.W. and Houlsby, G.T. (2003) “Foundations for Offshore Wind Turbines”, Philosophical Transactions of the Royal Society of London, Series A, Vol. 361, December, pp 2909-2930.
  14. Byrne B. W., McAdam R., Burd H. J., Houlsby G. T., Martin C. M., Zdravković L., Taborda D. M. G., Potts D. M., Jardine R. J., Sideri M., Schroeder F. C., Gavin K., Doherty P., Igoe D., Muir Wood A., Kellahave D., and Skov Gretlund J. 2015a. New design methods for large diameter piles under lateral loading for offshore wind applications. Proceedings of Third International Symposium on Frontiers in Offshore Geotechics 1, 705-710.
  15. Byrne B. W., McAdam R., Burd H. J., Houlsby G. T., Martin C. M., Gavin K., Doherty P., Igoe D., Zdravković L., Taborda D. M. G., Potts D. M., Jardine R. J., Sideri M., Schroeder F. C., Muir Wood A., Kellahave D. and Skov Gretlund J. 2015b. Field testing of large diameter piles under lateral loading for offshore wind applications. Proceedings of XVI European Conference on Soil Mechanics and Geotechnical Engineering, Edinburgh, 1255-1260.
  16. Cherchia, M. (2016). Centrifuge modeling of hybrid foundations for offshore wind turbines.
  17. El-Marassi M. Investigation of hybrid monopile-footing foundation systems subjected.
  18. to combined loading: The University of Western Ontario; 2011.
  19. Gerolymos, N., Giannakos, S., & Drosos, V. (2019). Generalised failure envelope for laterally loaded piles: Analytical formulation, numerical verification and experimental validation. Géotechnique,, 1-20. [CrossRef]
  20. TY - BOOKAU - Haigh, Stuart. PY- 2014/01/14SP - SN - 978-1-138-00152-7T1 - Fondations for offshore wind turbines. DO- 10.1201/b16200-13ER -.
  21. Heidari, M., Jahanandish, M., Naggar, H. E., & Ghahramani, A. (2014). Nonlinear cyclic behavior of laterally loaded pile in cohesive soil. Canadian Geotechnical Journal, 51(2), 129-143. [CrossRef]
  22. Heyer, Berry& Reese, L.C. Analysis of single piles under lateral loading. FHWA/TX-79/38+244-l. 1979.
  23. Lai, Y., Wang, L., Hong, Y., & He, B. (2020). Centrifuge modeling of the cyclic lateral behavior of large-diameter monopiles in soft clay: Effects of episodic cycling and reconsolidation. Ocean Engineering, 200, 107048–https://doi.org/10.1016/j.oceaneng.2020.107048.
  24. Lehane B, Powrie W, Doherty J. Centrifuge model tests on piled footings in clay for.
  25. offshore wind turbines. In: Proceedings of international conference in physical.
  26. modelling in geotechnics, ICPMG2010 Rotterdam: Balkema; 2010.
  27. L.J. Prendergast, D. Igoe. Examination of the reduction in natural frequency of laterally loaded piles due to strain-dependence of soil shear modulus, Ocean Engineering,Volume 258,2022,111614,ISSN00298018. [CrossRef]
  28. O'Neill, M. W., Reese, L. C., & Brown, D. A. (1987). Cyclic lateral loading of a large-scale pile group. Journal of Geotechnical Engineering, 113(11), 1326-1343. [CrossRef]
  29. Powrie, W., and Daly, M. P. (2007). “Centrifuge modeling of embedded retaining walls with stabilizing bases.” Geotechnique, 57(6), 485–497.
  30. T.P.T. Dao. Validation of PLAXIS Embedded Piles for Lateral Loading. Delft University of Technology. 2011.
  31. Wang, X., Zeng, X., Yang, X., & Li, J. (2018). Feasibility study of offshore wind turbines with hybrid monopile foundation based on centrifuge modeling. Applied Energy, 209, 127-139. [CrossRef]
  32. Wang, Z., Hong, Y., Ng, C. W. W., Wang, L. Z., Mašín, D., & He, B. (2017). Cyclic lateral response and failure mechanisms of semi-rigid pile in soft clay: Centrifuge tests and numerical modelling. Canadian Geotechnical Journal, 54(6), 806-824. [CrossRef]
  33. Zhang, G. (2017). A centrifuge study of the seismic response of pile–raft systems embedded in soft clay. Géotechnique, 67(6), 479–490. [CrossRef]
  34. Zhu, B., Zhu, Z., Li, T., Liu, J., & Liu, Y. (2017). Field Tests of Offshore Driven Piles Subjected to Lateral Monotonic and Cyclic Loads in Soft Clay. Journal of Waterway, Port, Coastal, and Ocean Engineering, 143(5), 5017003–. [CrossRef]
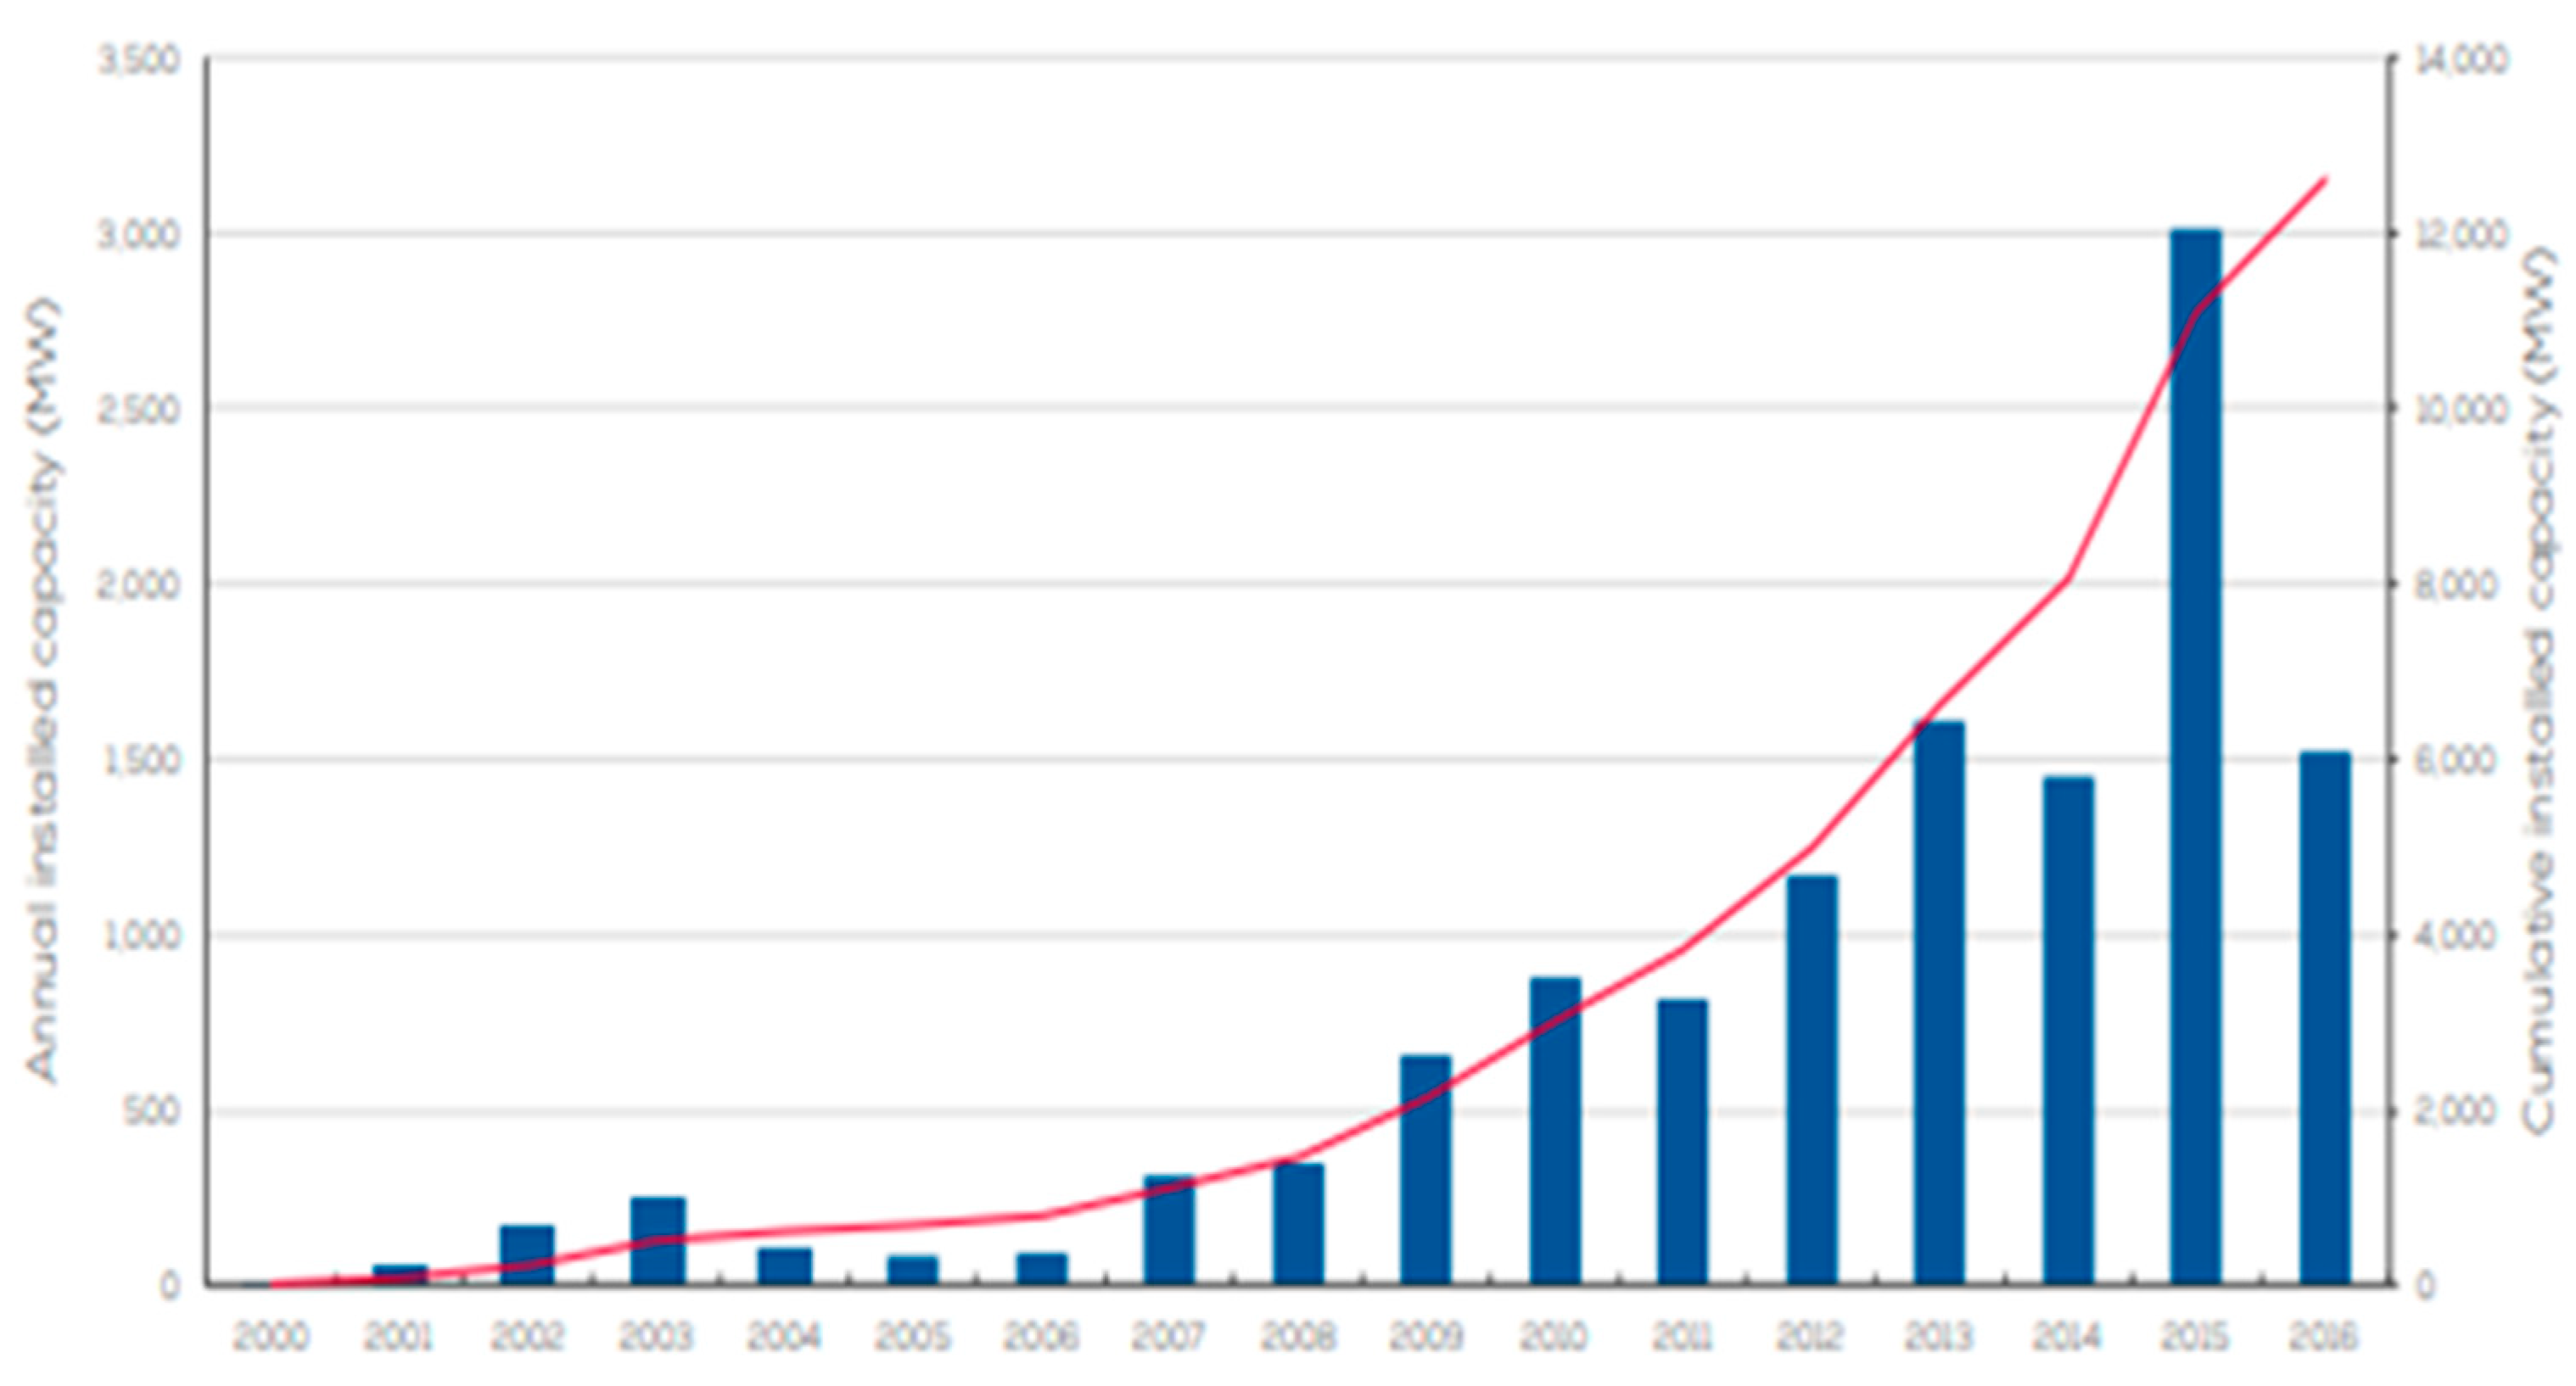
Figure 1. Capacity of wind farms installed in Europe (EWE, 2017).
Preprints 83394 g001
Figure 2. Available foundation options for offshore wind turbines (a) GBF (b) monopile (c) suction caisson (d) tripod/tetrapod piles (e) tripod/tetrapod suction caissons (f) multiple foundation options (h) guys with anchors (Byrne, 2013).
Preprints 83394 g002
Figure 3. Developed mesh and location of lateral point load.
Preprints 83394 g003
Figure 4. Cross section showing developed mesh.
Preprints 83394 g004
Figure 5. Load displacement curve using Hs undrained A parameters.
Preprints 83394 g005
Figure 7. Boundary conditions varied in convergence analyses.
Preprints 83394 g007
Figure 8. Sample of convergence analysis results.
Preprints 83394 g008
Figure 9. The considered monopile foundation system geometric notations (Not to scale).
Preprints 83394 g009
Figure 10. load displacement curves of different lengths monopiles in a) Clay1, b) Clay6.
Preprints 83394 g010
Figure 11. Effects of relative rigidity on normalized ultimate lateral load.
Preprints 83394 g011
Figure 12. Normalized ultimate lateral capacity versus L/D for different soil profiles considered .
Preprints 83394 g012
Figure 13. Bending moment versus normalized depth for MP in soft soil (su=4.2 kPa).
Preprints 83394 g013
Figure 14. Bending moment versus normalized depth for stiff soil (clay 6) profile.
Preprints 83394 g014
Figure 15. Comparison of predicted and calculated utimate capacity.
Preprints 83394 g015
Table 1. Soil properties and model parameters of case study (Zhu et al., 2017) used in validation.
Parameter Clay1
c' 15
Ψ 0
φ' 8
p p o p ' , k P a 15
p r e f ' , k P a 41
eini. 4.23
ɣ, kN/m3 17.9
E o e d r e f , k P a 1406
E 50 r e f , k P a 1758
E u r r e f , k P a 5000
vur 0.2
M 0.6
PI, % 30
Ko,NC 0.86
Rf 0.9
Depth, m 0-5
Type of analysis Undrained A
Table 2. Properties of considered clay profiles.
Parameter Clay1 Clay2 Clay3 Clay4 Clay5 Clay6
c' 4.23 24 44 87 170 354
Ψ 0 0 0 0 0 0
θ' 8 10 10 10 10 10
p p o p ' , k P a 13 51 83 140 240 414
p r e f ' , k P a 41 100 100 100 100 100
e(ini). 4.209 4.209 4.209 4.209 4.209 4.209
ɣ, kN/m3 17.9 17.9 17.9 17.9 17.9 17.9
E o e d r e f , k P a 1406 3461 14747 29040 56628 113134
E 50 r e f , k P a 1758 4000 18439 36310 70805 141457
E u r r e f , k P a 5000 10000 52444 103271 201380 402326
vur 0.2 0.2 0.2 0.2 0.2 0.2
M 0.6 0.6 0.6 0.6 0.6 0.6
PI 30 30 30 30 30 30
Ko, NC 0.54 0.54 0.54 0.54 0.54 0.54
Depth, m 0-25 0-26 0-27 0-28 0-29 0-30
Rf 0.9 0.9 0.9 0.9 0.9 0.9
Table 3. Range of parameter analyses.
L, m L/D/(Lp/W) Foundation system e/Dt V, kN
20 3.33 Monopile 6.83 Own weight1
30 5 6.83
40 6.67 6.83
50 8.33 6.83
60 10 6.83
70 11.67 6.83
80 13.33 6.83
L: Depth of embedment; D: Pile’s diameter; e: eccentricity of applied loads(m); Dt: Tower’s diameter; 1: uniformly distributed.
Disclaimer/Publisher’s Note: The statements, opinions and data contained in all publications are solely those of the individual author(s) and contributor(s) and not of MDPI and/or the editor(s). MDPI and/or the editor(s) disclaim responsibility for any injury to people or property resulting from any ideas, methods, instructions or products referred to in the content.
Copyright: This open access article is published under a Creative Commons CC BY 4.0 license, which permit the free download, distribution, and reuse, provided that the author and preprint are cited in any reuse.
Prerpints.org logo

Preprints.org is a free preprint server supported by MDPI in Basel, Switzerland.

Subscribe

© 2024 MDPI (Basel, Switzerland) unless otherwise stated