1. Introduction
Canopy gaps formed by lightning strikes are believed to be the main factor in regeneration of mangrove swamp forest in the tropical and temperate regions [1, 2, 3, 4, 5, 6, 7, 8, 9, 10, 11]. In addition, storms with the presence of lightning are the normal phenomena in both the tropical and subtropical regions with highest frequency in the tropics [
12]. For example, in Everglades National Park, Florida, United States the frequency of lightning strikes occurred five to nine times per km per year. [13, 14]. The minimum gap area defined is 10 km2 [
15] or the distance between the surrounding trees and the minimum width of 5 m [
1]. Lightning strikes not only cause canopy tree mortality in mangrove forests, it has a similar effects towards other tropical forest sites [
16,
17].
Mangrove swamp forests are prone to various kinds of disturbances either naturally or due to anthropogenic activities. Normally the attentions are given to large-scale disturbances such as those due to tropical typhoons and whirl winds [7, 18, 19, 20, 21]. Nevertheless, most mangrove swamp forests in tropical areas formed canopy gaps are of small-scale such as those caused by local lightning strikes, pest infestations and either due to broken trunks or branches after storms [2, 4, 5, 6, 22, 23, 24]. Both size and shapes of canopy gaps are the drivers of change for the ground flora and soil. The physical microenvironment is mainly affected by the size of canopy gaps. However, the accessibility of light especially at the centre of gaps are affected by the position of sun, direction of light and gap diameter including the height of canopy [
25]. Thus, [
26] suggest that the resistance of mangrove canopy cover varied according to disturbances regime and vegetation characteristic, but its resilience depends on the extend of canopy damage as the canopy recovery rate is consistent globally.
Canopy opening is the initiator of regeneration process of the disturbed forest where the propagules and the saplings are able to grow. This is affected by the availability of sunlight absorbed by the photoreceptors that changed the cell metabolism and subsequently induced growth and development of mangrove plants [
27]. The physical factors such as humidity, temperature, evapotranspiration, light and soil physical characteristics (salinity, temperature, and nutrients) would be modified with the formation of canopy gaps [5, 6, 28]. Additionally, both air and soil temperatures are affected by the period of light distribution and illumination to the forest floor [
25]. These changes would affect the microenvironment and soil characteristics in the canopy gaps. Thus, resulted in changes of carbon stocks storage [
29].
The objectives of this study are to assess the canopy gaps physical characteristics (size, form, direction), to assess the changes in soil physical characteristics and microenvionment in and around the canopy gaps.
2. Materials and Methods
2.1. Plot design
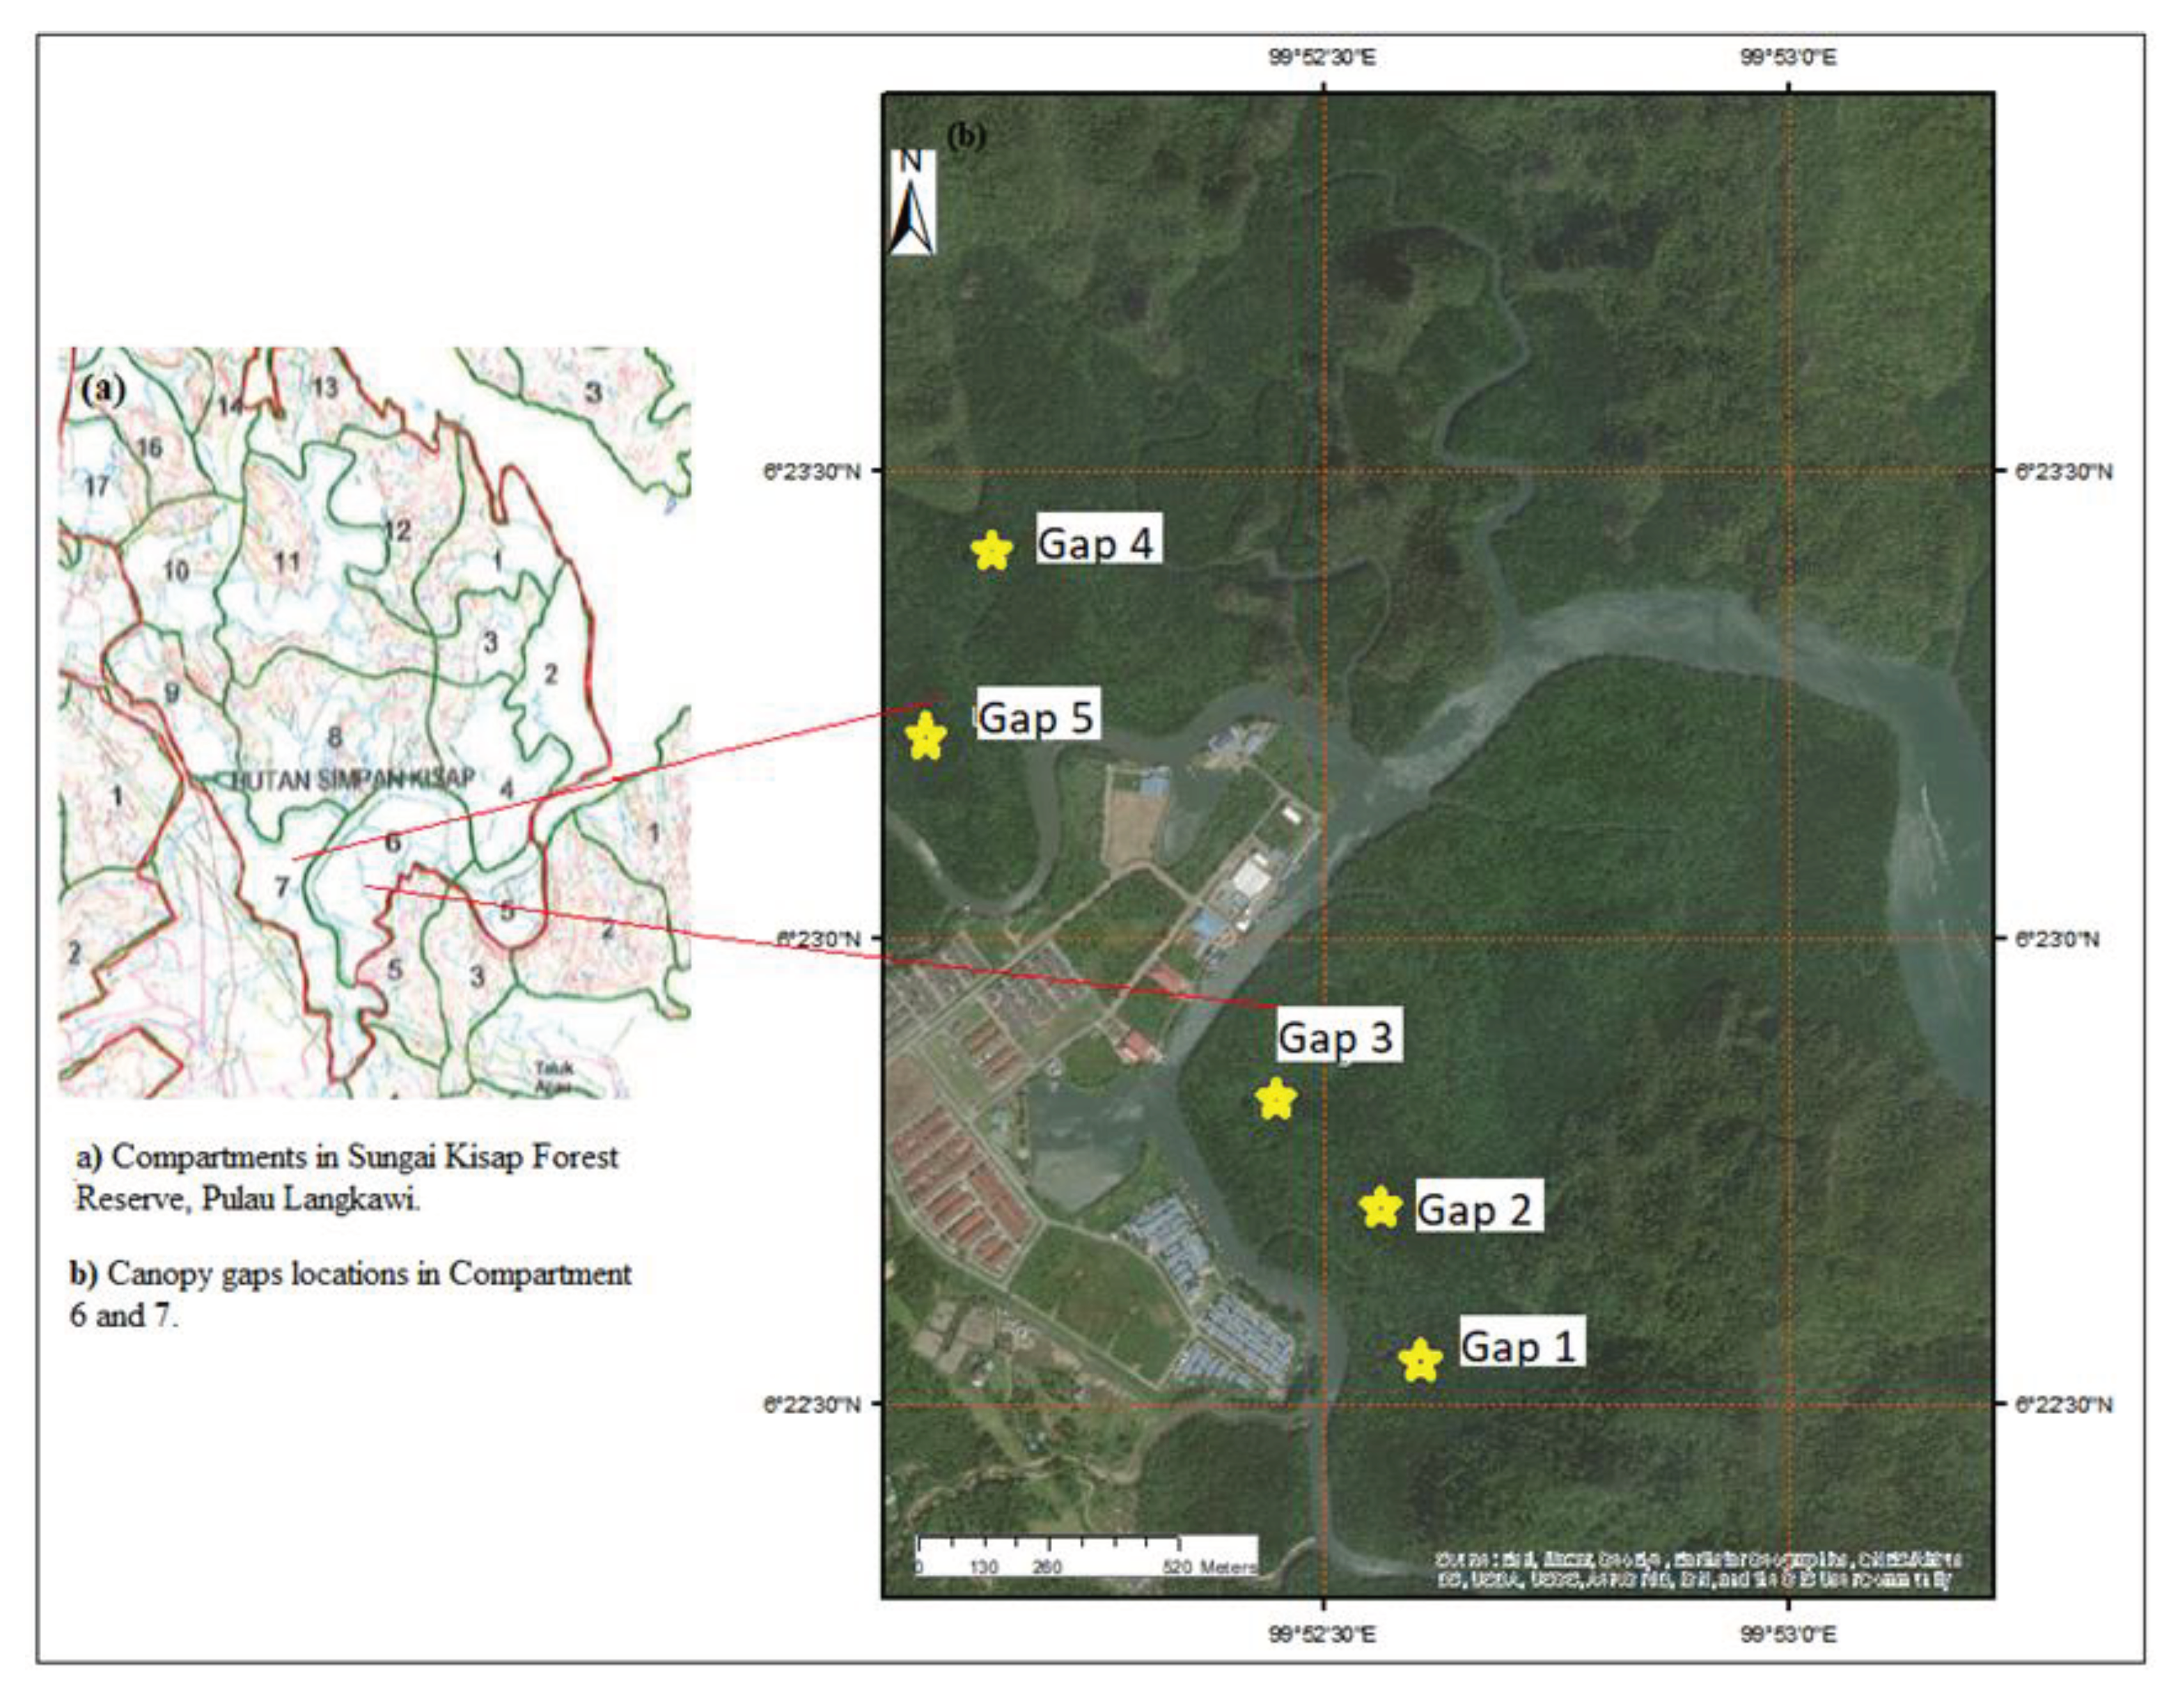
Five canopy gaps were selected as studied plots in Compartments 6 and 7 of Sungai Kisap Forest Reserve, Pulau Langkawi, Kedah. Selection of the areas is based on canopy gaps formed naturally (lightning strikes). These natural gaps are selected after observing the dynamics of the area affected by anthropogenic activities. Other factors considered are the accessibility of tha gap areas. The establishement of the plots was carried out in October 2017. The preliminary selection was done using Google Earth Pro version 7.3, where the canopy gaps are identified with their coordinates.
Plot construction is made using poles and raphia to fix the boundary of the area including marking the spots for observation. Those plots were marked as Gap 1 (G1), Gap 2 (G2), Gap 3 (G3), Gap 4 (G4), and Gap 5 (G5). The geopositions are:
G1 (N 6° 22’ 33.23”, E 99° 52’ 33.66”), G2 (N 6° 22’ 43.03”, E 99° 52’ 31.33”), and G3 (N 6° 22’ 49.53”, E 99° 52’ 24.4”) are in Compartment 6, whereas G4 (N 6° 23’ 24.46”, E 99° 52’ 6.38”) and G5 (N 6° 23’ 18.69”, E 99° 52’ 3.88”) are in Compartment 7 (
Figure 1).
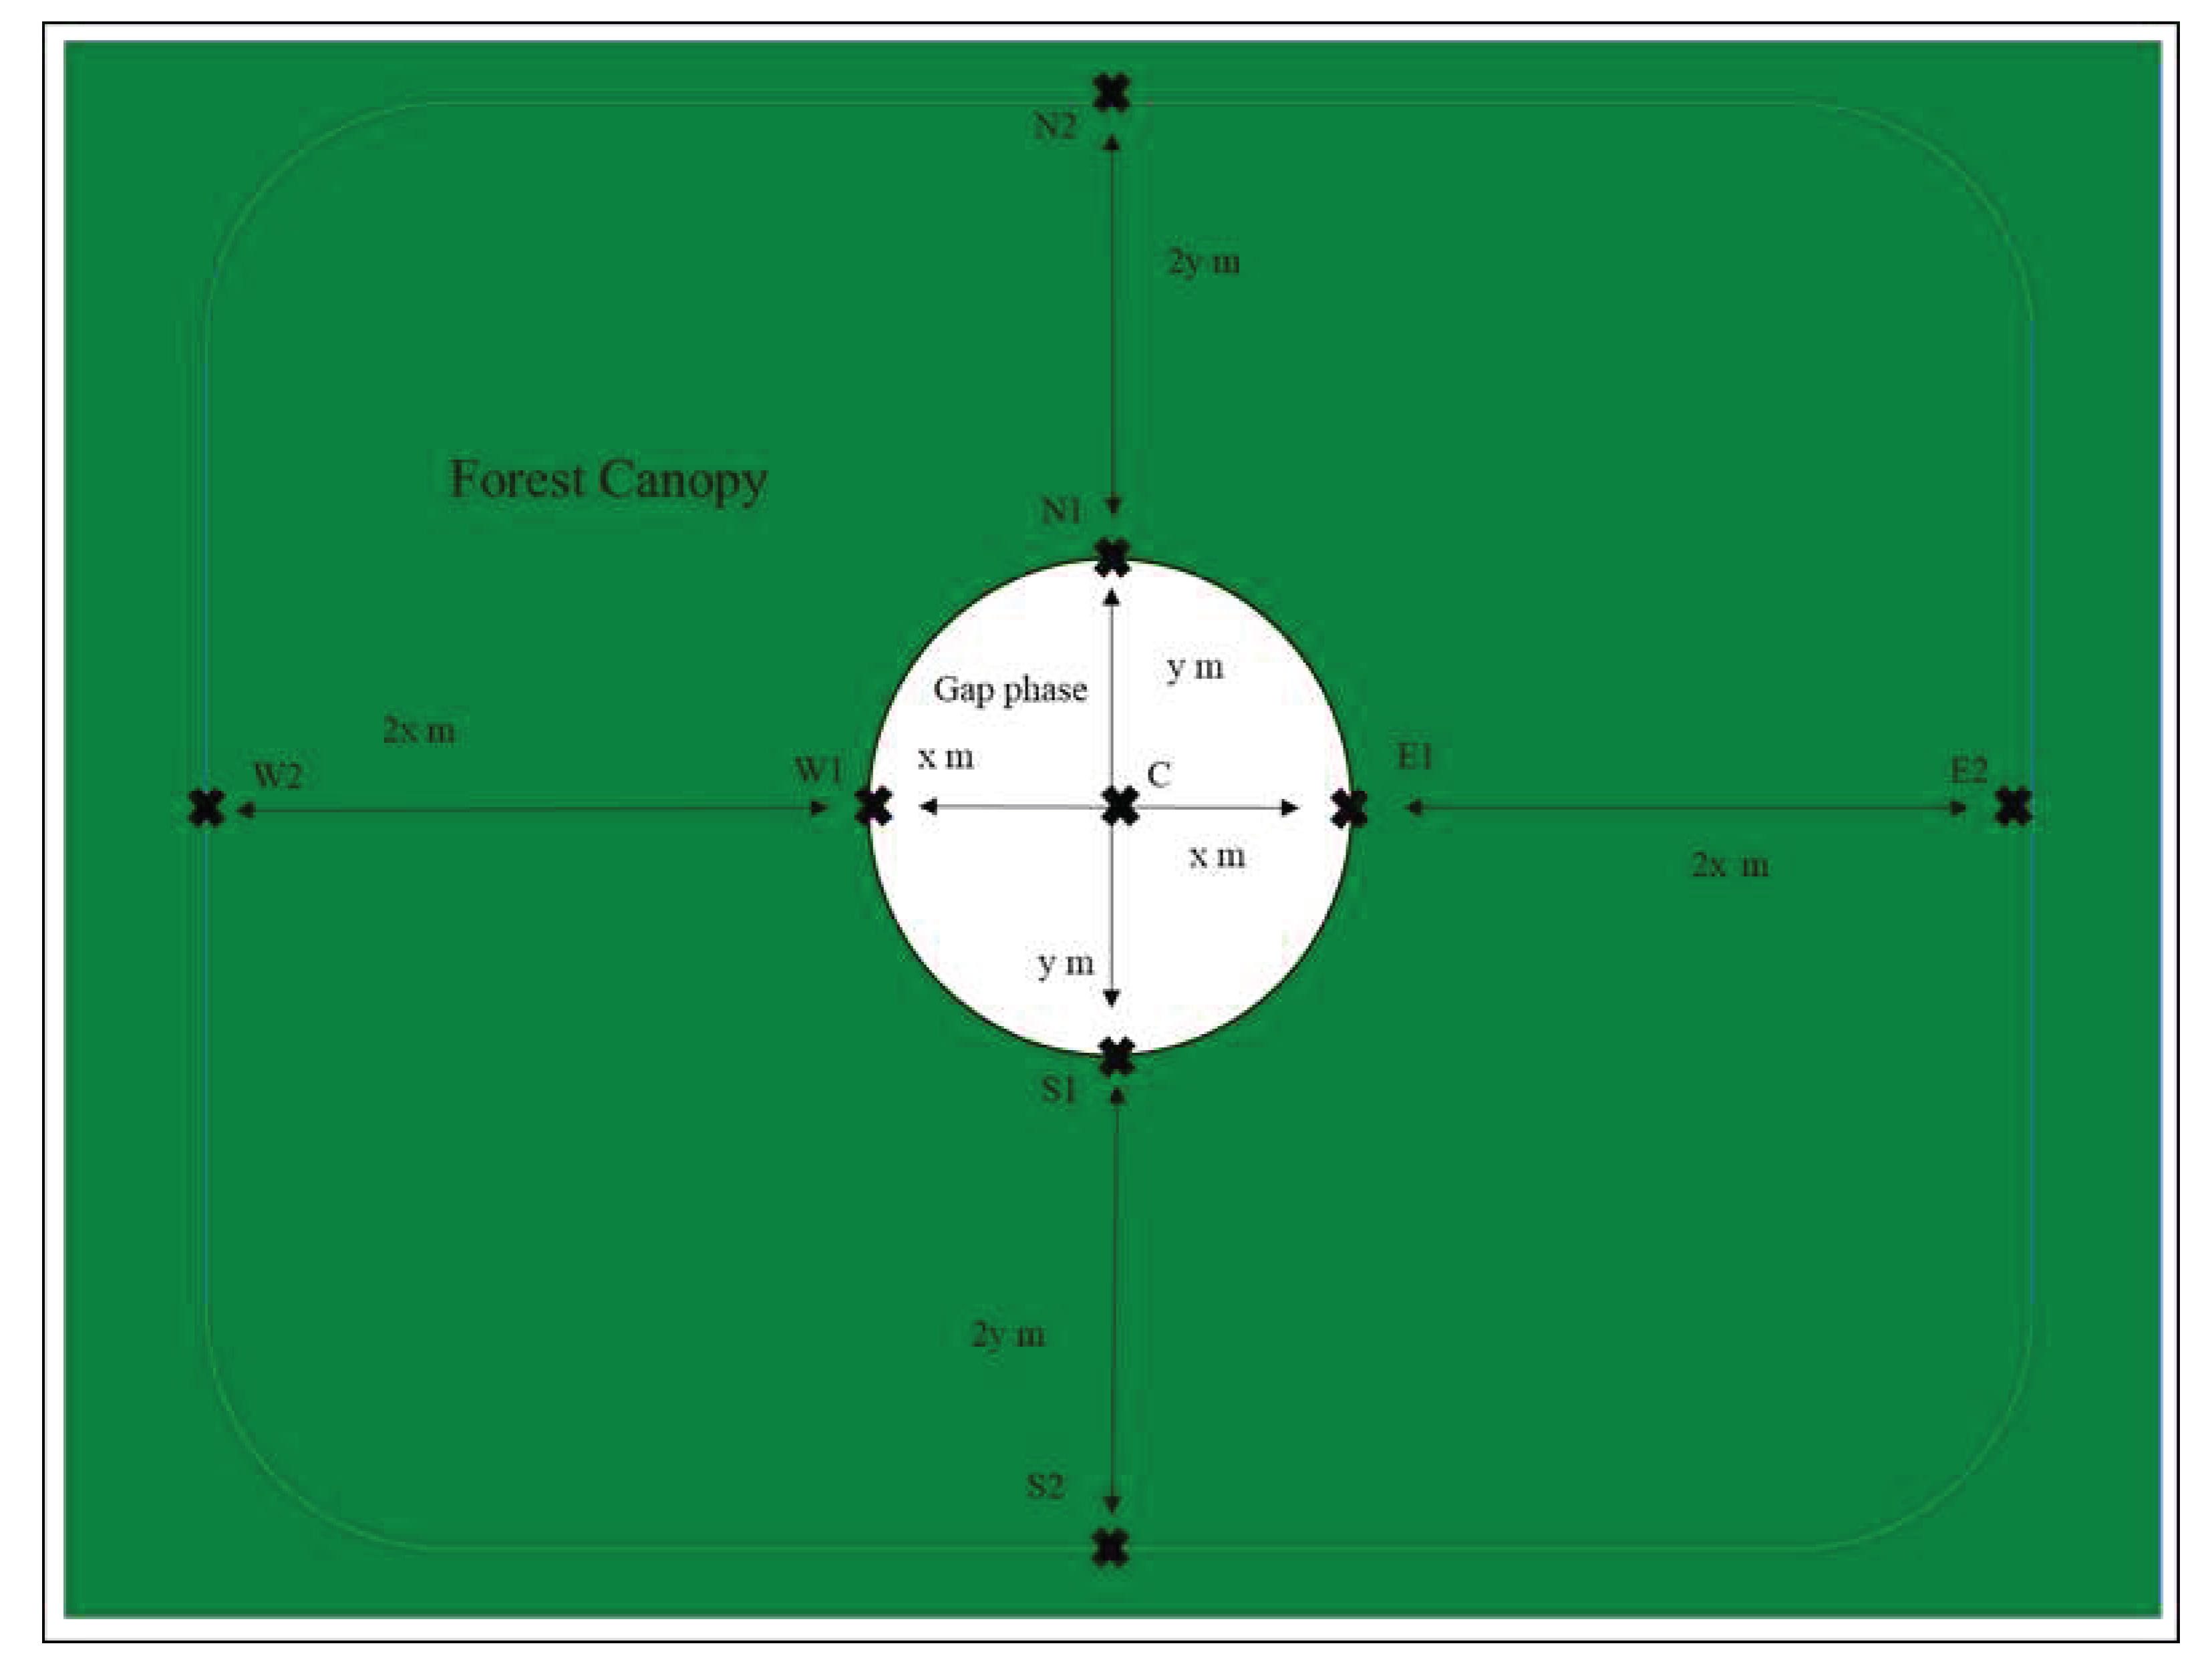
Figure 2 shows the design of the plots established to measure the gap size and determination of the canopy gaps and measurement of soil physical characteristics including measuring light intensity within and around the canopy gaps. Nine areas were marked as spots for the respective measurements. The central spot is marked as P. The north edge of gap is marked as N1, south edge of gap as S1, the east edge as E1, and the west edge as W1. Within the canopy there are four spots marked as (N2), in the north, (S2), in the south (E2) in the east and (W2) in the west.
2.2. Measurement of gap size
In the field the gap phases accessed were marked at the centre of the gap, north, south, east and west using the portable Global Positioning System (GPS). Length and width of each gap were measured to determine the size and shape of the respective gaps according to [
30]. The dimensions measured were from above the canopy opening. For gap size measurement and determination of gap shape the distance from N1 to S1 (y1 + y2) and E1 to W1 (x1 + x2) were taken.
The gap size formula is calculated based on the area size of the elongated form (elliptical);
where:
Gap shapes are of two main types (circular and elongated) either in the mangrove swamp forest or terrestrial forest [31, 32]. For the determination of the gap shape, the ratio of the distance from north edge (N1) to the south edge (S1) (a) from the distance of east edge (E1) to the west edge (W1) (b) gives the concentric index value for ther respective gaps as follows;
where:
The value of concentric Index for the gap area is categorised as;
1 = completely circular;
0.9-1.1 = circular;
0.7-0.9 = semi-circular towards east-west;
1.1-1.3 = semi-circular towards north-south;
<0.7 = elongated towards east-west;
>1.3 = elongated towards north-south.
2.3. Measurement of soil physical characteristics
Measurement for the percentage of canopy opening and the physical characteristics such as temperature, pH and salinity of water were taken to assess the microenvironment of the canopy including its relation of these parameters with the effect of canopy opening. A total of nine spots identified for the measurement of these parameters were made by constructing two transects crossing the N to S edges and E to W edges of the gap. The construction of transects began from gap edges to beneath the canopy beginning from N1 to U2, S1 to S2, E1 to E2, and W1 to W2 with the distance of 2y1, 2y2, 2x1, and 2x2. This distance is equivalent to the gap diameter (
Figure 2).
For the measurement of percentage of canopy gap opening, the hemispheric images were taken using fish-eye lens with Nikon DSLR D90 camera for all the nine spots. The hemispheric images taken by directing the lens to the canopy at 0.5 meter distance from the ground at 0800 hr until 1500 hr. The photographic images were analysed using ForestCrown, and the percentage of canopy openings were obtained.
From the same spots within the plots parameters such as temperature, pH, and salinity of soil pores were obtained by digging holes of 30 cm during low tide using metal shovel. After 15 to 20 mins when water from the soil pores flow into the the pits, probe YSI is dipped into the hole at 15 cm. Readings were recorded after 2 to 3 mins.
2.4. Data Analysis
The hemispheric images obtained from all spots or studied plots were uploaded to ForestCrown software for analysis. After all the images have been uploaded, images taken by fish-eye lenses were selected using elliptical selection tool before being processed. All images selected were digitalised to form the boundary between tree canopy with those with cloud background. This process used square selective function or elongated selective function or both. Those images digitilised were analysed to obtain canopy opening percentage values.
Readings of temperature, pH and salinity of soil pore water were recorded at all spots or plots (gap centre, gap edge, within canopy). Mean values for all variables are obtained. Regression analysis was conducted to determine the relationship between canopy opening percentage and physical characteristics of soil pore water using Microsoft Excel.
3. Results
The five canopy gaps accessed were formed by lightning strikes.
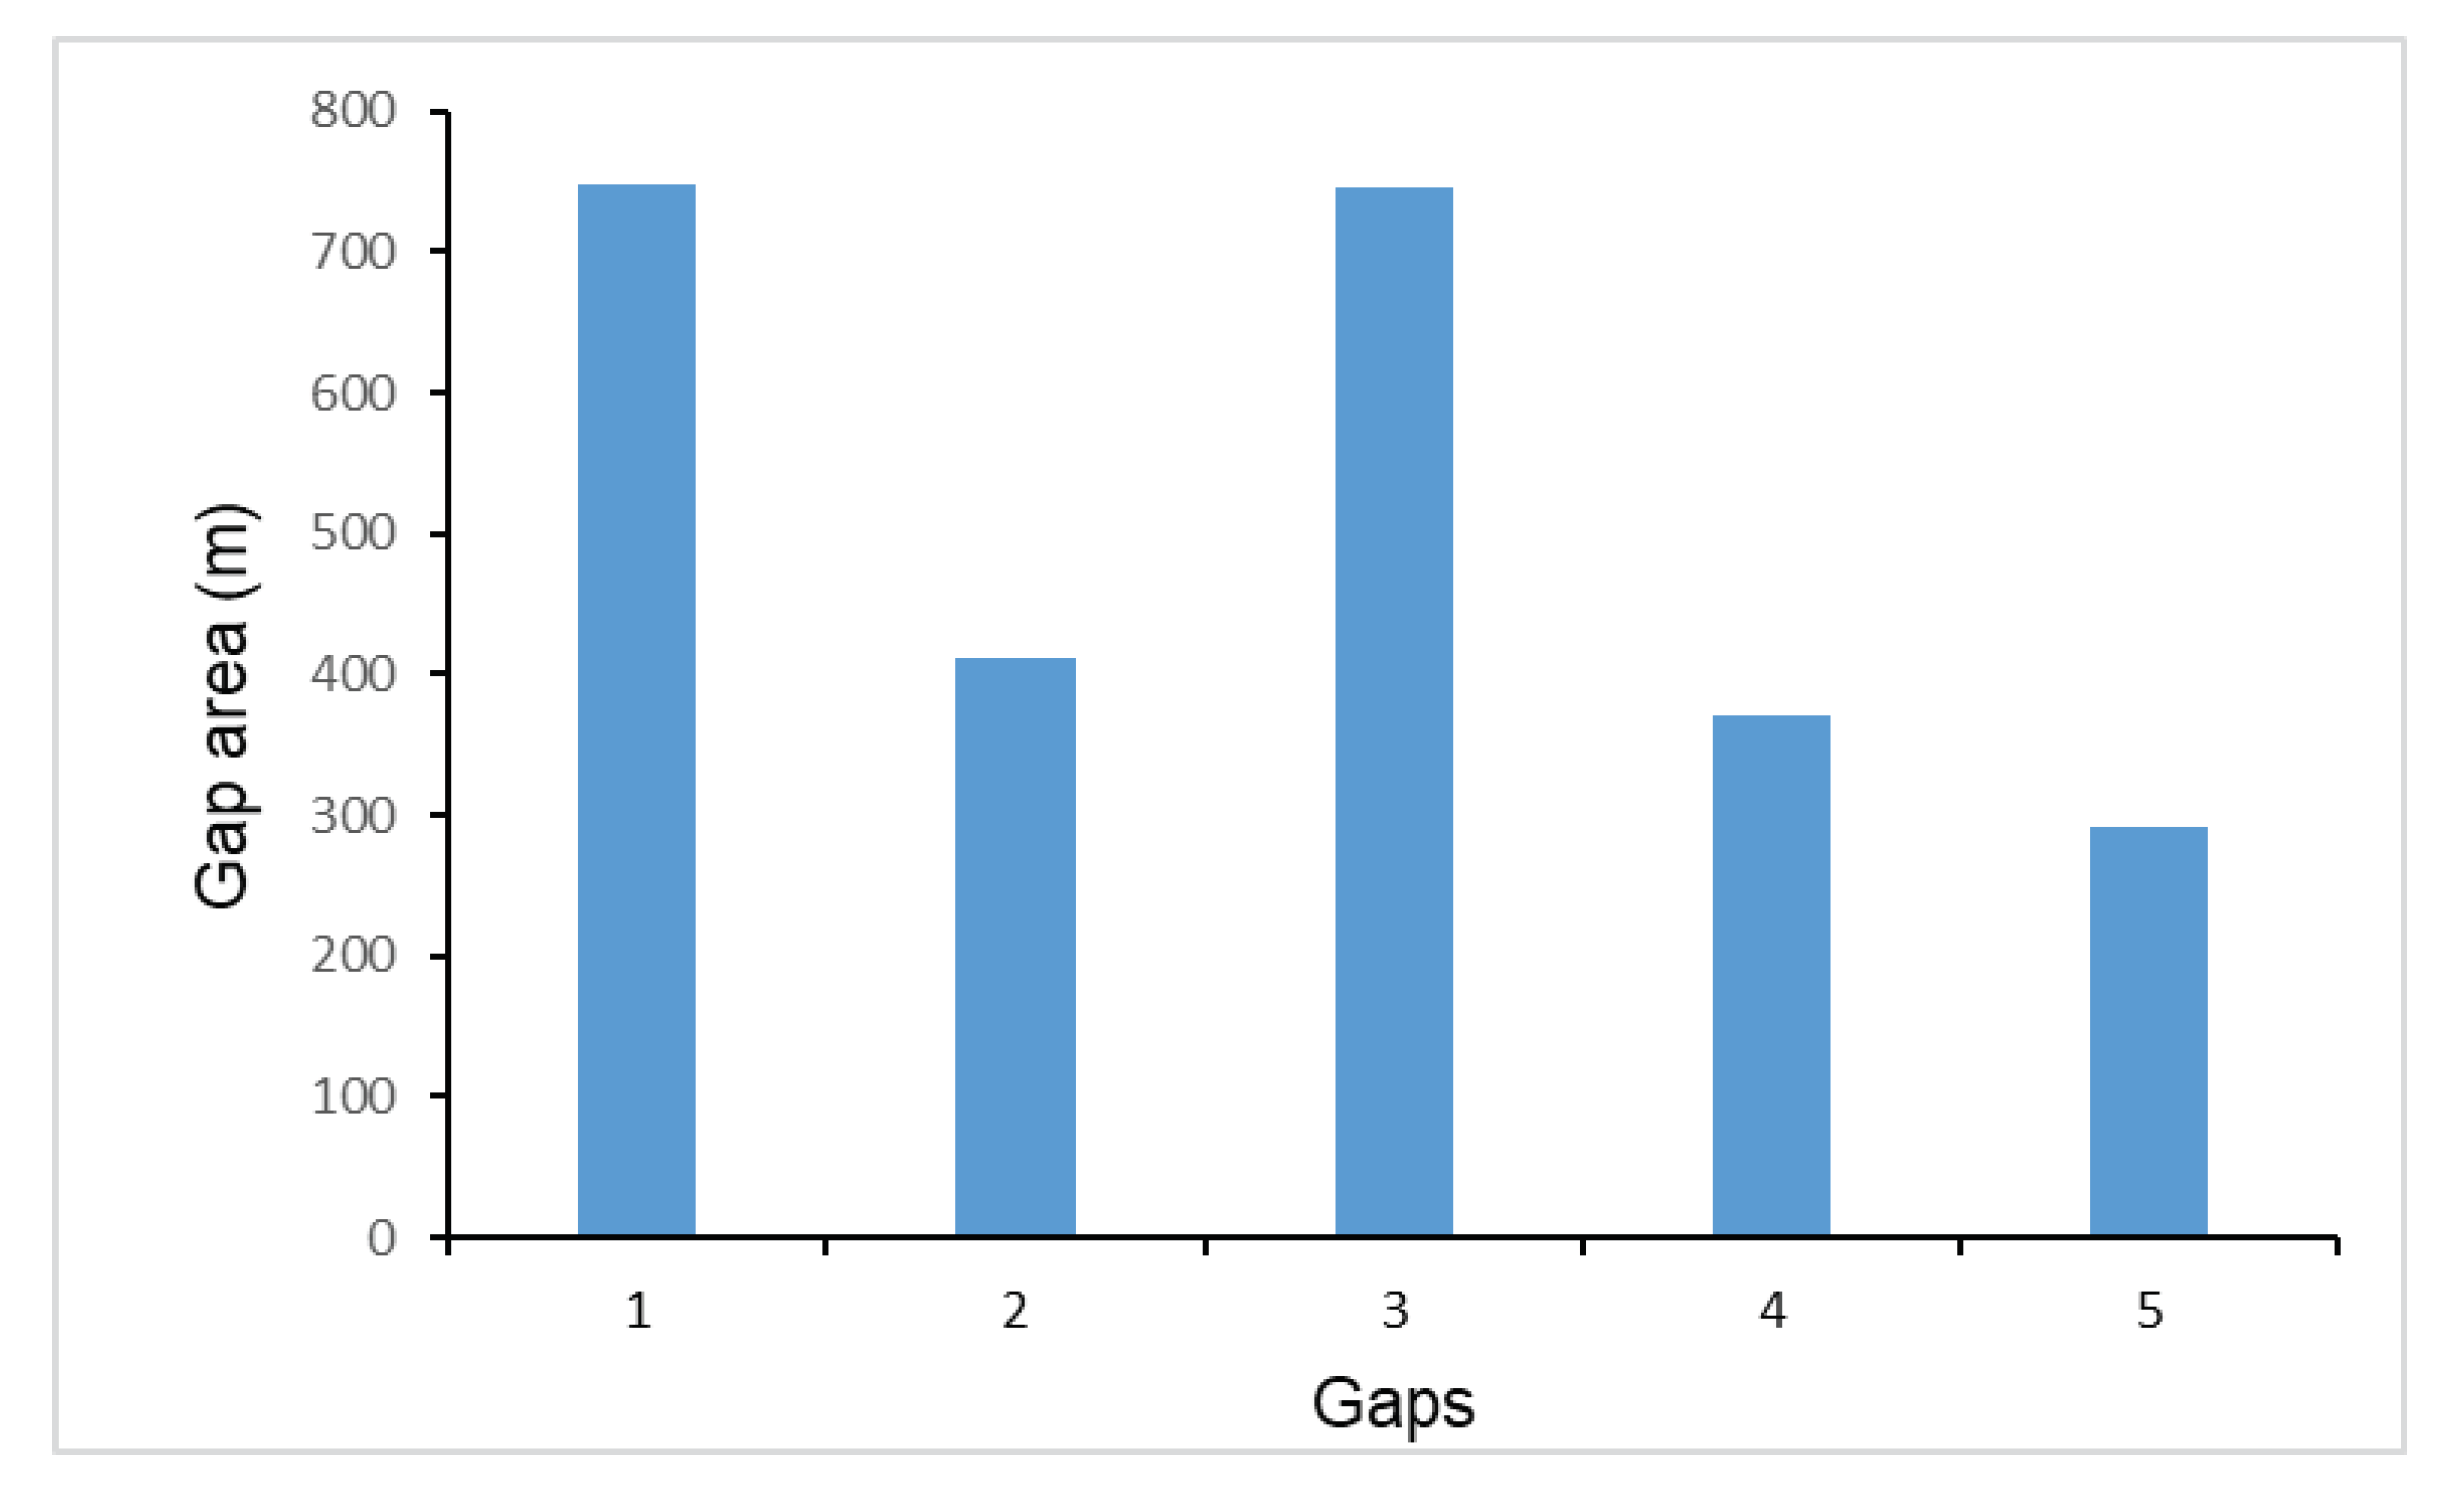
Table 1 gives all sizes and shapes that were determined. The range of gap size is between 290 m2 to 750 m2, two of them are circular, two are semi-circular towards east-west and one is elongated towards north-south. G1 is the largest (749.03 m2), G3 is almost as large as G1 (746.44 m2), next is G2 (411.20 m2), followed by G4 (370.15 m2) and the smallest is G5 (291.28 m2). However, all five gaps are categorised as large (>150 m2).
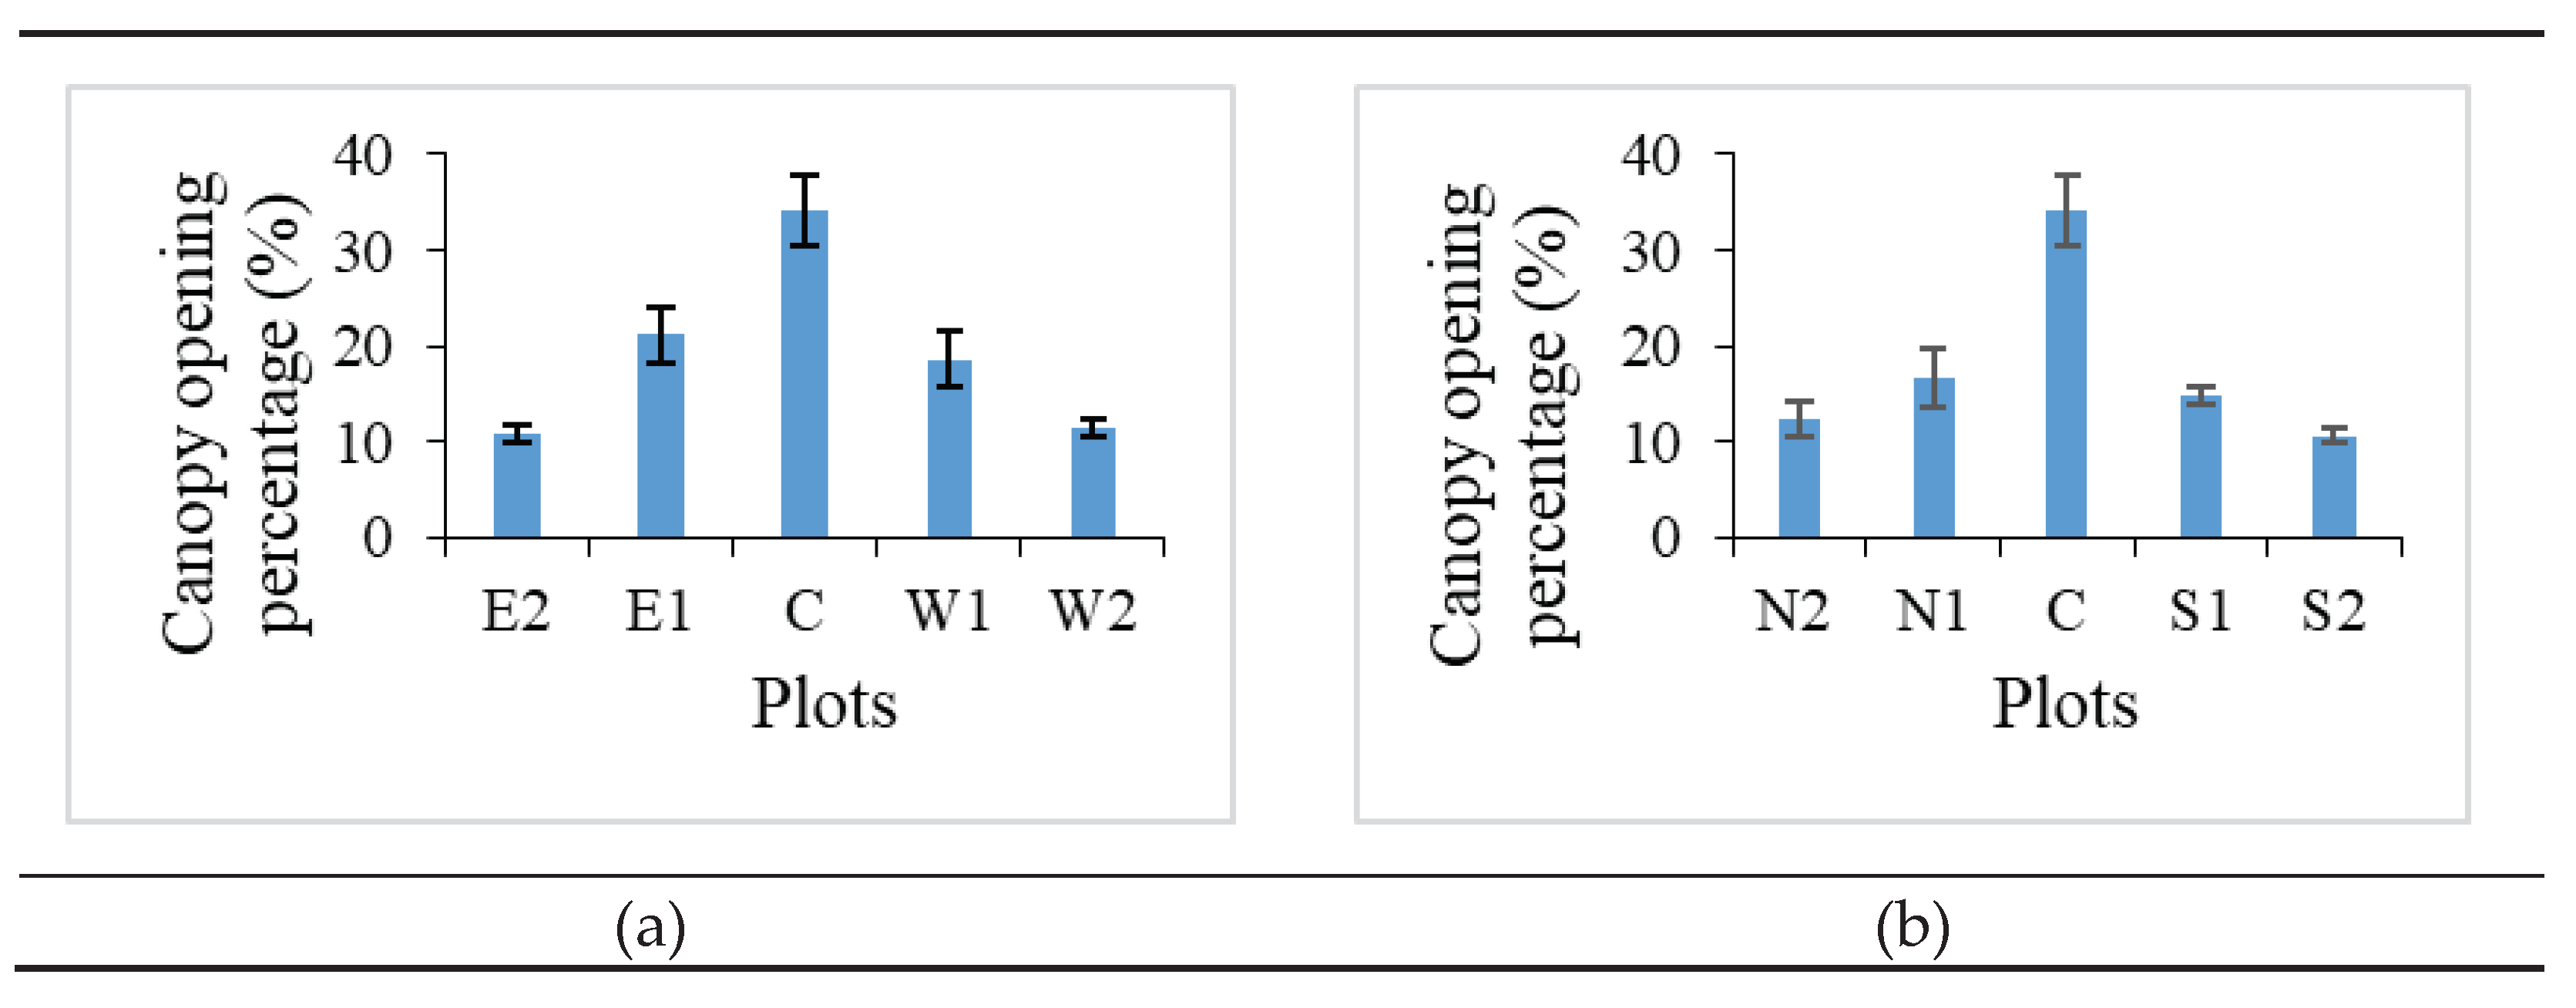
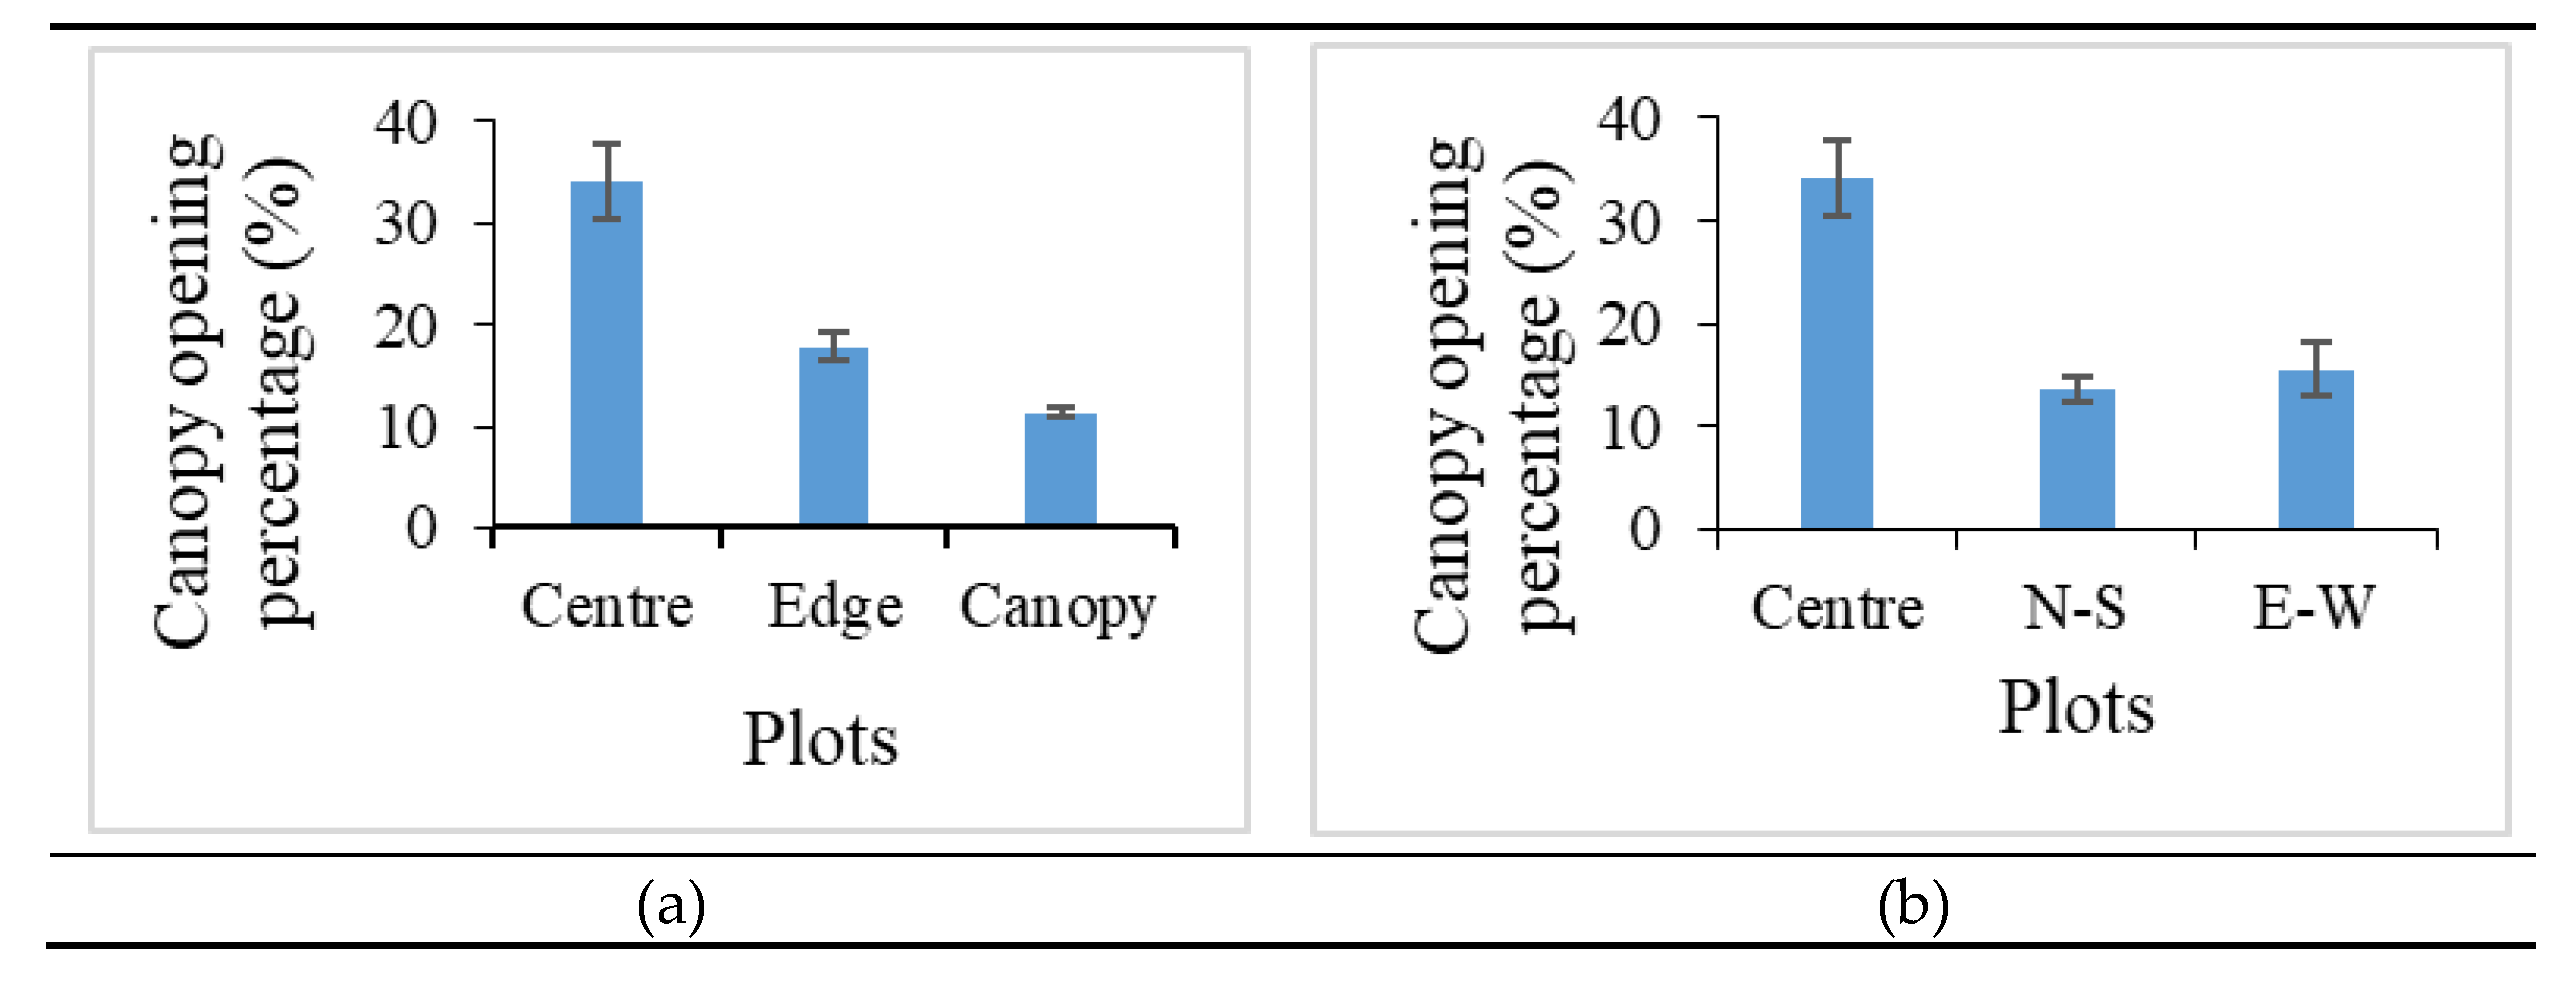
Canopy opening percentage shows that the highest values are at the centre and decreases towards the gap edges and the lowest are at in the canopy. This is due to different condition of the gaps where at the centre (C) it has the lowest canopy cover followed by gap edges (N1,S1,E1,W1) and eventually to under the canopy (N2,S2,E2,W2).
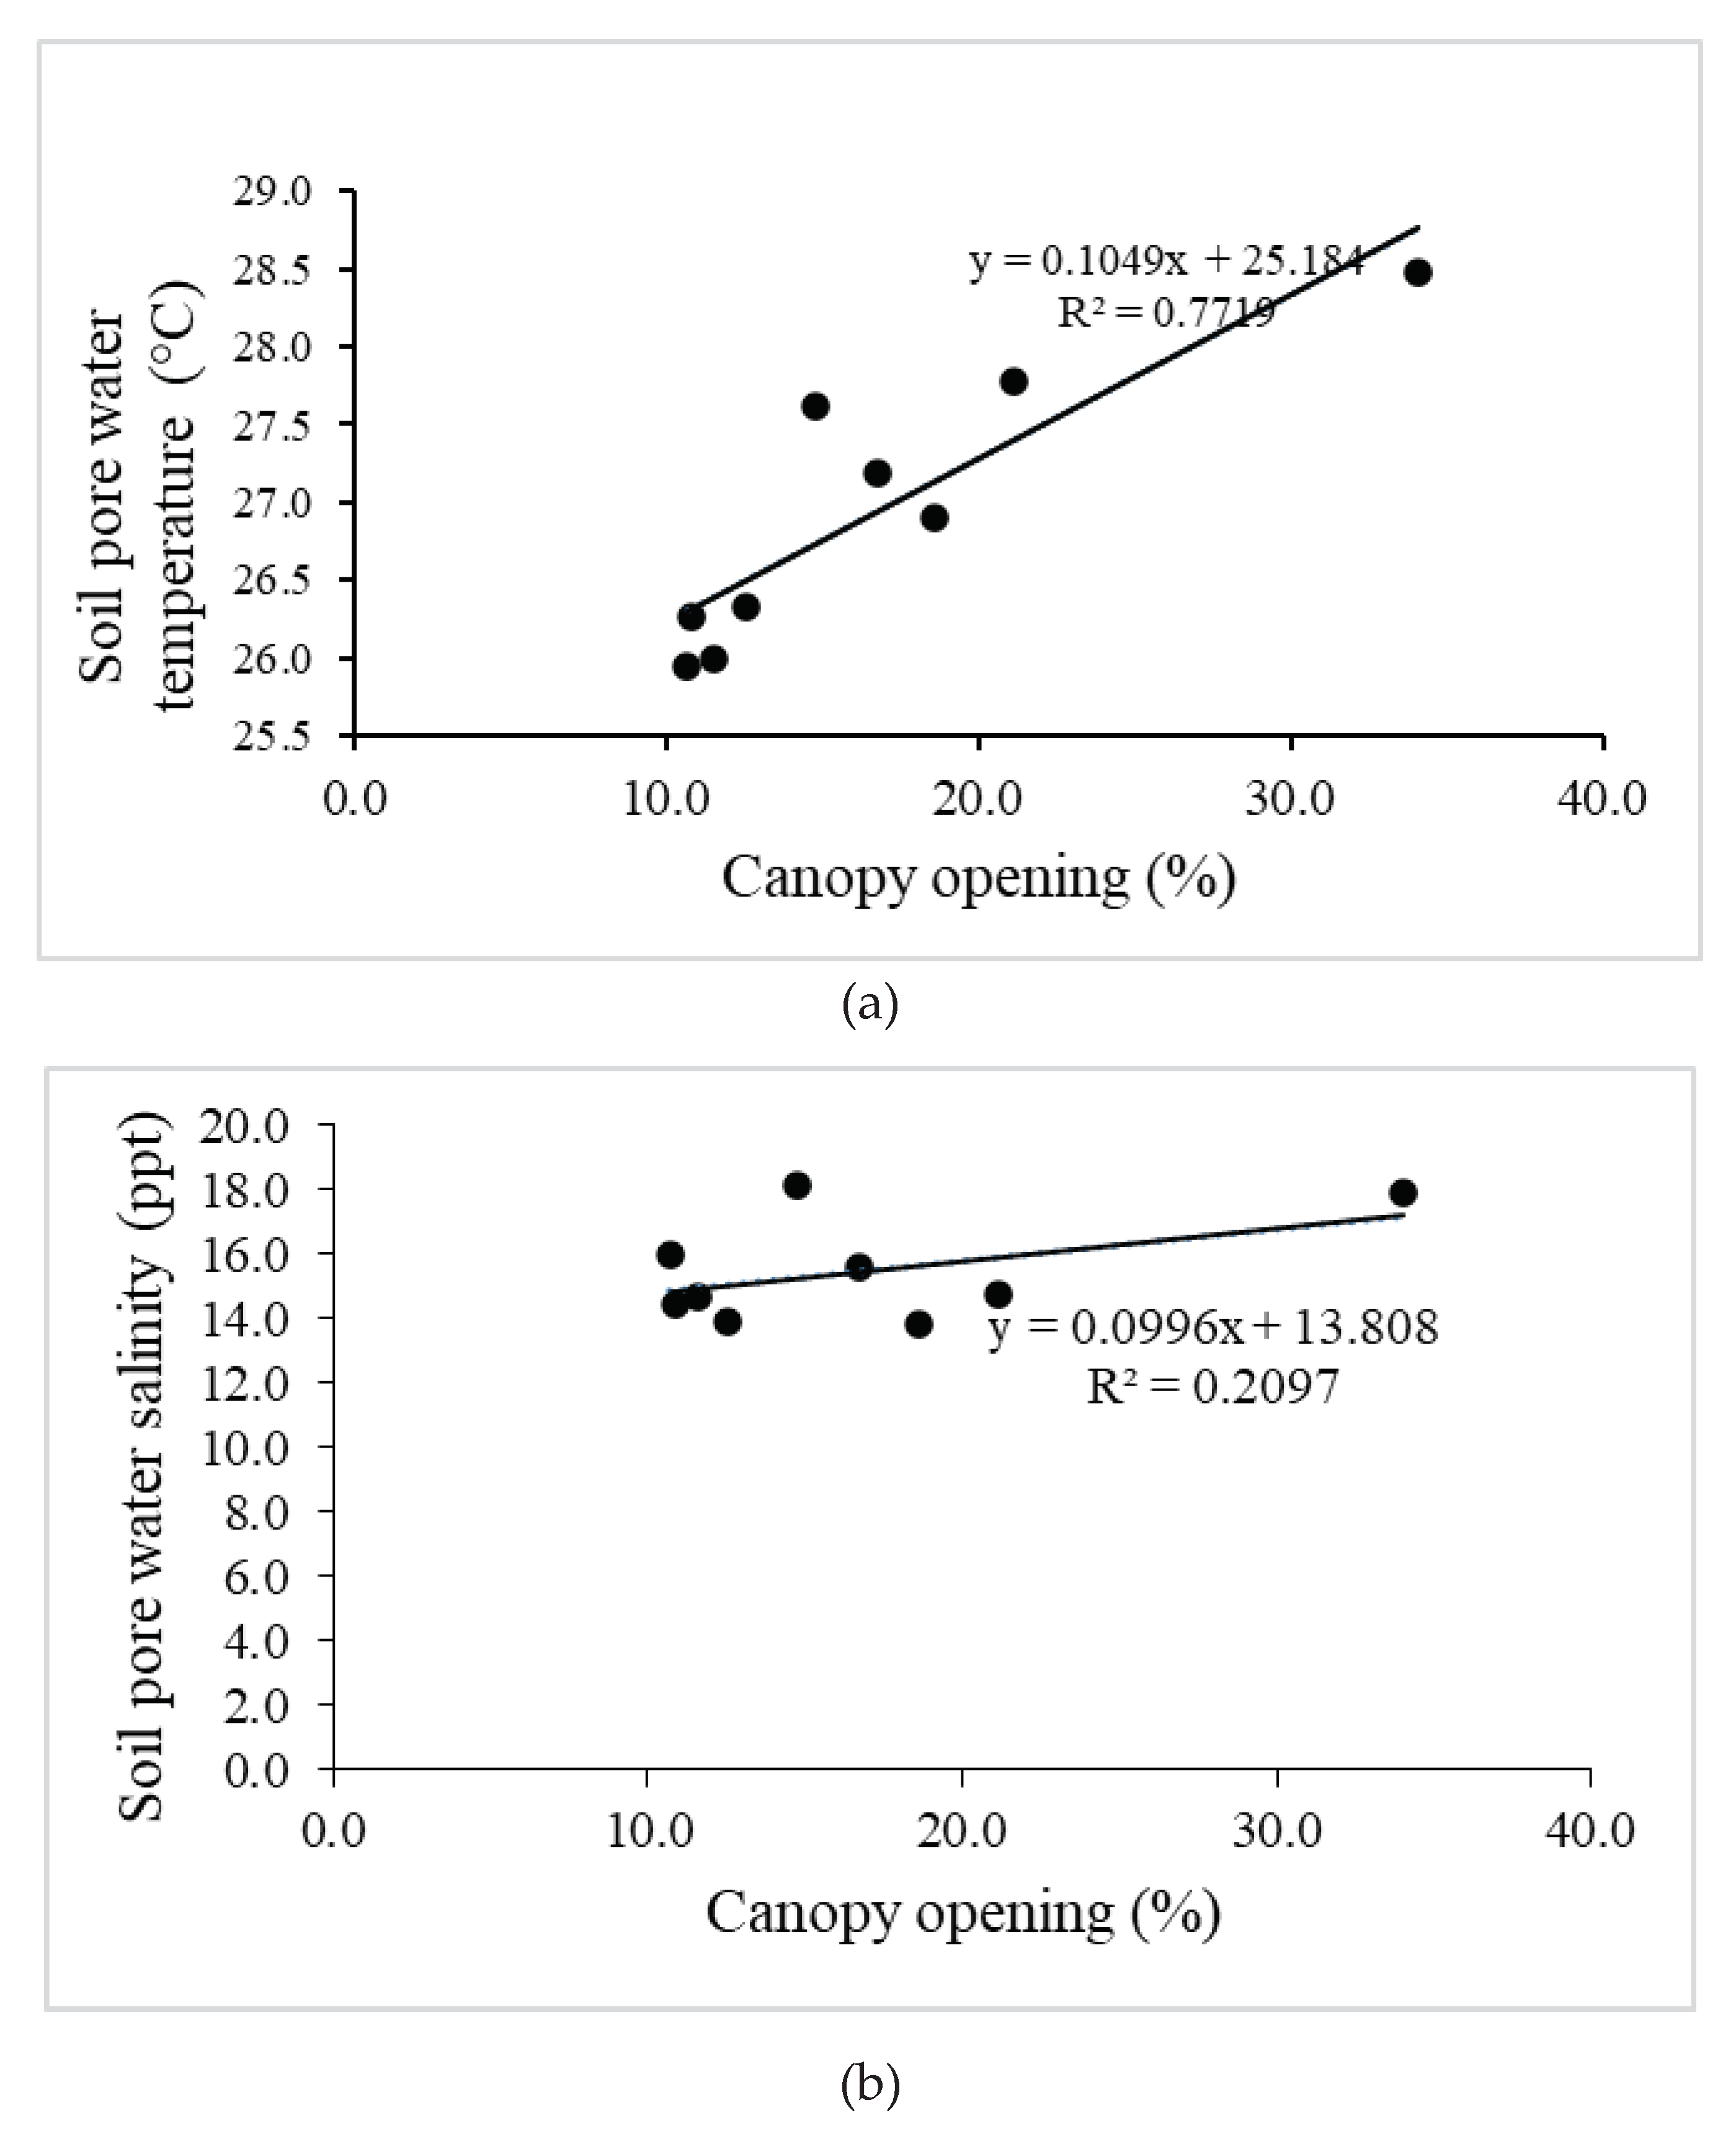
Regression analysis between canopy opening percentage with temperature of soil pore water shows a significant effect at r2 = 0.77 value (
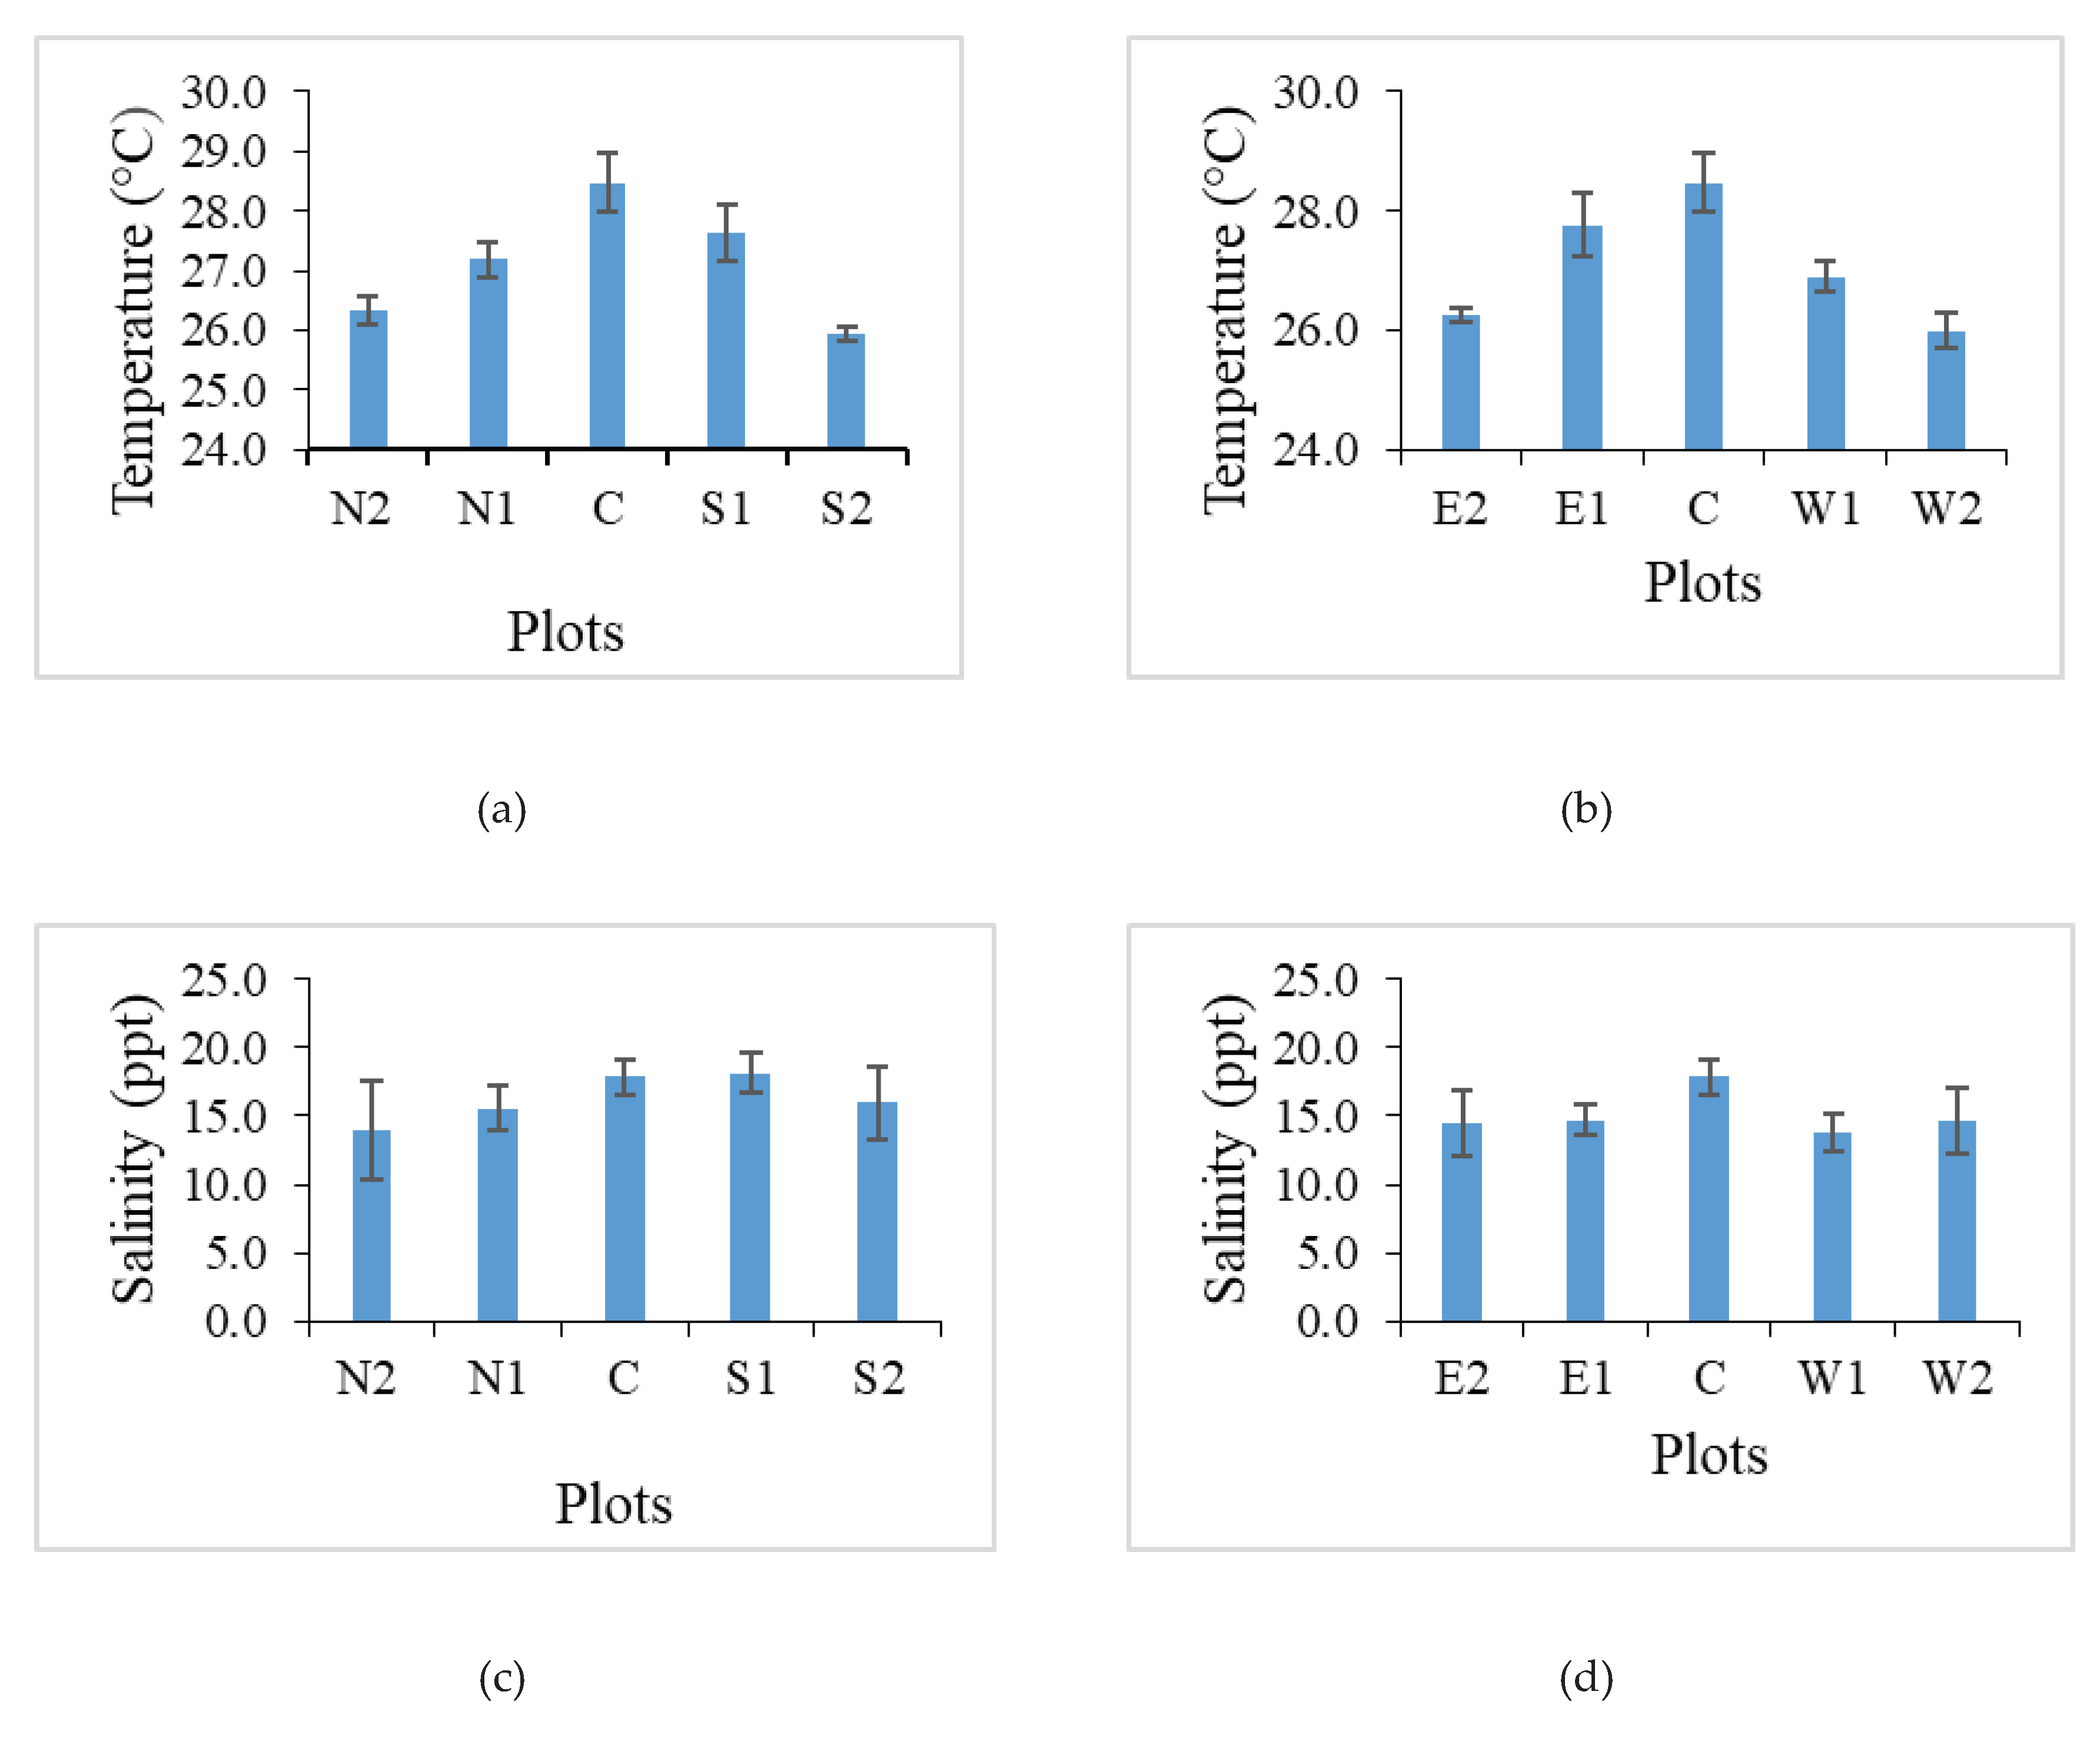
Figure 5 (a)). The mean of soil pore water temperature recorded at every studied plot is in the range of 25-29 °C and have different readings. The higher relative temperature was recorded at the centre of gap, decreases to the edges and the lowest were recorded under the canopy (
Figure 6).
Mean of salinity of soil pore water is in the range of 13-19 ppt in the individual plot (
Table 2). However, the value of salinity does not show significant differences between locations and plots (
Figure 6 (c) and (d)). Weak relationship (r2= 0.21) between canopy opening percentage is also shown in
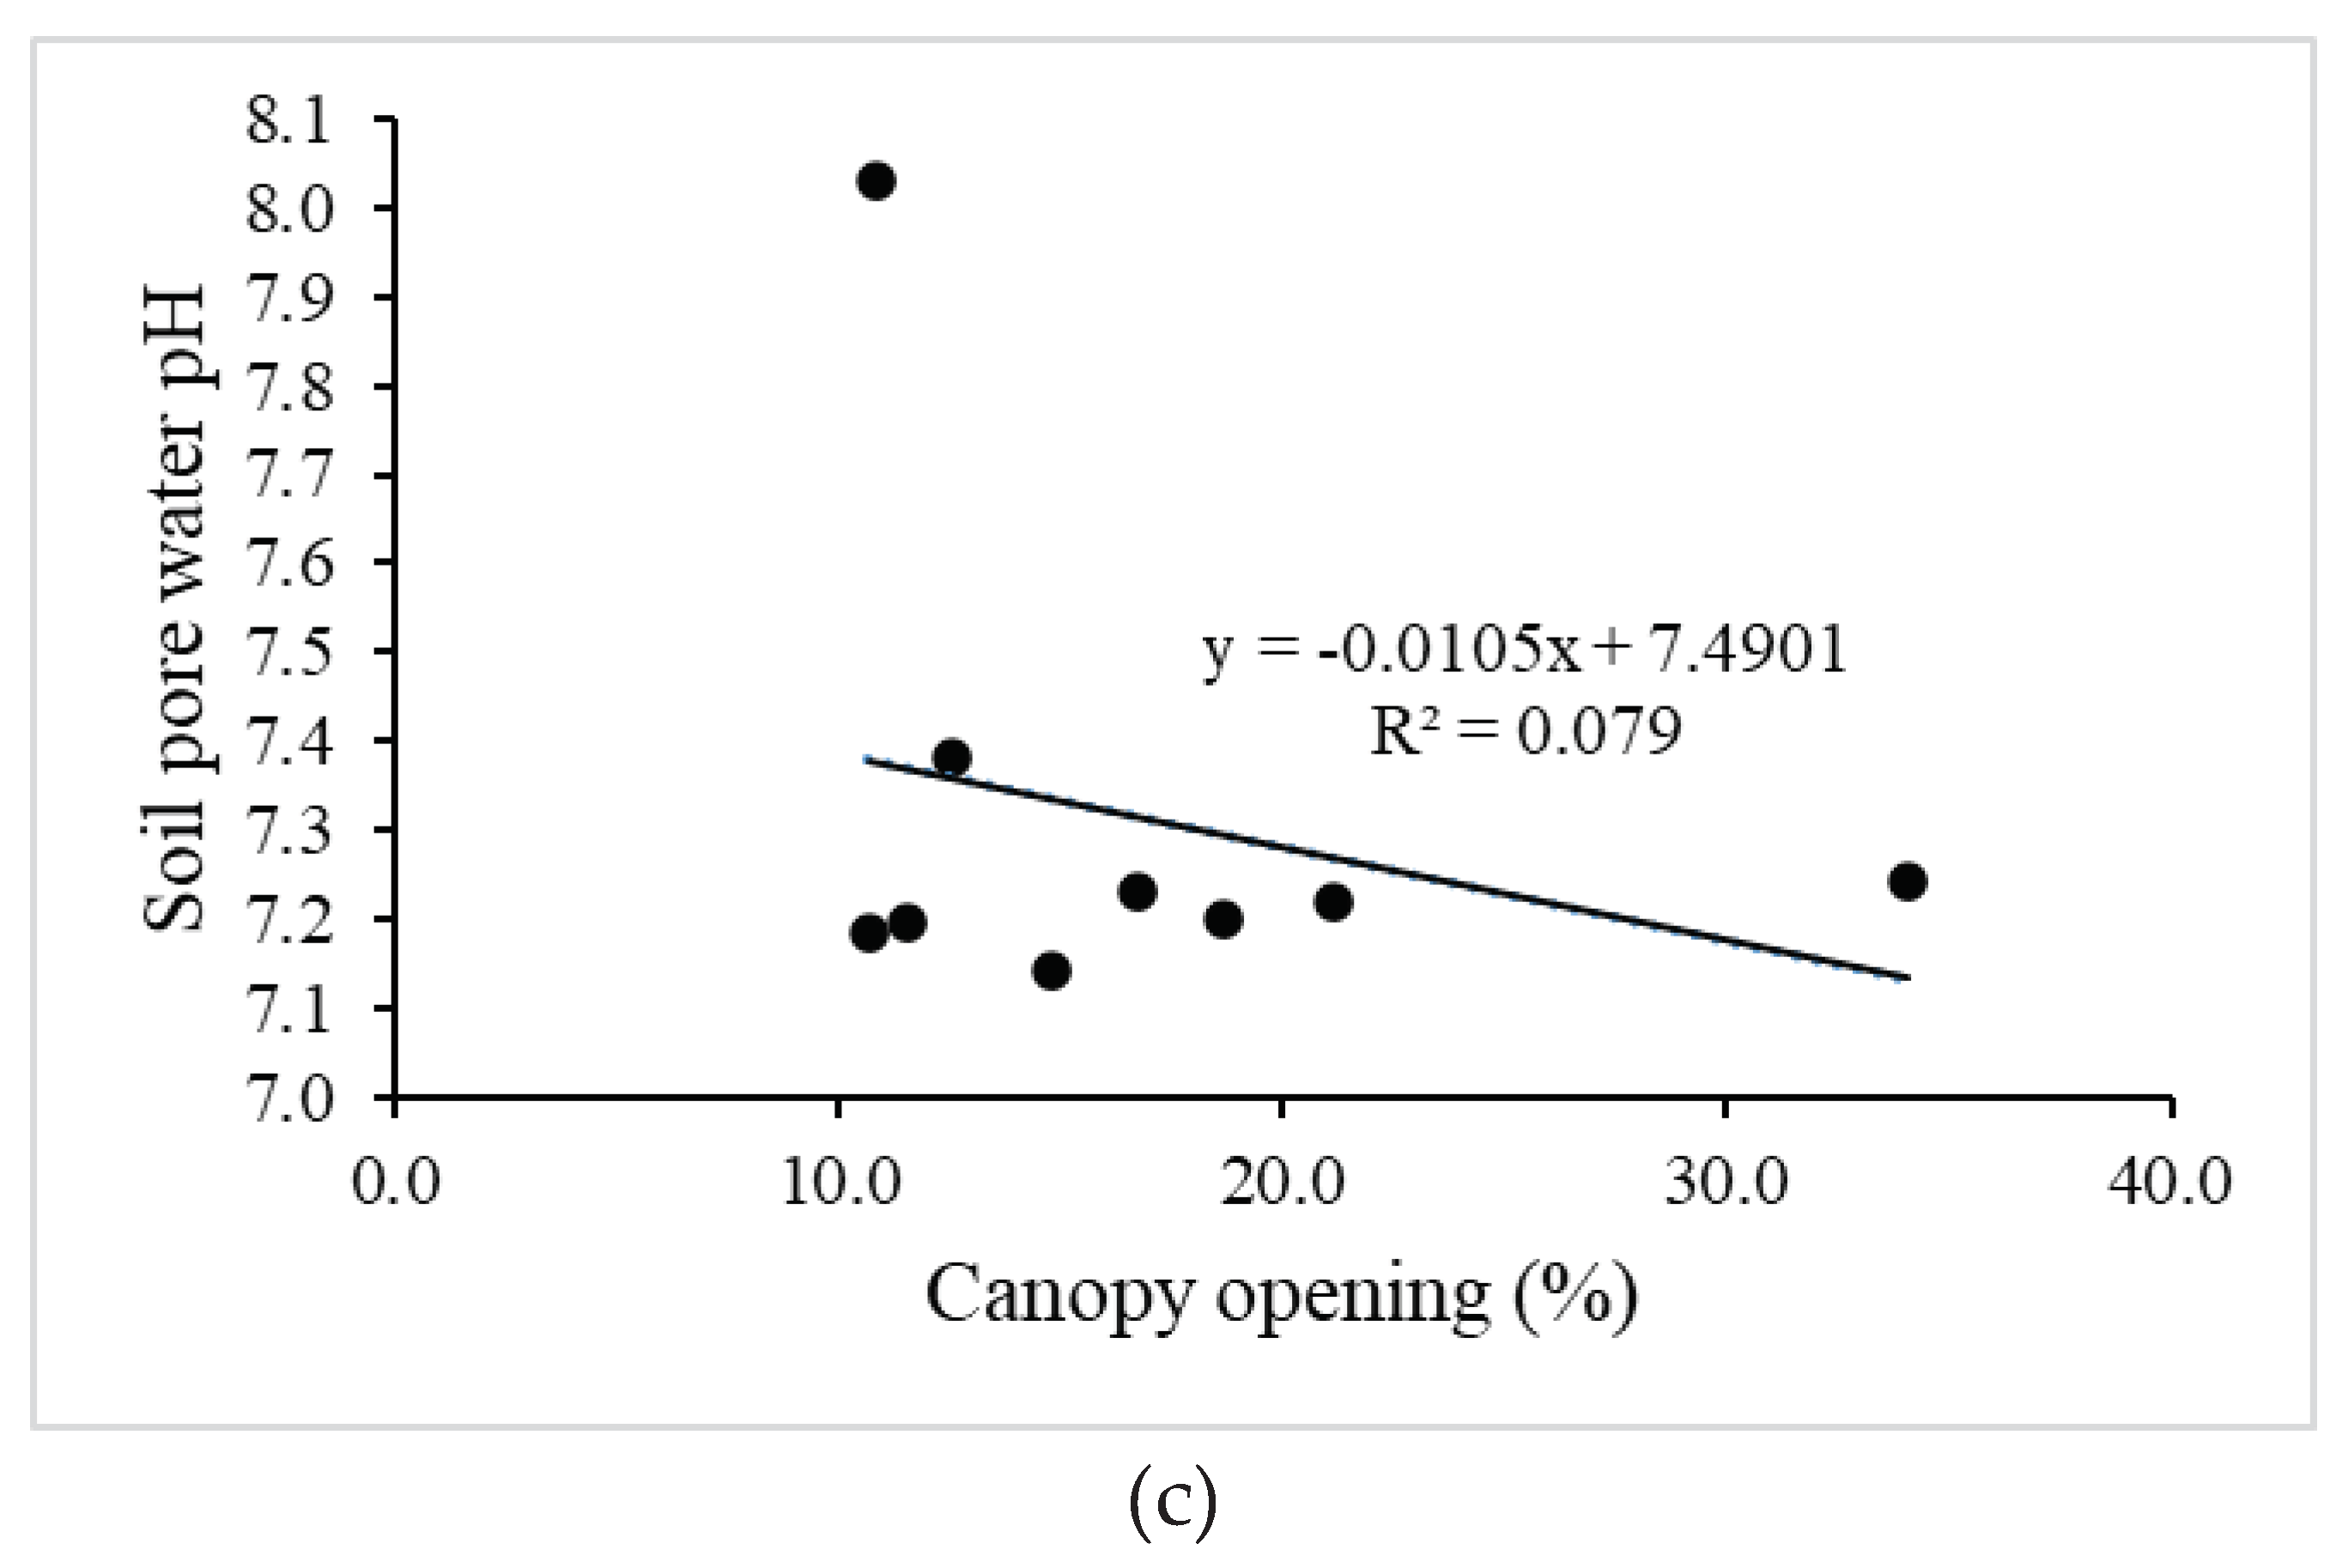
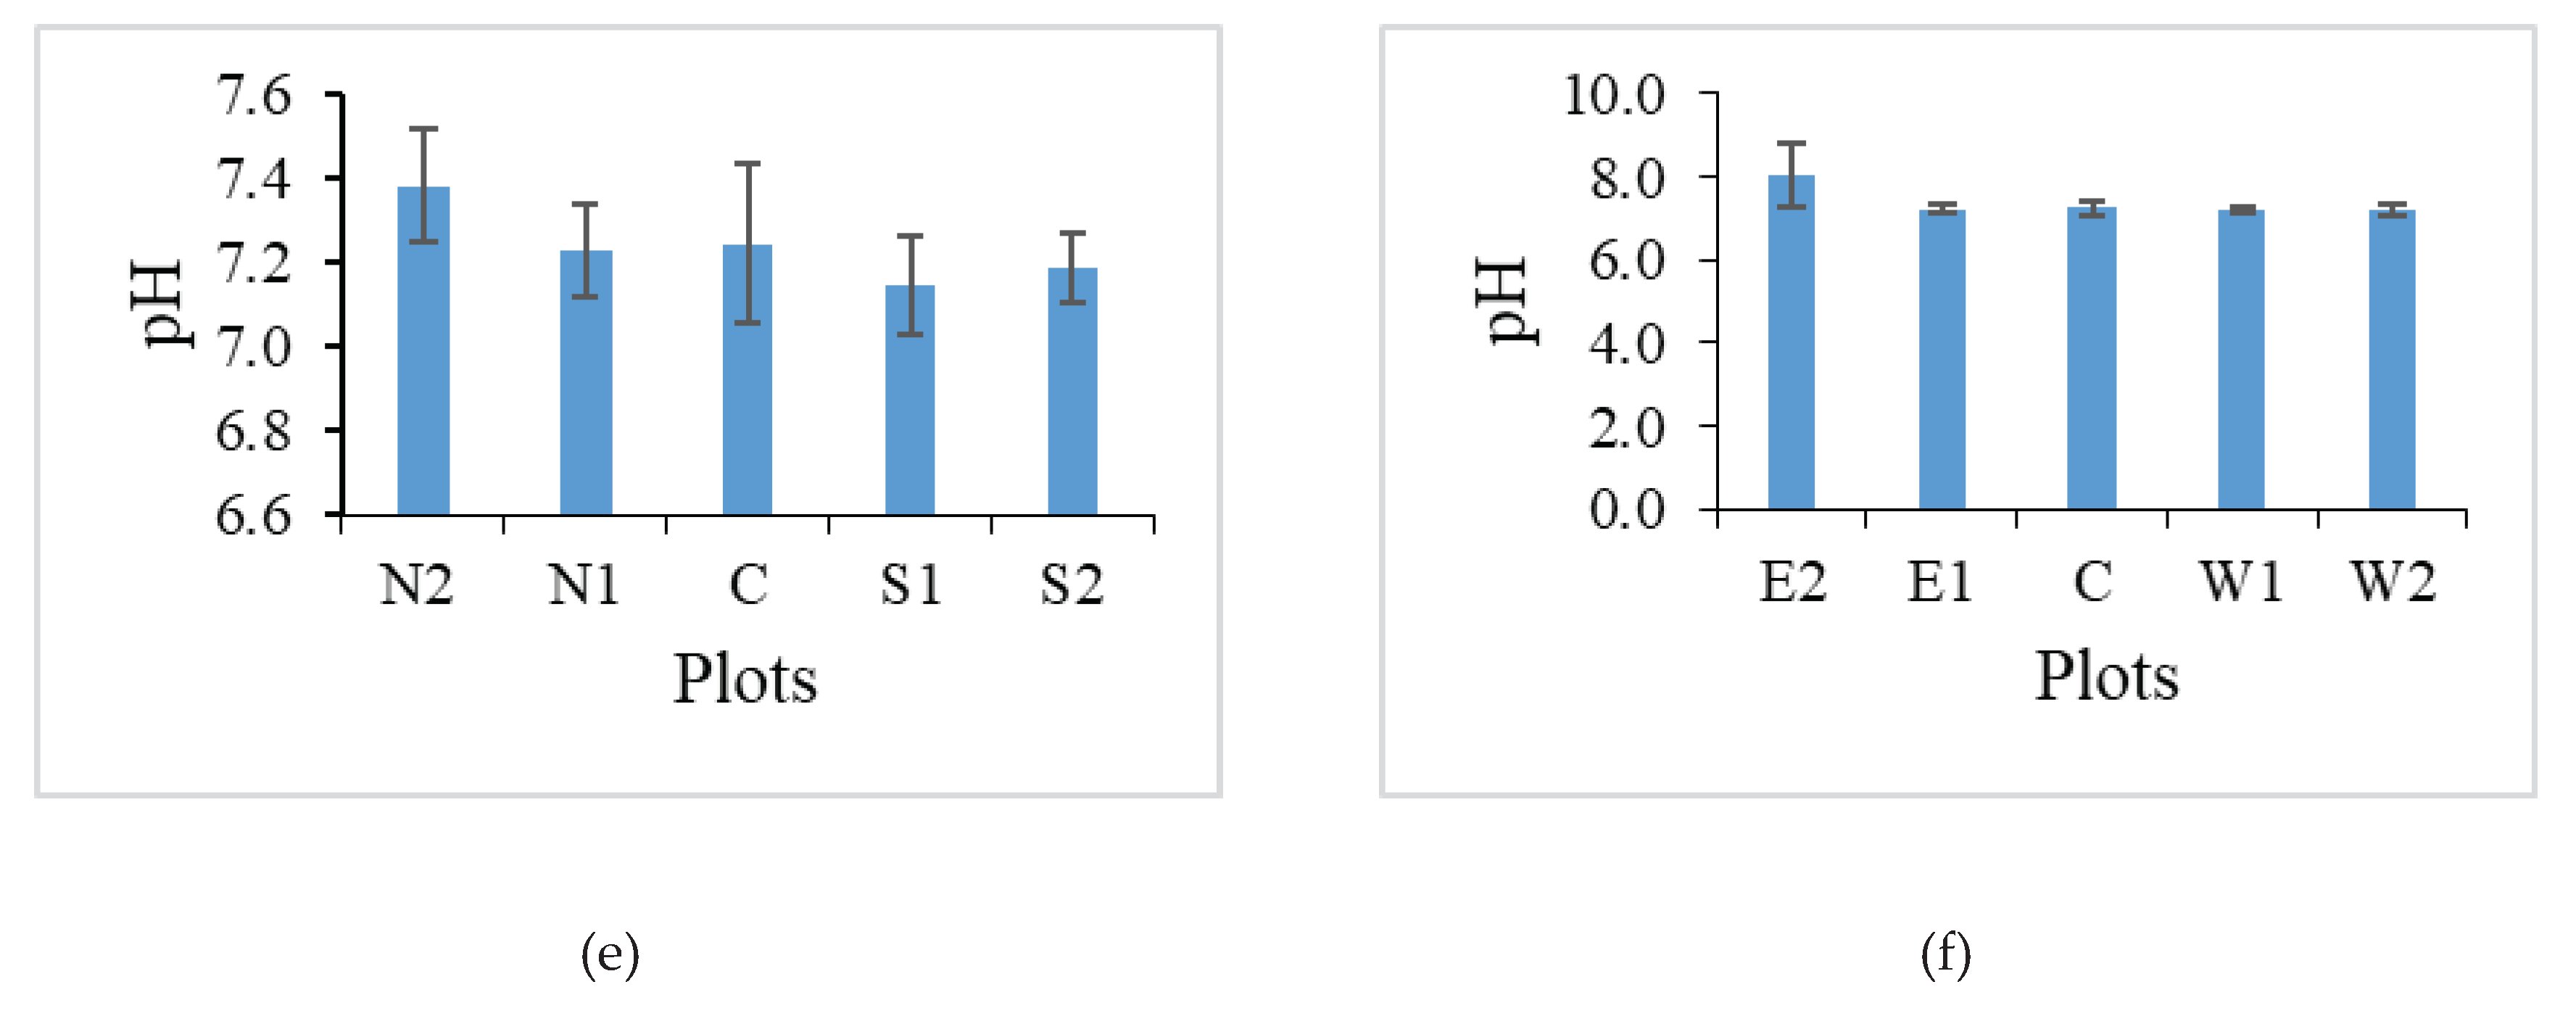
Figure 5 (b). For pH of soil pore water, it is almost insignificant (r2 = 0.08). Uniform mean pH values are recorded in every studied plot beginning with pH 7 to pH 8 (
Table 2). With regards to its relationship to canopy opening percentage, regression analysis showed a value of r2=0.08 which showed negative relationship (
Figure 5 (c)). The pH mean also does not show any significant difference between location or plot direction.
Temperature, salinity and pH of soil pore water
Table 4.
Mean of temperature, salinity, pH of soil pore water and canopy opening according to plot directions (centre, north-south, east-west).
Table 4.
Mean of temperature, salinity, pH of soil pore water and canopy opening according to plot directions (centre, north-south, east-west).
| Parameter |
Centre
n=5
|
N-S
n=20
|
E-W
n=20
|
| Temperature (°C) |
28.48
(±0.48) |
26.77
(±0.39) |
26.73
(±0.39) |
| Salinity (ppt) |
17.92
(±1.29) |
15.93
(±0.87) |
14.42
(±0.21) |
| pH |
7.24
(±0.19) |
7.24
(±0.05) |
7.41
(±0.21) |
| Canopy opening (%) |
34.06
(±3.67) |
13.69
(±1.32) |
15.55
(±2.57) |
4. Discussion
Similar results with this study in gap sizes (
Figure 7) were obtained in Papua New Guinea by [
4] who obtained the range of 300-700 m2. There are other studies which obtained similar results such as [
33] at Everglades, Florida, United States with mean size of 332 m2; [
34] at Kosrae island, Micronesia of 700 m2; [
5] in the Republic of Dominica of 724 m2; and [
35] at Panama (329 m2). However, a study at Queensland, Australia obtained the mean of gap area comparatively smaller at 84.2 m2 [
36].
Though all gaps measured were caused by similar factor (lightning strikes) but their effects are different. In addition, their physical characteristics adaptation are also different. According to [
36] mean of gap size formed by lightning strikes in the tropics are larger than those in the subtropics.
Canopy gaps that allow more light penetration gave the higher percentages and those covered by the canopy inhibit light penetration gave the lower percentages of openings (
Figure 3 and
Figure 4). However, these opening percentages do not give much changes to the orientation or direction of gap plots, either the north-south (N-S) direction or east-west E-W) direction (
Figure 4. This is because Pulau Langkawi is situated at the equator which has no season as the temperate region. For example, in summer in the southern hemisphere the earth axis slants, and the sun’s angle is almost vertical at about 10°- 20° at Moreton Bay, Queensland, Australia [
37]. Results of [
36] supports this assumption by recording a significant difference of the value of Photosynthesis Potential Active Radiation (PPAR) received in canopy gap centre and at north-south transect.
Results also showed that canopy opening percentage that enhance the light distribution to the forest floor and also modify the soil condition as observed by [1, 6, 36]. However, this study shows the enhancement of light distribution has given important effects to temperature and pH, except salinity. This is due to the fact that in mangrove swamp forest especially in gap phases it is directly influenced by water tides (twice a day), sea water and also freshwater flow in inland areas.
A study by [
38] finds that soil pore water salinity is very high under the canopy than those in gap areas. In this study salinity observed and measured is high and this is due to sea water tides that inundates the canopy gap areas including the mangrove inland areas. This process gives the ideal condition for mangrove species growth that tolerate high salt content such as
Avicennia marina. Meanwhile salinity and pH which are ordinary as observed in Pulau Langkawi is made possible by high tides. This condition gives more opportunity for seedlings and saplings to survive.
5. Conclusions
Canopy gap opening has increased the total light reaching the forest floor. The increase of light has changed the canopy gap microenvironment. Strong correlation between canopy opening percentage and temperature of gaps explains the changes of gaps characteristics and its surrounding. These changes have contributed to new seedlings germination, growth of saplings and sustain the canopy gap dynamics.
Author Contributions
Conceptualization, A. Latiff. and W.A. Wan Juliana.; methodology, A. Latiff. and W.A. Wan Juliana.; software, W.I. Wan Norilani.; validation, A. Latiff .; formal analysis, W. I. Wan Norilani.; investigation, W.I. Wan Norilani and Z. Ahmad Fitri.; resources, W.I. Wan Norilani and Z. Ahmad Fitri.; data curation, W.I. Wan Norilani; writing—original draft preparation, W.I. Wan Norilani.; writing—review and editing, A. Latiff and W.A. Wan Juliana.; visualization, W.I. Wan Norilani and A. Latiff.; supervision, A. Latiff and W.A. Wan Juliana.; project administration, A. Latiff and W.A. Wan Juliana.; funding acquisition, A. Latiff. All authors have read and agreed to the published version of the manuscript.”
Acknowledgments
The authors would like to thank the Langkawi District Forestry Office, Langkawi Development Authority (LADA), Persatuan Nelayan Kilim, Universiti Malaysia Terengganu, and to those involved for their assistance and guidance throughout this study. The study was supported by UKM-AP-PLW-01/2009 and UKM-ST-06-FRGS-0247-2010 research grants.
Conflicts of interest
The authors declare no conflict of interests.
References
- Clarke, P.J.; Kerrigan, R.A. Do Forest Gaps Influence the Population Structure and Species Composition of Mangrove Stands in Northern Australia? Biotropica 2000, 32, 642–652. [Google Scholar] [CrossRef]
- Craighead, F.C. The Trees of South Florida, Volume 1; University of Miami Press: Coral Gables, Florida, 1971. [Google Scholar]
- Odum, W.E.; Melvor, C.C.; Smith, T.J. III. The mangroves of South Florida: a community profile. FWS/OBS, 82/29, Fish and Wildlife Service: Washington DC, 1982. W: Wildlife Service.
- Paijmans, K.; Rollet, B. The mangroves of galley reach, Papua New Guinea. Forest Ecology and Management 1976, 1, 119–140. [Google Scholar] [CrossRef]
- Sherman, R.E.; Fahey, T.J.; Battles, J.J. Small-scale disturbance and regeneration dynamics in a neotropical mangrove forest. Journal of Ecology 2000, 88, 165–178. [Google Scholar] [CrossRef]
- Smith III, T. J. Forest structure. Tropical Mangrove Ecosystems 1992, 41, 101–136. [Google Scholar]
- Smith, T.J.; Robblee, M.B.; Wanless, H.R.; Doyle, T.W. Mangroves, hurricanes, and lightning strikes. BioScience 1994, 44, 256–262. [Google Scholar] [CrossRef]
- Sousa, W.P.; Mitchell, B.J. The effect of seed predators on plant distributions: is there a general pattern in mangroves? Oikos 1999, 55–66. [Google Scholar] [CrossRef]
- Amir, A.A.; Duke, N.C. Distinct characteristics of canopy gaps in the subtropical mangroves of Moreton Bay, Australia. Estuarine, Coastal and Shelf Science 2019, 222, 66–80. [Google Scholar] [CrossRef]
- Azad, M.S., Kamaruzzaman, M., Kanzaki, M. Canopy gaps influence regeneration dynamics in cyclone affected mangrove stands in medium saline zone of the Sundarbans, Bangladesh. Acta Ecologica Sinica 2021, 41(4), 296-303.
- Lassalle, G. , Filho, C. R.S. Tracking canopy gaps in mangroves remotely using deep learning. Remote Sensing in Ecology and Conservation 2022, 8, 890–903. [Google Scholar] [CrossRef]
- Cecil, D, J, Buechler, D, E., Blakeslee, R.J. Gridded lightning climatology from TRMM-LIS and OTD: dataset description. Atmospheric Research 2014, 135, 404–414.
- Huffines, G.R.; Orville, R.E. Lightning ground flash density and thunderstorm duration in the continental United States: 1989–96. Journal of Applied Meteorology and Climatology 1999, 38, 1013–1019. [Google Scholar] [CrossRef]
- Shafer, P.E.; Fuelberg, H.E. A statistical procedure to forecast warm season lightning over portions of the Florida peninsula. Weather and Forecasting 2006, 21, 851–868. [Google Scholar] [CrossRef]
- Imai, N.; Takyu, M.; Nakamura, Y.; Nakamura, T. Gap formation and regeneration of tropical mangrove forests in Ranong, Thailand. Plant Ecology 2006, 186, 37–46. [Google Scholar] [CrossRef]
- Fontes, C.G.; Chambers, J.Q.; Higuchi, N. Revealing the causes and temporal distribution of tree mortality in Central Amazonia. Forest Ecology and Management 2018, 424, 177–183. [Google Scholar] [CrossRef]
- Yanoviak, S.P.; Gora, E.M.; Bitzer, P.M.; Burchfield, J.C.; Muller-Landau, H.C.; Detto, M.; Paton, S.; Hubbell, S.P. Lightning is a major cause of large tree mortality in a lowland neotropical forest. New Phytologist 2020, 225, 1936–1944. [Google Scholar] [CrossRef] [PubMed]
- Bardsley, K. The effects of Cyclone Kathy on mangrove vegetation. Coasts and Tidal Wetlands of the Australian Monsoon Region, Australian National University North Australia Research Unit: Darwin, 1985; pp. 167-183.
- Craighead, F.C. Land, mangroves, and hurricanes. The Fairchild Tropical Garden Bulletin 1964, 19. [Google Scholar]
- Lugo, A.E.; Snedaker, S.C. The ecology of mangroves. Annual review of ecology and systematics 1974, 5, 39–64. [Google Scholar] [CrossRef]
- Roth, L.C. Hurricanes and mangrove regeneration: effects of Hurricane Joan, October 1988, on the vegetation of Isla del Venado, Bluefields, Nicaragua. Biotropica 1992, 375–384. [Google Scholar] [CrossRef]
- Feller, I.C.; McKee, K.L. Small gap creation in Belizean mangrove forests by a wood–boring insect 1. Biotropica 1999, 31, 607–617. [Google Scholar] [CrossRef]
- Putz, F.E.; Chan, H. Tree growth, dynamics, and productivity in a mature mangrove forest in Malaysia. Forest ecology and management, 1986; 17, 211–230. [Google Scholar]
- Putz, F.E.; Coley, P.D.; Lu, K.; Montalvo, A.; Aiello, A. Uprooting and snapping of trees: structural determinants and ecological consequences. Canadian Journal of Forest Research 1983, 13, 1011–1020. [Google Scholar] [CrossRef]
- Denslow, J.S.; Hartshorn, G.S. Tree-fall gap environments and forest dynamic processes. La Selva: ecology and natural history of a neotropical rain forest, University of Chicago Press: Chicago, 1994; pp. 120-127.
- Peereman, J.; Hogan, J.A.; Lin, T.C. Disturbance frequency, intensity and forest structure modulate cyclone-induced changes in mangrove forest canopy cover. Global Ecology and Biogeography 2022, 31, 37–50. [Google Scholar] [CrossRef]
- Ballaré, C.; Caldwell, M.; Pearcy, R. Light gaps: sensing the light opportunities in highly dynamic canopy environments. Redacted for Privacy 1994, 6. [Google Scholar]
- Fetcher, N.; Oberbauer, S.F.; Strain, B.R. Vegetation effects on microclimate in lowland tropical forest in Costa Rica. International Journal of Biometeorology 1985, 29, 145–155. [Google Scholar] [CrossRef]
- Alongi, D., M. Impacts of climate change on blue carbon stocks and fluxes in mangrove forests. Forests 2022, 13(2), 149. [Google Scholar] [CrossRef]
- Brokaw, N.V. The definition of treefall gap and its effect on measures of forest dynamics. Biotropica 1982, 158–160. [Google Scholar] [CrossRef]
- Brokaw, N.V. Gap-phase regeneration in a tropical forest. Ecology 1985, 66, 682–687. [Google Scholar] [CrossRef]
- Whelan, K.R.T. The successional dynamics of lightning-initiated canopy gaps in the mangrove forests of Shark River, Everglades National Park, USA, Florida International University: Florida, 2005.
- Whelan, K.R.T.; Smith III, T. J. Lightning gaps in the mangrove forest of everglades National Park, USGS: Florida, 2004.
- Allen, J.A.; Ewel, K.C.; Jack, J. Patterns of natural and anthropogenic disturbance of the mangroves on the Pacific Island of Kosrae. Wetlands Ecology and Management 2001, 9, 291–301. [Google Scholar] [CrossRef]
- Sousa, W.P.; Kennedy, P.G.; Mitchell, B.J. Propagule size and predispersal damage by insects affect establishment and early growth of mangrove seedlings. Oecologia 2003, 135, 564–575. [Google Scholar] [CrossRef]
- Amir, A.A. Canopy gaps and the natural regeneration of Matang mangroves. Forest Ecology and Management 2012, 269, 60–67. [Google Scholar] [CrossRef]
- Spencer, N.; Carignan, G.; Mayr, H.; Niemann, H.; Theis, R.; Wharton, L. The midnight temperature maximum in the earth's equatorial thermosphere. Geophysical Research Letters 1979, 6, 444–446. [Google Scholar] [CrossRef]
- Ewel, K.C.; Zheng, S.; Pinzón, Z.S.; Bourgeois, J.A. Environmental Effects of Canopy Gap Formation in High-Rainfall Mangrove Forests 1. Biotropica 1998, 30, 510–518. [Google Scholar] [CrossRef]
Figure 1.
Location of studied area in Compartments 6 and 7 Sungai Kisap Forest Reserve, Pulau Langkawi. Source: Forest Department Kedah & ArcMap (ArcGis).
Figure 1.
Location of studied area in Compartments 6 and 7 Sungai Kisap Forest Reserve, Pulau Langkawi. Source: Forest Department Kedah & ArcMap (ArcGis).
Figure 2.
Plot design of canopy gap in studied area of Sungai Kisap Forest Reserve, Pulau Langkawi.
Figure 2.
Plot design of canopy gap in studied area of Sungai Kisap Forest Reserve, Pulau Langkawi.
Figure 3.
Mean of canopy opening percentage in every plot across the transects (a) north-south, and (b) east-west, in five gaps.
Figure 3.
Mean of canopy opening percentage in every plot across the transects (a) north-south, and (b) east-west, in five gaps.
Figure 4.
Mean canopy opening percentage in the plots (a) gap centre, gap edge, and under the canopy, and (b) direction of transect (centre, north-south, and east-west).
Figure 4.
Mean canopy opening percentage in the plots (a) gap centre, gap edge, and under the canopy, and (b) direction of transect (centre, north-south, and east-west).
Figure 5.
Regression between canopy opening percentage and the physical characteristics of soil pore water (a) temperature, (b) salinity, and (c) pH.
Figure 5.
Regression between canopy opening percentage and the physical characteristics of soil pore water (a) temperature, (b) salinity, and (c) pH.
Figure 6.
Mean value of (a) & (b) temperature, (c) & (d) salinity, and (e) & (f) pH of soil pore water for every plot across the north-south transect and east-west transects for five canopy gaps.
Figure 6.
Mean value of (a) & (b) temperature, (c) & (d) salinity, and (e) & (f) pH of soil pore water for every plot across the north-south transect and east-west transects for five canopy gaps.
Figure 7.
Size of five canopy gaps.
Figure 7.
Size of five canopy gaps.
Table 1.
Size and shape of five canopy gaps.
Table 1.
Size and shape of five canopy gaps.
| Gap |
Area (m2) |
Concentricity Index |
Category |
| G1 |
749.03 |
0.88 |
Semi-circular towards E-W |
| G2 |
411.20 |
1.53 |
Elongated towards N-S |
| G3 |
746.44 |
1.08 |
Circular |
| G4 |
370.15 |
0.93 |
Circular |
| G5 |
291.28 |
0.89 |
Semi-circular towards E-W |
Table 2.
Mean value of temperature, salinity, pH and canopy opening percentage of soil pore water for every plot.
Table 2.
Mean value of temperature, salinity, pH and canopy opening percentage of soil pore water for every plot.
| Parameter |
Centre
C n=5
|
Edge |
Canopy |
| N1 n=5 |
S1 n=5 |
E1 n=5 |
W1 n=5 |
N2 n=5 |
S2 n=5 |
E2 n=5 |
W2 n=5 |
| Temperature (°C) |
28.48
(±0.48) |
27.19
(±0.30) |
27.62
(±0.47) |
27.77
(±0.54) |
26.90
(±0.26) |
26.33
(±0.23) |
25.94
(±0.13) |
26.26
(±0.11) |
26.00
(±0.28) |
| Salinity (ppt) |
17.92
(±1.29) |
15.60
(±1.64) |
18.18
(±1.39) |
14.73
(±1.10) |
13.81
(±1.37) |
13.93
(±3.56) |
16.00
(±2.70) |
14.47
(±2.35) |
14.67
(±2.42) |
| pH |
7.244
(±0.19) |
7.23
(±0.11) |
7.144
(±0.12) |
7.218
(±0.11) |
7.2
(±0.07) |
7.382
(±0.14) |
7.184
(±0.08) |
8.032
(±0.77) |
7.196
(±0.12) |
| Canopy opening (%) |
34.06
(±3.67) |
16.75
(±2.97) |
14.78
(±0.89) |
21.16
(±2.92) |
18.63
(±2.91) |
12.54
(±1.81) |
10.69
(±0.71) |
10.85
(±1.01) |
11.56
(±0.86) |
Table 3.
Mean temperature, salinity, pH of soil pore water, and percentage of canopy opening according to locations within plot (Centre, gap edge and within canopy).
Table 3.
Mean temperature, salinity, pH of soil pore water, and percentage of canopy opening according to locations within plot (Centre, gap edge and within canopy).
| Parameter |
Centre
n=5
|
Edge
n=20
|
Canopy
n=20
|
| Temperature (°C) |
28.48
(±0.48) |
27.37
(±0.20) |
26.13
(±0.10) |
| Salinity (ppt) |
17.92
(±1.29) |
15.58
(±0.94) |
14.77
(±0.44) |
| pH |
7.24
(±0.19) |
7.20
(±0.02) |
7.45
(±0.20) |
| Canopy opening (%) |
34.06
(±3.67) |
17.83
(±1.36) |
11.41
(±0.42) |
|
Disclaimer/Publisher’s Note: The statements, opinions and data contained in all publications are solely those of the individual author(s) and contributor(s) and not of MDPI and/or the editor(s). MDPI and/or the editor(s) disclaim responsibility for any injury to people or property resulting from any ideas, methods, instructions or products referred to in the content. |
© 2023 by the authors. Licensee MDPI, Basel, Switzerland. This article is an open access article distributed under the terms and conditions of the Creative Commons Attribution (CC BY) license (http://creativecommons.org/licenses/by/4.0/).
