Submitted:
28 August 2023
Posted:
29 August 2023
You are already at the latest version
Abstract
Keywords:
1. Introduction
1.1. Unilateral Metabolic-Hemodynamic Coupling and Bilateral Connectivity
1.2. Three Infraslow Oscillation Bands in Cerebral CCO and HbO Signals
1.3. Aim of This Study
2. Results
2.1. Bilateral Prefrontal Connectivity of ∆[HbO] and ∆[CCO] in Older and Younger Adults
2.2. Unilateral Prefrontal Coupling between ∆[HbO] and ∆[CCO] in Older and Younger Adults
2.3. Gender Difference in Bilateral Connectivity of Unilateral Coupling
3. Discussion
3.1. Age Effect on Bilateral Hemodynamic Connectivity of the Resting Prefrontal Cortex
3.2. Age Effect on Bilateral Metabolic Connectivity of the Resting Prefrontal Cortex
3.3. Age Effect on unilateral Metabolic-hemodynamic Coupling of the Resting Prefrontal Cortex
3.4. Signals Measured under Eyes-Open and Eyes-Closed Conditions
3.5. Gender Difference in Resting Bilateral Connectivity and Unilateral Coupling
3.6. Limitations of the Study and Future Work
4. Materials and Methods
4.1. Participants
4.2. Experiment Protocol and Setup
4.3. Broadband Near-Infrared Spectroscopy and its Measurements
4.4. Data Analysis
5. Conclusions
Supplementary Materials
Author Contributions
Funding
Institutional Review Board Statement
Informed Consent Statement
Data Availability Statement
Conflicts of Interest
References
- Motzkin, J.C.; Newman, J.P.; Kiehl, K.A.; Koenigs, M. Reduced prefrontal connectivity in psychopathy. J Neurosci 2011, 31, 17348-17357. [CrossRef]
- Racz, F.S.; Mukli, P.; Nagy, Z.; Eke, A. Increased prefrontal cortex connectivity during cognitive challenge assessed by fNIRS imaging. Biomed Opt Express 2017, 8, 3842-3855. [CrossRef]
- Yu, J.W.; Lim, S.H.; Kim, B.; Kim, E.; Kim, K.; Kyu Park, S.; Seok Byun, Y.; Sakong, J.; Choi, J.W. Prefrontal functional connectivity analysis of cognitive decline for early diagnosis of mild cognitive impairment: a functional near-infrared spectroscopy study. Biomed Opt Express 2020, 11, 1725-1741. [CrossRef]
- Jobson, D.D.; Hase, Y.; Clarkson, A.N.; Kalaria, R.N. The role of the medial prefrontal cortex in cognition, ageing and dementia. Brain Commun 2021, 3, fcab125. [CrossRef]
- Sampath, D.; Sathyanesan, M.; Newton, S.S. Cognitive dysfunction in major depression and Alzheimer’s disease is associated with hippocampal–prefrontal cortex dysconnectivity. Neuropsychiatric Disease and Treatment 2017, 13, 1509. [CrossRef]
- Grady, C. The cognitive neuroscience of ageing. Nat Rev Neurosci 2012, 13, 491-505. [CrossRef]
- Jones, L.K. Neurophysiological development across the life span. American Counseling Association 2017, pp. 27-44. [CrossRef]
- Shahdadian, S.; Wang, X.; Kang, S.; Carter, C.; Chaudhari, A.; Liu, H. Prefrontal cortical connectivity and coupling of infraslow oscillation in the resting human brain: a 2-channel broadband NIRS study. Cereb Cortex Commun 2022, 3, tgac033. [CrossRef]
- Swami, S. Executive functions and decision making: A managerial review. IIMB Management Review 2013, 25, 203-212. [CrossRef]
- Shahdadian, S.; Wang, X.; Kang, S.; Carter, C.; Liu, H. Site-specific effects of 800- and 850-nm forehead transcranial photobiomodulation on prefrontal bilateral connectivity and unilateral coupling in young adults. Neurophotonics 2023, 10, 025012. [CrossRef]
- Wang, X.; Tian, F.; Reddy, D.D.; Nalawade, S.S.; Barrett, D.W.; Gonzalez-Lima, F.; Liu, H. Up-regulation of cerebral cytochrome-c-oxidase and hemodynamics by transcranial infrared laser stimulation: A broadband near-infrared spectroscopy study. J Cereb Blood Flow Metab 2017, 37, 3789-3802. [CrossRef]
- Obrig, H.; Wenzel, R.; Kohl, M.; Horst, S.; Wobst, P.; Steinbrink, J.; Thomas, F.; Villringer, A. Near-infrared spectroscopy: does it function in functional activation studies of the adult brain? Int J Psychophysiol 2000, 35, 125-142. [CrossRef]
- Stefanovska, A.; Bracic, M.; Kvernmo, H.D. Wavelet analysis of oscillations in the peripheral blood circulation measured by laser Doppler technique. IEEE Trans Biomed Eng 1999, 46, 1230-1239. [CrossRef]
- Bracic, M.; Stefanovska, A. Wavelet-based analysis of human blood-flow dynamics. Bull Math Biol 1998, 60, 919-935. [CrossRef]
- Vermeij, A.; Meel-van den Abeelen, A.S.; Kessels, R.P.; van Beek, A.H.; Claassen, J.A. Very-low-frequency oscillations of cerebral hemodynamics and blood pressure are affected by aging and cognitive load. Neuroimage 2014, 85 Pt 1, 608-615. [CrossRef]
- Bernjak, A.; Clarkson, P.B.; McClintock, P.V.; Stefanovska, A. Low-frequency blood flow oscillations in congestive heart failure and after beta1-blockade treatment. Microvasc Res 2008, 76, 224-232. [CrossRef]
- Hillman, E.M.C. Coupling Mechanism and Significance of the BOLD Signal: A Status Report. Annual Review of Neuroscience 2014, 37, 161-181. [CrossRef]
- Kvernmo, H.D.; Stefanovska, A.; Kirkeboen, K.A.; Kvernebo, K. Oscillations in the human cutaneous blood perfusion signal modified by endothelium-dependent and endothelium-independent vasodilators. Microvasc Res 1999, 57, 298-309. [CrossRef]
- Wang, X.; Ma, L.C.; Shahdadian, S.; Wu, A.; Truong, N.C.D.; Liu, H. Metabolic Connectivity and Hemodynamic-Metabolic Coherence of Human Prefrontal Cortex at Rest and Post Photobiomodulation Assessed by Dual-Channel Broadband NIRS. Metabolites 2022, 12. [CrossRef]
- Wiedeman, M.P. Effect of venous flow on frequency of venous vasomotion in the bat wing. Circ Res 1957, 5, 641-644. [CrossRef]
- Buerk, D.G.; Riva, C.E. Vasomotion and spontaneous low-frequency oscillations in blood flow and nitric oxide in cat optic nerve head. Microvasc Res 1998, 55, 103-112. [CrossRef]
- Zhao, Y.; Vanhoutte, P.M.; Leung, S.W. Vascular nitric oxide: Beyond eNOS. J Pharmacol Sci 2015, 129, 83-94. [CrossRef]
- Vita, J.A.; Keaney, J.F., Jr. Endothelial function: a barometer for cardiovascular risk? Circulation 2002, 106, 640-642. [CrossRef]
- Deanfield, J.E.; Halcox, J.P.; Rabelink, T.J. Endothelial function and dysfunction: testing and clinical relevance. Circulation 2007, 115, 1285-1295. [CrossRef]
- Di Marco, L.Y.; Farkas, E.; Martin, C.; Venneri, A.; Frangi, A.F. Is vasomotion in cerebral arteries impaired in Alzheimer’s disease? Journal of Alzheimer's Disease 2015, 46, 35-53. [CrossRef]
- West, R.L. An application of prefrontal cortex function theory to cognitive aging. Psychol Bull 1996, 120, 272-292. [CrossRef]
- Cazzell, M.; Li, L.; Lin, Z.J.; Patel, S.J.; Liu, H. Comparison of neural correlates of risk decision making between genders: an exploratory fNIRS study of the Balloon Analogue Risk Task (BART). NeuroImage 2012, 62, 1896-1911. [CrossRef]
- Li, L.; Cazzell, M.; Zeng, L.; Liu, H. Are there gender differences in young vs. aging brains under risk decision-making? An optical brain imaging study. Brain Imaging Behav 2017, 11, 1085-1098. [CrossRef]
- de Roever, I.; Bale, G.; Cooper, R.J.; Tachtsidis, I. Functional NIRS Measurement of Cytochrome-C-Oxidase Demonstrates a More Brain-Specific Marker of Frontal Lobe Activation Compared to the Haemoglobins. Adv Exp Med Biol 2017, 977, 141-147. [CrossRef]
- Pruitt, T.; Carter, C.; Wang, X.; Wu, A.; Liu, H. Photobiomodulation at Different Wavelengths Boosts Mitochondrial Redox Metabolism and Hemoglobin Oxygenation: Lasers vs. Light-Emitting Diodes In Vivo. Metabolites 2022, 12. [CrossRef]
- Sampath, D.; Sathyanesan, M.; Newton, S.S. Cognitive dysfunction in major depression and Alzheimer's disease is associated with hippocampal-prefrontal cortex dysconnectivity. Neuropsychiatr Dis Treat 2017, 13, 1509-1519. [CrossRef]
- Li, L.; Babawale, O.; Yennu, A.; Trowbridge, C.; Hulla, R.; Gatchel, R.J.; Liu, H. Whole-cortical graphical networks at wakeful rest in young and older adults revealed by functional near-infrared spectroscopy. Neurophotonics 2018, 5, 035004. [CrossRef]
- Welch, P. The use of fast Fourier transform for the estimation of power spectra: a method based on time averaging over short, modified periodograms. IEEE Transactions on audio and electroacoustics 1967, 15, 70-73. [CrossRef]
- Xu, G.; Huo, C.; Yin, J.; Zhong, Y.; Sun, G.; Fan, Y.; Wang, D.; Li, Z. Test-retest reliability of fNIRS in resting-state cortical activity and brain network assessment in stroke patients. Biomed. Opt. Express 2023, 14 4217-4236. [CrossRef]
- Pruitt, T.; Wang, X.; Wu, A.; Kallioniemi, E.; Husain, M.M.; Liu, H. Transcranial Photobiomodulation (tPBM) With 1,064-nm Laser to Improve Cerebral Metabolism of the Human Brain In Vivo. Lasers Surg Med 2020, 52, 807-813. [CrossRef]
- Truong, N.C.D.; Shahdadian, S.; Kang, S.; Wang, X.; Liu, H. Influence of the Signal-To-Noise Ratio on Variance of Chromophore Concentration Quantification in Broadband Near-Infrared Spectroscopy. Frontiers in Photonics 2022, 3, 908931. [CrossRef]
- Kolyva, C.; Tachtsidis, I.; Ghosh, A.; Moroz, T.; Cooper, C.E.; Smith, M.; Elwell, C.E. Systematic investigation of changes in oxidized cerebral cytochrome c oxidase concentration during frontal lobe activation in healthy adults. Biomed Opt Express 2012, 3, 2550-2566. [CrossRef]
- Bainbridge, A.; Tachtsidis, I.; Faulkner, S.D.; Price, D.; Zhu, T.; Baer, E.; Broad, K.D.; Thomas, D.L.; Cady, E.B.; Robertson, N.J.; et al. Brain mitochondrial oxidative metabolism during and after cerebral hypoxia-ischemia studied by simultaneous phosphorus magnetic-resonance and broadband near-infrared spectroscopy. NeuroImage 2014, 102 Pt 1, 173-183. [CrossRef]
- Bale, G.; Mitra, S.; Meek, J.; Robertson, N.; Tachtsidis, I. A new broadband near-infrared spectroscopy system for in-vivo measurements of cerebral cytochrome-c-oxidase changes in neonatal brain injury. Biomed Opt Express 2014, 5, 3450-3466. [CrossRef]
- Park, J.; Lindberg, C.R.; Vernon III, F.L. Multitaper spectral analysis of high-frequency seismograms. Journal of Geophysical Research: Solid Earth 1987, 92, 12675-12684. [CrossRef]
- Babadi, B.; Brown, E.N. A review of multitaper spectral analysis. IEEE Transactions on Biomedical Engineering 2014, 61, 1555-1564. [CrossRef]
- Popov, T.; Oostenveld, R.; Schoffelen, J.M. FieldTrip Made Easy: An Analysis Protocol for Group Analysis of the Auditory Steady State Brain Response in Time, Frequency, and Space. Front Neurosci 2018, 12, 711. [CrossRef]
- Oostenveld, R.; Fries, P.; Maris, E.; Schoffelen, J.-M. FieldTrip: open source software for advanced analysis of MEG, EEG, and invasive electrophysiological data. Computational intelligence and neuroscience 2011, 2011. [CrossRef]
- Bastos, A.M.; Schoffelen, J.M. A Tutorial Review of Functional Connectivity Analysis Methods and Their Interpretational Pitfalls. Front Syst Neurosci 2015, 9, 175. [CrossRef]
- Percival, D.B.; Walden, A.T. Spectral analysis for physical applications; cambridge university press: 1993.
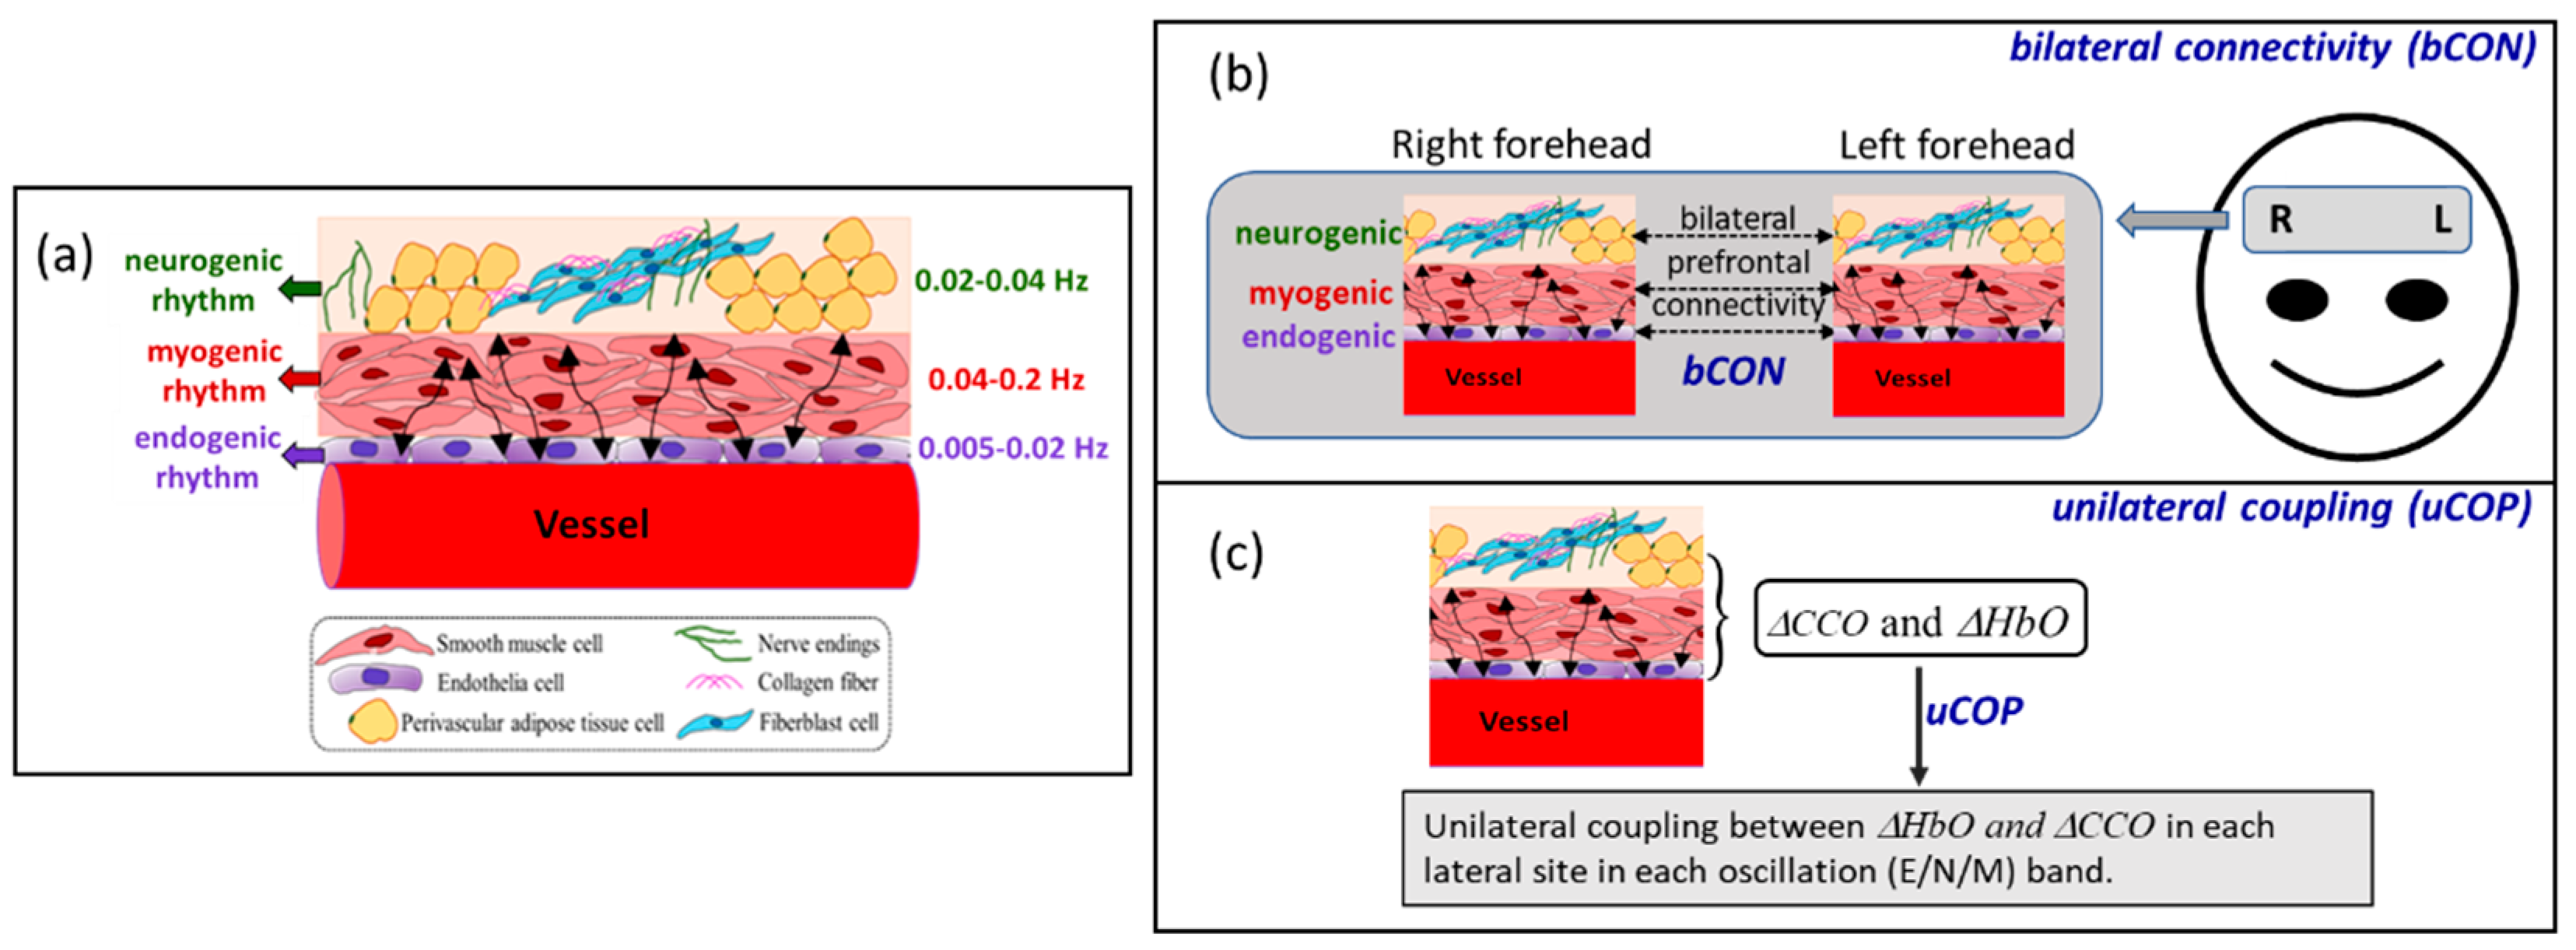
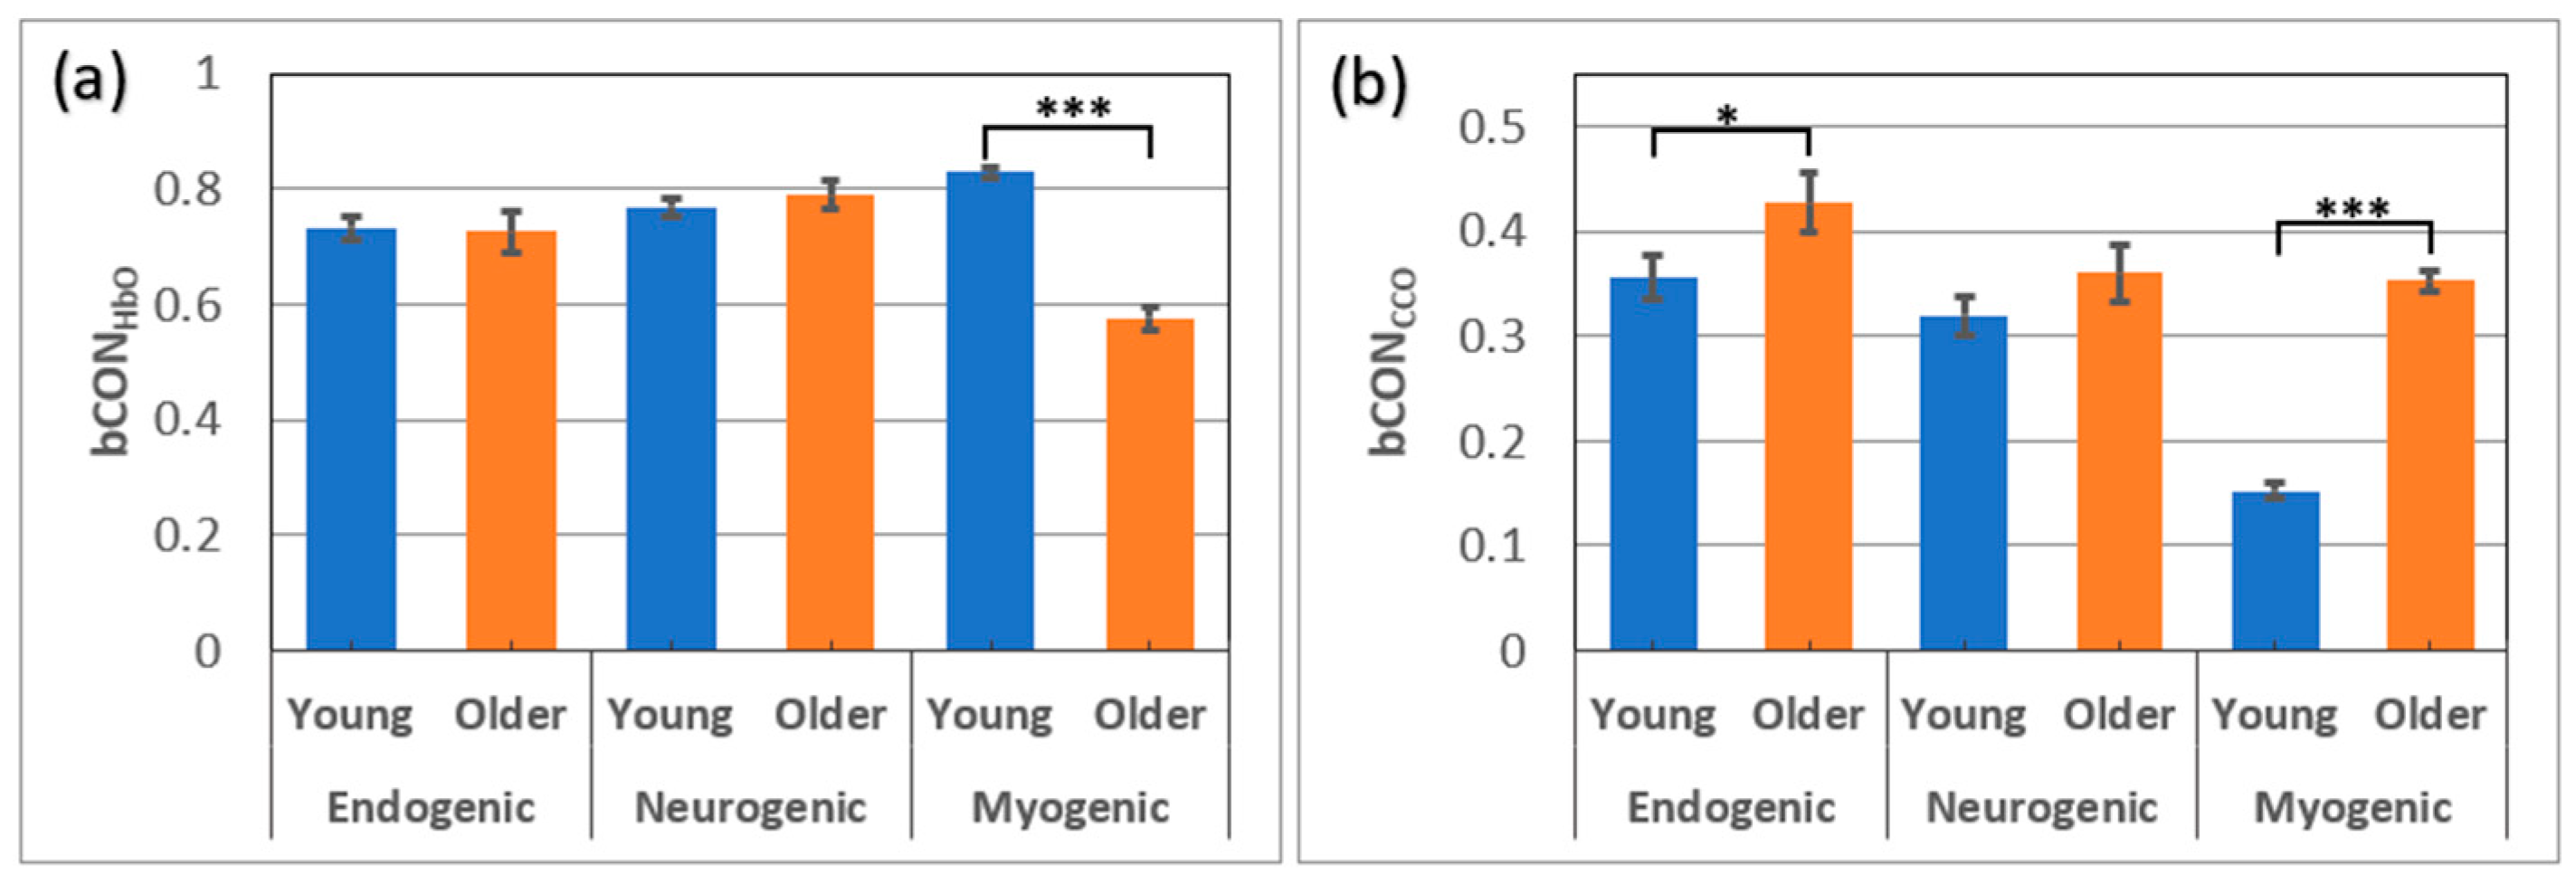
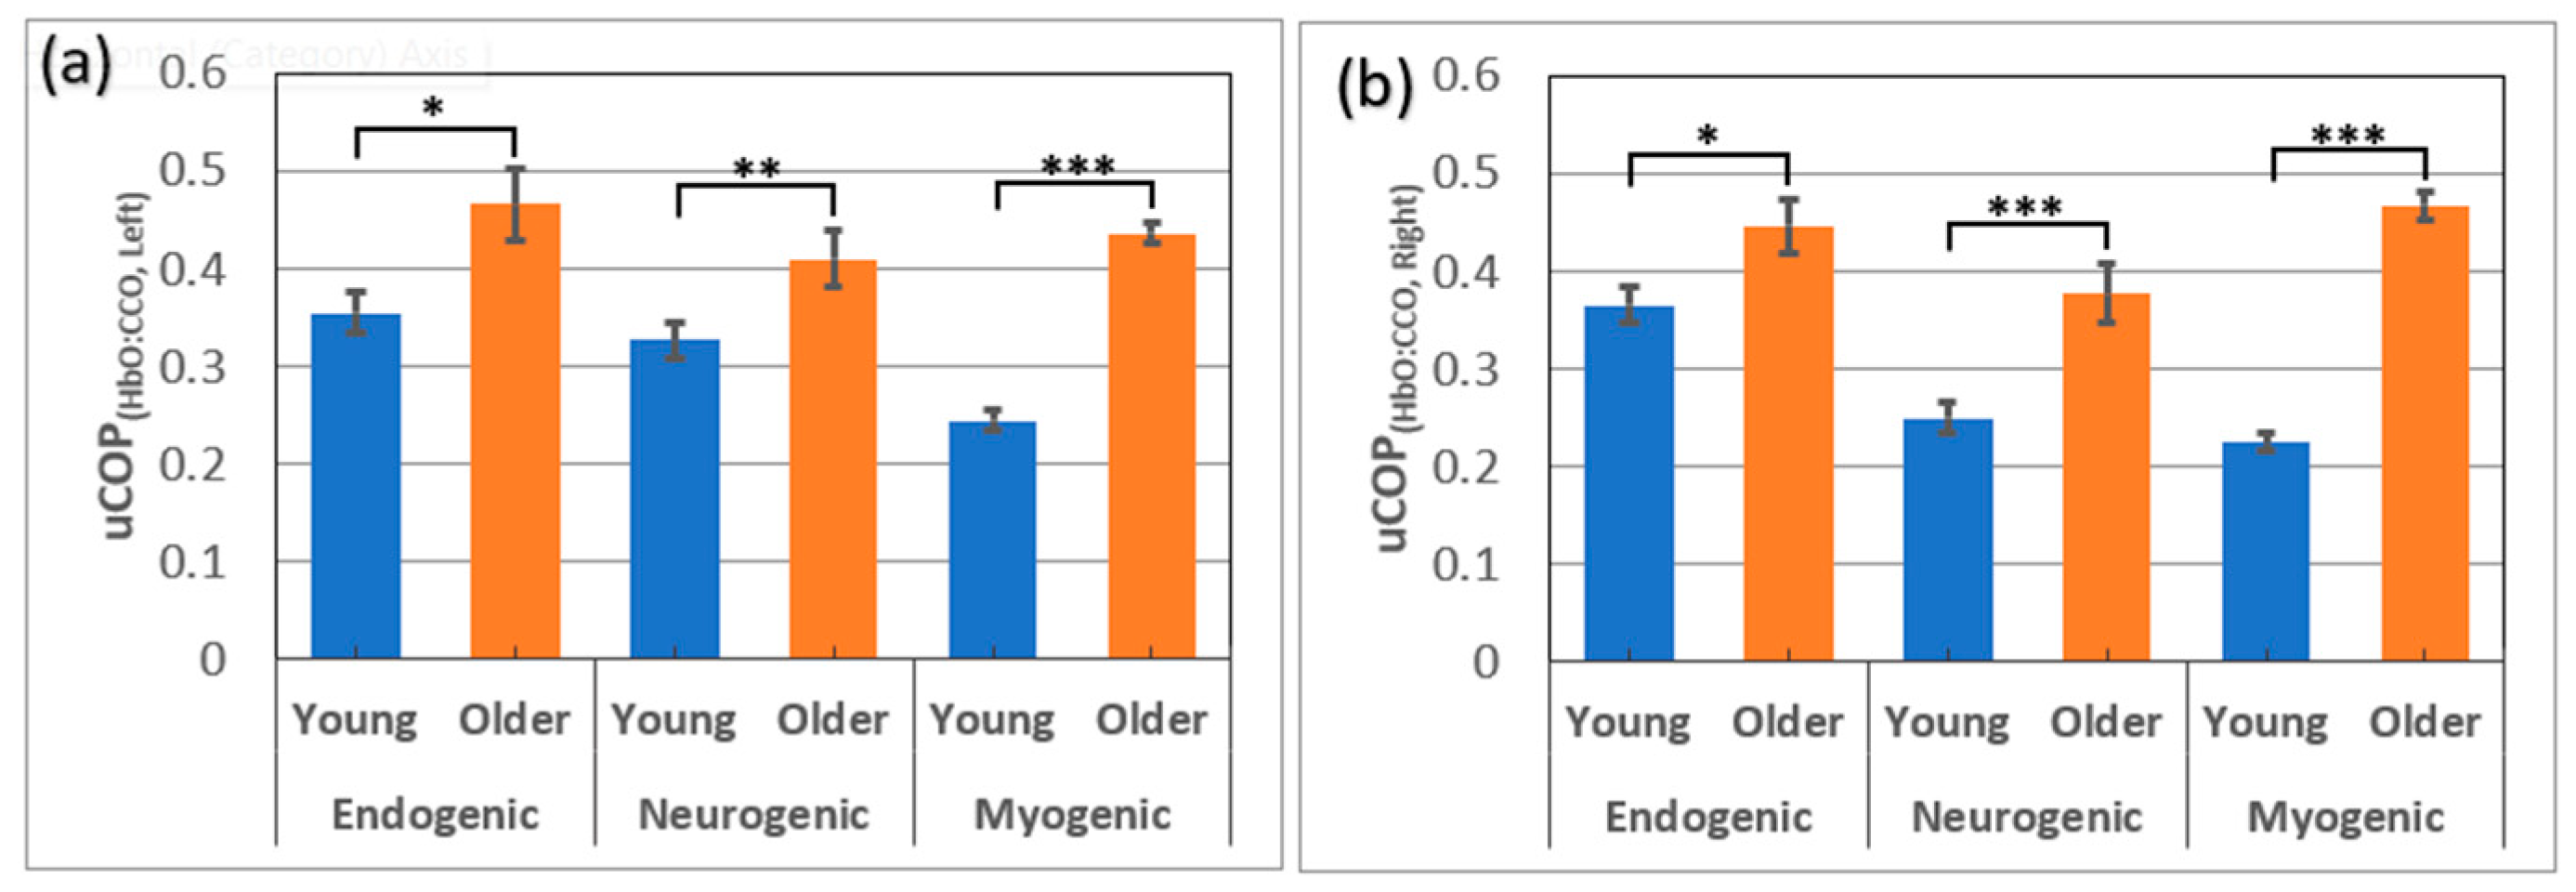
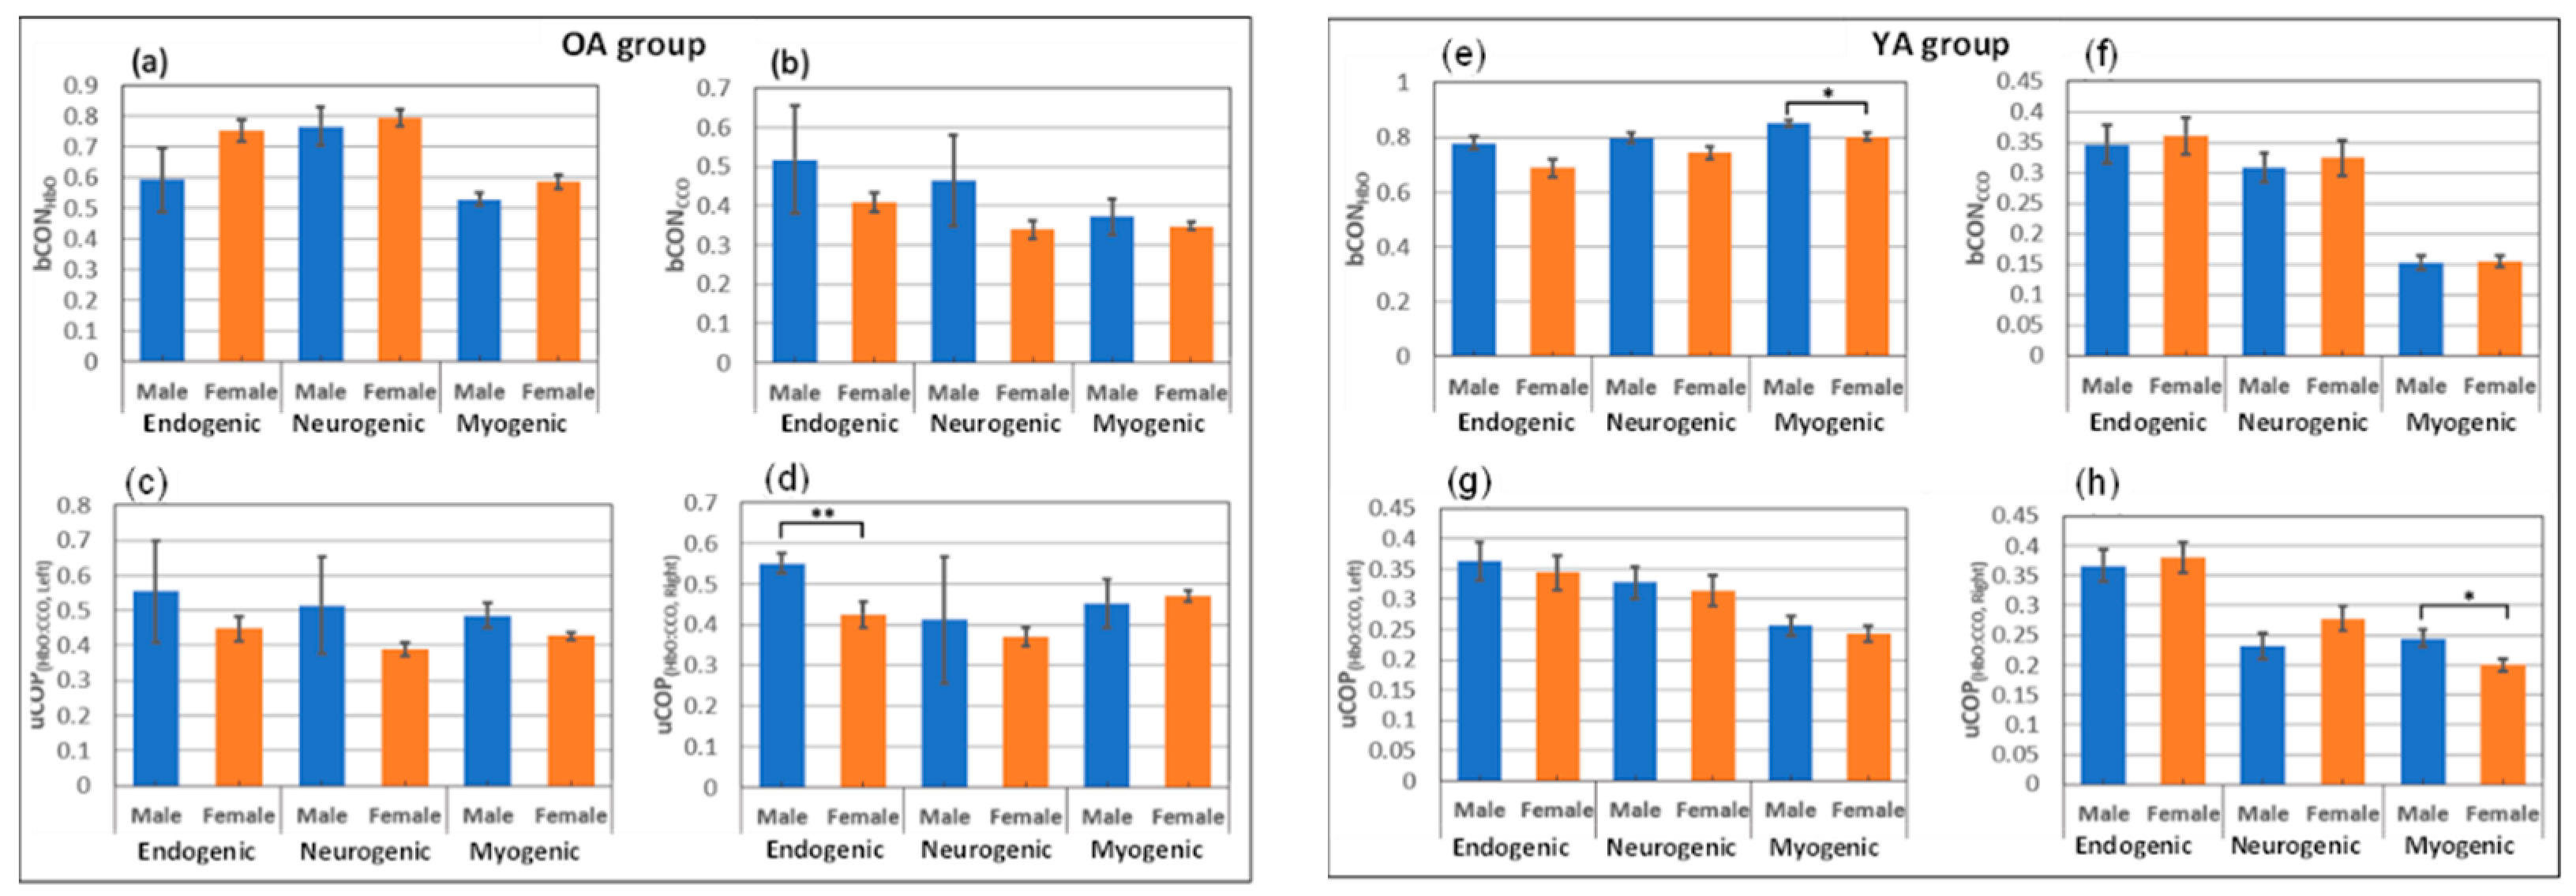
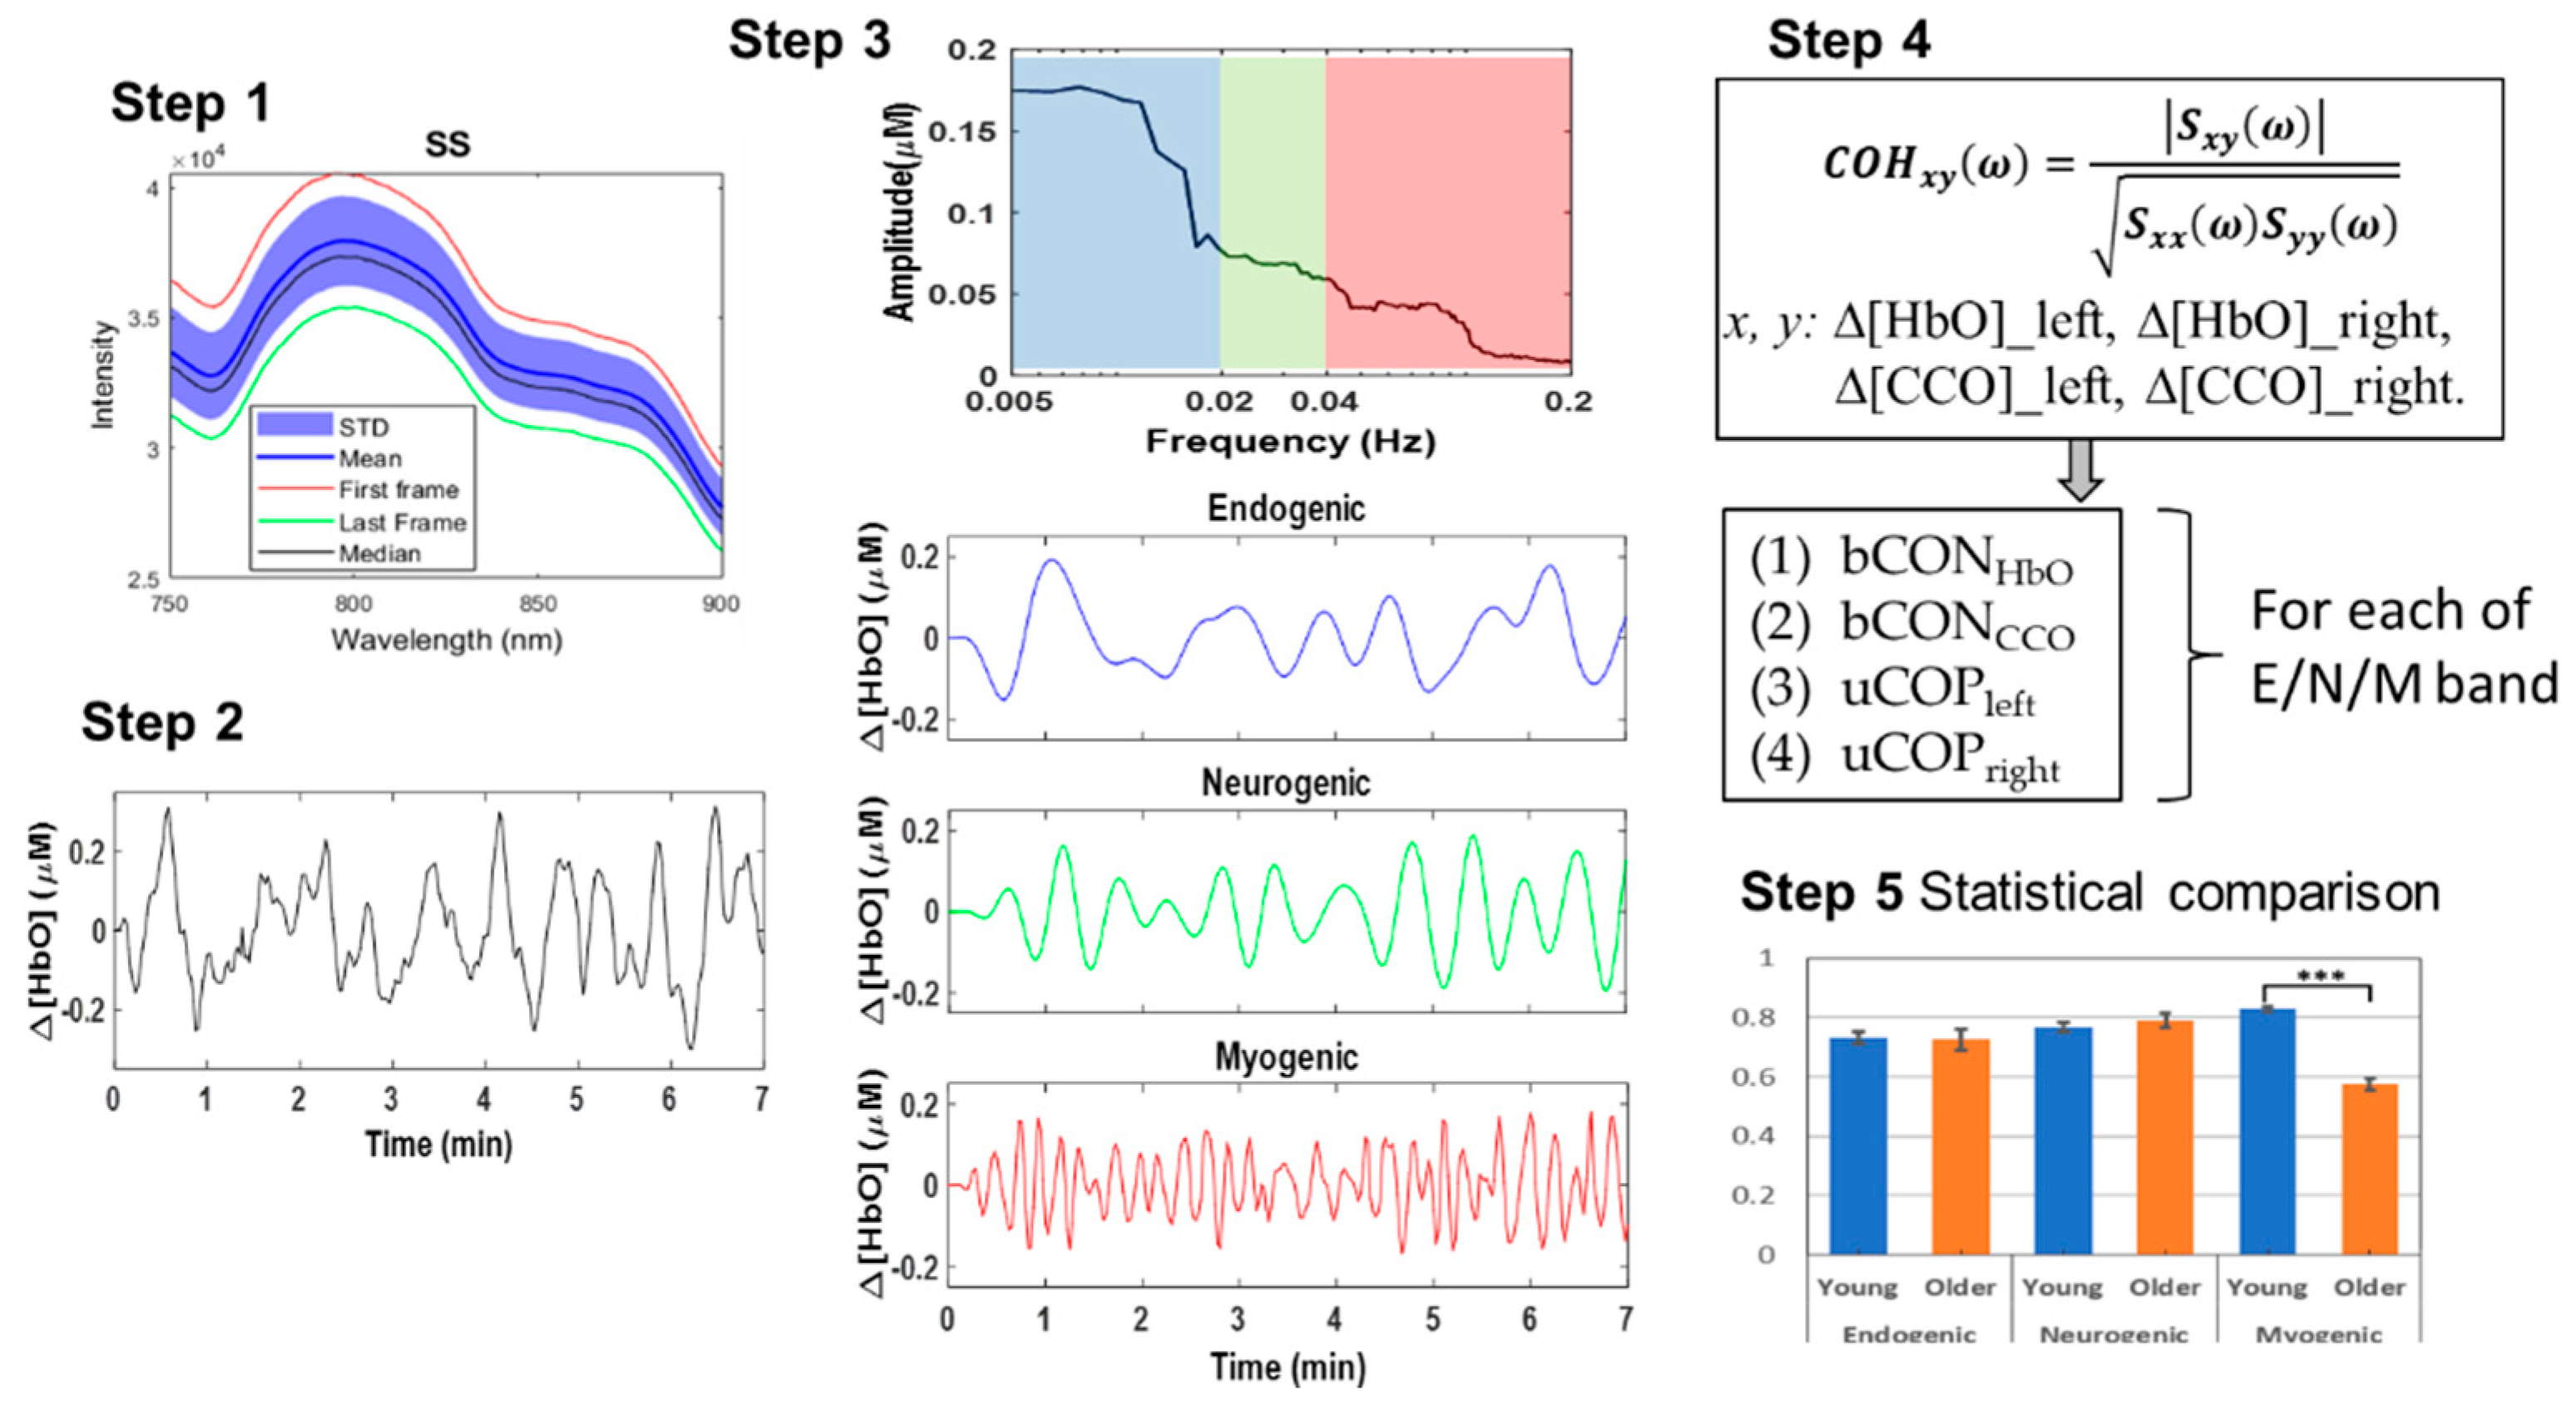
| (a) Bilateral hemodynamic connectivity, bCONHbO, of the two age groups | ||||
| Frequency Bands | OA (n = 24) | YA (n = 26) | p values (t-test) | Cohen’s d |
| Endogenic | 0.72 ± 0.17 | 0.73 ± 0.22 | 0.79 | N/A |
| Neurogenic | 0.79 ± 0.12 | 0.77 ± 0.17 | 0.59 | N/A |
| Myogenic | 0.58 ± 0.10 | 0.83 ± 0.11 | 1.1E-12 *** | 2.35 |
| (b) Bilateral metabolic/mitochondrial connectivity, bCONCCO, of the two age groups | ||||
| Frequency Bands | OA (n = 24) | YA (n = 130) | p values (t-test) | Cohen’s d |
| Endogenic | 0.43 ± 0.14 | 0.36 ± 0.25 | 0.023* | 0.37 |
| Neurogenic | 0.36 ± 0.14 | 0.32 ± 0.21 | 0.1625 | N/A |
| Myogenic | 0.35 ± 0.04 | 0.15 ± 0.08 | 1.1E-21*** | 2.99 |
| (a) Unilateral coupling on the left prefrontal cortex, uCONleft, of two age groups | ||||
| Frequency Bands | OA (n = 24) | YA (n = 26) | p values (t-test) | Cohen’s d |
| Endogenic | 0.47 ± 0.19 | 0.35 ± 0.24 | 0.011* | 0.536 |
| Neurogenic | 0.41 ± 0.14 | 0.33 ± 0.21 | 0.0098** | 0.508 |
| Myogenic | 0.44 ± 0.06 | 0.24 ± 0.12 | 1.4E-18*** | 1.96 |
| (b) Unilateral coupling on the right prefrontal cortex, uCONright, of two age groups | ||||
| Frequency Bands | OA (n = 24) | YA (n = 26) | p values (t-test) | Cohen’s d |
| Endogenic | 0.45 ± 0.14 | 0.36 ± 0.21 | 0.023* | 0.44 |
| Neurogenic | 0.38 ± 0.15 | 0.25 ± 0.17 | 0.0007*** | 0.78 |
| Myogenic | 0.47 ± 0.07 | 0.22 ± 0.11 | 3.9E-18*** | 2.72 |
Disclaimer/Publisher’s Note: The statements, opinions and data contained in all publications are solely those of the individual author(s) and contributor(s) and not of MDPI and/or the editor(s). MDPI and/or the editor(s) disclaim responsibility for any injury to people or property resulting from any ideas, methods, instructions or products referred to in the content. |
© 2023 by the authors. Licensee MDPI, Basel, Switzerland. This article is an open access article distributed under the terms and conditions of the Creative Commons Attribution (CC BY) license (http://creativecommons.org/licenses/by/4.0/).


