Preprint
Article

Two-fold ND5 genes, three-fold control regions, lnc RNA, and the “missing” ATP8 were surprisingly found in the mitogenomes of Polypedates megacephalus (Rhacophridae: Polypedates)

Altmetrics

Downloads

131

Views

47

Comments

0

A peer-reviewed article of this preprint also exists.

Submitted:

29 August 2023

Posted:

30 August 2023

You are already at the latest version

Alerts
Abstract
In this study, we resequenced the mitogenomes of P. megacephalus from different regions using a “primer bridging” approach with Sanger sequencing technologies. The mitogenome of this species was found to contain two copies of the ND5 genes and three copies of the control regions. Furthermore, multiple tandem repeats were identified in the control regions. Notably, we observed that there was no correlation between the distribution of species and their genetic distance. However, our research revealed the discovery of the “missing” ATP8 gene in P. megacephalus as well as three other previously published Polypedates, as a result of manual data curation. Using the mitogenome, gene expression analysis was performed via RT-qPCR of liver samples and determined that COIII, ND2, ND4, and ND6 were reduced to 0.64±0.24, 0.55±0.34, 0.44±0.21 and 0.65±0.17 under the low-temperature stress (8℃), respectively, as compared with controls (P<0.05). Remarkably, the transcript of long non-coding RNA (LncRNA) between positions 8029 and 8612 decreased significantly with exposure to low-temperature stress (8℃). Antisense ND6 gene expression showed a downward trend but this was not significant. These results reveal that modulations of protein-coding mitogenomes genes and lncRNAs of P. megacephalus play a crucial part in the molecular response to cold stress.
Keywords: 
Subject: Biology and Life Sciences  -   Animal Science, Veterinary Science and Zoology

Introduction

The genus Polypedates originated primarily in the islands of Southeast Asia during the Oligocene period and currently comprises 26 species that are widely distributed in South Asia, Southeast Asia, and East Asia [1]. Climate fluctuations have had a significant impact on the distribution of Polypedates species. With the effect of global warming, Polypedates have spread from Sundaland to mainland Southeast Asia and East Asia [2]. Low temperatures are thought to be the primary factor affecting the northward dispersal of Polypedates on the Chinese mainland, where they are mostly distributed in regions south of the Tsinling Mountains. Mitochondria, known as the cell’s energy factories, generate ATP through oxidative phosphorylation [3]. The contain genetic genome of mitochondria is independent of the nucleus. Additionally, they possess the ability to resist and adapt to the impact of cold stress, in order to maintain energy balance. This response may differ at various levels, including gene expression [4,5], protein levels [6,7], and enzyme activity [7,8]. Numerous studies have demonstrated that mitochondrial genes alter their expression to adapt to adverse environmental conditions [9,10,11,12]. However, few studies have investigated the impact of hypothermic stress on mitochondrial gene expression in the Polypedates genus.
The mitogenomes of tree frogs are arranged compactly, comprising 37 genes that include 13 protein-coding genes (PCGs), 22 tRNAs, and 2 ribosomal RNAs [13,14,15]. The length of mitogenomes varies depending on the length and number of control regions (CRs), generally ranging from 16-22 kb. Gene rearrangement is a frequent phenomenon in tree frogs and can be explained by the tandem duplication-random loss (TDRL) model [16] and the slipped-strand mispairing model [17]. Among the known species of tree frogs, mitochondrial ND5 gene rearrangements are classified into the following two types: (1) the ND5 gene shifted from between ND4 and ND6 genes to between the CR and LTPF gene cluster (Buergeria buergeri [18], Zhangixalus dennysi [19]), and (2) the ND5 gene translocated between the two CRs (Zhangixalus schlegelii [20], P. impresus [21], Polypedates mutus [21], Polypedates braueri [22]). The mitogenome of P. megacephalus was initially sequenced by Zhang et al., revealing a 16,473 bp genome lacking the ND5 gene and ATP8 gene [23]. Later, Huang et al. revised the length of the mitogenome to 19,952 bp and discovered that the ND5 gene had not been lost, but rather was shifted to between two CRs with high similarity [24]. The occurrence of duplicated CRs is common in the Neobatrachia suborder, not only in Rhacophoridae [20,22,24,25] but also in other families such as Mantellidae [26,27], and Dicroglossidae [28,29]. This pattern of duplicated CRs is phylogenetically conserved and may be attributed to independent [30,31] or concerted evolution [32,33,34].
The 13 PCGs are crucial for cellular ATP synthesis and have a major role in oxidative phosphorylation [3,35]. ATP synthase is a complex comprised of multiple subunits encoded by mitochondrial and nuclear genes, which form the F0 and F1 functional domains. The ATP8 gene encodes the A6L subunit of the F0 complex. This subunit has a conserved amino acid motif MPQL and N-terminal transmembrane helix that shows considerable homology with one of the two b subunits from α-proteobacteria, suggesting that A6L is an evolutionary remnant of this bacterial subunit [36,37]. Previous research has focused on the absence of the ATP8 gene in invertebrates such as Mollusca [38,39], Rotifera [40,41], and Nematoda [42]. However, recent studies have detected the presence of the ATP8 gene in flatworms through manual annotations and transcriptomic data [43]. Despite this, due to its short length and highly divergent nature, even within a genus, the ATP8 gene is not conserved in flatworms [44]. Gene loss is rare among vertebrates compared to gene rearrangement, but it has been reported that the ATP8 gene is missing only in the genus Polypedates [21,23,24]. Whether the ATP8 gene was actually “missing” in Polypedates has become a concern for researchers.
Herein, we resequenced and reannotated the mitogenomes of P. megacephalus from eight different locations. Surprisingly, a novel rearrangement with twofold ND5 genes and threefold CRs was found for the first time in anurans. Furthermore, through manual annotation and RT-qPCR, we detected a novel ATP8 located upstream of ATP6, and a lncRNA located between ATP8 and tRNALys. In addition, we analyzed the expression of the 13 mitochondrial PCGs and two lncRNAs in the liver under low-temperature stress to gain a deeper understanding of the molecular mechanisms under cold stress in P. megacephalus.

2. Materials and Methods

2.1. Sampling and Treatments

Twenty male P. megacephalus were captured from a rice paddy in Conghua, Guangdong Province, China on June 21, 2021. All animals were fed yellow mealworms in a plastic box at 25℃ for one week. Ten randomly selected frogs were transferred to a plastic box and placed at 8℃ for 24 h as the stress group. Meanwhile, another ten frogs were kept in another plastic box at a constant temperature of 25℃ for 24 hours to serve as a control group. All frogs were euthanized by double pithing and their livers were removed and placed into pre-chilled cryotubes before being immediately flash-frozen in liquid nitrogen. Liver tissue samples were subsequently stored at -80℃ for downstream molecular analyses. We also obtained samples of P. megacephalus from Jinhua, Zhejiang, China (ZJJH), Fuqing, Fujian, China (FJFQ), Guilin, Guangxi, China (GXGL), Qinyuan Guangdong, China (GDQY), Huidong, Guangdong, China (GDHD), Wenzhou, Zhejiang, China (ZJWZ), and Phuket, Thailand (TGPJ) during 2010-2022, which were used to acquire the complete mitogenomes (Table S1).

2.2. DNA Extraction and Sequencing

Total genomic DNA was extracted from a clipped toe using the Ezup Column Animal Genomic DNA purification Kit (Sangon Biotech Company, Shanghai, China) in compliance with the manufacturer’s standard protocols for tissue. We amplified 10 overlapping genes by normal PCR and long-accurate PCR methods slightly modified from Zhang et al. [45]. Additionally, the ND5 fragments were successfully obtained using primers designed by Cai et al. [46]. After obtaining the ND5 gene fragment, four sets of primers were designed to sequence adjacent gene fragments including the region from ND5(1) to ND5(2) genes, the region from Cytb to ND5(1) genes, and the region from ND5(2) to tRNAPro genes (Figure 1). An overview of all fragments is given in Table 1 and Table S2. Unexpectedly, the amplicons generated from Cytb to ND5(1), and ND5(1) to ND5(2), and ND5(2) to tRNAPro fragments were found to have lengths of approximately 3,400 bp, 3,300 bp, and 4,100 bp, respectively. These PCR products underwent bidirectional sequencing utilizing the primer-walking method by Sangon Biotech Company (Shanghai, China).

2.3. Assembly and Annotation

Via the DNASTAR Package v.7.1 [47], all mitogenomes were assembled sucessfully. Meanwhile, the tRNAscan-SE 2.0 web server (http://mitos.bioinf.uni-leipzig.de/index.py) [48] was used to identify the tRNA genes. Referring to the mitogenomes of P. megacephalus published in the GenBank database (AY458598, MH936677), two rRNAs and 12 PCGs (excluding the ATP8 gene) were identified via MEGA 7.0 [49]. To analyze the ATP8 sequences, we utilized SMART [50] with default parameters to identify domains. The hydrophobicity profiles of the resulting amino acid sequences were generated via the ExPASy tool ProScale [51]. In addition, AlphaFold2 (https://colab.research.google.com/github/sokrypton/ColabFold/blob/main/AlphaFold2.ipynb) [52], in combination with the Swiss-Model server (SWISS-MODEL (expasy.org)) [53], were also applied to predict the structure of the ATP8 proteins. The identical approach was applied to locate ATP8 in the previously published mitogenomes of P. mutus, P. braueri, and P. impresus. The AT% and relative synonymous codon usage (RSCU) of five complete genomes were calculated using MEGA 7.0 [49]. Tandem Repeats Finder (http://tandem.bu.edu/trf/trf.submit.options.ht-ml) [54] was utilized for identifying tandem repeats. The GC-skew and AT-skew indices were calculated by the following equations: GC-skew = (G - C)/(G + C), AT-skew = (A - T)/(A + T).

2.4. Molecular Phylogenetic Analyses

A total of 19 species mitogenomes of Rhacophoridae, including five newly complete (GDCH, GXGL, ZJJH, FJFQ, TGPJ) and three almost complete (GDHD, GDQY, ZJWZ) mitogenomes of P. megacephalus, were used for phylogenetic analyses (Table S3). Mantella madagascariensis (GenBank: AB212225) and Mantella baroni (GenBank: MH141579) were used as outgroups. Due to the sequence divergence in duplicate ND5 in TGPJ and FJFQ and the high heterogeneity of ATP8 in the Polypedates, 11 PCG genes and two rRNA genes were aligned using MAFFT v 7.475 [55]. Using Phylosuite v1.2.3pre3 [56], all genes were extracted, Gblocked, and concatenated into a line under general default parameters and workflow. Ultimately, these 13 processed genes consisted of a mitogenome dataset with 11,406 bp-length. Then, the dataset’s optimal partitioning scheme and specific nucleotide substitution models were determined by PartitionFinder v2.1.1 [57] with general default parameters. The specific partition schemes and the corresponding best-fit models selected for each part were documented in detail in Table S4. The GTR+I+G model was selected for ML and BI analyses. The ML analysis was performed with RaxML 8.2.0 [58] with rapid inference based on 1000 ultrafast repetitions. Meanwhile, the BI analysis was performed with MrBayes 3.2 for a total of 10 million generations, and the mean standard deviation of Bayesian split frequencies was below 0.01. The first quarter of generations were removed as burn-in. Based on the Kimura 2-Parameter (K2P) model, the genetic distances between different geographic sites were calculated, separately. Additionally, geographical distance was calculated from longitude and latitude. The strength of correlations between the genetic distances and the geographical distance matrices was tested using Mantel tests in GenALEx v6.0 [59].

2.5. RT-qPCR

Total RNA was extracted from liver samples of control and 24 h cold-exposed (at 8°C) P. megacephalus GDCH using a TakaRa MiniBEST Universak RNA Extraction Kit (Takara, Japan), according to manufacturer’s instructions. Quality control and reverse transcription of the extracted RNA were conducted following the procedures established by Jin et al. [10]. According to the newly obtained sequence of P. megacephalus from Conghua, Guangdong, Primer Premier 5.0 [60] was used to design specific primers for reverse transcription-quantitative polymerase chain reaction (RT-qPCR) (Table 2). The amplification products ranged from 97 to 155 bp in length, with melting temperatures between 48°C and 50°C and primer lengths between 18 and 22 bp. Three technical replicates were used to assess the genes corresponding to each primer pair. RT-qPCR was then performed using the conditions specified by Jin et al. [10].
The data are presented as the mean expression levels (± SE) for each experimental condition based on four independent experimental replicates from different individuals. The Grubbs’ test was applied to eliminate outliers. Statistical assessment of mRNA expression was conducted using a t-test, with significance set at P<0.05, as compared to the control group.

3. Results

3.1. Genome Organization and Gene Arrangement

In the present study, we obtained five complete mitogenomes and three partial mitogenomes of P. megacephalus from diverse geographic zones (Table S5). The newly sequenced complete mitogenomes varied in size from 23,798 bp in FJFQ to 24,103 bp in ZJJH. All mitogenomes contained 13 identified open reading frames (including the extra copy of the ND5), two rRNA genes, 22 transfer RNA genes, three CRs, and one long non-coding region (LNCR). Additionally, a short form of ATP8 with an ATG start codon and a TAG stop codon was identified, which was previously unannotated in P. megacephalus. As previously reported in other anurans, the majority of the genes were coded on the H-strand, with the exception of ND6 and eight tRNA genes (tRNAPro, tRNAGln, tRNAAla, tRNAAsn, tRNACys, tRNATyr, tRNASer, and tRNAGlu) (Table S6). The RSCU of five complete mitogenomes was identical to that of previous studies [24] (Figure S1).
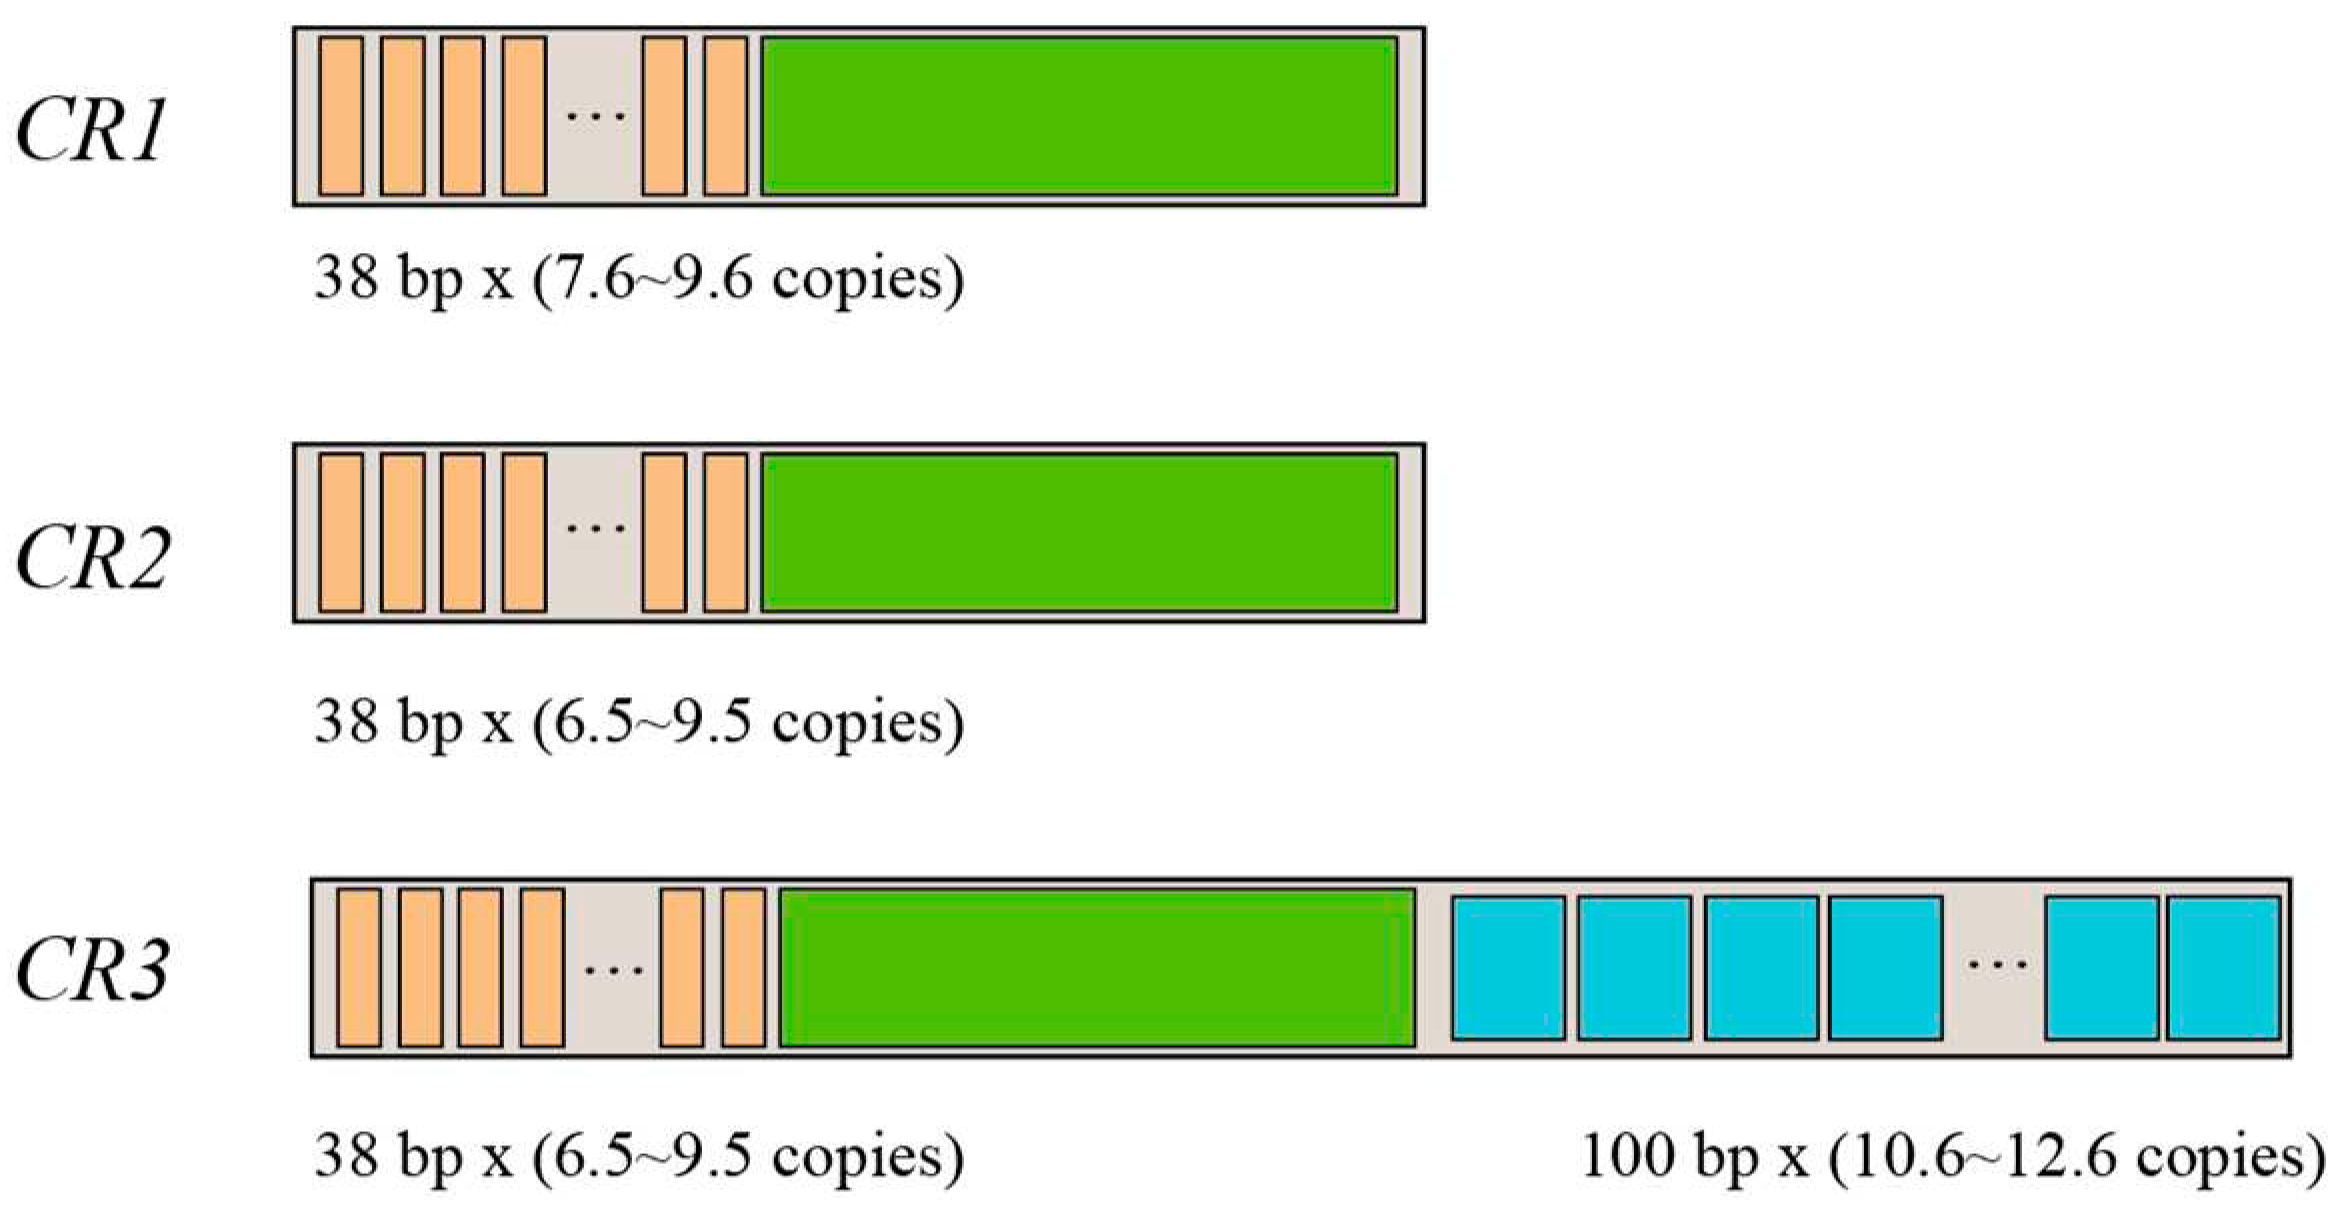
All mitogenomes of P. megacephalus in this study contained threefold CRs and twofold ND5 genes. We named these control regions CR1 (between the Cytb and ND5(1) genes), CR2 (between the ND5(1) and ND5(2) genes), and CR3 (between the ND5(2) and tRNAThr genes). The polymorphism of CR length was determined by the variable sizes and copy numbers of tandem repeats, resulting in size variations of the mitogenomes of the five P. megacephalus examined in this study. As shown in Table S7 and Figure 2, among these mitogenomes, tandem repeat units of 38 bp were detected in the 5' sides of CR1, CR2, and CR3, whereas only the 3' side of CR3 possessed tandem repeat units of 100 bp. Further comparison indicated that the 5' side of three CRs contained nearly identical sequences (around 99% similarity). Three CRs also showed higher AT content (around 66.3% for both CR1 and CR2, and about 70.1% for CR3) than in the whole genome (around 61.4%). Specifically, two identical ND5 genes were detected in the genome from frogs collected at GDCH, GXGL, and ZJJH locations, whereas two similar ND5 genes were found in the TGPJ and FJFQ groups (nearly 98.5% similar sequence). Furthermore, the length of ND5 was 1779 bp except for TGPJ (1785 bp).

3.2. ATP8 Annotation

Due to the annotation challenge presented by its short length and high variability, ATP8 could not be reliably annotated by automated tools in the assembled mitogenomes. Hence, to identify this gene, a series of manual curation steps were performed. The newly annotated ATP8, which was located upstream of and shared four bases (ATAG) with ATP6, had low amino acid similarity to other frogs (similarity <30%). Among these mitogenomes, the putative ATP8 was significantly shorter than its counterparts in other Rhacophoridaes except for P. bruari. In all but one Polypedates, the starting amino acid sequence is MVKT, whereas in P. bruari it was MAKT. As for the four Polypedates species, the ATP8 gene similarity was determined to be 30%, whereas there was 86% similarity between P. impresus and P. megacephalus. Despite lowering the stringency requirements, BLASTN and BLASTX failed to detect the ORF of the ATP8 gene. By using SMART, we only found a transmembrane domain of about 20 amino acids long in the putative ATP8 sequence of the genus Polypedates (Figure 3), whereas no signal peptide or ATPase domain was found.
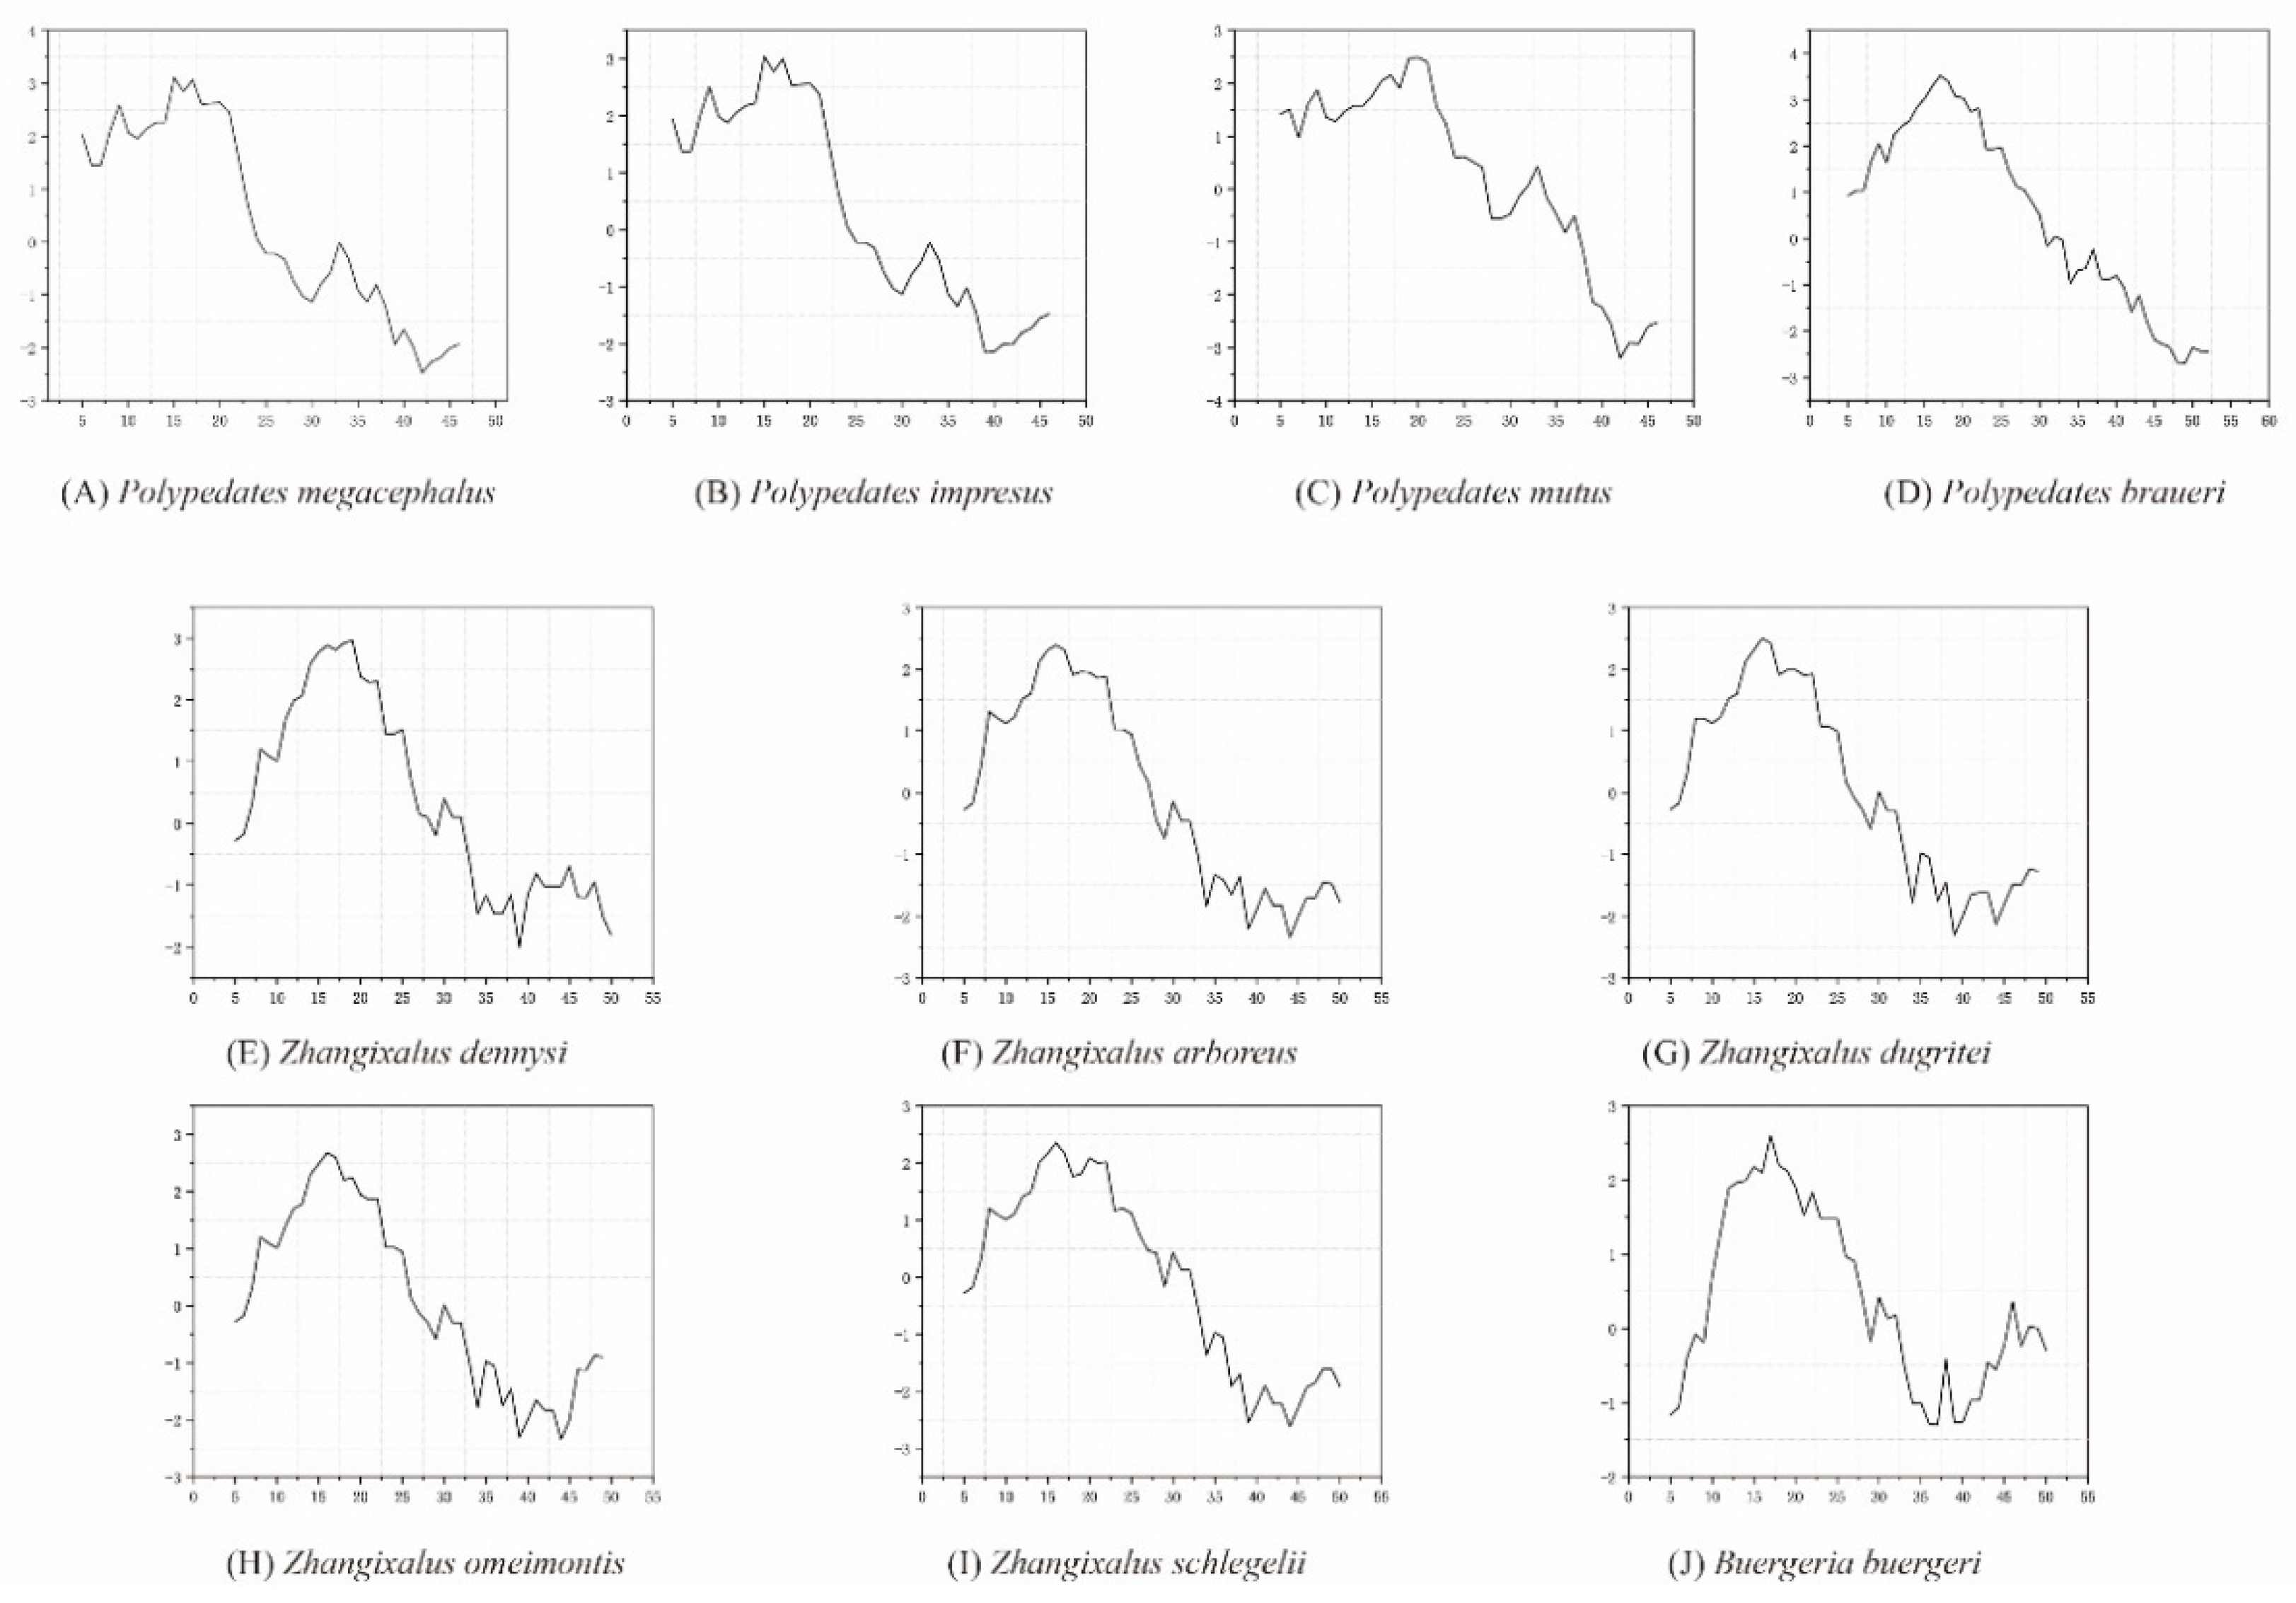
For comparison, the hydrophobic patterns of the annotated ATP8 in the Rhacophoridae family were depicted, as seen in Figure 4. The hydrophobicity profiles of the putative ATP8 amino acid sequences of Polypedates and other reported Rhacophoridae species showed remarkably similar graphs, with positive hydrophobicity at the N-terminus and largely negative scores at the C-terminus. ATP synthase protein 8 was detected using Swiss-model, albeit with low support (P. megacephalus: 10.71% sequence identity; P. mutus: 28.57% sequence identity; P. impresus: 16% sequence identity; P. braueri: 20% sequence identity). In addition, based on the amino-acid sequence alone, the three-dimensional (3D) structure of the ATP8 protein was predicted within Alphafold2 [52]. As depicted in Figure S2, the ATP8 domain structures of all ten Rhacophoridae species were accurately projected, whereas the precision and confidence of the C-terminus was found to be relatively low.
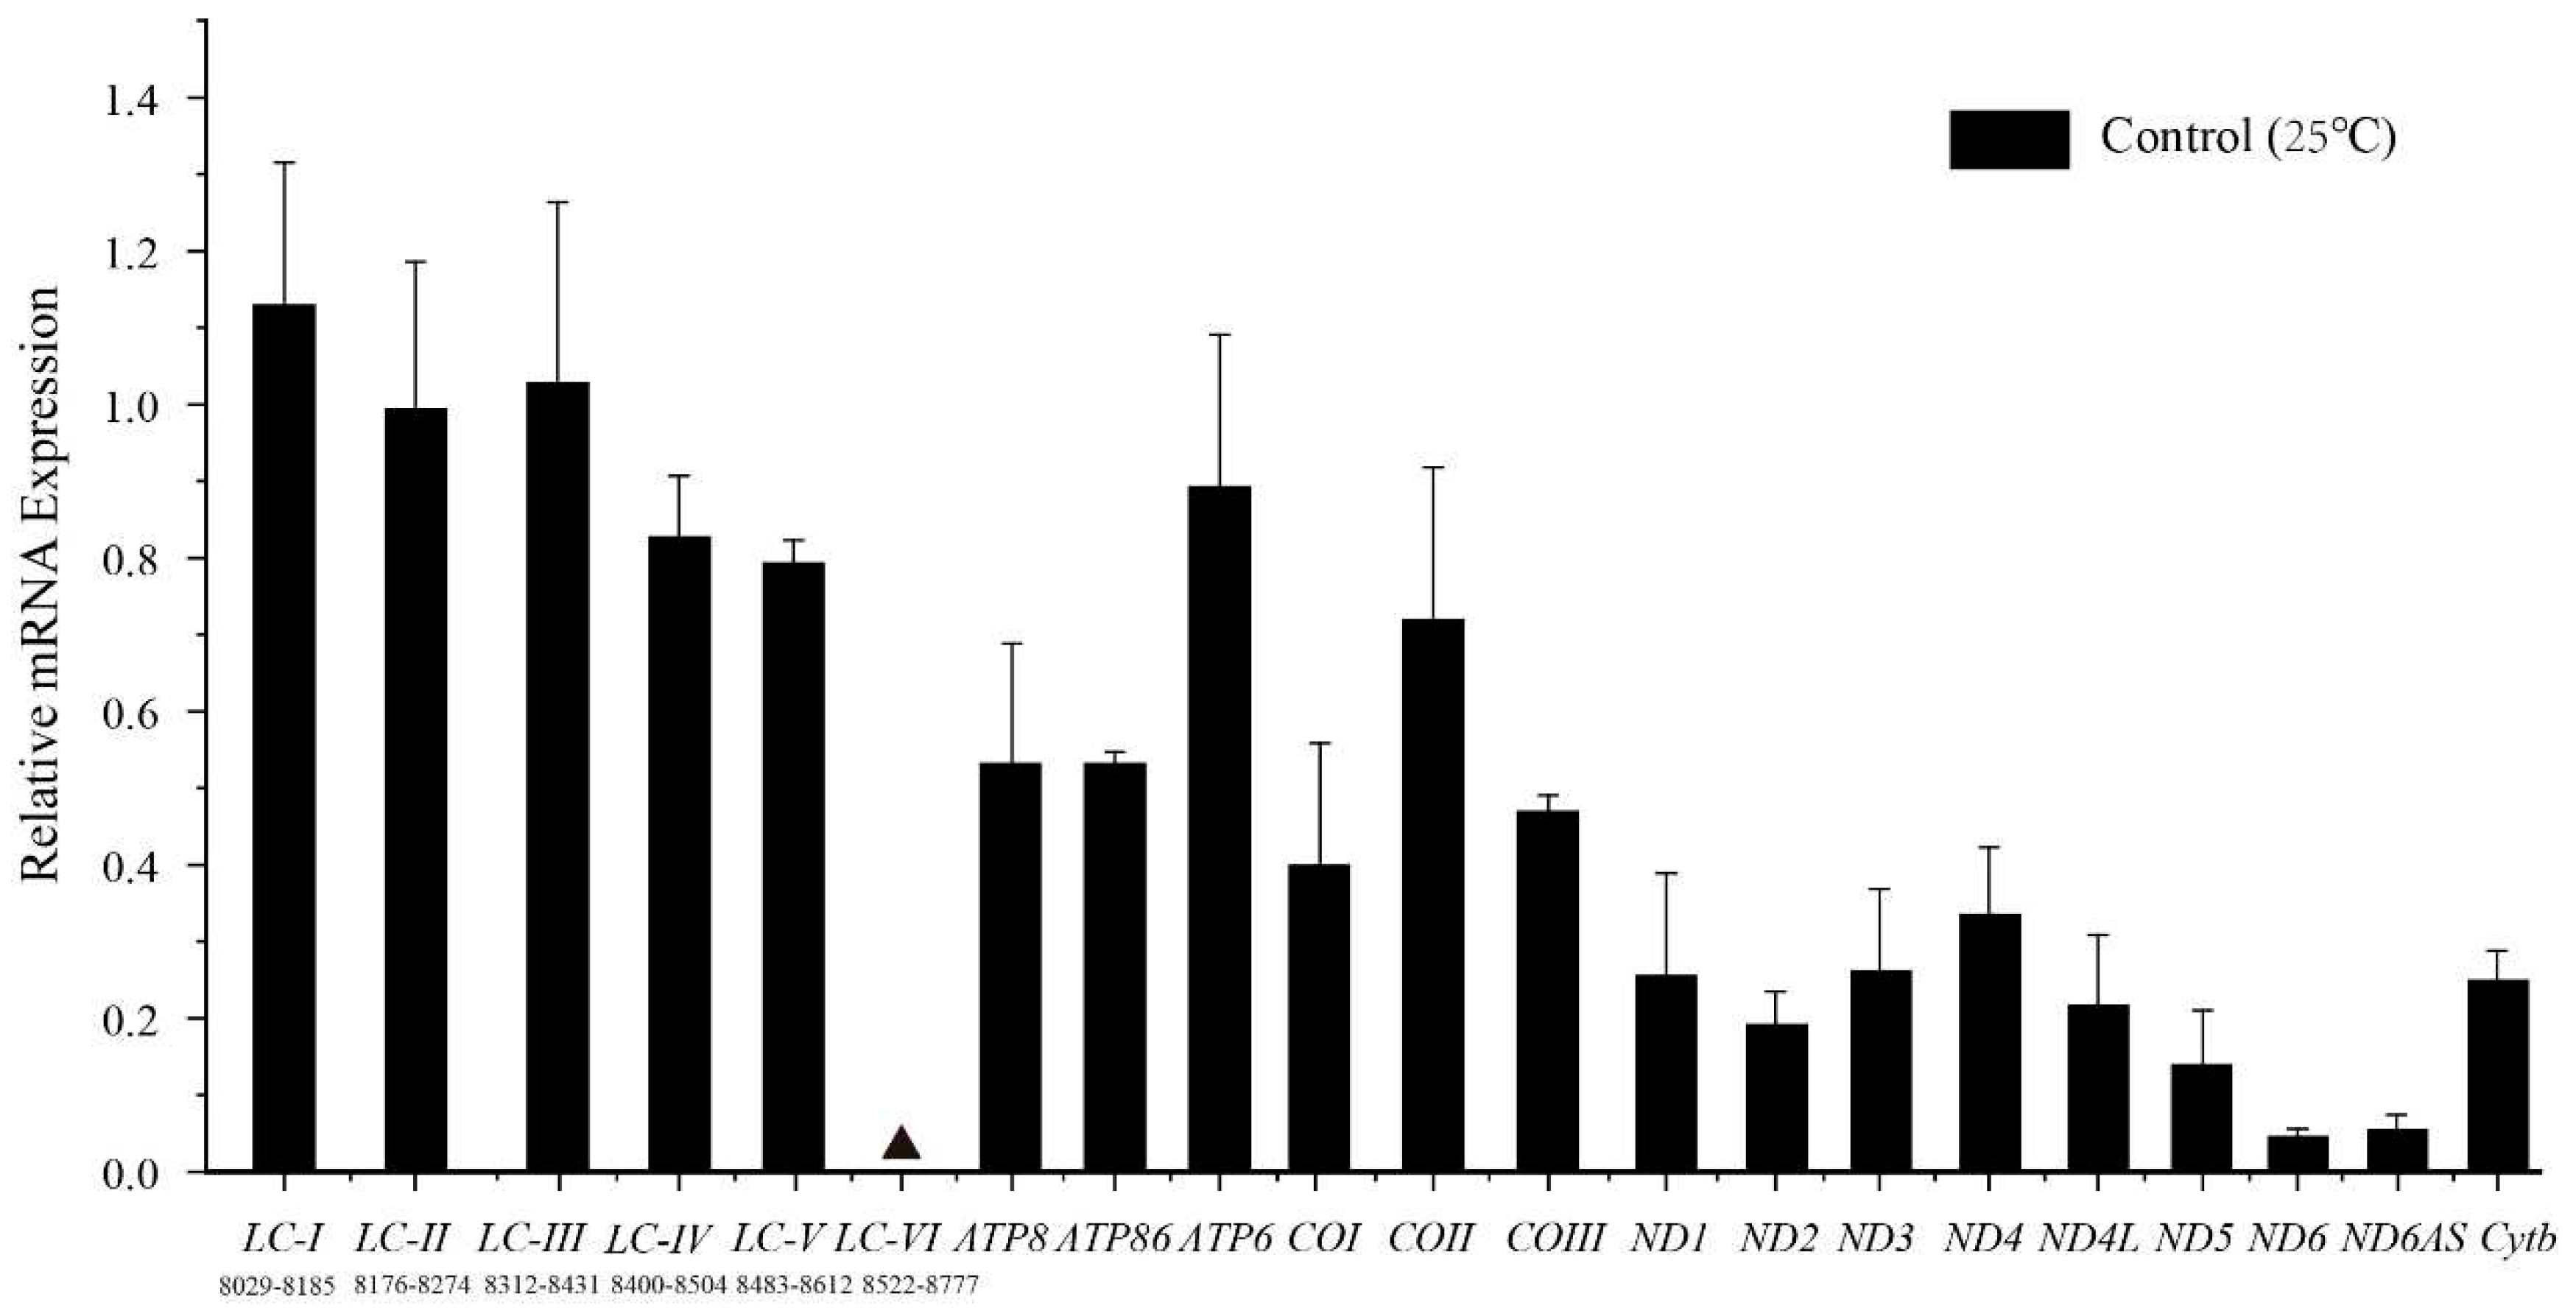
Confirmation of transcription of the idiosyncratic ATP8 was achieved by successful amplification of an RT-PCR product from the predicted partial ATP8, using total RNA isolated from GDCH as the template. To further ensure the accuracy of ATP8 annotation, a pair of quantitative primers (ATP86) spanning ATP8 and ATP6 were designed, and gene expression in this region was detected. The results indicated no significant differences in expression levels between ATP8 and ATP6 (Figure 5).

3.3. Long non-coding RNA

In P. megacephalus, a LNCR with high AT% (58.0%) between tRNALys and ATP8 genes was detected. The length of LNCR was 713 bp except for P. megacephalus GXGL (708 bp). In line with previous studies, this region included a fragment with high similarity to the tRNALys gene (around 76%) that failed to fold into a typical cloverleaf secondary structure. To confirm whether the LNCR can be transcribed into RNA, six pairs of quantitative primers were designed to measure the expression of this region. Among them, the expression levels of the products amplified by the first five primer pairs (LC-I, LC-II, LC-III, LC-IV, LC-V) were significantly 1.8-20.4 times higher than those of protein-coding genes (except for ATP6 and COII, which showed no significant difference) (Figure 5). By contrast, no gene expression was detected in the sixth segment (LC-VI). Due to the difficulty in designing quantitative primers, a 38 bp gap existed between the first amplified segment and the second amplified segment. Nevertheless, as there was no difference in expression levels between the first five segments, we concluded that the first five primer pairs measured gene expression at different positions on the same RNA transcript. Furthermore, the abundance of the antisense ND6 transcript (ND6AS) was higher than that of the sense ND6 transcript (P>0.05).

3.4. Gene Expression of P. megacephalus under Low-Temperature Stress

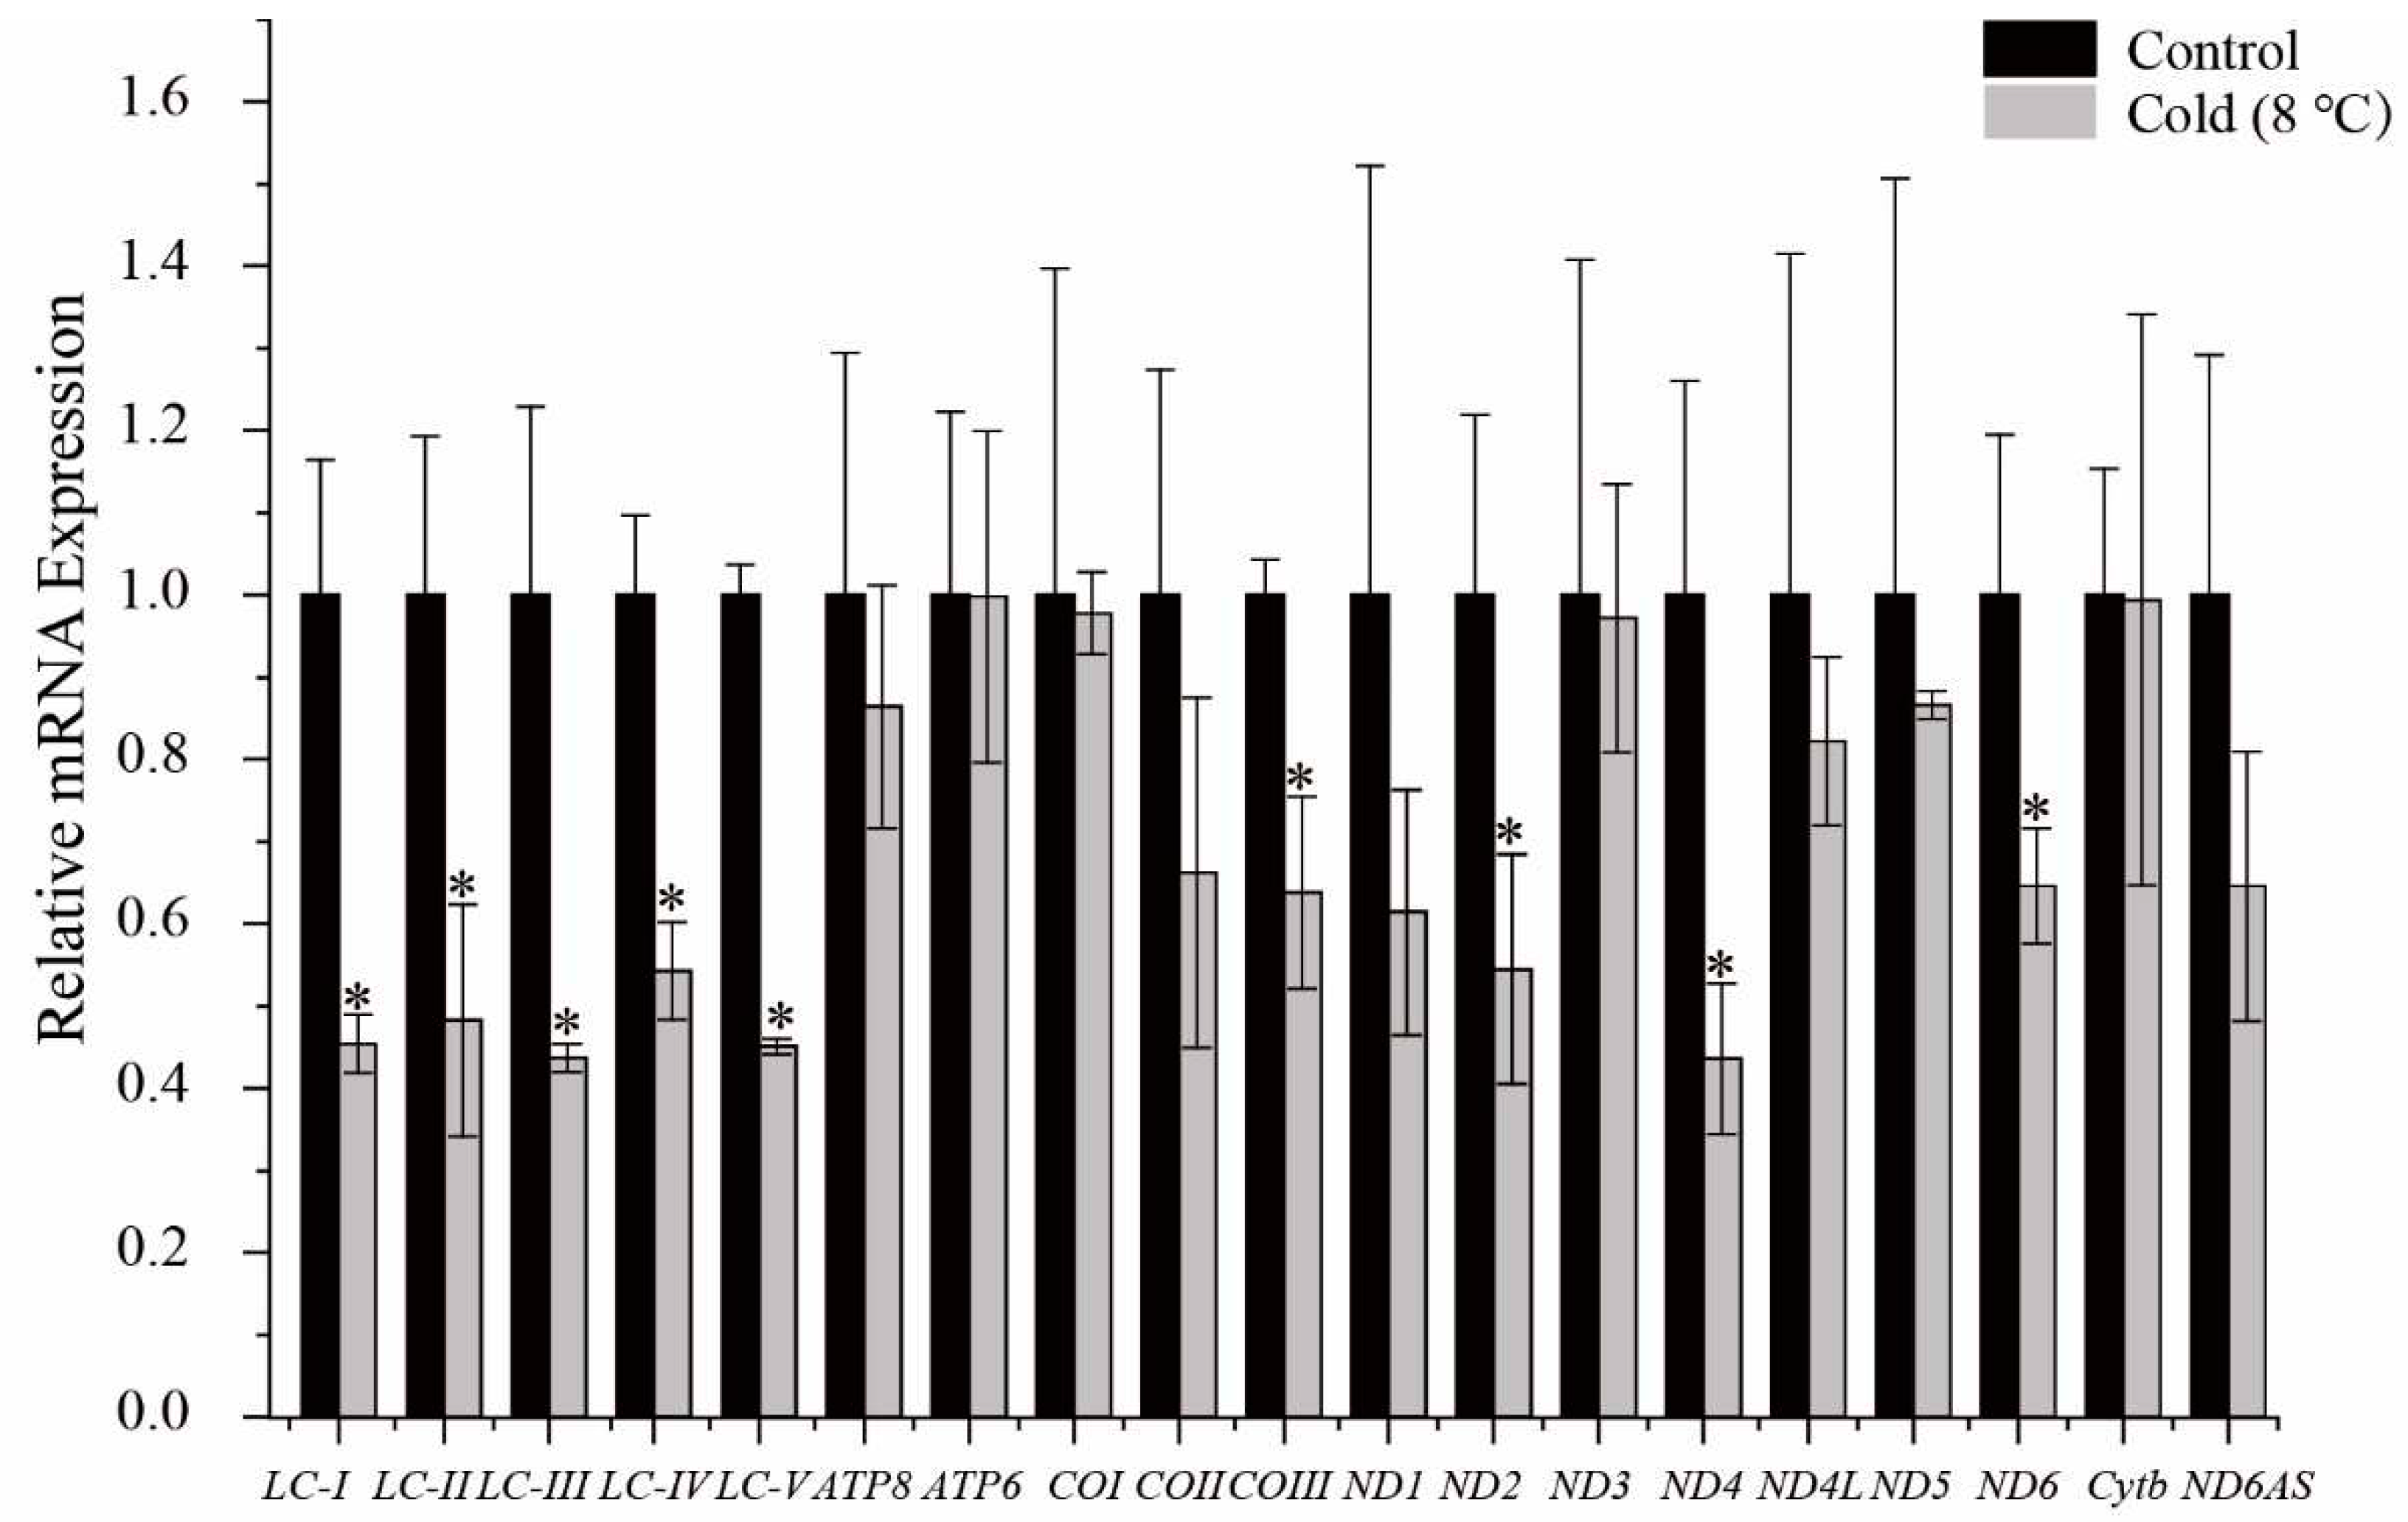
Under hypothermic stress (8℃, 24 h), the transcriptional levels of the 13 mitochondrial PCGs from P. megacephalus GDCH liver were measured to compare control 25℃ with 24 h cold exposure. Transcriptional levels of COIII, ND2, ND4 and ND6 were reduced to 0.64±0.24, 0.55±0.34, 0.44±0.21 and 0.65±0.17, respectively, as compared with controls (P<0.05). The relative transcriptional levels of the remaining 9 protein-coding mitochondrial genes, as well as antisense ND6, did not change in response to cold exposure. In addition, we determined that the transcriptional levels of the long noncoding region between tRNALys and ATP8 (LC-I, LC-II, LC-III, LC-IV, LC-V) were significantly reduced to values of 0.45±0.075, 0.48±0.28, 0.44±0.04, 0.54±0.12, 0.45±0.02, respectively, as compared with controls (P<0.05). Furthermore, there was no statistically significant difference in the transcript abundance of these five regions (Figure 6).

3.5. The genetic distances and phylogenetic relationships of Polypedates

The interspecific genetic distance within P. megacephalus was at least 0.001, ranging from 0.001 to 0.058. GDQY and GDCH showed the shortest geographical distance between all sampling locations, whereas TGPJ and ZJJH were the farthest apart (Table S8). Additional Mantel tests of isolation by distance demonstrated a statistically non-significant correlation between geographic and genetic distances (R2=0.096, P=0.08>0.05) (Figure S3).
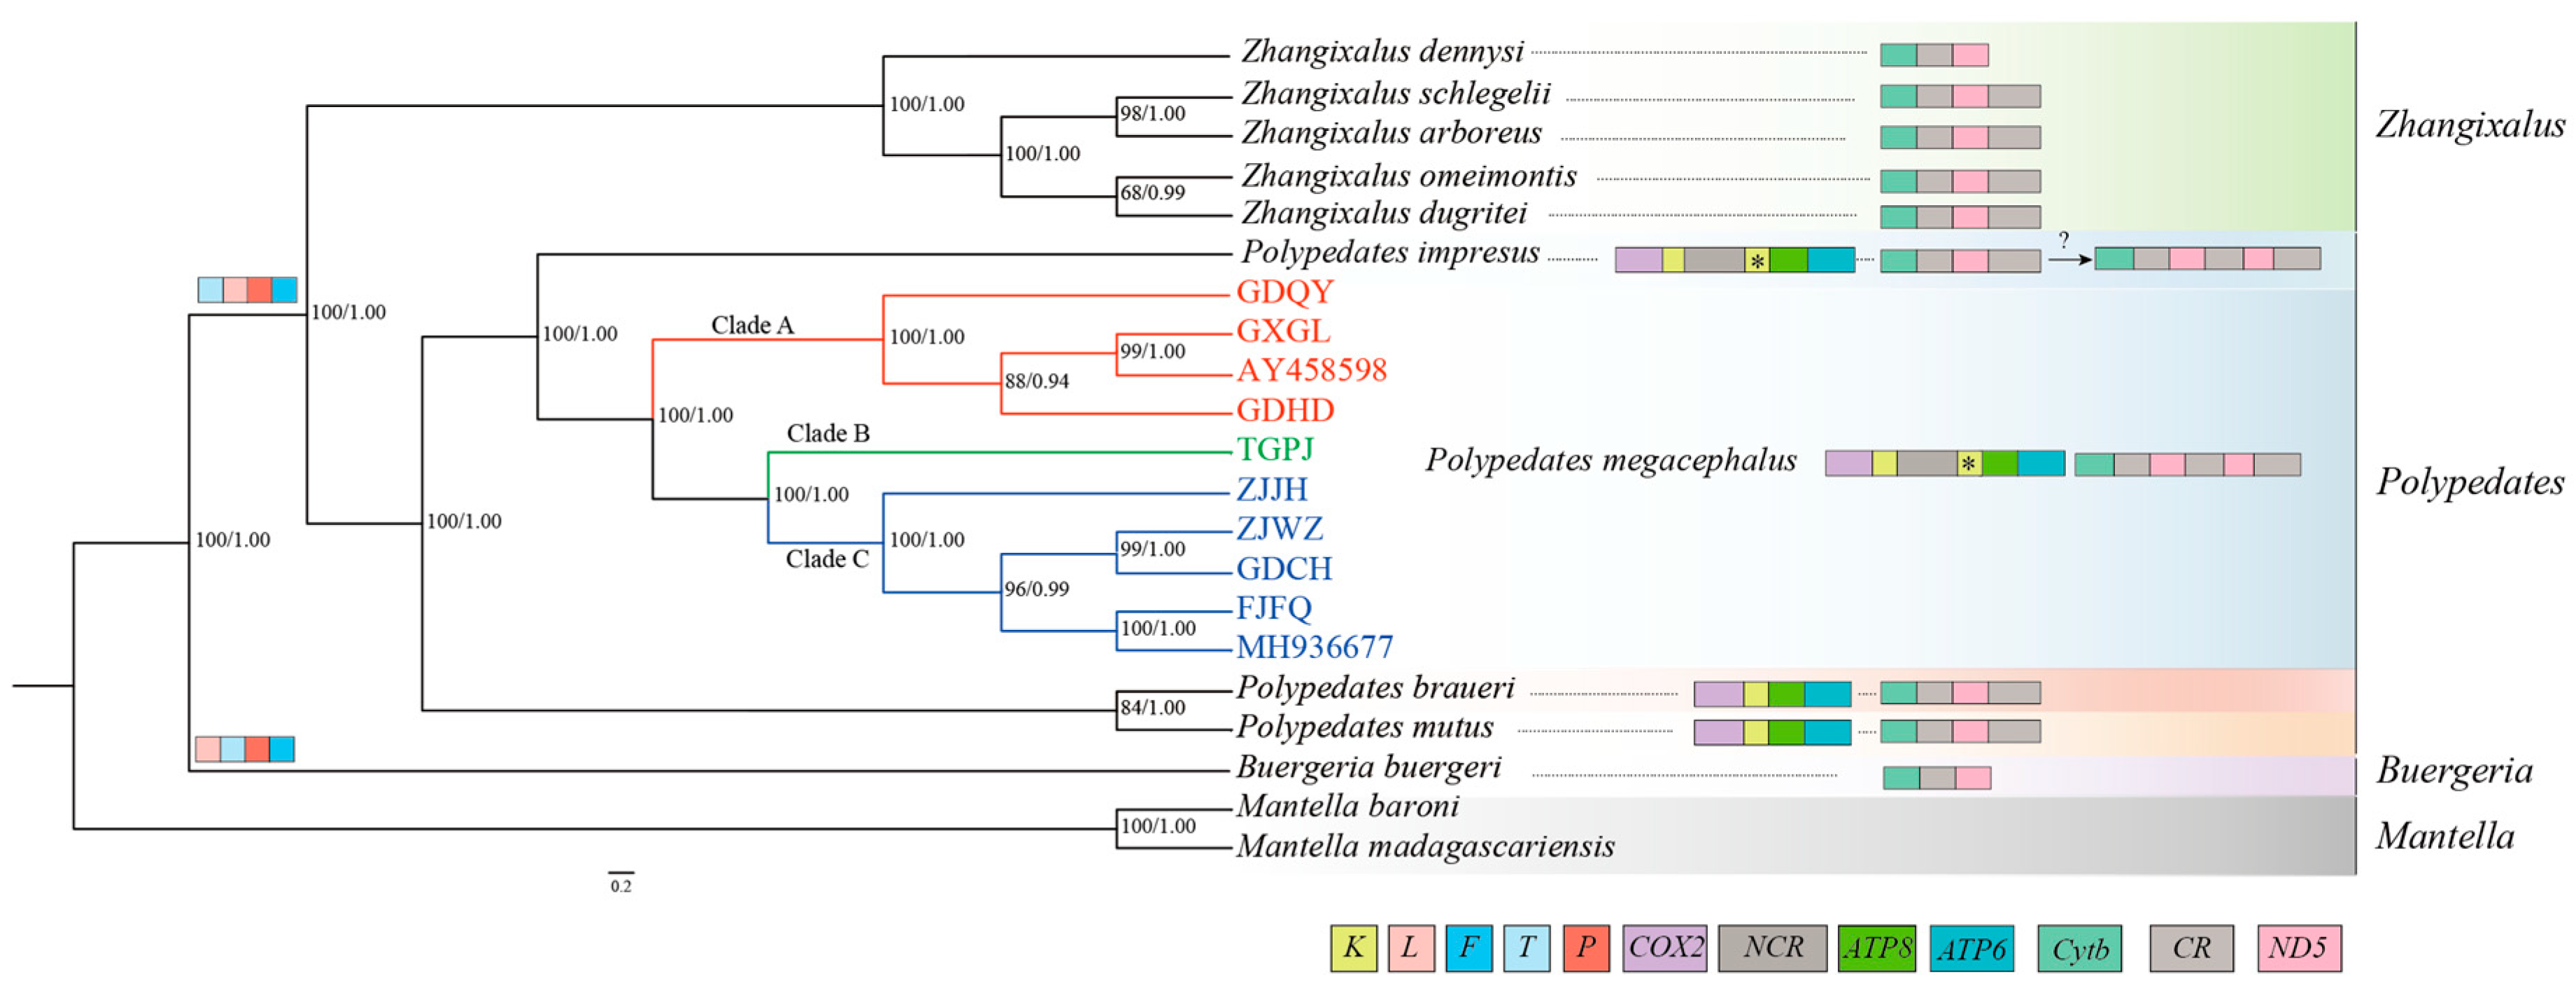
The results from both the two phylogenetic analyses (BI and ML) of the 11 protein-coding genes and two rRNAs showed similar topologies, supporting the previous classification (Figure 7). The phylogenetic analyses of nucleotide datasets with high bootstrap values revealed the formation of two independent sister groups: one composed of P. mutus and P. braueri, and the other composed of P. megacephalus and P. impresus. All specimens of P. megacephalus collected from various localities formed a single clade, which was further divided into three subclades (Clade A, Clade B, Clade C) (Figure 7). However, within Clade C, the frog of GDCH did not cluster with GDHD and GDQY, despite their close geographic proximity. The two previously published P. megacephalus genomes (AY458598, MH936677) from Guangxi province were assigned to Clade A and Clade C, respectively.

4. Discussion

4.1. Gene Rearrangements and Rearrangement Mechanisms

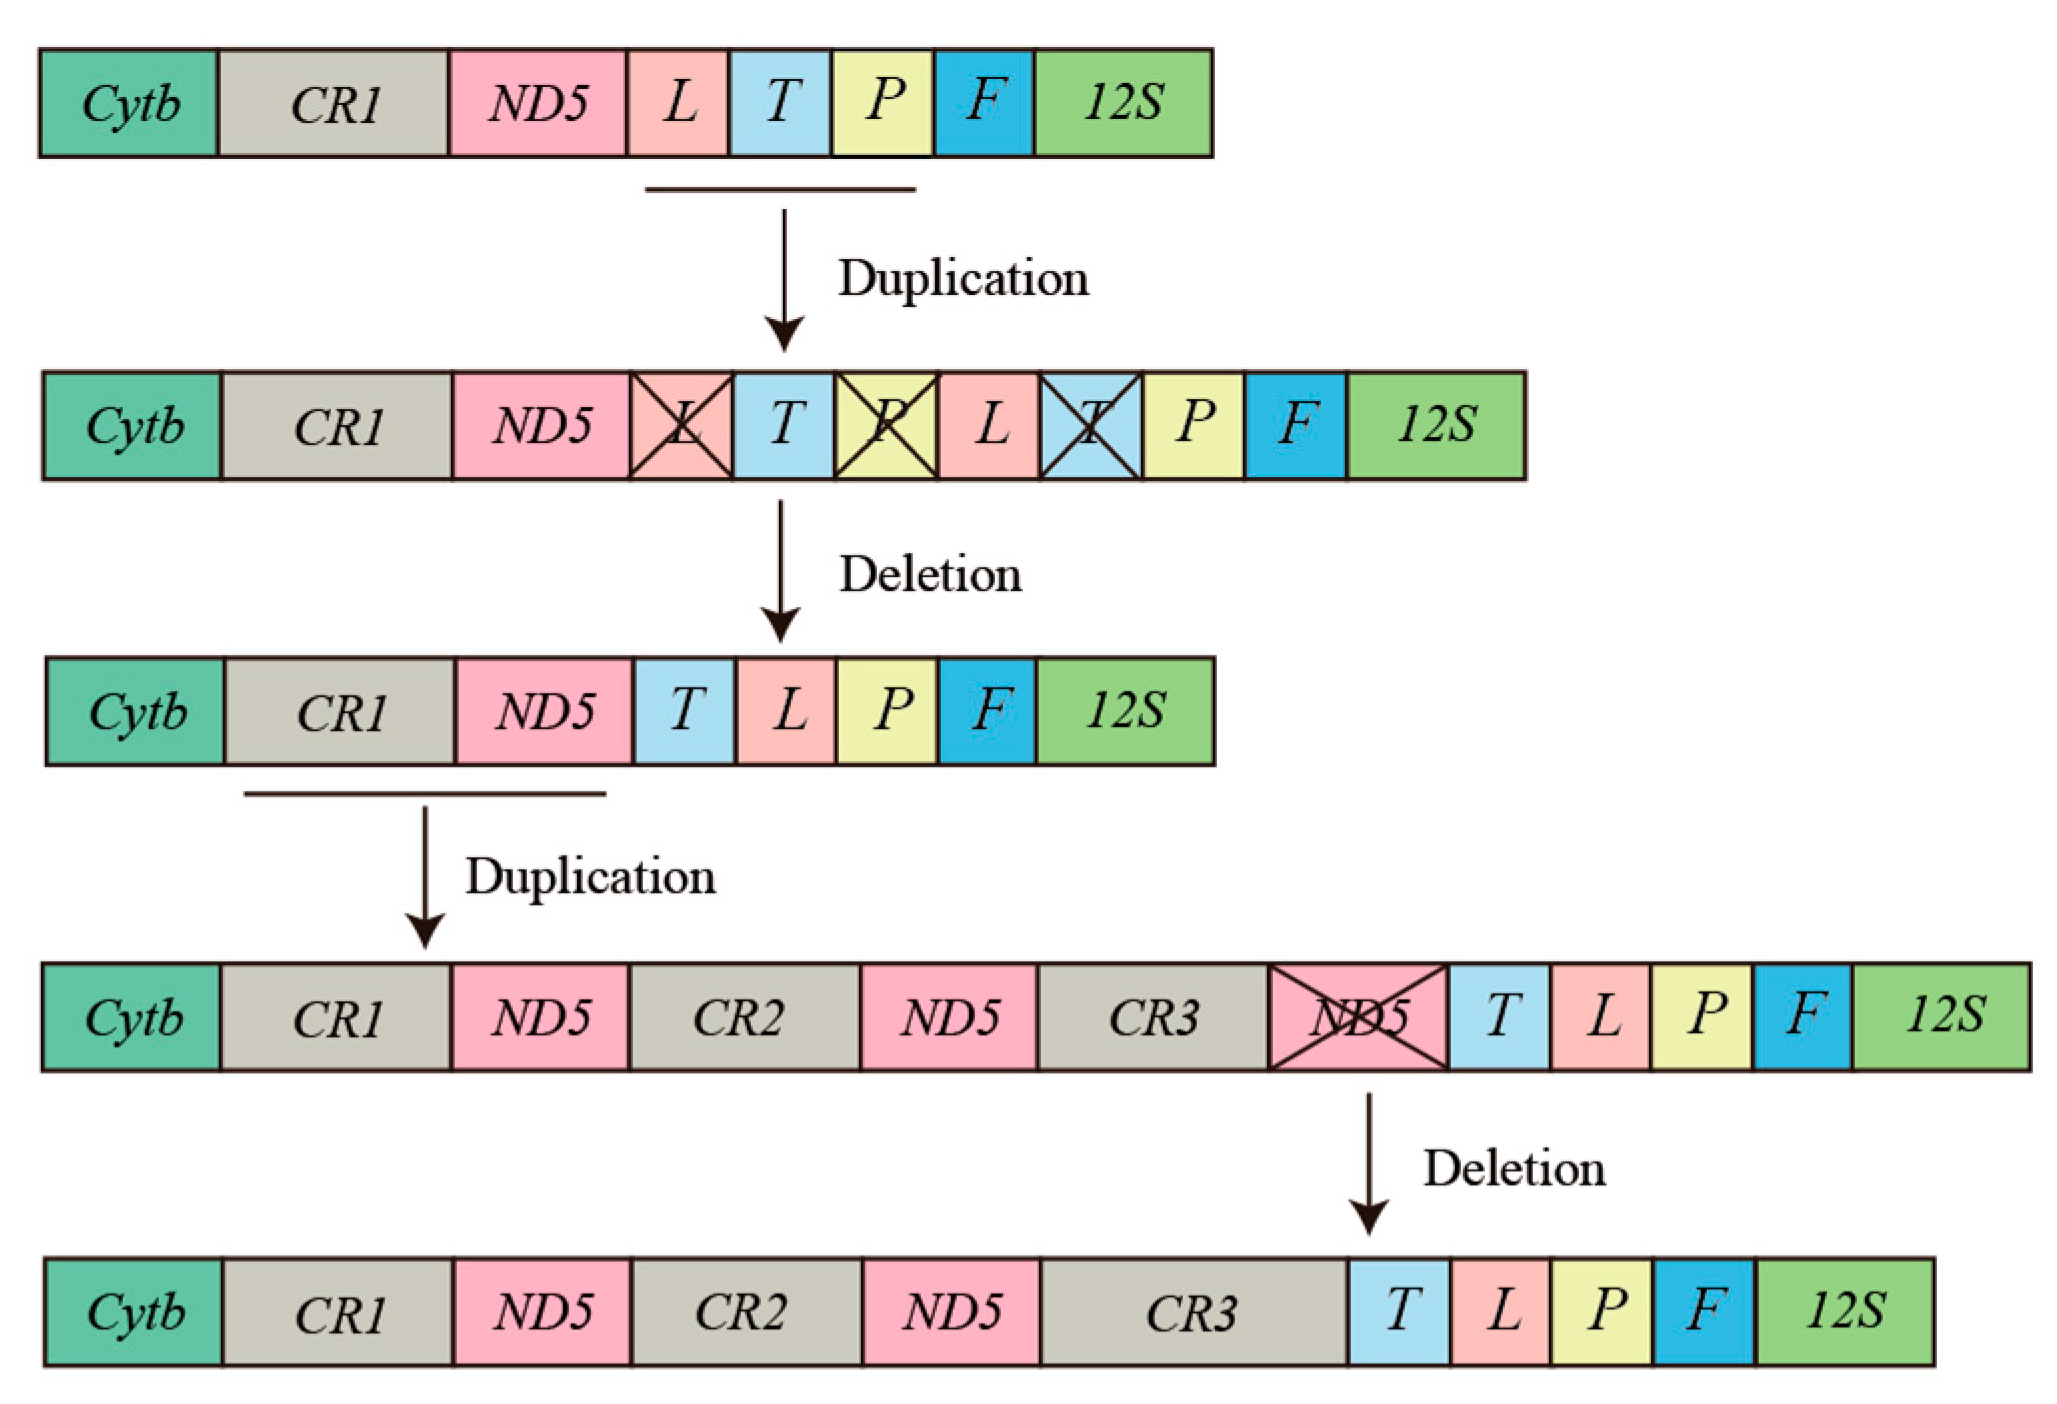
Vertebrate mitogenomes are typically compact and relatively conserved [15]. As the amount of whole mitogenome data for vertebrates has dramatically increased, gene rearrangement phenomena have become a common occurrence in the mitogenomes of vertebrates [61,62,63]. In addition, mitochondrial gene rearrangements are thought to result from tandem duplication of gene regions due to slipped-strand mispairing and the deletion of redundant genes [64,65]. The revised P. megacephalus mitogenomes possessing threefold control regions as well as twofold ND5 genes and a pseudogene of tRNALys seem to prove the occurrence of duplication-and-deletion events. Notably, the existence of three control regions has also been reported in sand lizards [66], whereas tiger frogs have been found to possess twofold ND5 genes [63]. However, the Cytb-CR1-ND5(1)-CR2-ND5(2)-CR3-tRNAThr-tRNALeu-tRNAPro-tRNAPhe gene rearrangement was first reported in anurans. The genus Buergeria was considered to be the most basal group of the Rhacophoridae family with the “Cytb-CR-ND5-tRNALeu-tRNAThr-tRNAPro-tRNAPhe” gene arrangement [18,67,68]. The TDRL model is the most valuable and commonly referenced model for understanding the diversity of gene rearrangements in vertebrate mitogenomes [16,69]. Therefore, we hypothesize that at least two duplication-deletion events must have occurred to explain the rearrangements of P. megacephalus. One rearrangement is a tandem duplication in the area encompassing the CR and ND5 genes. The steps of the TDRL are as follows. First, the CR-ND5 gene cluster was tandemly replicated three times and generated three sets of the identical gene cluster (CR1-ND5(1)-CR2-ND5(2)-CR3-ND5(3)). Secondly, the ND5(3) gene was randomly eliminated, and the new order CR1-ND5(1)-CR2-ND5(2)-CR3 was generated. The other tandem duplication event took place in the region harboring the tRNALeu, tRNAThr, tRNAPro, and tRNAphe genes. The TDRL appears to comprise the following steps: the tRNALeu-tRNAThr-tRNAPro gene cluster underwent two tandem duplications, followed by elimination of tRNALeu, tRNAThr, and tRNAPro, resulting in a new gene order of tRNAThr-tRNALeu-tRNAPro-tRNAPhe (Figure 8).

4.2. Possible Causes for Misdiagnosis of a “single” ND5 Gene

In a prior study, Huang [24] corrected the mitogenome of P. megacephalus using next-generation sequencing and LA-PCR and concluded that the ND5 gene had translocated to the CR 3' end instead of being lost. However, this conclusion contradicts the present study, which revealed the rearrangement structure of “CR1-ND5(1)-CR2-ND5(2)-CR3” using the “primer bridging” method. Re-analyzing Huang’s sequencing method and sequence characteristics revealed two factors that account for the discrepancy between Huang’s result and the present study: (1) In our study, LA-PCR amplification and Sanger sequencing with one set of primers (Primers upstream and downstream were located on ND5) and resulted in a product with 3300 bp, suggesting the existence of two ND5 genes. In Huang’s study, the ND5 gene was obtained using two primer pairs: (a) (upstream primer 1: CytbFow1, downstream primer 1: FND512800H) and (b) upstream primer 2: ND5F2, downstream primer 2: R16M1). Whereas the ND5 obtained by Huang was a combination of two ND5 fragments, the first primer pair amplified the sequence of the first ND5 gene, whereas the second primer pair amplified the sequence of the second ND5 gene. (2) In addition, it was found that the three CRs in the mitogenomes exhibited highly similar sequences in the 5' region, which could lead to sequence assembly errors (ie. CR2 and CR3 were misassembled or combined (as one CR).

4.3. Long non-coding RNA

Long non-coding RNAs (lnc RNAs) are generally defined as those that are >200 nucleotides, lack protein-coding capacity, and show great structural complexity and plasticity [70]. Most of them are generated by the nuclear genome. However, increasing evidence indicates that some the lncRNAs are generated from the mitochondrial genome or located in mitochondria [71]. In our study, an abundant mitochondrial lncRNA was identified between the genes tRNALys and ATP8 in GDCH, as detected by RT-qPCR. The lncRNA was punctuated by multiple stop codons and no prominent ORFs were detected using verterabate mitochondrial code. The longest ORF spanned merely 129 amino acids without homologous sequences based on vertebrate codons. Our study also measured the expression levels of the lncRNA and compared them with transcripts of the 13 mitochondrial protein coding genes. What surprised us was that lncRNA transcriptional levels were significantly higher than PCGs. Similarly, the lncRNA upstream of ATP8 was also strongly expressed in Stenostomum sthenum [43]. Earlier research revealed that antisense transcripts of ND5, ND6, and Cytb genes played an essential role in maintaining mitochondrial mRNA stability or regulating gene expression via forming ribonuclease-resistant double-stranded structures with their respective complementary mRNAs [72]. Expression of an antisense ND6 was also detected in our study. However, until now it is doubtful whether numerous lncRNAs have functions. This led us to think about what role a highly expressed lncRNAs could play in the cell, how these mitochondrial lncRNAs could affect energy metabolism, and whether they could respond to injury and stress. These are the fundamental research questions that will receive attention in the future.

4.4. Reviving the Lost ATP8 Gene in Polypedates

The absence of the ATP8 gene in Polypedates has garnered substantial interest among molecular systematists specializing in metazoans. It is worth noting that the ATP8 protein has unique features, such as its variable and short length, and higher preservation of secondary structure compared to the primary sequence [73]. Both these features can render the annotation of ATP8 more challenging in certain scenarios. Conventional tools failed to detect the ATP8 genes in Polypedates. Therefore, the significance of manual annotation is emphasized.
The ATP8 gene is one of the components of ATP synthase (F1F0), which contributes significantly to the electron transport chain, and deletion of the ATP8 gene will prevent the electron transport chain from providing ATP to the organism and prevent the frog from reproducing. However, in reality, Polypedates are widely distributed and not naturally extinct. As automated gene annotation with MITOS failed to identify ATP8 in either P. megacephalus or the other three published Polypedates mitochondrial genomes, we manually searched for ATP8 candidates in all four mitogenomes. From this search, we managed to identify ATP8 in P. megacephalus in the present study as well as all three published Polypedates mitogenomes. The presence of ATP8 in P. megacephalus was supported by RT-qPCR, a transmembrane region at the N-terminus, and hydrophobicity profiles. These findings suggest that ATP8 has not been absent in all Polypedates. The phenomenon of ATP8 gene loss is also common in flatworms, but recently, some researchers have used bioinformatics to demonstrate the existence of ATP8 in some flatworm species: Stenostomum leucops [74], S. sthenum [43], and Macrostomum lignano [43]. In addition, Lubośny, Przyłucka, and Śmietanka [75] have confirmed the presence of ATP8 in Mytilus edulis through proteomic approaches and manual curation procedures. In mammals, fish, and yeast, ATP6 and ATP8 are encoded in overlapping genes in mitochondrial DNA [76,77,78]. Additionally, it has been proven that the synthesis of ATP6 is dependent on the translation of ATP8 and occurs in association with a single ribopeptide transcript [78]. Among our resequenced sequences of P. megacephalus, these two genes shared a characteristic: a 4-nucleotide overlap of their sequences. Our quantitative data also demonstrated that ATP6 and ATP8 are contiguous transcripts.
In almost all animal lineages, there is strong selective pressure to maintain a minimal set of 37 genes [80]. It is imperative for researchers to exercise caution when regarding the absence of a mitochondrial gene [81]. Considering the traits of the ATP8 gene, it is not unexpected that many organisms have been hypothesized to have undergone ATP8 loss. This prompts the query of whether these organisms genuinely lack ATP8, or if this is merely a matter of annotation. Subsequent investigations into the functional roles and transcriptional activity of ATP8 may prove to be essential. Unambiguous resolution of uncertainties surrounding “uncertain” protein-coding genes can only be achieved through experimental proteomic methods.

4.5. Transcriptional Levels of Mitochondrial Genes

In the present study, we found that metabolic depression of P. megacephalus was reflected at the transcriptional levels of the mitogenome in liver. The transcriptional level of the COIII gene in P. megacephalus was found to be significantly reduced in response to cold exposure (Figure 6). This finding is consistent with an earlier study that found that overwintering frogs, Nanorana parkeri, decreased mRNA expression of cytochrome oxidase, thereby reducing mitochondrial aerobic capacity and increasing survival time [82]. Additionally, a decrease in COI expression has also been observed in Dryophytes versicolor [11]. Cytochrome c oxidase (COX) serves as the terminal electron acceptor of the respiratory chain, facilitating the transfer of electrons to reduced oxygen to form water, and also exhibits proton pumping activity [82,83]. Furthermore, defects in the assembly and function of COX can affect organs with high energy demands [84]. In a low-temperature environment, the decrease in COX activity and other mitochondrial enzymes in P. megacephalus may result from inhibited protein synthesis, which slows down mitochondrial metabolism. During cold stress, gene transcriptional levels of ND2, ND4, and ND6 in liver were significantly reduced in P. megacephalus. The observed suppression of the four NADH dehydrogenase subunits of P. megacephalus may represent a regulatory response to counteract the metabolic disturbances that occur in response to low temperatures. Furthermore, the LncRNA was down-regulated significantly in exposure to cold conditions, whereas antisense ND6 gene expression showed a downward rend but this was not significant. These results indicate that the lncRNA is involved in adapting to fluctuating environmental temperatures. However, the precise molecular mechanisms that regulate this process remain unclear.

4.6. Correlations Between Phylogenetic Relationships and Gene Rearrangements

In the current study, the phylogenetic tree showed the pairs of P. mutus and P. braueri versus P. megacephalus and P. impresus formed separate decisive sister groups. This topology was consistent with that published previously by other studies [21,86,87]. Past studies revealed that the P. leucomystax complex was considered to be composed of seven highly supported clades [2,87,88]. The phylogenetic analyses conducted by Yuan [2] based on partial mitochondrial and nuclear genes indicated that a clade comprising three species, P. megacephalus, P. leucomystax, and P. teraiensis, formed a sister group to P. impresus, whereas P. macrotis and P. mutus formed a clade as sisters, which was inconsistent with our results. This difference was due to the fact that different datasets were used to reconstruct the phylogenetic relationship.
During natural dispersal, amphibians face multiple distance and biogeographic barriers. Brown proposed that the transportation of agricultural products facilitated the range expansion of P. leucomystax into the Philippines [89]. Phylogenetic analysis revealed that the GDCH frog did not cluster with GDHD and GDQY, which were geographically closer, but instead grouped with ZJWZ, which was further away. We speculate that this may be due to human transportation, leading to the establishment of a new geographical population, that is consistent with Brown's perspective [89]. To enhance the comprehension of the taxonomic relationships among Polypedates species, additional molecular information is required to construct a fully accurate phylogenetic tree.
In our present study, the phylogenetic relationship within Polypedates offers highly convincing results that align with the gene arrangements and the NCRs locations (Figure 7). Regarding the four Polypedates species analyzed in this study, it was observed that the genus was split into two distinct branches. One of these branches contained a LNCR between pseudogene tRNALys and ATP8. Based on the phylogenetic tree analysis, it was observed that two mitochondrial genomes with incomplete sequences (GDQY and GDHD) and the published mitochondrial genomes (AY458598) clustered with GXGL in Clade A. By contrast ZJWZ clustered with three other mitochondrial genomes (ZJJH, GDCH, FJFQ) and the published mitochondrial genomes (MH936677) in Clade B. These results suggest that these species share the same “CR1-ND5(1)-CR2-ND5(2)-CR3” rearrangement structure. Additionally, P. megacephalus and P. impresus were sister taxa. The “CR1-ND5(1)-CR2-ND5(2)-CR3” rearrangement structure existed in P. megacephalus, whereas P. impresus exhibited a "CR1-ND5-CR2" structure. Therefore, further research is needed to determine whether P. impresus has the same rearrangement structure as the P. megacephalus.

5. Conclusion

In this study, we resequenced and reannotated five complete and three almost complete mitogenomes of P. megacephalus from different geographic sites. A novel gene rearrangement of “CR1-ND5(1)-CR2-ND5(2)-CR3” was first detected in P. megacephalus. The gene rearrangement was explained by the TDRL model and the slipped-strand mispairing model. Based on the resemblance of protein tertiary structures (Figure S2), hydrophobic pattern similarities (Figure 4), and the results presented above, it is proposed that ATP8 gene could be present not only in P. megacephalus but also throughout the genus Polypedates. However, whether this ATP8 gene can synthesize functional proteins remains to be further investigated in future studies. Analysis of mitochondrial gene expression in response to temperature change, showed that the gene expression of COIII, ND2, ND4, and ND6 transcripts was significantly reduced under cold stress. Also, the lnc RNA between positions 8029 and 8612 was transcripted at high levels and significantly down-regulated under low-temperature stress. These findings suggest that P. megacephalus alters mitochondrial gene expression to adapt to adverse environmental conditions.

Supplementary Materials

The following supporting information can be downloaded at the website of this paper posted on Preprints.org.

Author Contributions

Ling-Na Cai conceived and designed the experiments, performed the experiments, analyzed the data, contributed reagents/materials/analysis tools, prepared figures and/or tables, authored or reviewed drafts of the paper. Li-Hua Zhang, Yi-Jie Lin, and Jing-Yan Wang analyzed the data, prepared figures and/or tables, authored or reviewed drafts of the paper. Jia-Yong Zhang conceived and designed the experiments, analyzed the data, contributed reagents/materials/analysis tools, reviewed drafts of the paper. Kenneth B. Storey conceived and designed the experiments, authored or reviewed drafts of the paper. Dan-Na Yu conceived and designed the experiments, analyzed the data, contributed reagents/materials/analysis tools, reviewed drafts of the paper, approved the final draft.

Funding

This research was supported by the National Natural Science Foundation of China (No. 31801963), the Zhejiang Province Natural Science Foundation (LQ16C030001), the College Students’ Innovation and Entrepreneurship Project of Zhejiang Province (202010345R119), the College Students’ Innovation and Entrepreneurship Project of China (02310345026). The funders had no role in study design, data collection and analysis, decision to publish, or preparation of the manuscript.

Institutional Review Board Statement

All experimental designs and animal handling were approved by the Animal Research Ethics Committee of Zhejiang Normal University (No. 20001800C).

Informed Consent Statement

Not applicable.

Data Availability Statement

The mitochondrial genomes of newly generated in this study have been deposited in GenBank (OP965713-OP965718, OP936085-OP936086).

Acknowledgments

LN-Cai thanks to Le-Ping Zhang, Gong-Ji Wu, LianWu for their help in the experiment.

Conflicts of Interest

The authors declare no conflict of interest.

References

  1. Amphibian Species of the World: An Online Reference (Version 6). Reference Reviews 2014, 28, 32–32. [CrossRef]
  2. Yuan, L.M.; Deng, X.L.; Jiang, D.C.; Klaus, S.; Orlov, N.L.; Yang, K.; Li, J.T. Geographical range evolution of the genus Polypedates (Anura: Rhacophoridae) from the Oligocene to present. Zoological Research 2021, 42, 116. [Google Scholar] [CrossRef] [PubMed]
  3. Chong, R.A.; Mueller, R.L. Low metabolic rates in salamanders are correlated with weak selective constraints on mitochondrial genes. Evolution 2013, 67, 894–899. [Google Scholar] [CrossRef] [PubMed]
  4. Teets, N.M.; Dalrymple, E.G.; Hillis, M.H.; Gantz, J.D.; Spacht, D.E.; Lee, R.E.; Denlinger, D.L. Changes in energy reserves and gene expression elicited by freezing and supercooling in the Antarctic midge. Insects 2020, 11, 18. [Google Scholar] [CrossRef]
  5. Ramirez, L.; Luna, F.; Mucci, C.A.; Lamattina, L. Fast weight recovery, metabolic rate adjustment and gene-expression regulation define responses of cold-stressed honey bee brood. J. Insect Physiol. 2021, 128, 104178. [Google Scholar] [CrossRef]
  6. Rider, M.H.; Hussain, N.; Dilworth, S.M.; Storey, J.M.; Storey, K.B. AMP-activated protein kinase and metabolic regulation in cold-hardy insects. J. Insect Physiol. 2011, 57, 1453–1462. [Google Scholar] [CrossRef]
  7. Colinet, H.; Nguyen, T.T.A.; Cloutier, C.; Michaud, D.; Hance, T. Proteomic profiling of a parasitic wasp exposed to constant and fluctuating cold exposure. Insect Biochem. Mol. Biol. 2007, 37, 1177–1188. [Google Scholar] [CrossRef]
  8. Joanisse, D.R.; Storey, K.B. Mitochondrial enzymes during overwintering in two species of cold-hardy gall insects. Insect Biochem. Mol. Biol. 1994, 24, 145–150. [Google Scholar] [CrossRef]
  9. Storey, J.M.; Wu, S.; Storey, K.B. Mitochondria and the Frozen Frog. Antioxidants 2021, 10, 543. [Google Scholar] [CrossRef]
  10. Jin, W.T.; Guan, J.Y.; Dai, X.Y.; Wu, G.J.; Zhang, L.P.; Storey, K.B.; Zhang, J.Y.; Zheng, R.Q.; Yu, D.N. Mitochondrial gene expression in different organs of Hoplobatrachus rugulosus from China and Thailand under low-temperature stress. BMC Zoology 2022, 7, 1–14. [Google Scholar] [CrossRef]
  11. Zhang, J.Y.; Luu, B.E.; Yu, D.N.; Zhang, L.P.; Al-attar, R.; Storey, K.B. The complete mitochondrial genome of Dryophytes versicolor: Phylogenetic relationship among Hylidae and mitochondrial protein-coding gene expression in response to freezing and anoxia. Int. J. Biol. Macromol. 2019, 132, 461–469. [Google Scholar] [CrossRef]
  12. Cai, Q.; Storey, K.B. Anoxia-Induced Gene Expression in Turtle Heart. Eur. J. Biochem. 1996, 241, 83–92. [Google Scholar] [CrossRef]
  13. Shadel, G.S.; Clayton, D.A. Mitochondrial DNA maintenance in vertebrates. Annu. Rev. Biochem. 1997, 66, 409–435. [Google Scholar] [CrossRef]
  14. Zhang, J.Y.; Zhang, L.P.; Yu, D.N.; Storey, K.B.; Zheng, R.Q. Complete mitochondrial genomes of Nanorana taihangnica and N. yunnanensis (Anura: Dicroglossidae) with novel gene arrangements and phylogenetic relationship of Dicroglossidae. BMC Evol. Biol. 2018, 18, 1–13. [Google Scholar] [CrossRef]
  15. Boore, J.L. Animal mitochondrial genomes. Nucleic Acids Research 1999, 27, 1767–1780. [Google Scholar] [CrossRef] [PubMed]
  16. Arndt, A.; Smith, M.J. Mitochondrial gene rearrangement in the sea cucumber genus Cucumaria. Mol. Biol. Evol. 1998, 15, 1009–1016. [Google Scholar] [CrossRef] [PubMed]
  17. Levinson, G.; Gutman, G.A. Slipped-strand mispairing: a major mechanism for DNA sequence evolution. Mol. Biol. Evol. 1987, 4, 203–221. [Google Scholar] [PubMed]
  18. Sano, N.; Kurabayashi, A.; Fujii, T.; Yonekawa, H.; Sumida, M. Complete nucleotide sequence and gene rearrangement of the mitochondrial genome of the bell-ring frog, Buergeria buergeri (family Rhacophoridae). Genes Genet. Syst. 2004, 79, 151–163. [Google Scholar] [CrossRef] [PubMed]
  19. Huang, M.; Lv, T.; Duan, R.; Zhang, S.; Li, H. The complete mitochondrial genome of Rhacophorus dennysi (Anura: Rhacophoridae) and phylogenetic analysis. Mitochondrial DNA Part A 2016, 27, 3719–3720. [Google Scholar] [CrossRef]
  20. Sano, N.; Kurabayashi, A.; Fujii, T.; Yonekawa, H.; Sumida, M. Complete nucleotide sequence of the mitochondrial genome of Schlegel’s tree frog Rhacophorus schlegelii (family Rhacophoridae): duplicated control regions and gene rearrangements. Genes Genet. Syst. 2005, 80, 213–224. [Google Scholar] [CrossRef]
  21. Cui, L.; Huang, A.; He, Z.; Ao, L.; Ge, F.; Fan, X.; Zeng, B.; Yang, M.; Yang, D.; Ni, Q. et al. Complete mitogenomes of Polypedates tree frogs unveil gene rearrangement and concerted evolution within Rhacophoridae. Animals 2022, 12, 2449. [Google Scholar] [CrossRef]
  22. Liu, Y.; Yang, M.; Jiang, Y.; Han, F.; Li, Y.; Ni, Q.; Yao, Y.; Xu, H.; Zhang, M. The near complete mitochondrial genome of white-lipped treefrog, Polypedates braueri (Anura, Rhacophoridae). Mitochondrial DNA Part A 2017, 28, 271–272. [Google Scholar] [CrossRef]
  23. Zhang, P.; Zhou, H.; Liang, D.; Liu, Y.F.; Chen, Y.Q.; Qu, L.H. The complete mitochondrial genome of a tree frog, Polypedates megacephalus (Amphibia: Anura: Rhacophoridae), and a novel gene organization in living amphibians. Gene 2005, 346, 133–143. [Google Scholar] [CrossRef] [PubMed]
  24. Huang, A.; Liu, S.; Li, H.; Luo, H.; Ni, Q.; Yao, Y.; Xu, H.; Zeng, B.; Li, Y.; Wei, Z. et al. The revised complete mitogenome sequence of the tree frog Polypedates megacephalus (Anura, Rhacophoridae) by next-generation sequencing and phylogenetic analysis. PeerJ 2019, 7, e7415. [Google Scholar] [CrossRef] [PubMed]
  25. Inagaki, H.; Haramoto, Y.; Kubota, H.Y.; Shigeri, Y. Complete mitochondrial genome sequence of Japanese forest green tree frog (Rhacophorus arboreus). Mitochondrial DNA Part B 2020, 5, 3347–3348. [Google Scholar] [CrossRef]
  26. Kurabayashi, A.; Usuki, C.; Mikami, N.; Fujii, T.; Yonekawa, H.; Sumida, M.; Hasegawa, M. Complete nucleotide sequence of the mitochondrial genome of a Malagasy poison frog Mantella madagascariensis: evolutionary implications on mitochondrial genomes of higher anuran groups. Mol. Phylogenet. Evol. 2006, 39, 223–236. [Google Scholar] [CrossRef] [PubMed]
  27. Kurabayashi, A.; Sumida, M.; Yonekawa, H.; Glaw, F.; Vences, M.; Hasegawa, M. Phylogeny, recombination, and mechanisms of stepwise mitochondrial genome reorganization in mantellid frogs from Madagascar. Mol. Biol. Evol. 2008, 25, 874–891. [Google Scholar] [CrossRef]
  28. Alam, M.S.; Kurabayashi, A.; Hayashi, Y.; Sano, N.; Khan, M.M.R.; Fujii, T.; Sumida, M. Complete mitochondrial genomes and novel gene rearrangements in two dicroglossid frogs, Hoplobatrachus tigerinus and Euphlyctis hexadactylus, from Bangladesh. Genes Genet. Syst. 2010, 85, 219–232. [Google Scholar] [CrossRef] [PubMed]
  29. Yu, D.; Zhang, J.; Zheng, R.; Shao, C. The complete mitochondrial genome of Hoplobatrachus rugulosus (Anura: Dicroglossidae). Mitochondrial DNA 2012, 23, 336–337. [Google Scholar] [CrossRef]
  30. Zheng, C.; Nie, L.; Wang, J.; Zhou, H.; Hou, H.; Wang, H.; Liu, J. Recombination and evolution of duplicate control regions in the mitochondrial genome of the Asian big-headed turtle. PLoS one 2013, 8, e82854. [Google Scholar] [CrossRef]
  31. Eberhard, J.R.; Wright, T.F.; Bermingham, E. Duplication and concerted evolution of the mitochondrial control region in the parrot genus Amazona. Mol. Biol. Evol. 2001, 18, 1330–1342. [Google Scholar] [CrossRef]
  32. Kumazawa, Y.; Ota, H.; Nishida, M.; Ozawa, T. Gene rearrangements in snake mitochondrial genomes: highly concerted evolution of control-region-like sequences duplicated and inserted into a tRNA gene cluster. Mol. Biol. Evol. 1996, 13, 1242–1254. [Google Scholar] [CrossRef] [PubMed]
  33. Inoue, J.G.; Miya, M.; Tsukamoto, K.; Nishida, M. Evolution of the deep-sea gulper eel mitochondrial genomes: large-scale gene rearrangements originated within the eels. Mol. Biol. Evol. 2003, 20, 1917–1924. [Google Scholar] [CrossRef] [PubMed]
  34. Akiyama, T.; Nishida, C.; Momose, K.; Onuma, M.; Takami, K.; Masuda, R. Gene duplication and concerted evolution of mitochondrial DNA in crane species. Mol. Phylogenet. Evol. 2017, 106, 158–163. [Google Scholar] [CrossRef] [PubMed]
  35. Saraste, M. Oxidative phosphorylation at the fin de siècle. Science 1999, 283, 1488–1493. [Google Scholar] [CrossRef]
  36. Hahn, A.; Parey, K.; Bublitz, M.; Mills, Deryck J. ; Zickermann, V.; Vonck, J.; Kühlbrandt, W.; Meier, T. Structure of a complete ATP synthase dimer reveals the molecular basis of inner mitochondrial membrane morphology. Mol. Cell 2016, 63, 445–456. [Google Scholar] [CrossRef] [PubMed]
  37. Dautant, A.; Meier, T.; Hahn, A.; Tribouillard-Tanvier, D.; di Rago, J.P.; Kucharczyk, R. ATP synthase diseases of mitochondrial genetic origin. Frontiers in Physiology 2018, 9, 329. [Google Scholar] [CrossRef]
  38. Gissi, C.; Iannelli, F.; Pesole, G. Evolution of the mitochondrial genome of Metazoa as exemplified by comparison of congeneric species. Heredity 2008, 101, 301–320. [Google Scholar] [CrossRef]
  39. Uliano-Silva, M.; Americo, J.A.; Costa, I.; Schomaker-Bastos, A.; de Freitas Rebelo, M.; Prosdocimi, F. The complete mitochondrial genome of the golden mussel Limnoperna fortunei and comparative mitogenomics of Mytilidae. Gene 2016, 577, 202–208. [Google Scholar] [CrossRef]
  40. Steinauer, M.L.; Nickol, B.B.; Broughton, R.; Ortí, G. First sequenced mitochondrial genome from the phylum Acanthocephala (Leptorhynchoides thecatus) and its phylogenetic position within Metazoa. J. Mol. Evol. 2005, 60, 706–715. [Google Scholar] [CrossRef]
  41. Suga, K.; Mark Welch, D.B.; Tanaka, Y.; Sakakura, Y.; Hagiwara, A. Two circular chromosomes of unequal copy number make up the mitochondrial genome of the rotifer Brachionus plicatilis. Mol. Biol. Evol. 2008, 25, 1129–1137. [Google Scholar] [CrossRef]
  42. Lavrov, D.V.; Brown, W.M. Trichinella spiralis mtDNA: a nematode mitochondrial genome that encodes a putative ATP8 and normally structured tRNAs and has a gene arrangement relatable to those of coelomate metazoans. Genetics 2001, 157, 621–637. [Google Scholar] [CrossRef] [PubMed]
  43. Egger, B.; Bachmann, L.; Fromm, B. Atp8 is in the ground pattern of flatworm mitochondrial genomes. BMC Genomics 2017, 18, 414. [Google Scholar] [CrossRef]
  44. Monnens, M.; Thijs, S.; Briscoe, A.G.; Clark, M.; Frost, E.J.; Littlewood, D.T.J.; Sewell, M.; Smeets, K.; Artois, T.; Vanhove, M.P.M. The first mitochondrial genomes of endosymbiotic rhabdocoels illustrate evolutionary relaxation of atp8 and genome plasticity in flatworms. Int. J. Biol. Macromol. 2020, 162, 454–469. [Google Scholar] [CrossRef] [PubMed]
  45. Zhang, P.; Liang, D.; Mao, R.L.; Hillis, D.M.; Wake, D.B.; Cannatella, D.C. Efficient sequencing of anuran mtDNAs and a mitogenomic exploration of the phylogeny and evolution of frogs. Mol. Biol. Evol. 2013, 30, 1899–1915. [Google Scholar] [CrossRef] [PubMed]
  46. Cai, Y.Y.; Shen, S.Q.; Lu, L.X.; Storey, K.B.; Yu, D.-N.; Zhang, J.Y. The complete mitochondrial genome of Pyxicephalus adspersus: high gene rearrangement and phylogenetics of one of the world’s largest frogs. PeerJ 2019, 7, e7532. [Google Scholar] [CrossRef]
  47. Burland, T.G. DNASTAR’s Lasergene Sequence Analysis Software. In Bioinformatics Methods and Protocols; Misener, S., Krawetz, S. A., Eds.; Humana Press: Totowa, NJ, 1999; pp. 71–91. [Google Scholar]
  48. Lowe, T.M.; Chan, P.P. tRNAscan-SE On-line: integrating search and context for analysis of transfer RNA genes. Nucleic Acids Res. 2016, 44, W54–W57. [Google Scholar] [CrossRef] [PubMed]
  49. Kumar, S.; Stecher, G.; Tamura, K. MEGA7: Molecular Evolutionary Genetics Analysis Version 7.0 for Bigger Datasets. Mol. Biol. Evol. 2016, 33, 1870–1874. [Google Scholar] [CrossRef] [PubMed]
  50. Letunic, I.; Doerks, T.; Bork, P. SMART: recent updates, new developments and status in 2015. Nucleic Acids Res 2014, 43, D257–D260. [Google Scholar] [CrossRef] [PubMed]
  51. Wilkins, M.R.; Gasteiger, E.; Bairoch, A.; Sanchez, J.C.; Williams, K.L.; Appel, R.D.; Hochstrasser, D.F. Protein Identification and Analysis Tools in the ExPASy Server. In 2-D Proteome Analysis Protocols; Link, A. J., Ed.; Humana Press: Totowa, NJ, 1999; pp. 531–552. [Google Scholar]
  52. Jumper, J.; Evans, R.; Pritzel, A.; Green, T.; Figurnov, M.; Ronneberger, O.; Tunyasuvunakool, K.; Bates, R.; Žídek, A.; Potapenko, A. et al. Highly accurate protein structure prediction with AlphaFold. Nature 2021, 596, 583–589. [Google Scholar] [CrossRef]
  53. Arnold, K.; Bordoli, L.; Kopp, J.; Schwede, T. The SWISS-MODEL workspace: a web-based environment for protein structure homology modelling. Bioinformatics 2005, 22, 195–201. [Google Scholar] [CrossRef] [PubMed]
  54. Benson, G. Tandem repeats finder: a program to analyze DNA sequences. Nucleic Acids Res. 1999, 27, 573–580. [Google Scholar] [CrossRef]
  55. Katoh, K.; Standley, D.M. MAFFT Multiple Sequence Alignment Software Version 7: Improvements in Performance and Usability. Mol. Biol. Evol. 2013, 30, 772–780. [Google Scholar] [CrossRef] [PubMed]
  56. Zhang, D.; Gao, F.; Jakovlić, I.; Zou, H.; Zhang, J.; Li, W.X.; Wang, G.T. PhyloSuite: An integrated and scalable desktop platform for streamlined molecular sequence data management and evolutionary phylogenetics studies. Mol. Ecol. Resour 2020, 20, 348–355. [Google Scholar] [CrossRef]
  57. Lanfear, R.; Frandsen, P.B.; Wright, A.M.; Senfeld, T.; Calcott, B. PartitionFinder 2: New Methods for Selecting Partitioned Models of Evolution for Molecular and Morphological Phylogenetic Analyses. Mol. Biol. Evol. 2016, 34, 772–773. [Google Scholar] [CrossRef]
  58. Stamatakis, A. RAxML version 8: a tool for phylogenetic analysis and post-analysis of large phylogenies. Bioinformatics 2014, 30, 1312–1313. [Google Scholar] [CrossRef]
  59. Peakall, R.; Smouse, P.E. GenAlEx 6.5: genetic analysis in Excel. Population genetic software for teaching and research—an update. Bioinformatics 2012, 28, 2537–2539. [Google Scholar] [CrossRef] [PubMed]
  60. Lalitha, S. Primer Premier 5. Biotech. Softw. Internet Rep. 2000, 1, 270–272. [Google Scholar] [CrossRef]
  61. Macey, J.R.; Larson, A.; Ananjeva, N.B.; Fang, Z.; Papenfuss, T.J. Two novel gene orders and the role of light-strand replication in rearrangement of the vertebrate mitochondrial genome. Mol. Biol. Evol. 1997, 14, 91–104. [Google Scholar] [CrossRef]
  62. Lavrov, D.V.; Boore, J.L.; Brown, W.M. Complete mtDNA Sequences of Two Millipedes Suggest a New Model for Mitochondrial Gene Rearrangements: Duplication and Nonrandom Loss. Mol. Biol. Evol. 2002, 19, 163–169. [Google Scholar] [CrossRef]
  63. Yu, D.; Zhang, J.; Li, P.; Zheng, R.; Shao, C. Do Cryptic Species Exist in Hoplobatrachus rugulosus? An Examination Using Four Nuclear Genes, the Cyt b Gene and the Complete MT Genome. PLOS ONE 2015, 10, e0124825. [Google Scholar] [CrossRef]
  64. Boore, J.L.; Brown, W.M. Big trees from little genomes: mitochondrial gene order as a phylogenetic tool. Curr. Opin. Genet. Dev. 1998, 8, 668–674. [Google Scholar] [CrossRef] [PubMed]
  65. Moritz, C.; Brown, W.M. Tandem Duplication of D-Loop and Ribosomal RNA Sequences in Lizard Mitochondrial DNA. Science 1986, 233, 1425–1427. [Google Scholar] [CrossRef] [PubMed]
  66. Wu, N.; Liu, J.; Wang, S.; Guo, X. Comparative Analysis of Mitochondrial Genomes in Two Subspecies of the Sunwatcher Toad-Headed Agama (Phrynocephalus helioscopus): Prevalent Intraspecific Gene Rearrangements in Phrynocephalus. Genes 2022, 13, 203. [Google Scholar] [CrossRef] [PubMed]
  67. Chen, J.M.; Prendini, E.; Wu, Y.H.; Zhang, B.L.; Suwannapoom, C.; Chen, H.M.; Jin, J.Q.; Lemmon, E.M.; Lemmon, A.R.; Stuart, B.L.; Raxworthy, C.J.; Murphy, R.W.; Yuan, Z.Y.; Che, J. An integrative phylogenomic approach illuminates the evolutionary history of Old World tree frogs (Anura: Rhacophoridae). Mol. Phylogenet. Evol. 2020, 145, 106724. [Google Scholar] [CrossRef]
  68. Li, J.T.; Li, Y.; Klaus, S.; Rao, D.Q.; Hillis, D.M.; Zhang, Y.P. Diversification of rhacophorid frogs provides evidence for accelerated faunal exchange between India and Eurasia during the Oligocene. Proc. Natl. Acad. Sci. U.S.A. 2013, 110, 3441–3446. [Google Scholar] [CrossRef]
  69. Excoffier, L. Evolution of human mitochondrial DNA: Evidence for departure from a pure neutral model of populations at equilibrium. J. Mol. Evol. 1990, 30, 125–139. [Google Scholar] [CrossRef]
  70. Mattick, J.S.; Amaral, P.P.; Carninci, P.; Carpenter, S.; Chang, H.Y.; Chen, L.L.; Chen, R.; Dean, C.; Dinger, M.E.; Fitzgerald, K.A. et al. Long non-coding RNAs: definitions, functions, challenges and recommendations. Nat. Rev. Mol. Cell Biol. 2023. [Google Scholar] [CrossRef] [PubMed]
  71. Zhao, Y.; Sun, L.; Wang, R.R.; Hu, J.F.; Cui, J. The effects of mitochondria-associated long noncoding RNAs in cancer mitochondria: New players in an old arena. Crit Rev Oncol Hemat 2018, 131, 76–82. [Google Scholar] [CrossRef]
  72. Gao, S.; Tian, X.; Chang, H.; Sun, Y.; Wu, Z.; Cheng, Z.; Dong, P.; Zhao, Q.; Ruan, J.; Bu, W. Two novel lncRNAs discovered in human mitochondrial DNA using PacBio full-length transcriptome data. Mitochondrion 2018, 38, 41–47. [Google Scholar] [CrossRef]
  73. Gray, M.W. Evolution of organellar genomes. Curr Opin Genet Dev 1999, 9, 678–687. [Google Scholar] [CrossRef]
  74. Rosa, M.T.; Oliveira, D.S.; Loreto, E.L.S. Characterization of the first mitochondrial genome of a catenulid flatworm: Stenostomum leucops (Platyhelminthes). J Zool Syst Evol Res 2017, 55, 98–105. [Google Scholar] [CrossRef]
  75. Lubośny, M.; Przyłucka, A.; Śmietanka, B.; Breton, S.; Burzyński, A. Actively transcribed and expressed atp8 gene in Mytilus edulis mussels. PeerJ 2018, 6, e4897. [Google Scholar] [CrossRef]
  76. He, J.; Ford, H.C.; Carroll, J.; Douglas, C.; Gonzales, E.; Ding, S.; Fearnley, I.M.; Walker, J.E. Assembly of the membrane domain of ATP synthase in human mitochondria. Pnas 2018, 115, 2988–2993. [Google Scholar] [CrossRef]
  77. Fearnley, I.M.; Walker, J.E. Two overlapping genes in bovine mitochondrial DNA encode membrane components of ATP synthase. Embo J 1986, 5, 2003–2008. [Google Scholar] [CrossRef]
  78. Zardoya, R.; Pérez-Martos, A.; Bautista, J.M.; Montoya, J. Analysis of the transcription products of the rainbow trout (Oncorynchus mykiss) liver mitochondrial genome: detection of novel mitochondrial transcripts. Curr. Genet. 1995, 28, 67–70. [Google Scholar] [CrossRef] [PubMed]
  79. Cruz-Zaragoza, L.D.; Dennerlein, S.; Linden, A.; Yousefi, R.; Lavdovskaia, E.; Aich, A.; Falk, R.R.; Gomkale, R.; Schöndorf, T.; Bohnsack, M.T.; Richter-Dennerlein, R.; Urlaub, H.; Rehling, P. An in vitro system to silence mitochondrial gene expression. Cell 2021, 184, 5824–5837. [Google Scholar] [CrossRef] [PubMed]
  80. Ghiselli, F.; Gomes-dos-Santos, A.; Adema, C.M.; Lopes-Lima, M.; Sharbrough, J.; Boore, J.L. Molluscan mitochondrial genomes break the rules. Philos. Trans. R. Soc. B 2021, 376, 20200159. [Google Scholar] [CrossRef] [PubMed]
  81. Gan, H.M.; Grandjean, F.; Jenkins, T.L.; Austin, C.M. Absence of evidence is not evidence of absence: Nanopore sequencing and complete assembly of the European lobster (Homarus gammarus) mitogenome uncovers the missing nad2 and a new major gene cluster duplication. BMC Genomics 2019, 20, 335. [Google Scholar] [CrossRef]
  82. Niu, Y.; Cao, W.; Storey, K.B.; He, J.; Wang, J.; Zhang, T.; Tang, X.; Chen, Q. Metabolic characteristics of overwintering by the high-altitude dwelling Xizang plateau frog, Nanorana parkeri. J Comp Physiol B 2020, 190, 433–444. [Google Scholar] [CrossRef]
  83. Kadenbach, B.; Hüttemann, M. The subunit composition and function of mammalian cytochrome c oxidase. Mitochondrion 2015, 24, 64–76. [Google Scholar] [CrossRef] [PubMed]
  84. McMullen, D.C.; Storey, K.B. Suppression of Na+K+-ATPase activity by reversible phosphorylation over the winter in a freeze-tolerant insect. J Insect Physiol 2008, 54, 1023–1027. [Google Scholar] [CrossRef] [PubMed]
  85. Bourens, M.; Boulet, A.; Leary, S.C.; Barrientos, A. Human COX20 cooperates with SCO1 and SCO2 to mature COX2 and promote the assembly of cytochrome c oxidase. Hum Mol Genet 2014, 23, 2901–2913. [Google Scholar] [CrossRef] [PubMed]
  86. Pan, S.; Dang, N.; Wang, J.; Zheng, Y.; Rao, D.; Li, J. Molecular Phylogeny Supports the Validity of Polypedates impresus Yang 2008. Asian Herpetol Res 2013, 4, 124–133. [Google Scholar] [CrossRef]
  87. Kuraishi, N.; Matsui, M.; Hamidy, A.; Belabut, D.M.; Ahmad, N.; Panha, S.; Sudin, A.; Yong, H.S.; Jiang, J.P.; Ota, H.; Thong, H.T.; Nishikawa, K. Phylogenetic and taxonomic relationships of the Polypedates leucomystax complex (Amphibia). Zool. Scr. 2013, 42, 54–70. [Google Scholar] [CrossRef]
  88. Buddhachat, K.; Suwannapoom, C. Phylogenetic relationships and genetic diversity of the Polypedates leucomystax complex in Thailand. PeerJ 2018, 6, e4263. [Google Scholar] [CrossRef]
  89. Brown, R.M.; Linkem, C.W.; Siler, C.D.; Sukumaran, J.; Esselstyn, J.A.; Diesmos, A.C.; Iskandar, D.T.; Bickford, D.; Evans, B.J.; McGuire, J.A.; Grismer, L.; Supriatna, J.; Andayani, N. Phylogeography and historical demography of Polypedates leucomystax in the islands of Indonesia and the Philippines: Evidence for recent human-mediated range expansion? Mol. Phylogenet. Evol. 2010, 57, 598–619. [Google Scholar] [CrossRef] [PubMed]
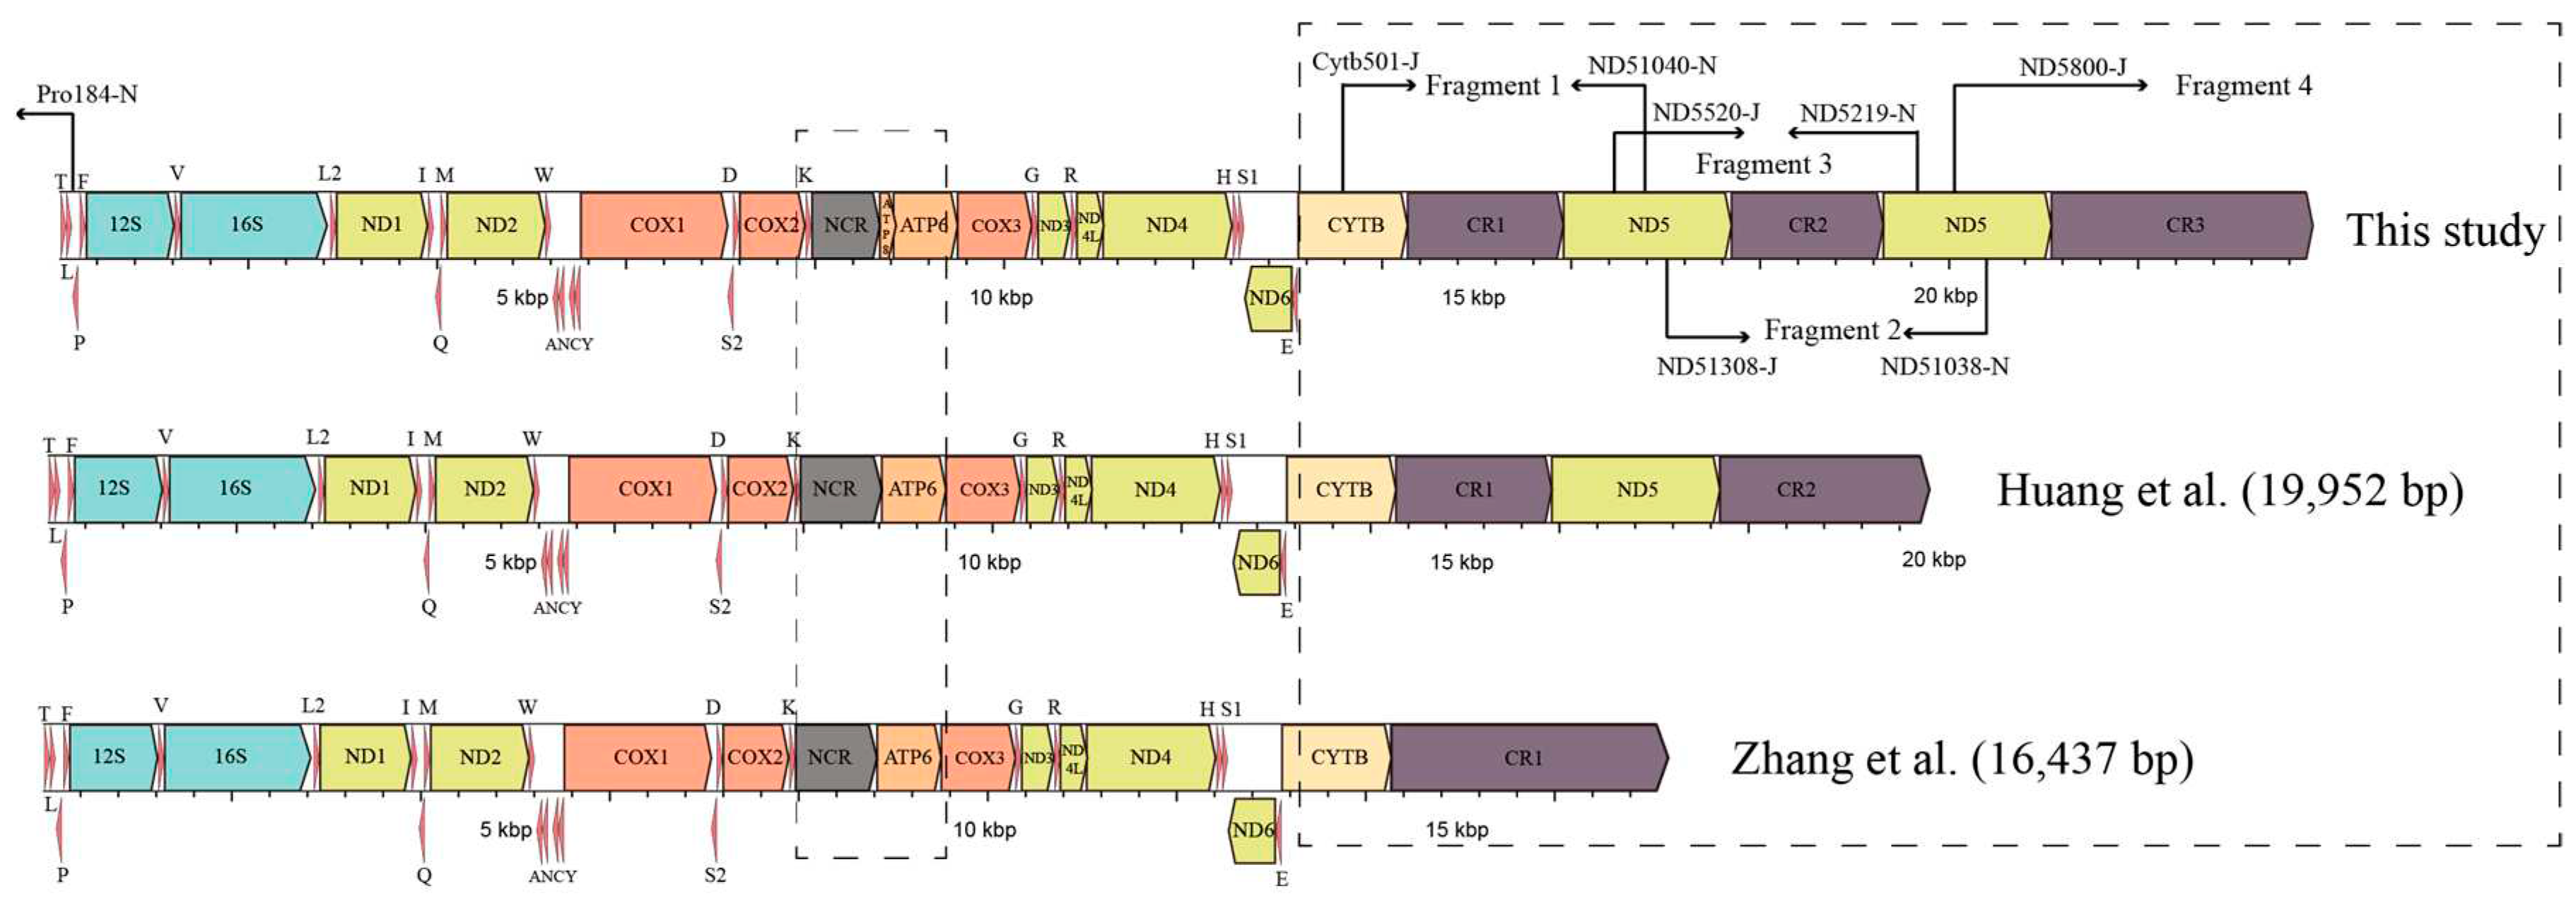
Figure 1. Illustration of sequencing strategy for mtDNA in P. megacephalus. Fragments 1-4 represent the four amplified segments. Primer names are shown above or below the arrows. The differences between this study and prior researches are emphasized by dashed box.
Preprints 83545 g001
Figure 2. Characteristics of P. megacephalus CRs. The number of copies of tandem repeats within each CR varied among geographic sites. The orange squares are tandem repeat units of 38 bp in length. The sky-blue squares are 100 bp-long tandem repeat units (only in the third control region). The green squares represent conserved sequences common to the three control regions.
Preprints 83545 g002
Figure 3. Amino acid alignment of ATP8 in Polypedates and other Rhacophoridaes. The transmembrane regions are highlighted with red boxes.
Preprints 83545 g003
Figure 4. The hydrophobicity profiles of the putative ATP8 amino acid sequences of Polypedates and other reported Rhacophoridae species.
Preprints 83545 g004
Figure 5. Relative mRNA expression levels of genes encoding mitochondrial proteins as well as two lnc RNAs at 25°C temperature. Solid black triangle represents undetected gene expression. The numbers under LC-I to LC-VI are amplified fragment ranges. Relative mRNA levels were determined with RT-qPCR with n = 4 independent biological replicates and outliers within the group were removed by Grubbs' method: the detection level α was 0.05, the critical value GP(n) was 1.46, and outliers were removed when the calculated value Gi>GP(n). Results are expressed as mean ± SE. Relative transcript levels were standard=ized using β-actin transcript levels as the reference gene.
Preprints 83545 g005
Figure 6. Relative mRNA expression levels in liver before and after low temperature stress at at 8°C in P. megacephalus. Mean values for controls were set to 1.0 and values for anoxic frogs are expressed relative to controls. Statistical significance was assessed with a two-tailed Student's t-test, where * denotes a significant difference from the corresponding control, p<0.05. Other information as in Figure 5.
Preprints 83545 g006
Figure 7. Phylogenetic tree was constructed based on the nucleotide dataset of 11 PCGs and 2 rRNAs using BI and ML methods. Mantella baroni and Mantella madagascariensis were used as the outgroups. The numbers above branches specify posterior probabilities as determined from BI (right) and bootstrap percentages from ML (left). Box images on the right show gene rearrangements for the Rhacophoridae species involved in this study. Different colored boxes represent different genes.
Preprints 83545 g007
Figure 8. Proposed mechanism of gene rearrangements in P. megacephalus. Gene sizes are not drawn to scale. Different colored boxes represent different genes. Horizontal lines and crossed-out colored boxes represent gene duplications and gene deletions, respectively.
Preprints 83545 g008
Table 1. PCR primer pairs, sequences, and estimated fragment length used in this study.
PCR Fragments Primer Names Primer Sequence(5’ - 3’) Length of Fragments Annealing Temperature
F1 Cytb501-J GGCTTCTCAGTYGAYAATGC ~3,400 bp 51 ℃
ND51040-N TTYCGAATGTCYTGTTCATC
F2 ND51308-J MTCAACYATATCCGCTGTRR ~3,300 bp 50 ℃
ND51038-N YCGAATGTCYTGTTCATCAT
F3 ND5520-J TAGTAATCTTTTGCTGRGC ~3,300 bp 50 ℃
ND5219-N ATAGGAGGGAGTAGGTGTC
F4 ND5800-J TATGCTTAGGTGCTCTATCC ~4,100 bp 50 ℃
Pro184-N GAGTCAGTGGAAGAGGTTAA
Table 2. RT-qPCR primers of P. megacephalus GDCH used in this study.
Gene name Forward primers (5’-3’) Reverse primers (5’-3’)
ND1 GDBT-ND1-J1
TGCCCTTATTGGTTCTTTAC
GDBT-ND1-N1
AAGATGGACAGTGTGAAGCC
ND2 GDBT-ND2-J1
ACTGACCTCAACACACGC
GDBT-ND2-N1
GGTAAGAGGTGGGAGGC
ND3 GDBT-ND3-J1
TTCTGGCTGGCAACTCTG
GDBT-ND3-N1
TACAAGGAAGAAGCGTATGGA
ND4 GDBT-ND4-J1
GGGCTACGGCATCTTACG
GDBT-ND4-N1
GGCAGAGCAGGGCTGTTAT
ND4L GDBT-ND4L-J1
GGCTCACCGAATACACTTACTT
GDBT-ND4L-N1
TGGGCAAAGGCTTAGGG
ND5 GDBT-ND5-J1
ACCGAATTGGAGACATTGGATT
GDBT-ND5-N1
GCAAGGATGAAGGCTATGAGAA
ND6 GDBT-ND6-J1
CGTCCAATCCGTCTCCGTT
GDBT-ND6-N1
GCAACCAGAGCTGAACAGTAAG
ND6AS GDBT-ND6AS-J1
GCTGAACAGTAAGCAAACACA
GDBT-ND6AS-N1
TGGGTTTAGTGTGAGGTGC
COI GDBT-COI-J1
CTACAAACTCCACGCTG
GDBT-COI-N1
GCGTCTGGGTAGTCTGAGTA
COII GDBT-COII-J1
CAGGGCGGCTCACTCAA
GDBT-COII-N1
ATCGGTAGGGCTTCAAC
COIII GDBT-COIII-J1
GGTCCTATTAGCCTCTGGG
GDBT-COIII-N1
TCGTAATACTCCATCGCTTG
ATP6 GDBT-ATP6-J1
ACAACCCAACTGCCACTAA
GDBT-ATP6-N1
GGGTGTGCCTTCTGGTAG
Cytb GDBT-CYTB-J1
GACTGCTCCGTAATCTCCA
GDBT-CYTB-N1
AAATAGGAGAATAACACCGATG
ATP8 GDBT-ATP8-J1
CATTCACGTAGCCCTATGAGC
GDBT-ATP8-N1
GTGATATTGTGCGGTACAGTGT
ATP86 GDBT-ATP86-J1
ACACTGTACCGCACAATATCA
GDBT-ATP86-N1
GGGTTGGTGATGTAAATTGACT
LC-I LC-I-J1
TTGCTTACTAAACTGCTGAG
LC-I-N1
GCGTATTATGATTCACAGGT
LC-II LC-II-J1
CATAATACGCCCGTGGAC
LC-II-N1
AGAGCCGCACTCATTGGT
LC-III LC-III-J1
AAGTGGCAAGTGCAACAATCA
LC-III-N1
GGCTCCGAGTGGATAAGAGG
LC-IV LC-IV-J1
CCCACTTAATACCCTCTTATCC
LC-IV-N1
CGCTTGGTGAATAATCAGTTG
LC-V LC-V-J1
GCAACTGATTATTCACCAAG
LC-V-N1
GGTGATTAGAGTTGTGGGAT
ACTIN GDBT-ACTIN-J1
CATCAGGCAACTCGTAGC
GDBT-ACTIN-N1
GCGTGACATCAAGGAGAAG
Disclaimer/Publisher’s Note: The statements, opinions and data contained in all publications are solely those of the individual author(s) and contributor(s) and not of MDPI and/or the editor(s). MDPI and/or the editor(s) disclaim responsibility for any injury to people or property resulting from any ideas, methods, instructions or products referred to in the content.
Copyright: This open access article is published under a Creative Commons CC BY 4.0 license, which permit the free download, distribution, and reuse, provided that the author and preprint are cited in any reuse.
Prerpints.org logo

Preprints.org is a free preprint server supported by MDPI in Basel, Switzerland.

Subscribe

© 2024 MDPI (Basel, Switzerland) unless otherwise stated