1. Introduction
The addition of small amounts of lithium to aluminum gives the alloy an unparalleled combination of mechanical properties, which has made Al-Li alloys one of the most desirable structural materials for aerospace applications [
1,
2,
3,
4]. Compared to Cu-containing Al-Li alloys, Al-Mg-Li alloys are of great interest in the aerospace industry, especially in the design of ultra-lightweight aircraft components that require weight reduction, due to their low density, high specific strength, excellent welding properties, and high corrosion resistance [
5,
6,
7].
Currently, micro-alloying is the main method to improve the processing properties and service properties of Al alloys [
8,
9,
10,
11,
12,
13,
14]. Therefore, finding appropriate micro-alloying element to elevate the comprehensive performance of Al-Mg-Li alloy is essential. The element beryllium (Be) is widely used as an additive to enhance the performance of casting Al alloys [
15,
16]. Adding a small amount of Be to the casting of high-quality Al alloys used in the aerospace industry enables the formation of a protective film of Be oxide on the surface of the melt, which effectively reduces molten slag and contributes to the degassing effect, improves the purity of the melt and increases its fluidity, resulting in ingots with high purity and good surface finish [
17,
18,
19,
20,
21].
Moreover, Al-Mg-Li alloy is a precipitation strengthening material, and its main precipitates are Al
3Li (δ′), and Al
2MgLi. Since Al
2MgLi precipitate are located at grain boundaries, it exerts little effect in strengthening alloys [
22,
23,
24,
25,
26,
27]. The main strengthening phase in Al-Mg-Li alloys is δ′ phases. Though there are some previous studies on the effect of adding Be of Al alloys [
8,
28], there is a lack of detailed study on the precipitation behavior of Al-Mg-Li alloys with different Be content addition. Thereby, it is still insufficiently known about how the Be element affects the comprehensive properties of the Al-Mg-Li alloy.
In this study, there are four alloys with different Be content were selected as the experimental material. The mechanical properties and anti-corrosion performance of each alloy were obtained. Their precipitation behavior was observed by transmission electron microscopy (TEM), and electron backscattering diffraction (EBSD) was used to characterized the grain morphology and recrystallization behavior of Al-Mg-Li alloys with different Be additions. The aim of this study is to combine the effects of different Be additions on the grain morphology, recrystallization behavior and precipitation behavior of Al-Mg-Li alloys to provide guidance for the subsequent design of Al-Mg-Li alloys.
2. Experimental Procedures
The Al-Mg-Li ingots used in this work were prepared by casting, including four alloys with different Be content. Inductively coupled plasma emission spectrometry (ICP-AES, iCAP7600, Thermo Fisher Scientific, Waltham, MA, USA) was used to measure their chemical composition. As shown in
Table 1, these alloys are named as alloy 1 (Be-free), alloy 2 (0.10wt.%Be), alloy 3 (0.25wt.%Be) and alloy 4 (0.50wt.%Be).
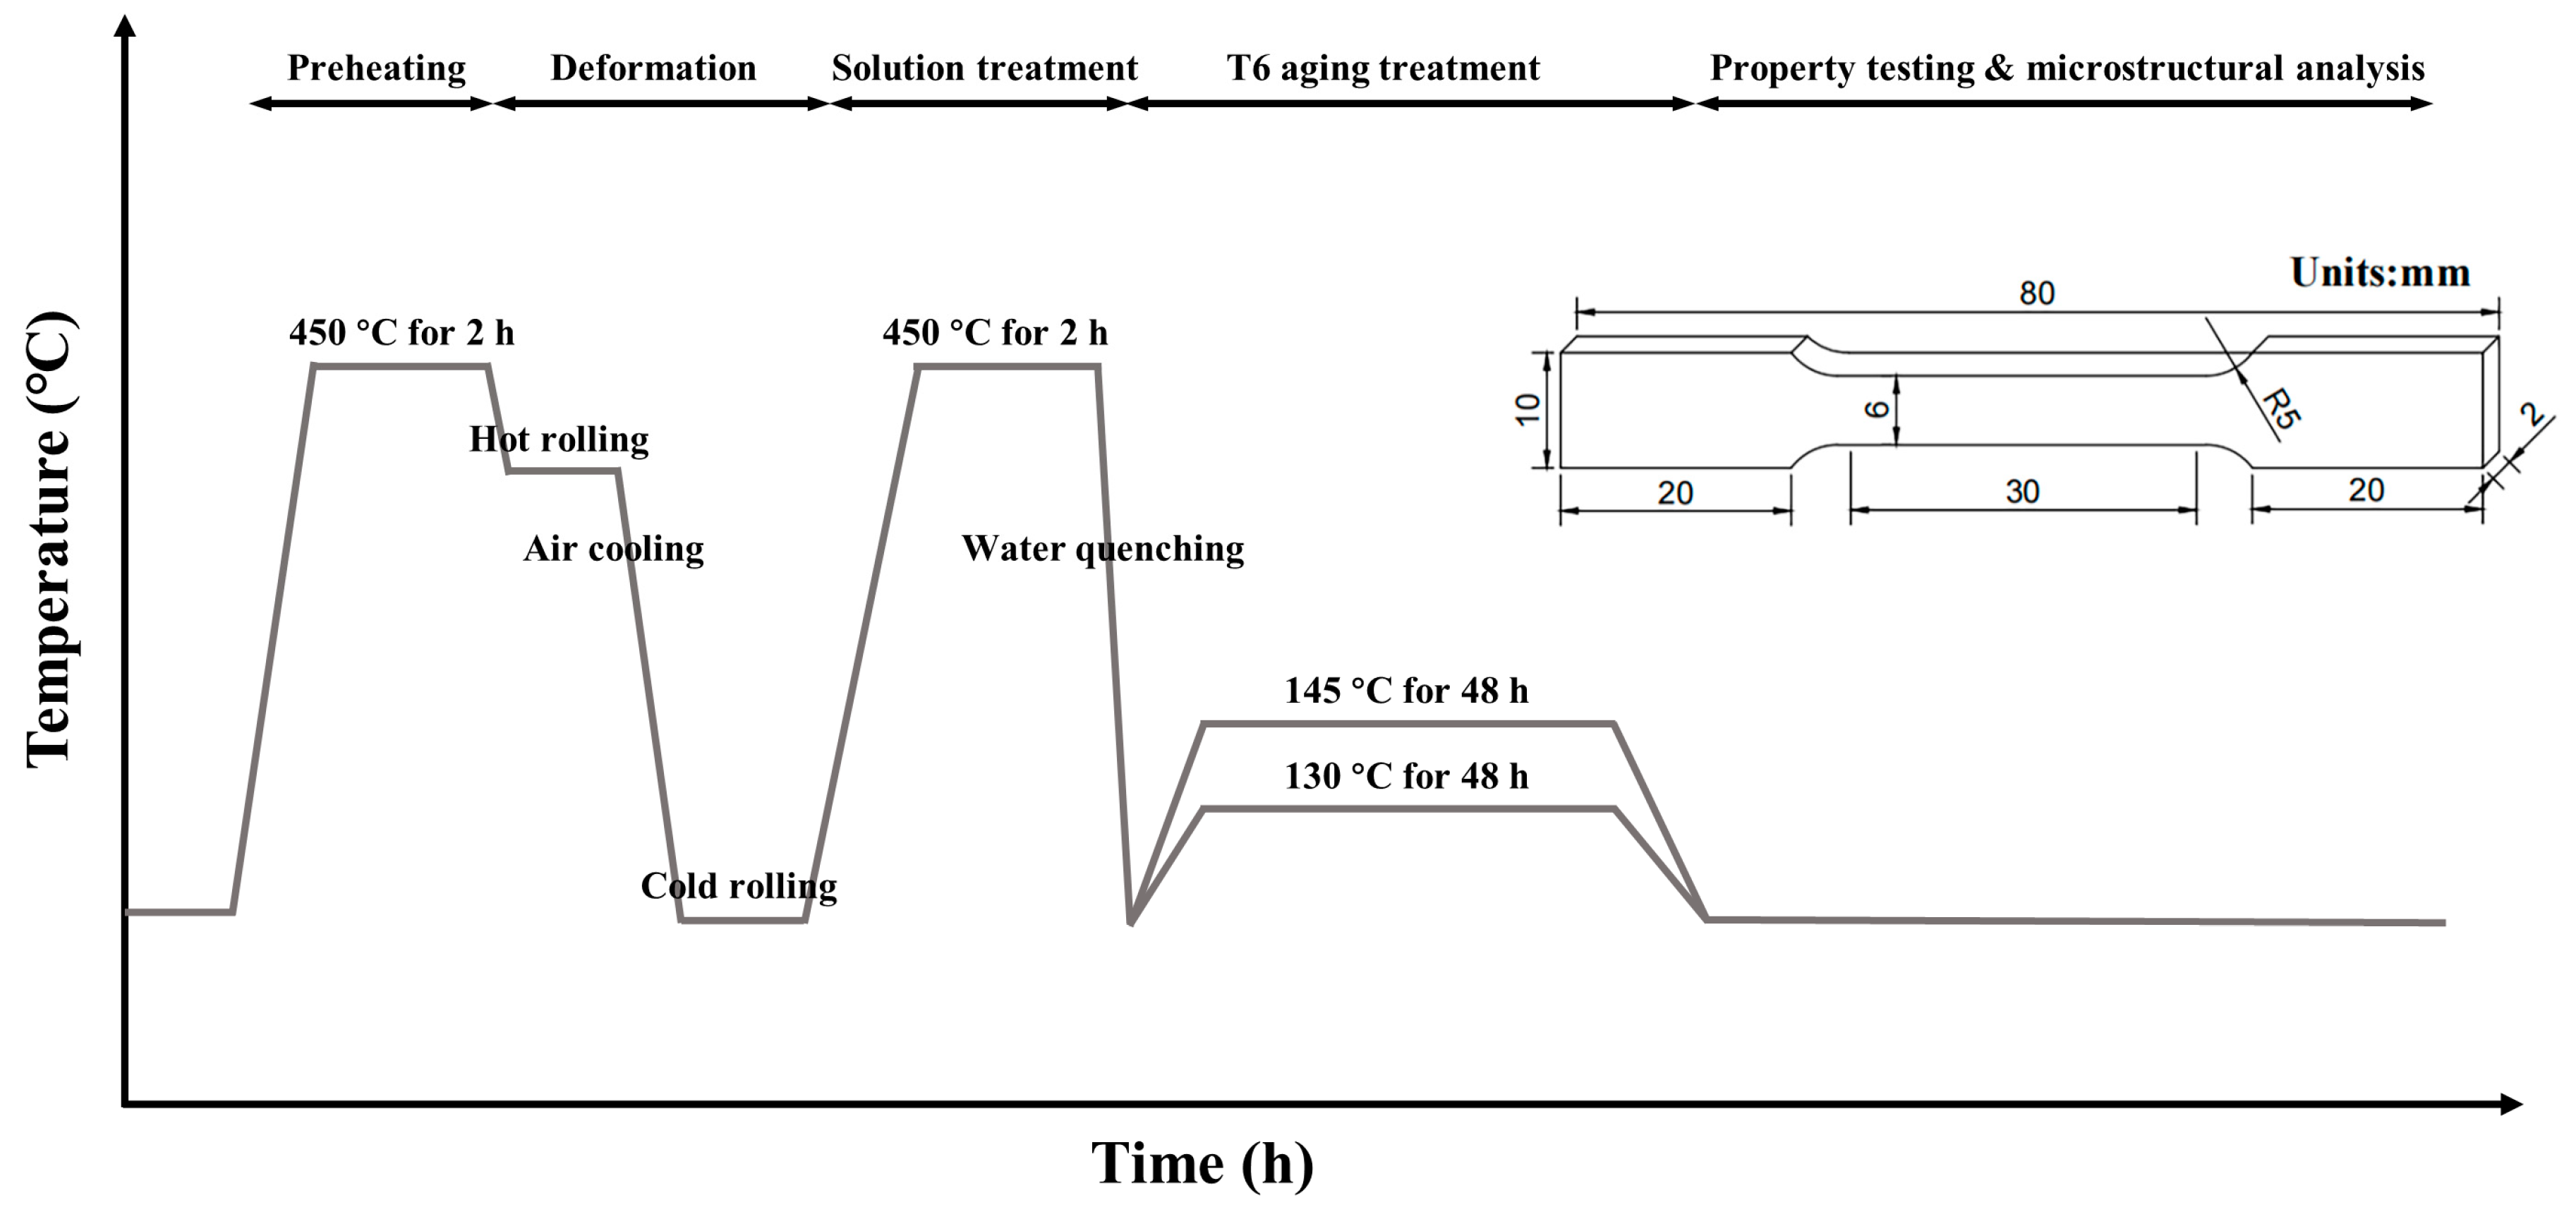
Initially, the as-cast ingots were homogenized for 2 h at 480 °C. After being preheated at 450 °C for 2 h, the homogenized ingots were hot-rolled to sheets with a rolling speed of 50 mm/s and the reduction ratio is 80%. The thickness of sheets was reduced from 10 mm to 2 mm. Then, the sheets were subjected to solid solution treatment at 450 °C for 2 h in an electronic resistance furnace, and quenched in water at ambient temperature. Subsequently, the quenched specimens were aged at 130/145 °C for 48 h in an electric thermostatic drying oven. The whole experiment process is shown in
Figure 1.
According to the standard GB/T 228.1-2021, tensile test samples with a scale length of a 6 mm (width) × 2 mm (thickness) and 30 mm gauge length were cut in the middle of above sheets along the rolling direction (RD), as shown in
Figure 1. The uniaxial room-temperature tensile test was performed in Instron 3369 mechanical tester with a speed of 2 mm/min. Moreover, an extensometer was attached to the tensile samples to determine strain and total elongation. The samples of each alloy were tested three times and the average value was used as the test result.
According to GB/T 7998-2005 standards and GB/T 40338-2021, the intergranular corrosion (IGC) tests and exfoliation corrosion were conducted to evaluate the corrosion resistance of alloy. In the IGC test, the samples were polished and then immersed in 30 g/L NaCl + 10 mL/L HCl solution at 35 ± 2 °C for 24 h. For the preparation of exfoliation corrosion medium, dissolve 53.5 g of NH4Cl, 20 g of NH4NO3 and 1.84 g of (NH4)2C4H4O6 in distilled water, then add 10 ml of H2O2 and dilute to 1 L with distilled or deionized water. The exfoliation corrosion samples were soaked in the solution for 24 h. The corrosion depth on the cross-section of the sample was characterized by optical microscopy (OM, Leica DM4500P, Wizz, Germany).
The rolling direction–transverse direction (RD-TD) plane is the microstructure observation surface for all characterization methods. For electron back scatter diffraction (EBSD) analysis, the samples were mechanically ground with silicon carbide sandpaper and polished with 1.5 μm Al2O3 polishing powder. Then, the samples were electrolytic polished with 10% HClO4 and 90% C2H5OH solution at temperature of −25 °C and voltage of 20 V for 3 s. The ZEISS EVO MA10 scanning electron microscope (SEM) and an OXFORD EBSD detector (at 25 kV) were used to perform the EBSD test. The CHANNEL 5 software was used to carry out data processing. For transmission electron microscope (TEM) observations, the samples were initially ground to a thickness of 80 μm. Then, a twin-jet electrolytic thinning instrument was used to polish the samples with a mixed solution of 25% HNO3 and 75% CH3OH at −30 °C. The number density, size, and distribution of precipitates were characterized by JEM-2100F, JEOL, Tokyo, Japan.
3. Results
3.1. Tensile Properties
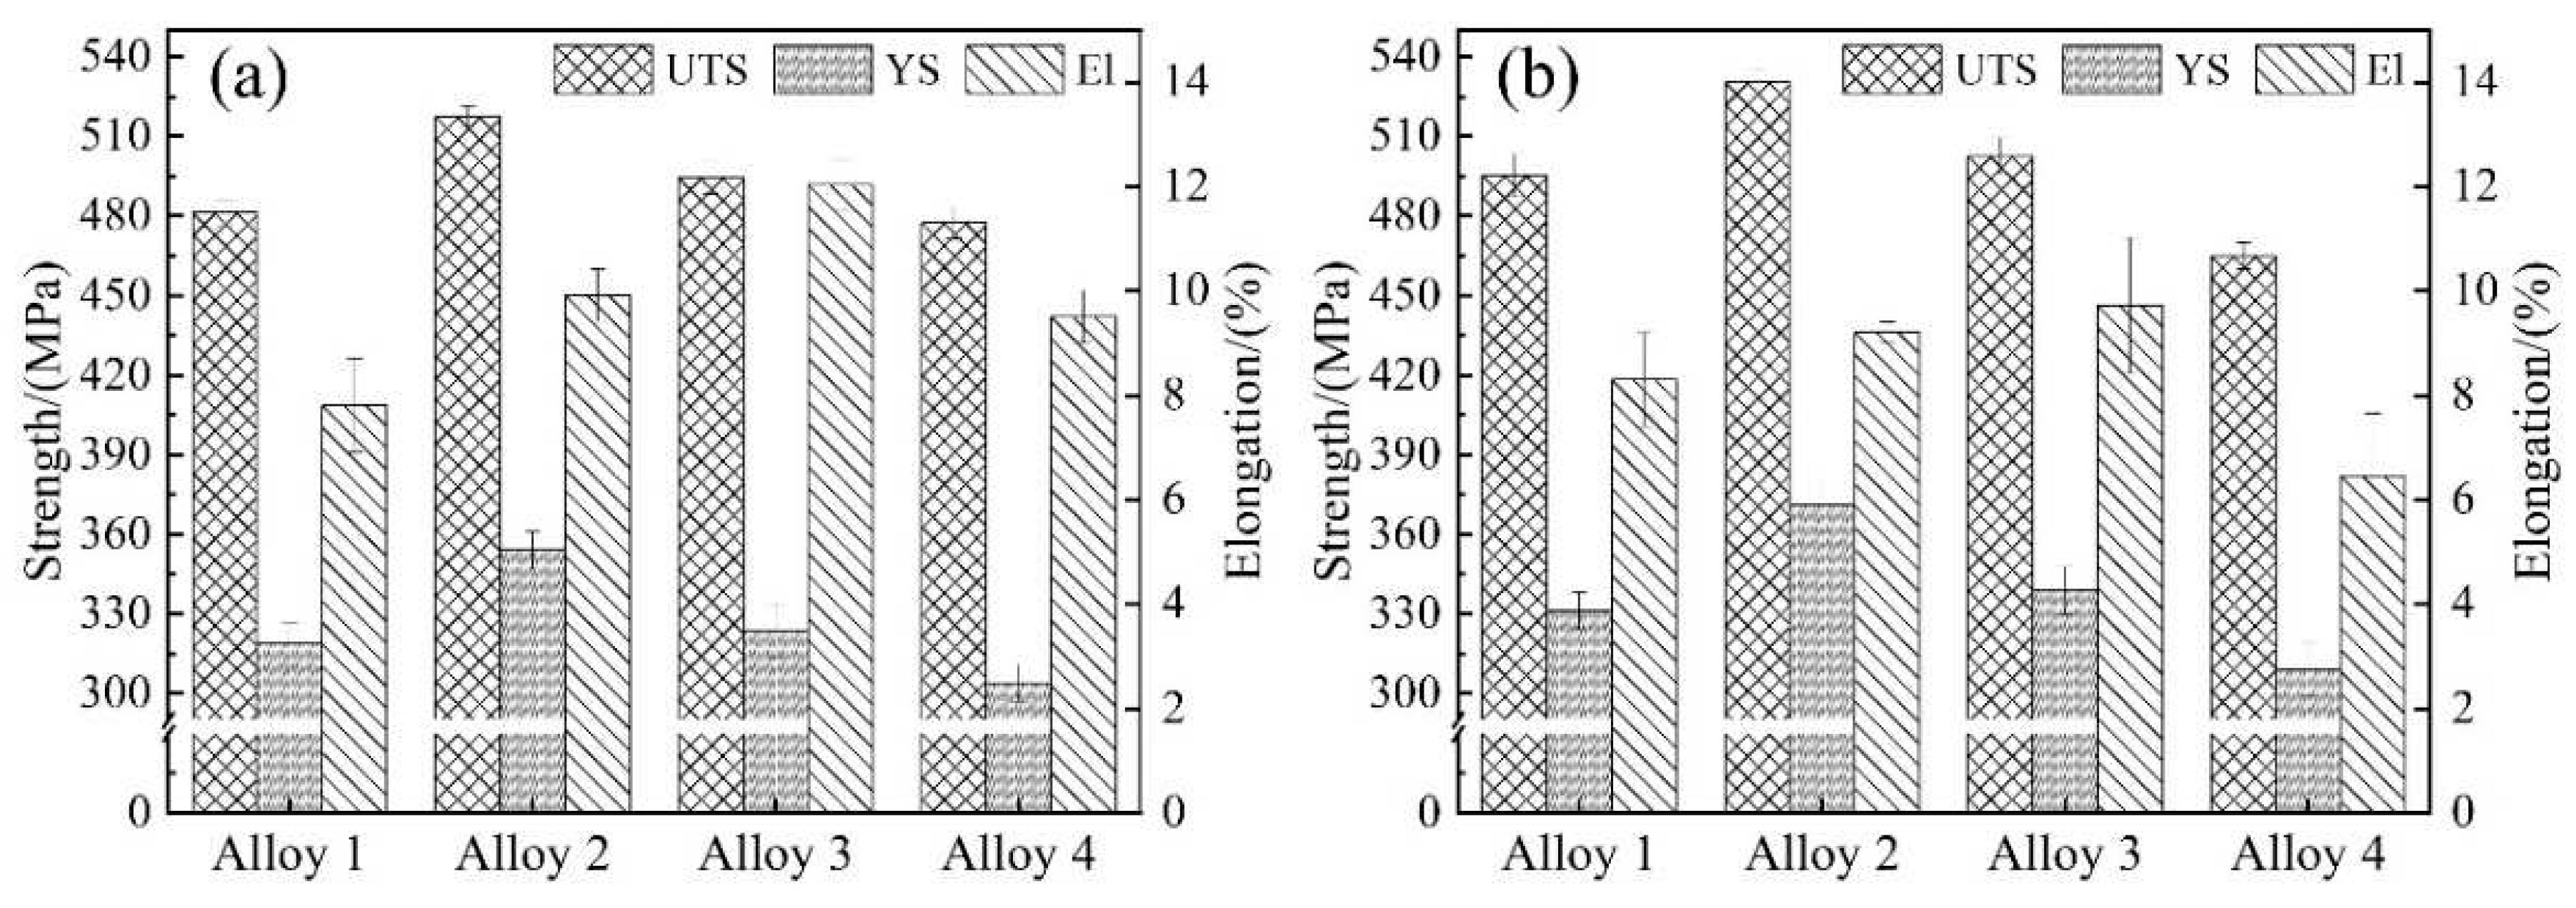
Figure 2 shows the histograms of the tensile properties of alloys 1 to 4 after aging at 130℃/48 h and 145℃/48 h. It is obvious that alloy 2 has the best overall room temperature tensile property. The tensile properties of the alloy increase with the minor addition of Be, while it decreases with the excessive addition. Both 130℃ and 145℃ aging condition show the same trend, each alloy presented better properties at 145 ℃ aging condition.
It can be seen that alloy 2 containing 0.1 wt.% Be exhibits the best performance at 145℃/48 h aging with UTS, YS and El of 530 MPa, 370 MPa and 9.2%, respectively, and the calculated specific strength is 214 MPa·cm3/g. In contrast, Be-free alloy 1 shows UTS, YS and El of 495 MPa, 331 MPa and 8.3% after 145 ℃/48 h aging. When the Be content increased to 0.25 wt.%, the UTS and YS of alloy 3 at 145℃/48 h aging decrease to 502 MPa and 338 MPa, respectively. Its specific strength is 203 MPa·cm3/g, which is significantly lower than that of alloy 2, while El increases to 9.7%. When the Be content continued to increase to 0.50 wt.%, the UTS, YS and El of alloy 4 at 145℃/48 h aging continued to reduce to 464 MPa, 309 MPa and 6.5%, respectively, and the specific strength is further reducing to 187 MPa·cm3/g.
For short, the addition of 0.1-0.25 wt.% Be shows a positive effect on the room-temperature tensile properties of Al-Mg-Li alloy. The addition of 0.1 wt.% Be notably improves the strength and elongation, but the excessive addition of Be content causes a remarkable degradation of tensile properties.
3.2. Corrosion Behaviors
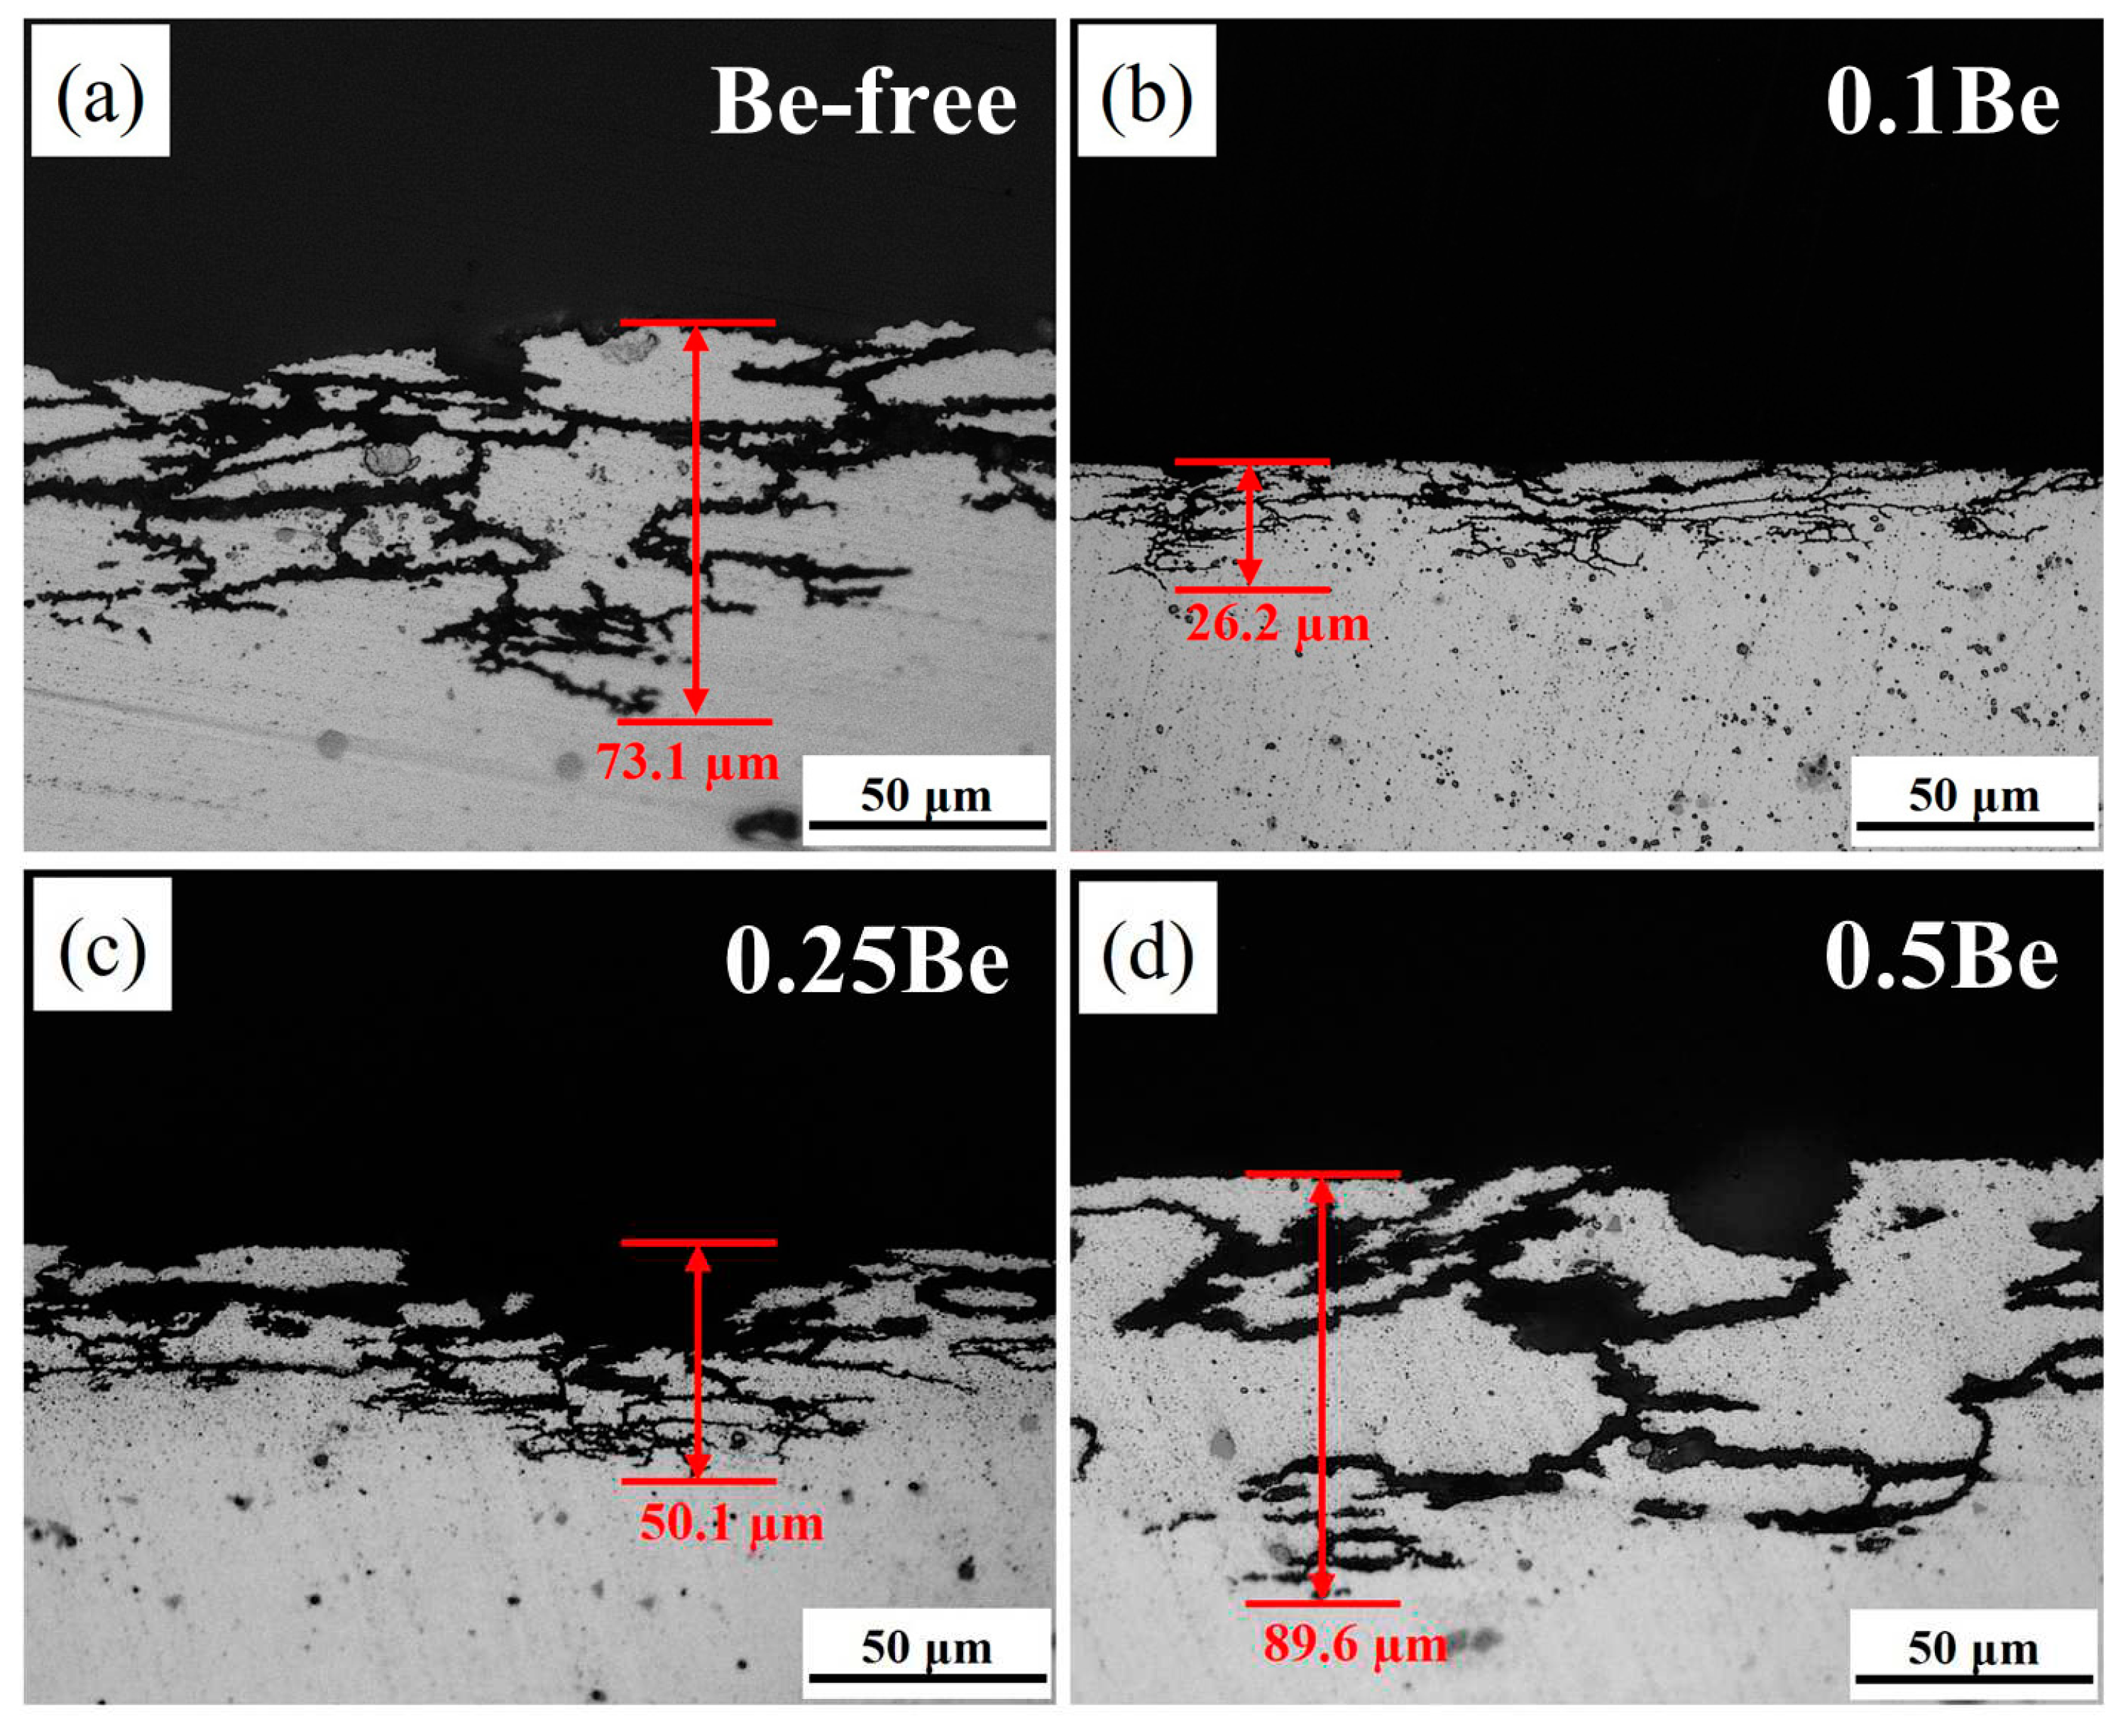
Figure 3 presents the OM images of the cross-section of alloy 1-4 in 145℃/48 h aging condition after 24 h of immersion in IGC solution. It can be seen that the corrosion mode of all alloy samples is uniform intergranular corrosion, corrosion extends inside the alloy along grain boundaries. The alloy 4 experienced severe IGC, which its corrosion surface produced partial detachment where corrosion along the large angle grain boundary deep inside the alloy, and corrosion band is wide with a maximum corrosion depth of 89.6 μm. The corrosion of alloy 1 is also aggressive. The grain of corrosion surface detached and the corrosion band width is slightly less than alloy 4 with a maximum corrosion depth of about 73.1 μm, which is slightly shallower than alloy 4. The alloy 2 presents the best performance of IGC resistance. There is no obvious grain detachment on its corrosion surface and the corrosion band is thin and the corrosion depth is the shallowest, the maximum corrosion depth is only 26.2 μm, which is significantly lower than that of alloy 4 and alloy 1. The IGC resistance of alloy 3 is between alloy 1 and alloy 2, with obvious traces of pitting on the corrosion surface and thin corrosion bands along the grain boundaries in the interior, with a maximum corrosion depth of about 50.1 μm.
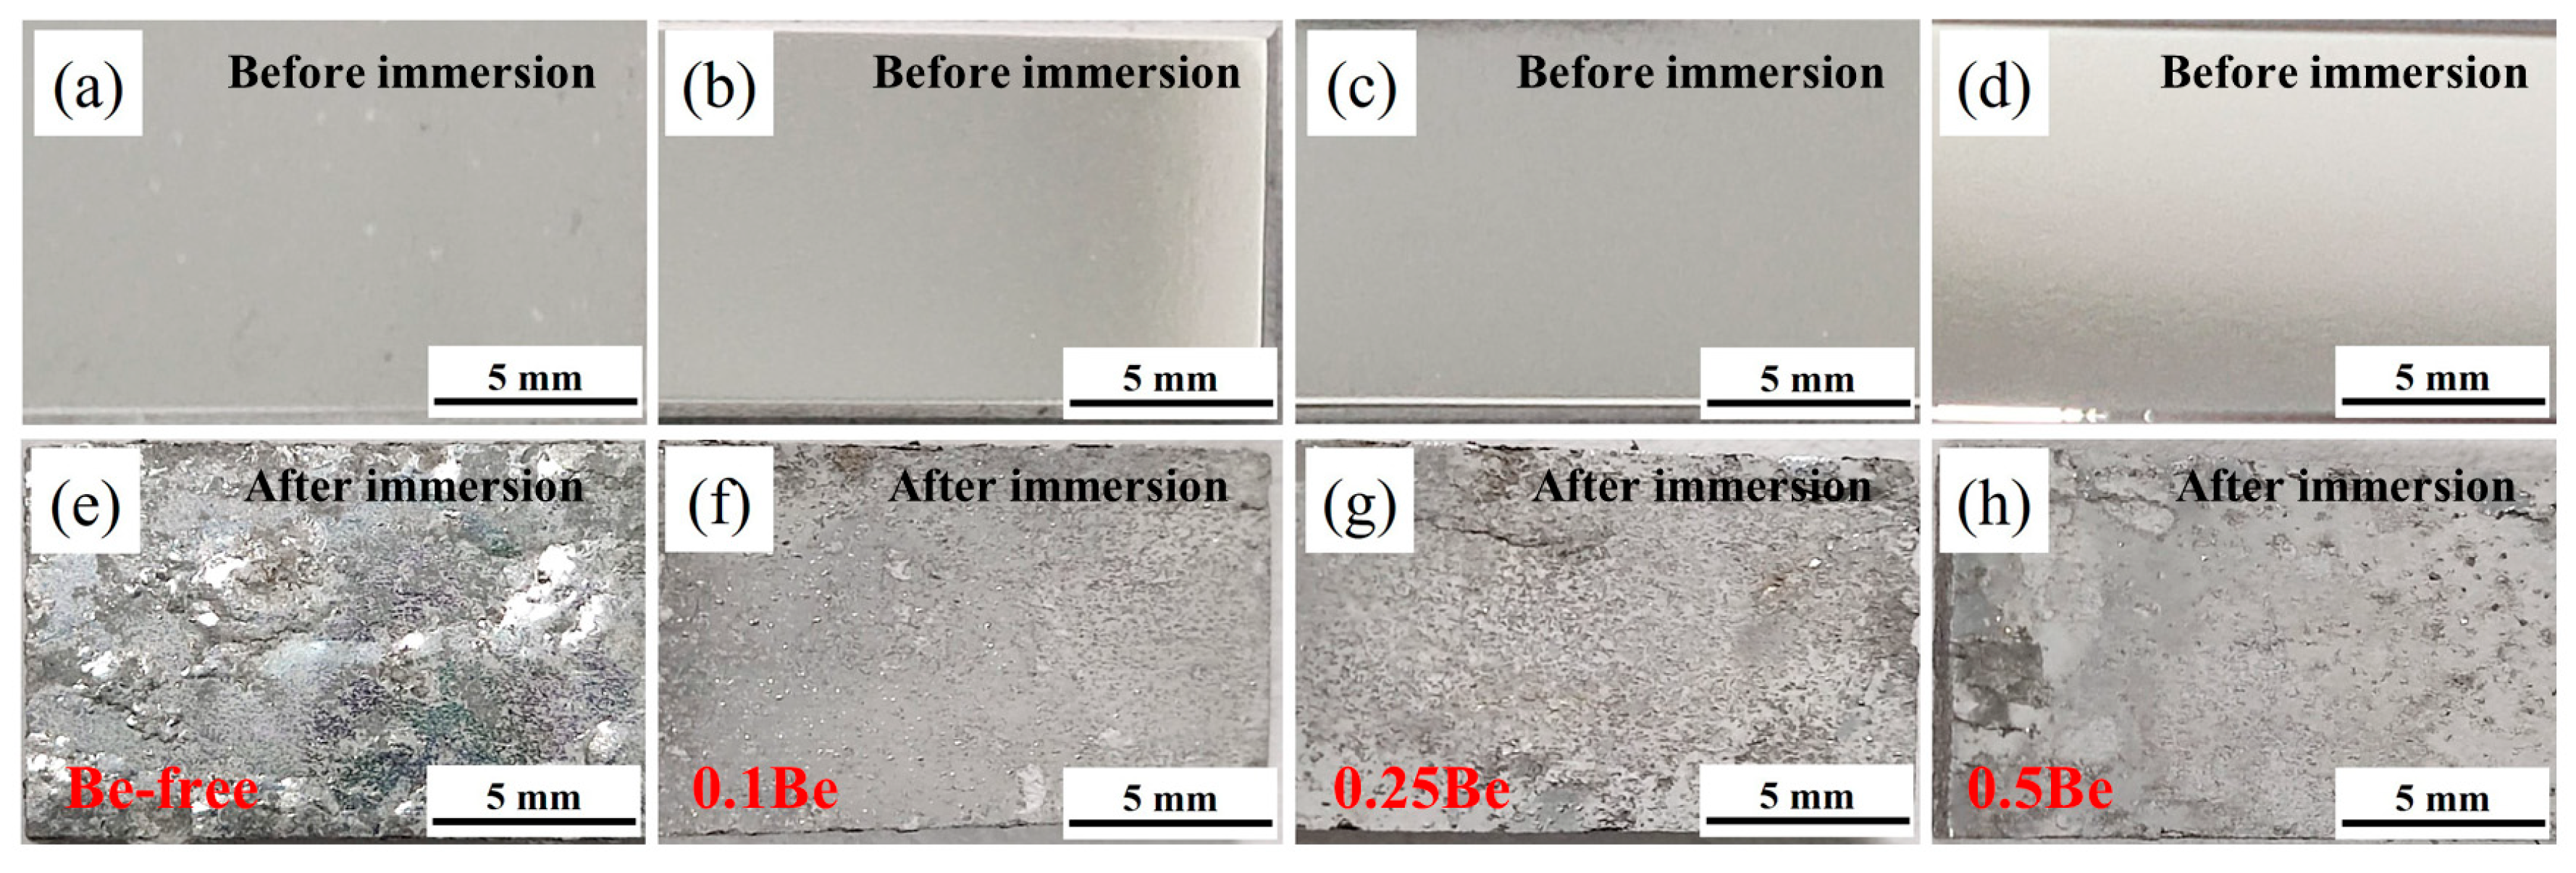
The macroscopic pictures of exfoliation corrosion of alloys with different Be content after aging treatment at 145 ℃/48 h are shown in
Figure 4. The corroded surface of Alloy 1 shows severe pitting, along with skin bursting, blistering and surface cracking, indicating poor corrosion resistance. The corrosion surface of alloy 2 exhibits minor pitting, no skin bursting or cracking, showing good anti-corrosion performance. With the excessive addition of Be content, the exfoliation corrosion performance of alloys deteriorates. The exfoliation corrosion of alloy 3 shows more serious pitting, while the corrosion surface edge exists blisters and spalling phenomena. On the corroded surface of Alloy 4, the presence of pits, together with the large area of blister scars, and the cracking and spalling of the alloy edges indicate further deterioration in corrosion performance.
In a word, the trace addition of 0.1 wt.% Be can significantly improve the anti-exfoliation corrosion performance of Al-Mg-Li alloy, but as the Be content in the alloy increase to an excessive level, the corrosion resistance is notably reduced.
3.3. Microstructures
3.3.1. As-Cast Grain Structures
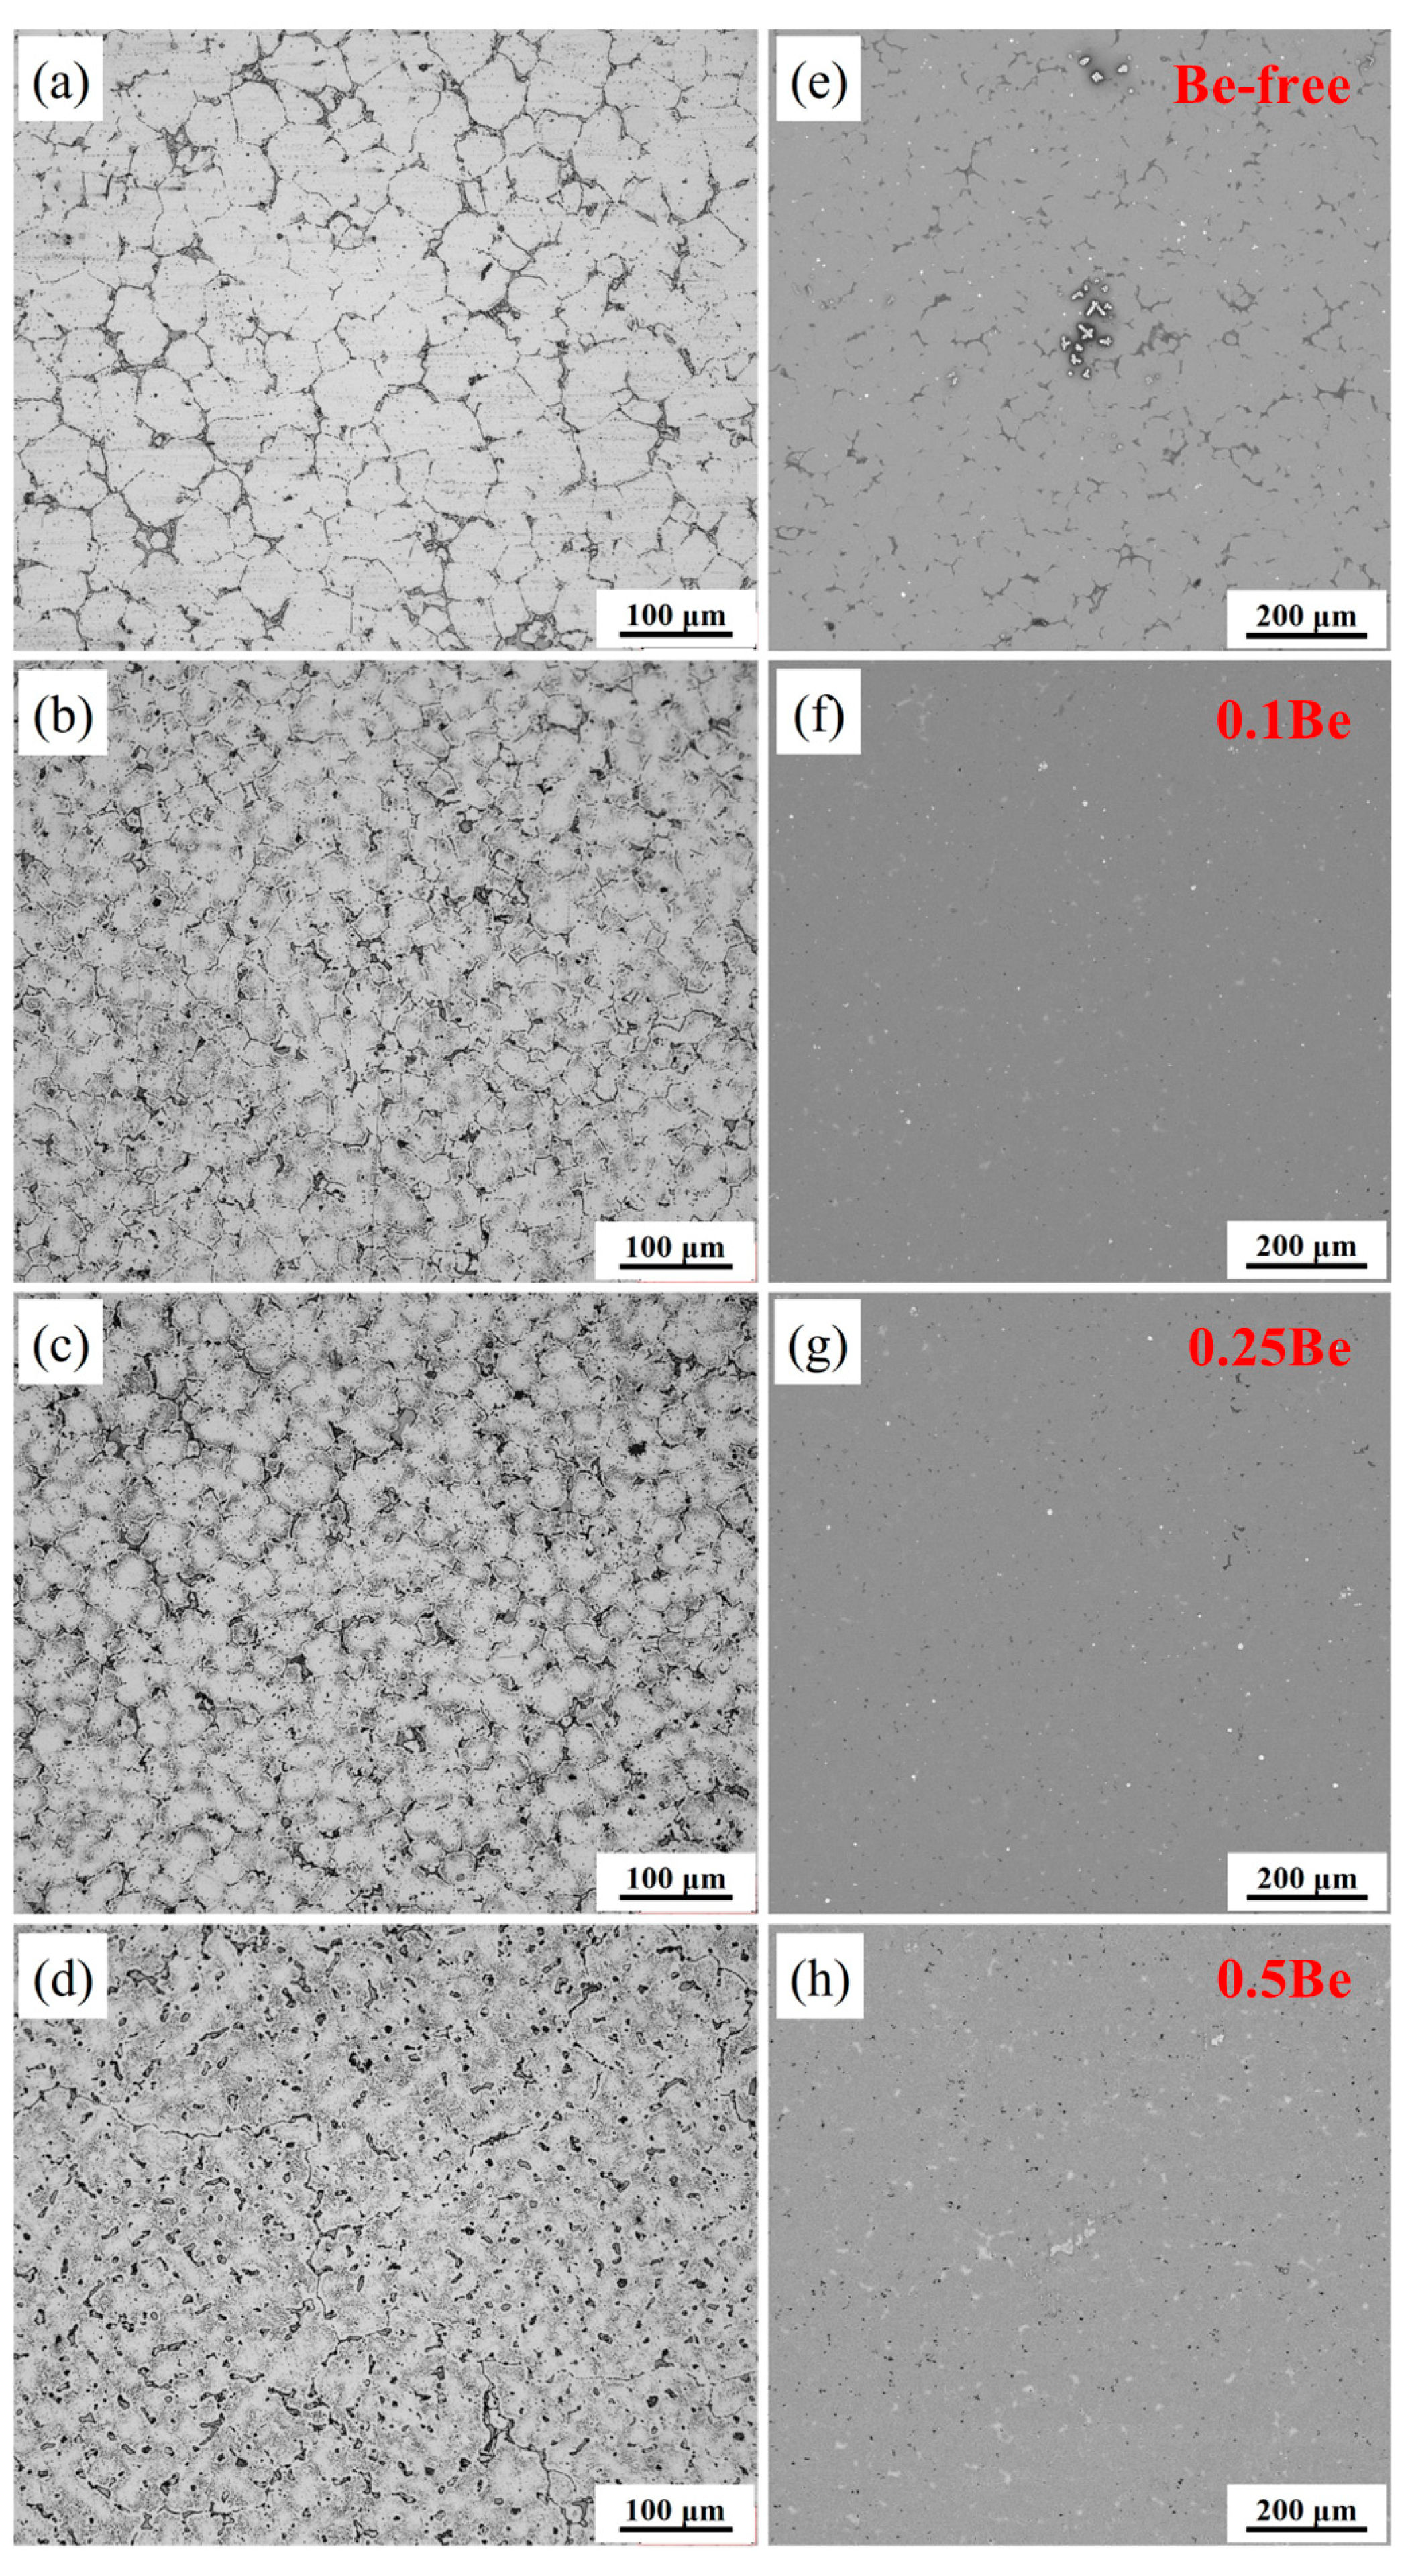
The OM and SEM images of the as-cast alloys with different Be contents are shown in
Figure 5. The OM images present varying degrees of dendritic segregation within the grains of all alloys, where their as-cast grain morphology is quite different. Alloys 1-3 exhibit equiaxed-grain structure, while alloy 4 shows a distinctive dendritic grain structure. The average grain sizes of alloy 1 and alloy 2 are statistically counted to be 41.3 μm and 22.6 μm, while the alloy 3 and alloy 4 are 29.4 μm and 28.7 μm, respectively. Excessive addition of Be (0.50 wt.%) causes the alloy grains to become particularly coarse and the grain morphology to change from equiaxed to dendritic.
According to the SEM images of the as-cast alloys with different Be content, Be-free alloy 1 has more distinctive element segregation, a higher number density of white non-equilibrium crystalline phases. In contrast, the addition of trace Be (0.1 wt.%) significantly reduced the element segregation in Alloy 2, with only some small white insoluble secondary phases. It indicates that the addition of trace Be can help to alleviate the element segregation and reduce the grain size in the as-cast Al-Mg-Li alloy. The grain structure of Alloy 3 is similar to that of Alloy 2, but it has more black dotted secondary phases. Alloy 4 shows more black dotted secondary phases and white non-equilibrium crystalline phase areas. With the increase of Be content, the density of the black punctate solidification phase increases, while the white non-equilibrium crystalline phase changes from a discrete distribution to a continuous distribution.
3.3.2. Distribution form of Be Oxides
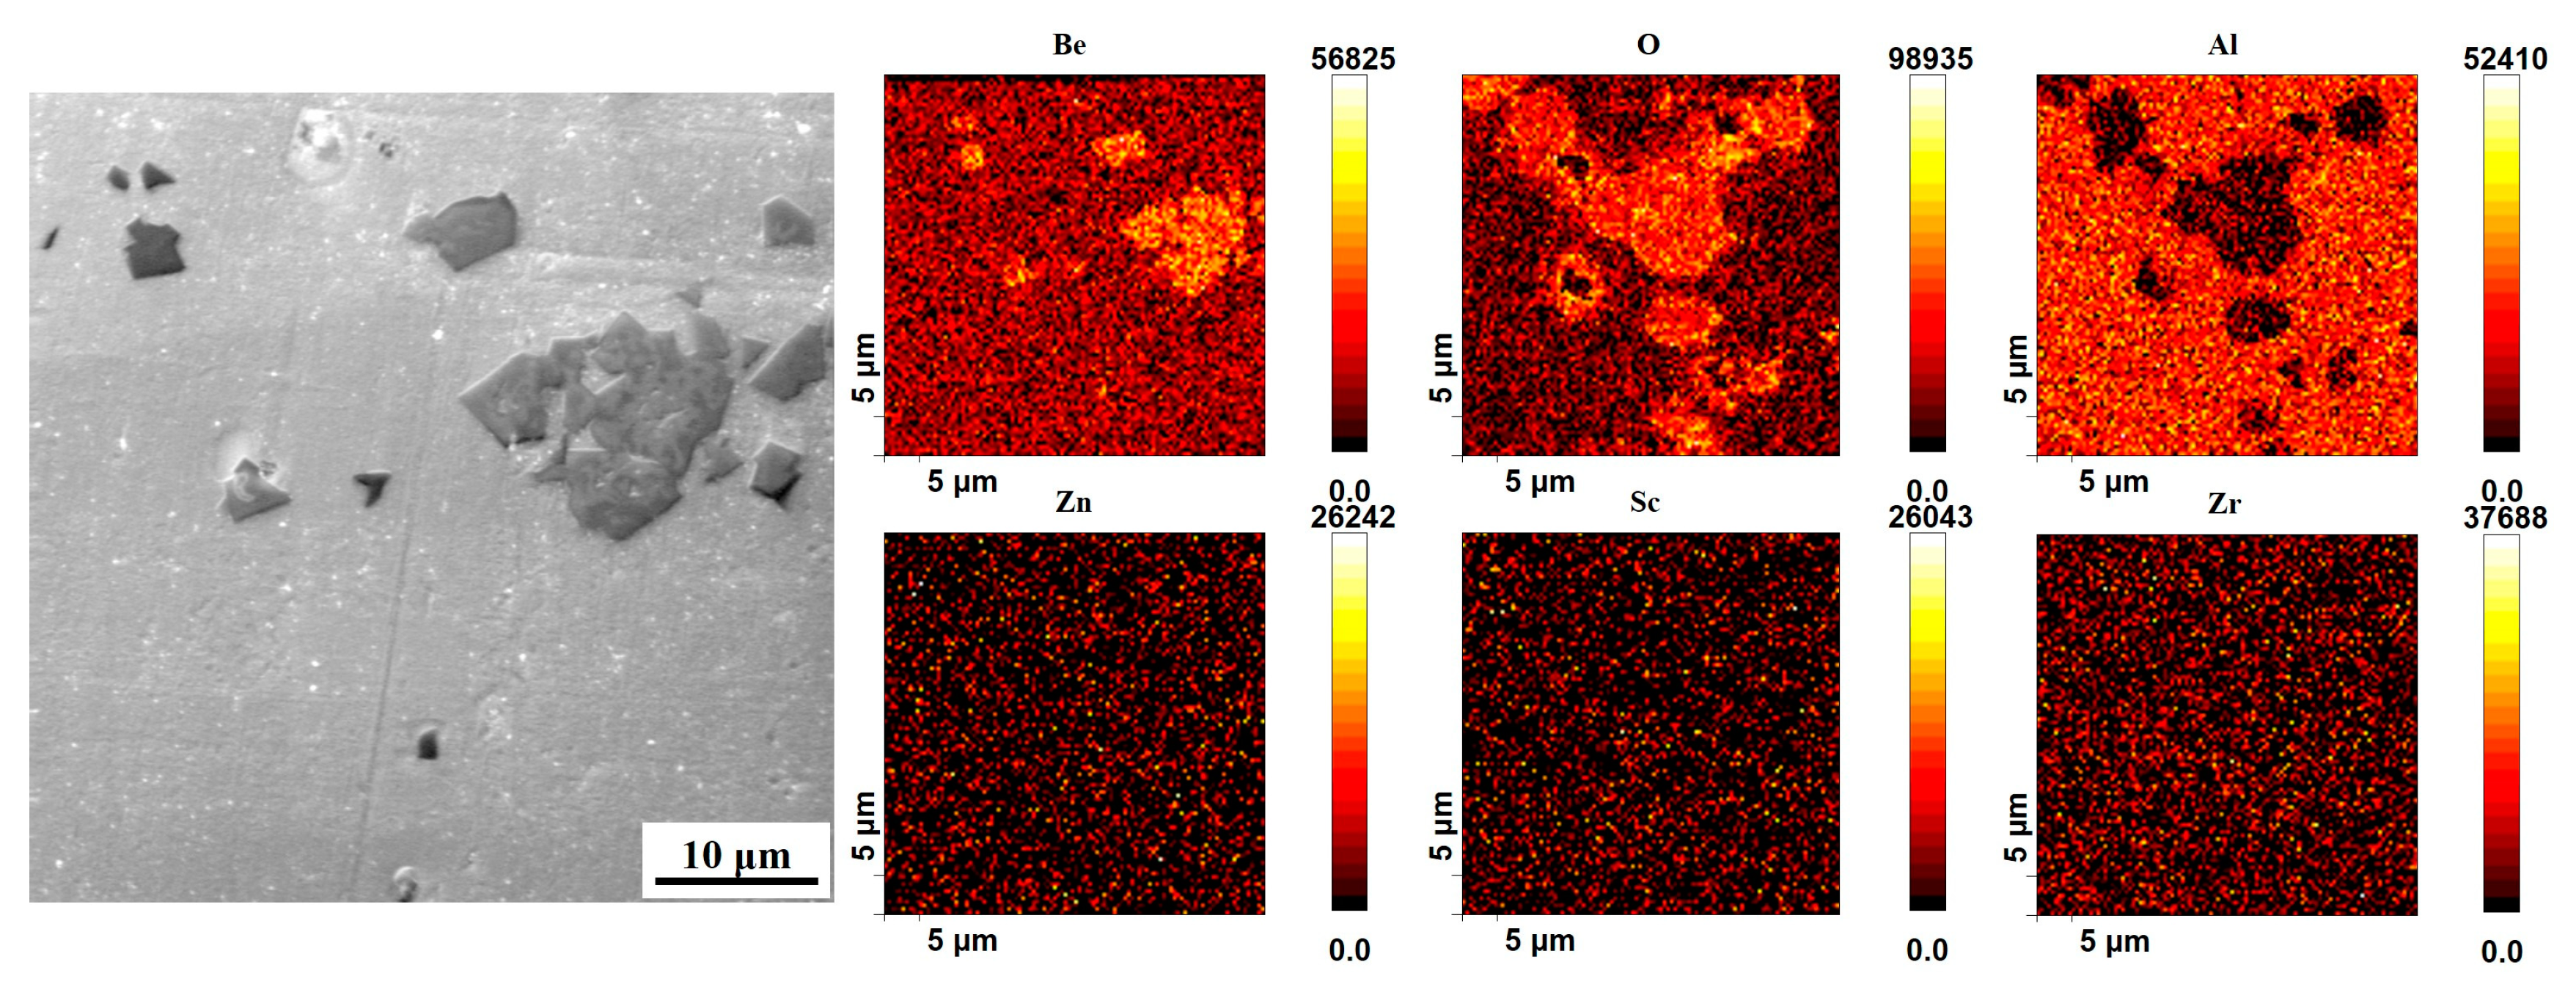
In order to further reveal the distribution of Be elements in the alloy, the as-cast alloy 4 was analyzed by the Auger electron spectroscopy (AES), and the results are shown in
Figure 6, 7. According to the results of AES scan mapping analysis of alloy 4 (
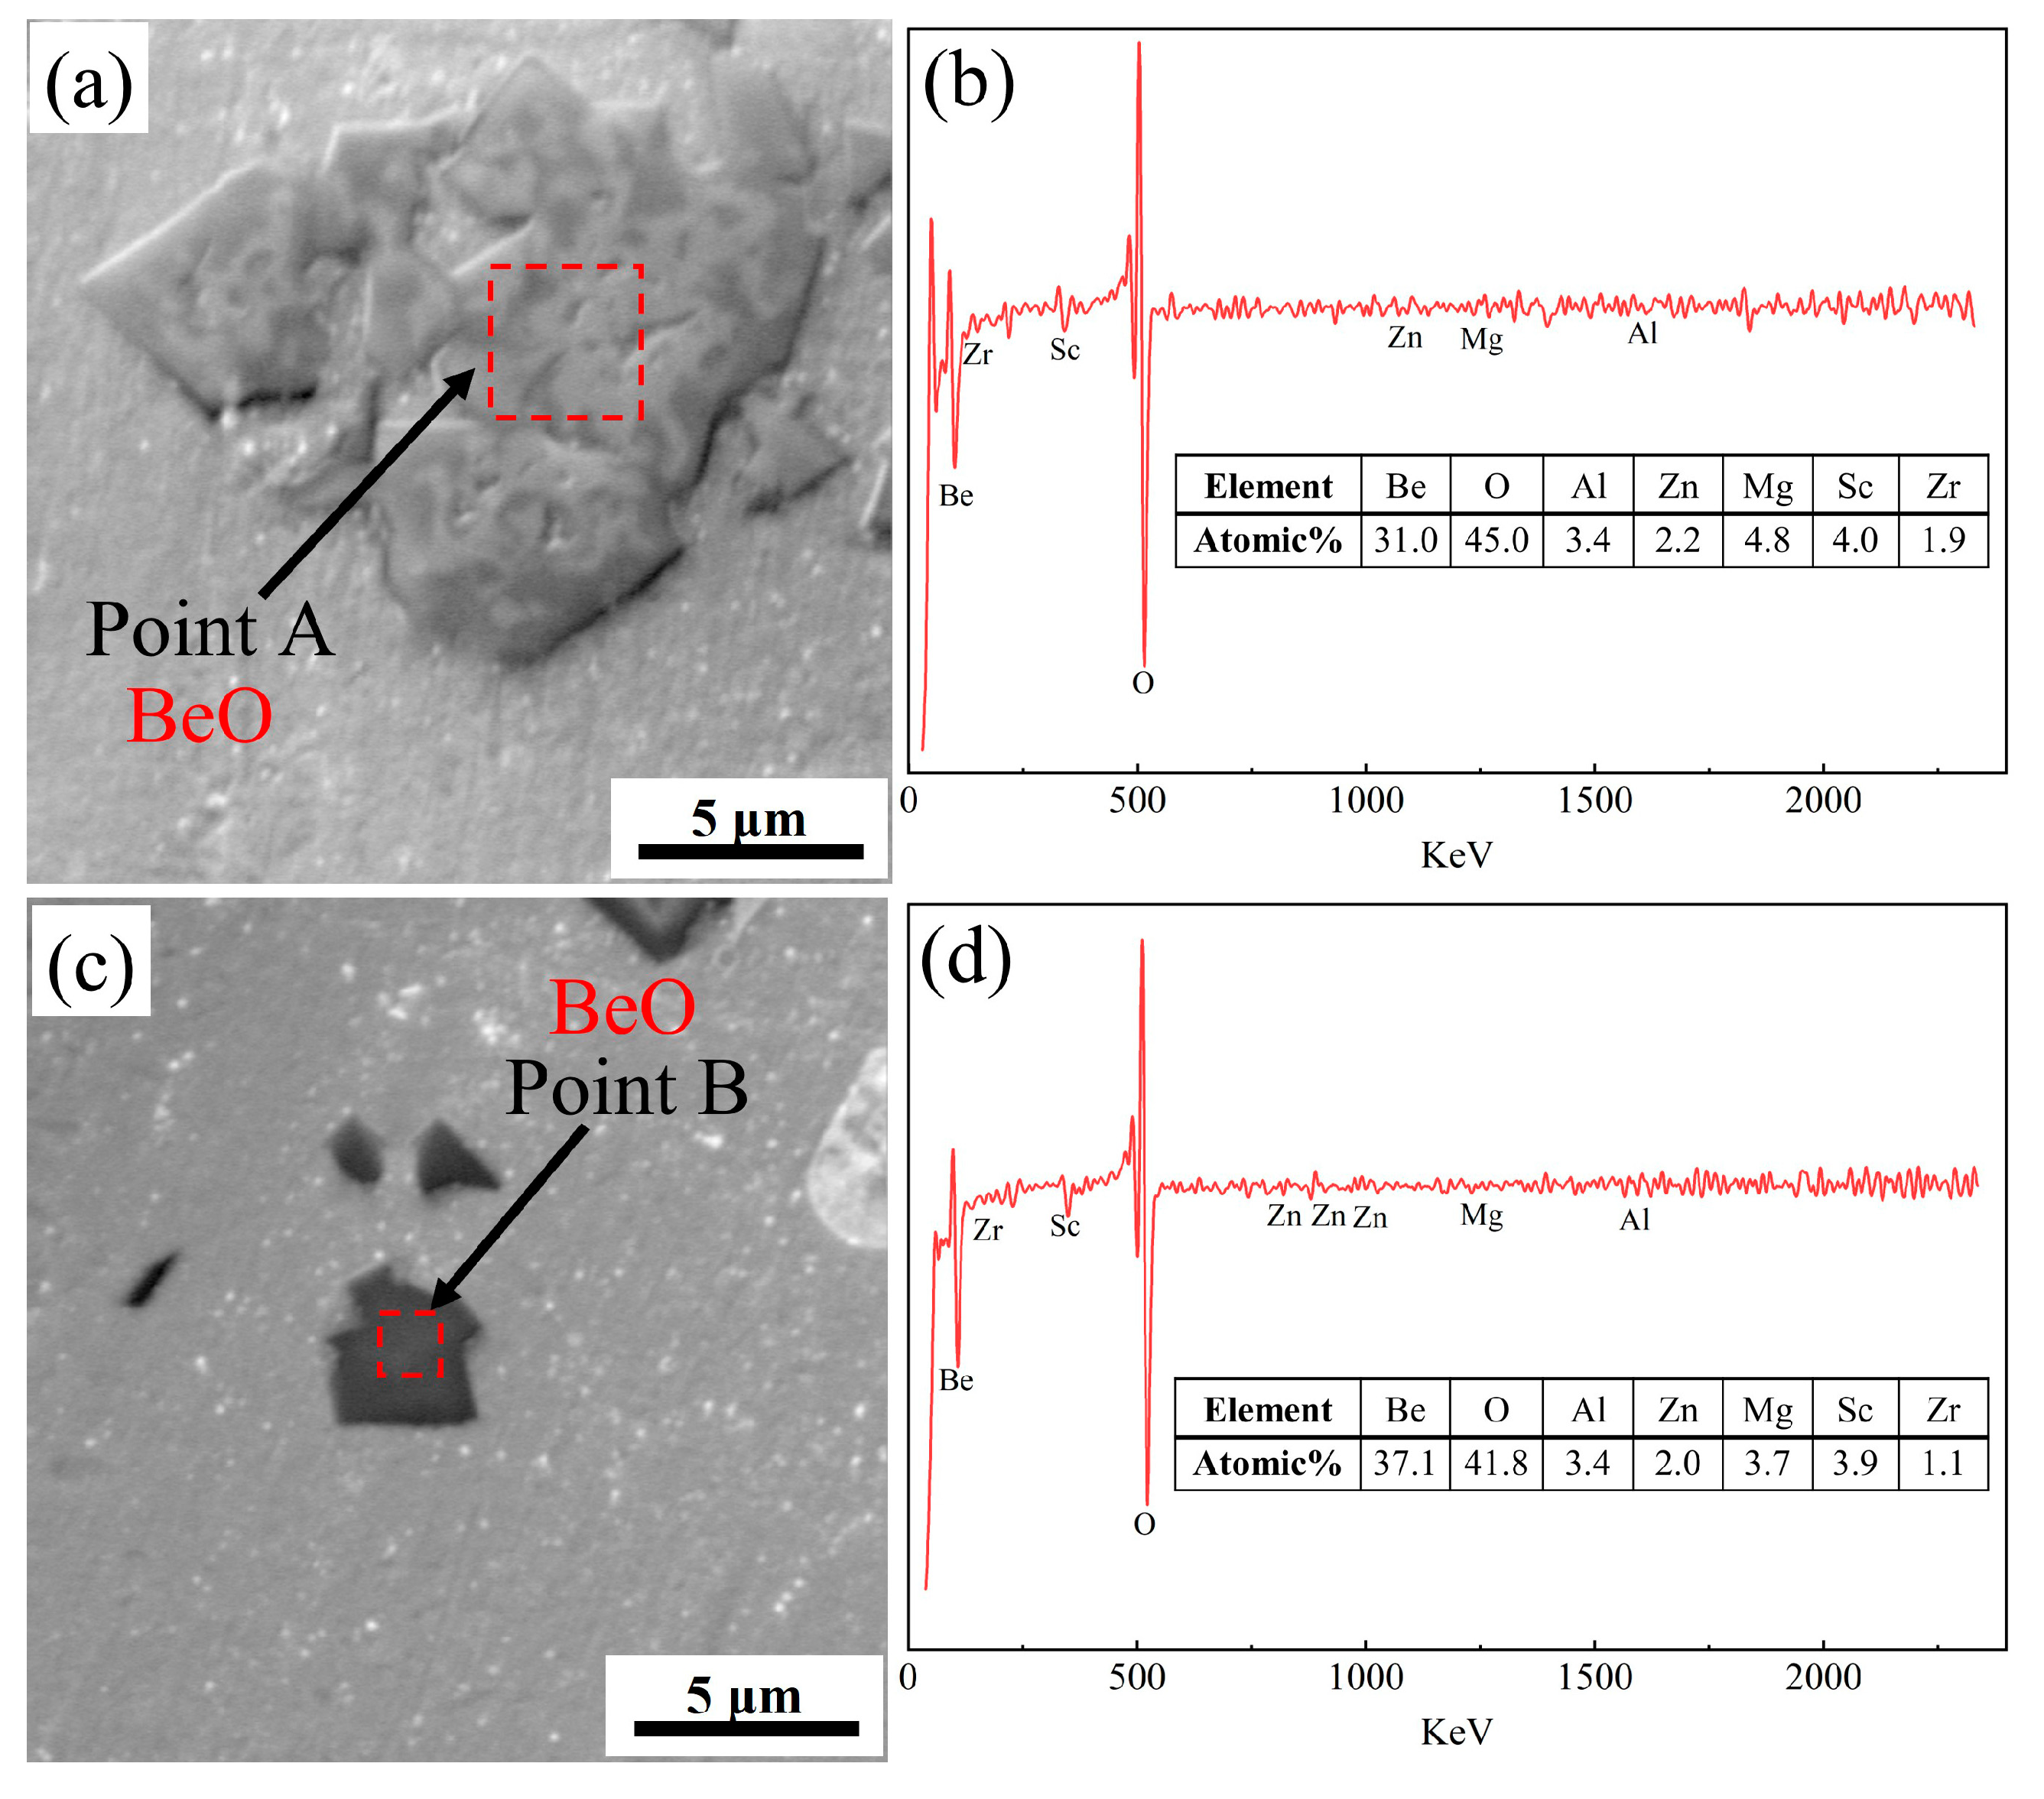
Figure 6), Be is present in the as-cast alloy 4 in two main forms, a secondary phase with a large size and layered stacking distribution, and a secondary phase with a smaller size and dispersed distribution. The distribution areas of both phases are rich in O elements, so it can be tentatively concluded that both phases are oxides of Be. Subsequently, AES point scanning results of the two Be containing phases in alloy 4 revealed that the main constituent elements of both phases are Be and O (
Figure 7). The atomic ratios of Be and O in the large-size Be containing phase are 31 at.% and 45 at.%, while in the small-size Be containing phase are 37 at.% and 41 at.%, which are recognized to be BeO. Therefore, the addition of 0.50 wt.% Be results in the formation of large amounts of Be oxides, which deteriorates the properties of the alloy.
3.3.3. Recrystallization Behaviors
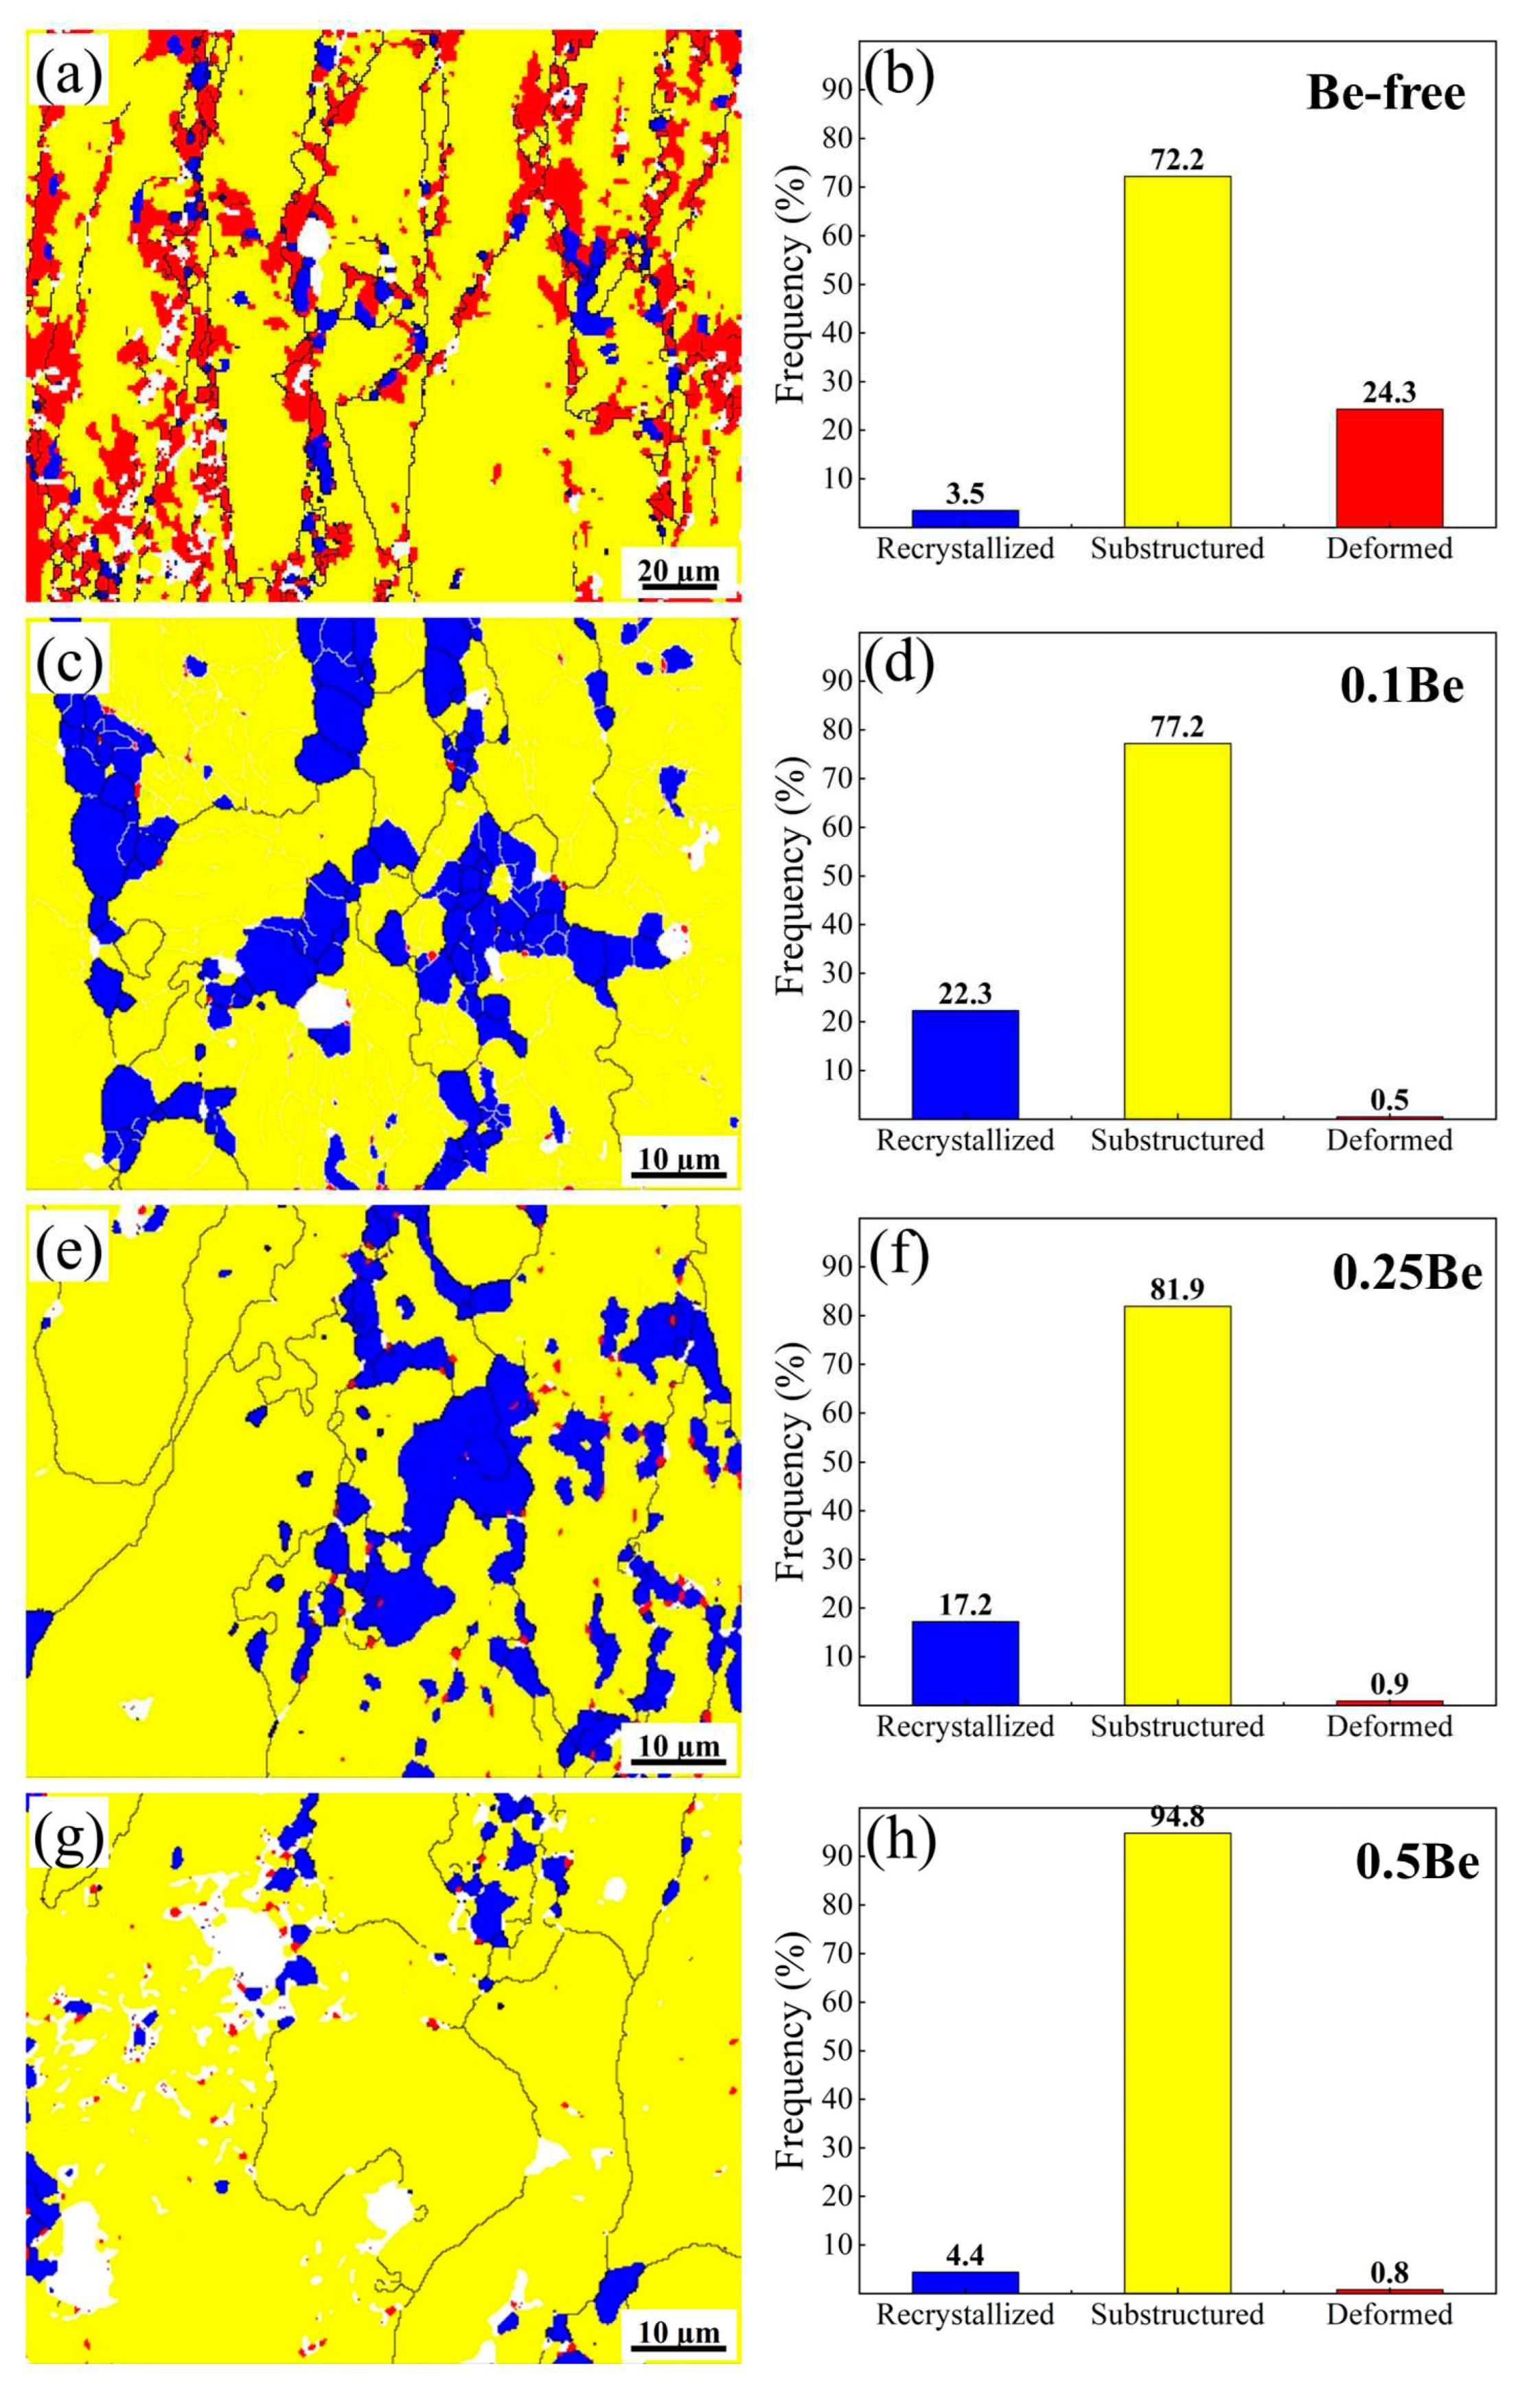
The distribution statistics of recrystallization fraction of hot-rolled plates of alloys with different Be content after solid solution treatment are shown in
Figure 8. The grain structures of alloys with different Be contents after solid solution treatment are quite different. After solid solution, the grain structure of Be-free alloy 1 consists mainly of sub-structured and deformed grains, with only partially recrystallized grains during the dynamic recovery and dynamic recrystallization, and the proportions of the recrystallized grains, sub-structured grains and deformed grains are 3.5%, 72.2% and 24.3%, respectively. While the solid solution treated alloy 2, containing 0.1 wt.% Be, has more recrystallized grains and more substructures. Compared to alloy 1, the proportion of recrystallized grains increased, and the proportion of deformed grains decreased remarkably, with the proportion of recrystallized, sub-structured, and deformed grains being 22.3%, 77.2%, and 0.5%, respectively. When the Be content increases to 0.25wt.%, the degree of recrystallization in Alloy 3 decreases, the sub-structure grains increase, the deformed grains remain the level of alloy 2, and the proportions of recrystallized grains, sub-structured grains, and deformed grains are 17.2%, 81.9%, and 0.9%, respectively. As the Be content continues to elevate, the degree of recrystallization in alloy 4 decreases further, the proportion of substructures increases, and the deformed grains decreases, with the proportions of recrystallized, sub-structured, and deformed grains being 4.4%, 94.8%, and 0.8%, respectively.
In summary, the addition of 0.1 wt.% Be to the Al-Mg-Li alloy can significantly enhance its recrystallization degree, but with the continued increase of Be content, the recrystallization degree of the alloy decreases.
3.3.4. Precipitation Behaviors
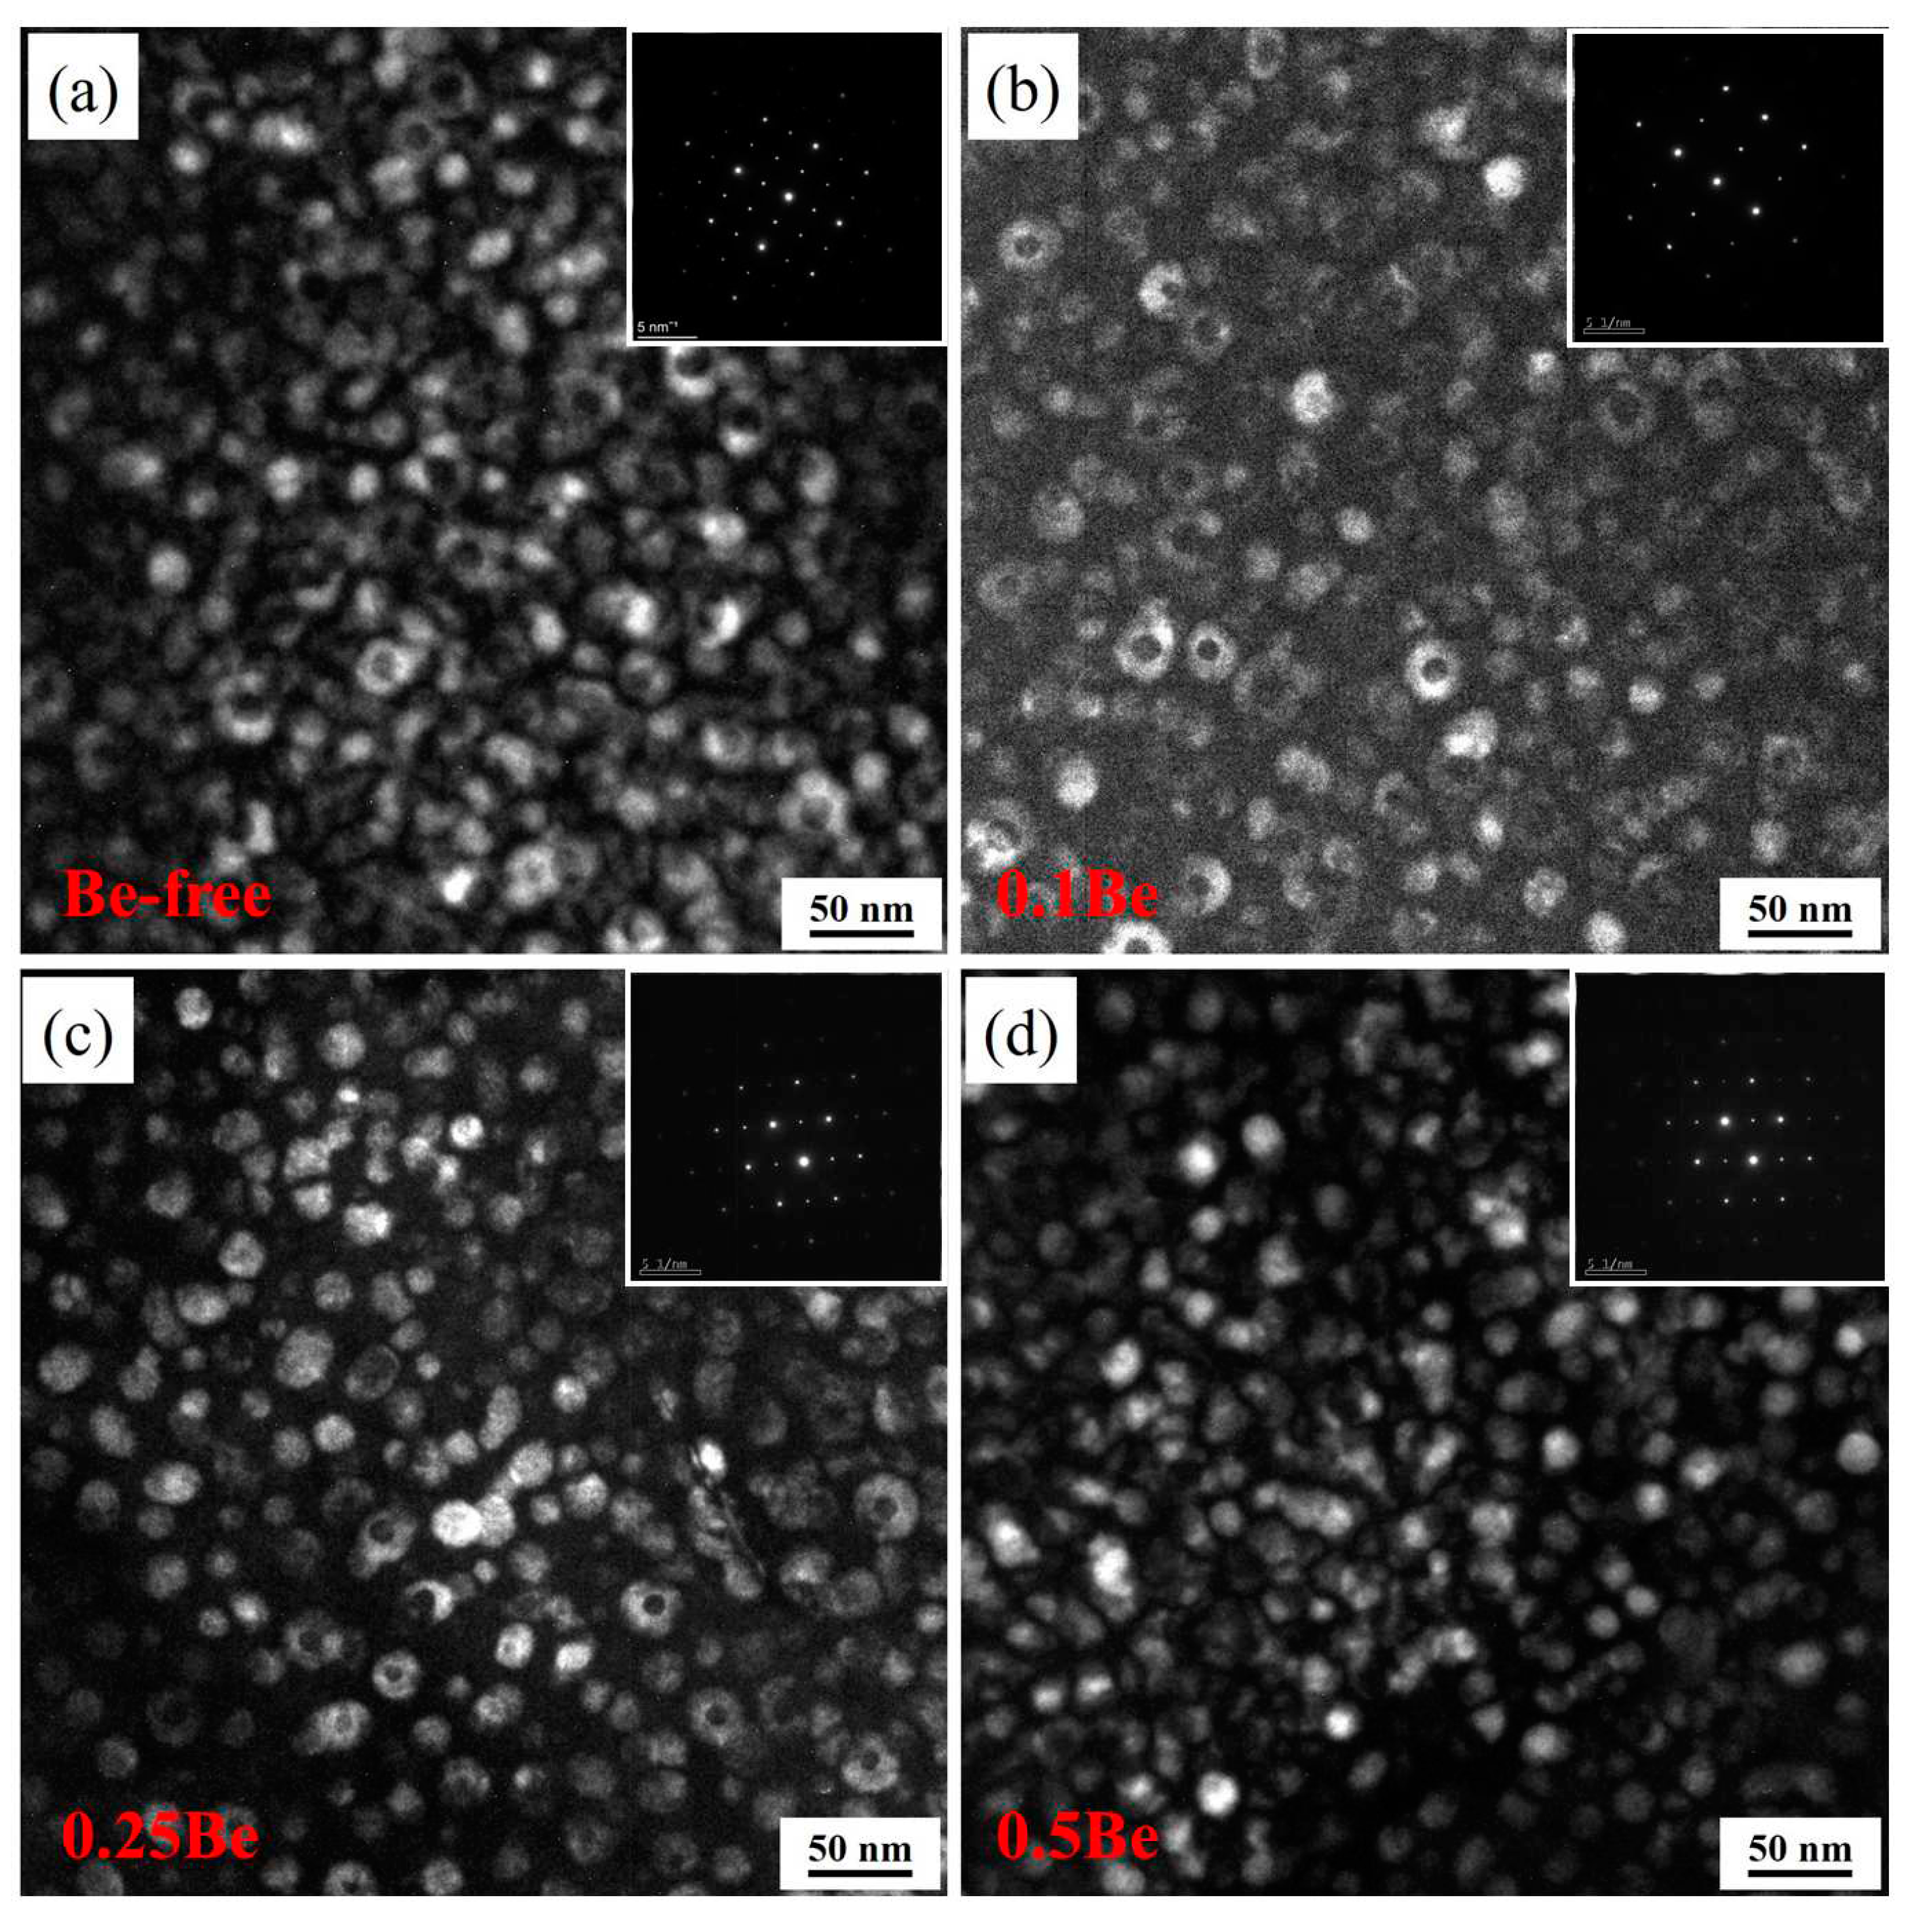
Figure 9 shows the TEM dark-field images of alloys 1 to 4 after aging at 145 ℃ for 48 h. There is small amount of uniformly distributed δ′ phase and some discretely distributed Al
3(Sc, Zr)/Al
3Li core-shell composite particles in the grains, but there are some differences in morphology and number density of these phases of each alloy.
The δ′ phase in alloy 1 presents as incomplete regular particles, while with the addition of Be, the δ′ phase in alloys 2-4 shows a more uniform and regular spherical shape. A certain number of dispersive distributed Al3(Sc, Zr)/Al3Li core-shell structure composite particles can be seen in alloys 1 to 3, but only very few Al3(Sc, Zr)/Al3Li particles are seen in alloy 4, which own the highest Be content, interspersing with many δ′ phases. It can be assumed that the addition of Be would change the morphology of the δ′ phase in the Al-Mg-Li alloy, while the formation of Al3(Sc, Zr)/Al3Li core-shell structure composite particles is inhibited when the Be content increases to a certain degree, which results in a decrease in the strength of the alloy.
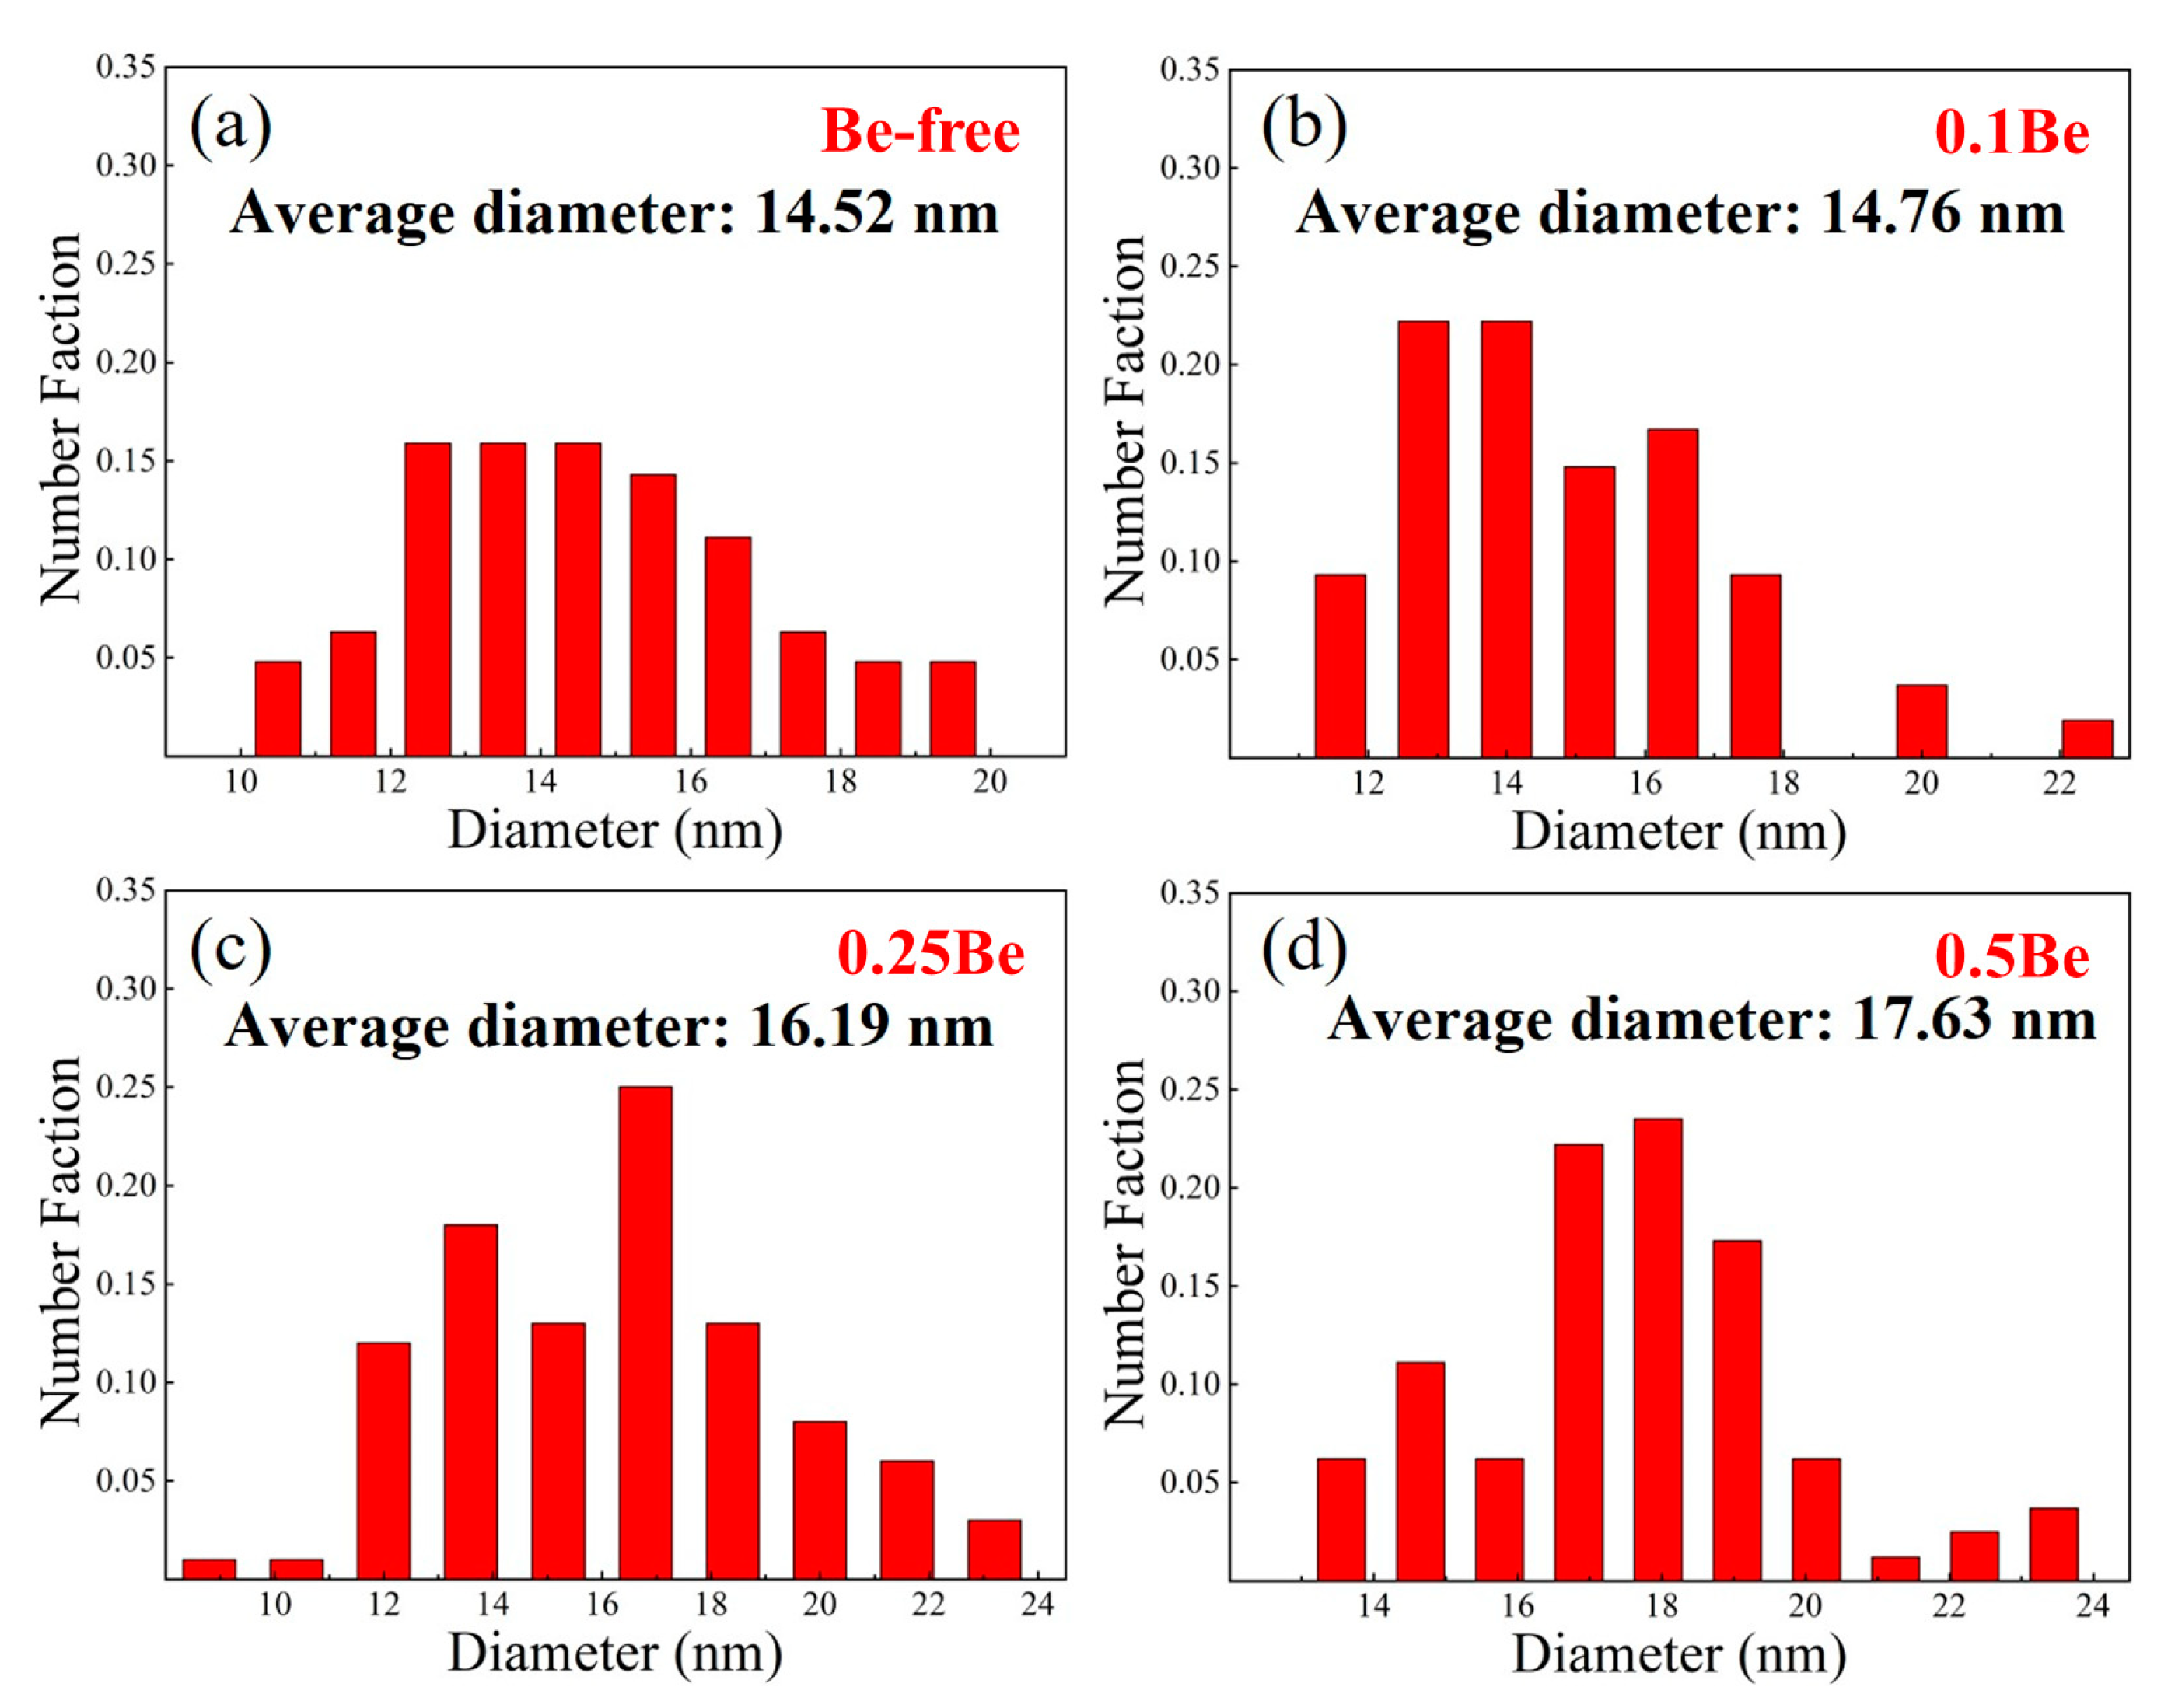
The TEM images of alloys 1-4 were then further analyzed and the size distribution of the δ′ phase in each alloy was calculated, and the results are shown in
Figure 10. The statistic results show that the average diameters of δ′ phase in alloys 1 to 4 are 14.52 nm, 14.76 nm, 16.19 nm and 17.63 nm, respectively. The average size of δ′ phase in alloy 1 and alloy 2 did not differ much, while the average size of δ′ phase increased with the increase of Be addition. The addition of excessive Be in Al-Mg-Li alloy would make the coarsening of δ′ phase and make the strength and plasticity decrease.
It is found that dislocation pile-up existed at the grain boundaries of each alloy after tensile test, and the TEM dark field images of alloy 1 to alloy 4 are shown in
Figure 11. It is obvious that alloy 4 exhibits the most serious dislocation pile-up, followed by alloy 1, alloy 2 and alloy 3, which may be due to the small volume fraction of Al
3(Sc, Zr)/Al
3Li composite particles in alloy 4. Moreover, the δ′ phase has low strength contribution and is easily cut through by dislocations, indicting its weak ability to hinder dislocation movement. The dislocations are severely accumulated at the grain boundaries. The dislocation pile-up will cause a significant increase in the stress of the dislocation source, resulting in stress concentration. The dislocation pile-up to a certain level will produce cracks along the grain boundaries, reducing the plasticity of the alloy.
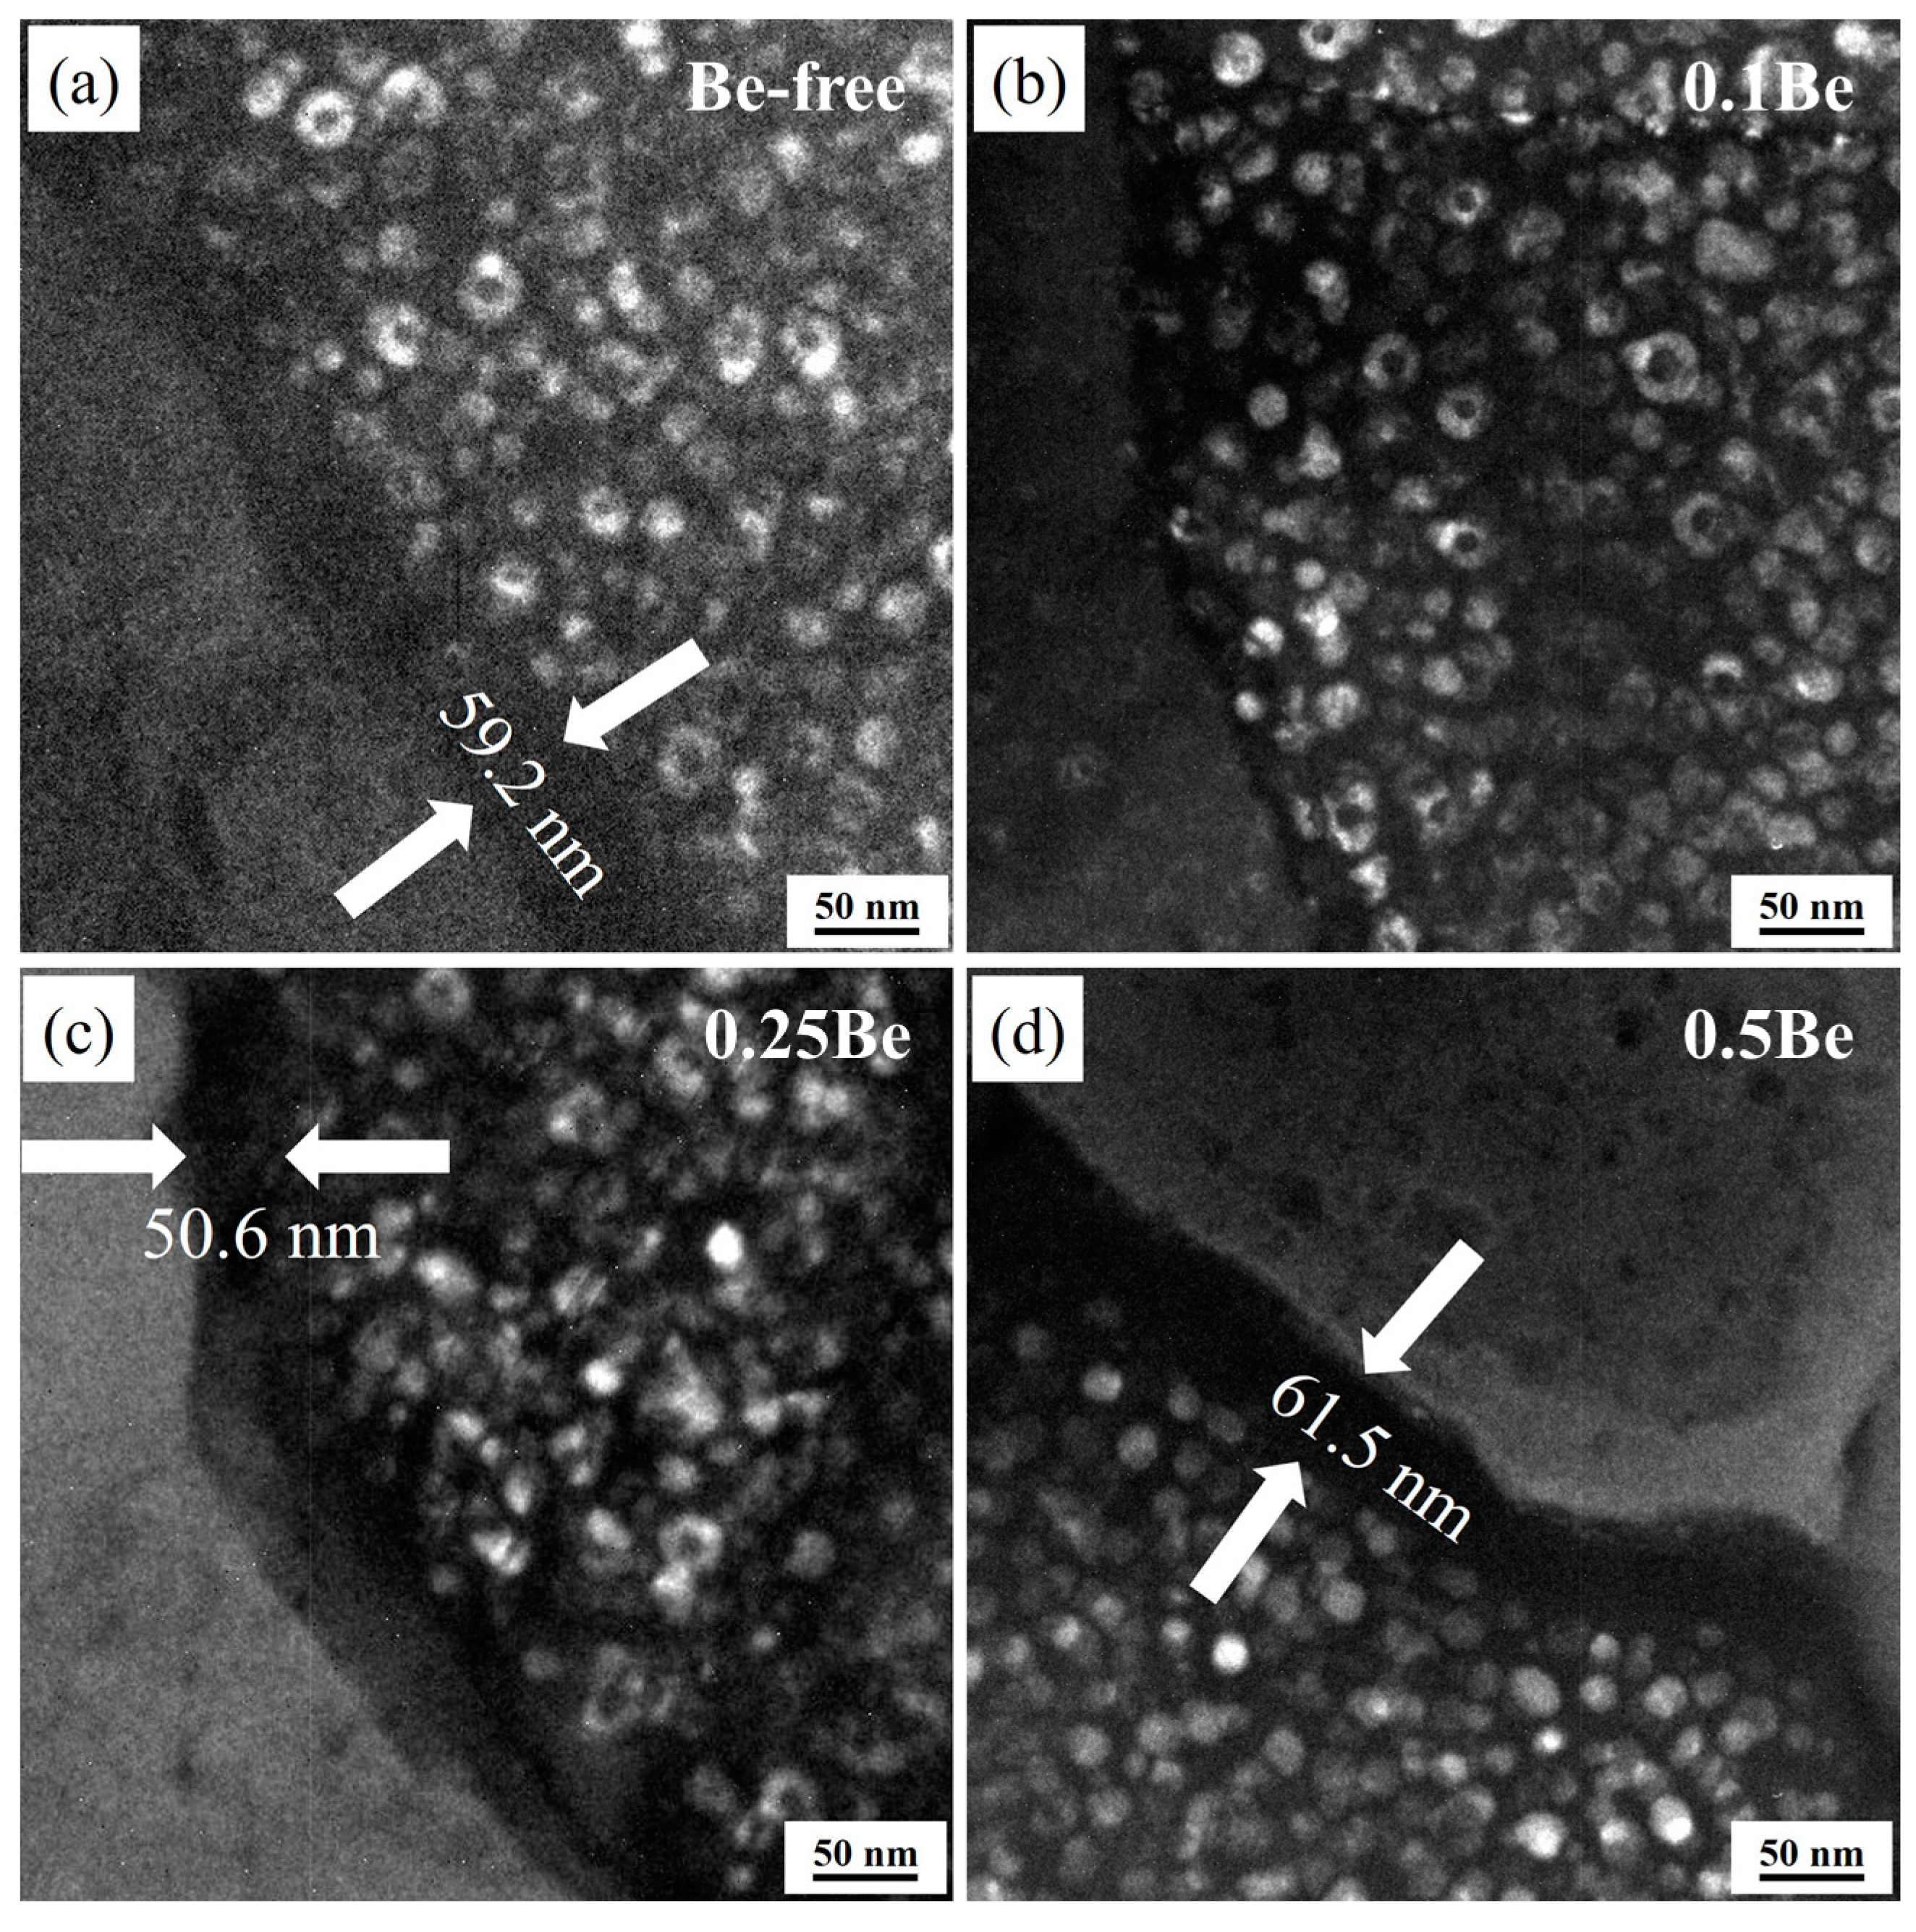
Figure 12 shows the TEM dark field images of the grain boundary of the alloys with different Be content after aging treatment at 145 ℃/48 h. The morphology of the precipitation-free zones (PFZs) of the alloys differed notably, with Alloy 2 having no obvious PFZs, while Alloy 1, Alloy 3, and Alloy 4 exhibited wide PFZs, with their PFZ
widths of 59.2 nm, 50.6 nm, and 61.5 nm, respectively. This indicates that the addition of 0.1 wt.% Be can significantly reduce the PFZ width of the alloy and enhance the intergranular corrosion resistance of the alloy, whereas the PFZ of the alloy becomes wider as the Be content continues to increase, resulting in a weakening of the corrosion resistance of the alloy.
4. Discussion
4.1. The effect of Be Content on the Mechanical Properties
Be is similar to Li in atomic number and atomic weight, and its addition to Al-Mg-Li alloys not only reduces the density, but also has a positive effect on the comprehensive properties, such as mechanical properties and corrosion properties. The addition of trace amounts of Be to Al-Mg-Li alloys significantly decreases the oxidative burnout of Mg and reduces inclusions during the casting process, due to the diffusion of Be in the alloy melt to form an oxide film [
13].
The yield strength of polycrystalline materials can be seen as a combination of different strengthening effects, which can be calculated by Eq. (1) [
29,
30],
where
is the strength factor determined by grain boundary strengthening, and ∆τ is the critical shear stress of the grain. ∆τ can be calculated as [
29,
30],
where
represents the internal stress of pure aluminum, and
represents the contribution of solid solution strengthening. In general, the solid solution strengthening contribution is weak for heat-treated aluminum alloys.
represents the contribution of dislocations strengthening, and
represents the contribution of precipitation strengthening. The increase in temperature of hot-rolling leads to a significant increase in the number density of Al
3(Sc, Zr)/ Al
3Li core-shell structure composite phases. These composite particles cause the dislocation cutting mechanism from a shearing mechanism to an Orowan by-passing mechanism. The value of
and
are elevated, and the three combined factors increase ∆τ, therefore enabling strength enhancement. There are remarkable differences in grain boundary strengthening effects of various Be content alloys. The change of precipitates makes the dislocation cutting mechanism switch and the precipitation strengthening effect decrease, so the grain boundary strengthening effect and the shift in precipitates play a significant role in the strength increase.
The experimental results show that the addition of 0.1-0.25 wt.% Be can notably refine the grains of Al-Mg-Li alloy and enhance the strength of the alloy, but the addition of 0.50 wt.% Be causes a significant increase in the grain size of Al-Mg-Li alloy and generates excessive Be oxides in the alloy. According to the experimental results in
Figure 9 and 10, the 0.50 wt.% addition of Be leads to the coarsening of the δ′ phase and inhibits the generation of Al
3(Sc, Zr)/ δ′ composite particles, which reduces the properties of the alloy. The addition of Be can also improve the thermal cracking resistance of the alloy, cause beryllium can be dissolved in some phases of the alloy, thus improving the thermal stability. The addition of 0.1 wt.% Be obviously promotes the recrystallization of Al-Mg-Li alloys, and then the recrystallization of the alloys decreases with the increase of Be content, and the further addition of Be inhibits the recrystallization of Al-Mg-Li alloys.
4.2. The effect of Be Content on the Corrosion Performance
As mentioned above, the Be addition affects the evolution of the microstructure and the related properties of alloys in the subsequent solid solution and aging process. It is more relevant that the corrosion behavior of alloys is also influenced by precipitates inside the grains and at grain boundaries [
31]. Previous studies show that the corrosion properties of aluminum alloys are dominated by grain boundary precipitates, which depends on the grain boundary structure [
31,
32]. According to the literature [
33], the increase of low-angle grain boundaries can improve the corrosion resistance of aluminum alloys by inhibiting the precipitation of grain boundary precipitates (GBPs). Besides, the width of the PFZ also has a more significant effect on the corrosion performance of the alloy. The wider PFZ, the worse corrosion resistance. This is mainly due to its electrochemical nature, the potential difference between the intermetallic phase and the aluminum matrix caused by chemical inhomogeneity.
According to the experimental results in
Figure 3 and
Figure 4, it can be seen that the addition of 0.1 wt.% Be can significantly improve the corrosion resistance of Al-Mg-Li alloy. It exhibits more low-angle grain boundaries and simultaneously reduces the width of PFZ of the grain boundaries. Intergranular corrosion occurs along grain boundaries, the more low-angle grain boundaries with low energy, the better the resistance to intergranular corrosion performance. The alloy with 0.1 wt.% Be addition exhibits more uniform grains and no obvious elongated grains, leading to better resistance to exfoliation corrosion. In contrast, Be-free alloy 1 and alloy 4 with 0.50 wt.% Be addition show obvious elongated grains, thus owned worse resistance to exfoliation corrosion. Moreover, the addition of 0.50 wt.% Be further deteriorates the intergranular corrosion resistance of Al-Mg-Li alloy.
5. Conclusions
The effects of Be addition on tensile properties, corrosion behavior, and microstructure of Al-Mg-Li alloys were systematically investigated. The main research conclusions are as follows:
(1) The addition of 0.1-0.25 wt.% Be can significantly refine the as-cast grain structure of the Al-Mg-Li alloy and alleviate the dendritic segregation in the as-cast alloy. However, with the increase of Be content to 0.50 wt.%, the as-cast grain size of the alloy increases and the grain morphology changes from equiaxed grains to dendritic grains, while Be oxides of two forms are generated in the as-cast alloy, which reduces the final properties of alloy.
(2) The experimental Al-Mg-Li alloy with trace addition of Be (0.1wt.%) present the optimal tensile property compared to other alloys. The addition of trace amount of Be in the casting process leads to a grain refinement, while avoiding the generation of excessive Be oxides. Moreover, it promotes the recrystallization behavior of the alloy during the solid solution process, while the optimal effect of the precipitation strengthening of the dispersive δ′ precipitates and Al3(Sc, Zr)/ δ′ composite particles is obtained during the aging precipitation process.
(3) The trace addition of 0.1 wt.% Be notably increased the corrosion resistance of Al-Mg-Li alloy, but the excessive addition of Be will deteriorates the anti-corrosion performance. The addition of 0.1 wt.% Be can significantly reduce the PFZ width of the alloy and enhance the intergranular corrosion resistance of the alloy, whereas the PFZ of the alloy becomes wider as the Be content continues to increase, resulting in a weakening of the corrosion resistance of the alloy.
Data Availability Statement
The raw/processed data required to reproduce these findings cannot be shared at this time as the data also forms part of an ongoing study.
Acknowledgments
This work was supported by Pre-research Fund (No. 6142912180105).
References
- A. Steuwer, M. Dumont, J. Altenkirch, S. Birosca, A. Deschamps, P.B. Prangnell, P.J. Withers, A combined approach to microstructure mapping of an Al-Li AA2199 friction stir weld, Acta Mater. 59 (2011) 3002-3011. [CrossRef]
- T. Dursun, C. Soutis, Recent developments in advanced aircraft aluminum alloys, Mater. Des. 56 (2014) 862-871.
- R.K. Gupta, N. Nayan, G. Nagasireesha, S.C. Sharma, Development and characterization of Al-Li alloys, Mater. Sci. Eng. A 420 (2006) 228-234.
- R.J. Rioja, J. Liu, The evolution of Al-Li base products for aerospace and space applications, Metall. Mater. Trans. A 43 (2012) 3325-3337. [CrossRef]
- L. B. Khokhlatova, V. I. Lukin, N. I. Kolobnev. Advanced aluminum-lithium 1420 alloy for welded structures for aerospace technology. Weld Int. 24 (2010):783-786.
- I. N. Fridlyander, L. B. Khokhlatova, N. I. Kolobnev, K. Rendiks. Thermally stable aluminum-lithium alloy 1424 for application in welded fuselage. Met Sci Heat Treat 44 (2002) 3-8. [CrossRef]
- B. D. Annin, V. M. Fomin, V. V. Antipov, E. N. Ioda, E. V. Karpov. Investigation of the technology of laser welding of aluminum alloy 1424. Dokl Phys 60 (2015) 533-8. [CrossRef]
- S. Zuiko, S. Mironov, R. Kaibyshev, Microstructural evolution and strengthening mechanisms operating during cryogenic rolling of solutionized Al-Cu-Mg alloy, Mater. Sci. Eng. A 745 (2019) 82-89. [CrossRef]
- K. G. Wikle, Improving aluminum castings with beryllium, AFS Transactions, 78 (1978) 513-517.
- Liu, J. Li, T. Liu, Y. Ma, H. Iwaoka, S. Hirosawa, K. Zhang, R. Zhang, Microstructure evolution and mechanical properties of Al-Cu-Li alloys with different rolling schedules and subsequent artificial ageing heat treatment, Mater. Charact. 170 (2020) 110676. [CrossRef]
- F. Liu, Z. Liu, P. Jia, S. Bai, P. Yan, Y. Hu, Dynamic dissolution and texture evolution of an Al-Cu-Mg-Ag alloy during hot rolling, J. Alloy Compd. 827 (2020) 154254.
- Q. Zhao, Z. Liu, Y. Hu, S. Li, S. Bai, Evolution of goss texture in an Al-Cu-Mg alloy during cold rolling, Arach. Civ. Mech. Eng. 20 (2020) 1-15.
- Jürgen Hirsch, Textures in industrial processes and products, Mater. Sci. Forum 702-703 (2011) 18-25. [CrossRef]
- J. Hirsch, Texture and anisotropy IN industrial applications OF aluminum alloys, Arch. Metall. Mater. 50 (2005) 21-34.
- S.Ya. Betsofen, V.V. Antipov, M.I. Knyazev, Al-Cu-Li and Al-Mg-Li alloys: phase composition, texture, and anisotropy of mechanical properties (review), Russ. Metall. (4) (2016) 326–341. [CrossRef]
- A. Deschamps, C. Sigli, T. Mourey, F. de Geuser, W. Lefebvre, B. Davo, Experimental and modelling assessment of precipitation kinetics in an Al-Li-Mg alloy, Acta Mater. 60 (2012) 1917-1928. [CrossRef]
- Nembach, Order strengthening: recent developments, with special reference to aluminum-lithium-alloys, Prog. Mater. Sci. 45 (2000) 275-338.
- X.L. Zhang, L. Zhang, G.H. Wu, J.W. Sun, M. Rong, C.C Hsieh, Y.X. Yu, Influence of Sc content on the microstructure and mechanical properties of cast Al-2Li-2Cu-0. 5Mg-0.2Zr alloy, Mater. Charact. 142 (2018) 223-236. [CrossRef]
- Y. Wang, Z. Zhang, R.Z. Wu, J.F. Sun, Y.L. Jiao, L.G. Hou, X.L. Li, J.H. Zhang, M.L. Zhang, Ambient-temperature mechanical properties of isochronally aged 1420-Sc-Zr aluminum, Mater. Sci. Eng. A 745 (2019) 411-419. [CrossRef]
- K.E. Knipling, D.C. Dunand, D.N. Seidman, Precipitation evolution in Al-Zr and Al-Zr-Ti alloys during isothermal aging at 375–425°C, Acta Mater. 56 (2008) 114-127.
- A. Medjahed, H. Moula, A. Zegaoui, M. Derradji, A. Henniche, R.Z. Wu, L.G. Hou, J.H. Zhang, M.L. Zhang, Influence of the rolling direction on the microstructure, mechanical, anisotropy and gamma rays shielding properties of an Al-Cu-Li-Mg-X alloy, Mater. Sci. Eng. A 732 (2018) 129-137. [CrossRef]
- Quanbo Kuang, Richu Wang, Chaoqun Peng, Zhiyong Cai, Comparison of microstructure and mechanical properties of Al-Mg-Li-Sc-Zr alloys processed by ingot metallurgy and rapid solidification, Journal of Alloys and Compounds, 883 (2021),160937. [CrossRef]
- Y.C. Tzeng, C.Y. Chung, H.C. Chien, Effects of trace amounts of Zr and Sc on the recrystallization behavior and mechanical properties of Al-4.5Zn-1.6Mg alloys, Mater. Lett. 228 (2018) 270-272. [CrossRef]
- A.T. Chen, P. Yu, L. Zhang, G.H. Wu, Y.L. Li, Microstructural evolution and mechanical properties of cast Al-3Li-1.5Cu-0.2Zr alloy during heat treatment, Mater. Charact. 114 (2016) 234–242. [CrossRef]
- X.L. Zhang, L. Zhang, G.H. Wu, W.C. Liu, C.C. Shi, J.S. Tao, J.W. Sun, Microstructural evolution and mechanical properties of cast Al-2Li-2Cu0.5Mg-0.2Zr alloy during heat treatment, Mater. Charact. 152 (2017) 312–317.
- M. Furukawa, Z. Horita, M. Nemoto, R.Z. Valiev, T.G. Langdon, Microhardness measurements and the Hall-Petch relationship in an Al-Mg alloy with sub-micrometer grain size, Acta Materialia, 44 (1996) 4619-4629.
- Minoru Furukawa, Yoshinori Iwahashi, Zenji Horita, Minoru Nemoto, Nikolai K. Tsenev, Ruslan Z. Valiev, Terence G. Langdon, Structural evolution and the Hall-Petch relationship in an Al-Mg-Li-Zr alloy with ultra-fine grain size, Acta Materialia, 45 (1997) 4751-4757.
- T. Shanmugasundaram, M. Heilmaier, B.S. Murty, V.S. Sarma, On the Hall-Petch relationship in a nanostructured Al-Cu alloy, Mater. Sci. Eng.: A 527 (2010) 7821-7825.
- M.J. Starink, S.C. Wang, A model for the yield strength of overaged Al-Zn-Mg-Cu alloys, Acta Mater. 51 (17) (2003) 5131-5150.
- M.J. Starink, A. Deschamps, S.C. Wang, The strength of friction stir welded and friction stir processed aluminum alloys, Scripta Mater. 58 (5) (2008) 377-382.
- Ruifeng Zhang, Yao Qiu, Yuanshen Qi, Nick Birbilis,A closer inspection of a grain boundary immune to intergranular corrosion in a sensitised Al-Mg alloy, Corrosion Science, 133 (2018) 1-5. [CrossRef]
- A. Lervik, S. Wenner, O. Lunder, C.D. Marioara, R. Holmestad, Grain boundary structures and their correlation with intergranular corrosion in an extruded Al-Mg-Si-Cu alloy, Materials Characterization,170 (2020) 110695. [CrossRef]
- W. Xu, Y.C. Xin, B. Zhang, X.Y. Li, Stress corrosion cracking resistant nanostructured Al-Mg alloy with low angle grain boundaries, Acta Materialia, 225 (2022) 117607. [CrossRef]
Figure 1.
Schematic diagram of experiment process route and the dimensions of tensile specimen.
Figure 1.
Schematic diagram of experiment process route and the dimensions of tensile specimen.
Figure 2.
Tensile properties of the alloys with different Be addition after aging treatment: (a)130 ℃/48 h; (b) 145 ℃/48 h.
Figure 2.
Tensile properties of the alloys with different Be addition after aging treatment: (a)130 ℃/48 h; (b) 145 ℃/48 h.
Figure 3.
OM images of the alloys with different Be addition after IGC test: (a) alloy 1; (b) alloy 2; (c) alloy 3; (d) alloy 4.
Figure 3.
OM images of the alloys with different Be addition after IGC test: (a) alloy 1; (b) alloy 2; (c) alloy 3; (d) alloy 4.
Figure 4.
Digital images of the alloys with different Be addition before and after Exfoliation corrosion test: (a, e) alloy 1; (b, f) alloy 2; (e, g); alloy 3; (d, h) alloy 4.
Figure 4.
Digital images of the alloys with different Be addition before and after Exfoliation corrosion test: (a, e) alloy 1; (b, f) alloy 2; (e, g); alloy 3; (d, h) alloy 4.
Figure 5.
OM and SEM images of the as-cast alloys: (a, e) alloy 1; (b, f) alloy 2; (c, g) alloy 3; (d, h) alloy 4.
Figure 5.
OM and SEM images of the as-cast alloys: (a, e) alloy 1; (b, f) alloy 2; (c, g) alloy 3; (d, h) alloy 4.
Figure 6.
AES image and corresponding scan mapping analysis of cast-alloy 4.
Figure 6.
AES image and corresponding scan mapping analysis of cast-alloy 4.
Figure 7.
High magnification AES image and corresponding point scan analysis of the as-cast alloy 4.
Figure 7.
High magnification AES image and corresponding point scan analysis of the as-cast alloy 4.
Figure 8.
The recrystallization fraction of hot-rolled sheets after solid solution treatment: (a, b) alloy 1; (c, d) alloy 2; (e, f) alloy 3; (g, h) alloy 4.
Figure 8.
The recrystallization fraction of hot-rolled sheets after solid solution treatment: (a, b) alloy 1; (c, d) alloy 2; (e, f) alloy 3; (g, h) alloy 4.
Figure 9.
TEM dark field images of alloy in T6 aging condition: (a-d) alloy 1-4.
Figure 9.
TEM dark field images of alloy in T6 aging condition: (a-d) alloy 1-4.
Figure 10.
Size distribution of precipitate particles in alloy: (a-d) alloy 1-4.
Figure 10.
Size distribution of precipitate particles in alloy: (a-d) alloy 1-4.
Figure 11.
TEM images of dislocation pile-up in alloy after tensile test: (a-d) alloy 1-4.
Figure 11.
TEM images of dislocation pile-up in alloy after tensile test: (a-d) alloy 1-4.
Figure 12.
TEM images of grain boundaries of alloy in T6 aging condition: (a-d) alloy 1-4.
Figure 12.
TEM images of grain boundaries of alloy in T6 aging condition: (a-d) alloy 1-4.
Table 1.
Chemical composition of Al-Mg-Li alloys studied in this work (wt.%).
Table 1.
Chemical composition of Al-Mg-Li alloys studied in this work (wt.%).
| Alloy |
Mg |
Li |
Be |
Sc |
Zr |
Al |
| 1 |
6.00 |
1.90 |
0 |
0.10 |
0.10 |
Bal |
| 2 |
6.00 |
1.90 |
0.10 |
0.10 |
0.10 |
Bal |
| 3 |
6.00 |
1.90 |
0.25 |
0.10 |
0.10 |
Bal |
| 4 |
6.00 |
1.90 |
0.50 |
0.10 |
0.10 |
Bal |
|
Disclaimer/Publisher’s Note: The statements, opinions and data contained in all publications are solely those of the individual author(s) and contributor(s) and not of MDPI and/or the editor(s). MDPI and/or the editor(s) disclaim responsibility for any injury to people or property resulting from any ideas, methods, instructions or products referred to in the content. |
© 2023 by the authors. Licensee MDPI, Basel, Switzerland. This article is an open access article distributed under the terms and conditions of the Creative Commons Attribution (CC BY) license (http://creativecommons.org/licenses/by/4.0/).
