Preprint
Article

Analysis of Gene Expression Networks in Primary Central Nervous System Tumors for Drug Repurposing Prospects

Altmetrics

Downloads

232

Views

113

Comments

0

Submitted:

29 August 2023

Posted:

30 August 2023

You are already at the latest version

Alerts
Abstract
Primary central nervous system and brain tumors are one of the global burdens that are continuously increasing in cases and requiring more treatment options. Surgery has been the leading treatment option for tumors, however, the localization of the tumor and its infiltrating nature make this option challenging. DNA microarray expression profiles of different CNS tumors provide insight into potential biomarkers for identifying different tumor types and subtypes. Here, we utilized the differentially expressed genes common in four expression profiles, GSE66354, GSE68848, GSE74195, and GSE43290 to reconstruct the gene co-expression network. In this study, we were able to identify preserved cluster genes, hub genes, co-regulating transcription factors, miRNA families, and candidate repurposed drugs. Fourteen identified hub genes, which were, CACNA1A, DNM1, GABRA1, GRIA2, MAPT, SLC17A7, SNAP25, SNAP91, STXBP1, SYT1, COL1A1, COL6A2, FBN2, and FN1 appeared to play a role in tumor progression and may serve as drug targets. We also reported the DEGs in each tumor type, which were ATRT, EPN, PA, MED, PNET, MEN, ACM, ODG, and GBM. Five identified miRNA families, which were, let-7 family, mir-124 family, mir-1 family, mir-103 family, and mir-27 family described in the literature to have tumor-suppressing characteristics. Drug-gene and drug-transcription factor network revealed 32 candidate repurposed drugs and 13 were validated through connectivity map analysis. Here, two main repurposed drugs fit the regulatory requirement for gene interaction, these were, quercetin and vorinostat. Future validation in experimental studies may utilize the future use of the candidate repurposed drugs. Our study provides insights into drug repurposing prospects and understanding tumor expressions.
Keywords: 
Subject: Biology and Life Sciences  -   Other

1. Introduction

Primary central nervous system (CNS) and brain tumors are abnormal masses and tissue growth that have no biological function and disturb the neural processes. They are well known for their high mortality rate and increasing global cases each year [1,2,3]. They cause serious health problems such as severe headaches, neurocognitive degeneration, loss of vision and hearing, seizures, and mental disorders, in some cases they trigger autoimmunity, and cancer [4,5,6,7]. Tumors can either be benign or malignant, benign tumors are less likely to spread and can be cured by surgery (WHO Grade I) while malignant tumors grow rapidly and cause serious health problems or worst, death (WHO Grade IV) [8]. Recently, the fifth edition of the World Health Organization Classification of Tumors of the Central Nervous System (WHO CNS5) introduced twenty-two new tumor types and subtypes [9]. CNS tumors may arise from different factors which may be sex, age, genetics, ethnicity/race, diet, socioeconomic status, environment (radiation, oncogenic pathogens, stress), and smoking [10,11,12]. Malignant CNS tumors are fatal cancers that remain a major global health burden, it significantly increased up to 94.35% from 1999 to 2019 [3,13]. Currently, In the U.S., CNS cancer represents 1.3% of all new cancer cases with a 33.8% survival rate and ranked 16th common type of cancer according to the National Cancer Institute’s (NCI) Surveillance, Epidemiology, and End Results (SEER) Program August 2023. Cancer has been one of the global public health burdens of the century, the increasing cases of CNS tumors require further knowledge in prognostic, imaging, therapeutics, surgery, alternative treatment, and drug discovery [13,14,15,16]. Understanding their molecular behavior based on gene expression prompts an opportunity for other treatment options.
Pediatric brain tumors are the most common brain cancer-related deaths [17]. It ranges from rare to common to most malignant. There are numerous CNS tumors, and most of them are named after their tissue localization. Glioblastoma multiforme (WHO Grade IV) is the most common brain cancer, it forms from three different cell types, parenchyma neurons, astrocytes, and oligodendrocytes [18]. Astrocytomas are tumors derived from astrocytes, according to the WHO grading system they can be grade II or III. Anaplastic astrocytomas (WHO Grade III) are diffusely infiltrating forming anaplasia following aggressive manifestation to higher cancer stage [19]. On the other hand, Pilocytic astrocytomas (WHO Grade I) are slow-growing tumors that often can be treated with surgery, chemotherapy, and drugs [20,21]. Oligodendrogliomas are tumors that originated from oligodendrocytes, they are graded as WHO II, III, or IV, and their molecular hallmark is the codeletion of 1p and 19q chromosome arms [22,23,24]. Ependymal cells derived from tumors are called ependymomas (WHO Grade II or III), they are found in the posterior fossa or supratentorial. Subgroups arising from posterior fossa are identified by Groups A and B. Group A tumors require more treatment with a low survival rate while Group B can survive through surgery [25,26,27]. The following mentioned tumors fall under the umbrella of gliomas. There are more specific and rare types of CNS tumors such as Meningioma, Medulloblastoma, and Atypical teratoid/rhabdoid tumors. Medulloblastoma is the most common malignant tumor among children, formed at the lower back brain called the cerebellum. It has four distinct groups the Wingless Type (WNT), Sonic Hedgehog (SHH), Group 3, and Group 4 [28,29,30,31]. Meningiomas, on the other hand, are tumors originating from the meninges, they can be resolved by surgery as they’re benign, however, tumor relapse is frequently observed [32]. Atypical teratoid/rhabdoid tumors are aggressive tumors that have distinguished loss function of SMARCB1 protein [33,34]. Central nervous system primitive neuroectodermal tumors grow in the extra cerebellar site, they can also derive from the pineal gland forming pineoblastoma, this tumor has been correlated to the WNT/β-catenin pathway disrupting normal CNS development [35]. A comparative study of human and mouse gene expression profile revealed that experimental PNETs corresponds to AT/TR [36]. Numerous CNS tumors have not been classified or are still unknown due to the continuous increase in new cases of tumors that are entirely unfamiliar to cancer physicians and biologists. Access to early diagnosis and screening and a poor understanding of cancer biology may contribute to this factor. The molecular characteristics of the tumor may serve as a key to further classifying tumors, particularly tumors with the same morphological characteristics but behave differently.
It is important to identify genetic markers for specific tumors as they help to identify, classify, and grade tumors [23,24,37]. These genetic markers may serve as a potential drug target, biomarker, distinguish gene regulator, and biological insight into the function and mechanism of tumorigenesis. There are numerous options for treating tumors. Commonly, surgery is the primary option to remove tumors, however, the high-risk failure of cranioplasty implant surgery after resection of the malignant infiltrating tumor in the skull may not be suitable, especially for pediatric patients [38]. Radiotherapy may be suitable for people with financial stability, however, an increased risk of secondary tumors in adults after radiotherapy was reported in the literature [39]. Clinical benefits of immunotherapy against brain metastases are promising, however, their response to primary tumors such as glioblastoma is poor [40]. Chemotherapy aided by nanomicelles as a tumor-targeting drug delivery complex proposed an effective strategy for treating glioma [41]. There are several options available for treating tumors such as hormone therapy, bone marrow transplant, oncolytic virus therapy, targeted therapy, and combinatory treatment and/or therapy [41,42,43,44,45,46,47]. Medical interventions can often extend the lifespan of a tumor patient, but it is not entirely cured. The need for more tumor treatment options is a leading concern in mitigating CNS tumors as a global burden.
Recently, computational approaches in biology provided avenues for studying gene expression profiles, advancement in the screening, detection, potential biomarkers, new drug candidates, and candidate repurposed drugs [8,37,48,49]. The drug repurposing approach employed known drugs for new therapeutic purposes. In cancer, the search for interesting new drugs is rapidly increasing due to the rise of new types and subtypes. Existing anticancer drugs have several adverse side effects, drug repurposing of a non-cancer drug may pave the way for better tumor treatment. Therefore, drug repurposing is a novel approach to reduce the time in new drug discovery utilizing approved drugs for new use [50]. Translational bioinformatics and computational oncology proposed that mutation-specific therapy may serve as a key pathway in treating tumors [50]. In gliomas, a molecular subtype of mouse glioblastomas predicted candidate drugs through gene-drug interaction using a computational drug repurposing approach [51]. A deep learning approach to expression profiles of tumors and cheminformatics may reveal opportunities in drug repurposing [52,53]. Understanding the expression profile of CNS tumors may contribute insights into tumor biology and new drug discovery [54,55]. In the case of CNS tumors, the use of drug repurposing provides a rapid, cost-efficient, and lower risk of drug side effects.
In this study, differentially expressed genes from expression profiles of different CNS tumors (from DNA microarray) provides a hallmark to identify gene target [37,55]. The current study searched for the shared differentially expressed genes from the four expression arrays of various CNS tumors and reconstructed co-expression networks. Here, we utilized computational web tools and databases, such as GEO2R, Network Analyst, STRING, DAVID, and DGIdb for co-expression network analysis. Co-expression networks revealed the correlation of hub genes, transcription factors, and miRNAs in finding candidate repurposed drugs that may treat CNS tumors [56,57]. Our study may serve as a significant strategy in the future of drug development against CNS tumors.

2. Materials and Methods

2.1. Acquiring and Preprocessing Microarray Datasets

2.1.1. Microarray Expression Profiles Acquisition

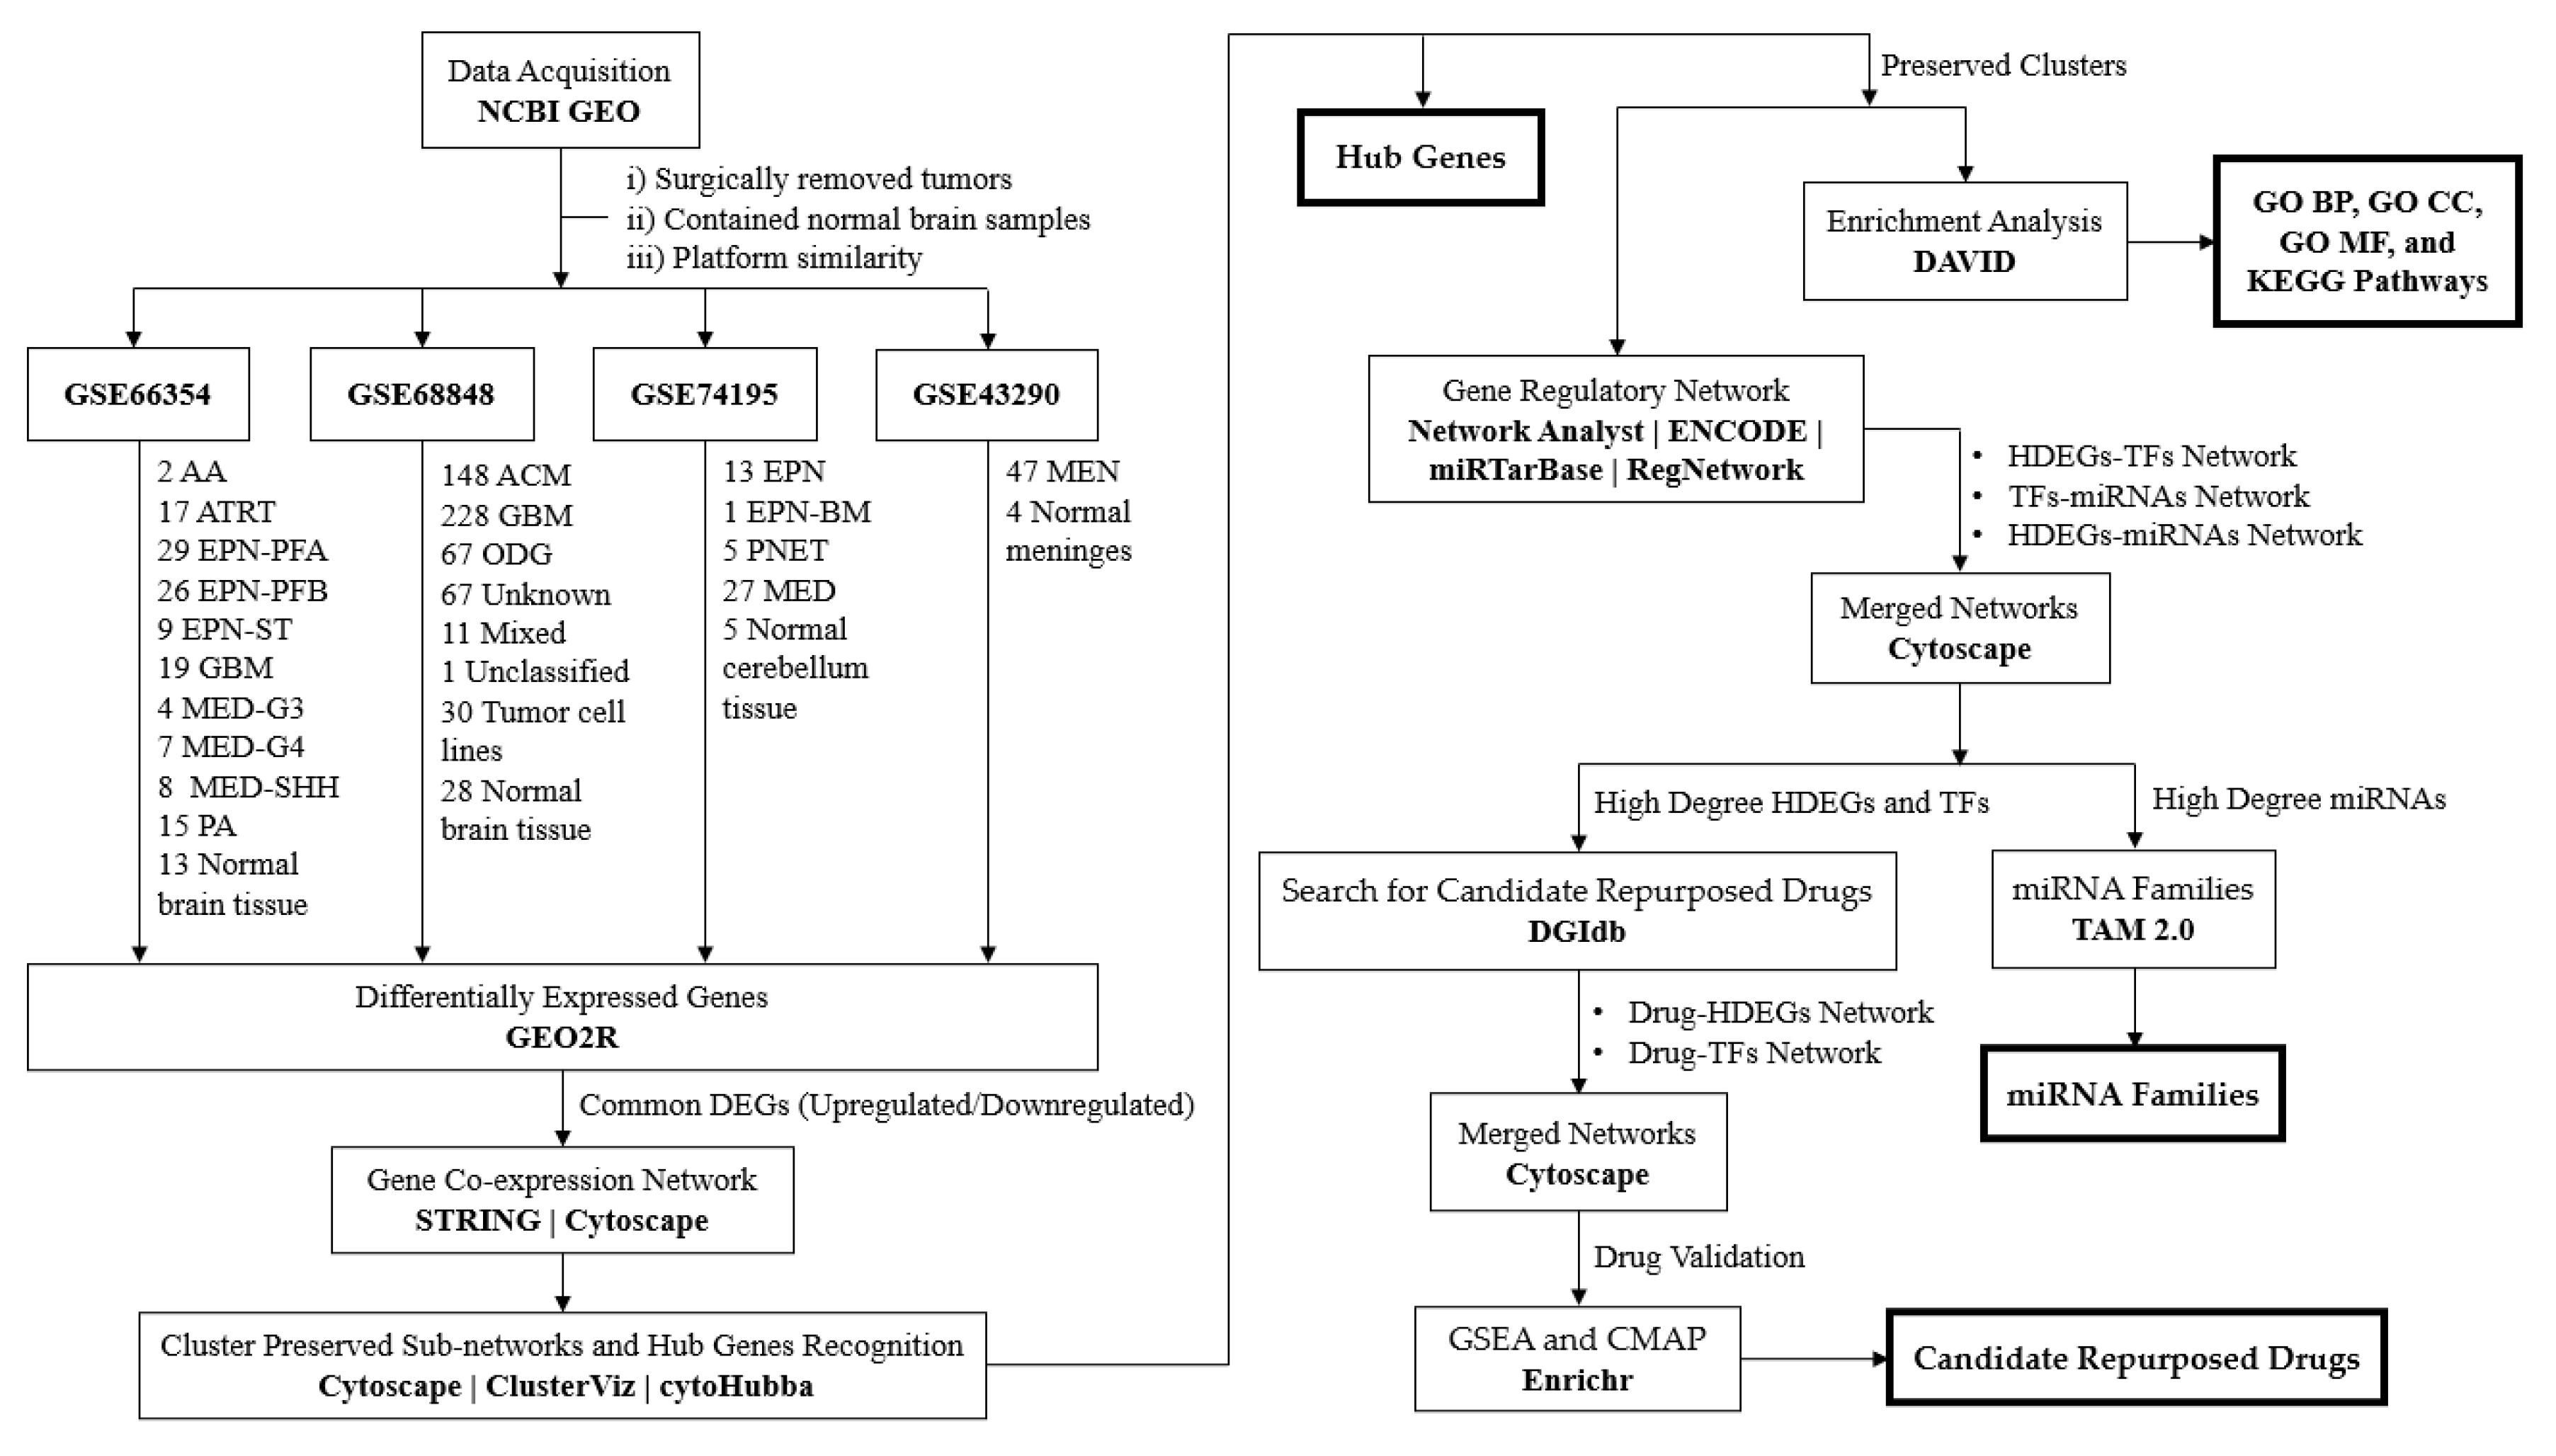
GSE66354 [25], GSE68848 [58,59], GSE74195 [60], and GSE43290 [32] are different primary CNS tumor microarray expression profiles retrieved from the National Center for Biotechnology Information-Gene Expression Omnibus (NCBI GEO) online database [https://www.ncbi.nlm.nih.gov/geo/] [61]. These expression profiles were chosen based on the (1) DNA source, which is surgically removed brain tumors, (2) the dataset contained normal comparable samples, and (3) platform similarity, the use of Affymetrix HG-U133A or HG-U133 Plus 2.0 [23,62,63,64]. Table 1 displays the summary of the dataset used in this study. Observed in Figure A1 is the methodological framework of this study.

2.1.2. Differentially Expressed Genes

The GEO2R [https://www.ncbi.nlm.nih.gov/geo/geo2r/] web tool was applied to identify differentially expressed genes (DEGs) between brain tumors and normal brain tissue in each dataset [65]. Benjamini & Hochberg's false discovery rate was applied in GEO2R, and samples were normalized. The adjusted p-value cutoff was 0.05 and the log2 fold threshold was ≥ 1 for upregulated genes and ≤ -1 for downregulated genes on selecting DEGs [66,67]. Specific probes for 9 CNS tumor types were also identified. Probe IDs on each dataset were converted to their corresponding gene symbols through the g:Convert mapping tool of the g:Profiler web server [https://biit.cs.ut.ee/gprofiler/convert] [68]. After filtering duplicates, extracted DEGs are obtained in plain text format and were intersected through the Venn diagram online tool [https://bioinformatics.psb.ugent.be/webtools/Venn/] to visualize common DEGs in between the four datasets.

2.2. Gene Co-Expression Network and Hub Genes Identification

2.2.1. Protein-Protein Interaction Network

Common differentially expressed genes extracted from the four datasets were used to reconstruct the gene co-expression network in Search Tool for Recurring Instances of Neighbouring Genes (STRING) web database version 12.0 [https://string-db.org/] [69]. In this web tool, the minimum required interaction score was set to medium confidence (0.400) for a full STRING network. Protein-protein interaction network of the common DEGs was correct through STRING interaction enrichment. Co-expression network from the STRING database was obtained in Tab-Separated Values (TSV) file format and reconstructed in Cytoscape version 3.10.0 software for visualization and analysis [70].

2.2.2. Clusters and Hub Genes Network

The ClusterViz plugin through the Molecular Complex Detection (MCODE) algorithm was used in Cytoscape to identify clusters in the co-expression network and utilized a sub-network [71]. The cytoHubba plugin in Cytoscape was utilized to calculate the hub genes (HGs) in the co-expression network through the Maximal Clique Centrality (MCC) algorithm [72]. In this study, only the top ten hub genes were considered.

2.3. Enrichment and Pathway Analysis

The Database of Annotation, Visualization, and Integrated Discovery (DAVID) Knowledgebase (v2023q2) [https://david.ncifcrf.gov/] was utilized for enrichment analysis. The common hub genes were used as the primary gene list for enrichment analysis [73]. The Gene Ontology (GO) database was utilized for the basic function and characteristics of gene-protein products through Biological Processes (BP), Cellular Components (CC), and Molecular Functions (MF) [74]. Kyoto Encyclopedia of Genes and Genomes (KEGG) database analyzed biological functions significant to hub genes [75]. Data obtained from the DAVID database were extracted in plain text and processed in MS Excel, p-values ≤ 0.05 and > 2 counts were considered. Processed data were utilized for bubble plots produced in the SRplot online server [https://www.bioinformatics.com.cn/srplot].

2.4. Gene Regulatory Network

Common hub genes calculated were used for the Gene Regulatory Network (GRN). Network Analyst 3.0 web server was used for GRN analysis through Gene List Input [https://www.networkanalyst.ca/] [76]. A transcription factor-gene (TF-HG) interaction network was utilized for TFs interacting with hub genes. The Encyclopedia of DNA Elements (ENCODE) database was chosen as a source derived from the ENCODE ChIP-seq data utilized by the Binding and Expression Target Analysis (BETA) Minus algorithm [77,78]. In this database option, only peak intensity signal < 500 and regulatory potential score < 1 were considered. Gene-microRNAs interaction miRTarBase version 8.0, a database of experimentally validated miRNA-gene interactions was chosen [79]. For the transcription factor-microRNAs coregulatory interaction (TF-miRNA), the Network Analyst retrieves data from the RegNetwork repository [80]. In this study, nodes were filtered specific to brain tissue utilized by the Genotype-Tissue Expression Project (GTEx) database [81]. TFs and miRNAs interacting with genes < 4 were considered relevant in the study. Each network produced in Network Analyst was extracted into Simple Interaction Format (SIF) and analyzed in Cytoscape software. Networks were merged into one using the union network option available in Cytoscape.

2.5. Screening of Candidate Repurposed Drugs

To identify potential repurposed drugs that target hub genes and transcription factors, Drug Gene Interaction Database (DGIdb) new beta version was used [https://beta.dgidb.org/] [82]. Here we only considered approved drugs for the drug-gene interaction. Drug candidates identified from DGIdb were compared through a reconstructed network and drugs with more than two hits were considered significant.

2.6. Gene Set Enrichment Analysis and Connectivity Mapping for Validation of Repurposed Candidate Drugs

The Gene Set Enrichment Analysis (GSEA) and Connectivity Map (CMAP) analysis were achieved through the Enrichr database [https://maayanlab.cloud/Enrichr/]. By inputting the common hub genes list, the CMAP-up and CMAP-down drugs are validated for their corresponding regulation [83].

2.7. MicroRNAs Enrichment Analysis

To identify the miRNAs family, the TAM 2.0 [http://www.lirmed.com/tam2/] was used [84]. All the miRNAs considered in this study were imported into the TAM online tool, and then the top five families were identified.

3. Results

3.1. Dataset Search and Selection

Four expression profiles of different CNS tumors GSE66354, GSE68848, GSE74195, and GSE43290 were selected and retrieved from the NCBI GEO database. In selecting the DNA microarray dataset, three criteria were established. First, gene expression profiles were generated from surgically removed CNS or brain tumors. Second, the dataset must contain non-tumor or normal brain samples. Lastly, the similarity of the microarray platform used, in this study expression profiling by Affymetrix. All the selected datasets used in this study satisfied these criteria. In a comparison of samples within the datasets, GSE66354 has the most diversely identified samples of brain tumors. It has three types of gliomas: two phenotypes of astrocytoma (2 anaplastic and 15 pilocytic), three phenotypes of ependymoma (29 posterior fossa group a, 26 posterior fossa group b, and 9 supratentorial), and 19 glioblastomas (12 pediatric and 7 adult). Three subtypes of medulloblastoma (4 group 3, 7 group 4, and 8 sonic hedgehog), the rare atypical teratoid/rhabdoid tumor, and normal brain tissue (2 cerebellum, 1 medulla, 1 midbrain, 8 cerebral cortex (2 cerebellum, 1 medulla, 1 midbrain, 8 cerebral cortex (3 frontal, 2 occipital, 2 parietal, and 1 temporal), and 1 thalamus) were also included in GSE66354 [25]. Meanwhile, the GSE68848 dataset has the largest sampling count with 552 tumor gene expression profiles, 30 of which are tumor cell lines, 128 astrocytomas, 228 glioblastomas, 67 oligodendrogliomas, 67 unknown brain tumors, 11 mixed tumors, 1 unclassified, and 28 non-tumor samples. It was purposely collected by the Repository of Molecular Brain Neoplasia Data (Rembrandt) database to contribute to improving cancer research [58,59]. GSE74195 has pediatric tumors, which are 27 medulloblastomas, 13 ependymomas (8 anaplastic and 5 cellular), 1 ependymoblastoma, 5 primitive neuroectodermal tumors, and 5 adult normal cerebellum tissue samples. The dataset was intended for comparison and to identify differentially expressed genes for medulloblastoma and ependymoma [60]. All the three discussed used GPL570 [HG-U133_Plus_2] Affymetrix Human Genome U133 Plus 2.0 microarrays while the GSE43290 dataset used GPL96 [HG-U133A] Affymetrix Human Genome U133A Array. The two microarray platforms shared the same probe set and are highly correlated to measure data [62]. However, HG-U133A has probes (21, 722) as a subset of HG-U133_Plus_2 (54, 220), and the two platforms are still compatible for comparison [62]. Moreover, 47 meningiomas (1 anaplastic, 12 atypical, 1 atypical-papillary, 4 fibroblasts, 7 meningothelial, 8 psammomatous, 1 secretory, and 13 transitional) and 4 normal meninges gene expression profiles came from the GSE43290 dataset [32]. The presence of different CNS tumor samples in each dataset provided a wide range of comparisons. It leads to further interpretation of the recurrence between different types and subtypes.

3.2. Differentially Expressed Genes

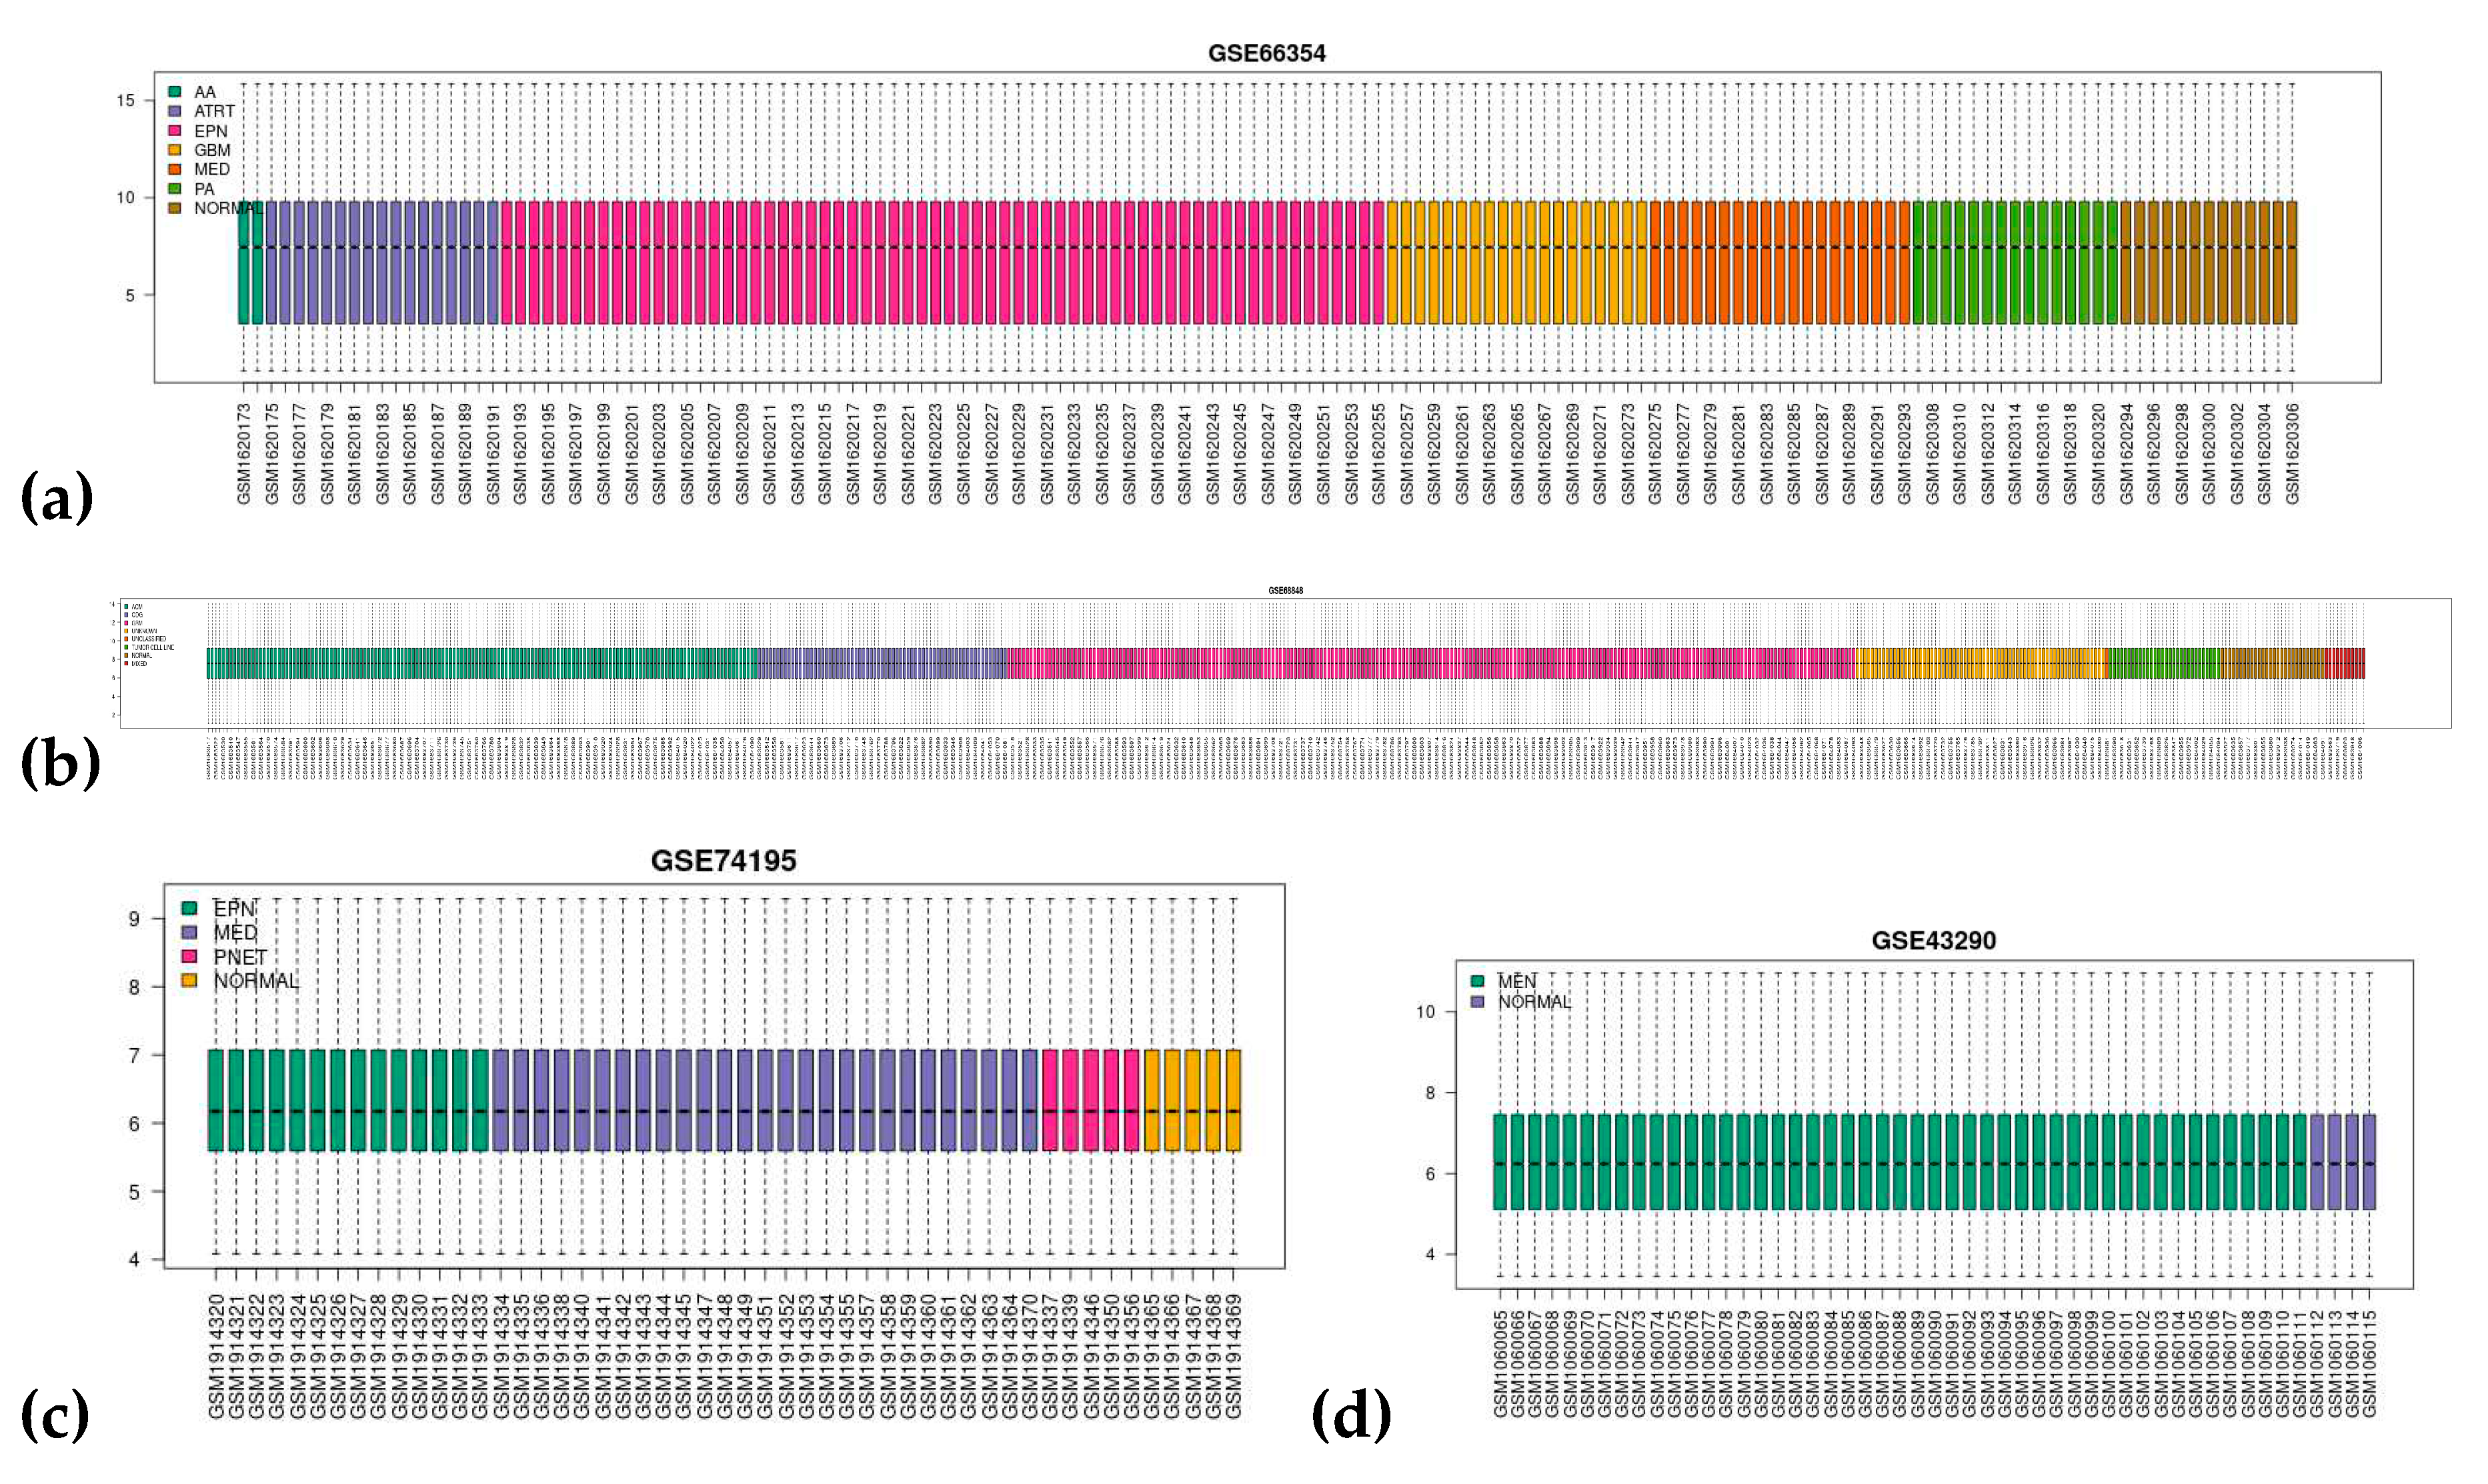
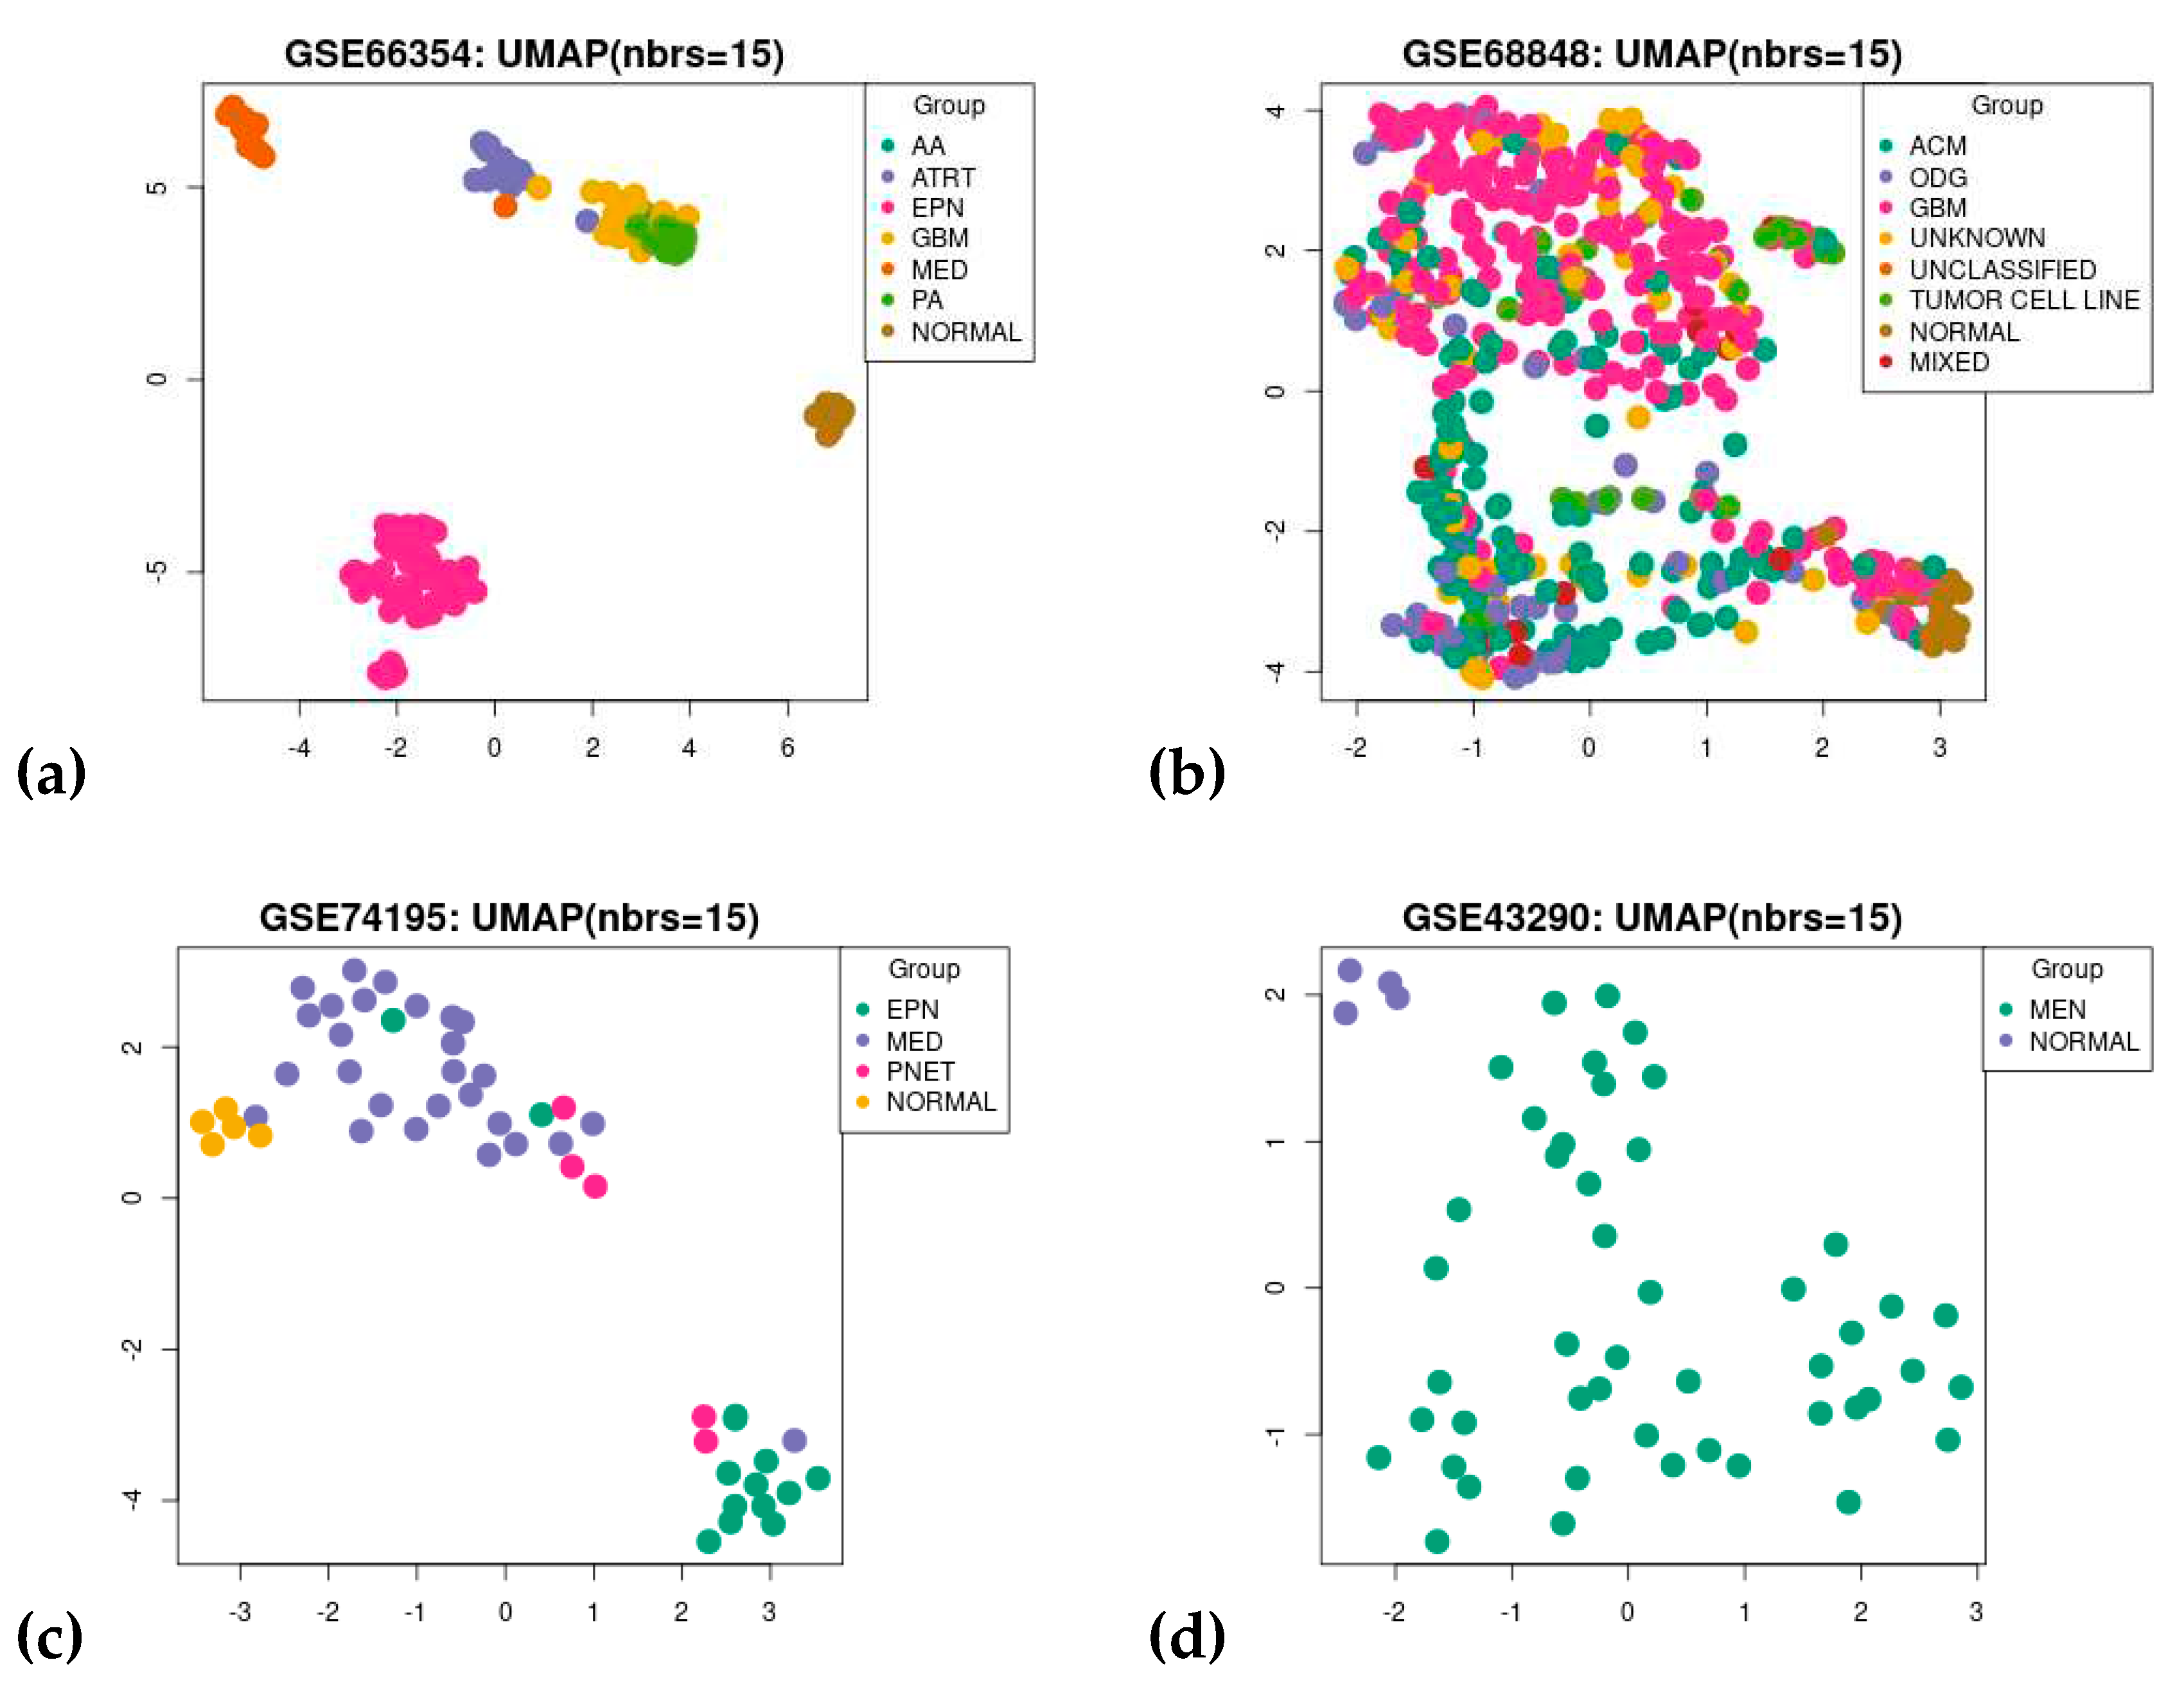
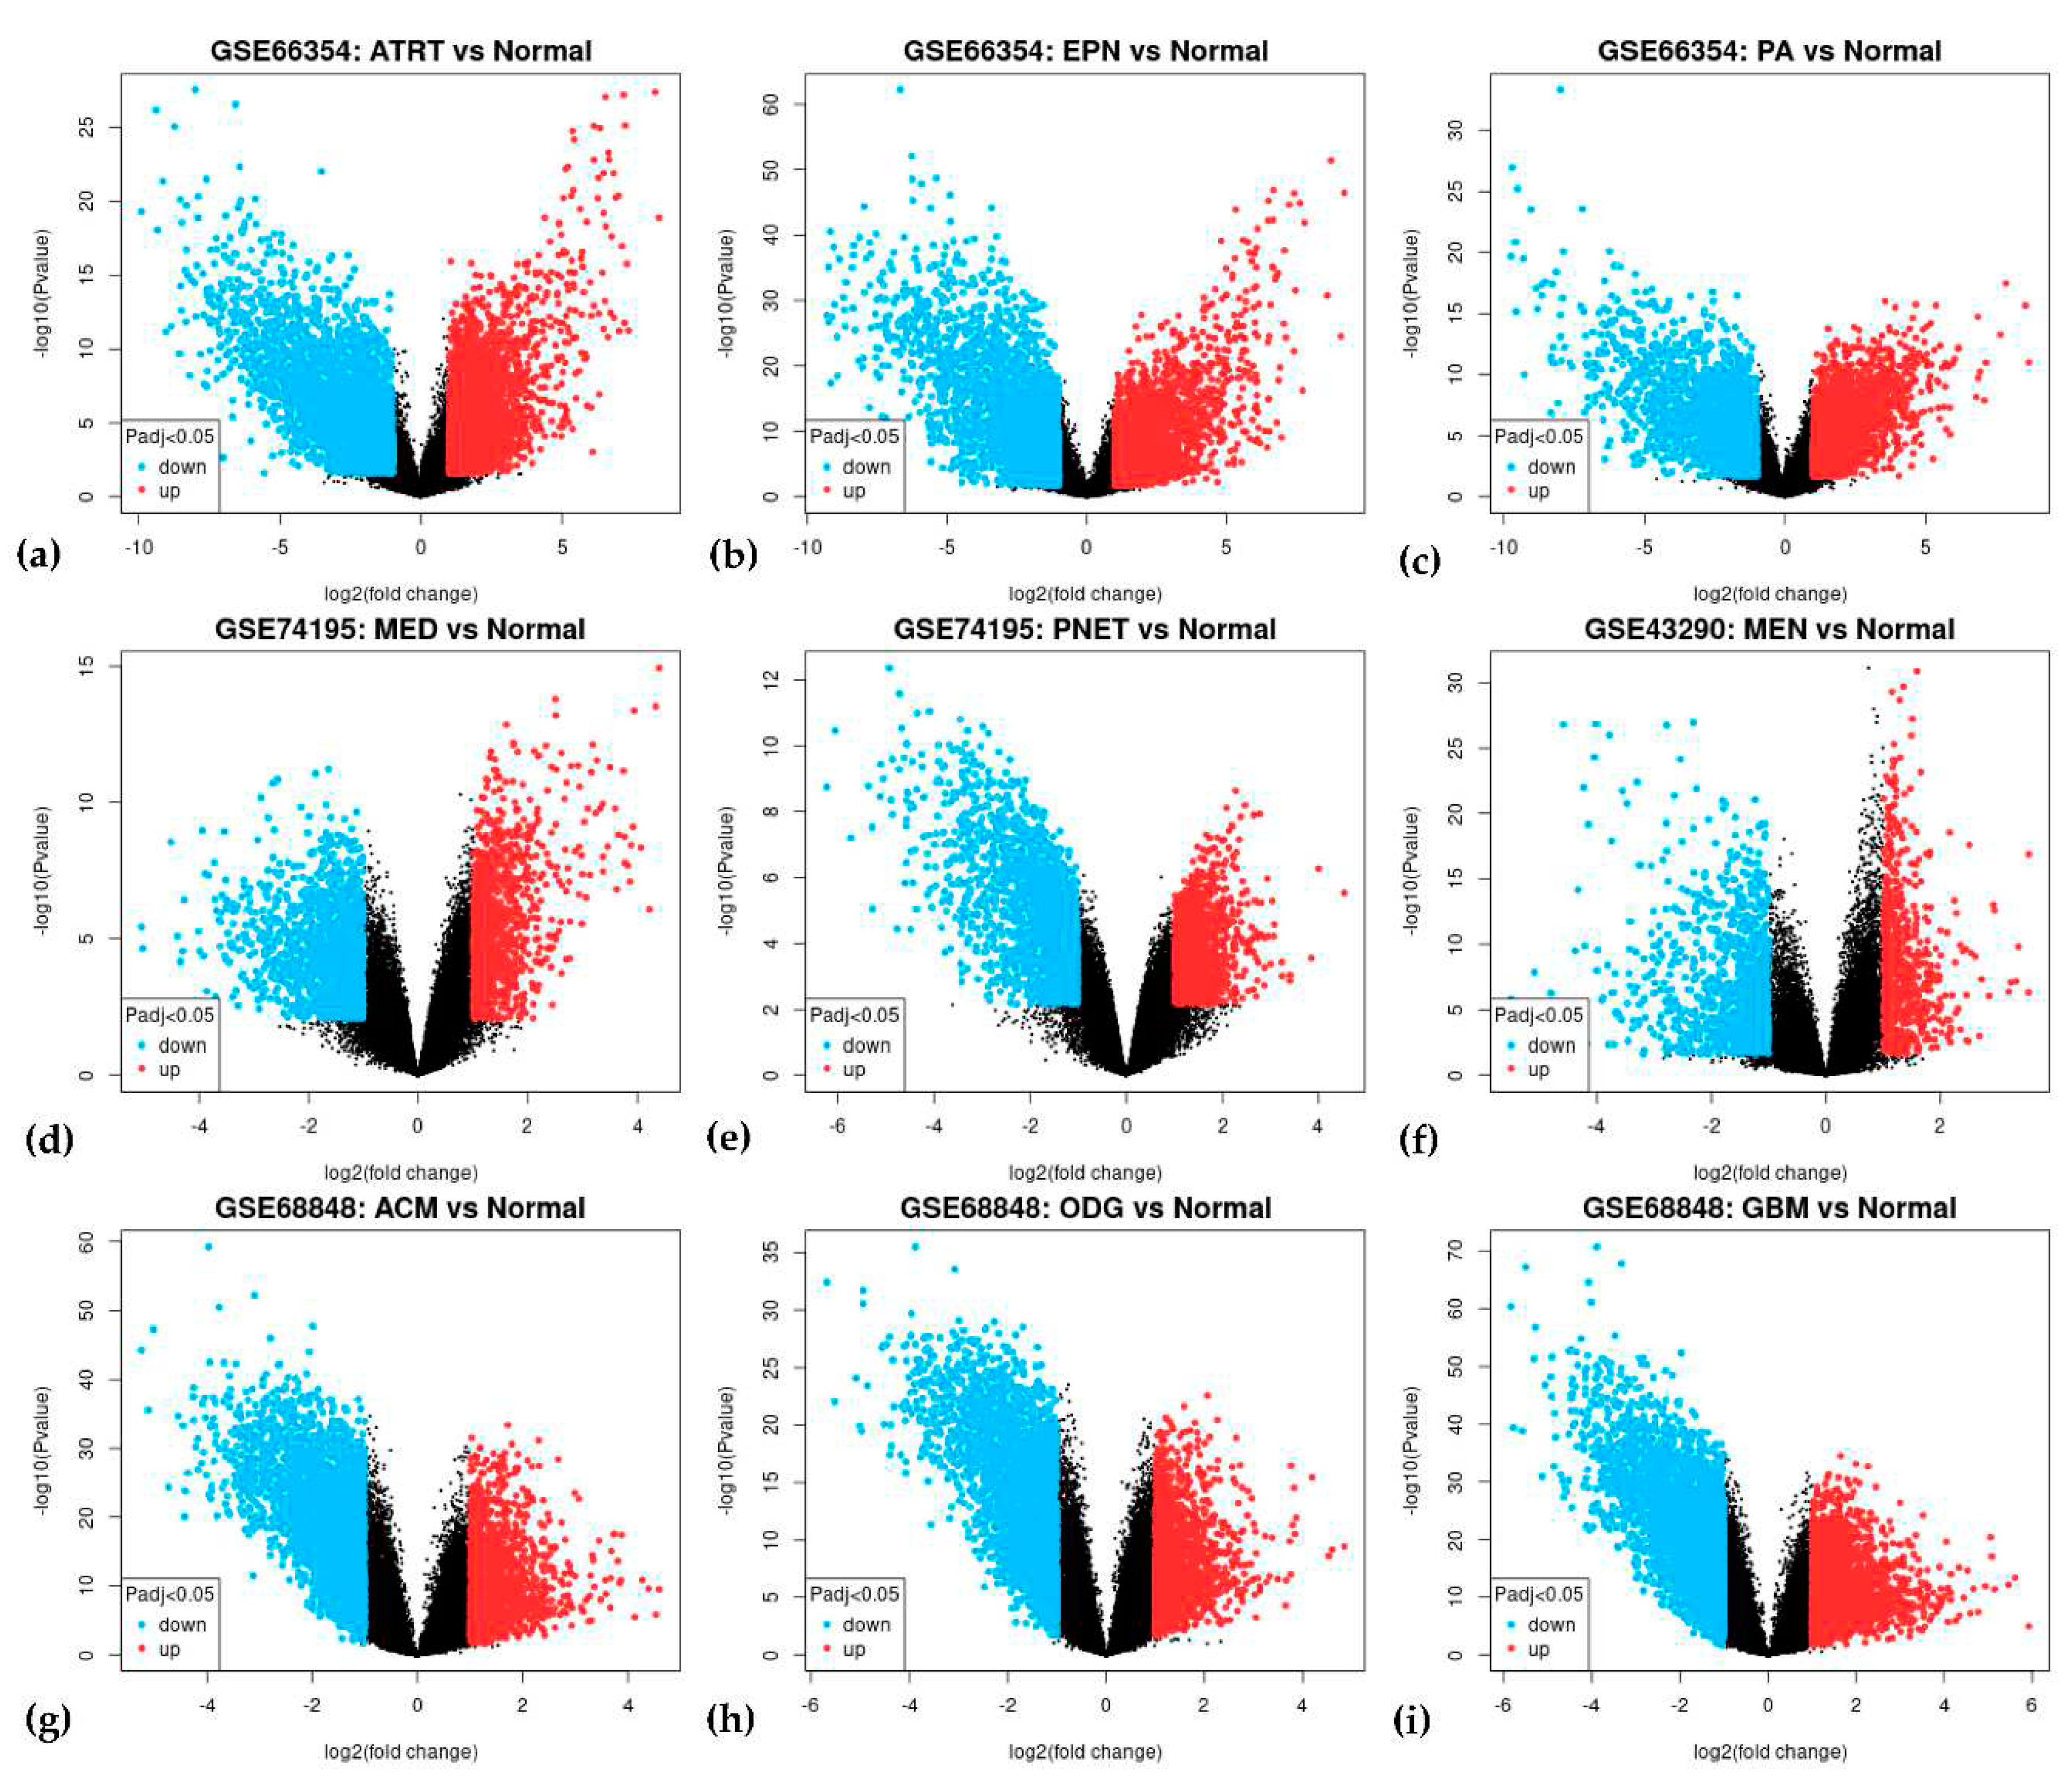
In each of the four datasets, two groups were compared, the tumor group and normal brain tissue. The GEO2R can compare different groups of samples within the dataset and identify probe sets that are differentially expressed [37]. Box plot (Figure A2) and the Principal Component Analysis (PCA) successfully illustrate that each sample within their dataset was comparable after transformation and normalization. The box plot showed the mean frequency reads in each sample and was not statistically irrelevant. PCA through the Uniform Manifold Approximation and Projection (UMAP) plot (Figure A3) showed that the samples were not entirely similar, but the groups were comparable. See Figure 1 for the volcanic plot of the significant probes in each dataset. Blue represents down-regulated genes and red represents up-regulated genes.
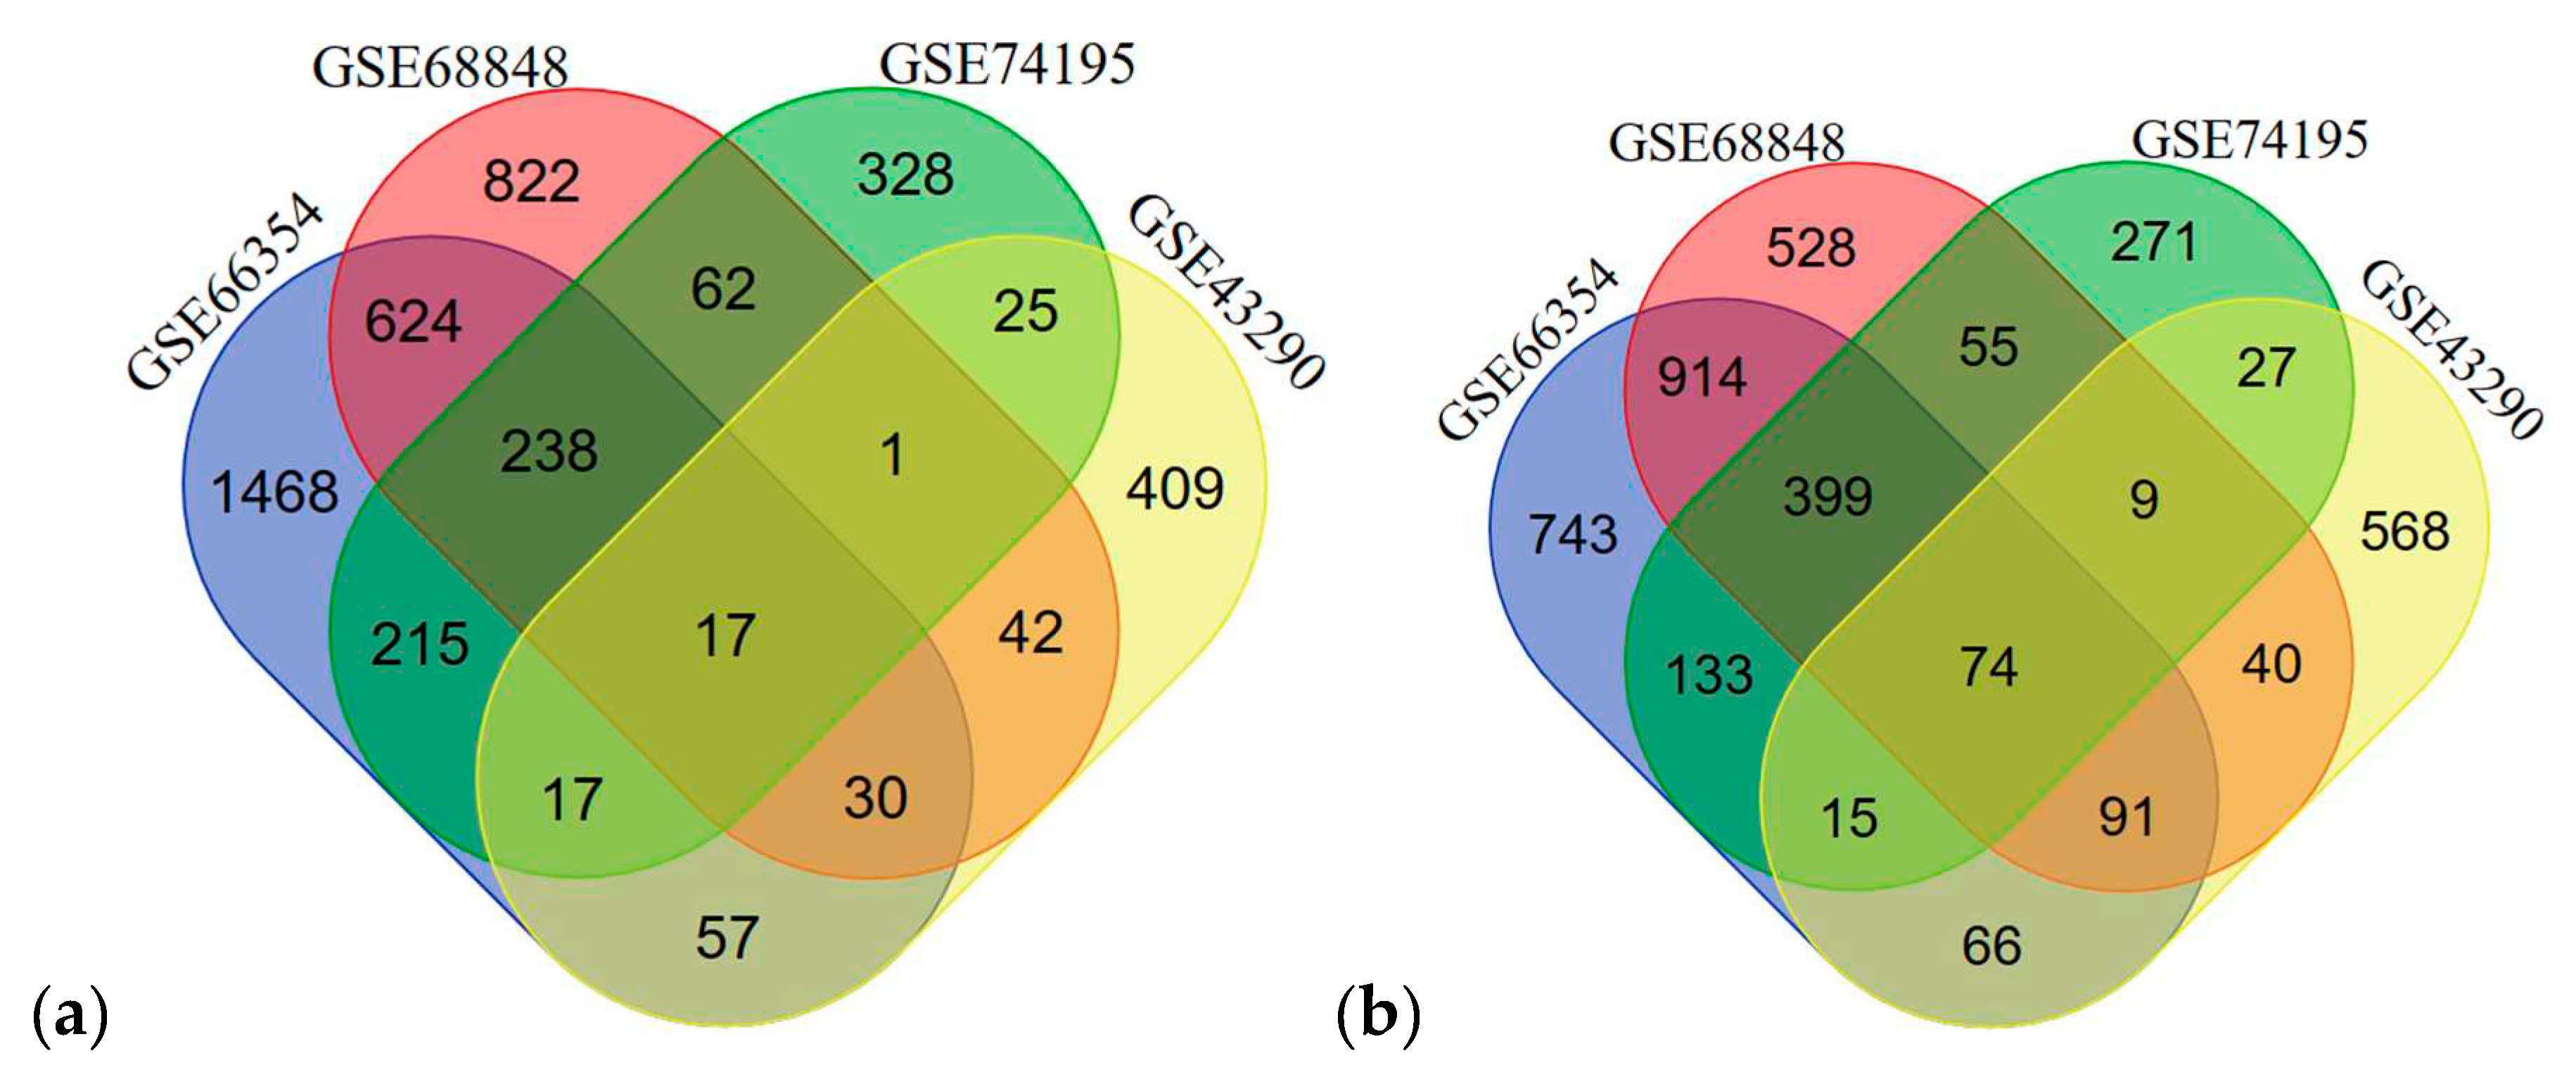
In each dataset, significant probes of the tumor group and the normal group were identified, (upregulated/downregulated) GSE66354 had 2678/2450, GSE68848 had 2752/3335, GSE74195 had 1136/1478, and GSE43290 had 711/1089 significant probes. See Supplementary Data 1 for the differentially expressed genes in each dataset. Significant probes were converted for their corresponding genes and then filtered for duplicates, blanks, and control probes. Identified upregulated/downregulated genes for GSE66354 (2666/2435), GSE68848 (1836/2110), GSE74195 (903/983), and GSE43290 (598/890) were intersected and revealed 17/74 common DEGs from the four datasets as observed in Figure 2. See Supplementary Data 2 for the list of intersected DEGs. Table 2 displays the list of 91 common differentially expressed genes. The 91 common DEGs served as the primary list for co-expression network reconstruction. The purpose of identifying common DEGs was to suggest a common biomarker that is involved in CNS tumors analyzed in this study. In this, bioinformatics provided a conventional technique to understand relative genes that might contribute to tumorigenesis and insight into the correlation of the different CNS tumors in manifestation into terminal cancer, glioblastoma multiforme.

3.3. Gene Co-Expression Network Analysis

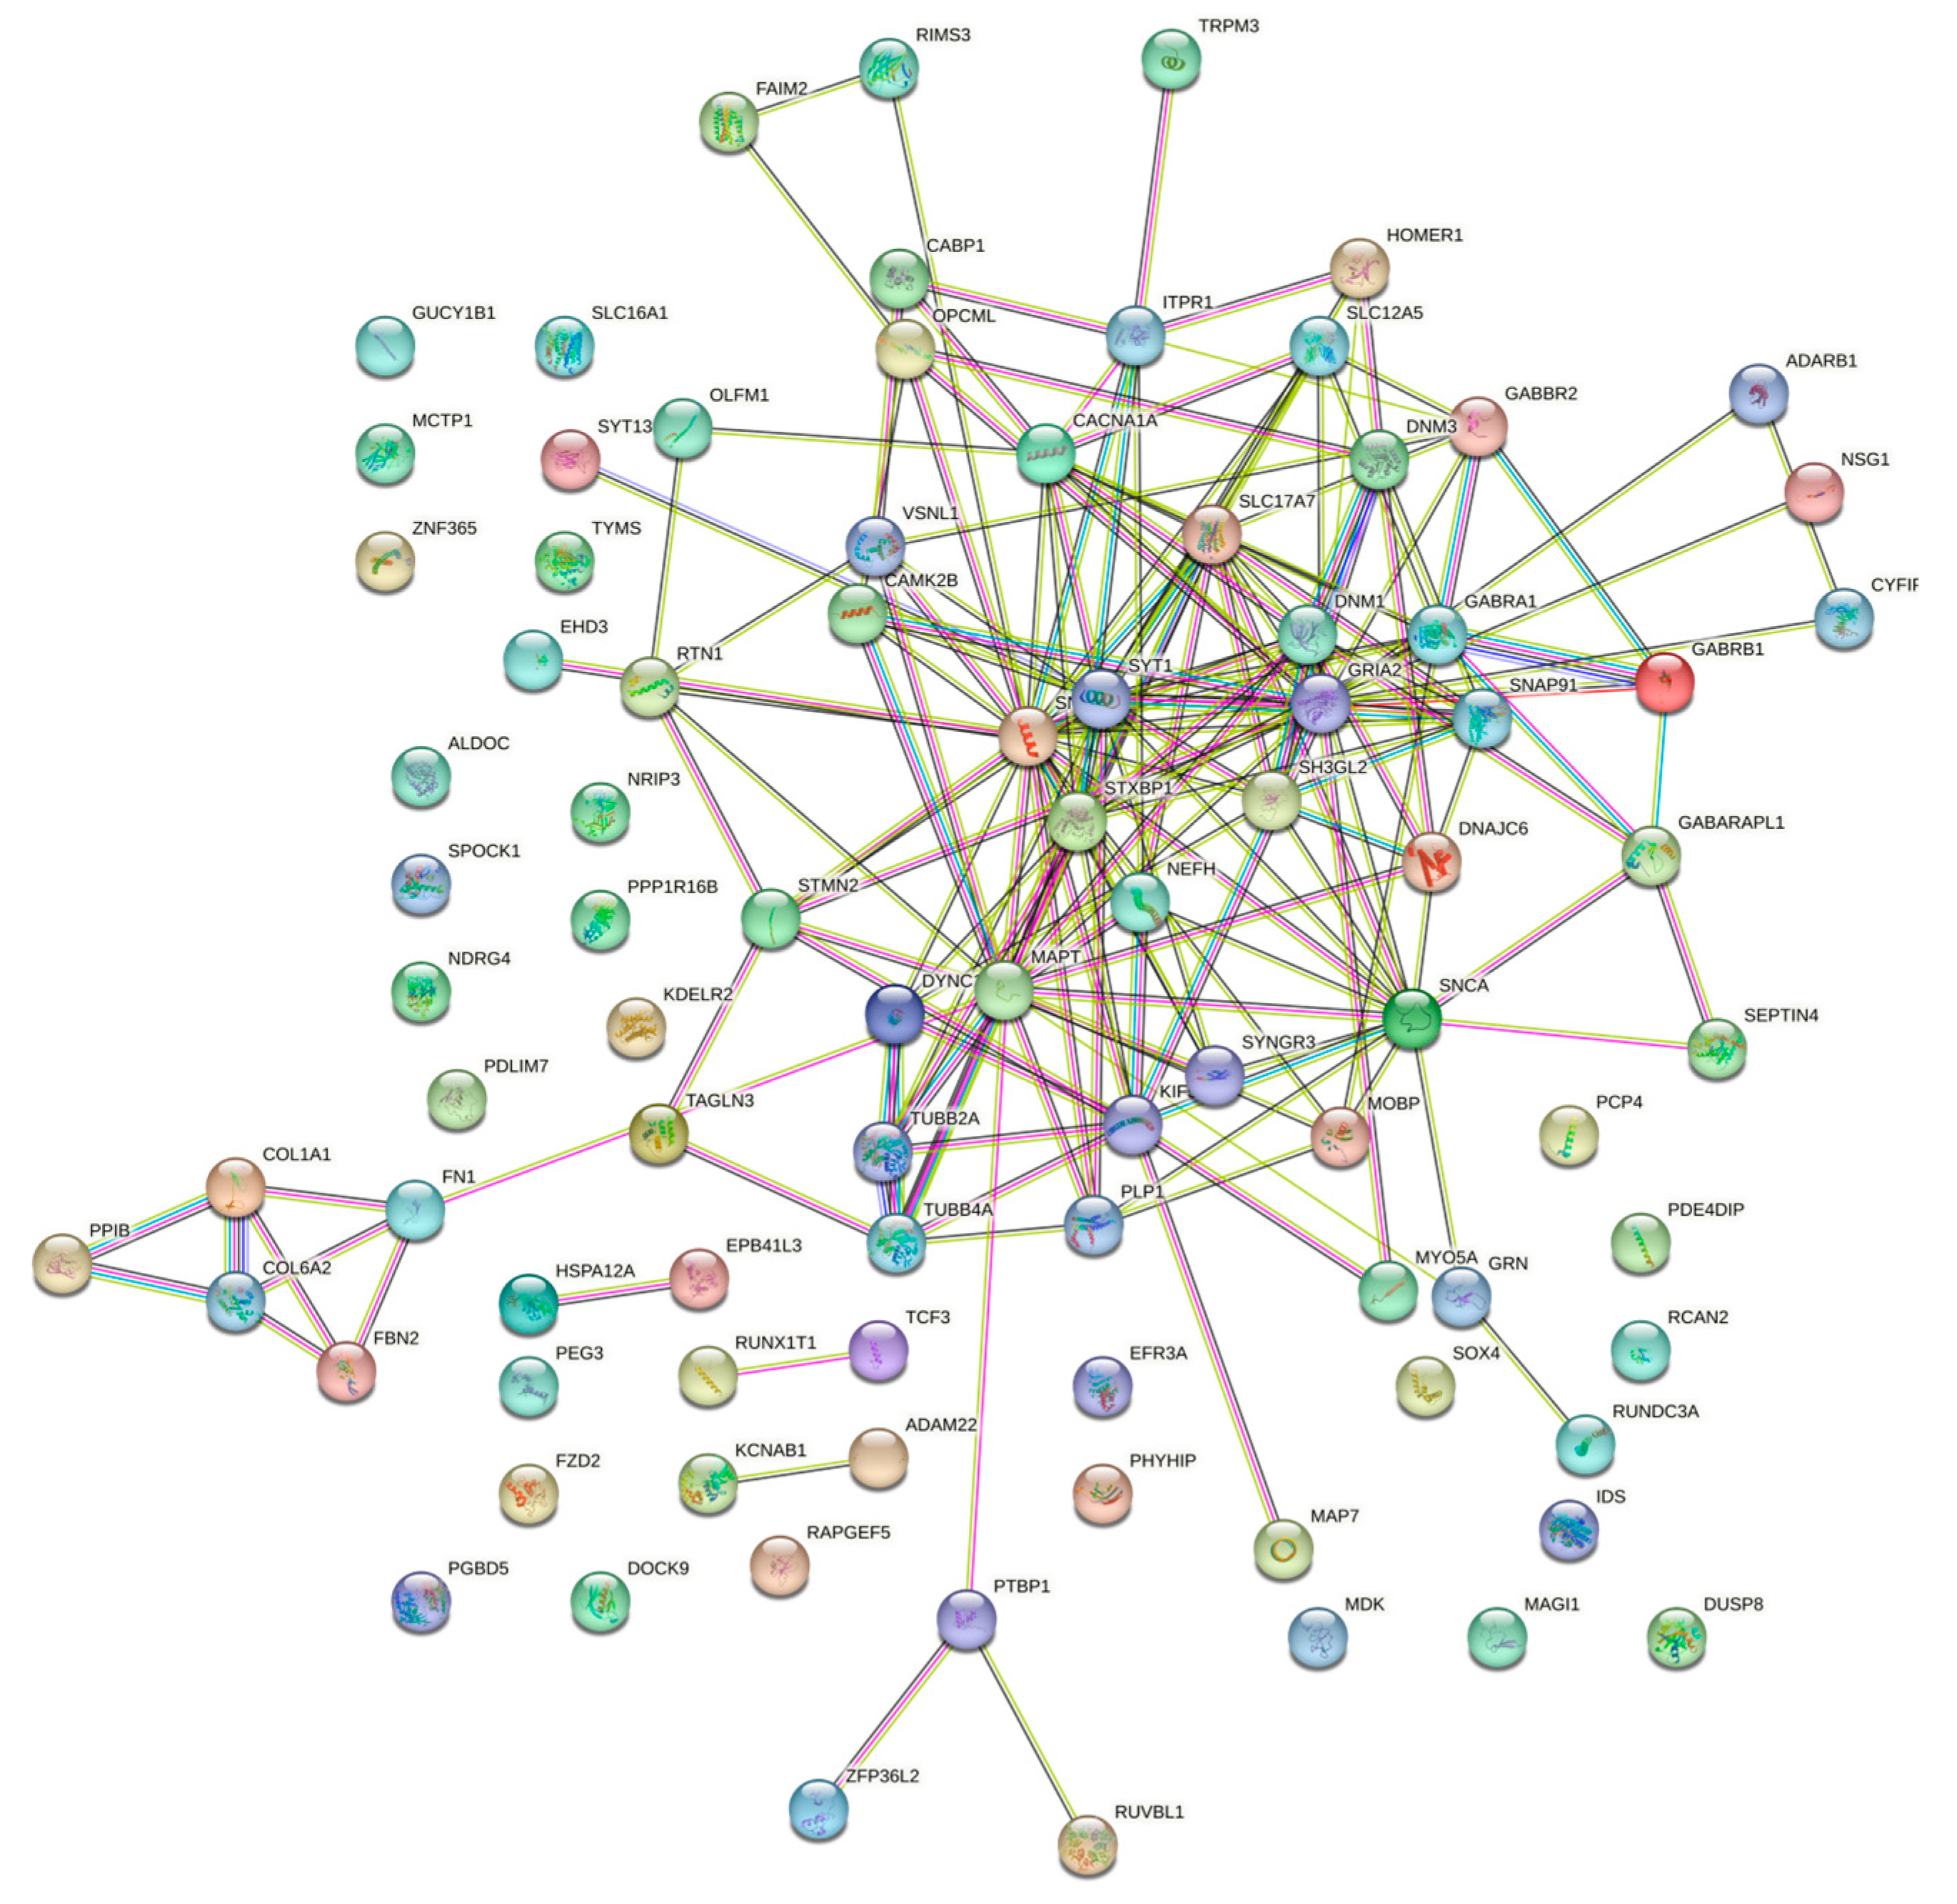
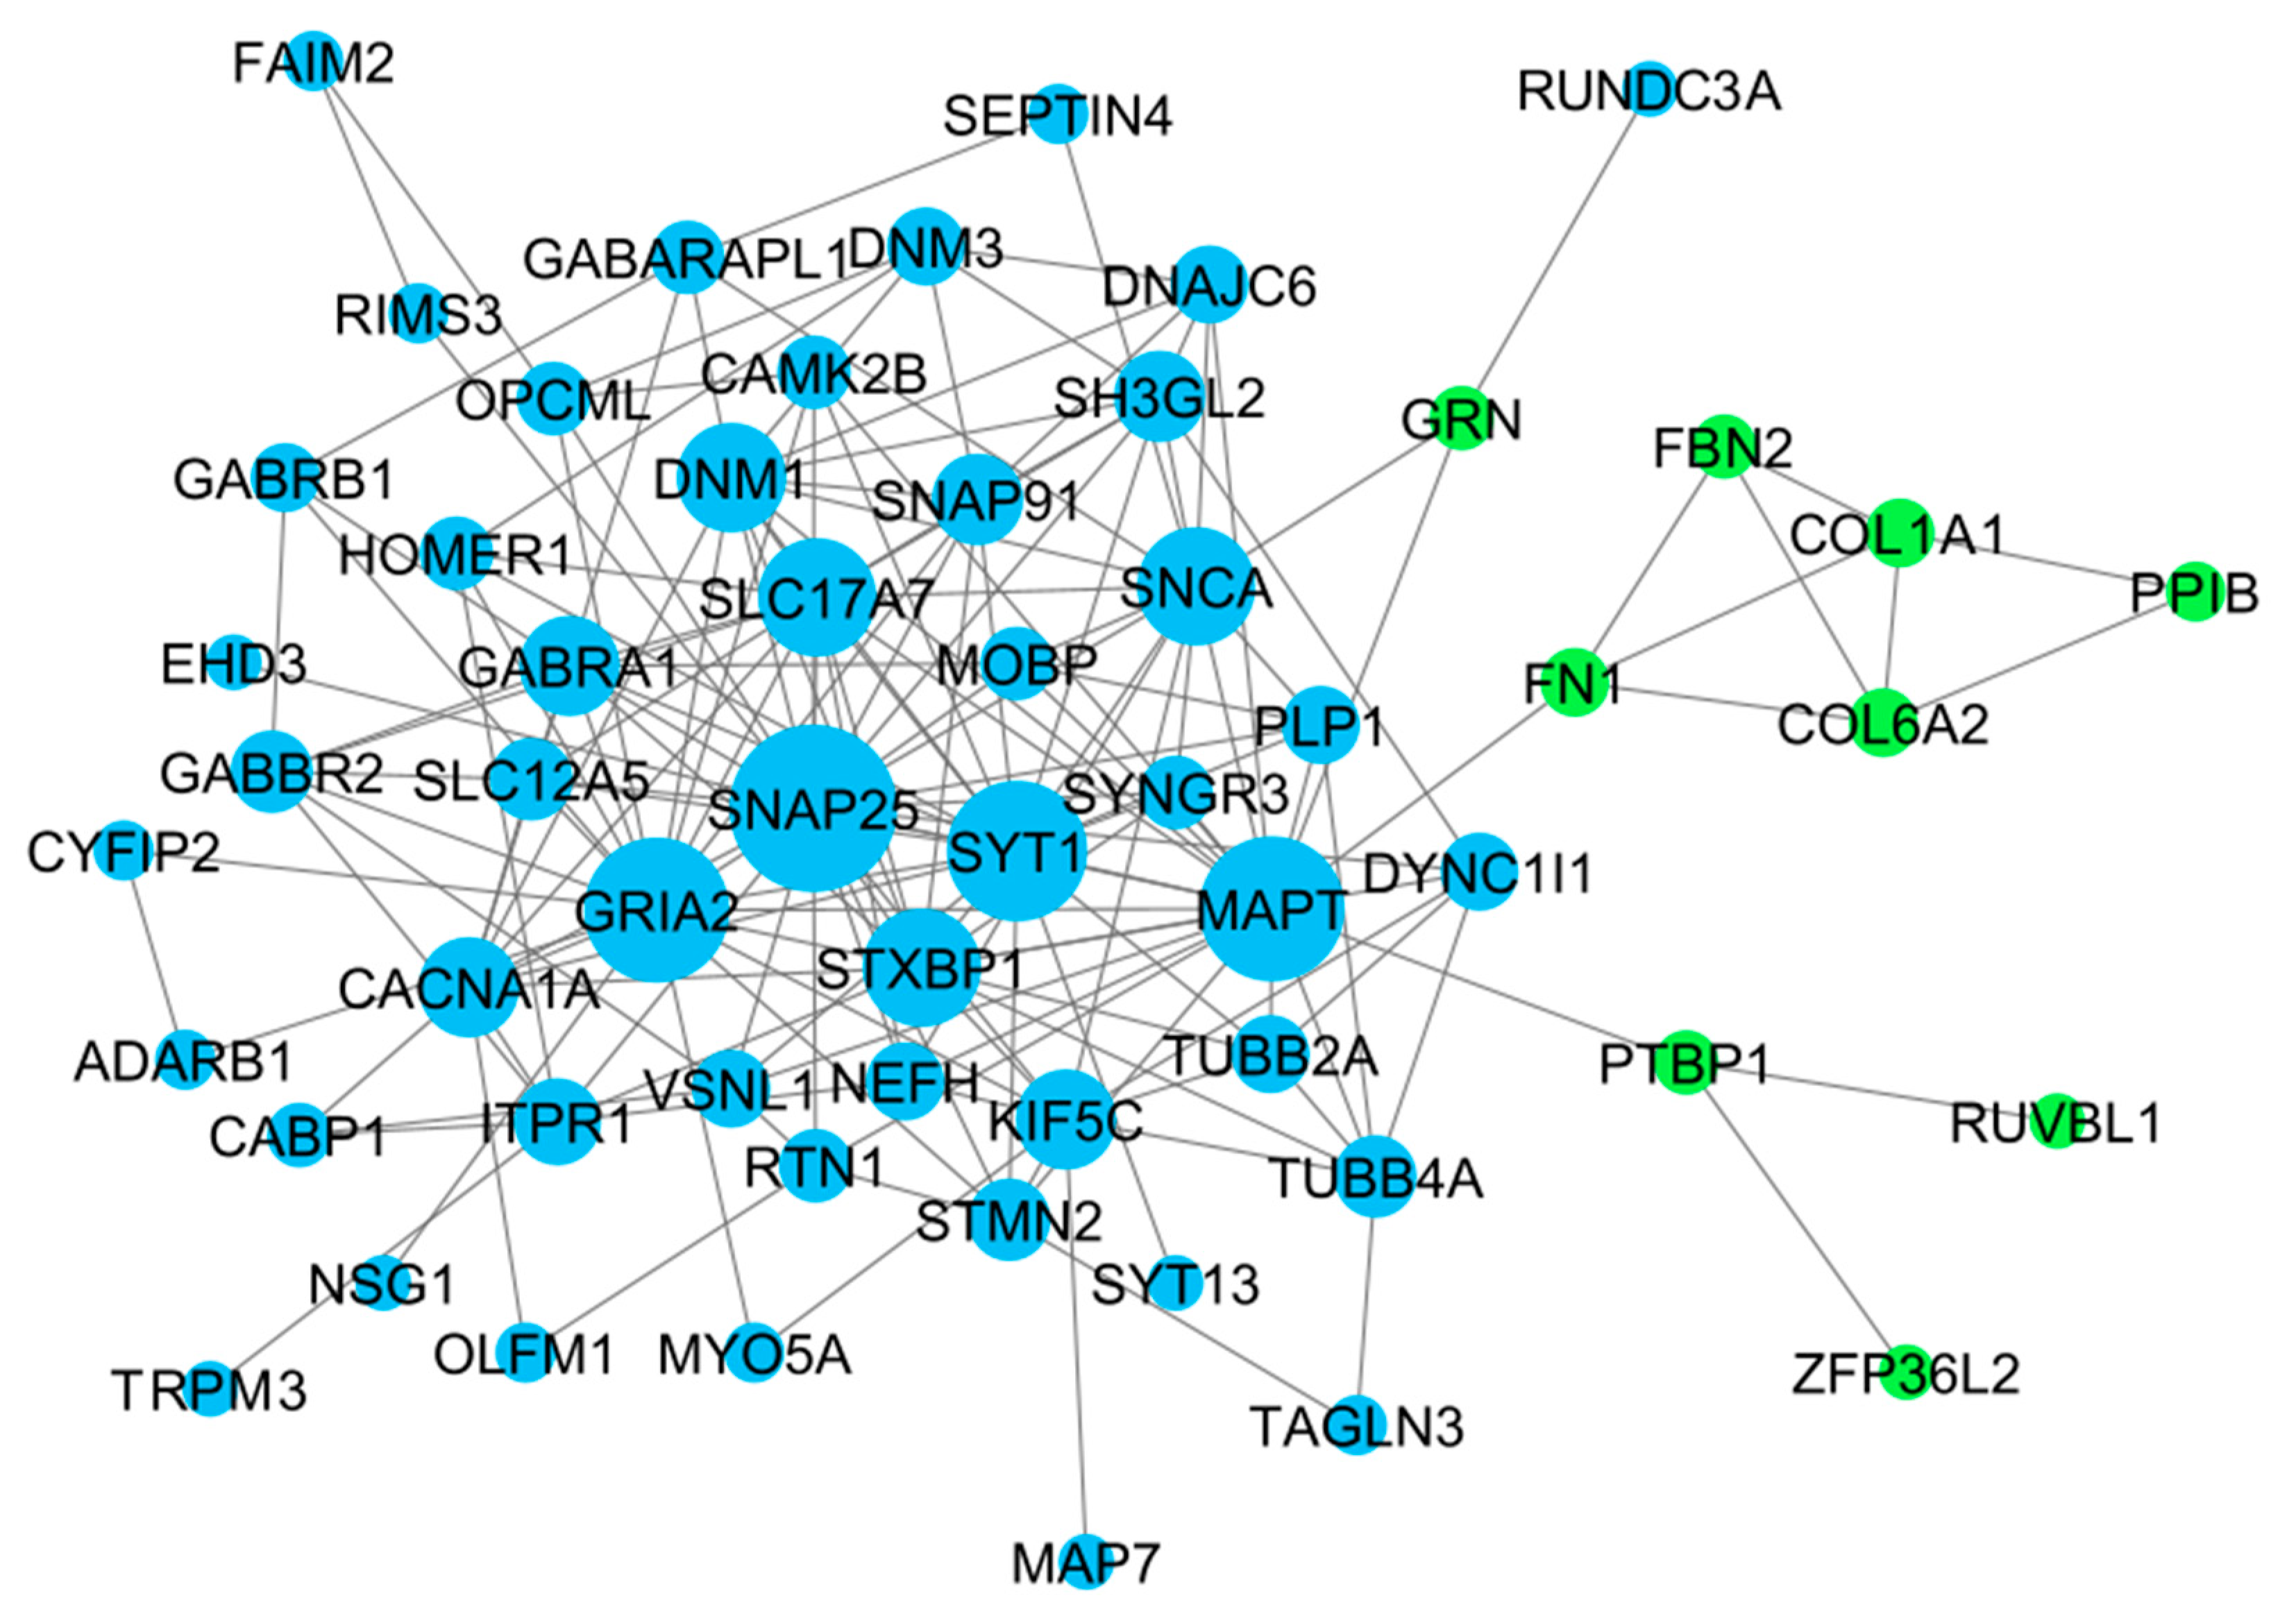
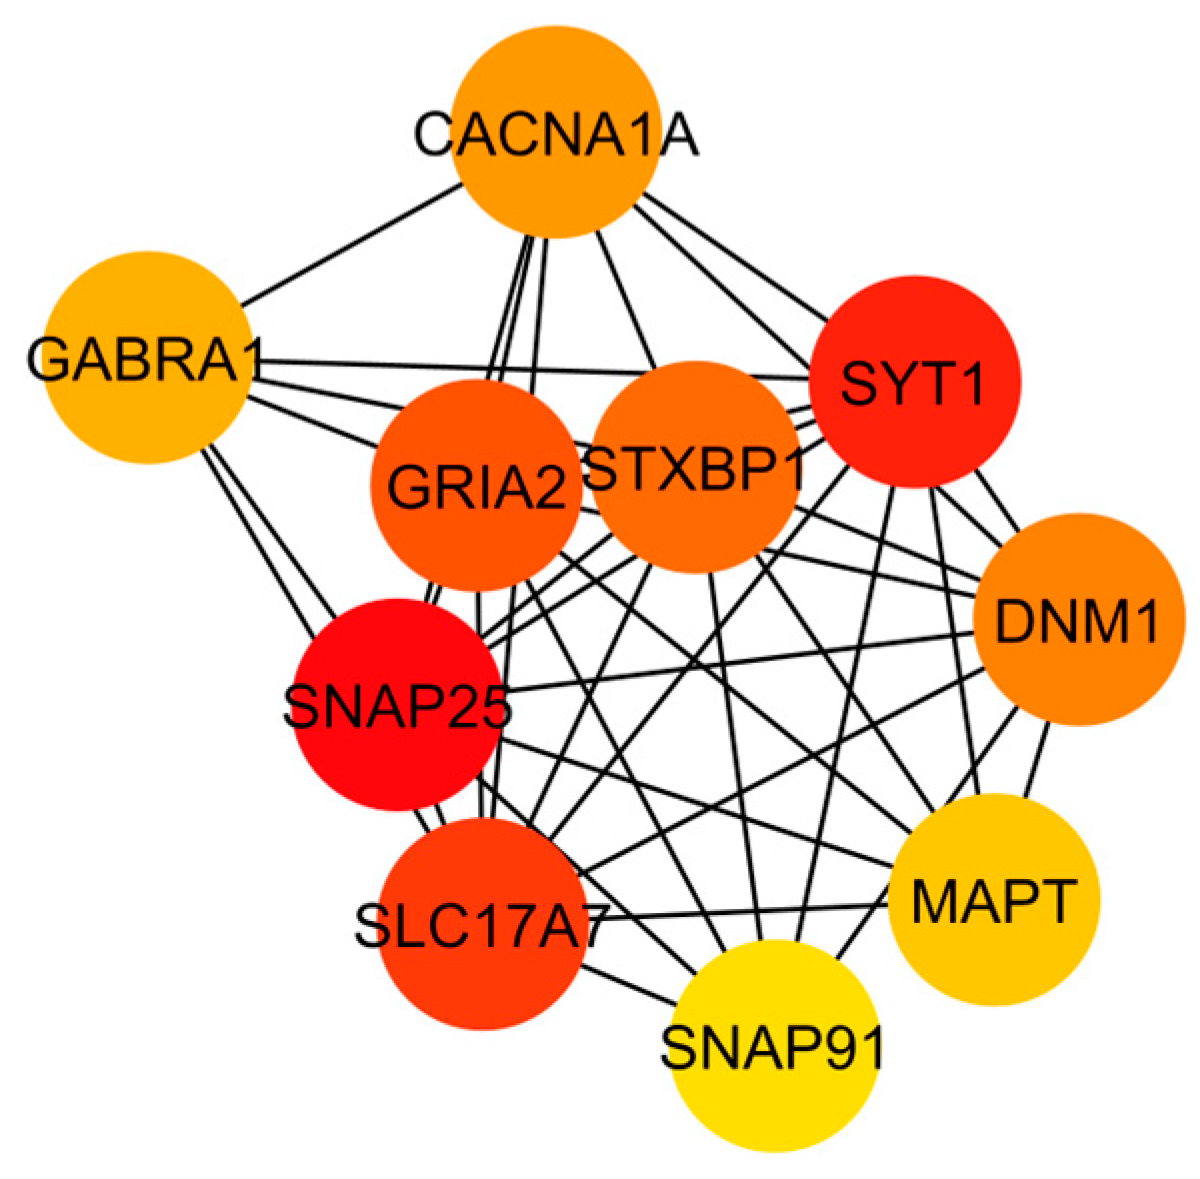
At first, the 91 differentially expressed genes retrieved from the four CNS tumor datasets were used to reconstruct a gene co-expression network. 90 nodes and 185 edges predicted by the STRING database were used in this study as observed in Figure 3. See Supplementary Data 2 for the STRING mapping of the primary DEGs entry and topological properties of the gene co-expression network. The co-expression network was then utilized in Cytoscape software for further analysis, see Figure 4 for the reconstructed co-expression network where disconnected nodes were disregarded. Topological properties of the Figure 4 network can be observed in Supplementary Data 2. Cytoscape plugin cytoHubba ranks nodes and their expanded network to identify hub genes. MCC topological analysis was used as it has a better-predicting precision of nodes [72]. The ten top-ranked nodes were SLC17A7, STXBP1, MAPT, CACNA1A, DNM1, SYT1, GABRA1, SNAP91, GRIA2, SNAP25. See Figure 5 for the sub-network of the top 10 hub genes. Cytoscape plugin ClusterViz identified three clusters in the co-expression network, two clusters composed of downregulated genes and one from the upregulated genes. Observed Figure 6 is the sub-network created from each cluster. See Table 3 for the genes identified in each module or cluster preserved. In each sub-network, highlighted (yellow) genes have the highest degree of interaction and could be considered key genes. These are GRIA2 with 7 interactions (Cluster 1), SNAP25 with 10 interactions (Cluster 2), and for Cluster 3 all nodes are considered highly important due to similar interaction scores [37]. Topological properties of the cluster sub-network in Figure 6 and hub genes subnetwork in Figure 5 can be observed in Supplementary Data 2.
In each cluster or module identified by the Cytoscape ClusterViz plugin, some genes had a high degree of interaction. Cluster 1 is composed of eight preserved genes and GRIA2 has the highest degree of interaction among the genes interacting with the rest of the genes in the cluster (Figure 6a). SNAP25 is majorly preserved in Cluster 2 with ten interactions in a cluster with fifteen preserved genes (Figure 6b). Cluster 3 has four preserved genes (Figure 6c), all interacting with one another and having the degree score the same.
Hub gene identification provides a functional impact on precision oncology and drug repurposing through the correlation of molecular profiles and clinical characteristics of tumors [51,85]. The study aimed to identify common hub genes from differentially expressed genes for more specific gene-drug targets. Based on the cytoHubba the predicted hub genes mostly represent downregulated group. Here, we considered all the genes in cluster 3 as hub genes considering the upregulated group. In this study, fourteen hub DEGs (HDEGs) are considered, these are CACNA1A, DNM1, GABRA1, GRIA2, MAPT, SLC17A7, SNAP25, SNAP91, STXBP1, SYT1, COL1A1, COL6A2, FBN2, and FN1. See Table 4 for the list of HDEGs and their description.

3.4. Enrichment Analysis

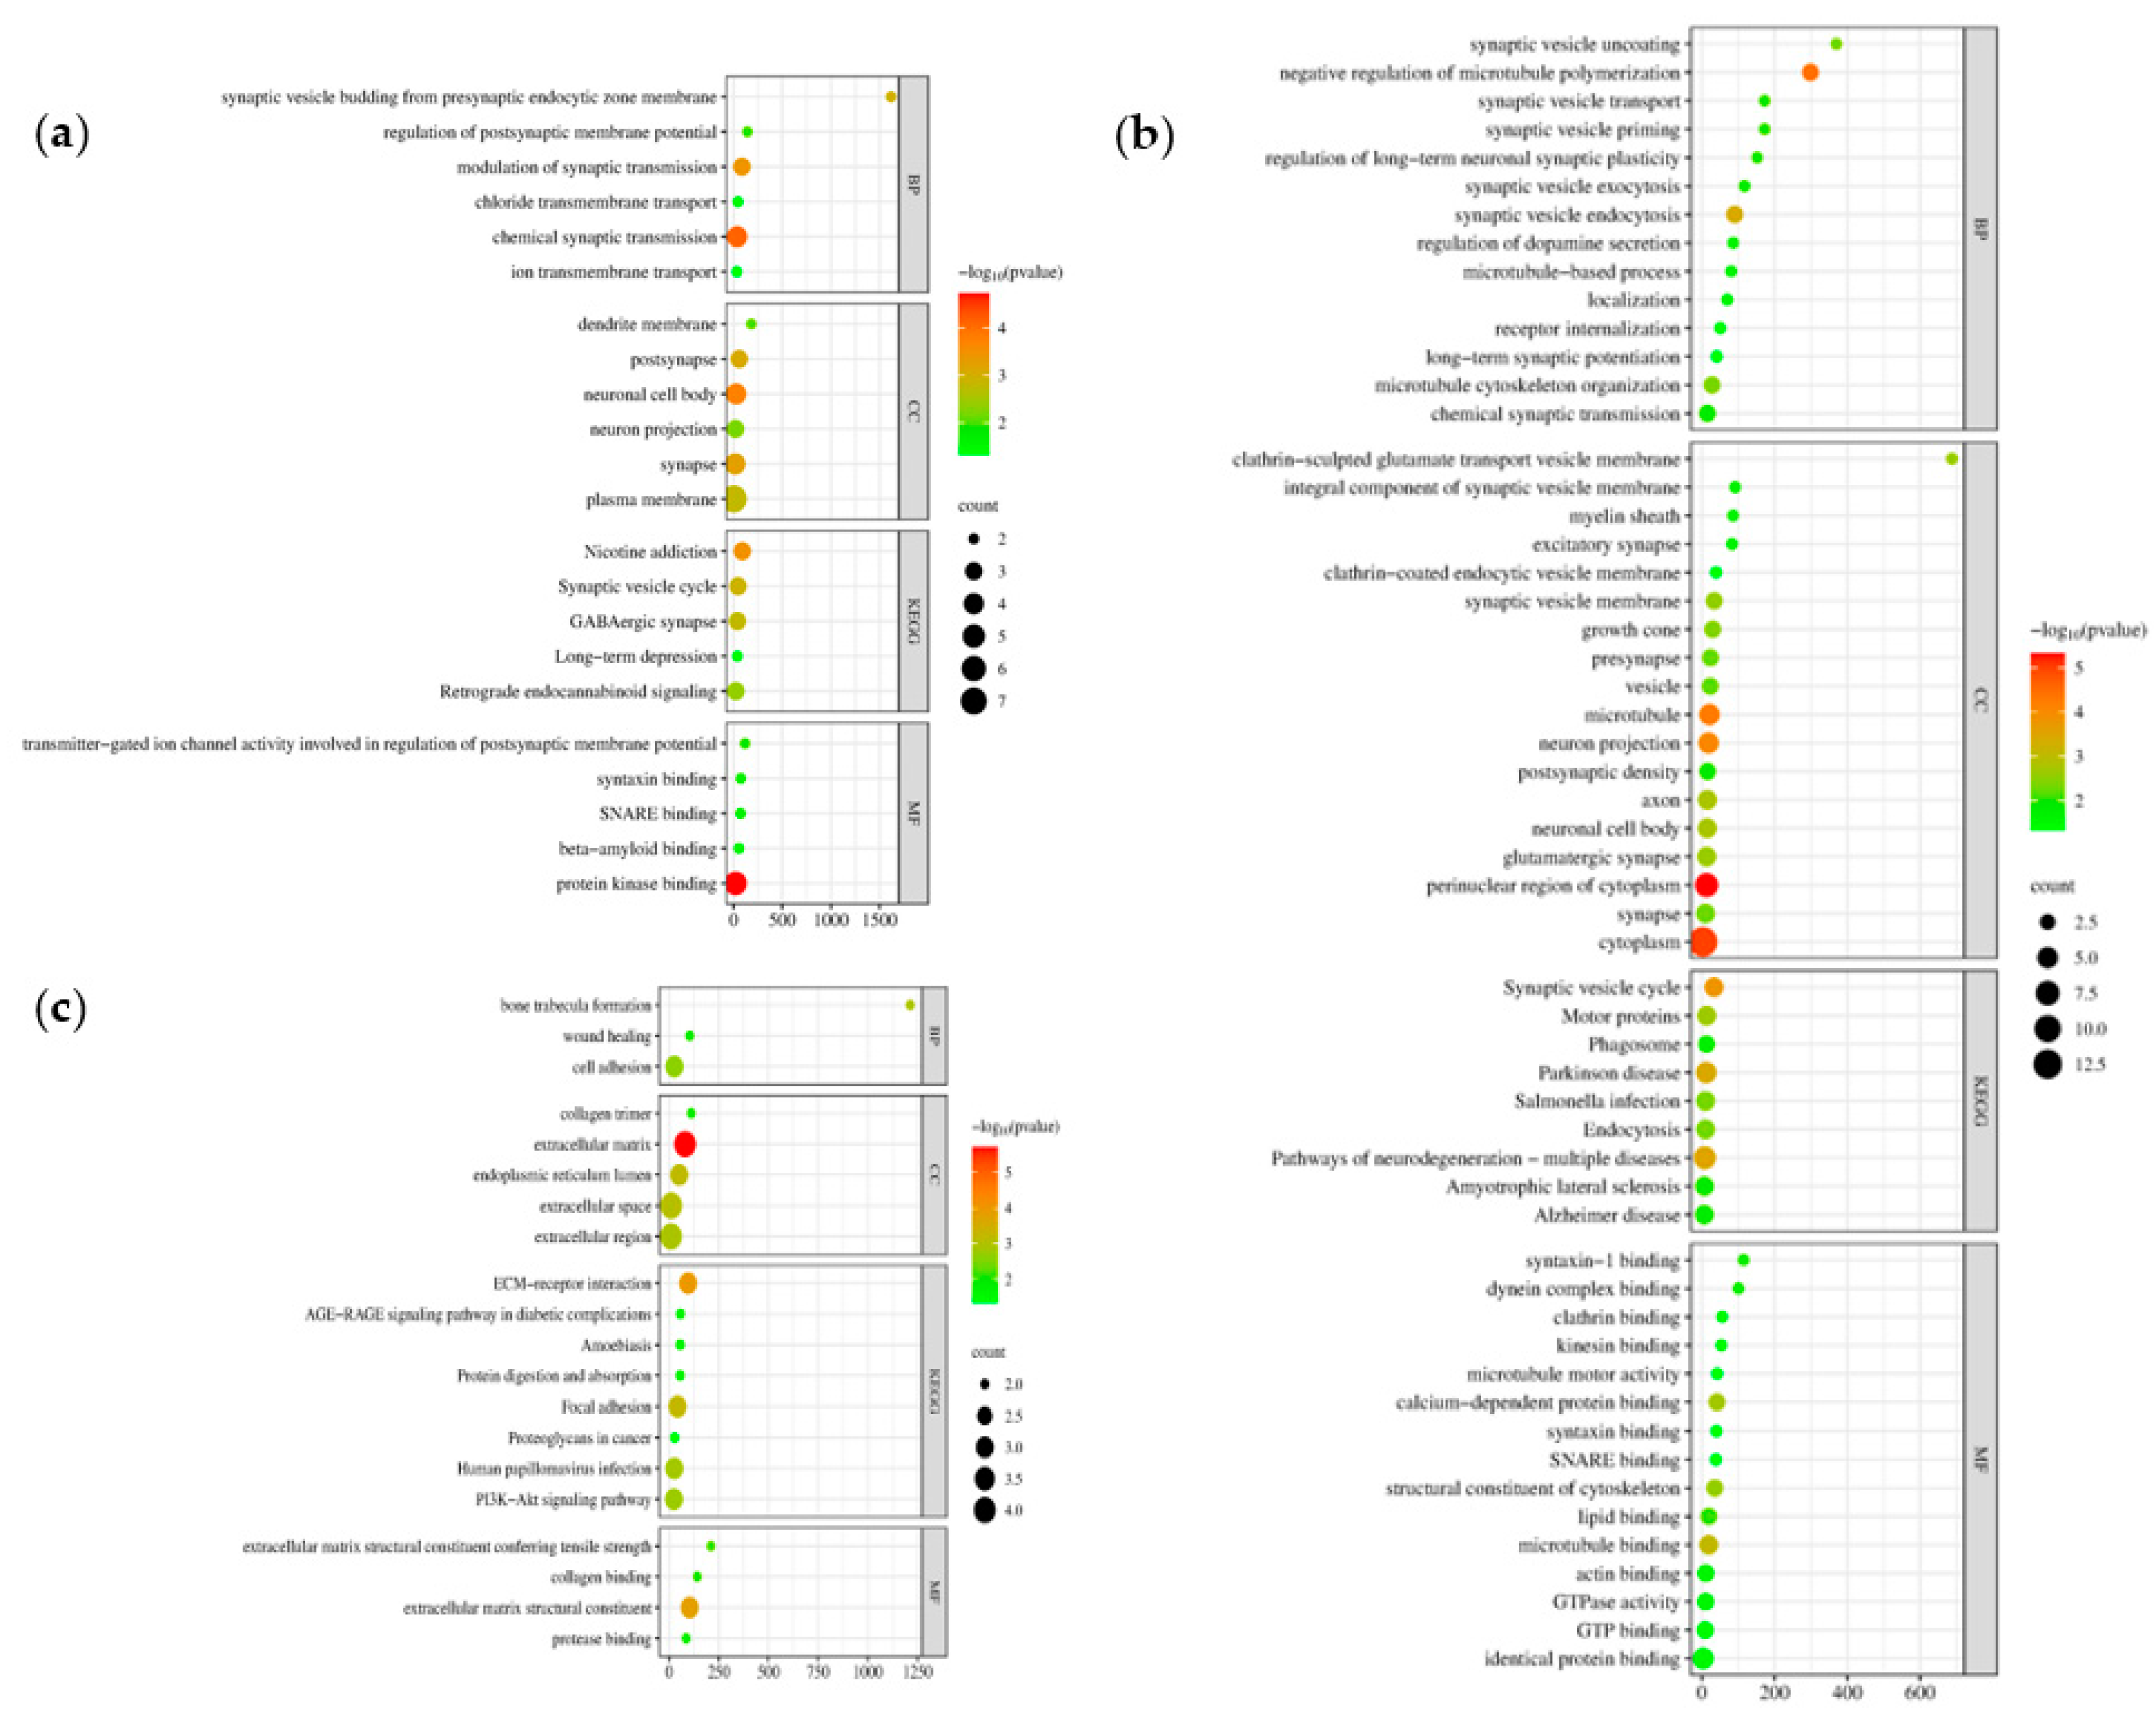
The Gene Ontology (GO) and Kyoto Encyclopedia of Genes and Genomes (KEGG) pathways revealed the biological function of the DEGs through the DAVID database. Here, we identified the GO enrichment analysis of three aspects: biological processes (BP), cell composition (CC), molecular function (MF), and KEGG pathways of the three clusters of modules. Cluster 1 (Figure 7a) and Cluster 2 (Figure 7b) represent the downregulated DEGs while Cluster 3 (Figure 7c) the upregulated DEGs. In the GO BP category, genes from Cluster 1: chemical synaptic transmission, modulation of synaptic transmission, and synaptic vesicle budding from presynaptic endocytic zone membrane, Cluster 2: negative regulation of microtubule polymerization, synaptic vesicle endocytosis, microtubule cytoskeleton organization, and Cluster 3: cell adhesion, bone trabecula formation, and wound healing are mainly involved. The GO CC category suggested plasma membrane, neuronal cell body, and synapse (Cluster 1), cytoplasm, perinuclear region of cytoplasm, microtubule (Cluster 2), extracellular matrix, extracellular space, extracellular region (Cluster 3). In the GO MF, Cluster 1 is observed to have protein kinase binding, transmitter-gated ion channel activity involved in the regulation of postsynaptic membrane potential, and syntaxin binding, Cluster 2 has identical protein binding, microtubule binding, and calcium-dependent protein binding, and for Cluster 3 the extracellular matrix structural constituent, extracellular matrix structural constituent conferring tensile strength, and collagen binding. Finally, KEGG pathways, Cluster 1 genes are highly involved in nicotine addiction, synaptic vesicle cycle, GABAergic synapse, and Cluster 2 suggested that pathways of neurodegeneration - multiple diseases, Parkinson disease, and synaptic vesicle cycle were involved, while for Cluster 3, ECM-receptor interaction, focal adhesion, and human papillomavirus infection are expressed. Enrichment data Figure 7 obtained from DAVID can be accessed in Supplementary Data 5. The different pathways may serve as a criterion for selecting candidate repurpose drugs based on their molecular functions and mechanisms.

3.5. Gene Regulatory Network

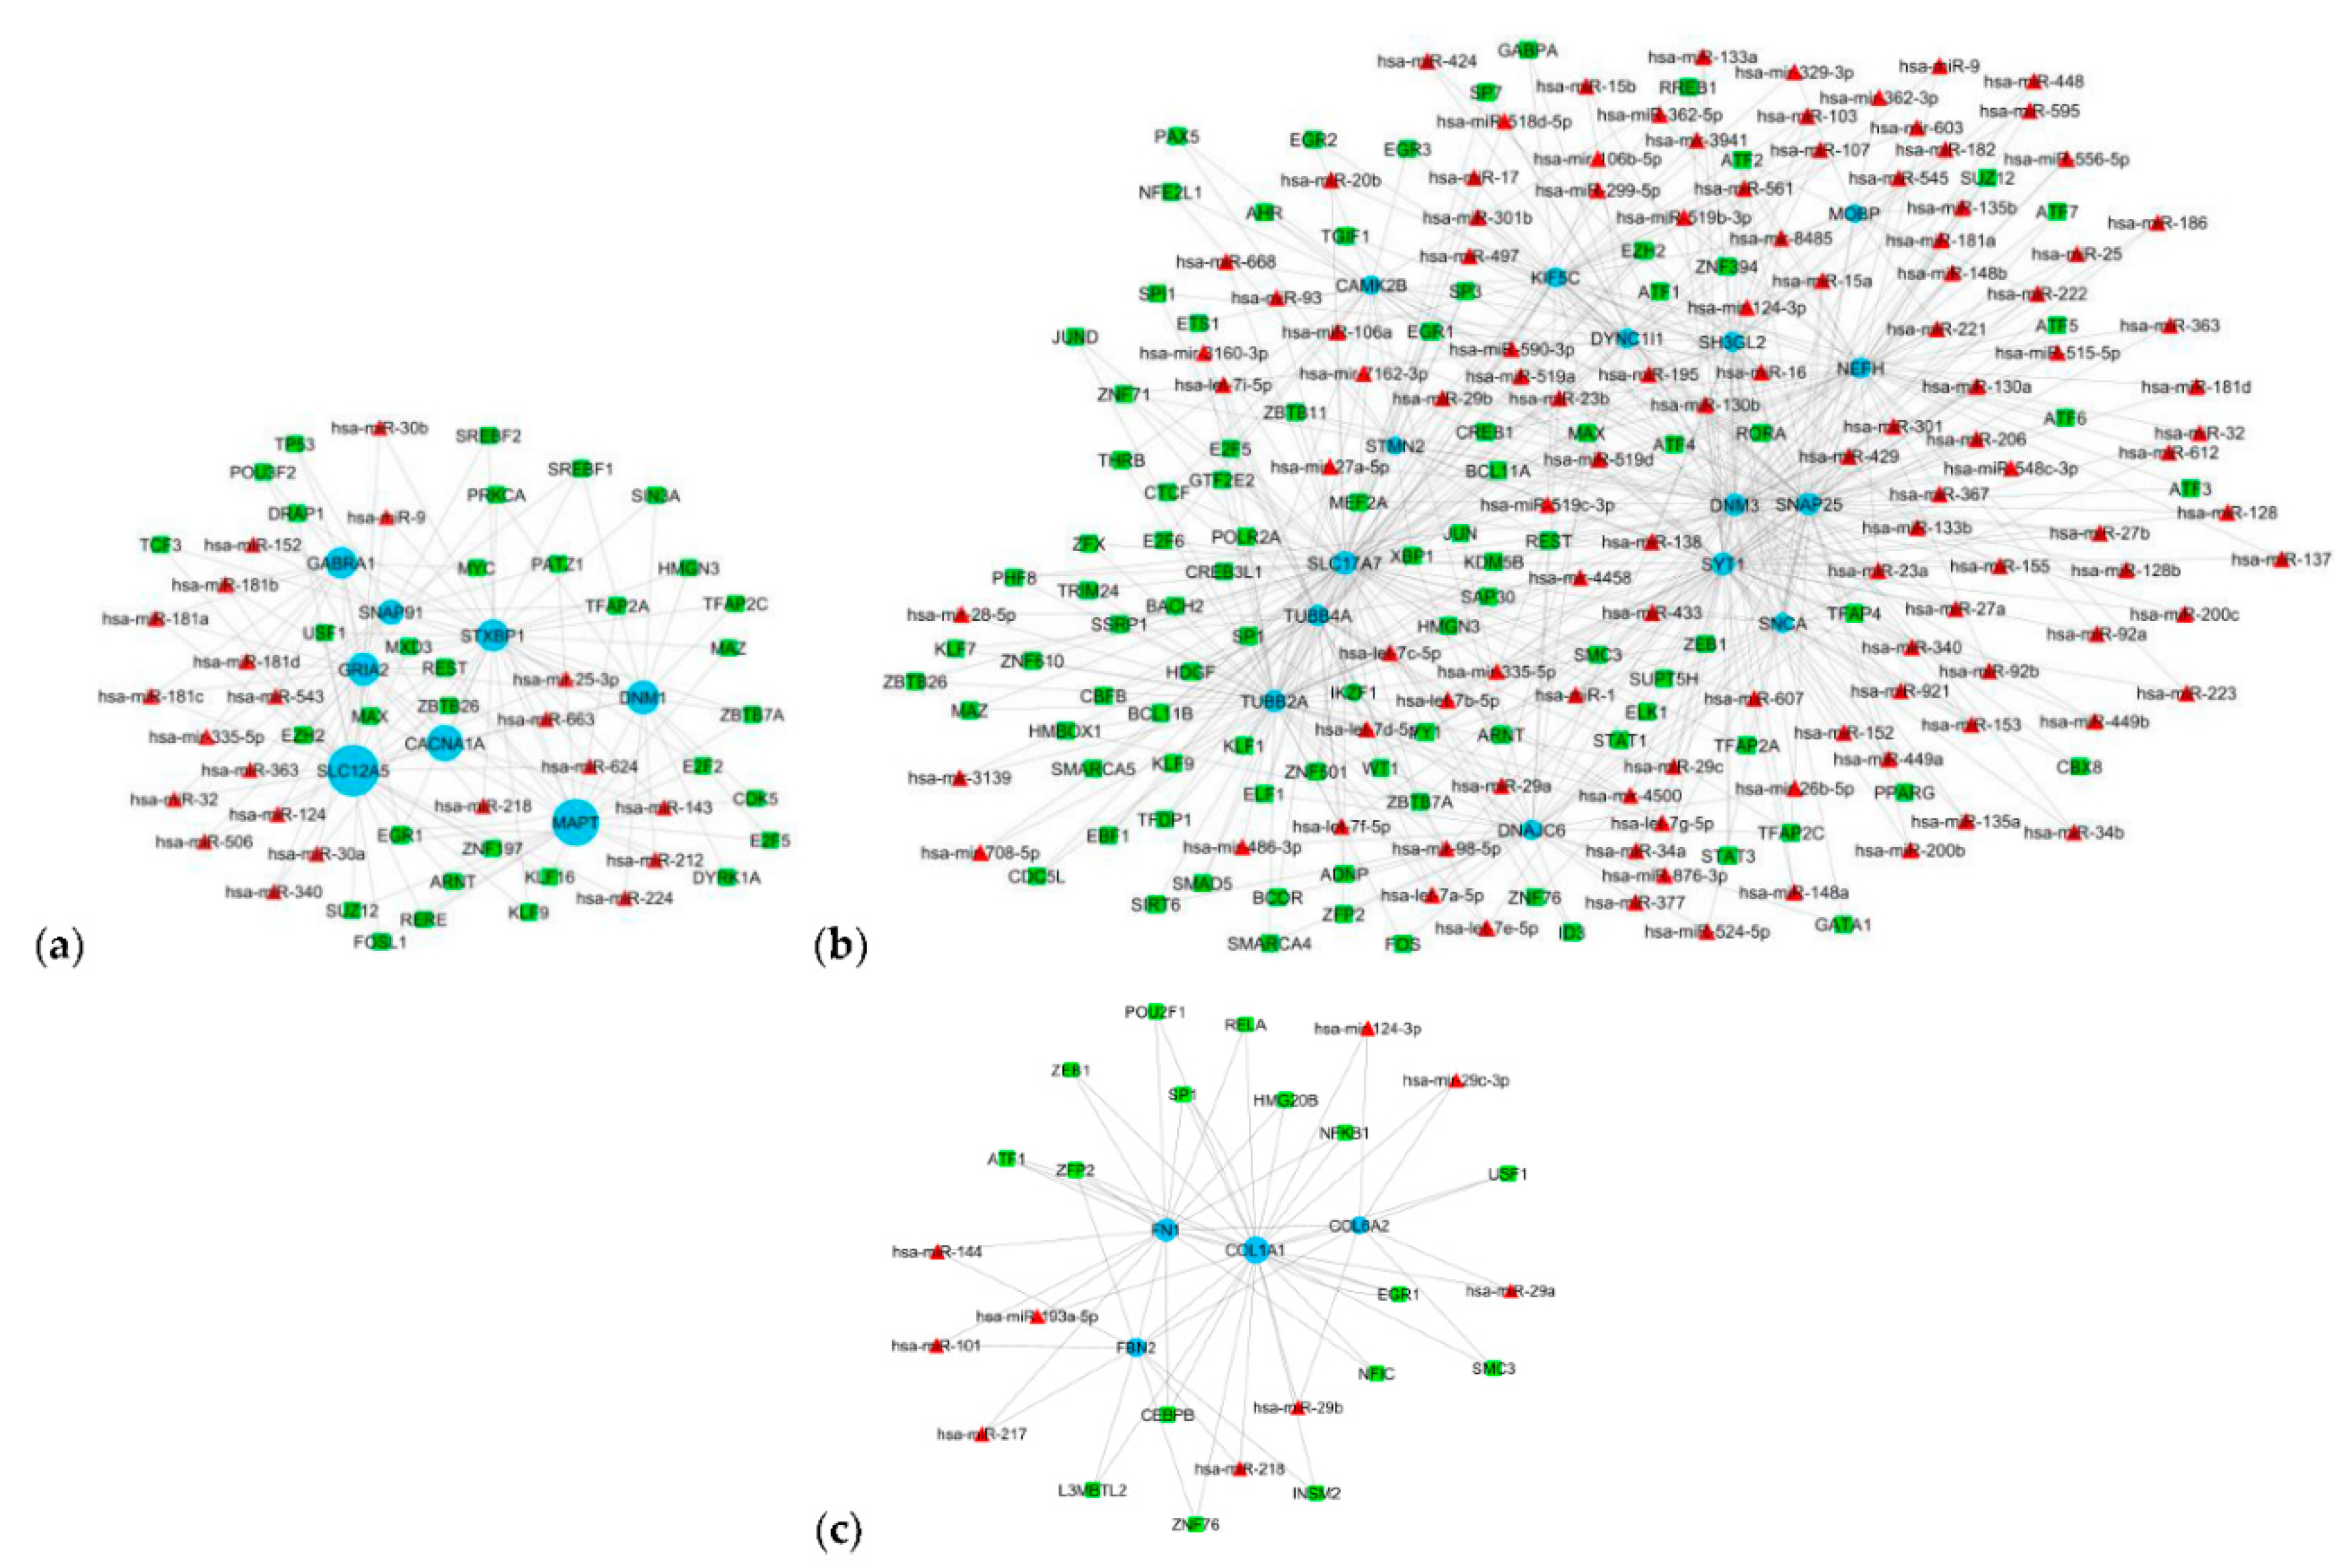
To further understand the hub genes, transcription factors that regulate hub genes. Hub genes, transcription factors, and microRNAs co-expressing, and co-regulating networks were obtained from Network Analysts. The TFs-HDEGs, HDEGs-miRNAs, and TFs-miRNAs networks were reanalyzed in Cytoscape software obtaining a single network in each cluster, TFs-HDEGs-miRNAs co-regulatory network (Figure 8). As observed in Table 5, the transcription factors interact with genes while in Table 6 miRNAs interact with hub genes. TFs with a degree of ≥ 3 are considered significant TFs. Here, we identified 33 transcription factors that interact with HDEGs. Transcription factors are proteins that co-regulate with genes. The common hub genes and transcription factors served as biological targets for treating CNS tumors. As observed in Figure 8a, SLC12A5 has the biggest node, meaning this gene interacts with the greatest number of transcription factors and miRNAs among the cluster genes, followed by MAPT and CACNA1A. Likewise, SLC17A7 has the highest TF and miRNA interaction followed by SYT1 and SNAP25 for Cluster 2 (Figure 8b) while COL1A1, FN1, and FBN2 for Cluster 3. In Cluster 1, eight leading TFs with three target HDEGs were identified, these are: EGR1, EZH2, MAX, PRKCA, REST, SREBF1, TFAP2A, and ZBTB7A. In the case of Cluster 2, five HDEGs interaction was the highest, REST, EZH2, and SP1, are the leading TFs in this cluster. Transcription factor ZFP2 was the lead in Cluster 3, excluding COL6A2 among the four genes in the cluster, see Figure 8c. Among the TFs, EGR1 prompts an interesting presence in all the cluster sub-networks. Aside from the active interaction for each cluster, it is the most HDEG interaction among all the TFs. The presence of high a degree interaction of SLC12A5, SLC17A7, and COL1A1 to transcription factors based on the TFs-HDEGs-miRNAs sub-network suggests that they may play a role in co-regulatory interactions that contribute to tumorigenesis. The topological properties of the networks in Figure 8 can be observed in Supplementary Data 3. Our study may serve as a primary insight to explore the importance of TFs and miRNAs in tumors together with gene regulation.
MicroRNAs (miRNAs) are non-coding RNAs that efficiently regulate post-transcription. Somatic mutations or polymorphisms in messenger RNA caused by miRNAs contribute to cancer progression [86]. Downregulation of suppressor proteins and overexpression of oncogenic proteins leads to abnormal miRNA expression. These cells cell to have high proliferation, invasiveness, and low apoptosis leading to cancer predisposition, initiation, and progression. The miRNAs considered in this study interacting with HDEGs must have at least 3 gene interactions. The leading miRNA, hsa-mir-124-3p, was observed to be present in Cluster 2 (DNM3, KIF5C, TUBB4A) and Cluster 3 (COL1A1, COL6A2), having five gene targets. The has-miR-16 and has-miR-195 may play an important role in DYNC1I1, KIF5C, SH3GL2, SNAP25, and SNCA as the lead miRNAs for Cluster 2. Coregulation miRNA with genes may contribute to further understanding of tumorigenesis in prognosis, diagnosis, treatment, staging, and progression. As observed in Table 6 the miRNAs were considered significant in different clusters. Here, we identified 46 miRNAs that have a gene interaction of more than 2. Cluster 2 has the most miRNA interaction while Cluster 3 has the least with only 2 interactions observed highest in the network. Co-regulatory effects of miRNA may serve as a turning point to further understand molecular mechanisms of tumor development and progression.

3.6. Drug repurposing candidates

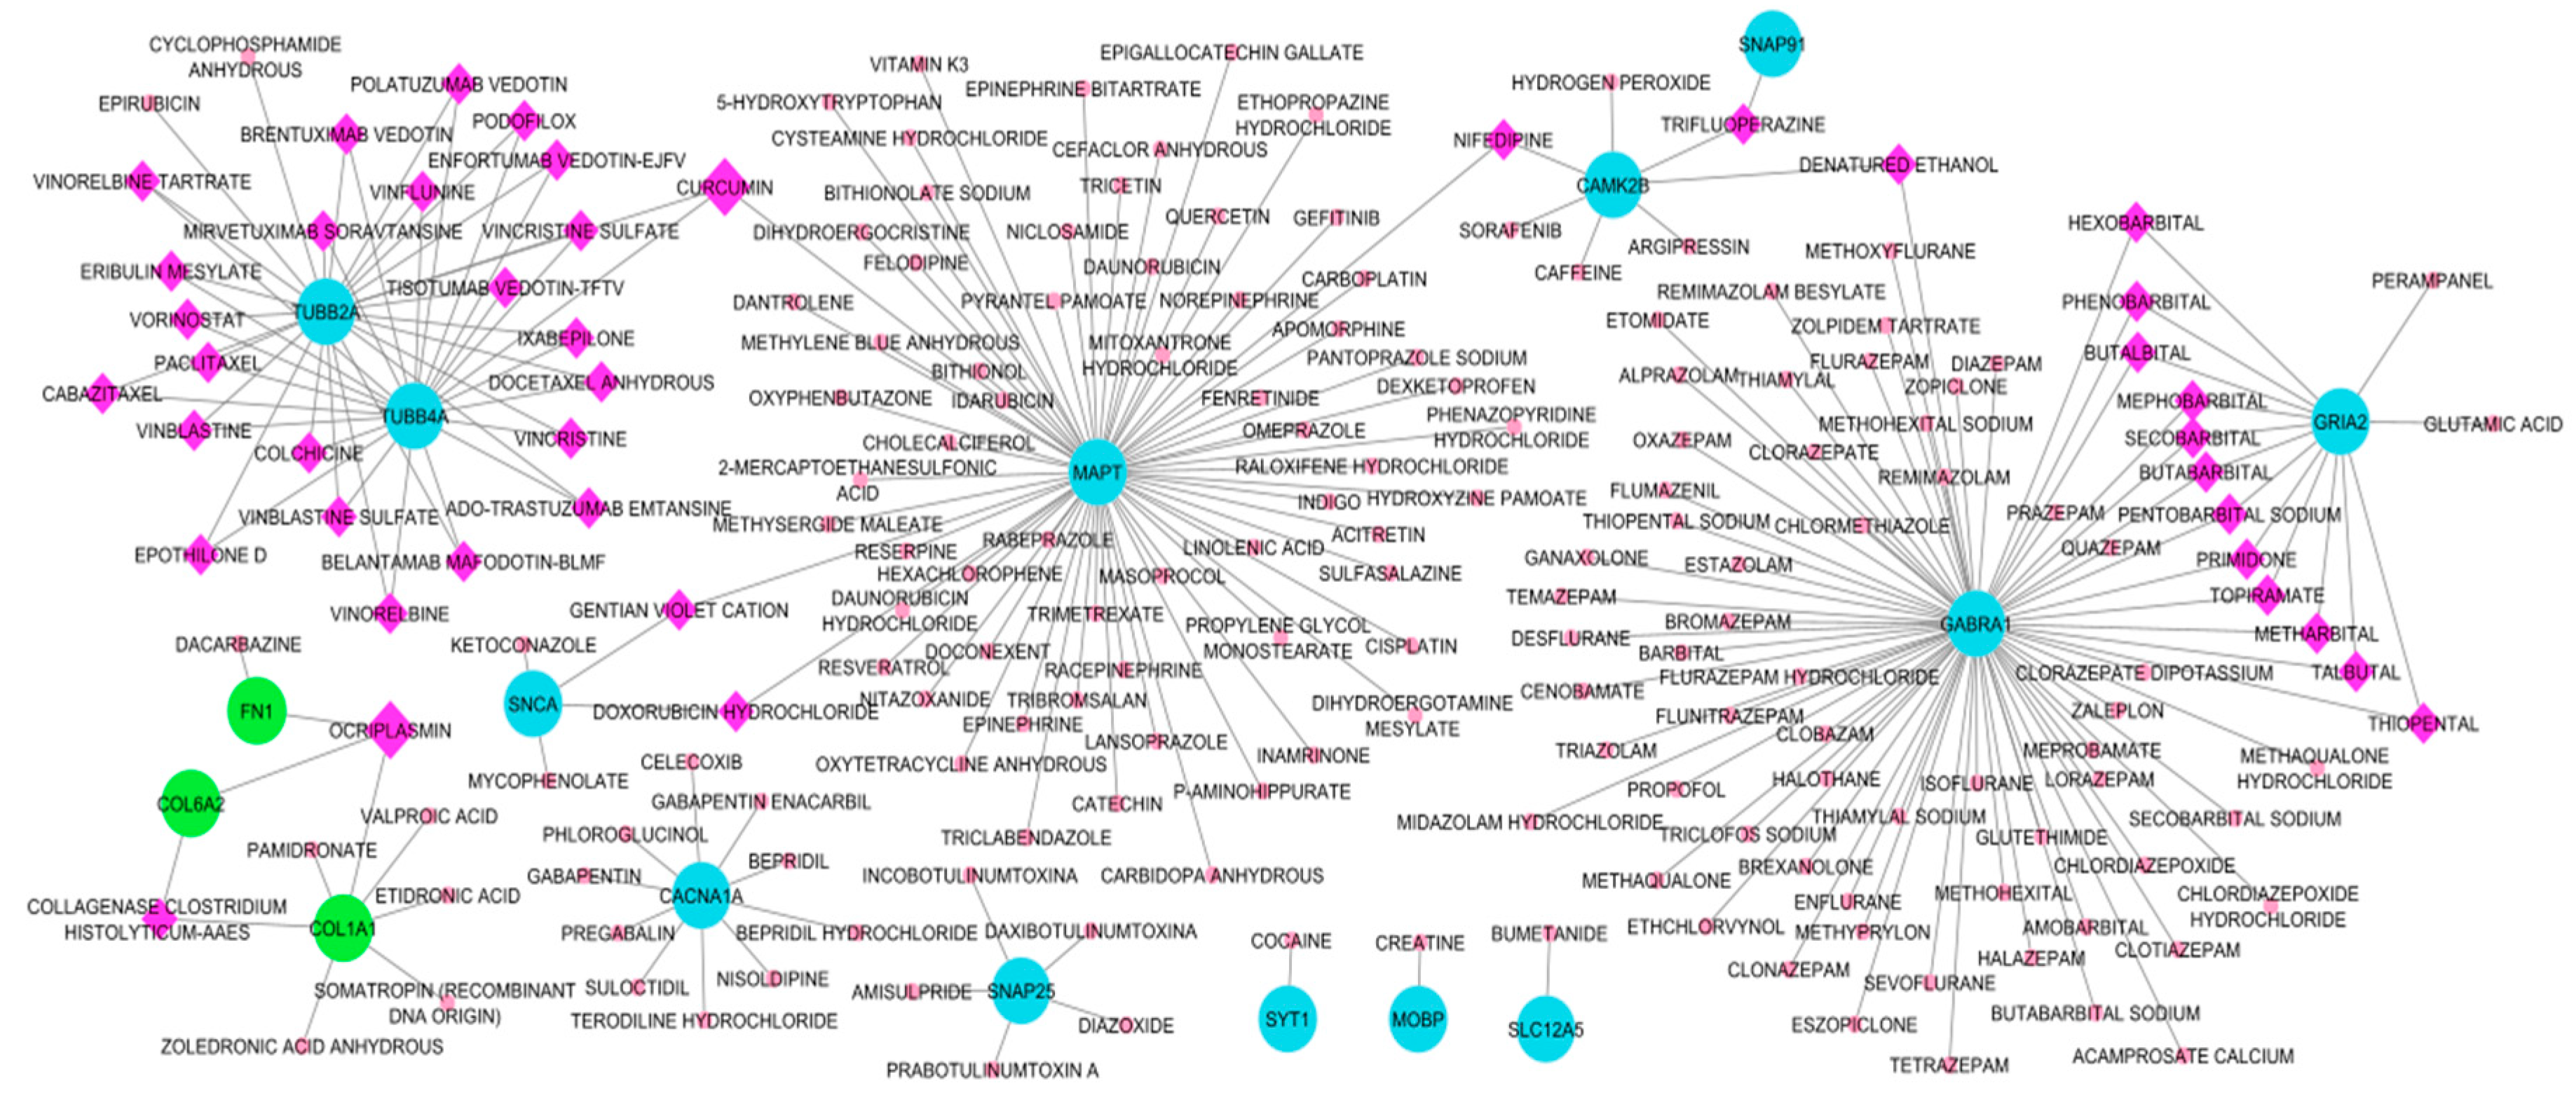
3.6.1. Drug-Hub Differentially Expressed Genes Network

Drug candidates for the hub DEGs were identified with the DGIdb database that outsources from 22 other cancer-specific sources or drug interaction databases. Candidate drugs were then selected based on the regulatory approval and only approved drugs were selected for the drug-gene network reconstruction. Here, we have identified two drugs that interact with three target genes, see Figure 9. Drug candidates are ocriplasmin and curcumin. Ocriplasmin interacts with three upregulated HDEGs: FN1, COL6A2, and COL1A1. Curcumin interacts with three downregulated HDEGs: MAPT, TUBB2A, and TUBB4A. In the search for drugs, Cluster 1: CACNA1A, GABRA1, SLC12A5, GRAI2, MAPT, SNAP91, Cluster 2: CAMK2B, TUBB4A, SYT1, SNCA, SNAP25, TUBB2A, MOBP, and Cluster 3: FN1, COL1A1, and COL6A2 were the HDEGs that has a drug hit based on DGIdb. Furthermore, DNM1, STXBP1, NEFH, STMN2, SLC17A7, KIF5C, DYNC1I1, SH3GL2, DNAJC6, DNM3, and FBN2 have no potential target as the database resulted in zero interaction. Cluster 1 HDEGs have the most genes that have drug interaction, GABRA1 with 72 drug interactions followed by MAPT, 65, then GRIA, 14. In Cluster 2, TUBB2A and TUBB4A had 26 and 24 drug interactions. Cluster 3, COL1A1, has 7 drug-identified interactions. Among HDEGs with drug interaction, SYT1, MOBP, and SLC12A5 had only one matching interaction. See Figure 9 for the Drugs-HDEGs network and Table 7 for the candidate repurposed drugs. Drug-gene interaction retrieved from DGIdb can be accessed in Supplementary Data 4 together with the topological properties of the Drug-HDEGs network. The two drugs with high gene interactions still require further validation before proceeding in use as an ani-tumor on the brain. Other candidate drugs with specific gene interactions may also be explored for their potential in tumor treatment. Currently, surgery is the leading tumor treatment, however, due to metastases and reoccurrence drug treatment may be useful.

3.6.2. Drug-Transcription Factors Networks

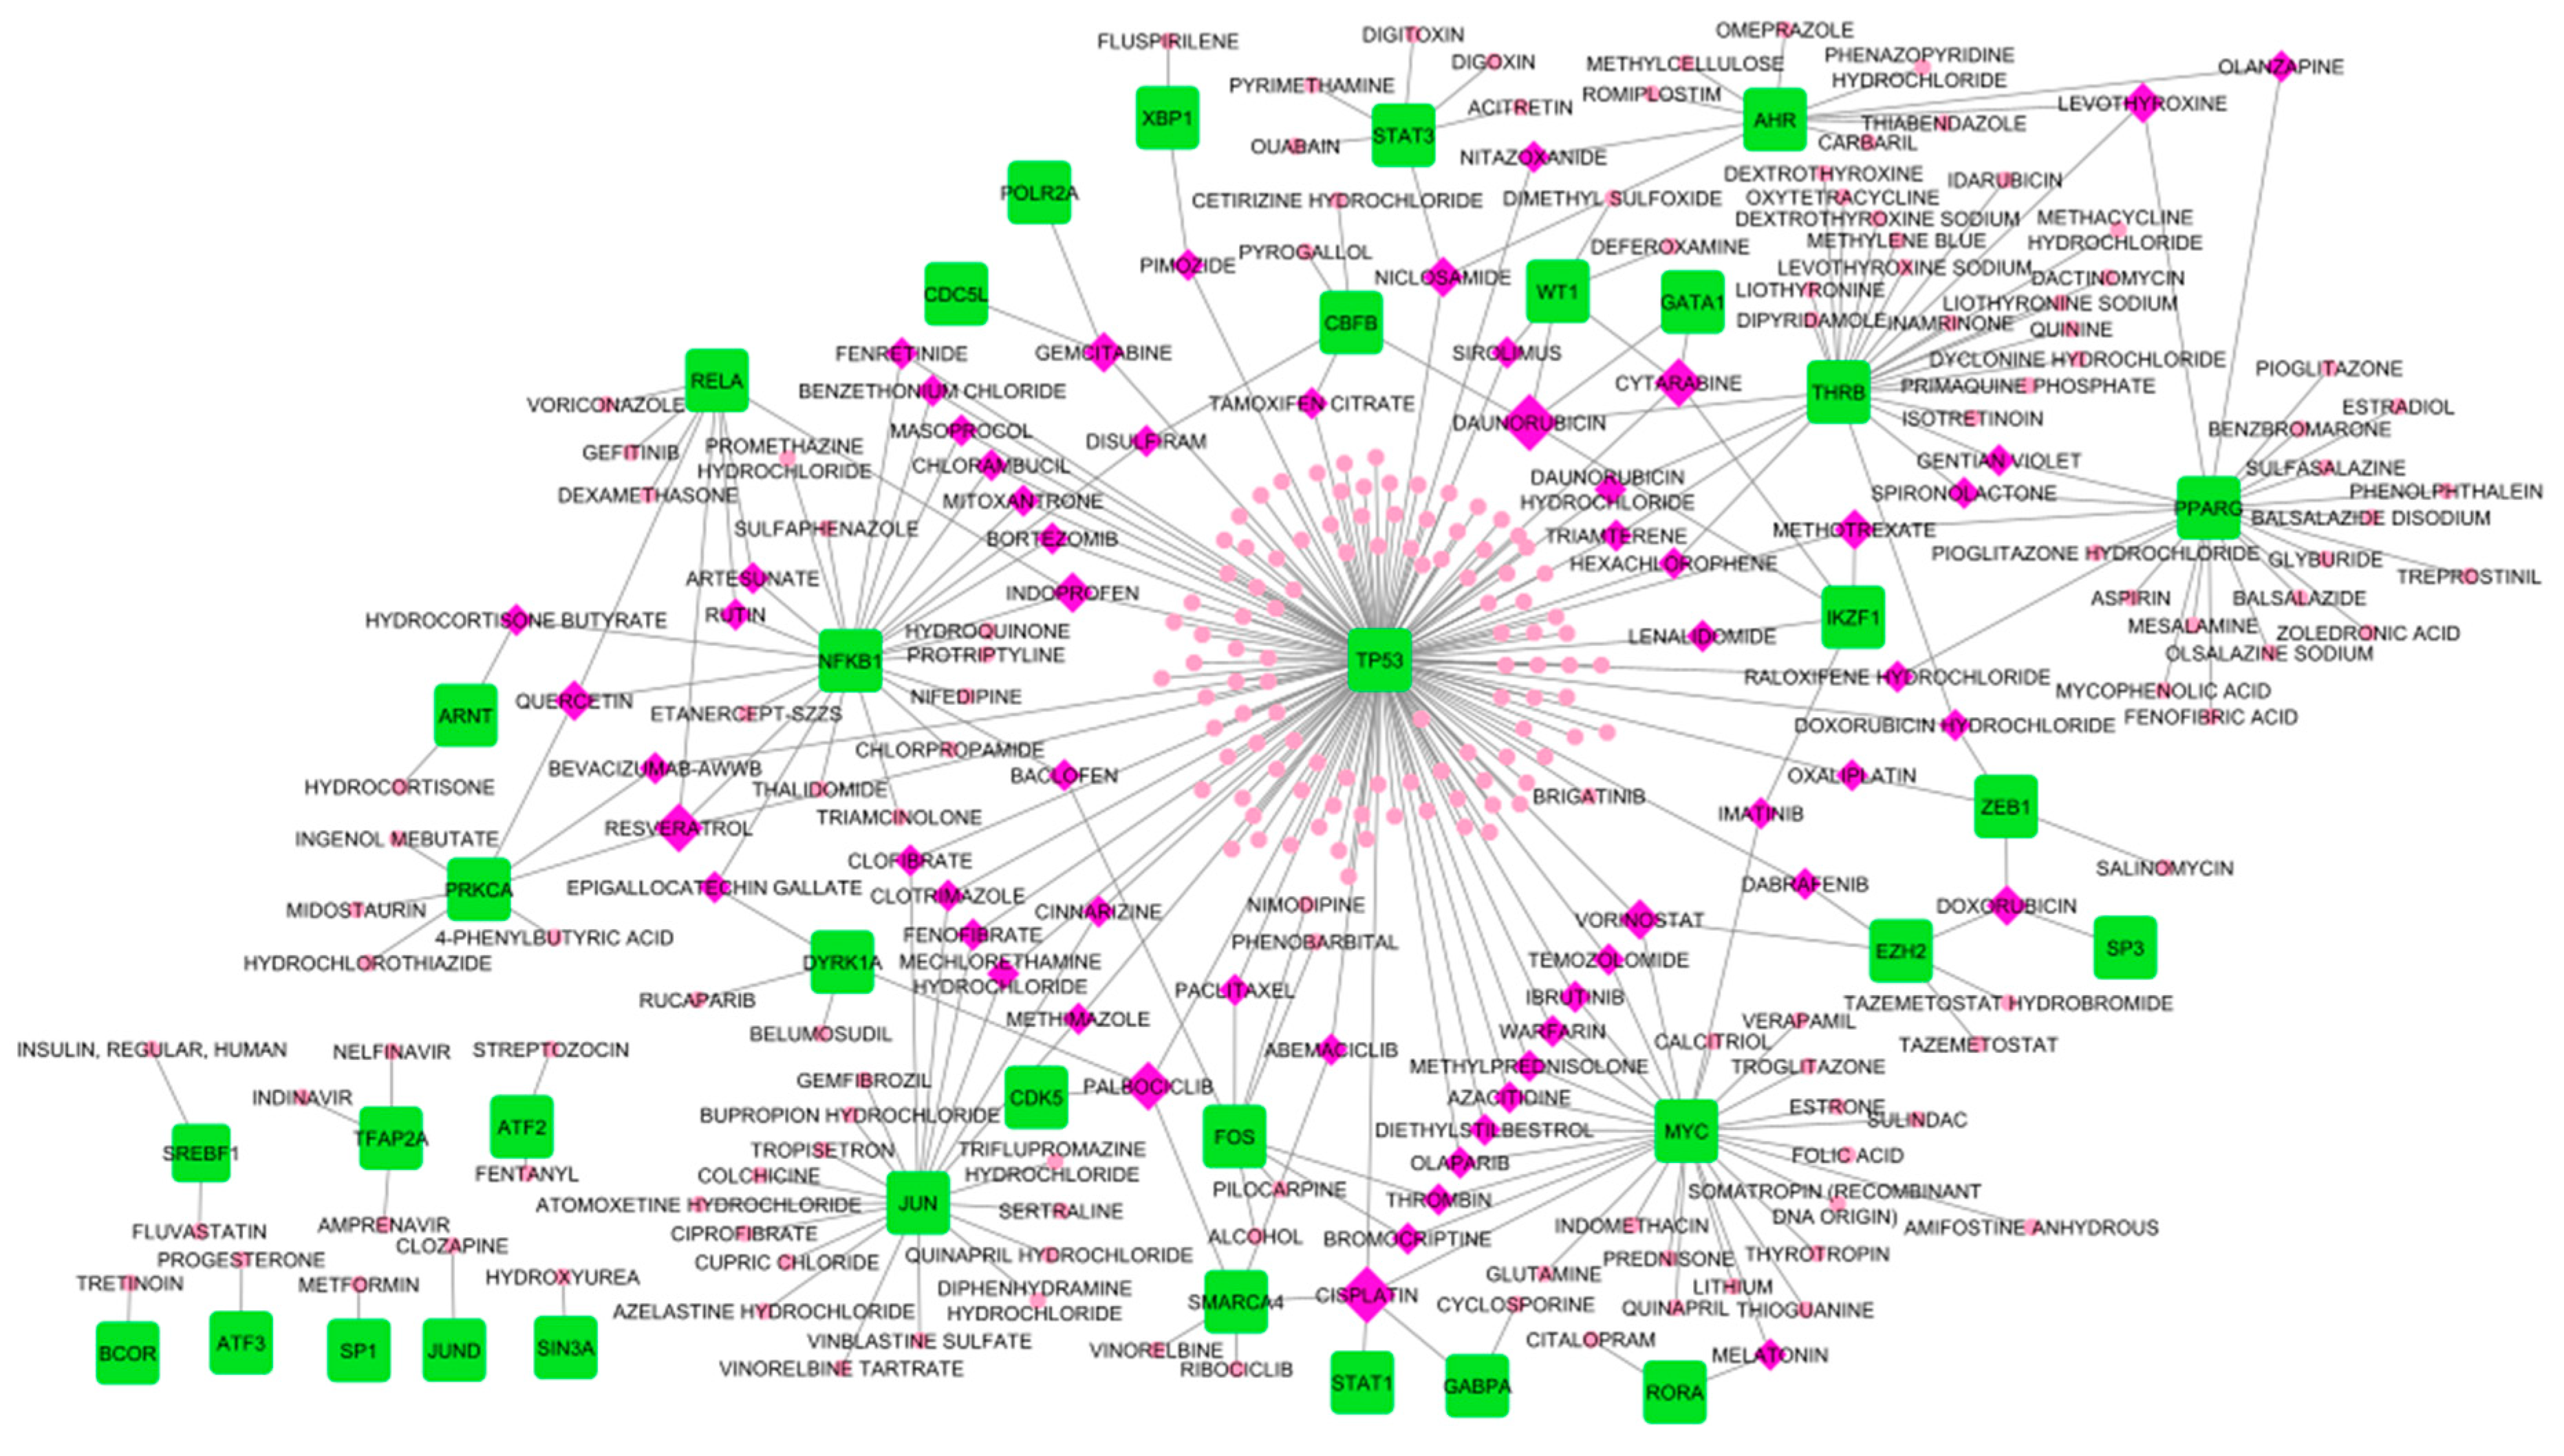
Transcription factors are regulatory proteins that efficiently control the gene expression that molds cell proliferation and homeostasis. In CNS tumors, several TFs have been identified to contribute to the progression of gliomas [87]. Here, we identified TFs that interact with the Hub DEGs through the Network Analys web tool and reconstructed a co-expression network. The identified TFs were then used for the Drug-TFs network to identify potential drugs. As observed in Figure 10, TP53 has the most drug interaction with 146 identified potential drugs. MYC, THRB, NFKB1, PPARG, and JUN had varying drug interactions between 20-28. Among the TFs, the least drug interaction was BCOR, ATF3, SP1, JUND, and SIN3A. In this study, daunorubicin and cisplatin drugs have the highest TF interaction both scoring five. Cisplatin interacts with SMARCA4, STAT1, GABPA, MYC, and TP53 while daunrubicin interacts with CBFB, WT1, GATA1, THRB, and IKZF1. Aside from the two leading drugs, drugs with four TF interactions were also promising repurposed candidates, these drugs were, palbociclib, cytarabine, and resveratrol. For the drugs with at least three TF interactions: vorinostat, methotrexate, doxorubicin, gemcitabine, doxorubicin hydrochloride, niclosamide, levothyroxine, indoprofen, and quercetin. See Figure 10 for the Drugs-TFs network. Table 8, the list of drugs that were considered significant due to interaction with more than two TF. Cisplatin, resveratrol, doxorubicin hydrochloride, niclosamide, quercetin, and vorinostat are candidate drugs that also interact with certain HDEGs. To consider drugs that interact with both the TFs and HDEGs, we considered an additional 16 drugs (Table 9). In considering candidate repurposed drugs, we only selected the drugs with more than two degrees of interaction. Candidate drugs for TFs obtained from DGIdb can be accessed in Supplementary Dat 4 together with the topological properties of the Drug-TF network. Moreover, drugs with single or two interactions may still be considered candidates for repurposing, however, further validation may be required.

3.7. MicroRNA families

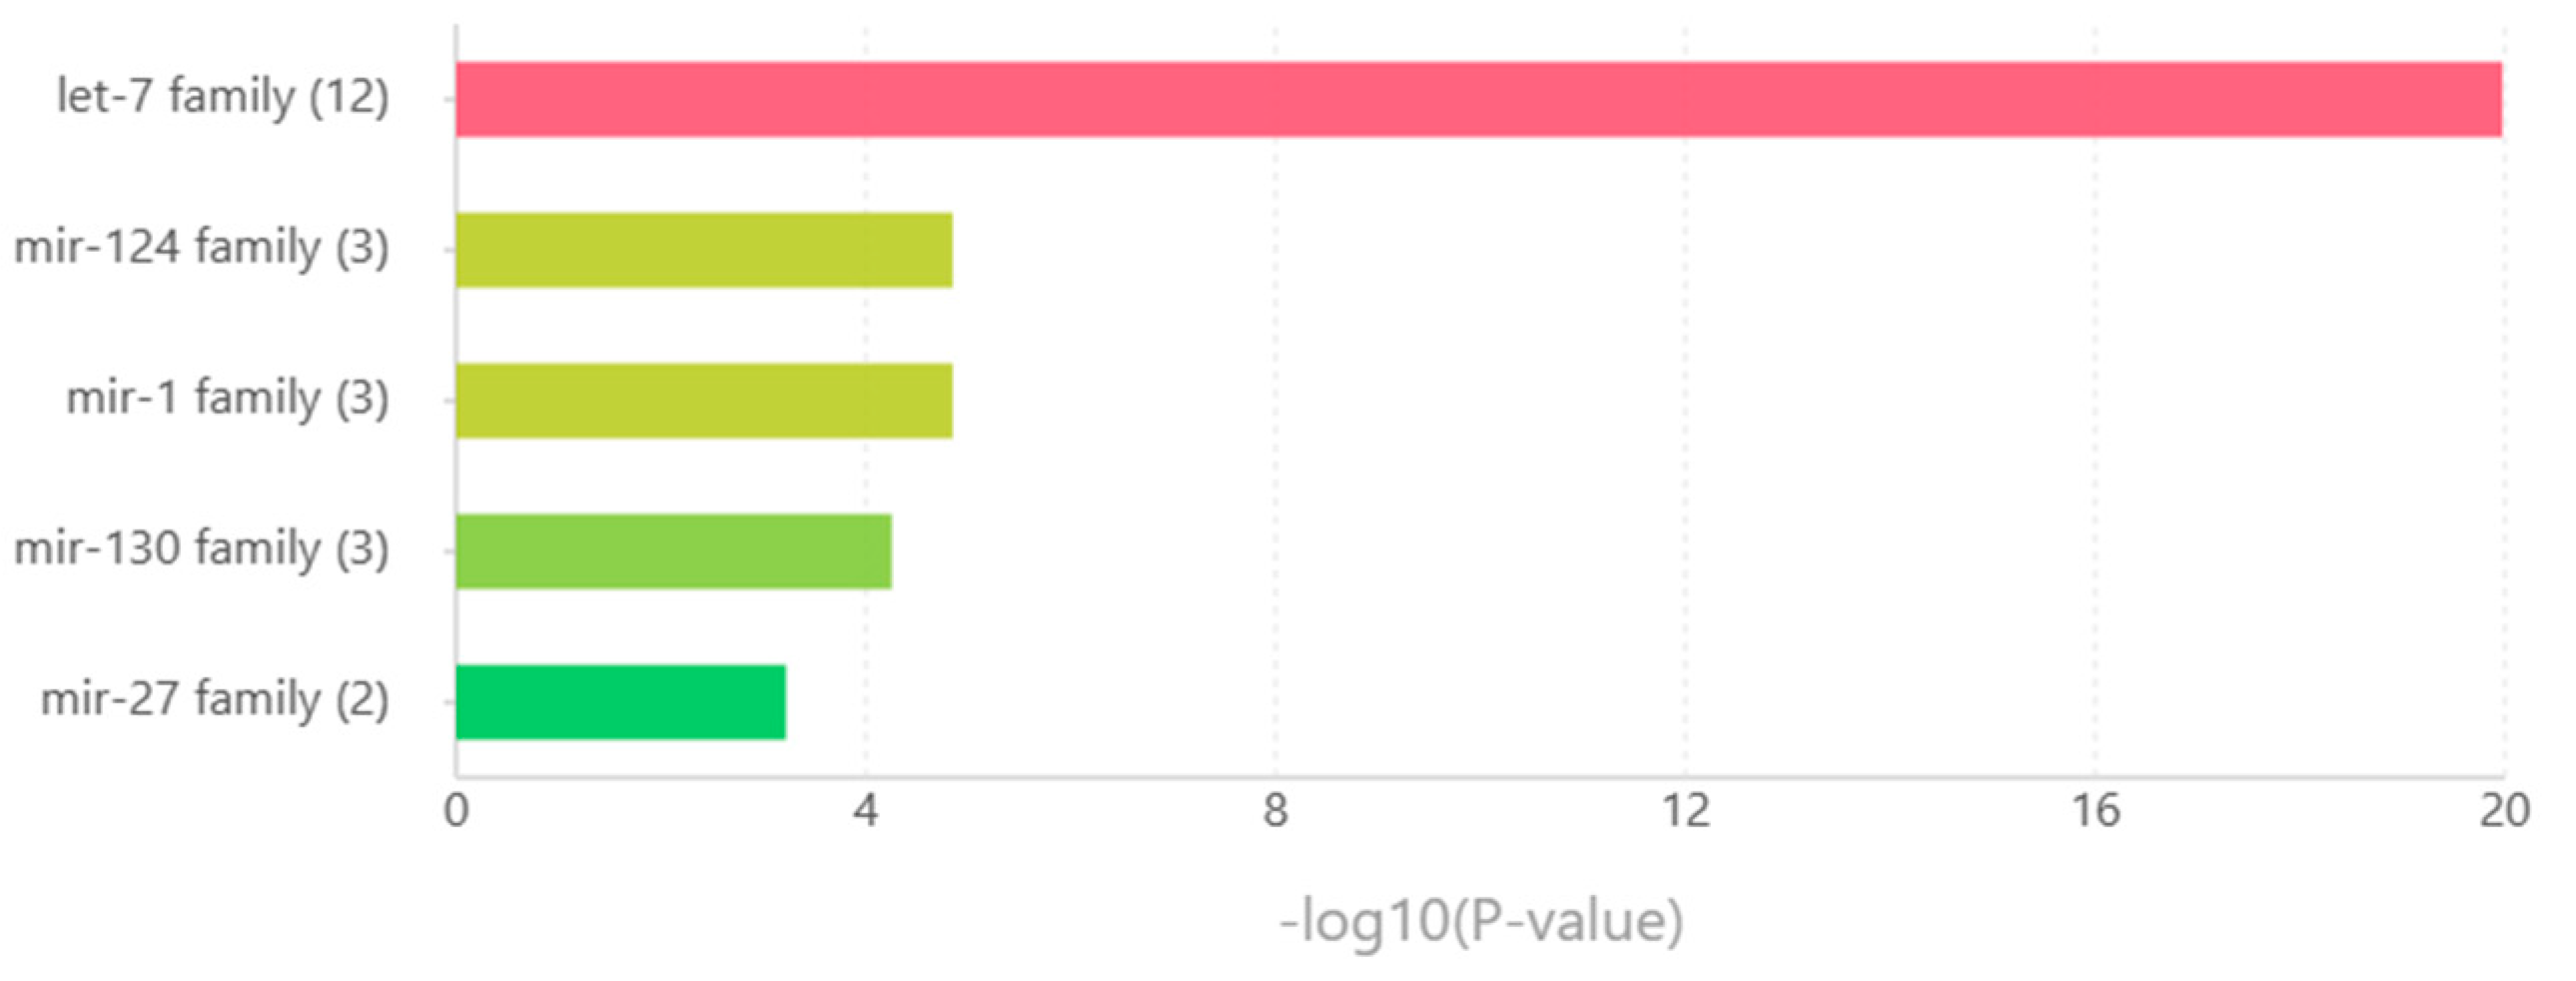
The five leading miRNA families were identified through the TAM online tool. The let-7 families were led with twelve miRNAs involved, followed by miRNA families mir-124, mir-1, and mir-130 with three miRNAs. The least in the five miRNA families considered was mir-27 with two miRNAs and the highest -log10(P-value) amount in the families with two miRNAs involved. Observed in Table 10 the miRNA families and the miRNAs belonging to the said family. Figure 11 displayed the -log10(p-value) graph that was enriched in the considered miRNAs. It is interesting to speculate that these miRNA families may play a role in tumorigenesis.

3.8. Gene set enrichment analysis and connectivity map for drug validation

To validate the proposed candidate drugs, CMAP analysis was utilized. The 32 drugs considered in this study were validated through the Enrichr CMAP database. Through CMAP Up and CMAP Down, the regulatory effect of the drug on the gene set was identified. Here, 14 drugs were validated by the CMAP. As observed in Table 11, the thirteen validated drugs and their corresponding regulatory effect on the genes. Vorinostat has the highest genes to upregulate while colchicine suppressed three genes. The following drugs were validated based on their regulatory response on the genes, however, the toxicity of drugs was not considered. Further drug validation may be required before using them as anti-tumor drugs.

4. Discussion

Microarray expression profile is a technique to identify the behavior of genes. It has been used to compare diseased tissue samples to normal. Tumor samples are commonly used to extract RNAs, through reverse transcription RNAs are converted to DNA and used in DNA microarray chips. Expression profiles provide insights into the behavior of the tumor based on clinical samples. Here, we used DNA microarray datasets with surgically removed tumor samples to identify genes that are behaving differently when compared to normal or non-tumor samples. The datasets were GSE66354, GSE68848, GSE74195, and GSE43290 which are publicly available in the NCBI GEO database. To identify genes behaving differently, also known as, differentially expressed genes, we used an online web tool, such as GEO2R. GEO2R uses R packages from Bioconductor projects based on the R computing language. Based on the clinical classification of the tumor samples we were able to compare the gene expressed on each tumor type. However, in this study we did not perform the sampling collection, RNA extraction, and microarray expression, instead, we utilized openly available microarray datasets.
The use of the computational approach has been growing in popularity due to the shorter time frame it requires to understand diseases in terms of prognosis, diagnosis, screening, therapeutics, and treatment. Gene co-expression network analysis has been a growing trend for understanding molecular biology and the characteristics of certain diseases. It has been used to identify important genes that may serve as biomarkers and specific molecular targets for treatment [37,88]. Further, CNS tumors have become the primary tumor emerging in pediatric patients [17,27,60,89]. CNS tumors are often associated with debilitating diseases or conditions, such as seizure, stroke, brain edema, severe headaches, mental disorders, neurocognitive impairment, and ultimately cancer [7,90,91]. Glioblastoma multiforme is a terminal brain cancer that is often the result of the metastasis and malignancy of high-grade CNS tumors such as astrocytoma and oligodendroglioma [18]. Other malignant brain tumors include CNS lymphoma, ependymoma, medulloblastoma, and meningioma. Molecular biology in understanding CNS tumors is still infancy due to the continuous surface of new types and subtypes with increasing cases each year [3,13]. In this present study, gene co-expression analysis of PA, ACM, ODG, GBM, EPN, MED, MEN, ATRT, and PNET tumors, using four NCBI GEO expression profiles to investigate common differentially expressed genes between the tumors and identify candidate repurposed drug for the preserved genes and their co-regulating transcription factors. In this study, we highly utilized web tools and online databases to ease the analysis and provide a unique computational approach for drug repurposing strategy against CNS tumors.
Table 4 displays the fourteen hub genes identified from common differentially expressed genes in GSE66354, GSE68848, GSE74195, and GSE43290 when we compare the tumor group and normal tissue samples. The shared differentially expressed genes were utilized for co-expression network, we've identified 10 upregulated (CACNA1A, DNM1, GABRA1, GRIA2, MAPT, SLC17A7, SNAP25, SNAP91, STXBP1, and SYT1) and 4 downregulated (COL1A1, COL6A2, FBN2, and FN1) hub DEGs. Voltage-gated calcium ion channels, such as CACNA1A, have been associated with cell proliferation, differentiation, apoptosis, and metastasis. CACNA1A was reported to be significantly downregulated in brain tumors such as GBM, AA, ATRT, PNET, MED, ODG, and ACM, where it served as a tumor suppressor gene. Moreover, CACNA1A was reported to be downregulated in colorectal, esophagus, gastric, and breast cancer [92]. DNM1 has been associated with epileptic encephalopathy patients, particularly the Arg237Trp variant [93]. It was also validated for its liked to several cancer-related pathways and positive correlation with Neutrophils, Tregs, NK cells, and macrophage infiltration in colon cancer [94]. Neurotransmitters have been linked to cancer cell proliferation. The downregulation of the neurotransmitter receptor gene, GABRA1, was reported to be associated with GBM and a positive prognosis of low-grade glioma with a negative correlation on genes responsible for immune response and inflammation [95]. In the coculture of neurons and brain metastases tumors, neurotransmitter receptor genes, such as GRIA2, were observed in early expression in breast and lung tumors [96]. GRIA2 was also reported to be downregulated in chemosensitive and chemoresistant advanced serous papillary ovarian adenocarcinoma and a promising prognosis of patients [97]. In MAPT gene expression, it was determined that upregulation increases the survival rate of patients with low-grade glioma [98]. Therefore, the downregulation of MAPT contributes to the malignancy of the tumor. In experimental validation on protein and RNA levels, SLC17A7 was reported to act as a bivalent tumor suppressor gene in GBM when compared to normal brain tissues. SLC17A7 also inhibits cell proliferation, migration, and invasion of GBM [99]. Likewise, SNAP25 inhibits carcinogenesis of glioma by fostering control in glutamine metabolism and regulating glutaminase expression [100]. Downregulation of SH3GL2 and SNAP91 in GBM was reported and inversely correlated with glioma grades [101]. Like DNM1, STXBP1 was reported an association with encephalopathies, however, studies involving CNS tumors and cancer were lacking [102]. Dysregulation of the SYT1 leads to severe neurodegenerative impairment as reported in the literature [103]. COL1A1 and COL6A2 have been reported to cause infiltration of CD4 + T and CD8 + T cells, neutrophils, macrophages, and dendritic cells in low-grade brain tumors and gliomas [104,105]. FBN2 is known to contribute to connective tissue disorders due to matrix sequestering of the transforming growth factor-β (TGF-β) family. TGF-β activation contributes to tumor angiogenesis and carcinogenesis. FBN1 was reported to have higher binding affinity compared to FBN2, therefore, investigating FBN1 on brain tumors in future studies is promising [106]. FN1 was reported expressed in glioblastoma and low-grade glioma through the bioinformatics approach, it is important in metastasis and malignancy of tumors [107]. Based on the literature, the downregulated genes that we have identified have tumor-suppressing behavior while the upregulated genes are involved in pathways that contribute to tumor progression. It is interesting to speculate that switching the regulation of these genes may change the tumor behavior to further suppression.
In each nine tumors, we compared them against normal brain tissues to identify the differentially expressed genes. Table 12 displays the five most upregulated and downregulated upon comparison while in Figure A4 are the volcanic plot on each tumor. GABRA1, SLC12A5, and SNAP25 hub genes that were downregulated based on the co-expression network, appeared to be associated with certain CNS tumors. The GABRA1 and MFSD4A genes displayed a downregulation for ACM, ODG, and GBM or the gliomas while TOP2A was observed to be upregulated. Astrocytoma and oligodendroglioma shared upregulation of SOX4 and HES6 while RGS4 was downregulated. Oligodendroglioma and glioblastoma were observed to share the NDC80 (upregulated) and GJB6 (downregulated) genes. In astrocytoma and glioblastoma, both were observed to have CACNG3 downregulation. Interestingly, medulloblastoma, primitive neuroectodermal tumor, and meningioma shared the downregulation of the MBP gene. PNET shared upregulation of COL1A1 with medulloblastoma while downregulation of SNAP25 with meningioma. Surprisingly, ependymoma was observed to share downregulation of SL12A5 with pilocytic astrocytoma and SV2B with ATRT. PA and ATRT shared two downregulated genes, PACSIN1 and GJB6. VSNL1 appears to be suppressed in ATRT, medulloblastoma, and oligodendroglioma. The TOP2A gene was observed to be active in four CNS tumors, such as ATRT, ACM, ODG, and GBM. In literature, TOP2A over-expression was observed to contribute to radioresistance in medulloblastoma patients [108]. Likewise, in glioma patients, TOP2A is highly expressed [109]. Our study suggests that TOP2A may have an oncogenic role in CNS tumors. GJB6 was found to be suppressed in ATRT, PA, ODG, and GBM. It is known to produce connexin 30 mainly plays a role in nervous system cells, which might suggest the correlation of CNS tumors with neurodegenerative diseases and their debilitating effects [110]. The DEGs for each tumor considered can be accessed in Supplementary Data 6. Our study may contribute to future understanding of CNS tumors and the similarity in the behavior of the tumors. This study provides insight into the shared genes that were behaving differently in CNS tumors. They may serve as prognostic biomarkers or future drug targets.
The SYT1, DNM1, and STXBP1 are HDEGs that have been associated with debilitating neurological diseases while reports on their role in CNS tumors were still lacking. Here, we identified ten downregulated genes that may serve as tumor-suppressing genes with inverse correlations with CNS tumor proliferation, invasion, metastasis, malignancy, and differentiation. It is interesting to investigate further the role of immune response and neurotransmitters in contributing to tumorigenesis. The four upregulated contribute to the infiltration of neurotransmitters contributing to tumor proliferation. In this present study, fourteen identified HDEGs as promising therapeutic targets and biomarkers in CNS tumors. Differential expression of genes provides insight into tumor behavior based on clinical characteristics and samples. To further validate the tumor-suppressing behavior of the downregulated genes and tumor-contributing behavior of upregulated genes we highly encourage experts to perform In vivo and In vitro experimental studies.
Three clusters were identified as preserved in the co-expression network, two represent the downregulated HDEGs, and one for the upregulated HDEGs. In this study, enrichment analysis in each cluster was achieved (Figure 7). In the enrichment analysis, GO BP, synaptic communication was significant in downregulated groups. This biological process provides insight into glutamatergic neuron-to-brain tumor synaptic communication [111]. For the upregulated group cell adhesion, bone trabecula formation, and wound healing are enriched. It is interesting to speculate that cell adhesion contributes to tumor proliferation and the trabeculae process responsible for aggressive size growth. In GO CC cluster 1, the plasma membrane, neuronal cell body, and synapse while in cluster 2, the cytoplasm, perinuclear region of cytoplasm, and microtubule are the enriched cellular components. Cellular responses are highly influenced by microtubule alteration which may lead to tumor development and chemoresistance [112]. Cluster 1 genes are mainly involved in neurons for the transmission of nervous impulses while cluster 2 facilitates cellular structure. The downregulation of cluster 1 genes provided insight into the neurological impairment in tumor patients while cluster 2 genes support the abnormal formation of tumor cells. Furthermore, enriched GO CC of cluster 3 are mainly extracellular matrix, extracellular space, and extracellular region. The extracellular matrix serves as the microenvironment for the cells, dysregulation may lead to the development of cancer. that was mainly responsible for tumor progression [113]. The GO MF highly preserved the protein kinase binding and identical protein binding functions. It has been reported that the protein kinase C functions as a tumor suppressor while its isoforms contribute to tumor progression [114]. In KEGG pathways, cluster 1 associated its genes with Nicotine addiction, Synaptic vesicle cycle, GABAergic synapse, and Retrograde endocannabinoid signaling. Mostly the pathways involve the disturbance of neurotransmitters in the brain [111,115,116]. Cluster 2 KEGG preserved pathways were Pathways of neurodegeneration - multiple diseases and Parkinson's disease both relative in neurocognitive impairment that hijacks glutamate signaling [117]. In cluster 3, KEGG pathways were ECM-receptor interaction and Focal adhesion, which is essential for cell anchoring and migration, these pathways were also reported in gastric cancer [118]. The GO and KEGG enrichment analysis provided insight into the molecular and biological functions of the cluster genes. Enrichment data of the top 5 DEGs in each tumor can be accessed in Supplementary Data 5. These may serve as key insights for the neurologist, oncologist, and biologist in assessing CNS tumors.
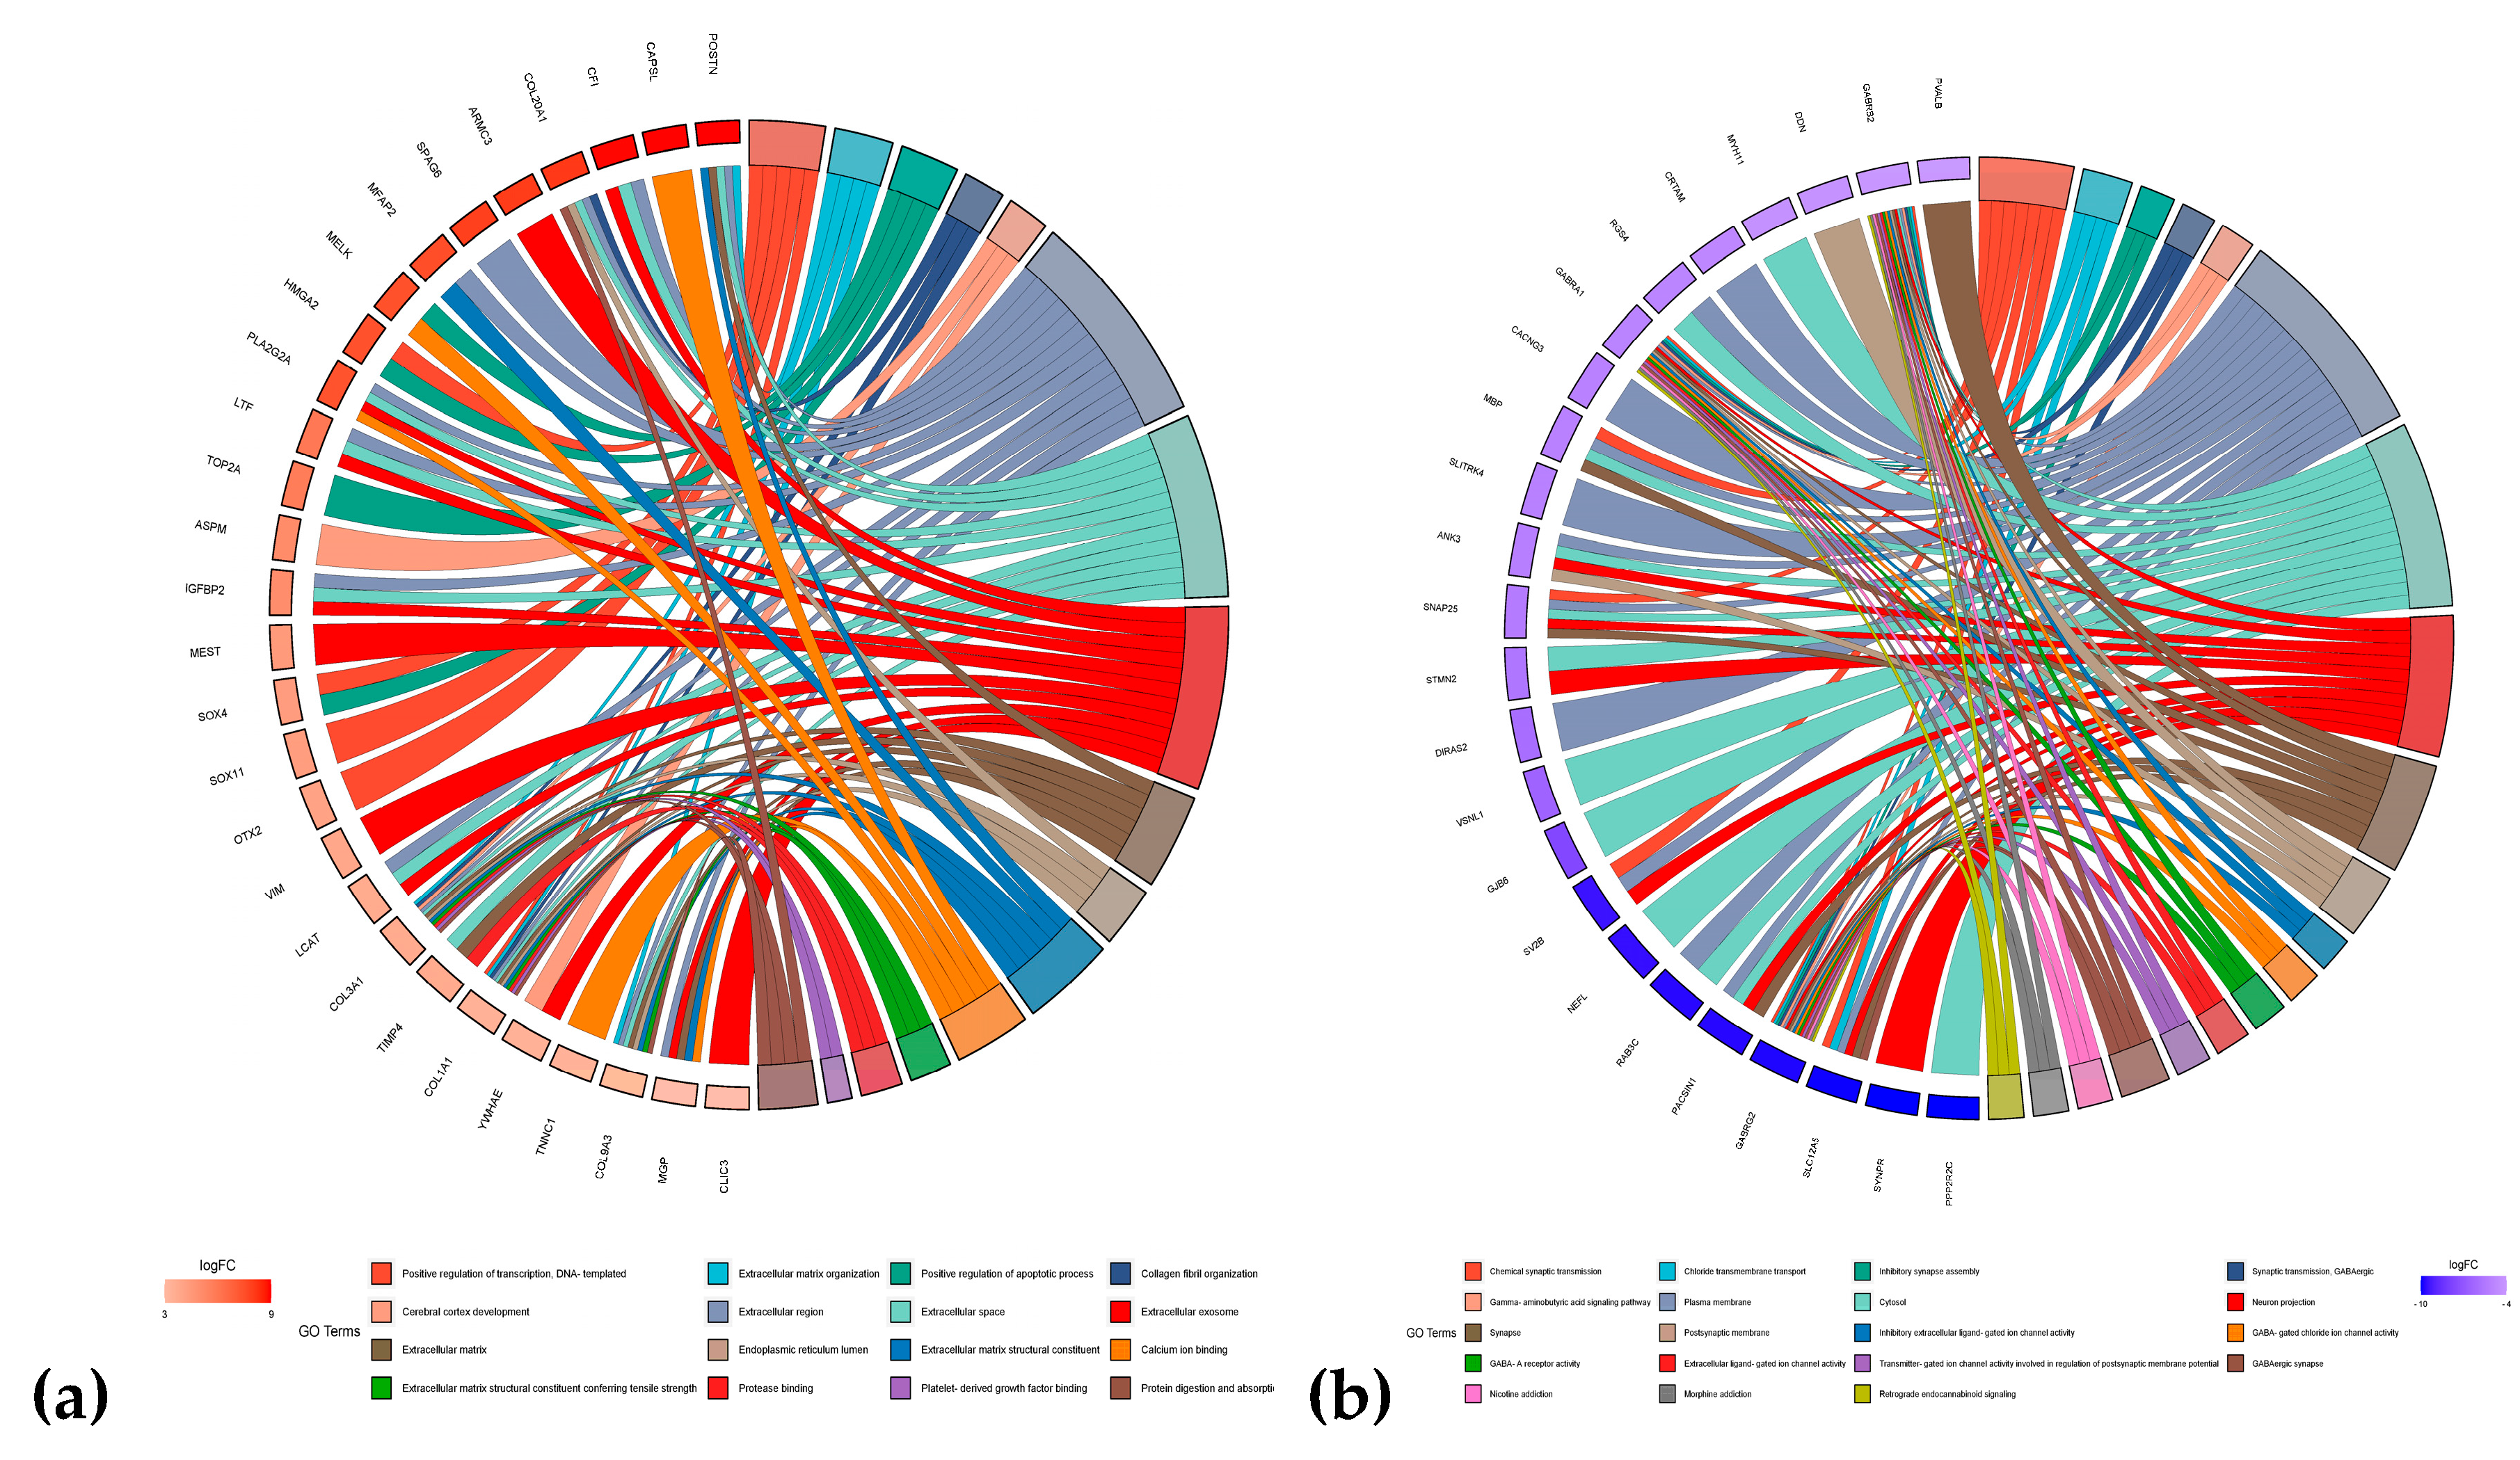
In this study, we explored the five most upregulated and downregulated genes in each of the nine CNS tumors for their KEGG and GO pathways. Observed in Figure 12 is the chord diagram of the following genes considered. We discovered that the upregulated genes mostly contribute to the extracellular region, extracellular space, and extracellular exosome. COL3A1 and COL1A1 appear to be involved in most of the pathways and their active expression is interesting to explore towards the behavior of different CNS tumors. Meanwhile, in the downregulated group, plasma membrane, cytosol, and neuron projection were highly enriched GO pathways. Among the suppress genes, GABRA1, GABRB2, and GABRBG2 are well involved in the GO and KEGG pathways. It is interesting to speculate that the suppression of these genes contributes to tumor progression. Their possible tumor-suppressing characteristics may open a door to drug development. This study opens a prospect for understanding CNS tumors for the future of drug development for anti-tumor.
Transcription factors and miRNA play a role in the coregulation of genes in post-transcription. Through the co-expression network of HDEGs, TFs, and miRNAs significant co-regulating TFs and miRNAs were identified. In this study, we have identified 33 transcription factors (Table 5) and 46 miRNAs (Table 6). Among the miRNAs, we considered five significant miRNA families, the let-7 family, the mir-124 family, the mir-1 family, the mir-103 family, and the mir-27 family. The let-7 mRNA family was reported as a promising biomarker and modulated cancer stemlike cells [119,120]. Expression of mir-124 in neurons contributes to suppressing tumor malignancy through coregulation of STAT3 and EZH2 [121]. Suppressive activity of mir-1 against GBM has been reported through FN1 targeting [122]. Likewise, mir-103 suppresses glioma cell proliferation and invasion by interacting with BDNF [123]. Lastly, the mir-27 family was reported to exhibit tumor suppression in colon cancer, pancreatic cancer, breast cancer, bladder cancer, and hepatocellular carcinoma [124]. It is interesting to examine and clinically validate these miRNA families in CNS tumor treatment. They might as well serve as biomarkers in examining tumor patients.
Table 13. Proposed candidate repurposed drugs and their regulatory effect on gene target, indication, and mechanism.
Drug HDEG TF Upregulated gene Class
Quercetin MAPT NFKB1, PRKCA, RELA SNCA Kinase inhibitors
Vorinostat TUBB2A, TUBB4A EZH2, MYC, TP53 DNAJC6, DNM3, KIF5C, SLC17A7, STXBP1, SYT1, TUBBA2A Antineoplastic agents
Moving on, the candidate repurposed drugs were identified by the DGIdb online database. Here, we considered the HDEGs and the TFs as drug targets, resulting in 32 candidate drugs. The Drug-TFs network and Drug-HDEGs network were reconstructed (Figure 9 and Figure 10) to identify drugs with a high degree of interaction. Curcumin and ocriplasmin were the considered candidate drugs in drug-HDEGs. Curcumin interacts with downregulated genes MAPT, TUBB2A, and TUBB4A while ocriplasmin interacts with upregulated genes COL1A1, COL6A2, and FN1. However, the two-lead drug failed CMAP analysis for drug validation. The Drug-TFs network showed cisplatin and daunorubicin as lead candidate repurposed drugs, both interacting with MAPT. Both have five TF interactions, cisplatin has GABPA, MYC, SMARCA4, STAT1, and TP53 while daunorubicin has CBFB, GATA1, IKZF1, THRB, and WT1. In the CMAP analysis, thirteen drugs were validated for their regulatory effect on HDEGs, namely, colchicine, doxorubicin, indoprofen, levothyroxine, methotrexate, nifedipine, paclitaxel, quercetin, raloxifene, resveratrol, trifluoperazine, vinblastine, and vorinostat. Based on the regulatory effect of the candidate drug, colchicine, and indoprofen are not suggestible. Colchicine will further downregulate the downregulated genes which were DNM3, SLC12A5, and TUBB2A while indoprofen will upregulate the upregulated gene COL1A1. Moreover, doxorubicin, levothyroxine, methotrexate, nifedipine, paclitaxel, raloxifene, resveratrol, trifluoperazine, and vinblastine were observed to have gene regulations that contradict the HDEGs. In considering drug contradictions with gene targets, drugs that upregulate the downregulated genes or vice versa are promising drug candidates for repurposing. Here, we proposed two major candidate repurposed drugs, quercetin and vorinostat. Furthermore, quercetin and resveratrol have been reported in the literature on their inhibitory effect on tumor proliferation. Quercetin is a polyphenol with antioxidant properties, its anticancer mechanism focuses on apoptosis through PI3K/Akt/mTOR, Wnt/β-catenin, and RAS/MAPK/ERK1/2 pathways, Upregulation of P53 protein through ROS generation and ER stress was also illustrated in the literature. Tumor invasion, proliferation, and migration are suppressed by MMP-9, PLD-1, ecto-5’-NT/CD73 inhibition, decrease in FN1, and cell arrest by G2 immune checkpoint [125] In rodent models, vorinostat has prevented brain metastases by 62% [126]. Vorinostat was also reported in peripheral mononuclear cells and tumor tissue acting as histone deacetylase (HDAC) inhibitors as an antitumor agent [127]. In rodent models, vorinostat was reported to hinder brain metastasis of triple-negative breast cancer due to its permeability in the brain. Identified drugs based on the drug-HDEGs and drug-TFs networks may pose a future use in treating CNS tumors. Currently, surgery is the most promising tumor removal or treatment. However, due to the reoccurrence of secondary tumors, metastases on different tissues or organs, and localization of tumors in areas of the body where surgery is not possible, drug treatment may be useful. Further validation on the candidate drugs might be needed such as their toxicity, administration, absorption, distribution, and excretion. The drug must also pass the blood-brain barrier if it will be used in treating CNS tumors.
In this present study, we have reported 17/74 (upregulated/downregulated) common differentially expressed genes and fourteen hub genes that are significant in CNS tumors. The 33 transcription factors may lead to further drug discovery and repurposing studies such as molecular docking, target binding sites, and molecular dynamics simulations. We reported five miRNA families that play a major role in CNS tumors. Their potential as biomarkers and therapeutic targets for tumor mitigation is promising in the landscape of cancer treatment. Furthermore, 32 speculated antitumor drugs have been identified and thirteen were validated. Among the validated candidate repurposed drugs only two fit the regulatory requirement for gene-targeted drugs, quercetin and vorinostat. Future experimental studies may be required to further validate the candidate repurposed drugs. Current challenges in CNS tumors are mostly associated with their debilitating effect on patients, neurocognitive impairment, and localization and infiltration in areas of the body making surgery removal of tumors difficult. In this present study, we utilized the DNA microarray of various CNS tumors to provide insights into their molecular biology. Our study contributes to society by providing prospects that may be useful in the future of drug treatment to mitigate CNS tumors as a global burden.

5. Conclusions

The study provides a co-expression network approach of differentially expressed genes in CNS tumors. This provides insights into molecular biology to understand tumorigenesis, malignancy, and metastases. Through the NCBI GEO database, we retrieved GSE66354, GSE68848, GSE74195, and GSE43290 DNA microarray datasets that contain nine different CNS tumors. GEO2R provided an avenue to identify differentially expressed genes, with this we identified 17 upregulated and 74 downregulated common genes. We reconstructed a co-expression network through the STRING database with 90 nodes and 185 edges. Cytoscape software was utilized for the co-expression network analysis. Through the ClusterViz plugin, we identified three highly preserved modules, two sub-networks represent the downregulated group while one is for the upregulated group. The cytoHubba plugin identified 10 hub genes, of which most were downregulated. Here, we consider the four upregulated genes from the preserved cluster. In this present study, fourteen hub genes were identified, namely, CACNA1A, DNM1, GABRA1, GRIA2, MAPT, SLC17A7, SNAP25, SNAP91, STXBP1, SYT1, COL1A1, COL6A2, FBN2, and FN1. Our study also identified highly suppressed and expressed genes from each of the nine CNS tumors and the pathways they were involved with. This may be beneficial to biologists and oncologists in understanding CNS tumor development for prospects of drug development. Their potential biomarker for tumor prognosis and drug targets is interesting to explore. HDEGs-TFs, TFs-miRNAs, and miRNAs-HDEGs networks paved the way to identify highly interacting HDEGs, TFs, and miRNAs. Five miRNA families (let-7 family, mir-124 family, mir-1 family, mir-103 family, mir-27 family) were discovered to have tumor-suppressing properties. Furthermore, drug interaction networks, such as Drug-HDEGs and Drug-TFs networks were reconstructed, and 32 multiple interacting repurposed drug candidates were identified. The computational approach for drug repurposing reduces resource requirements. Fourteen hub genes are highly significant in neurocognitive impairment such as brain cancer. Further exploring the biological roles of the identified TFs may open a new door for drug discovery as drug targets. Thirty-two candidates repurposed drugs, thirteen were validated drugs, and only two fitted the requirement in this study, quercetin, and vorinostat. Further, we identified differentially expressed genes in nine CNS tumor types and this provides insight for future understanding of the molecular mechanisms of CNS tumor progression. Likewise, experimental validation such as “in vivo” and “in vitro” studies were highly suggested before the use of candidate repurposed drugs for CNS tumor treatment. It is interesting to explore the tumor-suppressing characteristics of the HDEGs, TFs, and miRNAs. Our study contributes to the future landscape of understanding the central nervous system and brain tumor treatment.

Supplementary Materials

The following supporting information can be downloaded at the website of this paper posted on Preprints.org.

Author Contributions

Conceptualization, B.H.A.V., P.T. and L.L.T.; methodology, B.H.A.V., P.T., and L.L.T.; validation, P.T. and L.L.T.; formal analysis, B.H.A.V.; investigation, B.H.A.V.; resources, L.L.T. and P.T.; data curation, B.H.A.V.; writing—original draft preparation, B.H.A.V.; writing—review and editing, P.T. and L.L.T.; visualization, B.H.A.V.; supervision, L.L.T.; funding acquisition, L.L.T. All authors have read and agreed to the published version of the manuscript.

Funding

This research received no external funding.

Institutional Review Board Statement

Not applicable.

Informed Consent Statement

Not applicable.

Data Availability Statement

The microarray expression profiles used in the study are openly available in National Center for Biotechnology Information-Gene Expression Omnibus (NCBI GEO) online database [https://www.ncbi.nlm.nih.gov/geo/]. Accession IDs, GSSE66354, GSE68848, GSE74195, and GSE43290.

Acknowledgment

We sincerely give thanks to Mapúa University for its financial support.

Conflicts of Interest

The authors declare that they have no competing interests.

Appendix A

Figure A1. Methodological framework of this study.
Preprints 83618 g0a1
Figure A2. Box plot of the (a) GSE66354, (b) GSE68848, (c) GSE74195, and (d) GSE42390 for their various CNS tumor and normal control samples after Force Normalization in GEO2R.
Preprints 83618 g0a2
Figure A3. Principal component analysis (PCA) or Uniform Manifold Approximation and Projection (UMAP) of the (a) GSE66354, (b) GSE68848, (c) GSE74195, and (d) GSE42390.
Preprints 83618 g0a3
Figure A4. Volcanic plot of differentially expressed genes for (a) GSE66354-ATRT, (b) GSE66354-EPN, (c) GSE66354-PA, (d) GSE74195-MED, (e) GSE74195-PNET, (f) GSE43290-MEN, (g) GSE68848-ACM, (h) GSE68848-ODG, and (i) GSE68848-GBM. Highlighted genes are differentially expressed genes following the adjusted p-value cutoff of ≤ 0.05 and log2FC threshold of ≥ 1 (upregulated) and ≤ -1 (downregulated). Red represents upregulated genes while blue represents downregulated genes.
Preprints 83618 g0a4

References

  1. Girardi, F.; Matz, M.; Stiller, C.; You, H.; Gragera, R.M.; Valkov, M.Y.; Bulliard, J.L.; De, P.; Morrison, D.; Wanner, M.; et al. Global Survival Trends for Brain Tumors, by Histology: Analysis of Individual Records for 556,237 Adults Diagnosed in 59 Countries during 2000–2014 (CONCORD-3). Neuro Oncol 2023, 25, 580–592. [Google Scholar] [CrossRef] [PubMed]
  2. Ilic, I.; Ilic, M. International Patterns and Trends in the Brain Cancer Incidence and Mortality: An Observational Study Based on the Global Burden of Disease. Heliyon 2023, 9. [Google Scholar] [CrossRef] [PubMed]
  3. Miller, K.D.; Ostrom, Q.T.; Kruchko, C.; Patil, N.; Tihan, T.; Cioffi, G.; Fuchs, H.E.; Waite, K.A.; Jemal, A.; Siegel, R.L.; et al. Brain and Other Central Nervous System Tumor Statistics, 2021. CA Cancer J Clin 2021, 71, 381–406. [Google Scholar] [CrossRef] [PubMed]
  4. Aronica, E.; Ciusani, E.; Coppola, A.; Costa, C.; Russo, E.; Salmaggi, A.; Perversi, F.; Maschio, M. Epilepsy and Brain Tumors: Two Sides of the Same Coin. J Neurol Sci 2023, 446. [Google Scholar] [CrossRef] [PubMed]
  5. Slegers, R.J.; Blumcke, I. Low-Grade Developmental and Epilepsy Associated Brain Tumors: A Critical Update 2020. Acta Neuropathol Commun 2020, 8. [Google Scholar] [CrossRef]
  6. Pandini, C.; Garofalo, M.; Rey, F.; Garau, J.; Zucca, S.; Sproviero, D.; Bordoni, M.; Berzero, G.; Davin, A.; Poloni, T.E.; et al. MINCR: A Long Non-Coding RNA Shared between Cancer and Neurodegeneration. Genomics 2021, 113, 4039–4051. [Google Scholar] [CrossRef]
  7. Audrey, C.; Lim, K.S.; Ahmad Zaki, R.; Fong, S.L.; Chan, C.Y.; Sathis Kumar, T.; Narayanan, V.; Tan, C.T. Prevalence of Seizures in Brain Tumor: A Meta-Analysis. Epilepsy Res 2022, 187. [Google Scholar] [CrossRef]
  8. Raghavendra, U.; Gudigar, A.; Paul, A.; Goutham, T.S.; Inamdar, M.A.; Hegde, A.; Devi, A.; Ooi, C.P.; Deo, R.C.; Barua, P.D.; et al. Brain Tumor Detection and Screening Using Artificial Intelligence Techniques: Current Trends and Future Perspectives. Comput Biol Med 2023, 163. [Google Scholar] [CrossRef]
  9. Louis, D.N.; Perry, A.; Wesseling, P.; Brat, D.J.; Cree, I.A.; Figarella-Branger, D.; Hawkins, C.; Ng, H.K.; Pfister, S.M.; Reifenberger, G.; et al. The 2021 WHO Classification of Tumors of the Central Nervous System: A Summary. Neuro Oncol 2021, 23, 1231–1251. [Google Scholar] [CrossRef]
  10. Ostrom, Q.T.; Fahmideh, M.A.; Cote, D.J.; Muskens, I.S.; Schraw, J.M.; Scheurer, M.E.; Bondy, M.L. Risk Factors for Childhood and Adult Primary Brain Tumors. Neuro Oncol 2019, 21, 1357–1375. [Google Scholar] [CrossRef]
  11. Kentsis, A. Why Do Young People Get Cancer? Pediatr Blood Cancer 2020, 67. [Google Scholar] [CrossRef] [PubMed]
  12. Lin, D.; Shen, Y.; Liang, T. Oncolytic Virotherapy: Basic Principles, Recent Advances and Future Directions. Signal Transduct Target Ther 2023, 8. [Google Scholar]
  13. Fan, Y.; Zhang, X.; Gao, C.; Jiang, S.; Wu, H.; Liu, Z.; Dou, T. Burden and Trends of Brain and Central Nervous System Cancer from 1990 to 2019 at the Global, Regional, and Country Levels. Archives of Public Health 2022, 80. [Google Scholar] [CrossRef] [PubMed]
  14. Kocarnik, J.M.; Compton, K.; Dean, F.E.; Fu, W.; Gaw, B.L.; Harvey, J.D.; Henrikson, H.J.; Lu, D.; Pennini, A.; Xu, R.; et al. Cancer Incidence, Mortality, Years of Life Lost, Years Lived With Disability, and Disability-Adjusted Life Years for 29 Cancer Groups From 2010 to 2019 A Systematic Analysis for the Global Burden of Disease Study 2019. JAMA Oncol 2022, 8, 420–444. [Google Scholar] [CrossRef] [PubMed]
  15. Miller, B.A.; Chu, K.C.; Hankey, B.F.; Ries, L.A.G. Cancer Incidence and Mortality Patterns among Specific Asian and Pacific Islander Populations in the U.S. Cancer Causes and Control 2008, 19, 227–256. [Google Scholar] [CrossRef]
  16. Cronin, K.A.; Scott, S.; Firth, A.U.; Sung, H.; Henley, S.J.; Sherman, R.L.; Siegel, R.L.; Anderson, R.N.; Kohler, B.A.; Benard, V.B.; et al. Annual Report to the Nation on the Status of Cancer, Part 1: National Cancer Statistics. Cancer 2022, 128, 4251–4284. [Google Scholar] [CrossRef]
  17. Kalra, M.; Subramani, V. Rare Pediatric Brain Tumors. Pediatric Hematology Oncology Journal 2023. [Google Scholar] [CrossRef]
  18. Wu, W.; Klockow, J.L.; Zhang, M.; Lafortune, F.; Chang, E.; Jin, L.; Wu, Y.; Daldrup-Link, H.E. Glioblastoma Multiforme (GBM): An Overview of Current Therapies and Mechanisms of Resistance. Pharmacol Res 2021, 171. [Google Scholar] [CrossRef]
  19. Caccese, M.; Padovan, M.; D’Avella, D.; Chioffi, F.; Gardiman, M.P.; Berti, F.; Busato, F.; Bellu, L.; Bergo, E.; Zoccarato, M.; et al. Anaplastic Astrocytoma: State of the Art and Future Directions. Crit Rev Oncol Hematol 2020, 153. [Google Scholar] [CrossRef]
  20. Santino, S.F.; Salles, D.; Stávale, J.N.; Malinverni, A.C.M. Pathophysiological Evaluation of Pilocytic Astrocytoma in Adults: Histopathological and Immunohistochemical Analysis. Pathol Res Pract 2023, 248. [Google Scholar] [CrossRef]
  21. Salles, D.; Santino, S.F.; Ribeiro, D.A.; Malinverni, A.C.M.; Stávale, J.N. The Involvement of the MAPK Pathway in Pilocytic Astrocytomas. Pathol Res Pract 2022, 232. [Google Scholar] [CrossRef] [PubMed]
  22. Smits, M. Imaging of Oligodendroglioma. British Journal of Radiology 2016, 89. [Google Scholar] [CrossRef] [PubMed]
  23. Wesseling, P.; van den Bent, M.; Perry, A. Oligodendroglioma: Pathology, Molecular Mechanisms and Markers. Acta Neuropathol 2015, 129, 809–827. [Google Scholar] [CrossRef] [PubMed]
  24. Hägerstrand, D.; Smits, A.; Eriksson, A.; Sigurdardottir, S.; Olofsson, T.; Hartman, M.; Nistér, M.; Kalimo, H.; Östman, A. Gene Expression Analyses of Grade II Gliomas and Identification of RPTPβ/ζ as a Candidate Oligodendroglioma Marker. Neuro Oncol 2008, 10, 2–9. [Google Scholar] [CrossRef] [PubMed]
  25. Griesinger, A.M.; Josephson, R.J.; Donson, A.M.; Levy, J.M.M.; Amani, V.; Birks, D.K.; Hoffman, L.M.; Furtek, S.L.; Reigan, P.; Handler, M.H.; et al. Interleukin-6/STAT3 Pathway Signaling Drives an Inflammatory Phenotype in Group an Ependymoma. Cancer Immunol Res 2015, 3, 1165–1174. [Google Scholar] [CrossRef]
  26. Boukaka, R.G.; Szathmari, A.; Di Rocco, F.; Leblond, P.; Faure-Conter, C.; Claude, L.; Vasiljevic, A.; Beuriat, P.A.; Mottolese, C. Posterior Fossa Ependymoma in Children: A Long-Term Single-Center Experience. Neurochirurgie 2023, 69. [Google Scholar] [CrossRef]
  27. Korones, D.N. Pediatric Ependymomas: Something Old, Something New. Pediatric Hematology Oncology Journal 2023, 8, 114–120. [Google Scholar] [CrossRef]
  28. Cotter, J.A.; Hawkins, C. Medulloblastoma: WHO 2021 and Beyond. Pediatric and Developmental Pathology 2022, 25, 23–33. [Google Scholar] [CrossRef]
  29. Morfouace, M.; Cheepala, S.; Jackson, S.; Fukuda, Y.; Patel, Y.T.; Fatima, S.; Kawauchi, D.; Shelat, A.A.; Stewart, C.F.; Sorrentino, B.P.; et al. ABCG2 Transporter Expression Impacts Group 3 Medulloblastoma Response to Chemotherapy. Cancer Res 2015, 75, 3879–3889. [Google Scholar] [CrossRef]
  30. Kool, M.; Koster, J.; Bunt, J.; Hasselt, N.E.; Lakeman, A.; van Sluis, P.; Troost, D.; Schouten-van Meeteren, N.; Caron, H.N.; Cloos, J.; et al. Integrated Genomics Identifies Five Medulloblastoma Subtypes with Distinct Genetic Profiles, Pathway Signatures and Clinicopathological Features. PLoS One 2008, 3. [Google Scholar] [CrossRef]
  31. Castillo-Rodríguez, R.A.; Dávila-Borja, V.M.; Juárez-Méndez, S. Data Mining of Pediatric Medulloblastoma Microarray Expression Reveals a Novel Potential Subdivision of the Group 4 Molecular Subgroup. Oncol Lett 2018, 15, 6241–6250. [Google Scholar] [CrossRef] [PubMed]
  32. Tabernero, M.D.; Maillo, A.; Gil-Bellosta, C.J.; Castrillo, A.; Sousa, P.; Merino, M.; Orfao, A. Gene Expression Profiles of Meningiomas Are Associated with Tumor Cytogenetics and Patient Outcome. Brain Pathology 2009, 19, 409–420. [Google Scholar] [CrossRef] [PubMed]
  33. Birks, D.K.; Donson, A.M.; Patel, P.R.; Dunham, C.; Muscat, A.; Algar, E.M.; Ashley, D.M.; Kleinschmidt-DeMasters, B.K.; Vibhakar, R.; Handler, M.H.; et al. High Expression of BMP Pathway Genes Distinguishes a Subset of Atypical Teratoid/Rhabdoid Tumors Associated with Shorter Survival. Neuro Oncol 2011, 13, 1296–1307. [Google Scholar] [CrossRef] [PubMed]
  34. Birks, D.K.; Donson, A.M.; Patel, P.R.; Sufit, A.; Algar, E.M.; Dunham, C.; Kleinschmidt-Demasters, B.K.; Handler, M.H.; Vibhakar, R.; Foreman, N.K. Pediatric Rhabdoid Tumors of Kidney and Brain Show Many Differences in Gene Expression but Share Dysregulation of Cell Cycle and Epigenetic Effector Genes. Pediatr Blood Cancer 2013, 60, 1095–1102. [Google Scholar] [CrossRef]
  35. Rogers, H.A.; Ward, J.H.; Miller, S.; Lowe, J.; Coyle, B.; Grundy, R.G. The Role of the WNT/β-Catenin Pathway in Central Nervous System Primitive Neuroectodermal Tumours (CNS PNETs). Br J Cancer 2013, 108, 2130–2141. [Google Scholar] [CrossRef]
  36. Henriquez, N. V.; Forshew, T.; Tatevossian, R.; Ellis, M.; Richard-Loendt, A.; Rogers, H.; Jacques, T.S.; Reitboeck, P.G.; Pearce, K.; Sheer, D.; et al. Comparative Expression Analysis Reveals Lineage Relationships between Human and Murine Gliomas and a Dominance of Glial Signatures during Tumor Propagation in Vitro. Cancer Res 2013, 73, 5834–5844. [Google Scholar] [CrossRef]
  37. Wu, L.; Wang, J.; Zhao, J.; Yao, R.; Xu, Q.; Ma, L.; Liu, J. Bioinformatics Analysis Identified RGS4 as a Potential Tumor Promoter in Glioma. Pathol Res Pract 2022, 240. [Google Scholar] [CrossRef]
  38. Lönnemark, O.; Ryttlefors, M.; Sundblom, J. Cranioplasty in Brain Tumor Surgery: A Single-Center Retrospective Study Investigating Cranioplasty Failure and Tumor Recurrence. World Neurosurg 2023, 170, e313–e323. [Google Scholar] [CrossRef]
  39. Hamblin, R.; Vardon, A.; Akpalu, J.; Tampourlou, M.; Spiliotis, I.; Sbardella, E.; Lynch, J.; Shankaran, V.; Mavilakandy, A.; Gagliardi, I.; et al. Risk of Second Brain Tumour after Radiotherapy for Pituitary Adenoma or Craniopharyngioma: A Retrospective, Multicentre, Cohort Study of 3679 Patients with Long-Term Imaging Surveillance. Lancet Diabetes Endocrinol 2022, 10, 581–588. [Google Scholar] [CrossRef]
  40. Di Giacomo, A.M.; Mair, M.J.; Ceccarelli, M.; Anichini, A.; Ibrahim, R.; Weller, M.; Lahn, M.; Eggermont, A.M.M.; Fox, B.; Maio, M. Immunotherapy for Brain Metastases and Primary Brain Tumors. Eur J Cancer 2023, 179, 113–120. [Google Scholar] [CrossRef]
  41. Zhu, Y.; Jiang, Y.; Meng, F.; Deng, C.; Cheng, R.; Zhang, J.; Feijen, J.; Zhong, Z. Highly Efficacious and Specific Anti-Glioma Chemotherapy by Tandem Nanomicelles Co-Functionalized with Brain Tumor-Targeting and Cell-Penetrating Peptides. Journal of Controlled Release 2018, 278, 1–8. [Google Scholar] [CrossRef]
  42. Zhang, D.; Kong, J.; Huang, X.; Zeng, J.; Du, Q.; Yang, T.; Yue, H.; Bao, Q.; Miao, Y.; Xu, Y.; et al. Targeted Glioblastoma Therapy by Integrating Brain-Targeting Peptides and Corn-Derived Cancer Cell-Penetrating Proteins into Nanoparticles to Cross Blood-Brain Tumor Barriers. Mater Today Nano 2023, 23. [Google Scholar] [CrossRef]
  43. Deng, T.; Hasan, I.; Roy, S.; Liu, Y.; Zhang, B.; Guo, B. Advances in MRNA Nanomedicines for Malignant Brain Tumor Therapy. Smart Mater Med 2023, 4, 257–265. [Google Scholar] [CrossRef]
  44. Anami, Y.; Otani, Y.; Xiong, W.; Ha, S.Y.Y.; Yamaguchi, A.; Rivera-Caraballo, K.A.; Zhang, N.; An, Z.; Kaur, B.; Tsuchikama, K. Homogeneity of Antibody-Drug Conjugates Critically Impacts the Therapeutic Efficacy in Brain Tumors. Cell Rep 2022, 39. [Google Scholar] [CrossRef] [PubMed]
  45. Power, E.A.; Rechberger, J.S.; Gupta, S.; Schwartz, J.D.; Daniels, D.J.; Khatua, S. Drug Delivery across the Blood-Brain Barrier for the Treatment of Pediatric Brain Tumors – An Update. Adv Drug Deliv Rev 2022, 185. [Google Scholar] [CrossRef]
  46. Gaito, S.; Burnet, N.G.; Aznar, M.C.; Marvaso, G.; Jereczek-Fossa, B.A.; Crellin, A.; Indelicato, D.; Pan, S.; Colaco, R.; Rieu, R.; et al. Proton Beam Therapy in the Reirradiation Setting of Brain and Base of Skull Tumour Recurrences. Clin Oncol 2023. [Google Scholar] [CrossRef]
  47. Sriram, S.; Melnick, K.; Rahman, M.; Ghiaseddin, A. Updates on Role for and Efficacy of Laser Interstitial Thermal Therapy in the Management of Brain Tumors. Advances in Oncology 2023, 3, 87–96. [Google Scholar] [CrossRef]
  48. Zhang, L.; Liu, Y.; Huang, H.; Xie, H.; Zhang, B.; Xia, W.; Guo, B. Multifunctional Nanotheranostics for near Infrared Optical Imaging-Guided Treatment of Brain Tumors. Adv Drug Deliv Rev 2022, 190. [Google Scholar] [CrossRef]
  49. Talukder, M.A.; Islam, M.M.; Uddin, M.A.; Akhter, A.; Pramanik, M.A.J.; Aryal, S.; Almoyad, M.A.A.; Hasan, K.F.; Moni, M.A. An Efficient Deep Learning Model to Categorize Brain Tumor Using Reconstruction and Fine-Tuning. Expert Syst Appl 2023, 230. [Google Scholar] [CrossRef]
  50. Parvathaneni, V.; Kulkarni, N.S.; Muth, A.; Gupta, V. Drug Repurposing: A Promising Tool to Accelerate the Drug Discovery Process. Drug Discov Today 2019, 24, 2076–2085. [Google Scholar] [CrossRef]
  51. Chen, Y.; Xu, R. Drug Repurposing for Glioblastoma Based on Molecular Subtypes. J Biomed Inform 2016, 64, 131–138. [Google Scholar] [CrossRef]
  52. Issa, N.T.; Stathias, V.; Schürer, S.; Dakshanamurthy, S. Machine and Deep Learning Approaches for Cancer Drug Repurposing. Semin Cancer Biol 2021, 68, 132–142. [Google Scholar] [CrossRef] [PubMed]
  53. Chen, Y.; Yan, Y.; Xu, M.; Chen, W.; Lin, J.; Zhao, Y.; Wu, J.; Wang, X. Development of a Machine Learning Classifier for Brain Tumors Diagnosis Based on DNA Methylation Profile. Frontiers in Bioinformatics 2021, 1. [Google Scholar] [CrossRef] [PubMed]
  54. Dinić, J.; Efferth, T.; García-Sosa, A.T.; Grahovac, J.; Padrón, J.M.; Pajeva, I.; Rizzolio, F.; Saponara, S.; Spengler, G.; Tsakovska, I. Repurposing Old Drugs to Fight Multidrug Resistant Cancers. Drug Resistance Updates 2020, 52. [Google Scholar] [CrossRef]
  55. Saeed, M.E.M.; Kadioglu, O.; Henry, &; Greten, J.; Yildirim, A.; Mayr, K.; Wenz, F.; Giordano, F.A.; Efferth, T. Drug Repurposing Using Transcriptome Sequencing and Virtual Drug Screening in a Patient with Glioblastoma. [CrossRef]
  56. MotieGhader, H.; Safavi, E.; Rezapour, A.; Amoodizaj, F.F.; Iranifam, R. asl Drug Repurposing for Coronavirus (SARS-CoV-2) Based on Gene Co-Expression Network Analysis. Sci Rep 2021, 11. [Google Scholar] [CrossRef] [PubMed]
  57. Mailem, R.C.; Tayo, L.L. Drug Repurposing Using Gene Co-Expression and Module Preservation Analysis in Acute Respiratory Distress Syndrome (ARDS), Systemic Inflammatory Response Syndrome (SIRS), Sepsis, and COVID-19. Biology (Basel) 2022, 11. [Google Scholar] [CrossRef]
  58. Madhavan, S.; Zenklusen, J.C.; Kotliarov, Y.; Sahni, H.; Fine, H.A.; Buetow, K. Rembrandt: Helping Personalized Medicine Become a Reality through Integrative Translational Research. Molecular Cancer Research 2009, 7, 157–167. [Google Scholar] [CrossRef]
  59. Gusev, Y.; Bhuvaneshwar, K.; Song, L.; Zenklusen, J.C.; Fine, H.; Madhavan, S. Data Descriptor: The REMBRANDT Study, a Large Collection of Genomic Data from Brain Cancer Patients. Sci Data 2018, 5. [Google Scholar] [CrossRef]
  60. De Bont, J.M.; Kros, J.M.; Passier, M.M.C.J.; Reddingius, R.E.; Sillevis Smitt, P.A.E.; Luider, T.M.; Den Boer, M.L.; Pieters, R. Differential Expression and Prognostic Significance of SOX Genes in Pediatric Medulloblastoma and Ependymoma Identified by Microarray Analysis. Neuro Oncol 2008, 10, 648–660. [Google Scholar] [CrossRef]
  61. Clough, E.; Barrett, T. The Gene Expression Omnibus Database. In Methods in Molecular Biology; Humana Press Inc., 2016; Vol. 1418, pp. 93–110.
  62. Zhou, W.; Han, L.; Altman, R.B. Imputing Gene Expression to Maximize Platform Compatibility. Bioinformatics 2017, 33, 522–528. [Google Scholar] [CrossRef]
  63. Barnes, M.; Freudenberg, J.; Thompson, S.; Aronow, B.; Pavlidis, P. Experimental Comparison and Cross-Validation of the Affymetrix and Illumina Gene Expression Analysis Platforms. Nucleic Acids Res 2005, 33, 5914–5923. [Google Scholar] [CrossRef] [PubMed]
  64. Robinson, M.D.; Speed, T.P. A Comparison of Affymetrix Gene Expression Arrays. BMC Bioinformatics 2007, 8. [Google Scholar] [CrossRef] [PubMed]
  65. Barrett, T.; Wilhite, S.E.; Ledoux, P.; Evangelista, C.; Kim, I.F.; Tomashevsky, M.; Marshall, K.A.; Phillippy, K.H.; Sherman, P.M.; Holko, M.; et al. NCBI GEO: Archive for Functional Genomics Data Sets - Update. Nucleic Acids Res 2013, 41. [Google Scholar] [CrossRef] [PubMed]
  66. Hackstadt, A.J.; Hess, A.M. Filtering for Increased Power for Microarray Data Analysis. BMC Bioinformatics 2009, 10. [Google Scholar] [CrossRef]
  67. Chen, X.; Robinson, D.G.; Storey, J.D. The Functional False Discovery Rate with Applications to Genomics. Biostatistics 2021, 22, 68–81. [Google Scholar] [CrossRef]
  68. Raudvere, U.; Kolberg, L.; Kuzmin, I.; Arak, T.; Adler, P.; Peterson, H.; Vilo, J. G:Profiler: A Web Server for Functional Enrichment Analysis and Conversions of Gene Lists (2019 Update). Nucleic Acids Res 2019, 47, W191–W198. [Google Scholar] [CrossRef]
  69. Szklarczyk, D.; Kirsch, R.; Koutrouli, M.; Nastou, K.; Mehryary, F.; Hachilif, R.; Gable, A.L.; Fang, T.; Doncheva, N.T.; Pyysalo, S.; et al. The STRING Database in 2023: Protein-Protein Association Networks and Functional Enrichment Analyses for Any Sequenced Genome of Interest. Nucleic Acids Res 2023, 51, D638–D646. [Google Scholar] [CrossRef]
  70. Shannon, P.; Markiel, A.; Ozier, O.; Baliga, N.S.; Wang, J.T.; Ramage, D.; Amin, N.; Schwikowski, B.; Ideker, T. Cytoscape: A Software Environment for Integrated Models of Biomolecular Interaction Networks. Genome Res 2003, 13, 2498–2504. [Google Scholar] [CrossRef]
  71. Wang, J.; Zhong, J.; Chen, G.; Li, M.; Wu, F.X.; Pan, Y. ClusterViz: A Cytoscape APP for Cluster Analysis of Biological Network. IEEE/ACM Trans Comput Biol Bioinform 2015, 12, 815–822. [Google Scholar] [CrossRef]
  72. Chin, C.H.; Chen, S.H.; Wu, H.H.; Ho, C.W.; Ko, M.T.; Lin, C.Y. CytoHubba: Identifying Hub Objects and Sub-Networks from Complex Interactome. BMC Syst Biol 2014, 8. [Google Scholar] [CrossRef]
  73. Sherman, B.T.; Hao, M.; Qiu, J.; Jiao, X.; Baseler, M.W.; Lane, H.C.; Imamichi, T.; Chang, W. DAVID: A Web Server for Functional Enrichment Analysis and Functional Annotation of Gene Lists (2021 Update). Nucleic Acids Res 2022, 50, W216–W221. [Google Scholar] [CrossRef]
  74. Harris, M.A.; Clark, J.; Ireland, A.; Lomax, J.; Ashburner, M.; Foulger, R.; Eilbeck, K.; Lewis, S.; Marshall, B.; Mungall, C.; et al. The Gene Oncology (GO) Database and Informatics Resource. Nucleic Acids Res 2004, 32. [Google Scholar] [CrossRef]
  75. Kanehisa, M.; Goto, S. KEGG: Kyoto Encyclopedia of Genes and Genomes; 2000; Vol. 28;
  76. Zhou, G.; Soufan, O.; Ewald, J.; Hancock, R.E.W.; Basu, N.; Xia, J. NetworkAnalyst 3.0: A Visual Analytics Platform for Comprehensive Gene Expression Profiling and Meta-Analysis. Nucleic Acids Res 2019, 47, W234–W241. [Google Scholar] [CrossRef] [PubMed]
  77. Abascal, F.; Acosta, R.; Addleman, N.J.; Adrian, J.; Afzal, V.; Aken, B.; Akiyama, J.A.; Jammal, O. Al; Amrhein, H.; Anderson, S.M.; et al. Expanded Encyclopaedias of DNA Elements in the Human and Mouse Genomes. Nature 2020, 583, 699–710. [Google Scholar] [CrossRef]
  78. Wang, S.; Sun, H.; Ma, J.; Zang, C.; Wang, C.; Wang, J.; Tang, Q.; Meyer, C.A.; Zhang, Y.; Liu, X.S. Target Analysis by Integration of Transcriptome and ChIP-Seq Data with BETA. Nat Protoc 2013, 8, 2502–2515. [Google Scholar] [CrossRef]
  79. Huang, H.Y.; Lin, Y.C.D.; Cui, S.; Huang, Y.; Tang, Y.; Xu, J.; Bao, J.; Li, Y.; Wen, J.; Zuo, H.; et al. MiRTarBase Update 2022: An Informative Resource for Experimentally Validated MiRNA-Target Interactions. Nucleic Acids Res 2022, 50, D222–D230. [Google Scholar] [CrossRef]
  80. Liu, Z.P.; Wu, C.; Miao, H.; Wu, H. RegNetwork: An Integrated Database of Transcriptional and Post-Transcriptional Regulatory Networks in Human and Mouse. Database 2015, 2015, 1–12. [Google Scholar] [CrossRef]
  81. The GTEx Consortium Atlas of Genetic Regulatory Effects across Human Tissues The GTEx Consortium*;
  82. Freshour, S.L.; Kiwala, S.; Cotto, K.C.; Coffman, A.C.; McMichael, J.F.; Song, J.J.; Griffith, M.; Griffith, O.L.; Wagner, A.H. Integration of the Drug-Gene Interaction Database (DGIdb 4.0) with Open Crowdsource Efforts. Nucleic Acids Res 2021, 49, D1144–D1151. [Google Scholar] [CrossRef]
  83. Kuleshov, M. V.; Jones, M.R.; Rouillard, A.D.; Fernandez, N.F.; Duan, Q.; Wang, Z.; Koplev, S.; Jenkins, S.L.; Jagodnik, K.M.; Lachmann, A.; et al. Enrichr: A Comprehensive Gene Set Enrichment Analysis Web Server 2016 Update. Nucleic Acids Res 2016, 44, W90–W97. [Google Scholar] [CrossRef]
  84. Li, J.; Han, X.; Wan, Y.; Zhang, S.; Zhao, Y.; Fan, R.; Cui, Q.; Zhou, Y. TAM 2.0: Tool for MicroRNA Set Analysis. Nucleic Acids Res 2018, 46, W180–W185. [Google Scholar] [CrossRef]
  85. Li, Y.; Dong, Y. ping; Qian, Y. wen; Yu, L. xing; Wen, W.; Cui, X. liang; Wang, H. yang Identification of Important Genes and Drug Repurposing Based on Clinical-Centered Analysis across Human Cancers. Acta Pharmacol Sin 2021, 42, 282–289. [Google Scholar] [CrossRef]
  86. Nicoloso, M.S.; Calin, G.A. MicroRNA Involvement in Brain Tumors: From Bench to Bedside. In Proceedings of the Brain Pathology; January 2008; Vol. 18; pp. 122–129. [Google Scholar]
  87. Giannopoulou, A.I.; Kanakoglou, D.S.; Piperi, C. Transcription Factors with Targeting Potential in Gliomas. Int J Mol Sci 2022, 23. [Google Scholar] [CrossRef]
  88. Hernández-Lemus, E.; Martínez-García, M. Pathway-Based Drug-Repurposing Schemes in Cancer: The Role of Translational Bioinformatics. Front Oncol 2021, 10. [Google Scholar] [CrossRef] [PubMed]
  89. Damodharan, S.; Puccetti, D. Pediatric Central Nervous System Tumor Overview and Emerging Treatment Considerations. Brain Sci 2023, 13. [Google Scholar] [CrossRef] [PubMed]
  90. Maarif, R.; Kubota, Y.; Chernov, M.F. Early Tumor-Related Hemorrhage after Stereotactic Radiosurgery of Brain Metastases: Systematic Review of Reported Cases. Journal of Clinical Neuroscience 2023, 115, 66–70. [Google Scholar] [CrossRef] [PubMed]
  91. Ottensmeier, H.; Zimolong, B.; Wolff, J.E.; Ehrich, J.; Galley, N.; Von Hoff, K.; Kuehl, J.; Rutkowski, S. Neuropsychological Short Assessment of Disease- and Treatment-Related Intelligence Deficits in Children with Brain Tumours. European Journal of Paediatric Neurology 2015, 19, 298–307. [Google Scholar] [CrossRef] [PubMed]
  92. Phan, N.N.; Wang, C.Y.; Chen, C.F.; Sun, Z.; Lai, M.D.; Lin, Y.C. Voltage-Gated Calcium Channels: Novel Targets for Cancer Therapy. Oncol Lett 2017, 14, 2059–2074. [Google Scholar] [CrossRef]
  93. DNM1 Encephalopathy A New Disease of Vesicle Fission; 2017;
  94. Hu, M.; Gu, J.; Su, W.; Zhang, Z.; Zhu, B.; Wang, Q.; Xing, C. DNM1: A Prognostic Biomarker Associated with Immune Infiltration in Colon Cancer - A Study Based on TCGA Database. Biomed Res Int 2021, 2021. [Google Scholar] [CrossRef]
  95. Belotti, Y.; Tolomeo, S.; Yu, R.; Lim, W.T.; Lim, C.T. Prognostic Neurotransmitter Receptors Genes Are Associated with Immune Response, Inflammation and Cancer Hallmarks in Brain Tumors. Cancers (Basel) 2022, 14. [Google Scholar] [CrossRef]
  96. Deshpande, K.; Martirosian, V.; Nakamura, B.N.; Iyer, M.; Julian, A.; Eisenbarth, R.; Shao, L.; Attenello, F.; Neman, J. Neuronal Exposure Induces Neurotransmitter Signaling and Synaptic Mediators in Tumors Early in Brain Metastasis. Neuro Oncol 2022, 24, 914–924. [Google Scholar] [CrossRef]
  97. Choi, C.H.; Choi, J.J.; Park, Y.A.; Lee, Y.Y.; Song, S.Y.; Sung, C.O.; Song, T.; Kim, M.K.; Kim, T.J.; Lee, J.W.; et al. Identification of Differentially Expressed Genes According to Chemosensitivity in Advanced Ovarian Serous Adenocarcinomas: Expression of GRIA2 Predicts Better Survival. Br J Cancer 2012, 107, 91–99. [Google Scholar] [CrossRef] [PubMed]
  98. Zaman, S.; Chobrutskiy, B.I.; Sikaria, D.; Blanck, G. MAPT (Tau) Expression Is a Biomarker for an Increased Rate of Survival for Low-Grade Glioma. Oncol Rep 2019, 41, 1359–1366. [Google Scholar] [CrossRef] [PubMed]
  99. Lin, B.; Lee, H.; Yoon, J.-G.; Madan, A.; Wayner, E.; Tonning, S.; Hothi, P.; Schroeder, B.; Ulasov, I.; Foltz, G.; et al. Global Analysis of H3K4me3 and H3K27me3 Profiles in Glioblastoma Stem Cells and Identification of SLC17A7 as a Bivalent Tumor Suppressor Gene; Vol. 6;
  100. Huang, Q.; Lian, C.; Dong, Y.; Zeng, H.; Liu, B.; Xu, N.; He, Z.; Guo, H. SNAP25 Inhibits Glioma Progression by Regulating Synapse Plasticity via GLS-Mediated Glutaminolysis. Front Oncol 2021, 11. [Google Scholar] [CrossRef] [PubMed]
  101. Gao, Y.-F.; Mao, X.-Y.; Zhu, T.; Mao, C.-X.; Liu, Z.-X.; Wang, Z.-B.; Li, L.; Li, X.; Yin, J.-Y.; Zhang, W.; et al. Oncotarget 70494 Www.Impactjournals.Com/Oncotarget COL3A1 and SNAP91: Novel Glioblastoma Markers with Diagnostic and Prognostic Value; Vol. 7;
  102. Abramov, D.; Guy, N.; Guiberson, L.; Burré, J. STXBP1 Encephalopathies: Clinical Spectrum, Disease Mechanisms, and Therapeutic Strategies; C.
  103. Riggs, E.; Shakkour, Z.; Anderson, C.L.; Carney, P.R. SYT1-Associated Neurodevelopmental Disorder: A Narrative Review. Children 2022, 9. [Google Scholar] [CrossRef]
  104. Zhu, J.; Lin, Q.; Zheng, H.; Rao, Y.; Ji, T. The Pro-Invasive Factor COL6A2 Serves as a Novel Prognostic Marker of Glioma. Front Oncol 2022, 12. [Google Scholar] [CrossRef]
  105. Ren, J.; Da, J.; Hu, N. Identification of COL1A1 Associated with Immune Infiltration in Brain Lower Grade Glioma. PLoS One 2022, 17. [Google Scholar] [CrossRef]
  106. van Loon, K.; Yemelyanenko-Lyalenko, J.; Margadant, C.; Griffioen, A.W.; Huijbers, E.J.M. Role of Fibrillin-2 in the Control of TGF-β Activation in Tumor Angiogenesis and Connective Tissue Disorders. Biochim Biophys Acta Rev Cancer 2020, 1873. [Google Scholar] [CrossRef]
  107. Xu, B. Prediction and Analysis of Hub Genes between Glioblastoma and Low-Grade Glioma Using Bioinformatics Analysis. Medicine (United States) 2021, 100, E23513. [Google Scholar] [CrossRef]
  108. Zhang, Y.; Yang, H.; Wang, L.; Zhou, H.; Zhang, G.; Xiao, Z.; Xue, X. TOP2A Correlates with Poor Prognosis and Affects Radioresistance of Medulloblastoma. Front Oncol 2022, 12. [Google Scholar] [CrossRef]
  109. Zhou, T.; Wang, Y.; Qian, D.; Liang, Q.; Wang, B. Over-Expression of TOP2A as a Prognostic Biomarker in Patients with Glioma; 2018; Vol. 11;
  110. Sánchez, O.F.; Rodríguez, A. V.; Velasco-España, J.M.; Murillo, L.C.; Sutachan, J.J.; Albarracin, S.L. Role of Connexins 30, 36, and 43 in Brain Tumors, Neurodegenerative Diseases, and Neuroprotection. Cells 2020, 9. [Google Scholar] [CrossRef]
  111. Venkataramani, V.; Tanev, D.I.; Kuner, T.; Wick, W.; Winkler, F. Synaptic Input to Brain Tumors: Clinical Implications. Neuro Oncol 2021, 23, 23–33. [Google Scholar] [CrossRef] [PubMed]
  112. Parker, A.L.; Kavallaris, M.; McCarroll, J.A. Microtubules and Their Role in Cellular Stress in Cancer. Front Oncol 2014, 4 JUN.
  113. Walker, C.; Mojares, E.; Del Río Hernández, A. Role of Extracellular Matrix in Development and Cancer Progression. Int J Mol Sci 2018, 19. [Google Scholar] [CrossRef]
  114. Isakov, N. Protein Kinase C (PKC) Isoforms in Cancer, Tumor Promotion and Tumor Suppression. Semin Cancer Biol 2018, 48, 36–52. [Google Scholar] [CrossRef] [PubMed]
  115. Zhu, P.J.; Lovinger, D.M. Retrograde Endocannabinoid Signaling in a Postsynaptic Neuron/Synaptic Bouton Preparation from Basolateral Amygdala. Journal of Neuroscience 2005, 25, 6199–6207. [Google Scholar] [CrossRef] [PubMed]
  116. Benowitz, N.L.; Hukkanen, J.; Jacob, P. Nicotine Chemistry, Metabolism, Kinetics and Biomarkers. Handb Exp Pharmacol 2009, 192, 29–60. [Google Scholar]
  117. Savaskan, N.E.; Fan, Z.; Broggini, T.; Buchfelder, M.; Eyüpoglu, I.Y. Send Orders for Reprints to Reprints@benthamscience.Ae Neurodegeneration in the Brain Tumor Microenvironment: Glutamate in the Limelight; 2015; Vol. 13;
  118. Cao, L.; Chen, Y.; Zhang, M.; Xu, D. quan; Liu, Y.; Liu, T.; Liu, S.X.; Wang, P. Identification of Hub Genes and Potential Molecular Mechanisms in Gastric Cancer by Integrated Bioinformatics Analysis. PeerJ 2018, 2018. [Google Scholar] [CrossRef] [PubMed]
  119. Ma, Y.; Shen, N.; Wicha, M.S.; Luo, M. The Roles of the Let-7 Family of Micrornas in the Regulation of Cancer Stemness. Cells 2021, 10. [Google Scholar] [CrossRef]
  120. Zhang, W.T.; Zhang, G.X.; Gao, S.S. The Potential Diagnostic Accuracy of Let-7 Family for Cancer: A Meta-Analysis. Technol Cancer Res Treat 2021, 20. [Google Scholar] [CrossRef]
  121. Sanuki, R.; Yamamura, T. Tumor Suppressive Effects of Mir-124 and Its Function in Neuronal Development. Int J Mol Sci 2021, 22. [Google Scholar] [CrossRef]
  122. Yang, C.H.; Wang, Y.; Sims, M.; Cai, C.; Pfeffer, L.M. MicroRNA-1 Suppresses Glioblastoma in Preclinical Models by Targeting Fibronectin. Cancer Lett 2019, 465, 59–67. [Google Scholar] [CrossRef]
  123. Wang, L.; Liu, Y.; Song, J. MicroRNA-103 Suppresses Glioma Cell Proliferation and Invasion by Targeting the Brain-Derived Neurotrophic Factor. Mol Med Rep 2018, 17, 4083–4089. [Google Scholar] [CrossRef] [PubMed]
  124. Li, X.; Xu, M.; Ding, L.; Tang, J. MiR-27a: A Novel Biomarker and Potential Therapeutic Target in Tumors. J Cancer 2019, 10, 2836–2848. [Google Scholar] [CrossRef] [PubMed]
  125. Shala, A.L.; Arduino, I.; Salihu, M.B.; Denora, N. Quercetin and Its Nano-Formulations for Brain Tumor Therapy—Current Developments and Future Perspectives for Paediatric Studies. Pharmaceutics 2023, 15. [Google Scholar] [CrossRef] [PubMed]
  126. Palmieri, D.; Lockman, P.R.; Thomas, F.C.; Hua, E.; Herring, J.; Hargrave, E.; Johnson, M.; Flores, N.; Qian, Y.; Vega-Valle, E.; et al. Vorinostat Inhibits Brain Metastatic Colonization in a Model of Triple-Negative Breast Cancer and Induces DNA Double-Strand Breaks. Clinical Cancer Research 2009, 15, 6148–6157. [Google Scholar] [CrossRef]
  127. Richon, V.M. Cancer Biology: Mechanism of Antitumour Action of Vorinostat (Suberoylanilide Hydroxamic Acid), a Novel Histone Deacetylase Inhibitor. In Proceedings of the British Journal of Cancer; December 2006; Vol. 95.
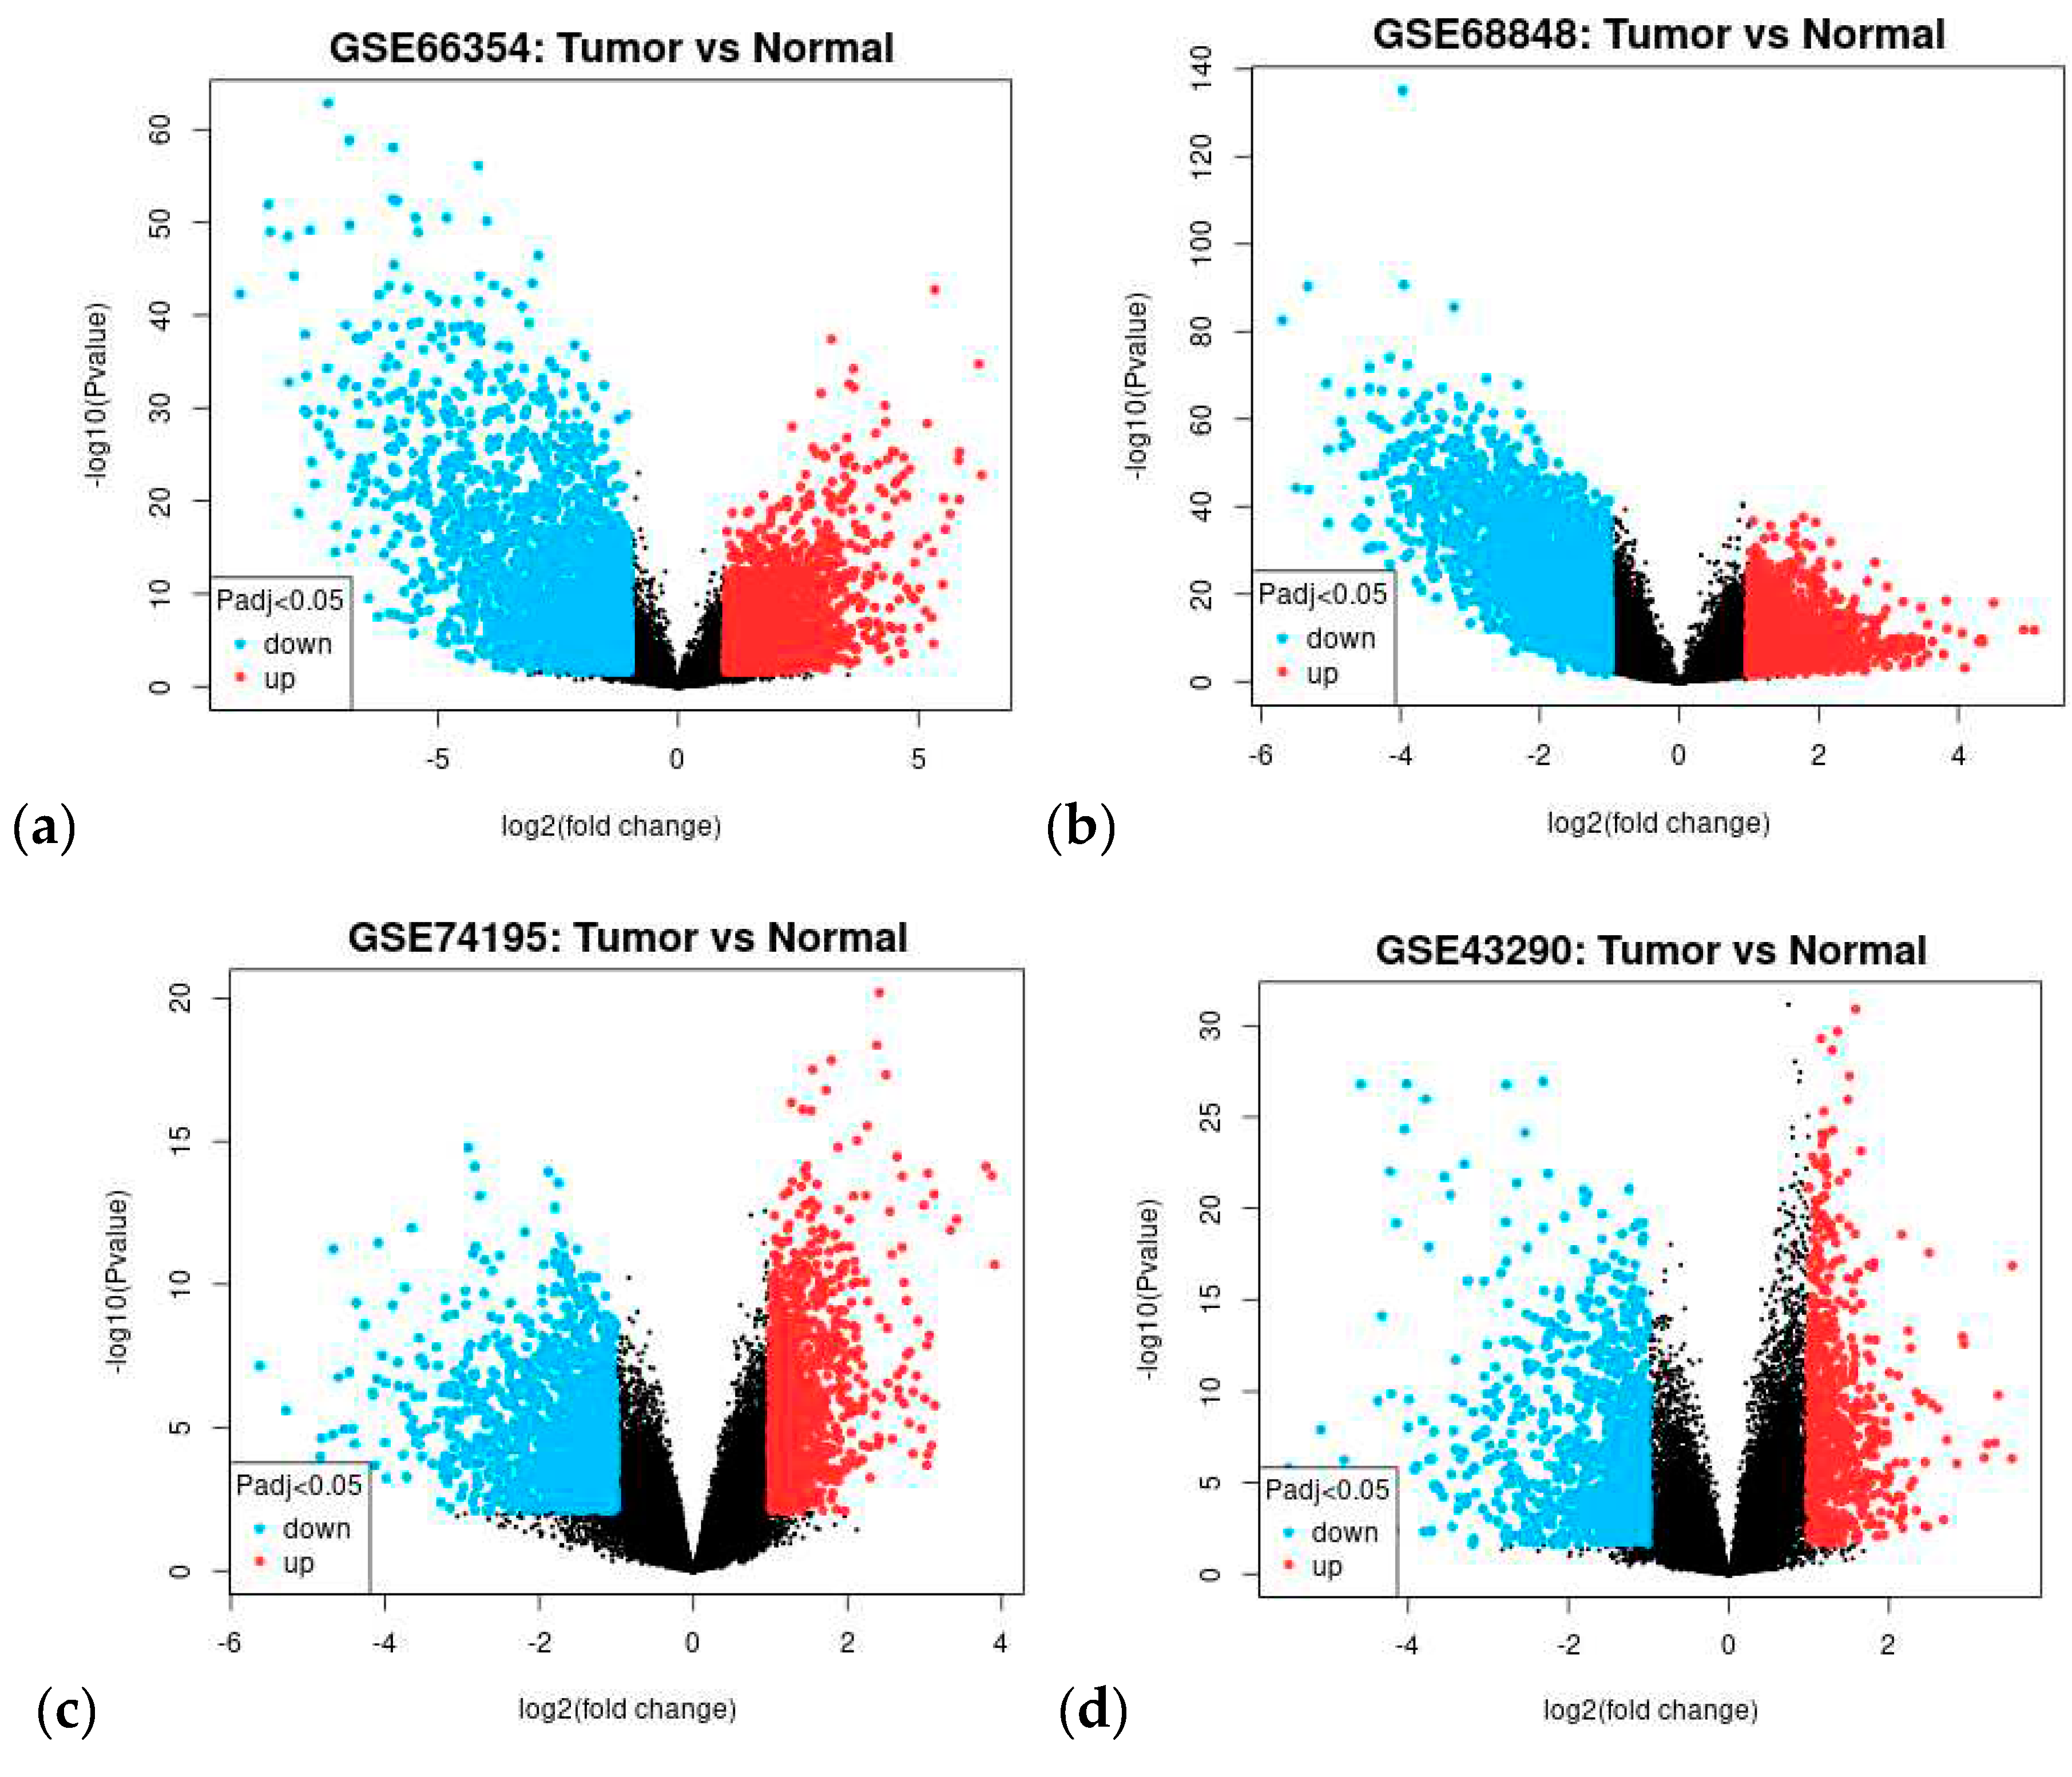
Figure 1. Volcano plot of differentially expressed genes for (a) GSE66354, (b) GSE68848, (c) GSE74195, and (d) GSE43290. Highlighted genes are differentially expressed genes following the adjusted p-value cutoff of ≤ 0.05 and log2FC threshold of ≥ 1 (upregulated) and ≤ -1 (downregulated). Red represents upregulated genes while blue represents downregulated genes.
Preprints 83618 g001
Figure 2. Venn diagram of intersected differentially expressed genes from GSE66354 (blue), GSE68848 (red), GSE74195 (green), and GSE43290 (yellow) datasets. Common DEGs are (a) upregulated and (b) downregulated.
Preprints 83618 g002
Figure 3. Protein-protein interaction network for the common differentially expressed genes of different CNS tumors obtained from the STRING database. The nodes are 90 and the number of edges is 185. Disconnected nodes were removed.
Preprints 83618 g003
Figure 4. Co-expression network of the DEGs. Green nodes are upregulated, and blue nodes are downregulated.
Preprints 83618 g004
Figure 5. Top 10 hub genes identified by Cytoscape-cytoHubba plugin through MCC algorithm. Rank is based on the intensity of color. Red is the highest rank to yellow is the lowest rank.
Preprints 83618 g005
Figure 6. Sub-networks based on clusters identified by the ClusterViz in the co-expression network. (a) cluster 1, (b) cluster 2, and (c) cluster 3. Highlighted nodes (yellow) are the highest edges (red) on their sub-network.
Preprints 83618 g006
Figure 7. Bubble plot of the KEGG and GO enrichment pathways of DEGs. (a) Cluster 1, (b) Cluster 2, and (c) Cluster 3.
Preprints 83618 g007
Figure 8. TFs-HDEGs-miRNAs coregulatory network. (a) Cluster 1, (b) Cluster 2, and (c) Cluster 3. Blue circle nodes are the hub genes, green square nodes are the transcription factors, and red triangle nodes are the miRNAs.
Preprints 83618 g008
Figure 9. Drug-Hub DEGs network. Blue circle nodes are downregulated genes from clusters 1 and 2, Green circle nodes are the upregulated genes from cluster 3, pink hexagons are the drugs with single hits, and purple diamonds are drugs that interact with more than one gene.
Preprints 83618 g009
Figure 10. Drug-Transcription factor network. Green box nodes are the transcription factors while the pink hexagon is the drugs with a single hit and purple diamond nodes are drugs with more than two hits.
Preprints 83618 g010
Figure 11. MiRNA families enriched from the miRNAs considered in this study. The number inside the parenthesis is the miRNA count. -Log10 (P-value) describes the enrichment of the miRNA family.
Preprints 83618 g011
Figure 12. Chord diagram of the top 5 genes in each of the nine CNS tumors corresponding KEGG and GO pathways. (a) upregulated genes and (b) downregulated genes.
Preprints 83618 g012
Table 1. Summary of central nervous system tumor datasets used and analyzed in this study.
NCBI GEO Accession GSE66354 a GSE68848 b GSE74195 c GSE43290 d
Published February 27, 2015 May 14, 2015 October 21, 2015 January 05, 2013
Type Expression profiling by array
Conditions 2 AA
17 ATRT
29 EPN-PFA
26 EPN-PFB
9 EPN-ST
19 GBM
4 MED-G3
7 MED-G4
8 MED-SHH
15 PA
13 normal brain tissue
148 ACM
228 GBM
67 ODG
67 unknown
11 mixed
1 unclassified
30 tumor cell lines
28 normal brain tissue
13 EPN
1 EPN-BM
5 PNET
27 MED
5 normal cerebellum tissue
47 MEN
4 normal meninges
Platform GPL570 [HG-U133_Plus_2] Affymetrix Human Genome U133 Plus 2.0 Array GPL96 [HG-U133A] Affymetrix Human Genome U133A Array
RNA Source Surgical CNS tumors and normal brain tissue
No. of Samples 149 580 51 51
a Anaplastic Astrocytoma (AA), Atypical Teratoid/Rhabdoid Tumors (ATRT), Posterior Fossa Group A Ependymomas (EPN-PFA), Posterior Fossa Group B Ependymomas (EPN-PFB), Supratentorial Ependymomas (EPN-ST), Glioblastomas (GBM), Group 3 Medulloblastomas (MED-G3), Group 4 Medulloblastomas (MED-G4), Sonic Hedgehog Group Medulloblastoma (MED-SHH), and Pilocytic Astrocytomas (PA). b Astrocytomas (ACM), Glioblastomas (GBM), and Oligodendrogliomas (ODG). c Ependymomas (EPN), Ependymoblastoma (EPN-BM), Primitive Neuroectodermal Tumors (PNET), and Medulloblastomas (MED). d Meningiomas (MEN).
Table 2. List of common differentially expressed genes from four CNS tumors datasets.
Differentially expressed genes Total Genes
Upregulated 17 COL1A1, PTBP1, TYMS, KDELR2, SOX4, PDLIM7, FZD2, ZFP36L2, COL6A2, RUVBL1, PPIB, FN1, SLC16A1, FBN2, MDK, GRN, TCF3
Downregulated 74 RTN1, PHYHIP, ALDOC, NEFH, PGBD5, CABP1, SYT13, DNM1, IDS, CAMK2B, MAP7, RUNX1T1, KCNAB1, SNCA, EPB41L3, MAGI1, KIF5C, GABRA1, ADARB1, ZNF365, TAGLN3, OPCML, MOBP, PDE4DIP, PEG3, TRPM3, RAPGEF5, NDRG4, STXBP1, NSG1, GABBR2, SH3GL2, EFR3A, PLP1, STMN2, CYFIP2, HSPA12A, MCTP1, SYNGR3, VSNL1, CACNA1A, RCAN2, OLFM1, MAPT, SEPTIN4, GUCY1B3, GABRB1, SNAP25, RIMS3, ITPR1, MYO5A, GABARAPL1, DUSP8, SLC17A7, DNAJC6, DNM3, SYT1, DOCK9, TUBB2A, HOMER1, FAIM2, EHD3, DYNC1I1, SLC12A5, NRIP3, PPP1R16B, GABARAPL1, PCP4, ADAM22, RUNDC3A, SNAP91, TUBB4A, GRIA2, SPOCK1
Table 3. Genes in each module were identified by ClusterViz and the top 10 hub genes were calculated by cytoHubba. Numbers inside the parenthesis indicate node score.
Cluster Gene names
Cluster 1 (5) GRIA2 (7), STXBP1 (6), DNM1 (5), CACNA1A (5), GABRA1 (4), MAPT (3), SNAP91 (3), SLC12A5 (3)
Cluster 2 (5) SNAP25 (10), SNCA (8), KIF5C (7), SH3GL2 (7), SYT1 (7), SLC17A7 (5), DYNC1I1 (5), NEFH (4), TUBB2A (4), STMN2 (3), TUBB4A (3), DNAJC6 (3), MOBP (2), CAMK2B (2), DNM3 (2)
Cluster 3 (4) COL1A1 (3), COL6A2 (3), FBN2 (3), FN1 (3)
Top 10 GRIA2 (9), SLC17A7 (9), SNAP25 (9), STXBP1 (9), SYT1 (9), DNM1 (8), CACNA1A (7), GABRA1 (6), MAPT (6), SNAP91 (6)
Table 4. Hub DEGs and their description.
Gene name Gene description
CACNA1A Calcium voltage-gated channel subunit alpha1 A
DNM1 Dynamin 1
GABRA1 Gamma-aminobutyric acid type A receptor subunit alpha1
GRIA2 Glutamate ionotropic receptor AMPA type subunit 2
MAPT Microtubule-associated protein tau
SLC17A7 Solute carrier family 17-member 7
SNAP25 Synaptosome-associated protein 25
SNAP91 Synaptosome-associated protein 91
STXBP1 Syntaxin binding protein 1
SYT1 Synaptotagmin 1
COL1A1 Collagen type I alpha 1 chain
COL6A2 Collagen type VI alpha 2 chain
FBN2 Fibrillin 2
FN1 Fibronectin 1
Table 5. Transcription factors co-express with hub genes.
Transcription factors Gene targets Cluster
ARNT CAMK2B, SLC17A7, SYT1 Cluster 2
ATF1 NEFH, SNAP25, TUBB4A & FN1, COL1A1 Cluster 2 & Cluster 3
ATF2 NEFH, SH3GL2, SNAP25 Cluster 2
ATF4 CAMK2B, NEFH, SNAP25 Cluster 2
BCL11A SNAP25, SLC17A7, TUBB4A Cluster 2
CREB1 NEFH, SH3GL2, SLC17A7, SNAP25 Cluster 2
CTCF CAMK2B, SLC17A7, TUBB4A Cluster 2
E2F5 CAMK2B, SLC17A7, TUBB4A Cluster 2
EGR1 GRIA2, MAPT, STXBP1 & CAMK2B, NEFH, SLC17A7, TUBB2A & FN1, COL1A1 Cluster 1, Cluster 2 & Cluster 3
ELF1 DNAJC6, SLC17A7, TUBB4A Cluster 2
ELK1 DNAJC6, SLC17A7, SNCA Cluster 2
EZH2 GRIA2, SNAP91, SLC12A5 & KIF5C, SH3GL2, SLC17A7, STMN2, TUBB4A Cluster 1 & Cluster 2
KDM5B DNM3, SLC17A7, TUBB2A Cluster 2
KLF1 KIF5C, SLC17A7, TUBB2A Cluster 2
MAX GABRA1, MAPT, STXBP1 & DNAJC6, NEFH, SLC17A7 Cluster 1 & Cluster 2
MEF2A CAMK2B, SNAP25, SYT1 Cluster 2
PHF8 DNM3, SLC17A7, TUBB2A Cluster 2
PRKCA DNM1, GRIA2, STXBP1 Cluster 1
REST GRIA2, MAPT, SLC12A5 & DNAJC6, NEFH, SNAP25, STMN2, TUBB2A Cluster 1 & Cluster 2
RREB1 CAMK2B, NEFH, SYT1 Cluster 2
SAP30 DNM3, SLC17A7, TUBB2A Cluster 2
SP1 CAMK2B, DNAJC6, DYNC1I1, SLC17A7, TUBB2A& FN1, COL1A1 Cluster 2 & Cluster 3
SP3 SNAP25, STMN2, TUBB2A Cluster 2
SREBF1 DNM1, SNAP91, STXBP1 Cluster 1
TFAP2A MAPT, SNAP91, STXBP1 & SLC17A7, SNAP25, SYT1 Cluster 1 & Cluster 2
TFAP2C DNAJC6, SNAP25, SLC17A7 Cluster 2
TFAP4 DNAJC6, SH3GL2, SNCA Cluster 2
YY1 SLC17A7, SNAP25, SYT1 Cluster 2
ZBTB7A DNM1, MAPT, STXBP1 Cluster 1
ZEB1 SLC17A7, SNAP25, TUBB2A Cluster 2
ZFP2 COL1A1, FBN2, FN1 Cluster 3
ZNF501 SLC17A7, SNCA, STMN2 Cluster 2
ZNF71 DNM3, DYNC1I1, SLC17A7, TUBB4A Cluster 2
Table 6. miRNAs co-regulating with hub genes.
miRNAs Gene targets Cluster
hsa-miR-137 GABRA1, SNAP91 ,SLC12A5 Cluster 1
hsa-miR-16 DYNC1I1, KIF5C, SH3GL2, SNAP25, SNCA Cluster 2
hsa-miR-181a GABRA1, GRIA2, SLC12A5 Cluster 1
hsa-miR-181b GABRA1, GRIA2, SLC12A5 Cluster 1
hsa-miR-181c GABRA1, GRIA2, SLC12A5 Cluster 1
hsa-miR-181d GABRA1, GRIA2, SLC12A5 Cluster 1
hsa-miR-195 DYNC1I1, KIF5C, SH3GL2, SNAP25, SNCA Cluster 2
hsa-let-7a-5p DNAJC6, SYT1, TUBB2A, TUBB4A Cluster 2
hsa-let-7b-5p DNM3, SYT1, TUBB2A, TUBB4A Cluster 2
hsa-let-7c-5p DNAJC6, SYT1, TUBB2A, TUBB4A Cluster 2
hsa-let-7d-5p SYT1, TUBB2A, TUBB4A Cluster 2
hsa-let-7e-5p SYT1, TUBB2A, TUBB4A Cluster 2
hsa-let-7f-5p SYT1, TUBB2A, TUBB4A Cluster 2
hsa-let-7g-5p SYT1, TUBB2A, TUBB4A Cluster 2
hsa-let-7i-5p SYT1, TUBB2A, TUBB4A Cluster 2
hsa-miR-1 DNM3, SNAP25, SYT1 Cluster 2
hsa-miR-103 DYNC1I1, KIF5C, SH3GL2 Cluster 2
hsa-miR-106a DNM3, KIF5C, SLC17A7 Cluster 2
hsa-miR-107 DYNC1I1, KIF5C, SH3GL2 Cluster 2
hsa-mir-124-3p DNM3, KIF5C, TUBB4A & COL1A1, COL6A2 Cluster 2 & Cluster 3
hsa-miR-130a DNM3, KIF5C, SNAP25, SYT1 Cluster 2
hsa-miR-130b DNM3, KIF5C, SNAP25, SYT1 Cluster 2
hsa-miR-135b DNM3, MOBP, SYT1 Cluster 2
hsa-miR-138 DNM3, SLC17A7, SNAP25 Cluster 2
hsa-miR-148b DNM3, MOBP, SYTI Cluster 2
hsa-miR-153 DNM3, SNAP25, SNCA, SYT1 Cluster 2
hsa-miR-15a DYNC1I1, NEFH, SH3GL2, SNCA Cluster 2
hsa-miR-206 DNM3, SNAP25, SYT1 Cluster 2
hsa-miR-221 DNM3, MOBP, NEFH Cluster 2
hsa-miR-222 DNM3, MOBP, NEFH Cluster 2
hsa-miR-23a DNAJC6, DNM3, NEFH, SNAP25 Cluster 2
hsa-miR-23b DNAJC6, DNM3, NEFH, SNAP25 Cluster 2
hsa-miR-27a DNM3, SNAP25, SYT1 Cluster 2
hsa-miR-27b DNM3, SNAP25, SYT1 Cluster 2
hsa-miR-301 DNM3, KIF5C, SNAP25 Cluster 2
hsa-miR-301b DNM3, KIF5C, SNAP25 Cluster 2
hsa-mir-335-5p DYNC1I1, NEFH, SLC17A7, SYT1 Cluster 2
hsa-miR-429 SNAP25, SYT1, TUBB2A Cluster 2
hsa-mir-4458 TUBB2A, TUBB4A, SYT1 Cluster 2
hsa-mir-4500 TUBB2A, TUBB4A, SYT1 Cluster 2
hsa-miR-497 DYNC1I1, KIF5C, SH3GL2 Cluster 2
hsa-miR-519b-3p NEFH, SLC17A7, SYT1 Cluster 2
hsa-miR-519c-3p KIF5C, NEFH, SLC17A7, SYT1 Cluster 2
hsa-miR-519d NEFH, KIF5C, SLC17A7 Cluster 2
hsa-mir-8485 MOBP, KIF5C, SYT1 Cluster 2
hsa-mir-98-5p TUBB2A, TUBB4A, SYT1 Cluster 2
Table 7. Drugs with more than two gene interactions.
Drug Degree Target HDEGs
Curcumin 3 MAPT, TUBB2A, TUBB4A
Ocriplasmin 3 COL1A1, COL6A2, FN1
Table 8. Drugs with more than two transcription factor interactions.
Drug Degree Target TFs Target HDEGs
Cisplatin 5 GABPA, MYC, SMARCA4, STAT1, TP53 MAPT
Daunorubicin 5 CBFB, GATA1, IKZF1, THRB, WT1 MAPT
Cytarabine 4 GATA1, IKZF1, TP53, WT1 -
Palbociclib 4 CDK5, DYRK1A, SMARCA4, TP53 -
Resveratrol 4 NFKB1, PRKCA, RELA, TP53 MAPT
Doxorubicin hydrochloride 3 THRB, TP53, ZEB1 MAPT, SNCA
Doxorubicin 3 EZH2, SP3, ZEB1 -
Gemcitabine 3 CDC5L, POLR2A, TP53 -
Indoprofen 3 NFKB1, RELA, TP53 -
Levothyroxine 3 AHR, PPARG, THRB -
Methotrexate 3 IKZF1, PPARG, TP53 -
Niclosamide 3 AHR, STAT3, TP53 MAPT
Quercetin 3 NFKB1, PRKCA, RELA MAPT
Vorinostat 3 EZH2, MYC, TP53 TUBB2A, TUBB4A
Table 9. Drugs that interact with TFs and HDEGs with more than two hits.
Drug Degree TFs HDEGs
Paclitaxel 4 FOS, TP53 TUBB2A, TUBB4A
Colchicine 3 JUN TUBB2A, TUBB4A
Daunorubicin hydrochloride 3 THRB, TP53 MAPT
Docetaxel anhydrous 3 TP53 TUBB2A, TUBB4A
Epigallocatechin gallate 3 DYRK1A, NFKB1 MAPT
Fenretinide 3 NFKB1, TP53 MAPT
Hexachlorophene 3 THRB, TP53 MAPT
Masoprocol 3 NFKB1, TP53 MAPT
Nifedipine 3 NFKB1 CAMK2B, MAPT
Nitazoxanide 3 AHR, TP53 MAPT
Phenobarbital 3 FOS GABRA1, GRIA2
Raloxifene hydrochloride 3 PPARG, TP53 MAPT
Trifluoperazine 3 TP53 CAMK2B, SNAP91
Vinblastine sulfate 3 JUN TUBB2A, TUBB4A
Vinorelbine 3 SMARCA4 TUBB2A, TUBB4A
Vinorelbine tartrate 3 JUN TUBB2A, TUBB4A
Table 10. Enriched miRNA families and their corresponding miRNAs.
miRNA Family miRNAs
let-7 family hsa-let-7a-1, hsa-let-7a-2, hsa-let-7a-3, hsa-let-7b, hsa-let-7c, hsa-let-7d, hsa-let-7e, hsa-let-7f-1, hsa-let-7f-2, hsa-let-7g, hsa-let-7i, hsa-mir-98
mir-124 family hsa-mir-124-1, hsa-mir-124-2, hsa-mir-124-3
mir-1 family hsa-mir-1-1, hsa-mir-1-2, hsa-mir-206
mir-103 family hsa-mir-130a, hsa-mir-130b, hsa-mir-301b
mir-27 family hsa-mir-27a, hsa-mir-27b
Table 11. Validated candidate repurposed drugs by CMAP analysis and their regulatory effects.
Drugs Upregulated gene Downregulated gene
Colchicine - DNM3, SLC12A5, TUBB2A
Doxorubicin COL1A1, FN1, SNCA -
Indoprofen COL1A1 -
Levothyroxine COL1A1, SLC17A7 -
Methotrexate CAMK2B, KIF5C, SNCA SLC12A5, STXBP1
Nifedipine COL1A1, DYNC1I1, FN1, KIF5C DYNC1I1, STXBP1
Paclitaxel CAMK2B, DNAJC6, SLC12A5, SLC17A7 DNM1
Quercetin SNCA -
Raloxifene SLC12A5 DNM1, DNM3
Resveratrol COL1A1, MAPT, SNCA -
Trifluoperazine CAMK2B, COL1A1, FN1, TUBB2A DNM3
Vinblastine COL1A1, KIF5C TUBB2A
Vorinostat DNAJC6, DNM3, KIF5C, SLC17A7, STXBP1, SYT1, TUBBA2A -
Table 12. The top 5 upregulated and downregulated differentially expressed genes for each type of CNS or brain tumor.
Regulation ATRT EPN PA MED PNET MEN ACM ODG GBM
Upregulated TOP2A FAM81B POSTN SOX11 MEST YWHAE SOX4 SOX4 LTF
TMSB15B CFAP126 CFI OTX2 VIM TNNC1 TOP2A TOP2A TOP2A
MFAP2 CAPSL COL20A1 DACH1 COL3A1 EIF5A NKAIN4 HES6 ASPM
MELK ARMC3 TRPM8 SOX4 MGP COL9A3 HES6 NDC80 IGFBP2
HMGA2 SPAG6 PLA2G2A COL1A1 COL1A1 CLIC3 LCAT TIMP4 NDC80
Downregulated VSNL1 RAB3C SLC12A5 MBP SNAP25 MBP MFSD4A MFSD4A MFSD4A
GABRG2 SLC12A5 GJB6 CRTAM DIRAS2 CXCL2 RGS4 GJB6 GABRA1
GJB6 MYT1L PPP2R2C VSNL1 STMN2 MAFF CACNG3 RGS4 GJB6
PACSIN1 NEFL SYNPR GABRB2 ANK3 SNAP25 GABRA1 GABRA1 CACNG3
SV2B SV2B PACSIN1 PVALB MBP MYH11 DDN VSNL1 SLITRK4
Disclaimer/Publisher’s Note: The statements, opinions and data contained in all publications are solely those of the individual author(s) and contributor(s) and not of MDPI and/or the editor(s). MDPI and/or the editor(s) disclaim responsibility for any injury to people or property resulting from any ideas, methods, instructions or products referred to in the content.
Copyright: This open access article is published under a Creative Commons CC BY 4.0 license, which permit the free download, distribution, and reuse, provided that the author and preprint are cited in any reuse.
Prerpints.org logo

Preprints.org is a free preprint server supported by MDPI in Basel, Switzerland.

Subscribe

© 2024 MDPI (Basel, Switzerland) unless otherwise stated