Submitted:
31 August 2023
Posted:
01 September 2023
You are already at the latest version
Abstract
Keywords:
1. Introduction
2. Analyzing methods for wildfire monitoring
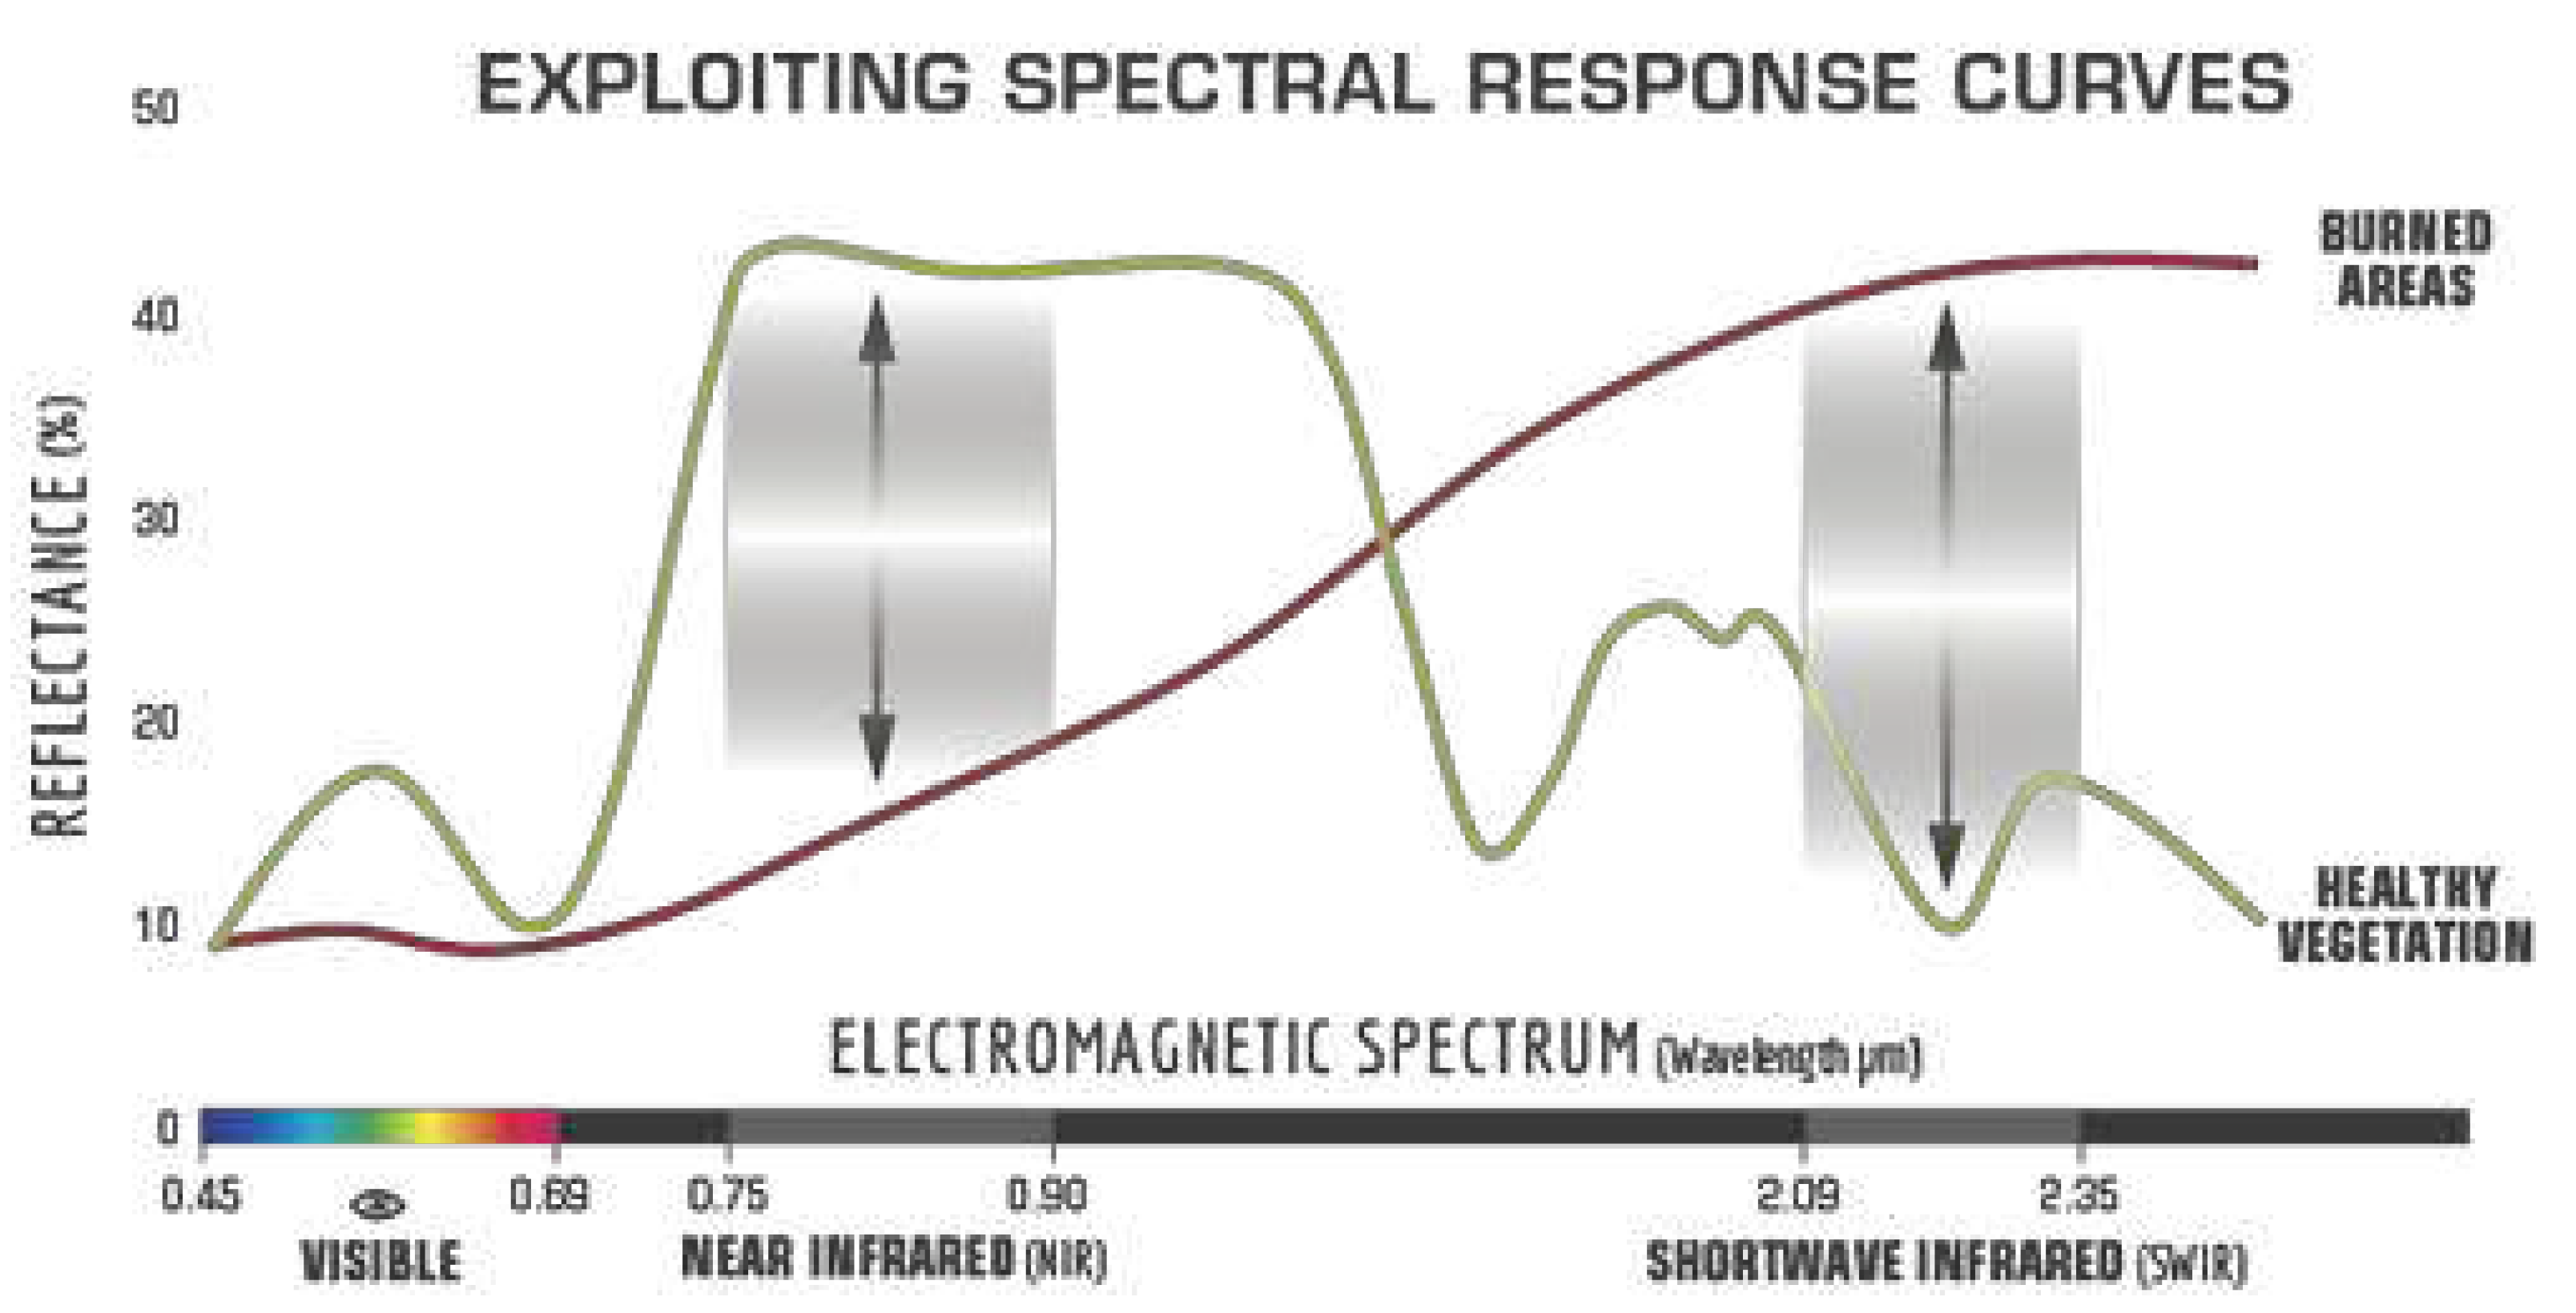
2.1. Spectral response for satellite images
2.2. Statistical analysis response
3. Wildfire case study
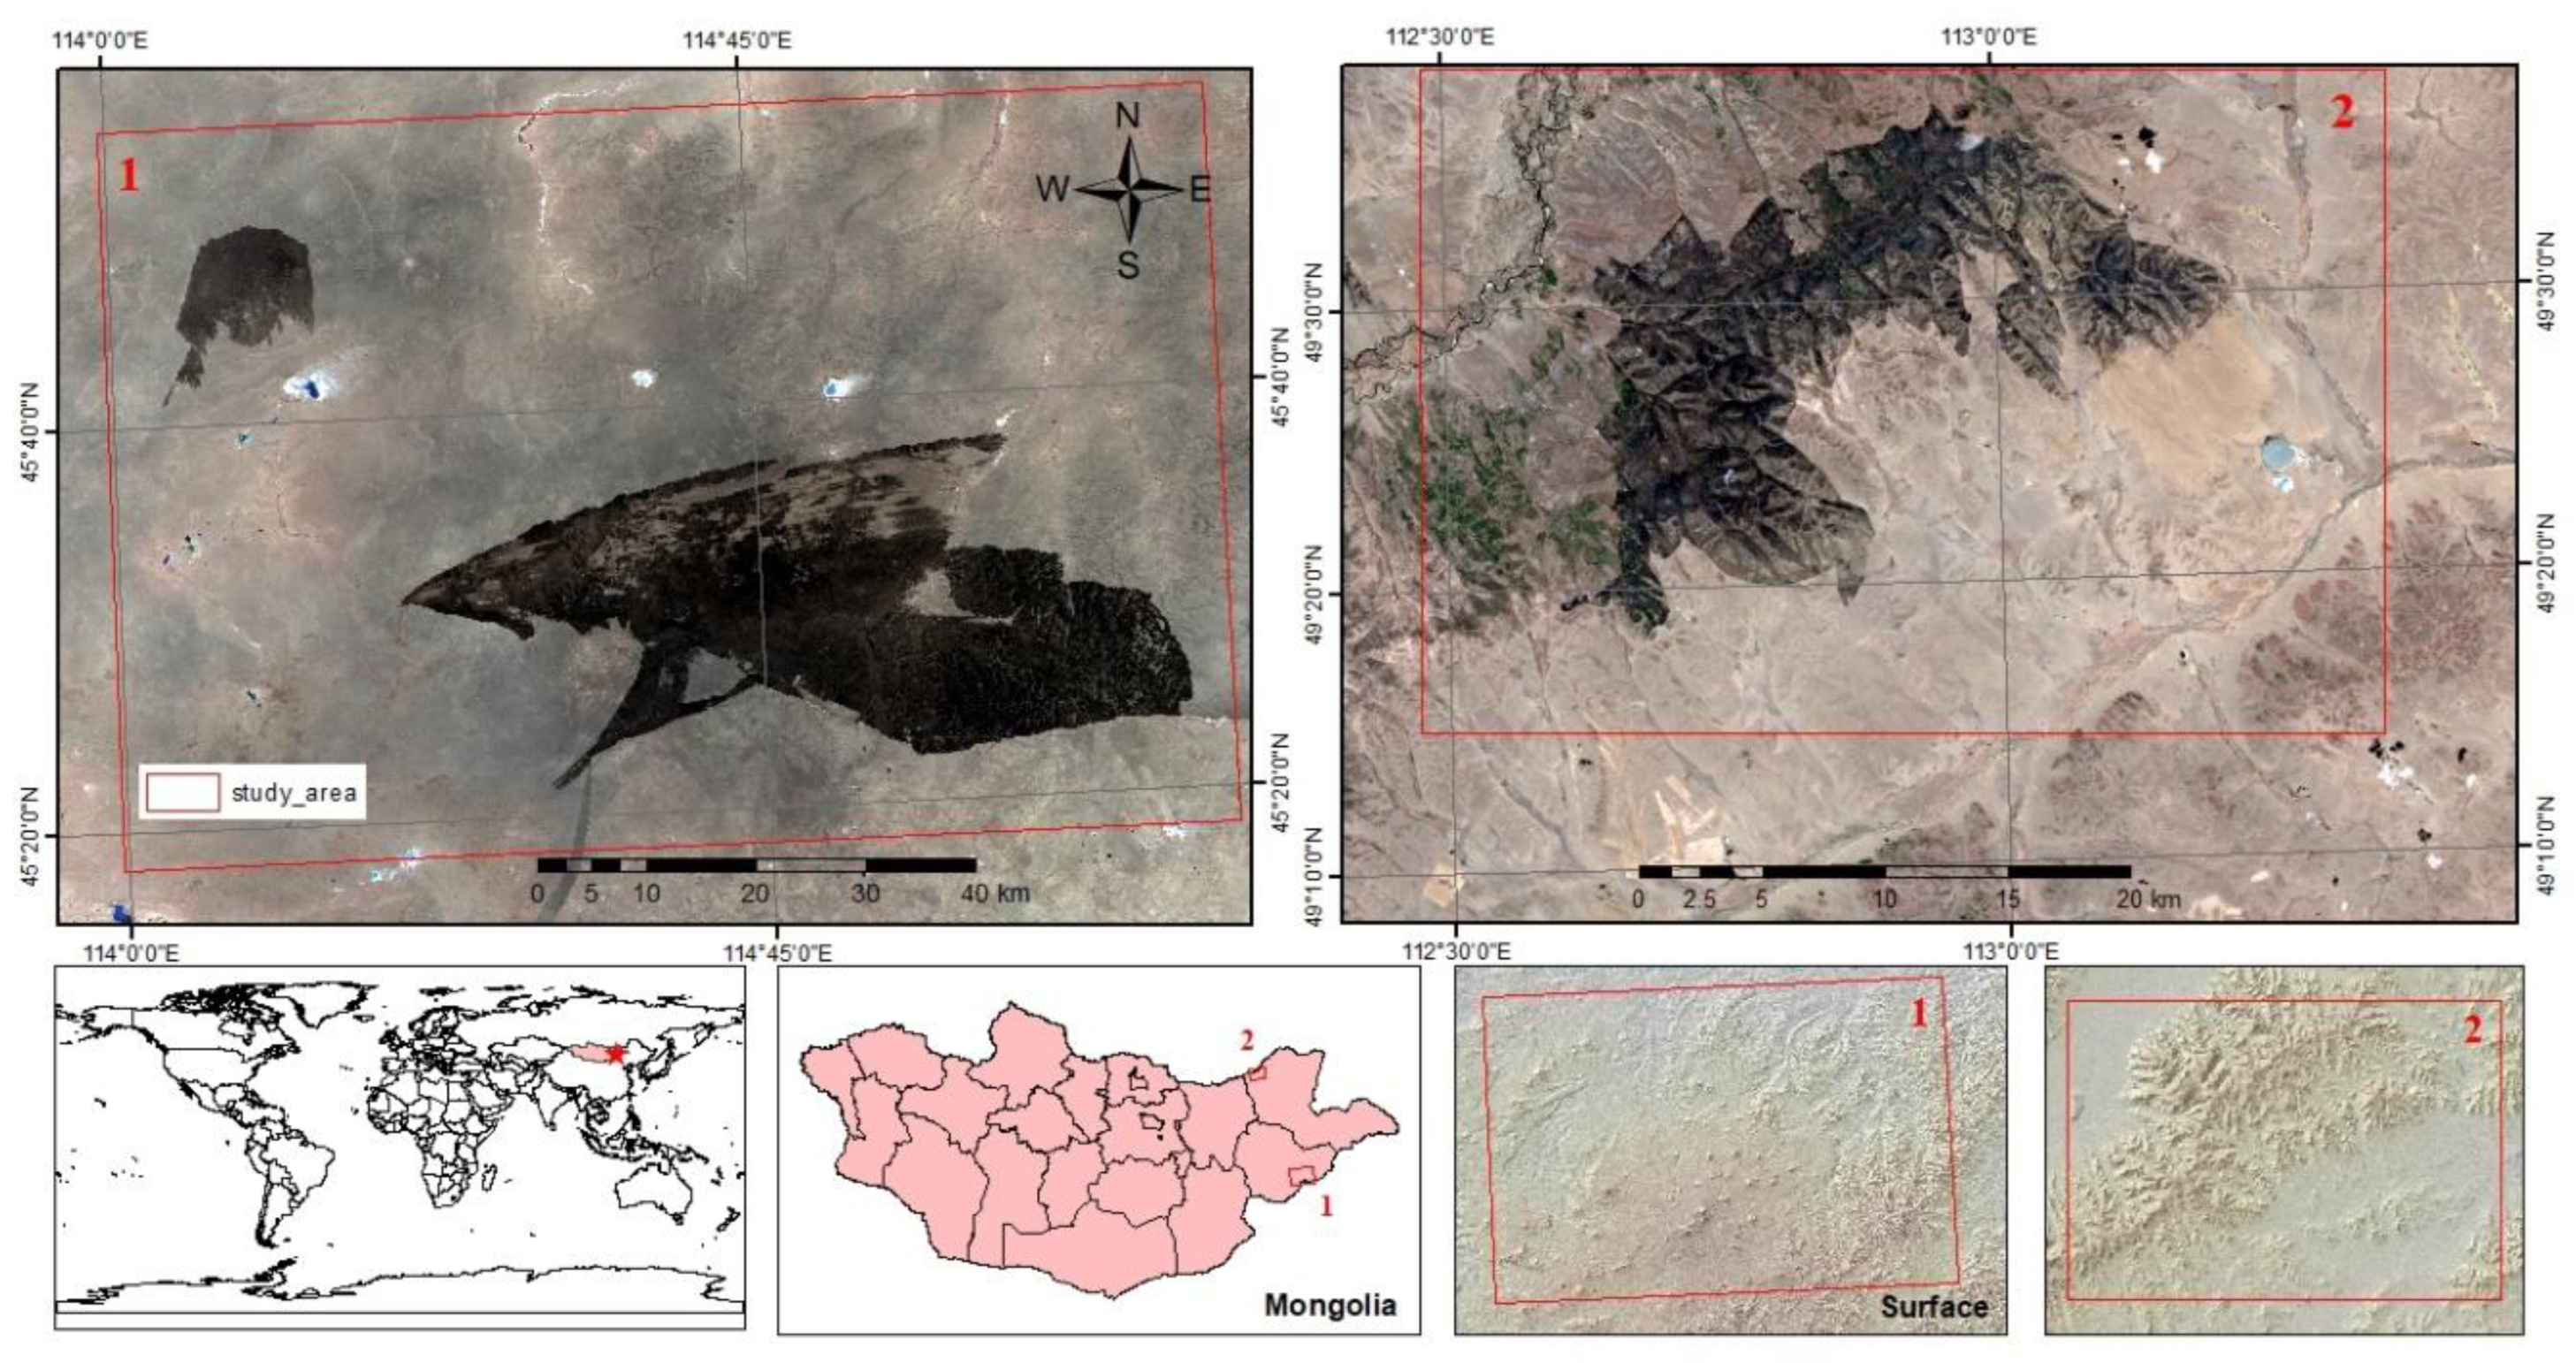
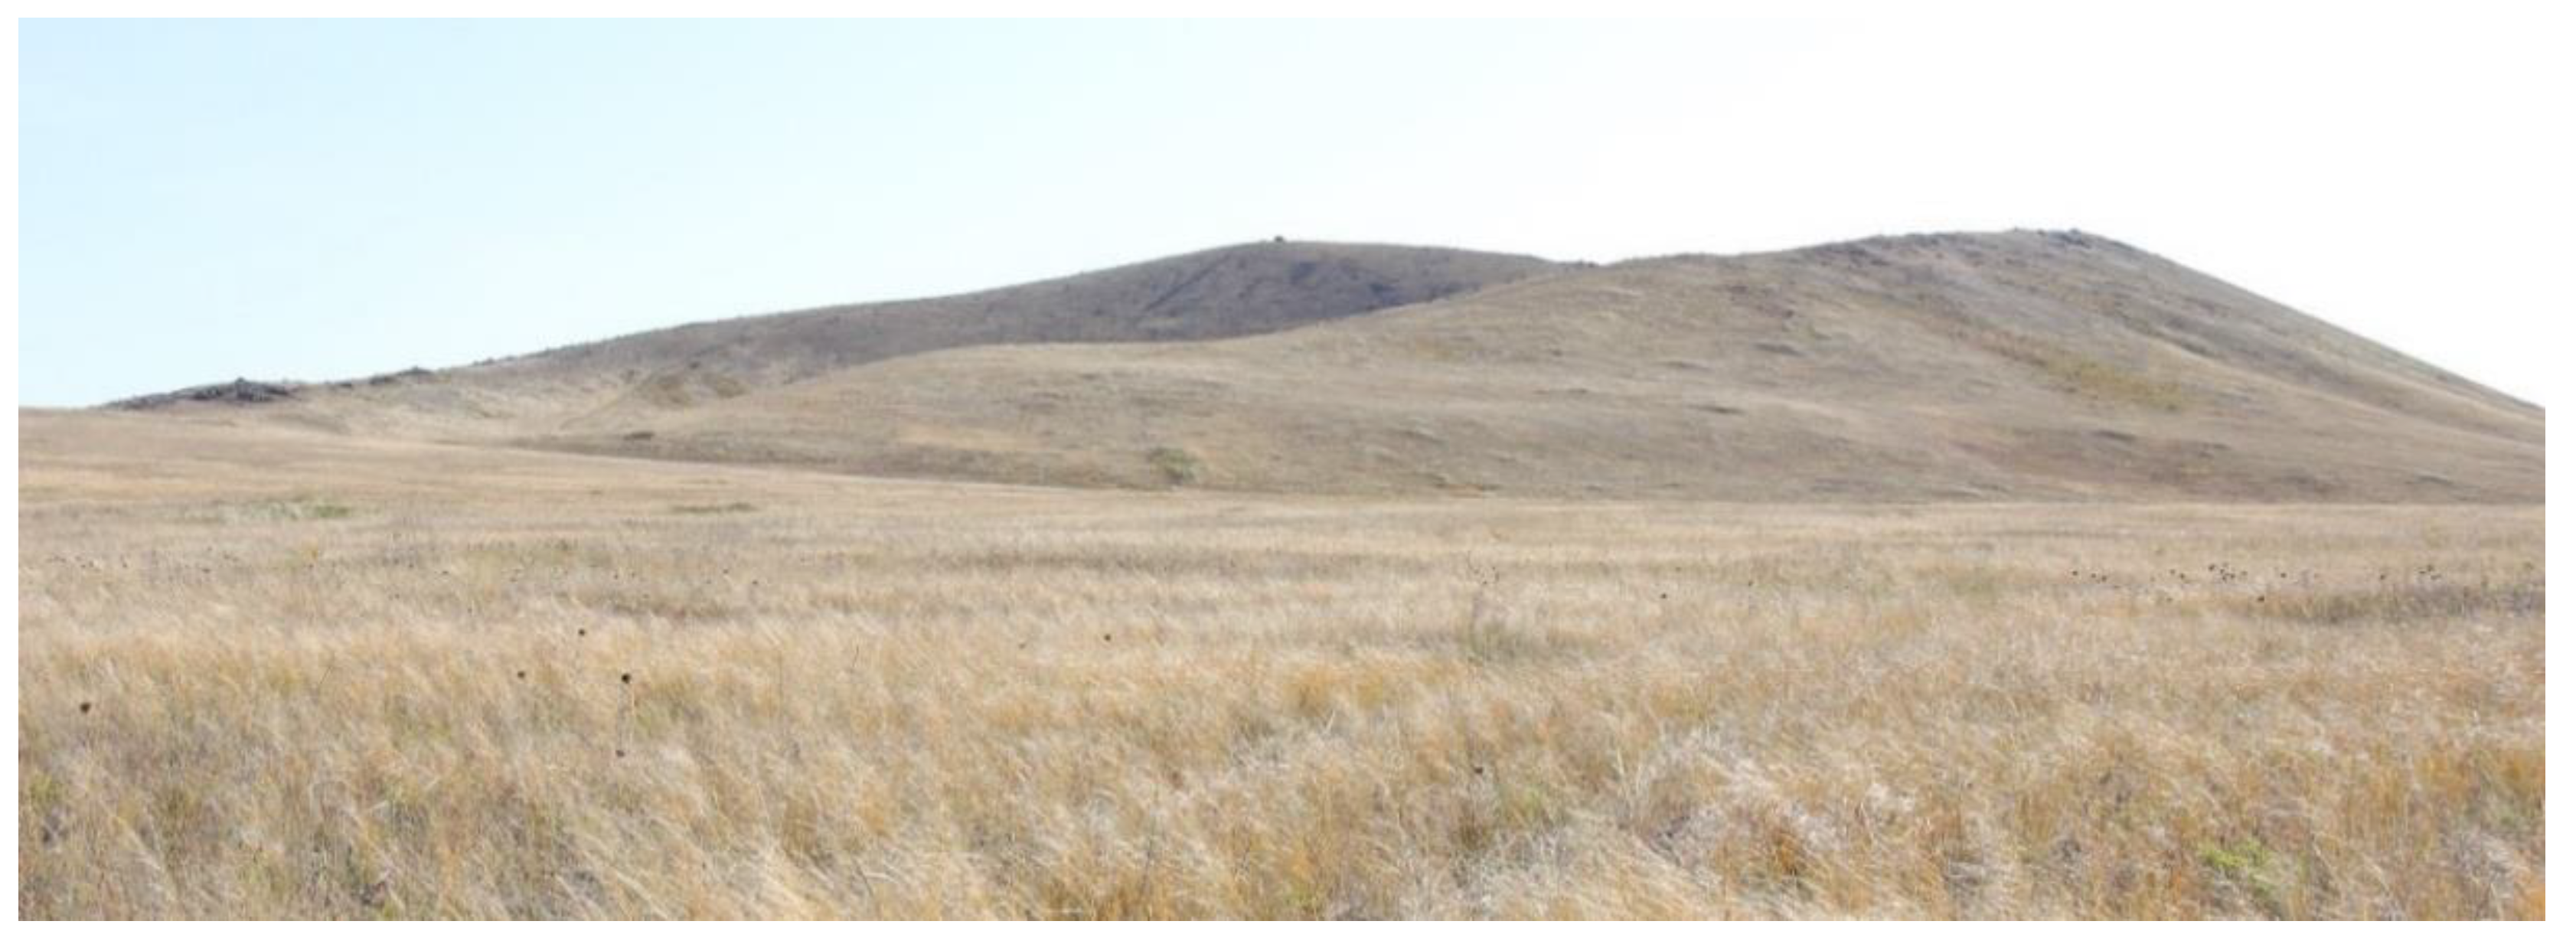
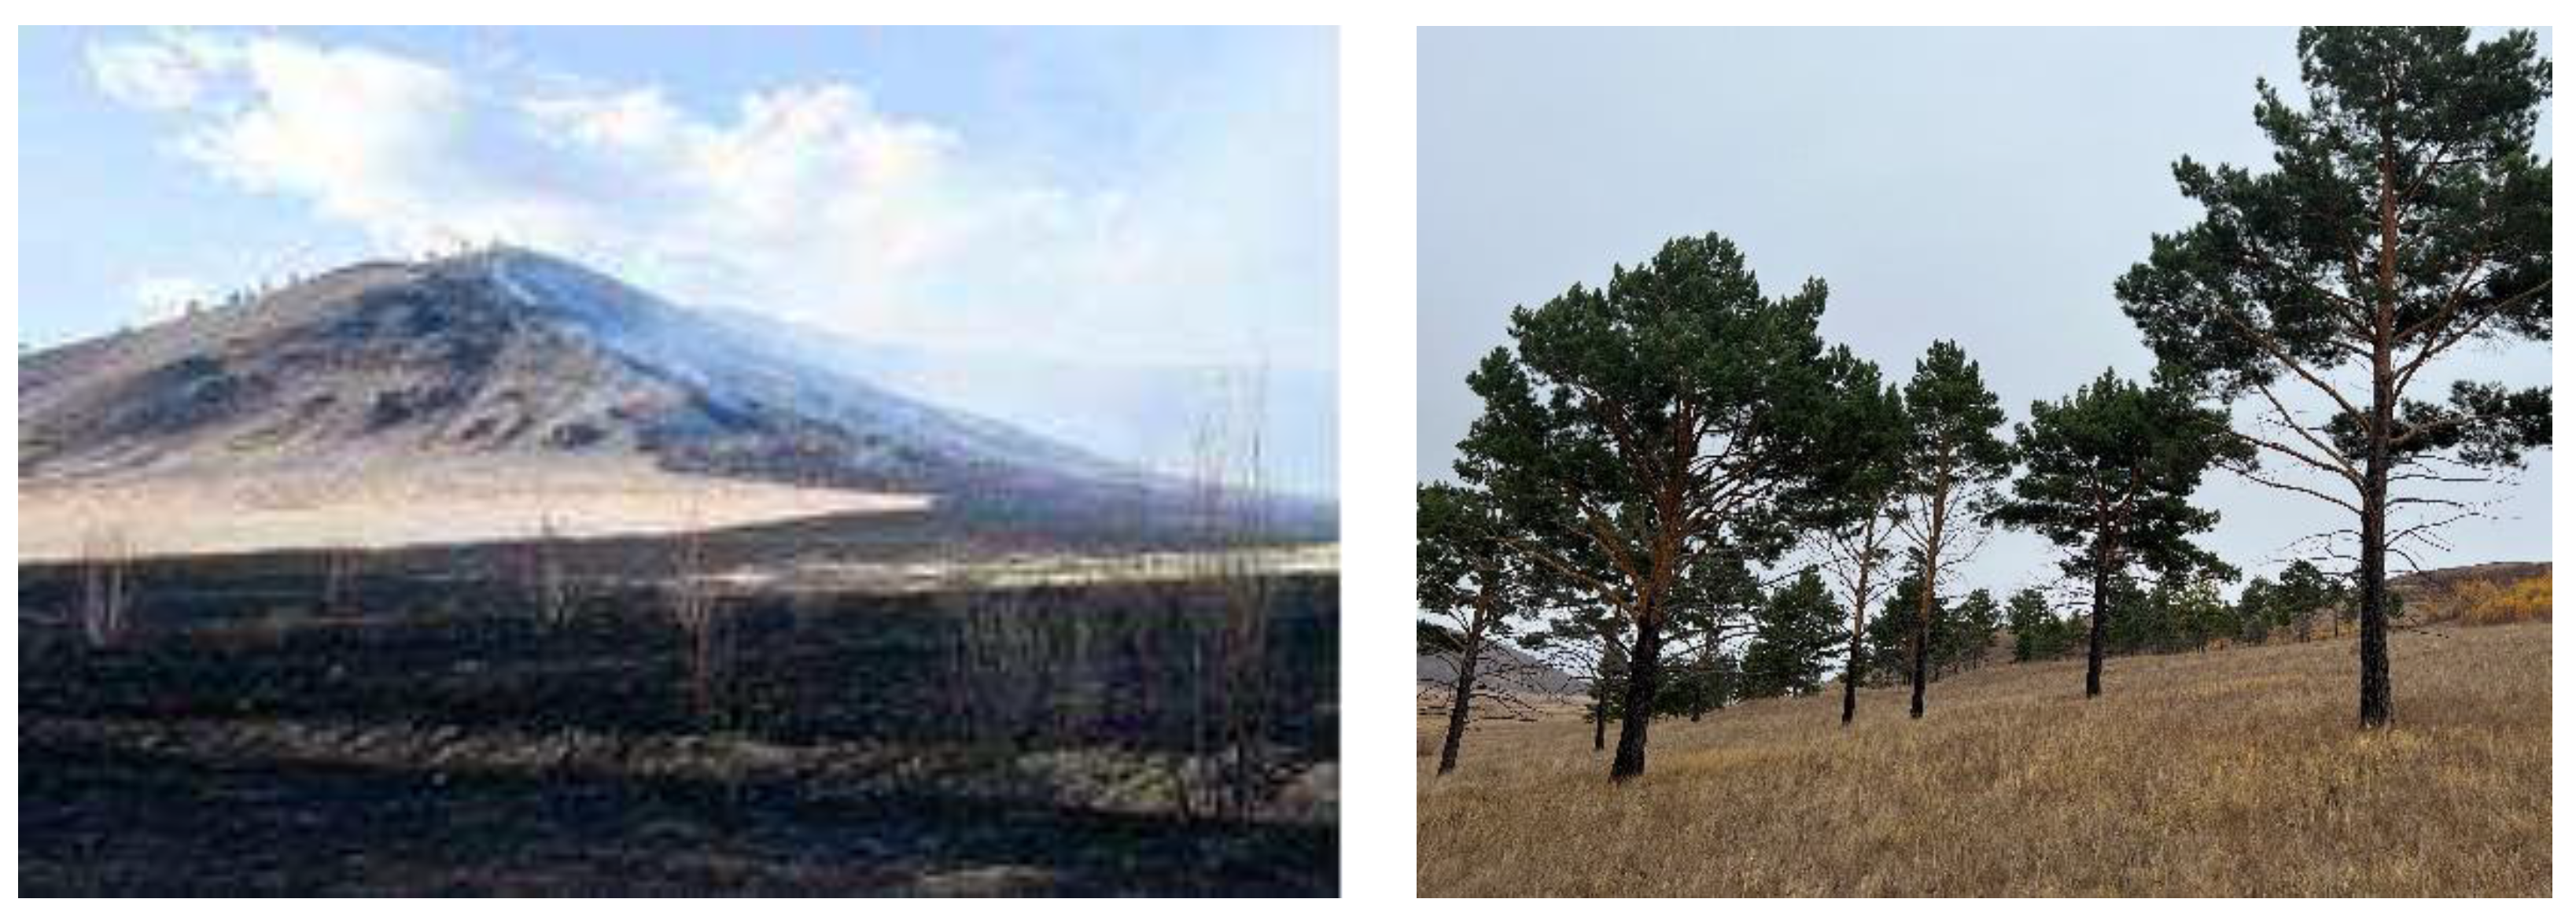
3.1. Study Areas
3.2. Data collection and processing
4. Results
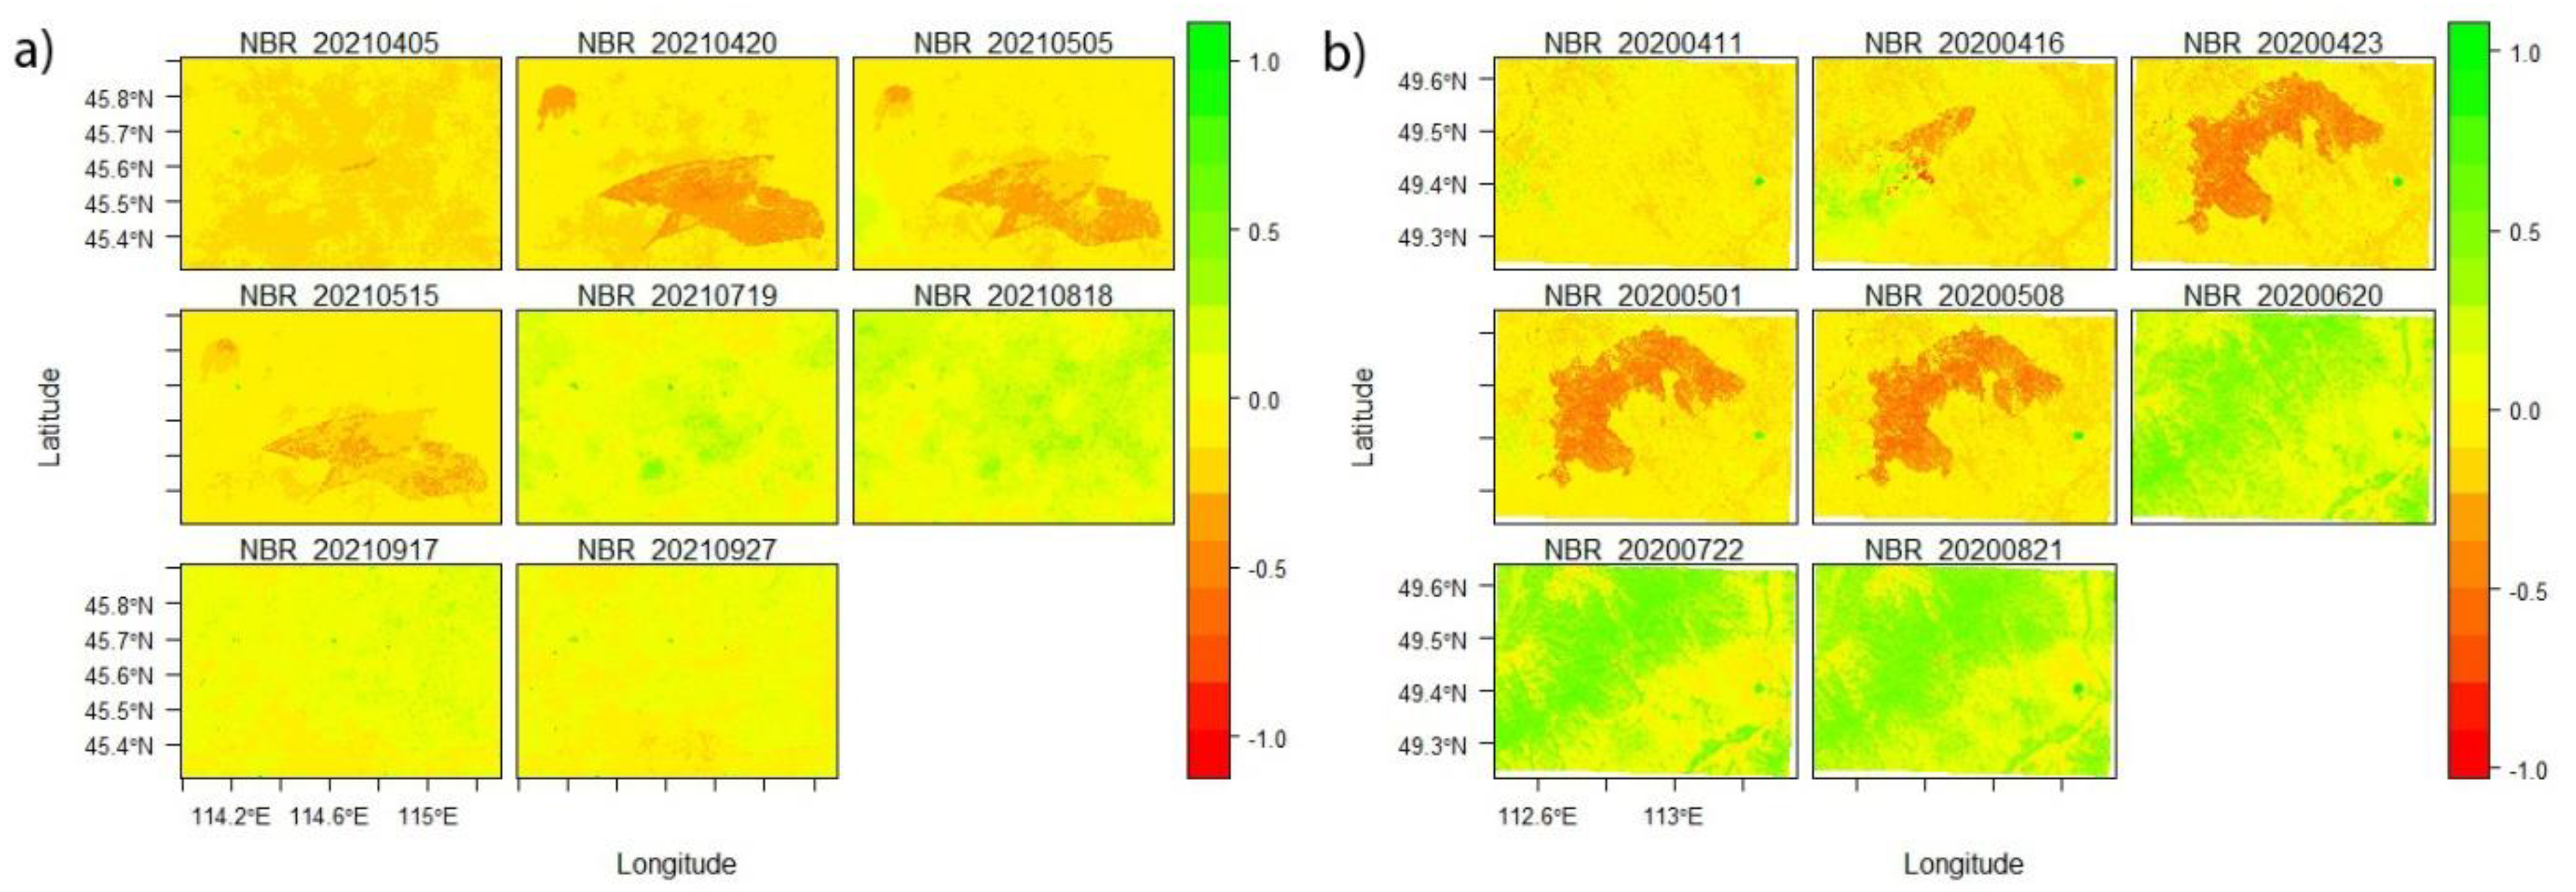
4.1. Estimation of Normalized Burn Ratio
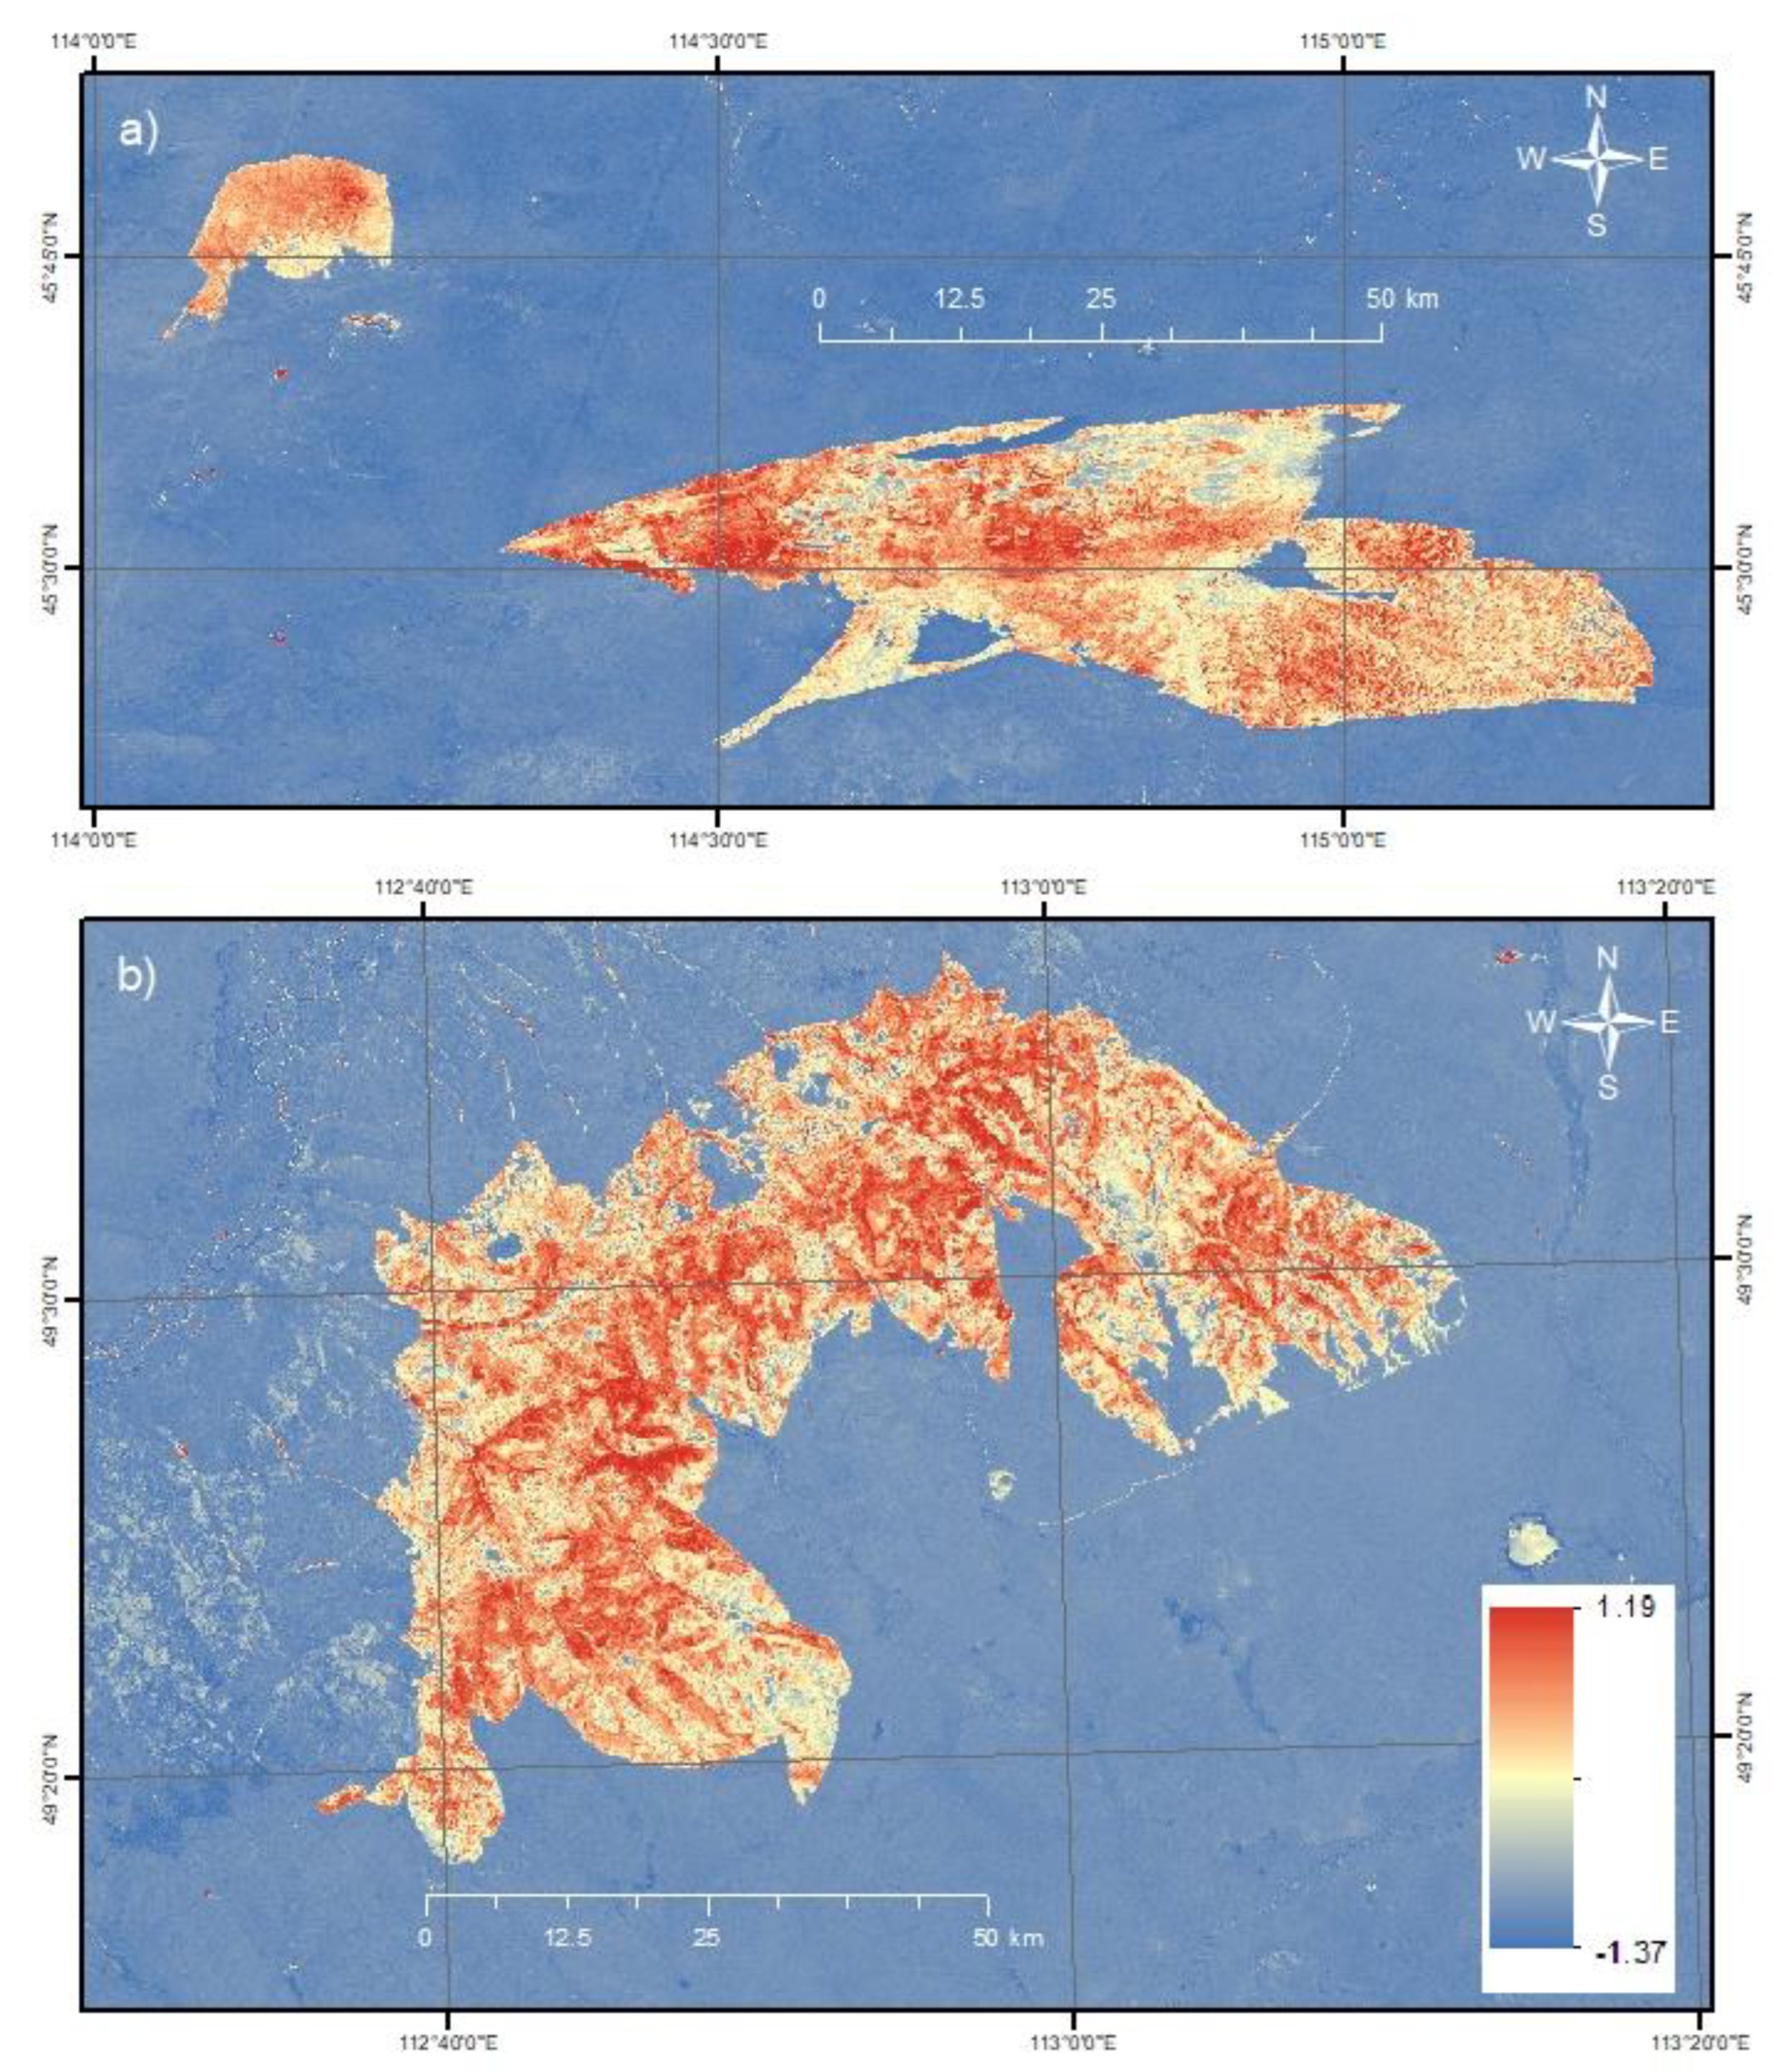
4.2. Identify burned areas
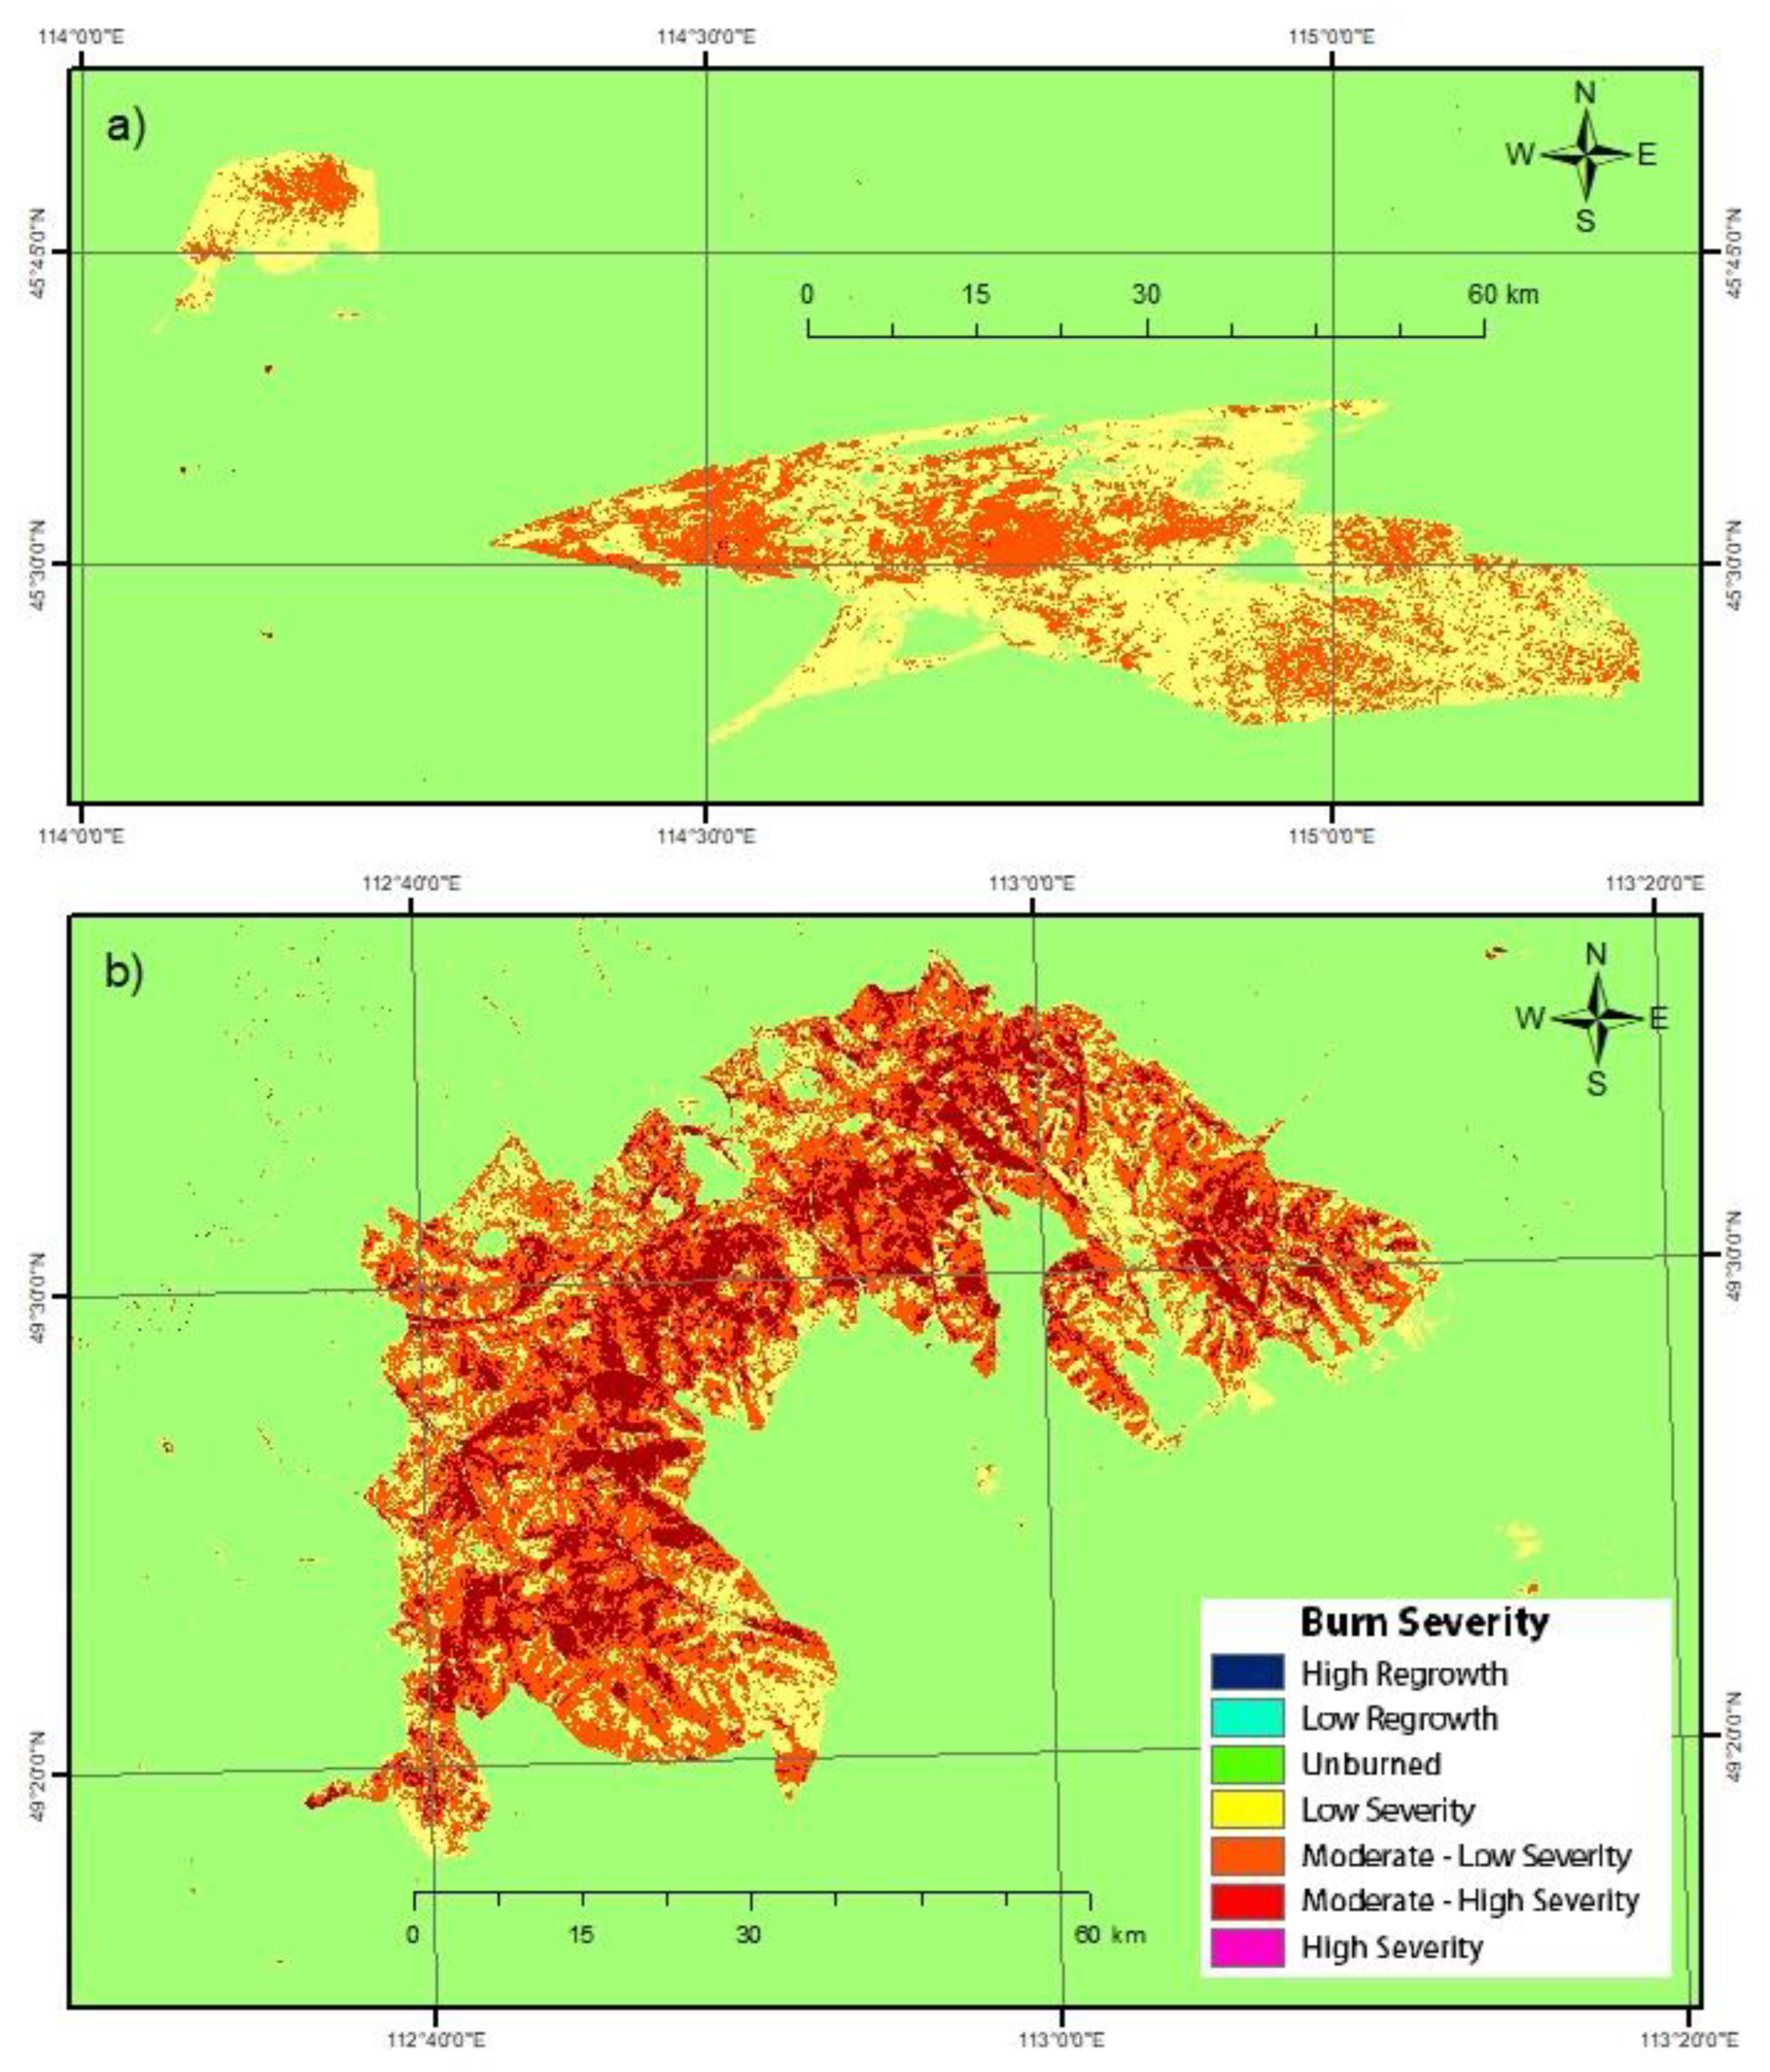
4.3. Burn severity classification
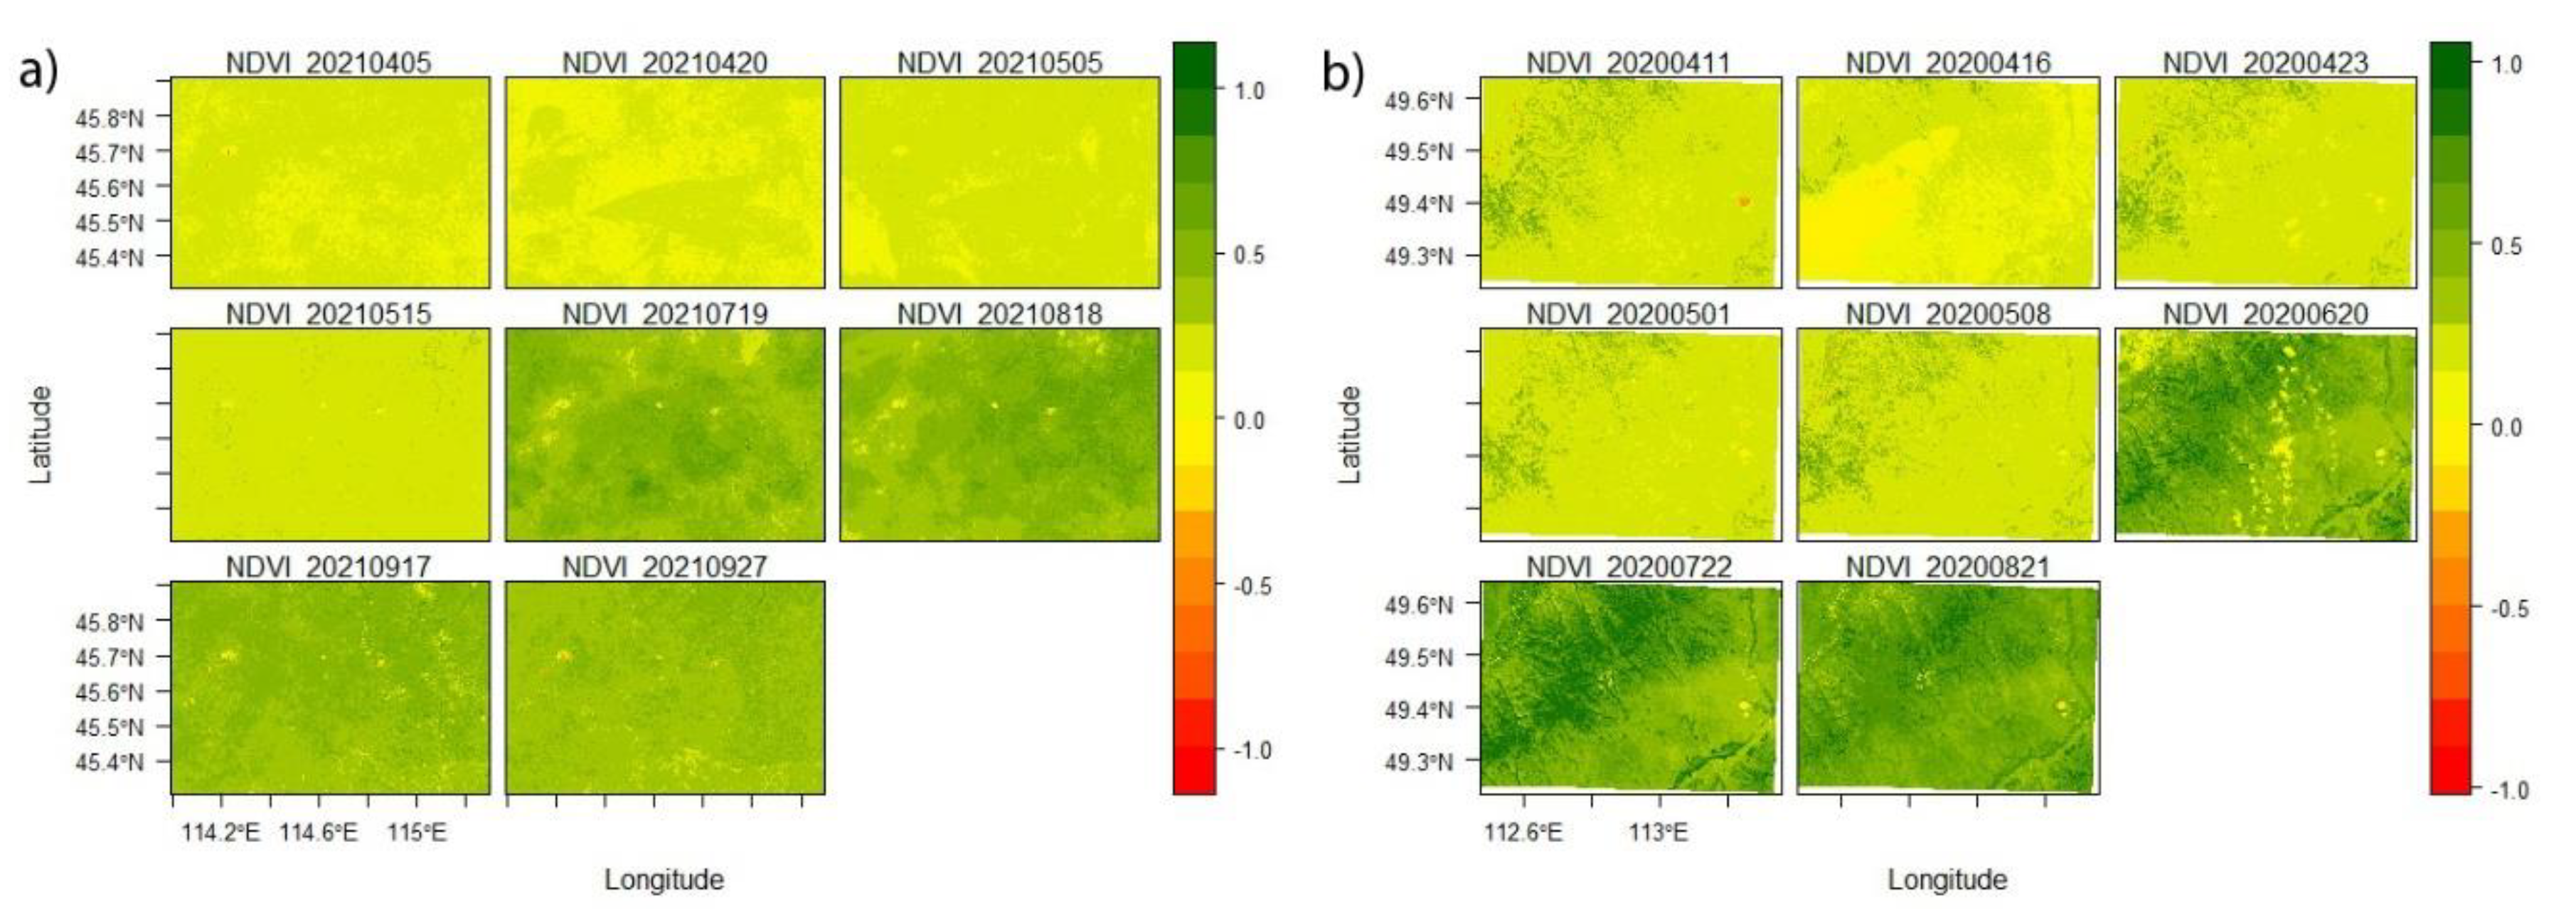
4.4. Recovery process after burn
5. Discussion
6. Conclusions
Author Contributions
Funding
Acknowledgments
Conflicts of Interest
References
- Bello, O.M.; Aina, Y.A. Satellite Remote Sensing as a Tool in Disaster Management and Sustainable Development: Towards a Synergistic Approach. Procedia - Soc. Behav. Sci. 2014, 120, 365–373. [Google Scholar] [CrossRef]
- Alcaras, E.; Costantino, D.; Guastaferro, F.; Parente, C.; Pepe, M. Normalized Burn Ratio Plus (NBR+): A New Index for Sentinel-2 Imagery. Remote. Sens. 2022, 14, 1727. [Google Scholar] [CrossRef]
- Amos, C.; Petropoulos, G.P.; Ferentinos, K.P. Determining the use of Sentinel-2A MSI for wildfire burning & severity detection. Int. J. Remote. Sens. 2018, 40, 905–930. [Google Scholar] [CrossRef]
- Brovkina, O.; Stojanović, M.; Milanović, S.; Latypov, I.; Marković, N.; Cienciala, E. Monitoring of post-fire forest scars in Serbia based on satellite Sentinel-2 data. Geomatics, Nat. Hazards Risk 2020, 11, 2315–2339. [Google Scholar] [CrossRef]
- Cai, L.; Wang, M. Is the RdNBR a better estimator of wildfire burn severity than the dNBR? A discussion and case study in southeast China. Geocarto Int. 2020, 37, 758–772. [Google Scholar] [CrossRef]
- Abdikan, S.; Bayik, C.; Sekertekin, A.; Balcik, F.B.; Karimzadeh, S.; Matsuoka, M.; Sanli, F.B. Burned Area Detection Using Multi-Sensor SAR, Optical, and Thermal Data in Mediterranean Pine Forest. Forests 2022, 13, 347. [Google Scholar] [CrossRef]
- Safder, Q.; Zhou, F.; Zheng, Z.; Xia, J.; Ma, Y.; Wu, B.; Zhu, M.; He, Y.; Jiang, L. BA_EnCaps: Dense Capsule Architecture for Thermal Scrutiny. IEEE Trans. Geosci. Remote. Sens. 2022, 60, 1–11. [Google Scholar] [CrossRef]
- Fernández-Guisuraga, J.M.; Fernandes, P.M. Using Pre-Fire High Point Cloud Density LiDAR Data to Predict Fire Severity in Central Portugal. Remote. Sens. 2023, 15, 768. [Google Scholar] [CrossRef]
- Alarcon-Aguirre, G.; Fidhel, R.F.M.; Enciso, D.R.; Canahuire-Robles, R.; Rodriguez-Achata, L.; Garate-Quispe, J. Burn Severity Assessment Using Sentinel-1 SAR in the Southeast Peruvian Amazon, a Case Study of Madre de Dios. Fire 2022, 5, 94. [Google Scholar] [CrossRef]
- Chhabra, A.; Rüdiger, C.; Yebra, M.; Jagdhuber, T.; Hilton, J. RADAR-Vegetation Structural Perpendicular Index (R-VSPI) for the Quantification of Wildfire Impact and Post-Fire Vegetation Recovery. Remote. Sens. 2022, 14, 3132. [Google Scholar] [CrossRef]
- Lee, S.M. and J.C. Jeong, Forest Fire Severity Classification Using Probability Density Function and KOMPSAT-3A. Korean Journal of Remote Sensing, 2019. 35(6): p. 1341-1350.
- Fernández-Guisuraga, J.M.; Marcos, E.; Suárez-Seoane, S.; Calvo, L. ALOS-2 L-band SAR backscatter data improves the estimation and temporal transferability of wildfire effects on soil properties under different post-fire vegetation responses. Sci. Total. Environ. 2022, 842, 156852. [Google Scholar] [CrossRef] [PubMed]
- Fernandez-Carrillo, A.; McCaw, L.; Tanase, M.A. Estimating prescribed fire impacts and post-fire tree survival in eucalyptus forests of Western Australia with L-band SAR data. Remote. Sens. Environ. 2019, 224, 133–144. [Google Scholar] [CrossRef]
- García, M.; North, P.; Viana-Soto, A.; Stavros, N.E.; Rosette, J.; Martín, M.P.; Franquesa, M.; González-Cascón, R.; Riaño, D.; Becerra, J.; et al. Evaluating the potential of LiDAR data for fire damage assessment: A radiative transfer model approach. Remote. Sens. Environ. 2020, 247, 111893. [Google Scholar] [CrossRef]
- Gibson, R.K.; White, L.A.; Hislop, S.; Nolan, R.H.; Dorrough, J. The post-fire stability index; a new approach to monitoring post-fire recovery by satellite imagery. Remote. Sens. Environ. 2022, 280. [Google Scholar] [CrossRef]
- Maxwald, M.; Immitzer, M.; Rauch, H.P.; Preti, F. Analyzing Fire Severity and Post-Fire Vegetation Recovery in the Temperate Andes Using Earth Observation Data. Fire 2022, 5, 211. [Google Scholar] [CrossRef]
- Rust, A.J.; Saxe, S.; McCray, J.; Rhoades, C.C.; Hogue, T.S. Evaluating the factors responsible for post-fire water quality response in forests of the western USA. Int. J. Wildland Fire 2019, 28, 769. [Google Scholar] [CrossRef]
- Shvetsov, E.G.; A Kukavskaya, E.; Buryak, L.V.; Barrett, K. Assessment of post-fire vegetation recovery in Southern Siberia using remote sensing observations. Environ. Res. Lett. 2019, 14, 055001. [Google Scholar] [CrossRef]
- Kim, S.I., D.S. Ahn, and S.C. Kim, RGB Composite Technique for Post Wildfire Vegetation Monitoring Using Sentinel-2 Satellite Data. Korean Journal of Remote Sensing, 2021. 37(5): p. 939-946.
- Talucci, A.C.; Forbath, E.; Kropp, H.; Alexander, H.D.; DeMarco, J.; Paulson, A.K.; Zimov, N.S.; Zimov, S.; Loranty, M.M. Evaluating Post-Fire Vegetation Recovery in Cajander Larch Forests in Northeastern Siberia Using UAV Derived Vegetation Indices. Remote. Sens. 2020, 12, 2970. [Google Scholar] [CrossRef]
- Barrett, K.; Baxter, R.; Kukavskaya, E.; Balzter, H.; Shvetsov, E.; Buryak, L. Postfire recruitment failure in Scots pine forests of southern Siberia. Remote. Sens. Environ. 2019, 237, 111539. [Google Scholar] [CrossRef]
- Sutomo and E.J.B. van Etten, Fire Impacts and Dynamics of Seasonally Dry Tropical Forest of East Java, Indonesia. Forests, 2023. 14(1).
- Gerrand, S.; Aspinall, J.; Jensen, T.; Hopkinson, C.; Collingwood, A.; Chasmer, L. Partitioning carbon losses from fire combustion in a montane Valley, Alberta Canada. For. Ecol. Manag. 2021, 496, 119435. [Google Scholar] [CrossRef]
- Wang, W.W., et al., Burn Severity in Canada's Mountain National Parks: Patterns, Drivers, and Predictions. Geophysical Research Letters, 2022. 49(12).
- Gibson, R.K. and S. Hislop, Signs of resilience in resprouting Eucalyptus forests, but areas of concern: I year of post-fire recovery from Australia's Black Summer of 2019-2020. International Journal of Wildland Fire, 2022. 31(5): p. 545-557.
- Ndalila, M.N.; Williamson, G.J.; Fox-Hughes, P.; Sharples, J.; Bowman, D.M.J.S. Evolution of a pyrocumulonimbus event associated with an extreme wildfire in Tasmania, Australia. Nat. Hazards Earth Syst. Sci. 2020, 20, 1497–1511. [Google Scholar] [CrossRef]
- Shah, S.U.; Yebra, M.; Van Dijk, A.I.J.M.; Cary, G.J. Relating McArthur fire danger indices to remote sensing derived burned area across Australia. Int. J. Wildland Fire 2022, 32, 133–148. [Google Scholar] [CrossRef]
- Fernández, C.; Fernández-Alonso, J.M.; Vega, J.A.; Fontúrbel, T.; Llorens, R.; Sobrino, J.A. Exploring the use of spectral indices to assess alterations in soil properties in pine stands affected by crown fire in Spain. Fire Ecol. 2021, 17, 1–11. [Google Scholar] [CrossRef]
- Domingo, D., et al., Fuel Type Classification Using Airborne Laser Scanning and Sentinel 2 Data in Mediterranean Forest Affected by Wildfires. Remote Sensing, 2020. 12(21).
- Balde, B.; Vega-Garcia, C.; Gelabert, P.J.; Ameztegui, A.; Rodrigues, M. The relationship between fire severity and burning efficiency for estimating wildfire emissions in Mediterranean forests. J. For. Res. 2023, 34, 1195–1206. [Google Scholar] [CrossRef]
- Adaktylou, N.; Stratoulias, D.; Landenberger, R. Wildfire Risk Assessment Based on Geospatial Open Data: Application on Chios, Greece. ISPRS Int. J. Geo-Information 2020, 9, 516. [Google Scholar] [CrossRef]
- Quintano, C.; Fernandez-Manso, A.; Marcos, E.; Calvo, L. Burn Severity and Post-Fire Land Surface Albedo Relationship in Mediterranean Forest Ecosystems. Remote. Sens. 2019, 11, 2309. [Google Scholar] [CrossRef]
- Cao, X.; Hu, X.; Han, M.; Jin, T.; Yang, X.; Yang, Y.; He, K.; Wang, Y.; Huang, J.; Xi, C.; et al. Characteristics and predictive models of hillslope erosion in burned areas in Xichang, China, on March 30, 2020. CATENA 2022, 217. [Google Scholar] [CrossRef]
- Li, W.; Xu, Q.; Yi, J.; Liu, J. Predictive model of spatial scale of forest fire driving factors: a case study of Yunnan Province, China. Sci. Rep. 2022, 12, 1–20. [Google Scholar] [CrossRef]
- Li, X.; Jin, H.; Wang, H.; Jin, X.; Bense, V.F.; Marchenko, S.S.; He, R.; Huang, Y.; Luo, D. Effects of fire history on thermal regimes of permafrost in the northern Da Xing’anling Mountains, NE China. Geoderma 2021, 410, 115670. [Google Scholar] [CrossRef]
- Shirazi, Z.; Wang, L.; Bondur, V.G. Modeling Conditions Appropriate for Wildfire in South East China – A Machine Learning Approach. Front. Earth Sci. 2021, 9. [Google Scholar] [CrossRef]
- Keeley, J.E.; Brennan, T.J.; Syphard, A.D. The effects of prolonged drought on vegetation dieback and megafires in southern California chaparral. Ecosphere 2022, 13. [Google Scholar] [CrossRef]
- Madani, N.; Parazoo, N.C.; Kimball, J.S.; Reichle, R.H.; Chatterjee, A.; Watts, J.D.; Saatchi, S.; Liu, Z.; Endsley, A.; Tagesson, T.; et al. The Impacts of Climate and Wildfire on Ecosystem Gross Primary Productivity in Alaska. J. Geophys. Res. Biogeosciences 2021, 126. [Google Scholar] [CrossRef]
- Mathews, L.E.H.; Kinoshita, A.M. Urban Fire Severity and Vegetation Dynamics in Southern California. Remote. Sens. 2020, 13, 19. [Google Scholar] [CrossRef]
- Ball, G.; Regier, P.; González-Pinzón, R.; Reale, J.; Van Horn, D. Wildfires increasingly impact western US fluvial networks. Nat. Commun. 2021, 12, 1–8. [Google Scholar] [CrossRef]
- Balch, J.K., et al., FIRED (Fire Events Delineation): An Open, Flexible Algorithm and Database of US Fire Events Derived from the MODIS Burned Area Product (2001-2019). Remote Sensing, 2020. 12(21).
- Hammond, D.H.; Strand, E.K.; Hudak, A.T.; Newingham, B.A. Boreal forest vegetation and fuel conditions 12 years after the 2004 Taylor Complex fires in Alaska, USA. Fire Ecol. 2019, 15, 1–19. [Google Scholar] [CrossRef]
- Moris, J.V.; Reilly, M.J.; Yang, Z.; Cohen, W.B.; Motta, R.; Ascoli, D. Using a trait-based approach to asses fire resistance in forest landscapes of the Inland Northwest, USA. Landsc. Ecol. 2022, 37, 2149–2164. [Google Scholar] [CrossRef]
- Palaiologou, P.; Essen, M.; Hogland, J.; Kalabokidis, K. Locating Forest Management Units Using Remote Sensing and Geostatistical Tools in North-Central Washington, USA. Sensors 2020, 20, 2454. [Google Scholar] [CrossRef]
- Gholamrezaie, H.; Hasanlou, M.; Amani, M.; Mirmazloumi, S.M. Automatic Mapping of Burned Areas Using Landsat 8 Time-Series Images in Google Earth Engine: A Case Study from Iran. Remote. Sens. 2022, 14, 6376. [Google Scholar] [CrossRef]
- Maillard, O.; Flores-Valencia, M.; Michme, G.; Coronado, R.; Bachfischer, M.; Azurduy, H.; Vides-Almonacid, R.; Flores, R.; Angulo, S.; Mielich, N. Phenology Patterns and Postfire Vegetation Regeneration in the Chiquitania Region of Bolivia Using Sentinel-2. Fire 2022, 5, 70. [Google Scholar] [CrossRef]
- Santana, N.C.; Júnior, O.A.d.C.; Gomes, R.A.T.; Guimarães, R.F. Comparison of Post-fire Patterns in Brazilian Savanna and Tropical Forest from Remote Sensing Time Series. ISPRS Int. J. Geo-Information 2020, 9, 659. [Google Scholar] [CrossRef]
- Kale, M.P.; Mishra, A.; Pardeshi, S.; Ghosh, S.; Pai, D.S.; Roy, P.S. Forecasting wildfires in major forest types of India. Front. For. Glob. Chang. 2022, 5. [Google Scholar] [CrossRef]
- Hessl, A.E.; Ariya, U.; Brown, P.; Byambasuren, O.; Green, T.; Jacoby, G.; Sutherland, E.K.; Nachin, B.; Maxwell, R.S.; Pederson, N.; et al. Reconstructing fire history in central Mongolia from tree-rings. Int. J. Wildland Fire 2012, 21, 86–92. [Google Scholar] [CrossRef]
- Kolář, T.; Kusbach, A.; Čermák, P.; Štěrba, T.; Batkhuu, E.; Rybníček, M. Climate and wildfire effects on radial growth of Pinus sylvestris in the Khan Khentii Mountains, north-central Mongolia. J. Arid. Environ. 2020, 182. [Google Scholar] [CrossRef]
- Kopp, B.J.; Lange, J.; Menzel, L. Effects of wildfire on runoff generating processes in northern Mongolia. Reg. Environ. Chang. 2016, 17, 1951–1963. [Google Scholar] [CrossRef]
- Munkhjargal, M.; Yadamsuren, G.; Yamkhin, J.; Menzel, L. The Combination of Wildfire and Changing Climate Triggers Permafrost Degradation in the Khentii Mountains, Northern Mongolia. Atmosphere 2020, 11, 155. [Google Scholar] [CrossRef]
- Nasanbat, E., et al. A fire risk map for protected areas of Mongolia: Dornod Mongol SPA, Numrug SPA, Zed-Khangai-Buteeliin Nuruu SPA and Onon-Balj National Park. in Asian Conference of Remote Sensing (ACRS). 2020. Deqing, China.
- Wu, R.H., et al., Wildfires on the Mongolian Plateau: Identifying Drivers and Spatial Distributions to Predict Wildfire Probability. Remote Sensing, 2019. 11(20).
- Wu, R.H., et al., Promote the advance of the start of the growing season from combined effects of climate change and wildfire. Ecological Indicators, 2021. 125.
- Zhao, H.; Zhang, Z.; Ying, H.; Chen, J.; Zhen, S.; Wang, X.; Shan, Y. The spatial patterns of climate-fire relationships on the Mongolian Plateau. Agric. For. Meteorol. 2021, 308-309, 108549. [Google Scholar] [CrossRef]
- Bao, Y.; Shinoda, M.; Yi, K.; Fu, X.; Sun, L.; Nasanbat, E.; Li, N.; Xiang, H.; Yang, Y.; DavdaiJavzmaa, B.; et al. Satellite-Based Analysis of Spatiotemporal Wildfire Pattern in the Mongolian Plateau. Remote. Sens. 2022, 15, 190. [Google Scholar] [CrossRef]
- Dashpurev, B.; Wesche, K.; Jäschke, Y.; Oyundelger, K.; Phan, T.N.; Bendix, J.; Lehnert, L.W. A cost-effective method to monitor vegetation changes in steppes ecosystems: A case study on remote sensing of fire and infrastructure effects in eastern Mongolia. Ecol. Indic. 2021, 132, 108331. [Google Scholar] [CrossRef]
- Kazato, M.; Soyollham, B. Forest-steppe fires as moving disasters in the Mongolia-Russian borderland. J. Contemp. East Asia Stud. 2022, 11, 22–45. [Google Scholar] [CrossRef]
- Li, Y.; Xu, S.; Fan, Z.; Zhang, X.; Yang, X.; Wen, S.; Shi, Z. Risk Factors and Prediction of the Probability of Wildfire Occurrence in the China–Mongolia–Russia Cross-Border Area. Remote. Sens. 2022, 15, 42. [Google Scholar] [CrossRef]
- Sainbuyan, B., et al., Estimation of the burned area with severity and its influencing factors for wildfire using Sentinel-2 satellite imagery: Ой, хээрийн түймрийн шатсан талбай, түүний шаталтын зэрэглэлд нөлөөлөх хүчин зүйлсийн хамаарлын судалгаа. Geographical Issues, 2023. 23(01): p. 22-36.
- Gantumur, B., et al., A wildfire monitoring study for burn severity and recovery process using remote sensing techniques: A case study near Shiliin Bogd mountain, Eastern Mongolia. Geographical Issues, 2022. 22(1): p. 20-31.
- Boucher, J.; Beaudoin, A.; Hébert, C.; Guindon, L.; Bauce, . Assessing the potential of the differenced Normalized Burn Ratio (dNBR) for estimating burn severity in eastern Canadian boreal forests. Int. J. Wildland Fire 2017, 26, 32–45. [CrossRef]
- Cardil, A.; Mola-Yudego, B.; Blázquez-Casado, .; González-Olabarria, J.R. Fire and burn severity assessment: Calibration of Relative Differenced Normalized Burn Ratio (RdNBR) with field data. J. Environ. Manag. 2019, 235, 342–349. [CrossRef]
- Gantumur, B.; Wu, F.; Vandansambuu, B.; Dalaibaatar, E.; Tumursukh, B.; Munkhsukh, U.; Zhao, Y. Implication of urban heat island (UHI) related to human activities: a case study in Mongolia. 2019, 11157, 111570V. [CrossRef]
- Parks, S.A.; Dillon, G.K.; Miller, C. A New Metric for Quantifying Burn Severity: The Relativized Burn Ratio. Remote Sens. 2014, 6, 1827–1844. [Google Scholar] [CrossRef]
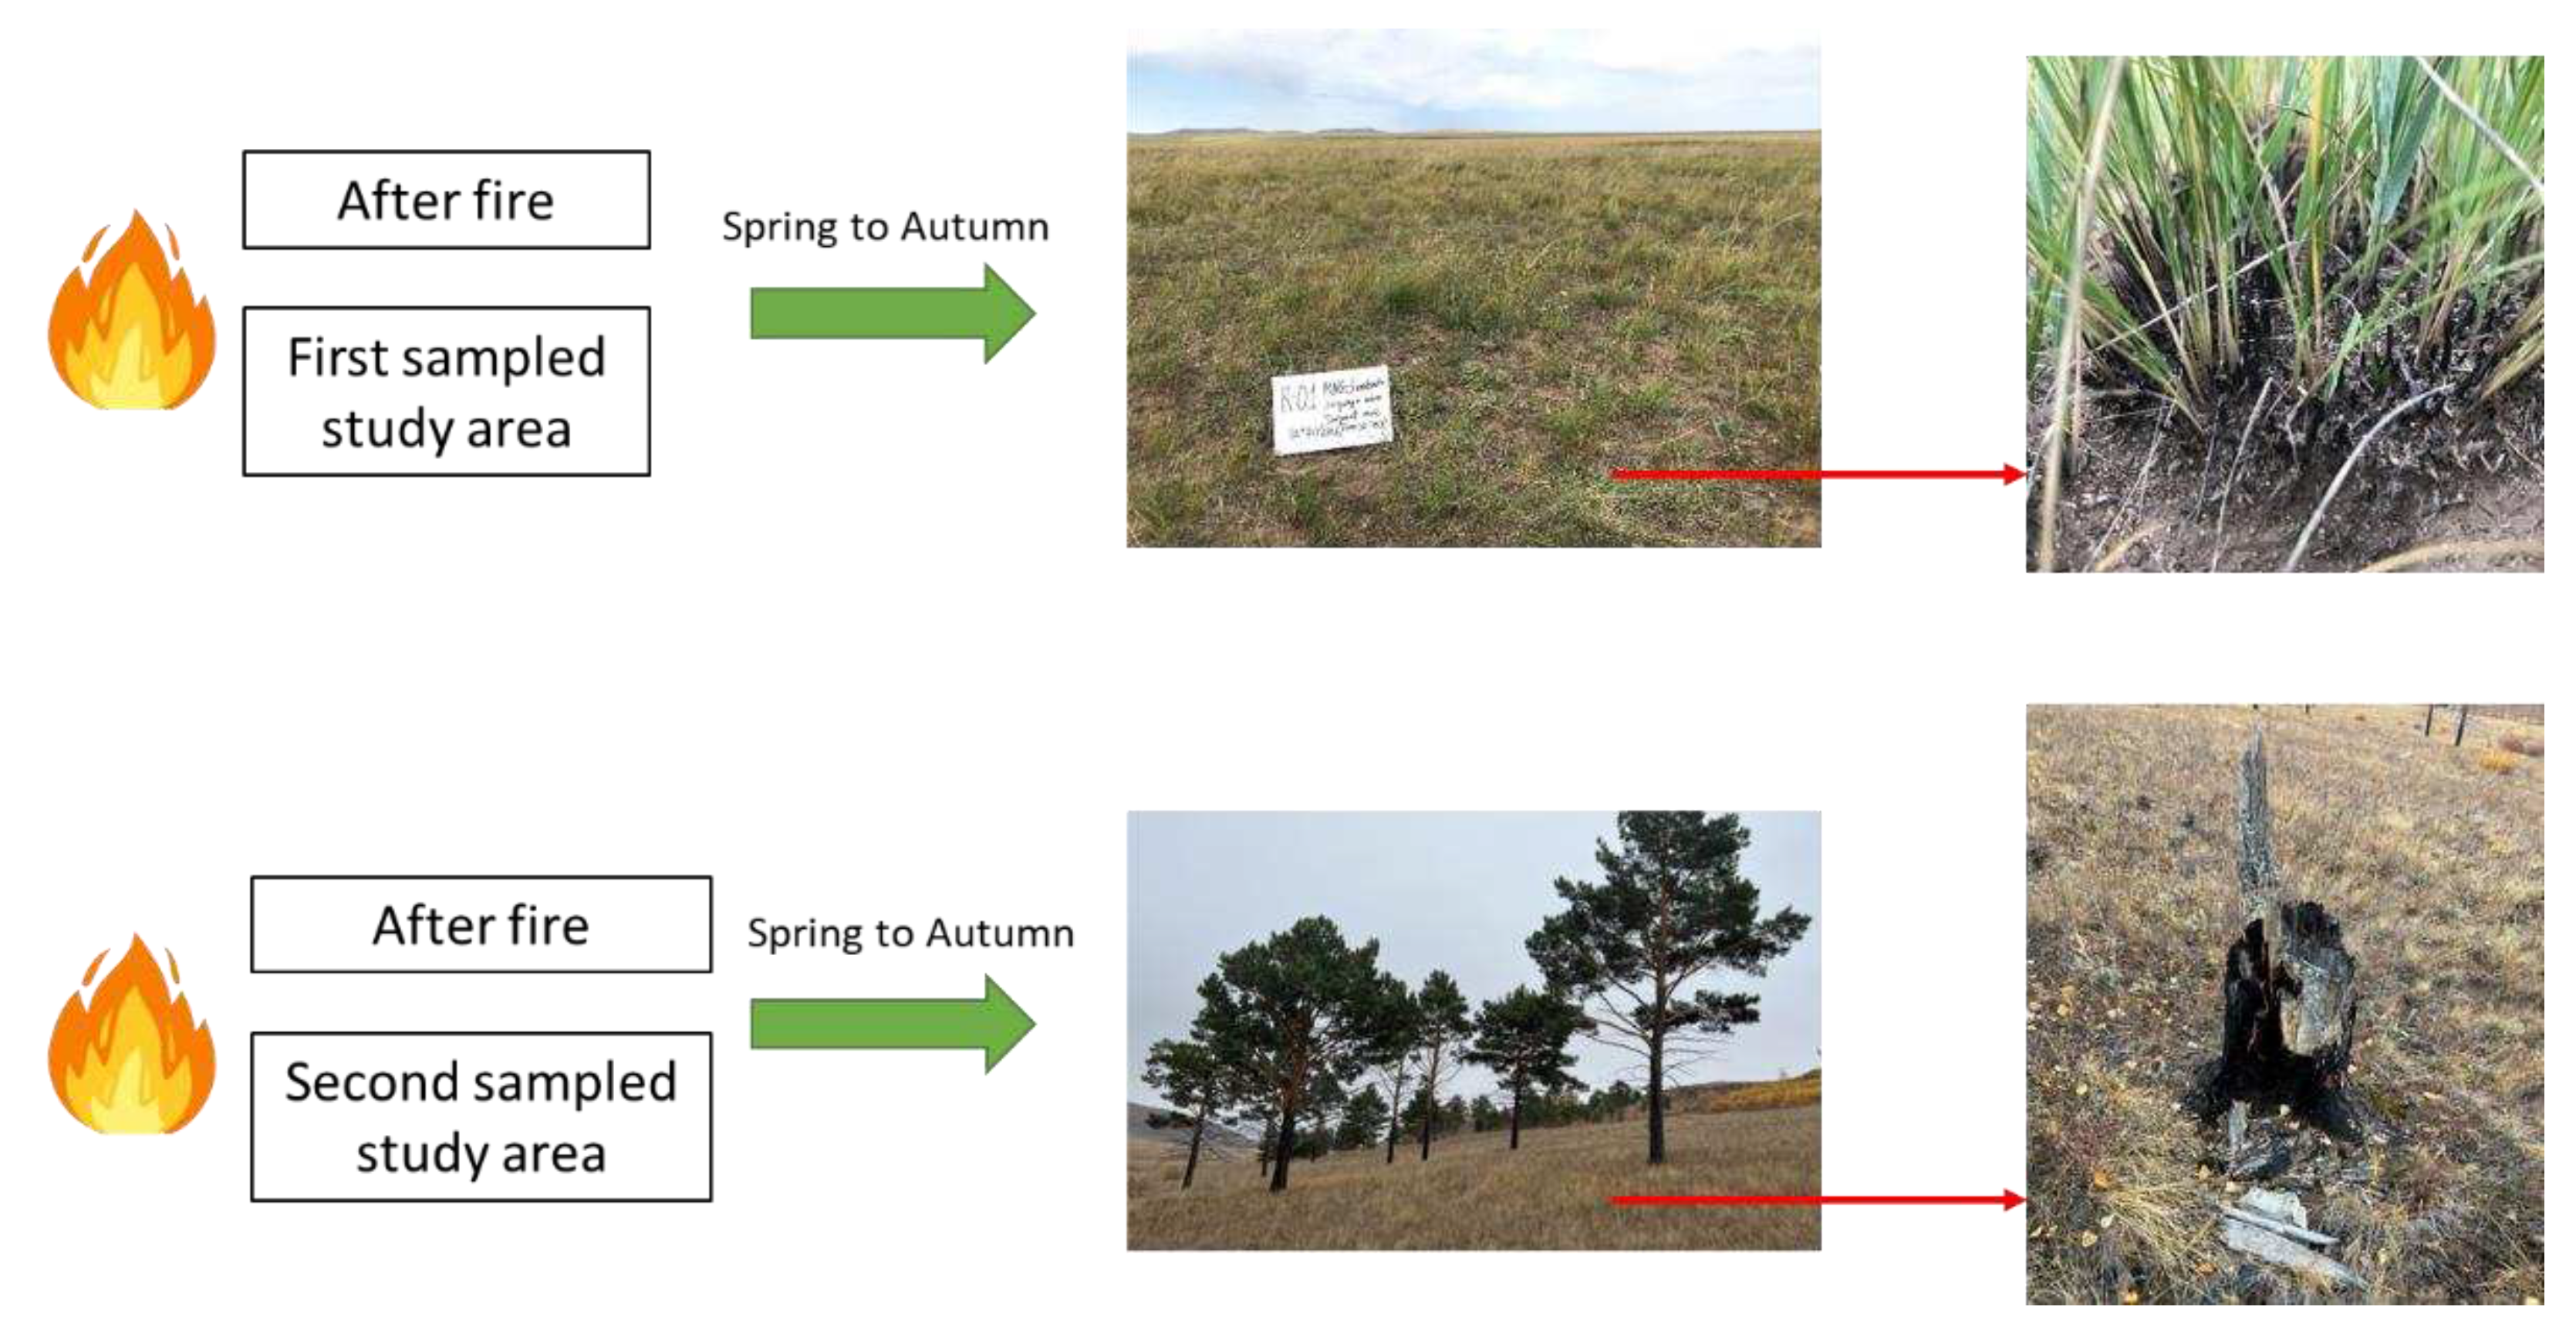
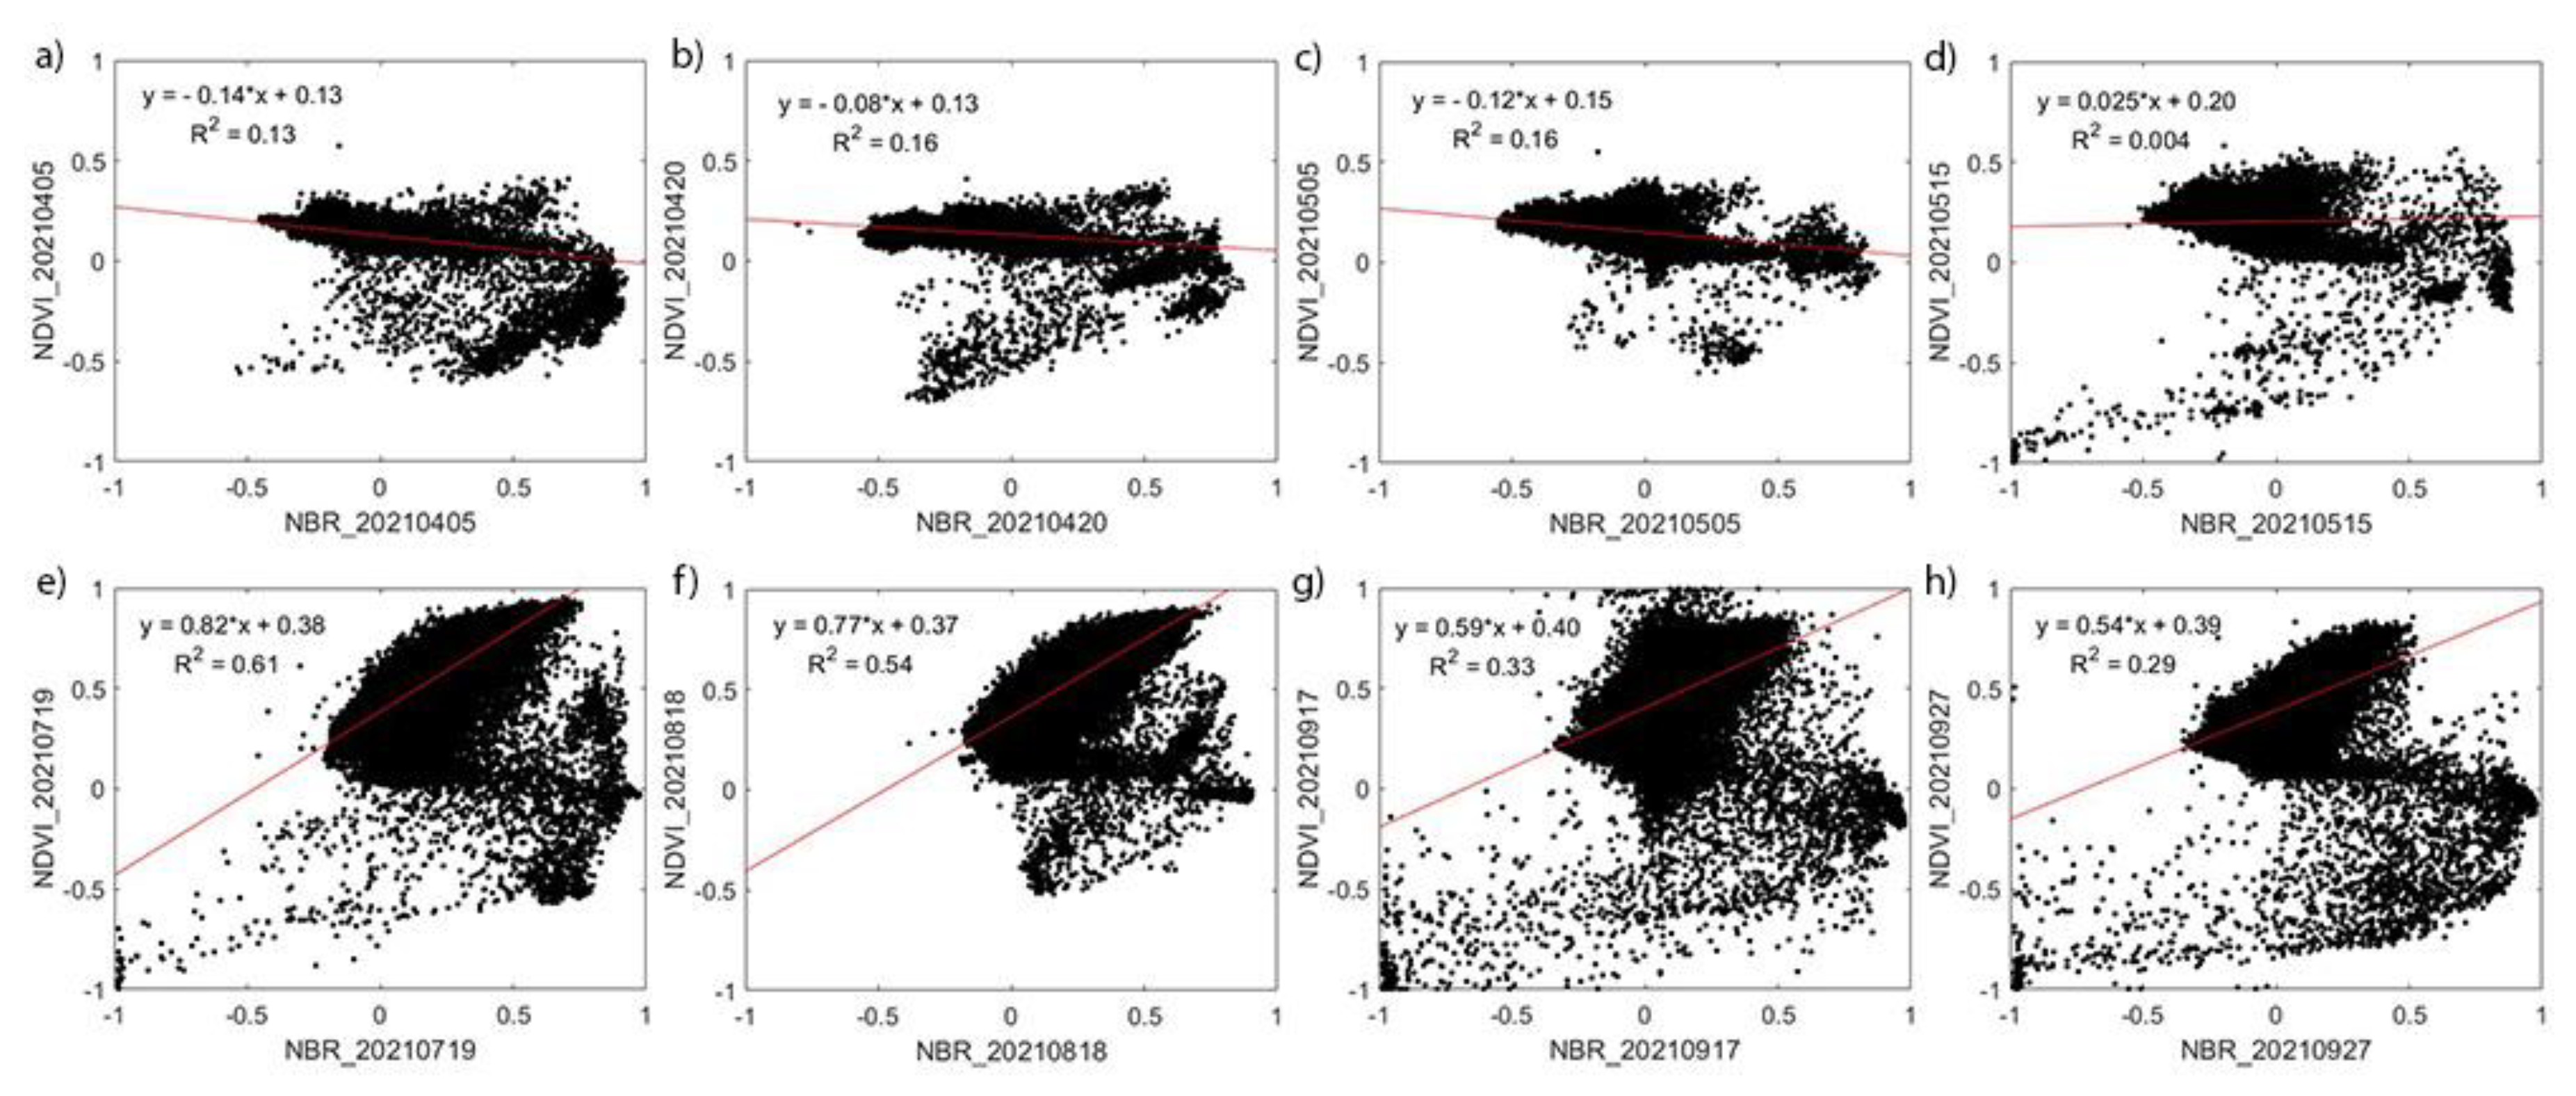
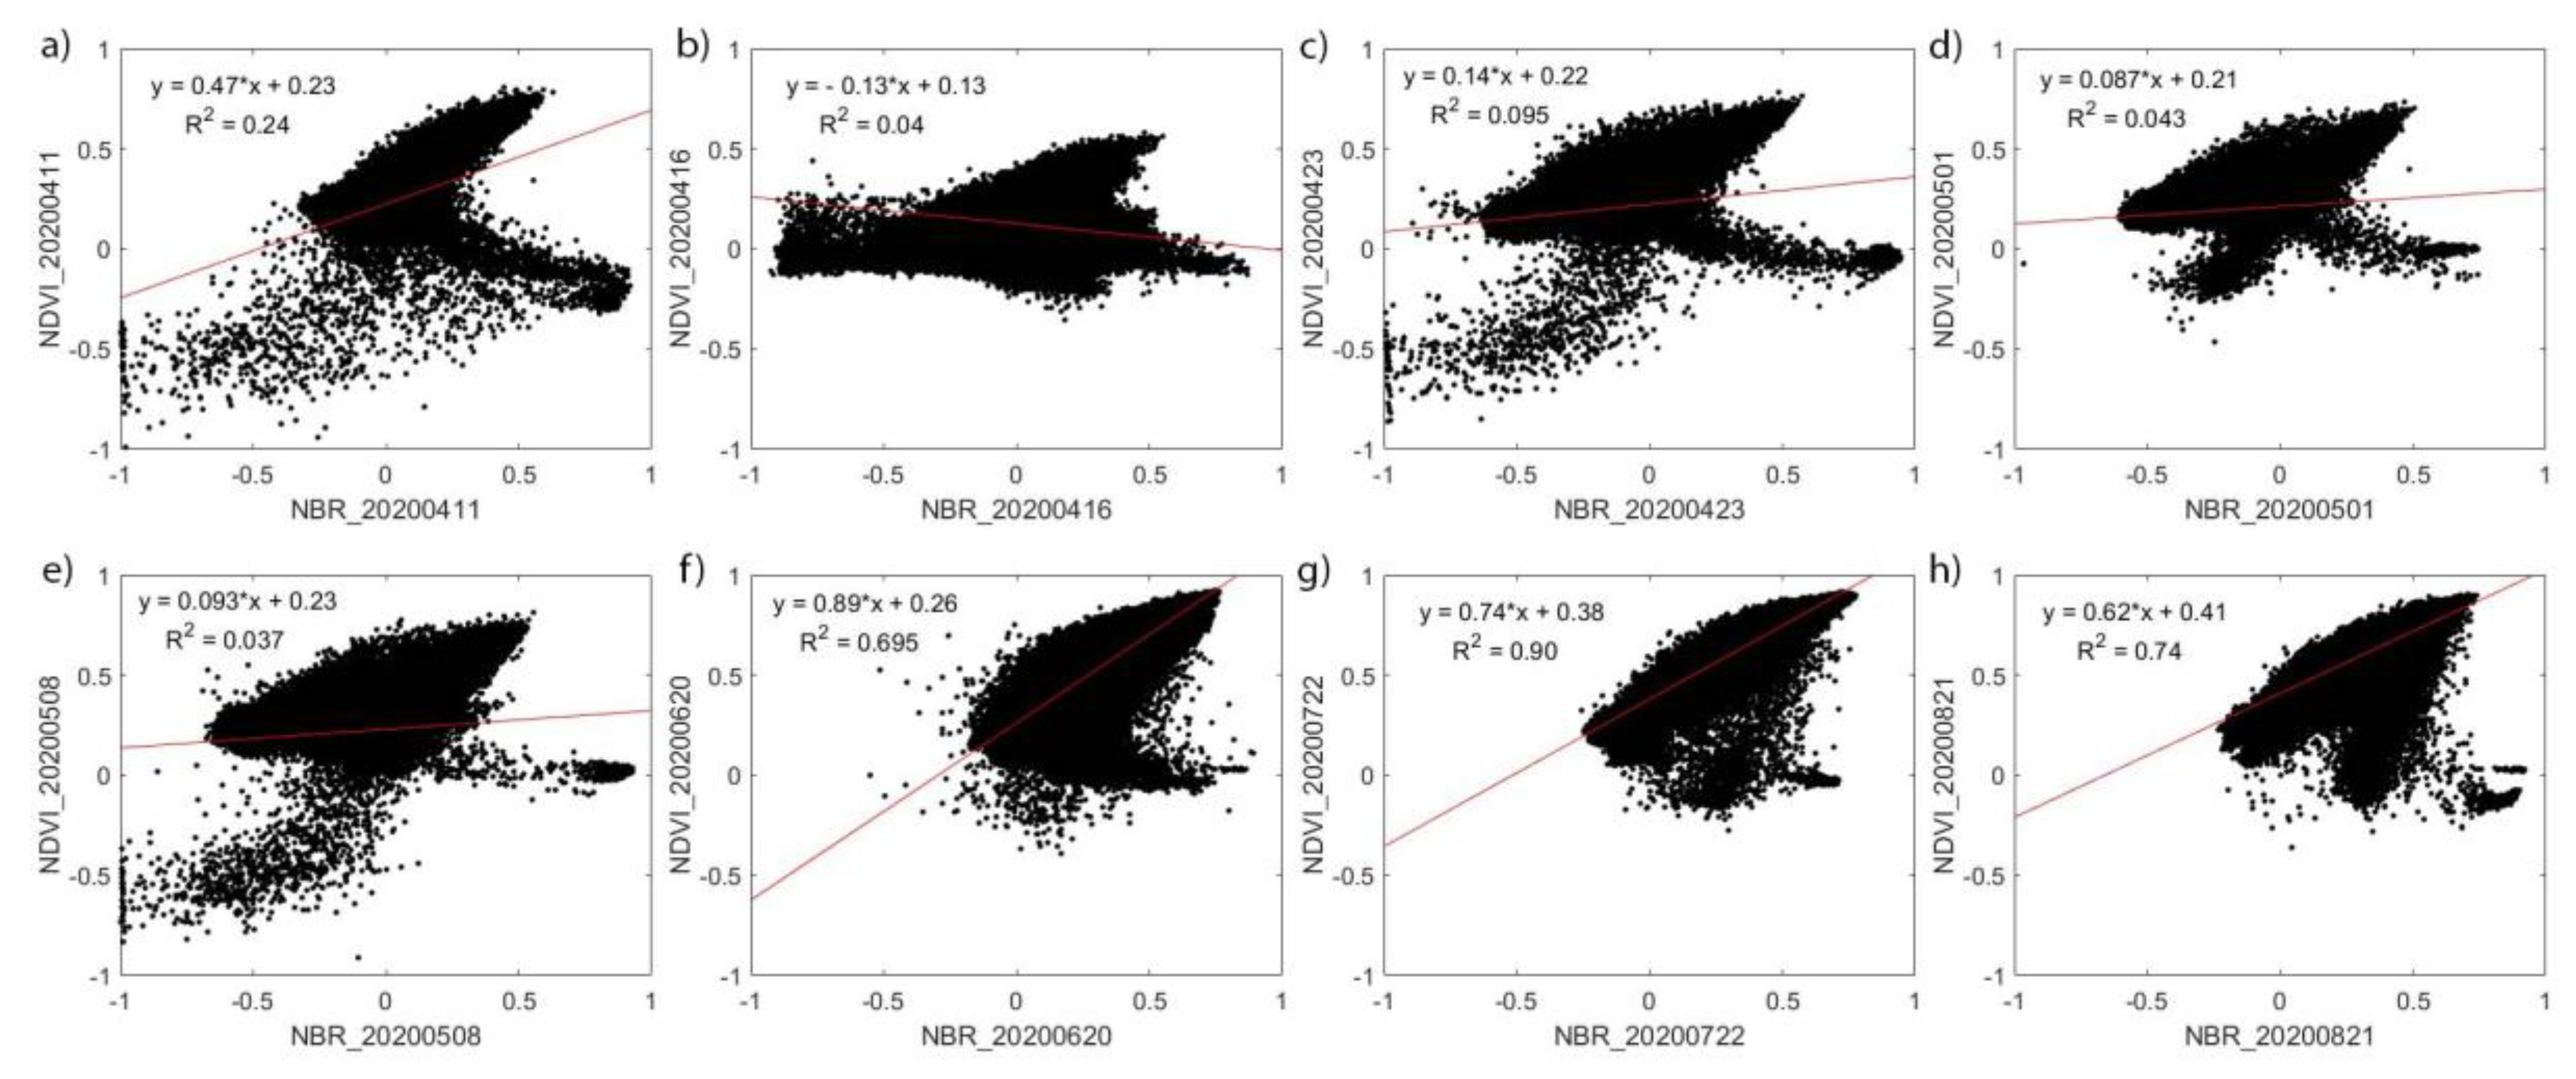
| Spectral Band | Spatial resolution (nm) | Centre Wavelength (nm) | Band Width (nm) | |
|---|---|---|---|---|
| B1 | Coastal aerosol | 60 | 443 | 20 |
| B2 | Blue | 10 | 494 | 65 |
| B3 | Green | 10 | 560 | 35 |
| B4 | Red | 10 | 665 | 30 |
| B5 | Vegetation red edge | 20 | 704 | 15 |
| B6 | Vegetation red edge | 20 | 740 | 15 |
| B7 | Vegetation red edge | 20 | 781 | 20 |
| B8 | NIR | 10 | 834 | 115 |
| B8a | Narrow NIR or NIR 2 | 20 | 864 | 20 |
| B9 | Water vapour | 60 | 944 | 20 |
| B10 | SWIR – Cirrus | 60 | 1375 | 30 |
| B11 | SWIR 1 | 20 | 1612 | 90 |
| B12 | SWIR2 | 20 | 2185 | 185 |
| Date of 1st sampled area | Date of 2nd sampled area |
|---|---|
| April 5, 2021 | April 11, 2020 |
| April 20, 2021 | April 16, 2020 |
| May 5, 2021 | April 23, 2020 |
| May 15, 2021 | May 01, 2020 |
| July 19, 2021 | May 08, 2020 |
| August 18, 2021 | June 20, 2020 |
| September 17, 2021 | July 22, 2020 |
| September 27, 2021 | August 21, 2020 |
| Severity level | dNBR range (scaled by 103) | dNBR range (not scaled) |
|---|---|---|
| Enhanced regrowth, high (post-fire) | -500 to -251 | -0.500 to -0.251 |
| Enhanced regrowth, low (post-fire) | -250 to -101 | -0.250 to -0.101 |
| Unburned | -100 to +99 | -0.100 to +0.99 |
| Low severity | +100 to +269 | +0.100 to +0.269 |
| Moderate-low severity | +270 to +439 | +0.270 to +0.439 |
| Moderate-high severity | +440 to +659 | +0.440 to +0.659 |
| High severity | +660 to +1300 | +0.660 to +1.300 |
Disclaimer/Publisher’s Note: The statements, opinions and data contained in all publications are solely those of the individual author(s) and contributor(s) and not of MDPI and/or the editor(s). MDPI and/or the editor(s) disclaim responsibility for any injury to people or property resulting from any ideas, methods, instructions or products referred to in the content. |
© 2023 by the authors. Licensee MDPI, Basel, Switzerland. This article is an open access article distributed under the terms and conditions of the Creative Commons Attribution (CC BY) license (http://creativecommons.org/licenses/by/4.0/).


