Preprint
Article

Index for Adaptive Responses (InARes): A New Framework for Evaluating Adaptive, Functional Traits considering Complex Environments

Altmetrics

Downloads

117

Views

90

Comments

0

Submitted:

29 August 2023

Posted:

01 September 2023

You are already at the latest version

Alerts
Abstract
The focus of recent research shifts towards complex ‘whole organism’ responses (i.e., in multiple functional traits) in adaptation to or to defend against stressors under complex environmental conditions. This increasing complexity is challenging to analyse and demands sophisticated tools to drive meaningful conclusions from those data. Trait-based regression models, multivariate analyses, like principal component analyses, and plasticity indices can be used to tackle challenges with those complex investigations. But those methods have substantial limitations, like the need for high sample size, multi-dimensionality of results or the need for trait coordination in high-dimensional space, or the calculation on the population level, which might buffer or cover the de facto occurring individual effects. To improve and simplify studies on ‘whole organism’ responses, analyses, and their interpretation, we developed the Index for Adaptive Responses. This straightforward framework can unite all traits of an organism in one number. A newly developed transformation method, included in this framework, comprises a normalisation and standardisation to a baseline or control without changing the data or variance structure of the original data. We assessed the performance and accuracy of the framework with an application in an extensive predator-prey case study, with simulations and application examples using literature data. We show that the Index for Adaptive Responses respects adaptations as well as maladaptations and outperforms established approaches. The framework is robust against outliers and non-gaussian distribution. We further show that the qualitative prediction of the adaptiveness of included traits is highly accurate, even under challenging conditions, e.g., low replicate numbers. Functions and algorithms of the framework are provided with an R package but can easily be translated into other programming languages. The Index for Adaptive Responses will simplify future research on complex adaptive responses and improves our understanding of these responses’ ecological as well as evolutionary implications.
Keywords: 
Subject: Biology and Life Sciences  -   Ecology, Evolution, Behavior and Systematics

Introduction

Environmental stressors, such as changes in biotic or abiotic conditions induce phenotypic responses in organisms. These phenotypic responses are often gathered under the terms of phenotypic plasticity, phenotypic flexibility, or cyclomorphosis (Forsman, 2015; Laforsch & Tollrian, 2009). In this concept, a genotype can express different phenotypes depending on environmental conditions (Whitman & Agrawal, 2009). Examples of phenotypic plasticity include responses to temperature changes (e.g., Gilbert, 2011; Hofmann et al., 2019; Martin-Creuzburg et al., 2012), inducible defences against predators (e.g., Christjani et al., 2016; Stoks et al., 2016; Wigley et al., 2018), induced adaptations to toxins and other harmful substances (e.g., Colpaert et al., 2004; Li et al., 2020; Polat et al., 2010) and radiation (e.g., Eshun-Wilson et al., 2020; Leech & Williamson, 2000), and adaptations to withstand droughts (e.g., Belluau & Shipley, 2017; Blumenthal et al., 2020; Hu et al., 2020). Different stressors may cause different or even opposing responses in organisms and may interact with each other or with other, at first sight, unrelated environmental parameters. An increasing number of studies on phenotypic plasticity have considered more than one stressor or environmental parameter to achieve a better mechanistic understanding of ecological and/or evolutionary responses (e.g., Borden et al., 2020; Herzog et al., 2016; Martin-Creuzburg et al., 2012; Sarrazin & Sperfeld, 2022; Shudo & Iwasa, 2001; Turschwell et al., 2022).
Phenotypic plasticity of functional traits became a quickly increasing research field (Dewitt & Scheiner, 2004). It becomes more and more evident that it is often insufficient (depending on the research question) to investigate single or a small subset of functional traits of an organism but that there is a complex interplay of all traits exhibited by the organism at all scales (Forsman, 2015; Piersma & Gils, 2011; Pigliucci & Preston, 2004; Valladares et al., 2007). As Forsman (2015) pointed out, the investigation of ‘whole organism’ or total adaptive responses (meaning to include as many potentially relevant traits as possible) would improve our understanding of the ecological and evolutionary success of individuals, populations, and species. This is crucial for a better understanding of the evolution and maintenance of biodiversity (see Forsman (2015) and references herein). However, not all traits of an organism contribute equally to an adaptation to a stressor. Especially in multi-stressor studies, it is not trivial to conclude how an upcoming stressor, e.g., a toxin, affects the adaptive response against another stressor, e.g., predation. A traits’ increase may be beneficial for the particular trait but detrimental and maladaptive for other traits. To disentangle multiple traits' contribution to an organism's actual adaptation, elaborative experiments would be required (see further below for an example). Even though this would be the most straightforward approach, it would need to be repeated for every change in the system and each organism/species/clone.
To tackle the challenge of investigating such multi-trait responses under complex environmental conditions, we need more sophisticated tools to achieve meaningful conclusions about the total adaptive state of an organism and how it might be changed by other stressors or changing environments. In principle, regression models can be used to disentangle the benefit of different traits on the organism's fitness (e.g., see Diel et al. 2023, manuscript in preparation). However, they require high degrees of freedom and, hence, large sample sizes. Multivariate techniques, like principal component analyses, can reduce the number of traits or parameters that have to be evaluated by regression models. However, these approaches mainly provide benefits in the case of meaningful trait coordination in the hyperdimensional space (e.g., Candeias & Fraterrigo, 2020; Wright et al., 2006). Thereby, traits that achieve a similar goal coordinate in the same direction and can be summarised in the respective principal component (e.g., some root traits of a plant can coordinate for water uptake efficiency). But if this coordination cannot be found, they rarely simplify the interpretation, since the resulting principal components are combinations of all traits. Other approaches, like some plasticity indices, can also account for several traits. However, those plasticity indices are calculated on the population or treatment level instead of the individual level (see Valladares et al. (2006) for an overview). This makes the inference on single traits difficult and masks the overall effects of stressors due to the buffering effect by the population variance and other (maybe neglected) traits (for discussion, see Karpestam et al., 2012; Pigliucci & Preston, 2004; Whitman & Agrawal, 2009). Calculation on the population level further poses the problem that it is impossible to calculate the estimates' uncertainty. However, uncertainty is valuable information in ecological research and an essential tool for predictions and ecosystem management. Furthermore, plasticity indices are rather meant to estimate the organism's overall capacity to respond to a certain environment and not, specifically, how it adapts to it.
Here, we present a unified framework based on simple equations and algorithms to achieve a single value reflecting the total adaptive response of an organism to a certain stressor. Our approach is applicable to all kinds of quantifiable traits. Furthermore, the obtained value is comparable across experiments, organisms, and systems. The framework uses a newly developed data-transformation method, which standardises and normalises trait data to a baseline (control treatment or similar data). All values are calculated on the individual level, allowing for the estimation of uncertainties. Additionally, a priori knowledge about the adaptiveness of traits can be applied if available, e.g., from literature. Furthermore, the framework allows for estimating each trait's contribution to the total adaptive response of organisms. We demonstrate the applicability and potential of this framework using a case study on a predator-prey system and with simulations. Finally, we provide examples of how the framework can be applied to different research fields and experimental data. The Index for Adaptive Responses framework is implemented in an R package (InARes), allowing to apply all steps and variants thereof using just a few lines of code in R.

Material & Methods

Developing the framework

The main goal in developing an Index for Adaptive Responses (InARes) framework was to achieve only one number or parameter that reflects the total (mal-)adaptation to a certain stressor. It should be usable in comparing organismal responses across environmental factors (hereafter referred to as stressors). Several steps are necessary for the Index for Adaptive Responses framework to achieve these goals, which will be elaborated on in the following paragraphs. The equations herein can be modified individually (e.g., when using the R package) to enter a priori knowledge into the framework (e.g., which traits are adaptive and which maladaptive). Additionally, some functions come in two variants for calculating the InARes or a plasticity index. Examples of how the functions of the R package can be used and modified are described further below in the supplementary information and the readme and help file of the R package (the package will be available on CRAN and GitHub: https://github.com/Maki-science/InARes).
Transforming each trait's values
A tremendous number of possible traits can contribute to an organism's adaptation to a certain stressor. Those traits can comprise behavioural, life history, morphological, physiological, and molecular traits (maybe even more). These are naturally on different scales. Therefore, all trait values must be transformed to the same scale in the first step. This is usually achieved by, e.g., a z-transformation (or standardisation) with the following equation:
z = x μ σ
where z is the standardised value, x is an individual's trait value, μ is the population's (or treatment's) mean, and σ is the standard deviation of the same population (or treatment).
Additionally, it is necessary to scale them to a meaningful range, e.g., normalised from 0 to 1. This can be achieved using a normalisation equation like the following:
x ' = x m i n ( x ) m a x ( x ) m i n ( x )
where x ' is the normalised value in a range of 0 to 1, x is the individuals’ value to be transformed, and m i n ( x ) and m a x ( x ) are the minimum or maximum value of a population (or treatment), respectively.
However, if we perform just these two steps, the values would be at the same scale and range but still are not more meaningful than their unprocessed counterparts. Furthermore, each experimental setup might be (slightly) different, and even if not, the organisms may respond slightly differently each time an experiment is repeated. Therefore, the baseline of a response would change each time an experiment is repeated, or some parameters have changed. To solve this issue, the idea is to use a control treatment (or similar population, hereafter referred to as control) as the baseline of a response. Therefore, we invented a new transformation method, which incorporates a standardisation and normalisation to a control population in just one step. We merged and modified equations 1 and 2, resulting in a rex-transformation (rex for relative expression):
r e x i , k = x i μ c m a x ( x c t ) m i n ( x c t )
Values of r e x assume the individual has:
< 0: a lower response in a certain trait compared to the control mean
= 0: a similar response compared to the control mean
> 0: an enhanced response compared to the control mean
where r e x i , k is the transformed value of the k th trait of the i th individuum. It must be calculated for each trait and individual separately. x i is the untransformed individuals’ trait value, μ c is the mean value of the control, m a x ( x c t ) and m i n ( x c t ) are the maximum and minimum trait values across the control and the stressor treatment (hereafter referred to as treatment). Through this transformation, the values are standardised to the same scale and normalised to a range of -1 to 1. Thus, the values become independent of the experimental design and environmental conditions, to a certain extent, as all those factors are implicitly included in the control and set as a baseline. In other words, r e x i , k is an individual's measure of the relative expression of a trait in relation to the control. It is comparable across experiments and even species, as the value always considers the control and, therefore, also accounts for performance differences among organisms (which happens, even in similar experiments).
The Index for Adaptive Responses’ value: a weighted mean of all traits
The main issue for a reasonable estimation of a total adaptation is that not all traits of an organism contribute equally to the adaptation. Therefore, all traits incorporated in the InARes would have to be weighted according to their contribution. Usually, very extensive and elaborative experiments are necessary to assess each trait's contribution to the total adaptation of an organism. To avoid this tremendous effort and necessity for those data, we made use of some inherent assumptions of most ecological studies to realise another way of weighing the traits: Although usually not explicitly mentioned, it is implicitly assumed that an increase in a trait under a certain stressor is a beneficial response that protects the organisms against the stressor to a certain extent. Furthermore, an organism will "prevent" overexpression of a trait to avoid wasting resources. Although not necessarily true in all cases, these assumptions are implicitly accepted broadly in ecological research. However, in cases where such a trait enhancement under exposure to a stressor is not obviously beneficial, we might need to understand the mechanism behind this change, rendering these assumptions still viable. On the other hand, traits that are thought or known to be rather an effect of the stressor instead of an adaptation should not be included at this step of the framework.
Following these assumptions, a relatively stronger increase in one trait (i.e., a relatively higher investment) renders this relatively stronger response potentially more beneficial compared to a relatively lower response (i.e., a relatively lower investment). We calculated the relative expression of all traits with the rex-transformation. Therefore, we can use the highest absolute r e x value (i.e., the relatively strongest expression) of a trait as a weighing parameter for this trait. The absolute value because of two reasons: First, an adaptive response can also mean a decrease in a trait (i.e., a negative sign), e.g., a decrease in body size against visual hunting predators to increase elusiveness. Second, even if organisms of the treatment enhance a trait in general, there may also be some individuals that strongly decrease it. These contrasting responses within a population lead to the assumption that the trait might not be that important, since otherwise most individuals would behave similarly. By taking the absolute value, this case will lead to a diminished weight of this specific trait, which is a desired feature of the InARes.
These implicit assumptions further allow for the estimation of whether a trait enhancement is adaptive or maladaptive. When most individuals in the treatment population exhibit an increase in a trait, compared to control, we can assume that an increase in this trait is adaptive, and vice versa. Therefore, we need the sign of the median of the treatment population (i.e., > 0 means an increase in rex is adaptive, < 0 means an increase in rex is maladaptive). We use the median instead of the mean, making the algorithm robust to outliers. Those thoughts lead to the following equation for a weighted mean value of all traits:
I n A R e s i = k n t r a i t s r e x i , k max | | r e x i , k ( c t ) | |       s g n ( m e d i a n r e x i , k ( t ) ) n t r a i t s
Values of I n A R e s assume the individual exhibits an:
< 0: overall maladaptive change in the included traits against a certain stressor
= 0: overall, neither adaptive nor maladaptive response
> 0: an overall adaptive response
where I n A R e s i is the individuals’ weighted mean value of all traits. As before, it is calculated at the individual level, allowing for estimating the uncertainty (i.e., standard deviation) of this value. n t r a i t s is the number of traits included in I n A R e s , r e x i , k is the value of the k th trait of the i th individuum that is included. r e x i , k ( c t ) is the vector of all r e x values of the k th trait of control and treatment, and r e x i , k ( t ) is the vector of all r e x values of the k th trait of the treatment. The signum function ( s g n ( m e d i a n r e x i , k , t ) ) assesses just the sign of the median of r e x i , k ( t ) . max | | r e x i , k ( c t ) | |       s g n ( m e d i a n r e x i , k ( t ) ) is the weighing term, which we call r e x m a x k from hereon. Similarly to r e x , I n A R e s will be between -1 and 1. Through this, adaptations and maladaptations are considered, such that adaptive decreases in a trait would lead to increases in I n A R e s . In contrast, maladaptive increases in a trait would lead to decreases in I n A R e s . In other words, I n A R e s measures the cumulative expression of traits in relation to their maximum expression and their control or baseline. Similar to the previous step, equation 4.1 comes with another variant that allows customisation and incorporation of additional knowledge of the investigated system, if available (see SI for more detail).
Estimate each trait's contribution to the Index for Adaptive Responses
This step is optional. It allows estimating the contribution of each trait to the InARes value from a simple control vs treatment experiment or similar data. In principle, we reverse the calculation of equation 4.1 or 4.2, respectively, to calculate each trait's contribution to I n A R e s at the individual level:
c o i , k = γ i , k n t r a i t s     1 I n A R e s i   ,   γ i k = r e x i , k max | | r e x i , k , c t | |
where all parameters have a similar meaning as before, and c o i , k is the contribution of the k th trait of the i th individuum to I n A R e s i , and the weighted trait γ i k , similar to previous equations. In this case, the previously calculated values for γ i , k can be used and do not have to be calculated again. Then, the mean and standard deviation of c o i , k is calculated for each trait and used in the following equation to estimate the adaptiveness of each trait qualitatively:
C O k ¯ = c o ¯ i , k ( t ) c o ¯ i , k ( c )     | m e d i a n I n A R e s c | m e d i a n I n A R e s t
C O k ¯ is the corrected change in the mean contribution from the control to the treatment. The contribution of each trait to the I n A R e s of the control can vary strongly because the values are very low (naturally around 0), resulting in a very high mean contribution (in equation 5.1). Thus, we correct the mean contribution with the ratio of the absolute median value of I n A R e s of the control and the treatment. This step considers the strength of deviation of the treatment from control and solves the issue with small contribution numbers in control. Again, we use the median to achieve robustness against outliers and the absolute value to get the sign of the relation (i.e., whether the trait is adaptive or maladaptive). If C O k ¯ exceeds 0.05 (meaning a change in the contribution of 5 % or more) in one trait, an increase in this trait is considered adaptive or maladaptive, depending on the sign. This value was initially chosen arbitrarily but has proven to be the best value during the simulations (see SI for results). Furthermore, the treatment's standard deviation of c o i , k is used to assess potential interactions with other parameters. If the value exceeds 5 % of the c o i , k of the treatment, it is assumed that the strong variance in the contribution is caused by other parameters (i.e., an interaction exists). This is a reasonable assumption, as the specimens of the treatment should similarly respond if there is a definite benefit in the enhancement of a trait. Suppose a high variation occurs in the response. In that case, the benefit of the respective trait might be dependent on factors other than just that single trait (e.g., an interaction with environmental factors), causing individuals to potentially “select” different strategies in this trade-off. However, both of these thresholds can be customised in the corresponding function of the R package if desired.
The values of C O k ¯ can also be ordered ordinary. Therefore, the trait with the highest absolute value is assumed to have the highest adaptive benefit for the total adaptation of the organism against the stressor. However, it probably cannot be considered a linear relationship (e.g., a value of 10 % compared to 5 % does not necessarily mean that it is twice as effective, although possible). We would need many experimental data from different research fields to support this assumption of a linear relationship between those values. Future application of the InARes framework will show whether it can be applied at a continuous scale. The function in the R package will report the result as clear text and numerical output (see Table SI1 for an example). However, this approach can only provide a rough estimate, as it cannot replace a proper experiment to investigate the effectiveness of each trait. This approach is a tool that helps interpret the results of an analysis, to get first ideas of the traits’ effectiveness if nothing or not much is known about the studied system. This will also help in designing proper experiments for that estimation and further studies of the respective system.

Testing the Index for Adaptive Responses

We sophisticatedly tested the InARes framework and all its features. We used data from a very elaborative laboratory predation trial with the aquatic predator-prey system, comprising Daphnia magna as prey and Triops cancriformis as invertebrate predator (Diel et al., 2023, manuscript in preparation). In this study, 10 morphological, plastic traits were examined and related to a survival probability for each individuum. This is a perfect testing data set for this framework. We evaluated the original full trait-based model, a predictive model thereof, models applying different ways of the InARes framework, and two versions of a model based on principal component analysis as a common way to analyse such data. One with a common approach of dimension reduction, and one with just the first principal component, since we aimed to achieve a single value, representing the organisms adaptation (see SI for a detailed description).
The framework and its equations imply that a specific InARes value reflects a certain efficiency of the adaptive response. We used another predator-prey data set to test this implication, where the prey D. cucullata was exposed to three different predators (Laforsch & Tollrian, 2004). We calculated the InARes value for each situation and related them to the defence effectiveness against each predator (see SI for a detailed description).
We used simulations to analyse the effect of the rex-transformation on the data and variance structure (see SI for results) and to estimate the prediction accuracy of the algorithm comprising equations 5.1 and 5.2. Therefore, we defined several parameters of simulated data that should be tested semi-permutated to analyse how they affect the quality of the outcome. We assessed 656 different cases, including their combinations. We ran regression models to evaluate the impact of the different data parameters (i.e., number of non-gaussian distributed traits, number of traits, number of replicates, number of (mal)adaptive traits, and difference in the traits between control and treatment). During the simulation, we ran the complete framework in its default form and checked whether the outcome is similar to the input (i.e., whether the traits set as adaptive or maladaptive when creating the data are estimated as such by the algorithm; see SI for a detailed description).
For creating the algorithms and the package, as well as performing the statistical analyses, we used R version 4.0.3 (Core Development Team, 2020) with the packages car (Fox & Weisberg, 2019), ggplot2 (Wickham, 2016), and gamm4 (Wood et al., 2020). Residuals of all statistical models were checked for normal distribution and homogeneity of variance. The general level of significance was set to 0.05.

Application examples for the Index for Adaptive Responses

To show the broad application possibilities of the InARes framework, we re-evaluated literature data from different research fields. We took a typical example of a multi-predator study with rotifers facing an invertebrate and a vertebrate predator (Zhang et al., 2022). We took a second study investigating the effects of monoculture and agroforestry on cocoa trees in different environments, representing an example of an application in complex environments with different environmental conditions (Borden et al., 2020). For better readability, we provided the complete analyses, including brief methods, results, and discussion of each data in separate blocks at the end of the results chapter in the supplemental information.

Results

Re-evaluation of the case study

The full model of the corresponding study (Diel et al. 2023, manuscript in preparation) showed that the tail-spine length and the furca length (in interaction with the predator body length) have a major impact on the survival probability. Some additional analyses showed that the lateral body width and the length of the dorsal spinule bearing area provide additional benefits on survival probability in a specific orientation. The full model exhibited a deviance of 630.5 and comprised 19 parameters (i.e., the traits and selected interactions). However, because of collinearity with other traits, two additional traits (the lateral body width and the length of the ventral spinule bearing area) and their interactions had to be excluded from this model (Table 1).
Following a stepwise downward selection of the full model, we created the predictive model. The most important predictors for the survival probability of the prey were the tail-spine length (chi-sq. = 8.658, p = 0.003), the distance between the fornices (chi-sq. = 4.899, p = 0.027) and the interaction between the length of the furca and the body length of the predator (chi-sq. = 9.650, p = 0.002). The model exhibited a deviance of 648.0 (Table 1).
We calculated the InARes over all traits and used this value to predict survival probability in interaction with the predator body length. The model showed a significant effect on the survival probability in the InARes value (chi-sq. = 6.016, p = 0.014) and in the interaction with this value and the predator body length (chi-sq. = 5.372, p = 0.021). It exhibited a deviance of 568.4 (Figure 1 A, Table 1). When excluding the collinear traits from the calculation of the InARes, there was no significant effect anymore (chi-sq. = 3.618, p = 0.057), but the interaction with the predators’ body length was still significant (chi-sq. = 5.925, p = 0.015). The deviance of this model was 570.2 (Table 1). We evaluated the contribution of each trait to the InARes over all traits. The traits predicted to be adaptive comprised the tail-spine length, the distance between the fornices, the length of the dorsal and ventral spinules, as well as the length of the dorsal and ventral spinule bearing areas, with the effect strength in this order. An increase in furca length was recognised as maladaptive. However, the algorithm predicted potential interactions in all of the included traits. We used these predictions calculated by the InARes framework in an additional model. Then, we fitted the model again with these adaptive and maladaptive traits. Here, the InARes had a significant effect on the survival probability of the prey (chi-sq. = 9.166, p = 0.003), while the predator body length and their interaction had no significant effect. The model exhibited a deviance of 563.6 (Table 1). It is worth to mention, that this is the most sophisticated model, without the use of any external information.
From the corresponding study (Diel et al. 2023, manuscript in preparation), we knew that only two traits significantly influenced the survival probability (i.e., tail-spine length and furca length). Thus, we included just these two traits in the InARes. The corresponding model showed a significant effect of the InARes value on the survival probability (chi-sq. = 15.345, p < 0.001) and a significant interaction with the predator body length (chi-sq. = 5.715, p = 0.017). The deviance of this model was 560.4 (Figure 1 B, Table 1). The same traits were included in a trait-based model, which showed almost equal deviance of 560.5 (Table 1). When we additionally included the lateral body width as well as the length of the dorsal spinule bearing area (i.e., the minor affecting traits of the corresponding study), again, the InARes value (chi-sq. = 8.156, p = 0.004) and the interaction with the predator body length (chi-sq. = 5.456, p = 0.020) had significant effects, but the deviance increased to 564.2 (Table 1).
The principal component analysis explained 90.6 % of the variance with the first three components (the others explained less than 5 %). The first component explained 70.0 %. It was mainly described by a decrease in the ventral spinule bearing area, the body length, the dorsal spinule bearing area, the dorso-ventral body width, the lateral body width, and the tail-spine length, in this order. The second component explained a 13.2 % variance, comprising a decrease in the length of the ventral spinule bearing area, an increase in body length and dorso-ventral body width, a decrease in tail-spine length, an increase in the lateral body width, and a decrease in the distance between the fornices, in this order. The third component explained 7.5 % of the variance and was mainly described by a decrease in tail-spine length and an increase in the length of the dorsal spinule bearing area. We were not able to identify any meaningful trait coordination. We used the same model as before but included the first three principal components and their interaction with the predator body length. The model with these three principal components showed a significant effect on the survival probability of the prey in the first (chi-sq. = 14.941, p < 0.001) and the third (chi-sq. = 5.685, p = 0.017) component but not in the second component (chi-sq. = 0.941, p = 0.332) nor any interaction with the predator body length. This model had a deviance of 564.3. When we only included the first principal component to achieve just one single value, representing the total defence (i.e., as anticipated with the InARes), the principal component had a significant effect (chi-sq. = 11.656, p = 0.001), but not the interaction with the predator body length. This model had a deviance of 570.4 (Table 1).

The transferability of the relation between the Index for Adaptive Responses value and defence effectiveness.

In the T. cancriformis vs D. magna model, a shift of the InARes value from 0 to 0.4 was related to an increase in survival probability from 80.9 ± 3.2 % to 94.7 ± 2.1 %, which is a mean relative increase of the survival probability by 72.2 % (see Figure 1).
In the study with D. cucullata (Laforsch & Tollrian, 2004), animals of the predation trial with C. flavicans showed a survival probability from 52.98 ± 8.9 % of control to 92.9 ± 2.2 % of induced morphs, which is a relative increase of the mean survival probability by 84.9 %. The InARes value increased from 0 ± 0.17 to 0.42 ± 0.22.
Animals of the predation trial with Cyclops sp. showed a survival probability from 7.3 ± 0.4 % of control to 9.5 ± 0.2 % of induced morphs in size class 2, which is a mean relative increase in the survival probability by 2.5 %. The InARes value increased from 0 ± 0.26 to 0.37 ± 0.24, but the ratio of completely eaten vs incompletely eaten prey was lower in induced morphs than in control, from 20 ± 3.7 % to 3.3 ± 1.6 %, which is a relative increase in “feeding protection" by 83.1 % in the mean.
Animals of the predation trial with L. kindtii showed a survival probability from 35.0 ± 5.0 % of control to 90.0 ± 5.0 % of induced morphs, a mean relative increase of 84.6 %. The InARes value increased from 0 ± 0.19 to 0.37 ± 0.19.

Performance of the prediction of the adaptiveness of traits

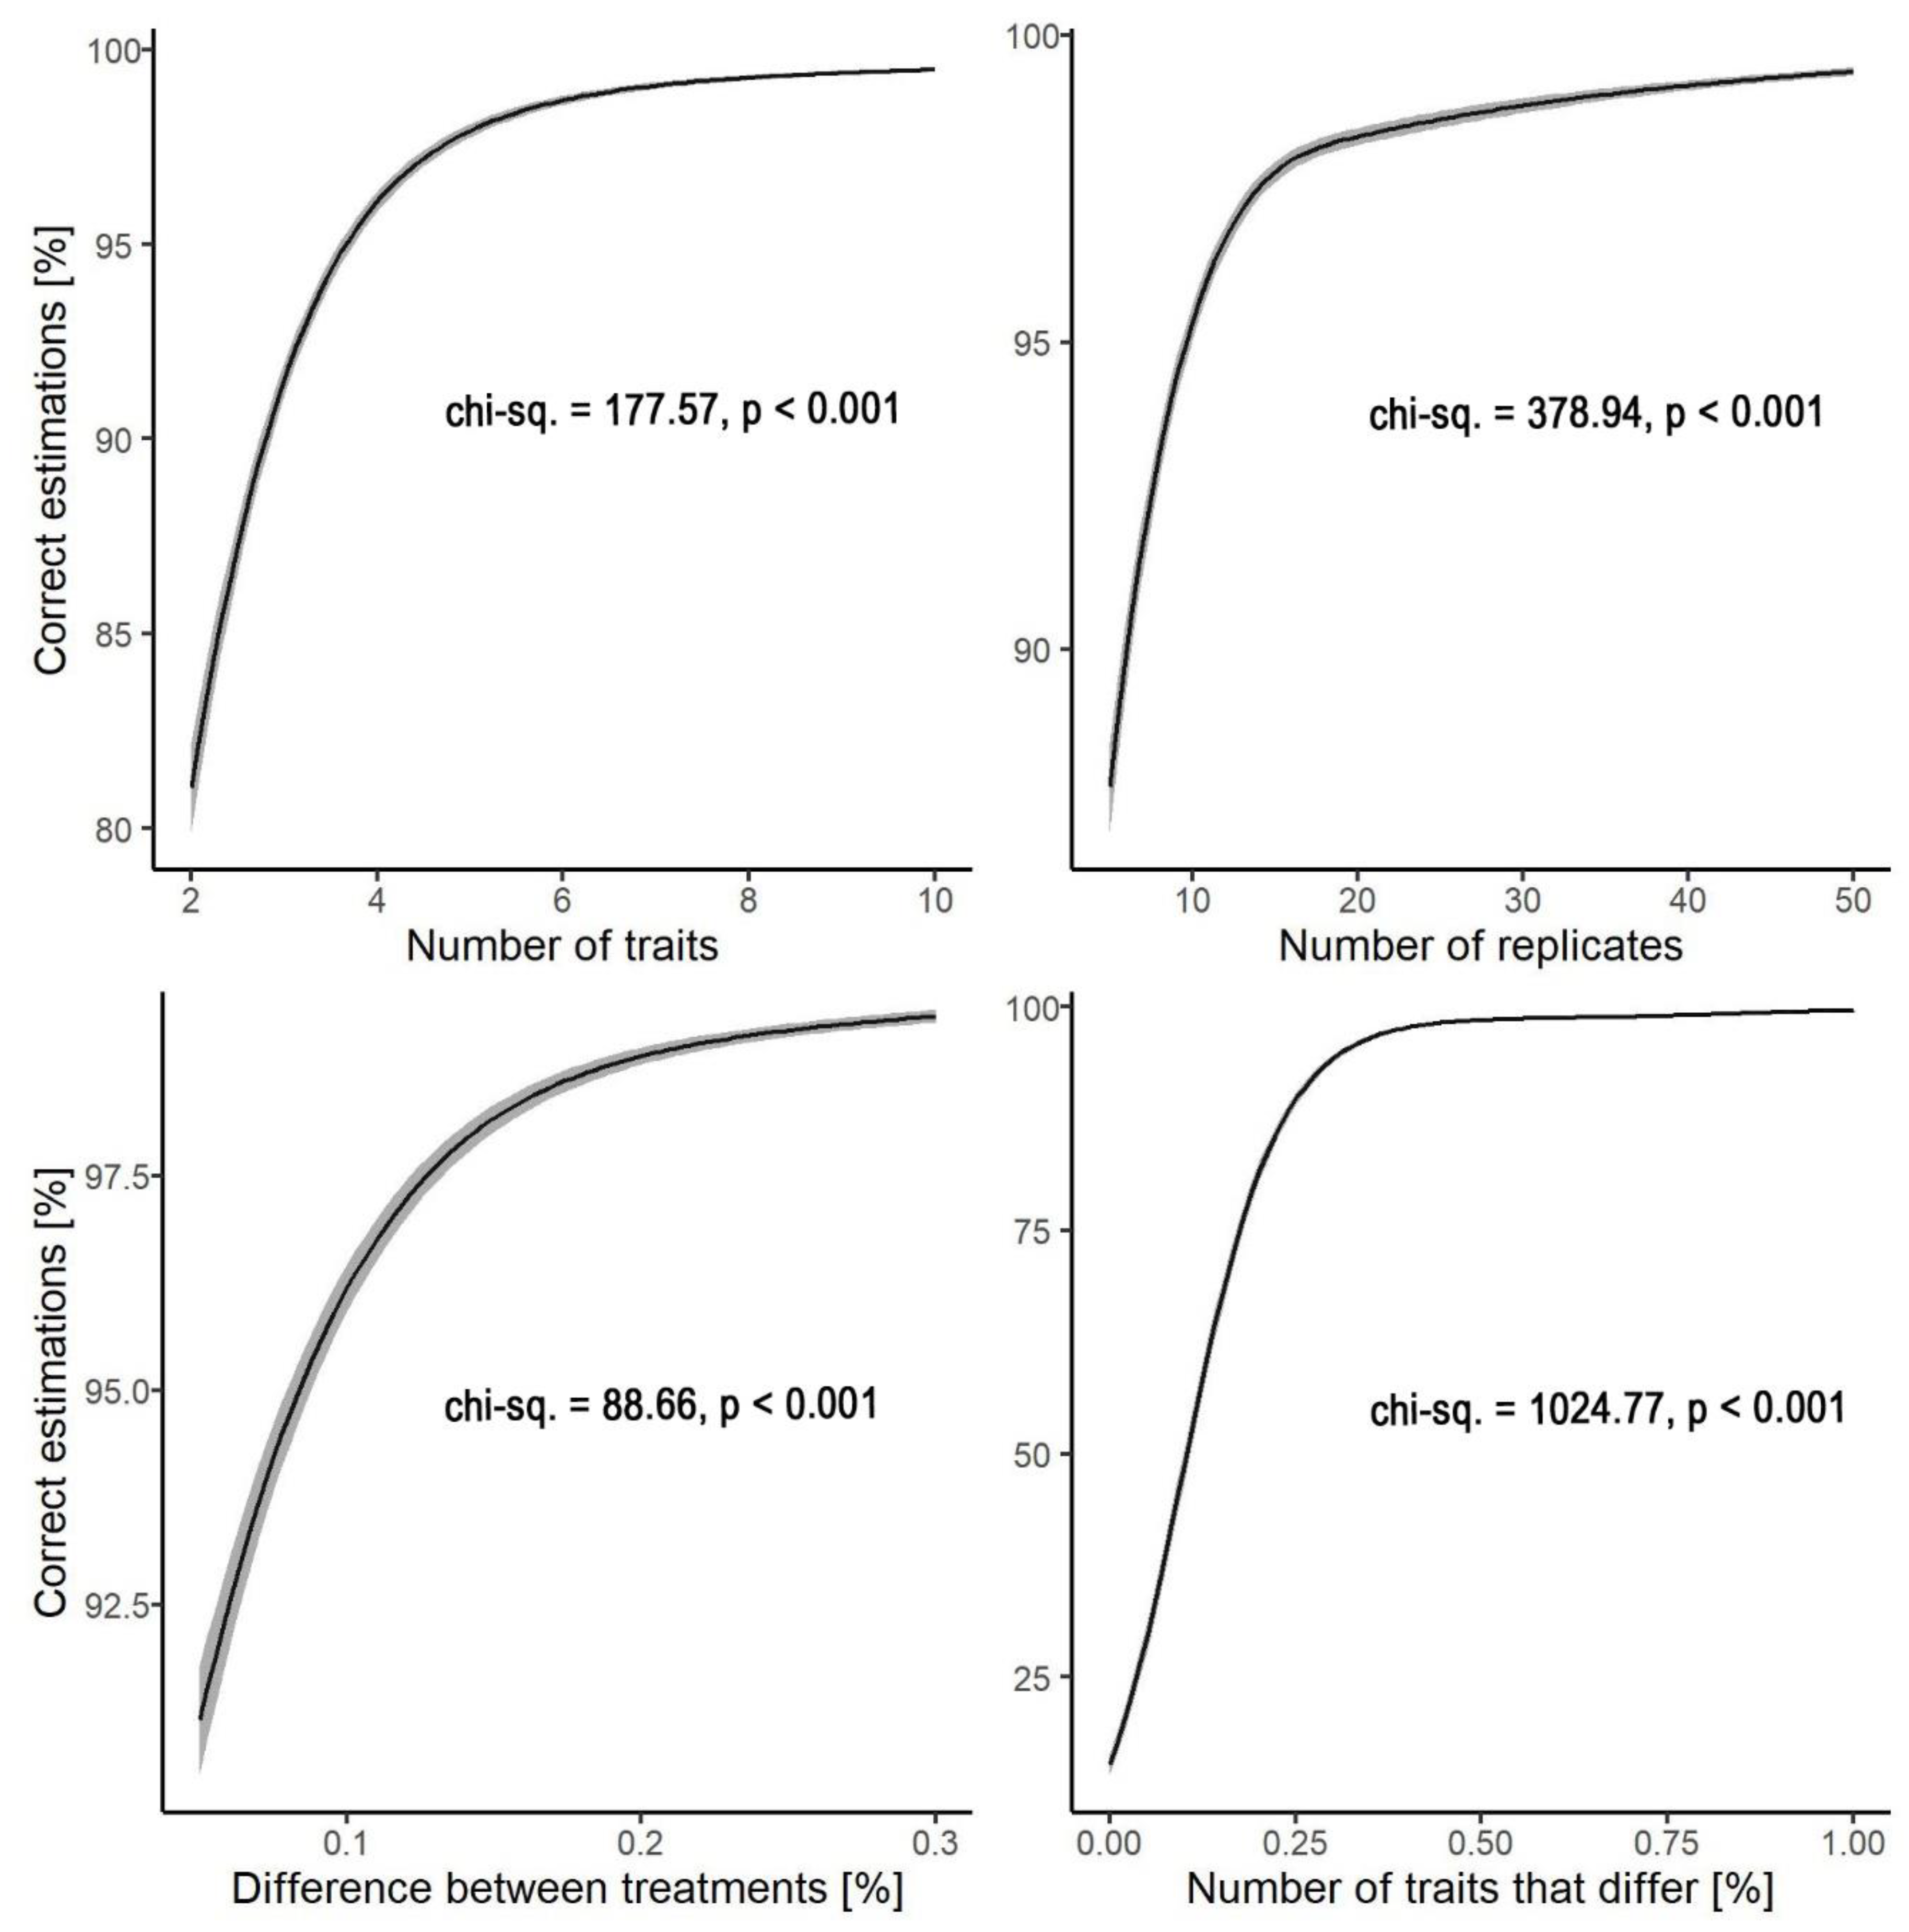
When we assessed the effects of different data attributes (i.e., number of traits included in the InARes, number of replicates per treatment, number of traits that differed between treatment and control, trait differences between control and treatment), we found high accuracy in most cases (Figure 2).

Discussion

We have developed the InARes framework with simple, robust, and intuitive equations that can be conveniently used with the included InARes R package or transferred to any other computer language without requiring extensive programming or statistical knowledge. Furthermore, without the data preparation, the whole InARes framework can be applied very simply with just three lines of code in R. We have extensively tested the performance, comparability, and accuracy of the InARes framework. We demonstrated that all provided features are fully functional, accurate and powerful (see Box SI1, and Fig. SI2, or the package website for a summary of recommendations and limitations).
When all traits are unified in one number that reflects the total adaptation of an organism against a stressor, one of the main issues was that the traits may contribute differently to the adaptation. Some are more important than others. Some might be non-adaptive, some adaptive, and others are maladaptive. We solved this issue by taking advantage of two implicit assumptions in ecology: First, the organism will respond to a stressor in a for the organism beneficial way. Second, overexpression of traits will be avoided due to the costs that come along with an increased expression. The InARes value might be biased in cases where an organism responds to a certain stressor in a maladaptive way without a biological reason. If this is the case at an individual level, the algorithm performance would not be affected, as it is robust to outliers. However, if a whole population responds that way, this will bias the InARes value. Therefore, we recommend always including prior knowledge of the system in the calculation if it is available and validated. The improvement of the model fit in the corresponding feeding-trial study (Diel et al. 2023, manuscript in preparation), where the findings of the study were respected in the InARes calculation, supports this recommendation.
The results of the corresponding predator-prey study show that using the InARes value in statistical models generally outperforms common alternatives. This is even true if no prior knowledge about the adaptiveness of the traits exists, and all traits are used in the InARes calculation. The fit accuracy was even further improved when we preliminarily estimated the adaptiveness with the InARes framework and used the results in a subsequent recalculation of the InARes. There, the model fit quality was close to that of the model with a priori knowledge. This is an additional advantage of this framework. It strongly reduces the potential effort to assess each trait's contribution to the defence of an organism. Excluding collinear terms reduced the model quality slightly. This indicates that these terms contribute to the defence to some extent (see below for additional discussion) and that collinear terms are generally no issue for this framework. It is noteworthy that the principal component analysis almost provided a similar fit quality, but we had to use more than one component to achieve a similar fit. Even in this case, the interpretation of the principal component analysis is not simplified. Each component consists of a linear combination of all traits included, and each other component also partially accounts for the same traits. Therefore, it is still quite complicated to interpret these results and conclude the importance of each trait. Finally, the InARes model showed equal deviance compared to a likewise trait-based model when using just the two majorly affecting traits (of the corresponding study) in the InARes framework. This further shows that uniting and weighing the traits provides a similar evaluation quality compared to trait-based models. However, with the InARes framework, there is no need for extraordinarily high replicates compared to trait-based models with many traits included.
The transformation method is robust even with non-Gaussian distributed data. The values are implicitly standardised to the environment through the standardisation to a control treatment. The algorithms allow comparisons across studies, systems, and even organisms in a so far not existing simplicity and comparability. Furthermore, it will simplify studies of many traits, environmental conditions, and/or stressors. This also accounts for different laboratories where similar experiments are conducted. Even in clonal organisms (like Daphnia), the individuals behave slightly differently each time an experiment is repeated. By using the control as a baseline, all those factors that are uncontrollable or remain unrecognised are implied in the baseline. Therefore, they are excluded from the assessment of the adaptive response as such. We tested the comparability or transferability with a data set with multiple predator-prey systems (Laforsch & Tollrian, 2004). When evaluating the proper metrics for the efficiency of the defences, the within-study comparison of the defences of Daphnia against all three predators showed high comparability across the different predator systems. Even though the efficiency of the defences between the two predator-prey studies was relatively close (i.e., approx. 72 % vs 84 %), there remains a minor discrepancy. However, we have to admit that there was considerable variability in the defence of the individuals in the study of Laforsch et al. (2004), and no direct relationship between each individual's morphology and the survival probability has been done (animals measured were not fed to the predator). Furthermore, only some of the traits have been measured in D. cucullata in this study. In contrast, (almost) all morphological plastic traits in the corresponding study of Diel et al. (2023) were measured, which renders the estimate of this study more accurate. However, to our knowledge, there is no other study with a comparable and comprehensively recorded set of traits of a predator-prey interaction, which renders perfect comparability difficult. Nevertheless, this study provided the opportunity to compare the defence of the same study animals against three different predator-prey systems, showing an almost perfect match of the increase in the InARes value and the relative increase in protection efficiency (84.9 % against C. flavicans, 83.1 % against Cyclops sp. and 84.6 % against L. kintii upon an increase of the InARes value from 0 to approximately 0.4). Thus, the cross-study, cross-system and cross-species comparability are, most likely, relatively well provided by the InARes value, even though one must be careful about the comparability of the circumstances (i.e., the environment), and perfect comparability might be rare.
We tested the predictive power of the third step of this framework with simulations. They provided very sophisticated results, indicating a high accuracy of predicting the adaptiveness of each trait even under challenging circumstances, like a low replicate number or minimal differences between the control and the treatment. The only data attribute that resulted in bad prediction accuracy was a low number of (mal-) adaptive traits. The algorithm performs poorly if less than 25 % of the included traits differ from control (adaptive or maladaptive). In a natural context, however, we assume that the InARes framework will be applied only when differences between the control and treatment have been observed. Thus, this poor performance can be neglected, resulting in a prediction accuracy above 90 % in almost all cases. Nevertheless, the simulations only estimate how the algorithm might perform in a natural context, and future studies will provide a better idea about the “in-field” performance. When testing the algorithm in the corresponding predator-prey study, we achieved a result from the algorithm that was in line with the results of the trait-based evaluation (see SI for a more detailed discussion). However, the trait-based approach allows a more detailed inference on the relation of a functional-trait value and its benefit against the stressor. These results show that the algorithm cannot replace experiments, e.g., feeding experiments, for estimating the adaptiveness of a certain defensive trait when definite knowledge is aimed for or necessary. However, the trait-contribution assessment of the InARes framework can help creating new hypotheses and design experiments. Furthermore, it does not require extensive work force and still provides decent estimates of the traits’ adaptability. This will improve the knowledge about the studied system and help to achieve this definite knowledge.
The framework even allows testing traits that cannot be directly investigated in such an experiment. For example, in the corresponding study (Diel et al., 2023), it was not possible to record the ultrastructural traits of D. magnas’ carapace, which affect the stability of the daphnids’ shell (Kruppert et al., 2016; Rabus et al., 2013; Ritschar et al., 2020). The animals would need to be killed for these measurements and could not be fed to the predator. Without the urgent need for a feeding trial with the same animals, all traits could be measured on the same animal and then analysed using the InARes framework. The baseline and r e x m a x k values can also be estimated with control and exposure treatments in a preliminary experiment. Those values can then be used in further experiments, e.g., that even apply unreplicated designs (i.e., without specific treatments but continuous parameters).
We provided examples of how the InARes framework can be applied in different cases. Even though we could not confirm all results of the underlying data with the InARes framework, they were generally in line with prevailing theories and the findings and discussions in the corresponding studies (see SI for detailed discussions). We could show that the InARes framework has broad applicability and provides a fast and easy way to improve and simplify inference and comparability across studies and environments. However, we would recommend and highly appreciate feedback from users of the framework (e.g., via Github) to expand the list of recommendations in the packages’ readme file.

Conclusions

Analyses using the InARes provide easily understandable and interpretable results. Especially when studying the impact of one stressor on the adaptiveness against another stressor or in complex environments, this framework provides a simple and intuitive interpretation of the analyses. We showed how this framework could be applied in various research fields and to investigate different questions. The framework and its algorithms are created with broad applicability in mind and are not dedicated to a special case. Therefore, there might be ways to apply this framework (or parts thereof, i.e., the rex-transformation) in other research areas. The only requirement is a baseline or control treatment to which the individual values can be related. However, this can also be achieved in a preliminary experiment. We admit that this framework simplifies reality and can only approximate an organism's total response and each trait's contribution to the adaptation. However, by the time of writing, this method is probably the best tool available to investigate functional traits and total responses under complex environments. The InARes framework will help to reveal and understand trade-offs in organismal responses and corresponding functional traits. Consequently, it will help to understand these responses' underlying mechanisms and evolution.

Supplementary Materials

The following supporting information can be downloaded at the website of this paper posted on Preprints.org.

Author Contributions

The framework concept was conceived by M.K. and discussed and improved by all authors. M.K., P.D., and M.S. conceived and optimised the methodology. M.K. and P.D. were involved in the data acquisition. M.K. performed the formal analysis and data visualisation. M.K. wrote the original draft, and all authors contributed to the manuscript's writing, reviewing, and editing.

Data Availability Statement

Data from the original works used and cited in this manuscript are available via repositories or upon request, as stated in the original publications.

Acknowledgements

We highly appreciated the very patient help and listening ear of Volker Bürkel and Jasper Lendla and their mathematical support and comments for the InARes framework. Furthermore, we thank Luc De Meester for a fruitful discussion at the SIL-Conference and valuable comments on the InARes framework and how to convince very critical readers like him that this is the, so far, best tool available to investigate 'whole organism’ responses. Finally, we thank two anonymous reviewers for their highly appreciated work and comments on this manuscript.

Conflict of Interest

None of the authors was subjected to any conflicts of interest.

References

  1. Belluau, M. , & Shipley, B. (2017). Predicting habitat affinities of herbaceous dicots to soil wetness based on physiological traits of drought tolerance. ( 119(6), 1073–1084. [CrossRef] [PubMed]
  2. Blumenthal, D. M. , Mueller, K. E., Kray, J. A., Ocheltree, T. W., Augustine, D. J., & Wilcox, K. R. (2020). Traits link drought resistance with herbivore defence and plant economics in semi-arid grasslands: The central roles of phenology and leaf dry matter content. Journal of Ecology, 2351. [Google Scholar] [CrossRef]
  3. Borden, K. A. , Anglaaere, L. C. N., Owusu, S., Martin, A. R., Buchanan, S. W., Addo-Danso, S. D., & Isaac, M. E. (2020). Soil texture moderates root functional traits in agroforestry systems across a climatic gradient. Agriculture, Ecosystems & Environment. [CrossRef]
  4. Candeias, M. , & Fraterrigo, J. (2020). Trait coordination and environmental filters shape functional trait distributions of forest understory herbs. ( 10(24), 14098–14112. [CrossRef] [PubMed]
  5. Christjani, M. , Fink, P., & von Elert, E. (2016). Phenotypic plasticity in three Daphnia genotypes in response to predator kairomone: evidence for an involvement of chitin deacetylases. The Journal of Experimental Biology, 1697. [Google Scholar] [CrossRef]
  6. Colpaert, J. v. , Muller, L. A. H., Lambaerts, M., Adriaensen, K., & Vangronsveld, J. (2004). Evolutionary adaptation to Zn toxicity in populations of Suilloid fungi. ( 162(2), 549–559. [CrossRef]
  7. Core Development Team, R. (2020). A Language and Environment for Statistical Computing. R Foundation for Statistical Computing.
  8. Dewitt, T. , & Scheiner, S. (2004). Future research directions. Phenotypic Plasticity: Functional and Conceptual Approaches, Oxford University Press, 2004. [Google Scholar]
  9. Diel, P. , Rabus, M., & Laforsch, C. (2021). Pricklier with the proper predator? Predator-induced small-scale changes of spinescence in Daphnia. Ecology and Evolution. [CrossRef]
  10. Dodson, S. I. (1974). Adaptive change in plankton morphology in response to size-selective predation: A new hypothesis of cyclomorphosis. Limnology and Oceanography. [CrossRef]
  11. Eshun-Wilson, F. , Wolf, R., Andersen, T., Hessen, D. O., & Sperfeld, E. (2020). UV radiation affects antipredatory defense traits in Daphnia pulex. Ecology and Evolution. [CrossRef]
  12. Forsman, A. (2015). Rethinking phenotypic plasticity and its consequences for individuals, populations and species. Heredity. [CrossRef]
  13. Fox, J. , & Weisberg, S. (2019). An R Companion to Applied Regression.
  14. Galarowicz, T. L. , & Wahl, D. H. (2005). Foraging by a young-of-the-year piscivore: The role of predator size, prey type, and density. Canadian Journal of Fisheries and Aquatic Sciences, 2342. [Google Scholar] [CrossRef]
  15. Gilbert, J. J. (2011). Temperature, kairomones, and phenotypic plasticity in the rotifer Keratella tropica (Apstein, 1907). Hydrobiologia. [CrossRef]
  16. Herzog, Q. , Tittgen, C., & Laforsch, C. (2016). Predator-specific reversibility of morphological defenses in Daphnia barbata. Journal of Plankton Research. [CrossRef]
  17. Hofmann, P. , Chatzinotas, A., Harpole, W. S., & Dunker, S. (2019). Temperature and stoichiometric dependence of phytoplankton traits. Ecology. [CrossRef]
  18. Hu, Y. , Zuo, X., Yue, P., Zhao, S., Guo, X., Li, X., & Medina-Roldán, E. (2020). Increased Precipitation Shapes Relationship between Biochemical and Functional Traits of Stipa glareosa in Grass-Dominated Rather than Shrub-Dominated Community in a Desert Steppe. Plants 2020, Vol. 9, Page 1463. [CrossRef]
  19. Karpestam, E. , Wennersten, L., & Forsman, A. (2012). Matching habitat choice by experimentally mismatched phenotypes. ( 26(4), 893–907. [CrossRef]
  20. Kruppert, S. , Horstmann, M., Weiss, L. C., Schaber, C. F., Gorb, S. N., & Tollrian, R. (2016). Push or Pull? The light-weight architecture of the Daphnia pulex carapace is adapted to withstand tension, not compression. Journal of Morphology. [CrossRef]
  21. Laforsch, C. , & Tollrian, R. (2004). Inducible defenses in multipredator environments: Cyclomorphosis in Daphnia cucullata. Ecology, 2311. [Google Scholar] [CrossRef]
  22. Laforsch, C. , & Tollrian, R. (2009). Cyclomorphosis and Phenotypic Changes. In Encyclopedia of Inland Waters (pp. 643–650). Elsevier. [CrossRef]
  23. Leech, D. M. , & Williamson, C. E. (2000). Is tolerance to UV radiation in zooplankton related to body size, taxon, or lake transparency? Ecological Applications, 1540. [Google Scholar] [CrossRef]
  24. Li, H. , Xu, W., Wu, L., Dong, B., Jin, J., Han, D., Zhu, X., Yang, Y., Liu, H., & Xie, S. (2020). Distinct dietary cadmium toxic effects and defense strategies in two strains of gibel carp (Carassius gibelio) revealed by a comprehensive perspective. ( 261, 127597. [CrossRef] [PubMed]
  25. Martin-Creuzburg, D. , Wacker, A., Ziese, C., & Kainz, M. J. (2012). Dietary lipid quality affects temperature-mediated reaction norms of a freshwater key herbivore. Oecologia. [CrossRef]
  26. Murray, G. P. D. , Stillman, R. A., & Britton, J. R. (2016). Habitat complexity and food item size modify the foraging behaviour of a freshwater fish. R. ( 766(1), 321–332. [CrossRef]
  27. Piersma, T. , & Gils, J. van. (2011). The flexible phenotype: a body-centred integration of ecology, physiology, and behaviour.
  28. Pigliucci, M. , & Preston, K. (2004). Phenotypic integration: studying the ecology and evolution of complex phenotypes.
  29. Polat, B. , Suleyman, H., & Alp, H. H. (2010). Adaptation of rat gastric tissue against indomethacin toxicity. Chemico-Biological Interactions. [CrossRef]
  30. Rabus, M. , Söllradl, T., Clausen-Schaumann, H., & Laforsch, C. (2013). Uncovering Ultrastructural Defences in Daphnia magna - An Interdisciplinary Approach to Assess the Predator-Induced Fortification of the Carapace. PLoS ONE. [CrossRef]
  31. Ritschar, S. , Bangalore Narayana, V. K., Rabus, M., & Laforsch, C. (2020). Uncovering the chemistry behind inducible morphological defences in the crustacean Daphnia magna via micro-Raman spectroscopy. Scientific Reports. [CrossRef]
  32. Rose, N. L. , Yang, H., Turner, S. D., & Simpson, G. L. (2012). An assessment of the mechanisms for the transfer of lead and mercury from atmospherically contaminated organic soils to lake sediments with particular reference to Scotland, UK. L. ( 82, 113–135. [CrossRef]
  33. Sarrazin, J. , & Sperfeld, E. (2022). Food quality mediates responses of Daphnia magna life history traits and heat tolerance to elevated temperature. Freshwater Biology. [CrossRef]
  34. Shudo, E. , & Iwasa, Y. (2001). Inducible defense against pathogens and parasites: optimal choice among multiple options. Journal of Theoretical Biology, 0022. [Google Scholar]
  35. Stoks, R. , Govaert, L., Pauwels, K., Jansen, B., & de Meester, L. (2016). Resurrecting complexity: the interplay of plasticity and rapid evolution in the multiple trait response to strong changes in predation pressure in the water flea Daphnia magna. Ecology Letters. [CrossRef]
  36. Turschwell, M. P. , Connolly, S. R., Schäfer, R. B., de Laender, F., Campbell, M. D., Mantyka-Pringle, C., Jackson, M. C., Kattwinkel, M., Sievers, M., Ashauer, R., Côté, I. M., Connolly, R. M., van den Brink, P. J., Brown, C. J., & Byers, J. (2022). Interactive effects of multiple stressors vary with consumer interactions, stressor dynamics and magnitude. Ecology Letters. [CrossRef]
  37. Valladares, F. , Gianoli, E., & Gómez, J. (2007). Ecological limits to plant phenotypic plasticity. ( 176(4), 749–763. [CrossRef]
  38. Valladares, F. , Sanchez-Gomez, D., & Zavala, M. A. (2006). Quantitative estimation of phenotypic plasticity: bridging the gap between the evolutionary concept and its ecological applications. Journal of Ecology, 1116. [Google Scholar] [CrossRef]
  39. Whitman, D. W. , & Agrawal, A. A. (2009). What is Phenotypic Plasticity and Why is it Important? Phenotypic Plasticity of Insects: Mechanisms and Consequences.
  40. Wickham, H. (2016). ggplot2 Elegant Graphics for Data Analysis (Use R!). Springer.
  41. Wigley, B. J. , Fritz, H., & Coetsee, C. (2018). Defence strategies in African savanna trees. ( 187(3), 797–809. [CrossRef]
  42. Wood, S. , Scheipl, F., Stat, M. W.-A., & 2017, undefined. (2020). Package “gamm4.” 152.19.134.44, 9. ftp://152.19.134.44/CRAN/web/packages/gamm4/gamm4.
  43. Wright, I. J. , Falster, D. S., Pickup, M., & Westoby, M. (2006). Cross-species patterns in the coordination between leaf and stem traits, and their implications for plant hydraulics. Physiologia Plantarum. [CrossRef]
  44. Zhang, H. , He, Y., Liang He, |, Zhao, | Kangshun, Molinos, J. G., Hansson, L.-A., & Xu, J. (2022). Plasticity in rotifer morphology induced by conflicting threats from multiple predators. Wiley Online Library. [CrossRef]
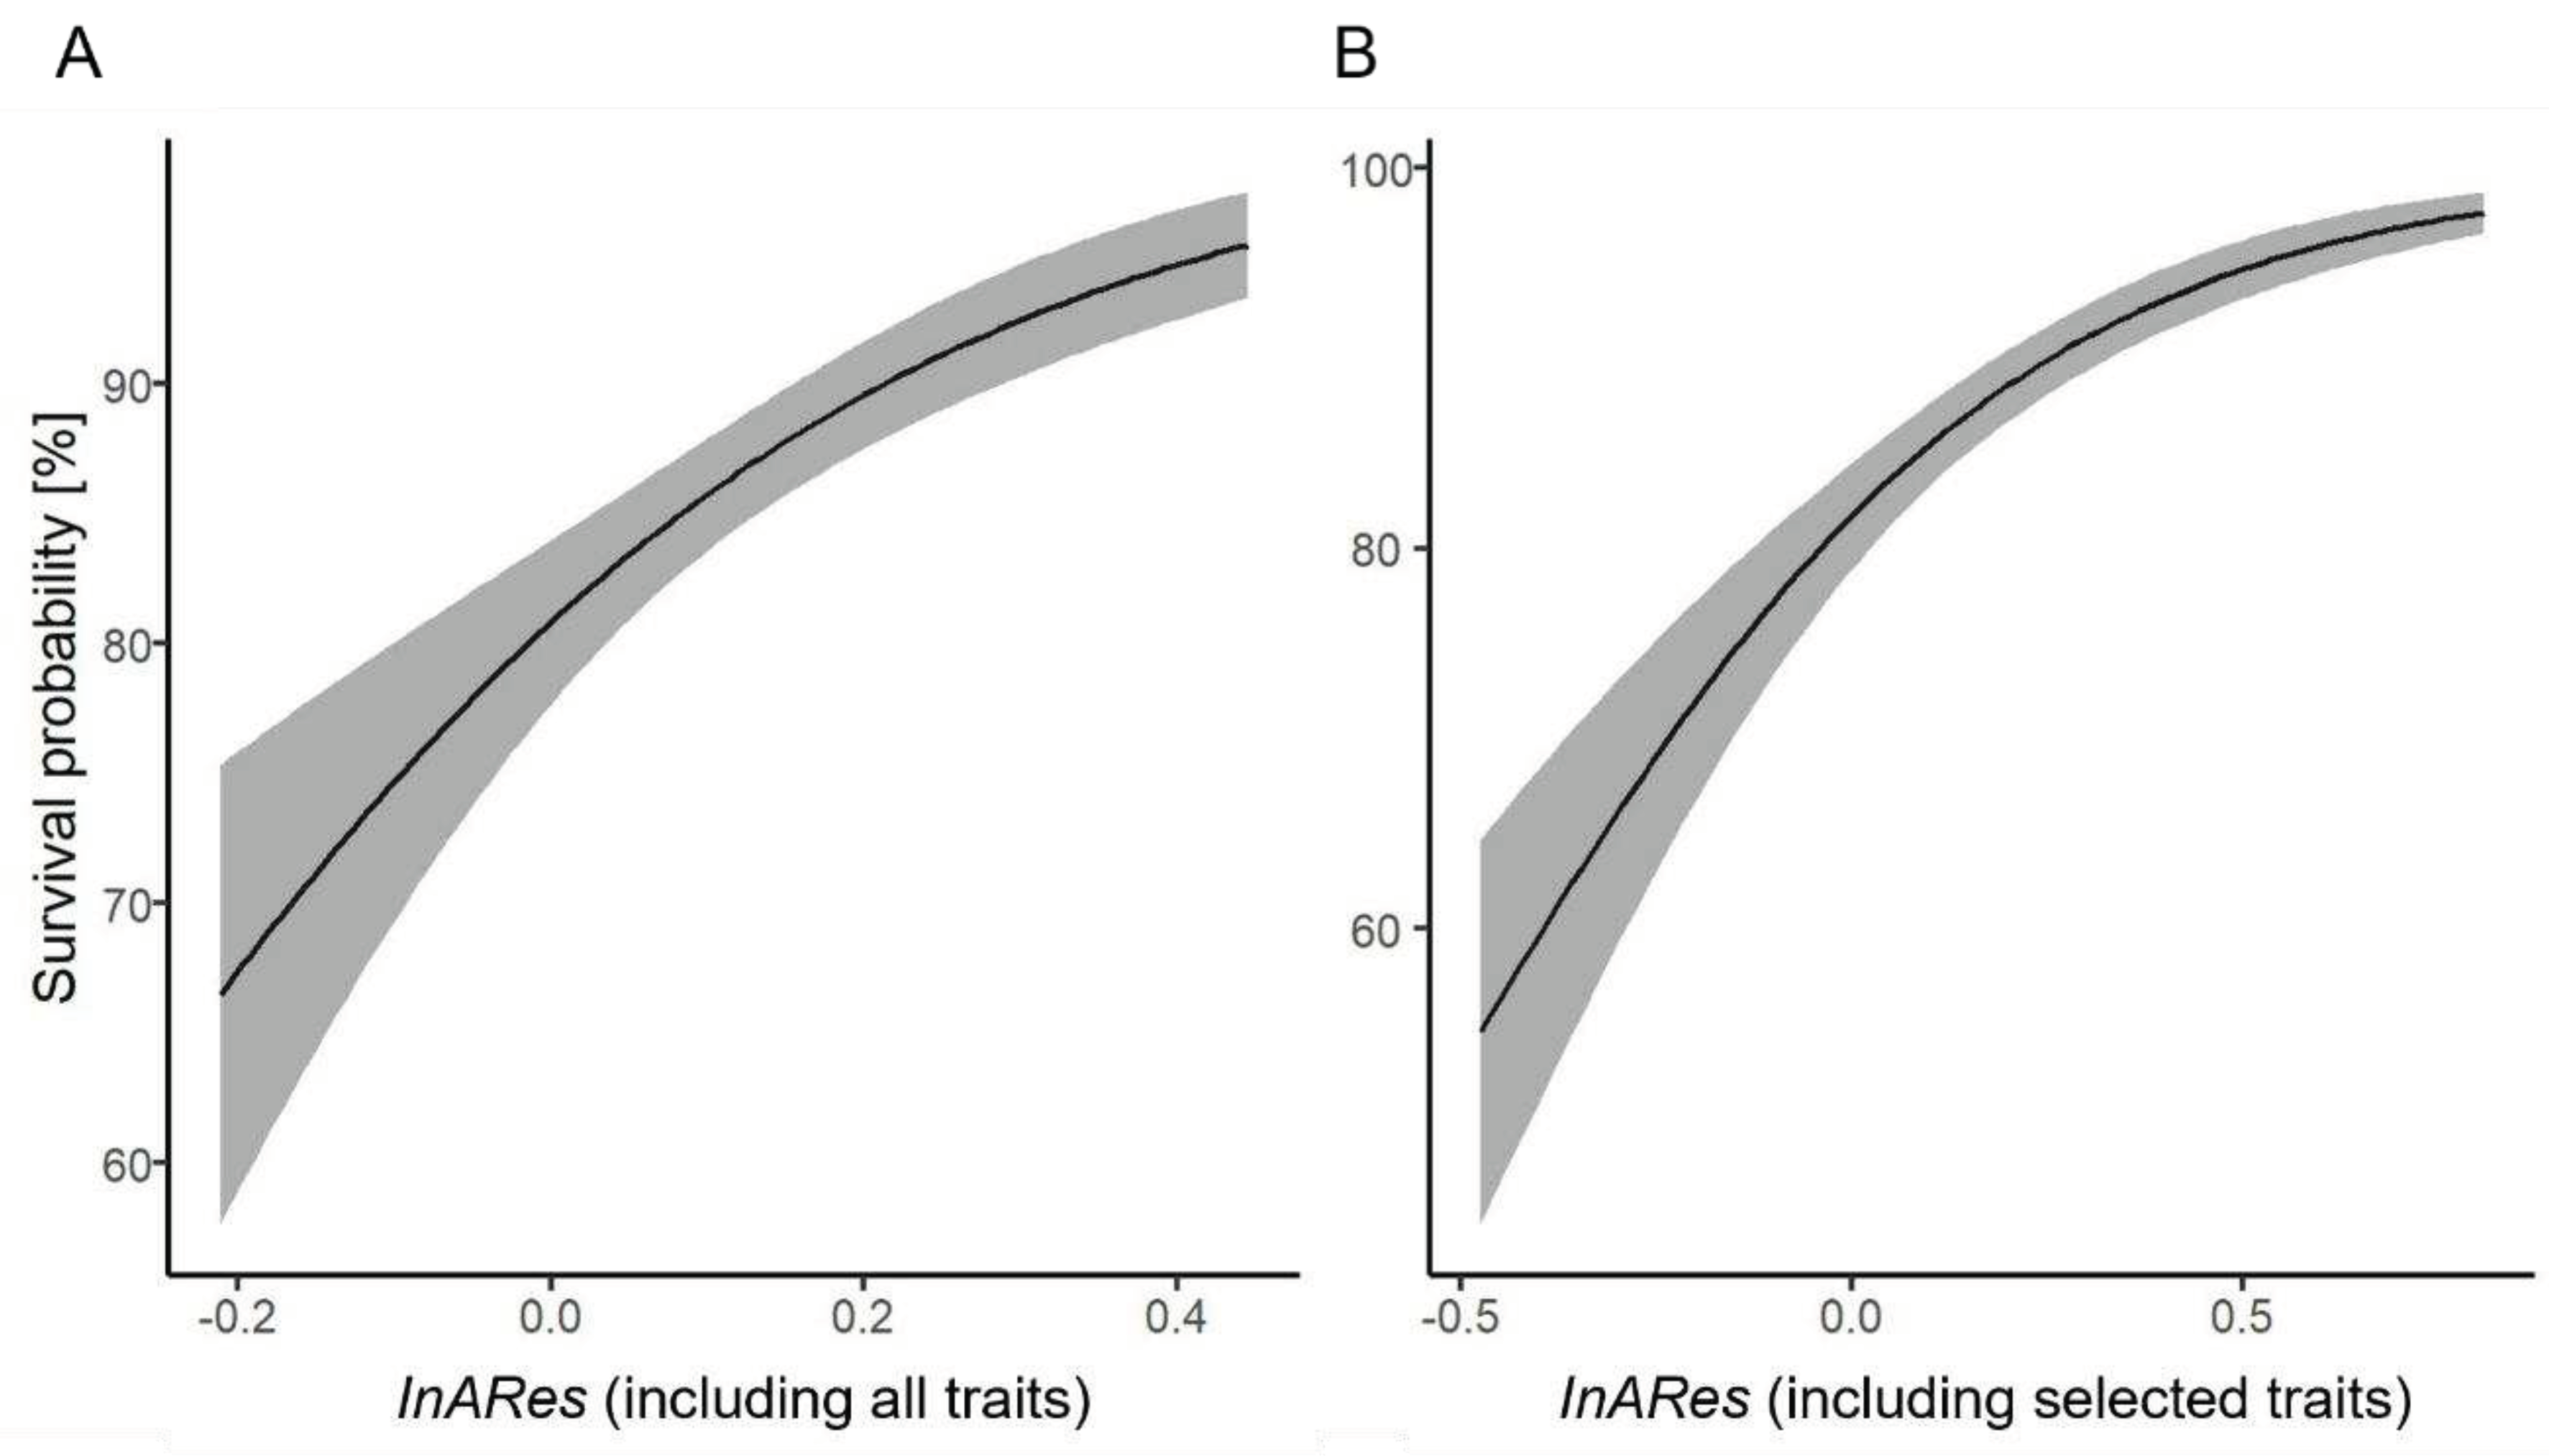
Figure 1. Binomial generalised additive mixed model prediction for prey survival probability depending on differently calculated InARes values. We included all traits in the calculation of the InARes (A) or only two traits (B) found in the corresponding study to affect the survival probability significantly. The latter is the model with the overall lowest deviance and therefore chosen as the best model. The solid line indicates the mean prediction. The ribbon indicates the standard deviation of this prediction.
Preprints 83636 g001
Figure 2. Relationship of data attributes and the accuracy of estimating which trait is adaptive, maladaptive or non-adaptive. In simulations, we manipulated the number of traits included in the InARes, the number of replicates for each treatment, how strong the traits differ between the treatments if they differ, and how many traits differ between control and treatment. The curves were estimated with a binomial generalised additive model when all other attributes were set to the median value. The solid line indicates the mean prediction, and the grey ribbon (very small) indicates the standard deviation. Note the different scales on the y-axis.
Preprints 83636 g002
Table 1. The deviance of all binomial generalised additive mixed models applied in this study, with different parameterisation. The deviance is a proxy for the fit quality across different parameterised models. Noted are the original model (Diel et al. 2023, manuscript in preparation) and its predictive model version, all models with differently calculated InARes (i.e., comprising different traits) and the models using the principal components of a principal component analysis as fixed terms (see SI for detailed methods).
Model Deviance
Full trait-based model from the corresponding study, including 19 parameters 630.5
Selected version of the full-trait-based model 648.0
Trait-based model, including only the two majorly affecting terms of the corresponding study 560.5
Model, based on the InARes, including all 10 traits 568.4
Model, based on the InARes, including all traits except the two collinear traits 570.2
Model, based on the InARes, including terms selected by prior contribution analyses (as part of the framework) 563.6
Model, based on the InARes, including only the two majorly affecting terms of the corresponding study 560.4
Model, based on the InARes, including the two major terms and the minor affecting terms (in specific orientation) of the corresponding study 564.2
Model, based on the principal component analysis including components 1--3 564.3
Model, based on the principal component analysis including just component 1 570.4
Disclaimer/Publisher’s Note: The statements, opinions and data contained in all publications are solely those of the individual author(s) and contributor(s) and not of MDPI and/or the editor(s). MDPI and/or the editor(s) disclaim responsibility for any injury to people or property resulting from any ideas, methods, instructions or products referred to in the content.
Copyright: This open access article is published under a Creative Commons CC BY 4.0 license, which permit the free download, distribution, and reuse, provided that the author and preprint are cited in any reuse.
Prerpints.org logo

Preprints.org is a free preprint server supported by MDPI in Basel, Switzerland.

Subscribe

© 2024 MDPI (Basel, Switzerland) unless otherwise stated