Submitted:
31 August 2023
Posted:
05 September 2023
You are already at the latest version
Abstract
Keywords:
1. Introduction
2. Material Data and Method
2.1. Study Area
2.2. Data
2.3. Methods
2.3.1. Bivariate Polar Plots
2.3.2. Bivariate CPF Methodology
3. Results et Discussion
3.1. Local Meteorology
3.2. CPF and Bivariate Polar Plots
3.2.1. CH4
3.2.2. CO2
3.2.3. CO
3.3. Correlation Statistic
5. Conclusions
Author Contributions
Acknowledgments
Conflicts of Interest
References
- Grange, S.K.; Lewis, A.C.; Carslaw, D.C. Source Apportionment Advances Using Polar Plots of Bivariate Correlation and Regression Statistics. Atmos. Environ. 2016, 145, 128–134. [Google Scholar] [CrossRef]
- Mai, B.; Deng, X.; Liu, X.; Li, T.; Guo, J.; Ma, Q. The Climatology of Ambient CO2 Concentrations from Long-Term Observation in the Pearl River Delta Region of China: Roles of Anthropogenic and Biogenic Processes. Atmos. Environ. 2021, 251, 118266. [Google Scholar] [CrossRef]
- Tiemoko, D.T.; Yoroba, F.; Diawara, A.; Kouadio, K.; Kouassi, B.K.; Yapo, A.L.M. Understanding the Local Carbon Fluxes Variations and Their Relationship to Climate Conditions in a Sub-Humid Savannah-Ecosystem during 2008-2015: Case of Lamto in Cote d’Ivoire. Atmospheric Clim. Sci. 2020, 10, 186–205. [Google Scholar] [CrossRef]
- Tiemoko, T.D.; Ramonet, M.; Yoroba, F.; Kouassi, K.B.; Kouadio, K.; Kazan, V.; Kaiser, C.; Truong, F.; Vuillemin, C.; Delmotte, M.; et al. Analysis of the Temporal Variability of CO2, CH4 and CO Concentrations at Lamto, West Africa. Tellus B Chem. Phys. Meteorol. 2021, 73, 1863707. [Google Scholar] [CrossRef]
- Statheropoulos, M.; Vassiliadis, N.; Pappa, A. Principal Component and Canonical Correlation Analysis for Examining Air Pollution and Meteorological Data. Atmos. Environ. 1998, 32, 1087–1095. [Google Scholar] [CrossRef]
- Manoli, E.; Voutsa, D.; Samara, C. Chemical Characterization and Source Identification/Apportionment of Fine and Coarse Air Particles in Thessaloniki, Greece. Atmos. Environ. 2002, 36, 949–961. [Google Scholar] [CrossRef]
- Donnelly, A.; Misstear, B.; Broderick, B. Application of Nonparametric Regression Methods to Study the Relationship between NO2 Concentrations and Local Wind Direction and Speed at Background Sites. Sci. Total Environ. 2011, 409, 1134–1144. [Google Scholar] [CrossRef]
- Malby, A.R.; Whyatt, J.D.; Timmis, R.J. Conditional Extraction of Air-Pollutant Source Signals from Air-Quality Monitoring. Atmos. Environ. 2013, 74, 112–122. [Google Scholar] [CrossRef]
- Petit, J.-E.; Favez, O.; Albinet, A.; Canonaco, F. A User-Friendly Tool for Comprehensive Evaluation of the Geographical Origins of Atmospheric Pollution: Wind and Trajectory Analyses. Environ. Model. Softw. 2017, 88, 183–187. [Google Scholar] [CrossRef]
- Henne, S.; Klausen, J.; Junkermann, W.; Kariuki, J.M.; Aseyo, J.O.; Buchmann, B. Representativeness and Climatology of Carbon Monoxide and Ozone at the Global GAW Station Mt. Kenya in Equatorial Africa. Atmospheric Chem. Phys. 2008, 8, 3119–3139. [Google Scholar] [CrossRef]
- Ncipha, X.G.; Sivakumar, V.; Malahlela, O.E. The Influence of Meteorology and Air Transport on CO2 Atmospheric Distribution over South Africa. Atmosphere 2020, 11, 287. [Google Scholar] [CrossRef]
- Tiemoko, D.T.; Yoroba, F.; Paris, J.-D.; Diawara, A.; Berchet, A.; Pison, I.; Riandet, A.; Ramonet, M. Source–Receptor Relationships and Cluster Analysis of CO2, CH4, and CO Concentrations in West Africa: The Case of Lamto in Côte d’Ivoire. Atmosphere 2020, 11, 903. [Google Scholar] [CrossRef]
- Rosa, L.P.; Schaeffer, R. Greenhouse Gas Emissions from Hydroelectric Reservoirs. Ambio 1994, 23, 164–165. [Google Scholar]
- Galy-Lacaux, C.; Delmas, R.; Kouadio, G.; Richard, S.; Gosse, P. Long-Term Greenhouse Gas Emissions from Hydroelectric Reservoirs in Tropical Forest Regions. Glob. Biogeochem. Cycles 1999, 13, 503–517. [Google Scholar] [CrossRef]
- Galy-Lacaux, C.; Delmas, R.; Jamber, C.; Dumestre, J.-F.; Labroue, L.; Richard, S.; Gosse, P. Gaseous Emissions and Oxygen Consumption in Hydroelectric Dams: A Case Study in French Guiana. Glob. Biogeochem. Cycles. 1997, 11, 471–183. [Google Scholar] [CrossRef]
- Delmas, R.; Galy-Lacaux, C.; Richard, S. Emissions of Greenhouse Gases from the Tropical Hydroelectric Reservoir of Petit Saut (French Guiana) Compared with Emissions from Thermal Alternatives. Glob. Biogeochem. Cycles 2001, 15, 993–1003. [Google Scholar] [CrossRef]
- Carslaw, D.; Beevers, S.; Ropkins, K.; Bell, M. Detecting and Quantifying Aircraft and Other On-Airport Contributions to Ambient Nitrogen Oxides in the Vicinity of a Large International Airport. Atmos. Environ. 2006, 40, 5424–5434. [Google Scholar] [CrossRef]
- Uria-Tellaetxe, I.; Carslaw, D.C. Conditional Bivariate Probability Function for Source Identification. Environ. Model. Softw. 2014, 59, 1–9. [Google Scholar] [CrossRef]
- Carslaw, D.C.; Ropkins, K. Openair—An R Package for Air Quality Data Analysis. Environ. Model. Softw. 2012, 27–28, 52–61. [Google Scholar] [CrossRef]
- Szulecka, A.; Oleniacz, R.; Rzeszutek, M. Functionality of Openair Package in Air Pollution Assessment and Modeling—A Case Study of Krakow. Ochr. Srodowiska Zasobów Nat. 2017, 28, 22–27. [Google Scholar] [CrossRef]
- Boon, A.; Broquet, G.; Clifford, D.J.; Chevallier, F.; Butterfield, D.M.; Pison, I.; Ramonet, M.; Paris, J.D.; Ciais, P. Analysis of the Potential of near Ground Measurements of CO2 and CH4 in London, UK for the Monitoring of City-Scale Emissions Using an Atmospheric Transport Model. Atmos. Chem. Phys. 2016, 16, 6735–6756. [Google Scholar] [CrossRef]
- Buchholz, R.R.; Paton-Walsh, C.; Griffith, D.W.T.; Kubistin, D.; Caldow, C.; Fisher, J.A.; Deutscher, N.M.; Kettlewell, G.; Riggenbach, M.; Macatangay, R.; et al. Source and Meteorological Influences on Air Quality (CO, CH4 & CO2) at a Southern Hemisphere Urban Site. Atmos. Environ. 2016, 126, 274–289. [Google Scholar] [CrossRef]
- Bae, M.-S.; Schwab, J.J.; Chen, W.-N.; Lin, C.-Y.; Rattigan, O.V.; Demerjian, K.L. Identifying Pollutant Source Directions Using Multiple Analysis Methods at a Rural Location in New York. Atmos. Environ. 2011, 45, 2531–2540. [Google Scholar] [CrossRef]
- Munir, S.; Habeebullah, T.M.; Mohammed, A.M.F.; Morsy, E.A.; Rehan, M.; Ali, K. Analysing PM2.5 and Its Association with PM10 and Meteorology in the Arid Climate of Makkah, Saudi Arabia. Aerosol Air Qual. Res. 2017, 17, 453–464. [Google Scholar] [CrossRef]
- GIEC Changement Climatique 2014: Rapport De Synthèse. Contribution Des Groupes De Travail I, II Et III au Cinquième Rapport D’évaluation du Groupe D’experts Intergouvernemental Sur L’évolution du Climat [Sous la Direction De L’équipe De Rédaction Principale (R.K. Pachauri, L.A. Meyer, eds.).; Genève, Suisse, 2014; p. 161.
- Diawara, A.; Yoroba, F.; Kouadio, K.Y.; Kouassi, K.B.; Assamoi, E.M.; Diedhiou, A.; Assamoi, P. Climate Variability in the Sudano-Guinean Transition Area and Its Impact on Vegetation: The Case of the Lamto Region in Côte D’Ivoire. Adv. Meteorol. 2014, 2014, 1–11. [Google Scholar] [CrossRef]
- Devineau, J.-L. Etude quantitative des forêts-galeries de Lamto (Moyenne Côte d’Ivoire). Thesis, Université Pierre et Marie Curie-Paris VI., Paris, France, 1975.
- 28. Louvet Modulations Intrasaisonnières de la Mousson d’Afrique de l’Ouest et Impacts sur les Vecteurs du Paludisme à Ndiop (Sénégal): Diagnostics et prévisibilité. Ph.D Thesis, Université de Bourgogne, Bourgogne, France, 2008.
- Nacro, H.B. Le Feu de Brousse, Un Facteur de Reproduction Des Écosystèmes de Savanes à Dominance Herbacées à Lamto (Côte d’Ivoire). Rev CAMES-Sér A. 2003, 2, 49–54. [Google Scholar]
- Carslaw, D.C.; Ropkins, K. Openair—An R Package for Air Quality Data Analysis. Environ. Model. Softw. 2012, 27–28, 52–61. [Google Scholar] [CrossRef]
- Carslaw, D.C.; Beevers, S.D. Characterising and Understanding Emission Sources Using Bivariate Polar Plots and K-Means Clustering. Environ. Model. Softw. 2013, 40, 325–329. [Google Scholar] [CrossRef]
- Ashbaugh, L.L.; Malm, W.C.; Sadeh, W.Z. A Residence Time Probability Analysis of Sulfur Concentrations at Grand Canyon National Park. Atmospheric Environ. 1967 1985, 19, 1263–1270. [Google Scholar] [CrossRef]
- Tong, L.; Zhang, J.; Xiao, H.; Cai, Q.; Huang, Z.; Zhang, H.; Zheng, J.; He, M.; Peng, C.; Feng, J.; et al. Identification of the Potential Regions Contributing to Ozone at a Coastal Site of Eastern China with Air Mass Typology. Atmospheric Pollut. Res. 2017, 8, 1044–1057. [Google Scholar] [CrossRef]
- Zhou, S.; Davy, P.K.; Huang, M.; Duan, J.; Wang, X.; Fan, Q.; Chang, M.; Liu, Y.; Chen, W.; Xie, S.; et al. High-Resolution Sampling and Analysis of Ambient Particulate Matter in the Pearl River Delta Region of Southern China: Source Apportionment and Health Risk Implications. Atmospheric Chem. Phys. 2018, 18, 2049–2064. [Google Scholar] [CrossRef]
- Vellingiri, K.; Kim, K.-H.; Lim, J.-M.; Lee, J.-H.; Ma, C.-J.; Jeon, B.-H.; Sohn, J.-R.; Kumar, P.; Kang, C.-H. Identification of Nitrogen Dioxide and Ozone Source Regions for an Urban Area in Korea Using Back Trajectory Analysis. Atmospheric Res. 2016, 176–177, 212–221. [Google Scholar] [CrossRef]
- Rodríguez, S.; Alastuey, A.; Alonso-Pérez, S.; Querol, X.; Cuevas, E.; Abreu-Afonso, J.; Viana, M.; Pérez, N.; Pandolfi, M.; De La Rosa, J. Transport of Desert Dust Mixed with North African Industrial Pollutants in the Subtropical Saharan Air Layer. Atmospheric Chem. Phys. 2011, 11, 6663–6685. [Google Scholar] [CrossRef]
- Touré, N.E.; Konaré, A.; Silué, S. Intercontinental Transport and Climatic Impact of Saharan and Sahelian Dust. Adv. Meteorol. 2012, 2012, 1–14. [Google Scholar] [CrossRef]
- Adler, B.; Babić, K.; Kalthoff, N.; Lohou, F.; Lothon, M.; Dione, C.; Pedruzo-Bagazgoitia, X.; Andersen, H. Nocturnal Low-Level Clouds in the Atmospheric Boundary Layer over Southern West Africa: An Observation-Based Analysis of Conditions and Processes. Atmospheric Chem. Phys. 2019, 19, 663–681. [Google Scholar] [CrossRef]
- De Souza Maria, L.; Rossi, F.S.; Costa, L.M.D.; Campos, M.O.; Blas, J.C.G.; Panosso, A.R.; Silva, J.L.D.; Silva Junior, C.A.D.; La Scala Jr, N. Spatiotemporal Analysis of Atmospheric XCH4 as Related to Fires in the Amazon Biome during 2015–2020. Remote Sens. Appl. Soc. Environ. 2023, 30, 100967. [Google Scholar] [CrossRef]
- Anderson, L.O.; Ribeiro Neto, G.; Cunha, A.P.; Fonseca, M.G.; Mendes De Moura, Y.; Dalagnol, R.; Wagner, F.H.; De Aragão, L.E.O.E.C. Vulnerability of Amazonian Forests to Repeated Droughts. Philos. Trans. R. Soc. B Biol. Sci. 2018, 373, 20170411. [Google Scholar] [CrossRef]
- Basso, L.S.; Marani, L.; Gatti, L.V.; Miller, J.B.; Gloor, M.; Melack, J.; Cassol, H.L.G.; Tejada, G.; Domingues, L.G.; Arai, E.; et al. Amazon Methane Budget Derived from Multi-Year Airborne Observations Highlights Regional Variations in Emissions. Commun. Earth Environ. 2021, 2, 246. [Google Scholar] [CrossRef]
- Nho, E.-Y.; Ardouin, B.; Le Cloarec, M.F.; Ramonet, M. Origins of 210Po in the Atmosphere at Lamto, Ivory Coast: Biomass Burning and Saharan Dusts. Atmos. Environ. 1996, 30, 3705–3714. [Google Scholar] [CrossRef]
- Capes, G.; Johnson, B.; McFiggans, G.; Williams, P.I.; Haywood, J.; Coe, H. Aging of Biomass Burning Aerosols over West Africa: Aircraft Measurements of Chemical Composition, Microphysical Properties, and Emission Ratios. J. Geophys. Res. 2008, 113, D00C15. [Google Scholar] [CrossRef]
- Morgan, L. Estimation des émissions de gaz à effet de serre à différentes échelles en France à l’aide d’observations de haute précision. Ph.D Thesis, Université Paris Sud-Paris XI, Paris, France, 2012. [Google Scholar]
- Gu, H.; Yu, Z.W.; Xu, D.W.; Huang, Y.; Zheng, L.; Ma, J. Seasonal Dynamics of Carbon Dioxide Concentration and Its Influencing Factors in Urban Park Green Spaces in Northeast China. Nat. Environ. Pollut. Technol. 2018, 17, 329–337. [Google Scholar]
- Pattinson, W.; Kingham, S.; Longley, I.; Salmond, J. Potential Pollution Exposure Reductions from Small-Distance Bicycle Lane Separations. J. Transp. Health 2017, 4, 40–52. [Google Scholar] [CrossRef]
- Sultan, B.; Janicot, S. La Variabilité Climatique En Afrique de l’Ouest Aux Échelles Saisonnière et Intra-Saisonnière. I: Mise En Place de La Mousson et Variabilité Intra-Saisonnière de La Convection. Sci. Chang. Planétaires Sécheresse 2004, 15, 321–330. [Google Scholar]
- Fu, X.W.; Zhang, H.; Lin, C.-J.; Feng, X.B.; Zhou, L.X.; Fang, S.X. Correlation Slopes of GEM / CO, GEM / CO2, and GEM / CH4 and Estimated Mercury Emissions in China, South Asia, the Indochinese Peninsula, and Central Asia Derived from Observations in Northwestern and Southwestern China. Atmospheric Chem. Phys. 2015, 15, 1013–1028. [Google Scholar] [CrossRef]
- Tohjima, Y.; Kubo, M.; Minejima, C.; Mukai, H.; Tanimoto, H.; Ganshin, A.; Maksyutov, S.; Katsumata, K.; Machida, T.; Kita, K. Temporal Changes in the Emissions of CH4 and CO from China Estimated from CH4/CO2 and CO/CO2 correlations Observed at Hateruma Island. Atmospheric Chem. Phys. 2014, 14, 1663–1677. [Google Scholar] [CrossRef]
- Canty, A.; Ripley, B. Boot: Bootstrap R (S-Plus) Functions. R Package Version 1.3-28.1. 2022.
- Bechara, J. Impact de la mousson sur la chimie photo oxydante en Afrique de l’Ouest Thèse de Doctorat, Université Paris-Est, Paris, France, 2009.
- Conway, T.J.; Steele, L.P.; Novelli, P.C. Correlations among Atmospheric CO2, CH4 and CO in the Arctic, March 1989. Atmospheric Environ. Part Gen. Top. 1993, 27, 2881–2894. [Google Scholar] [CrossRef]
- Steele, L.P.; Fraser, P.J.; Rasmussen, R.A.; Khalil, M.A.K.; Conway, T.J.; Crawford, A.J.; Gammon, R.H.; Masarie, K.A.; Thoning, K.W. The Global Distribution of Methane in the Troposphere. J. Atmospheric Chem. 1987, 5, 125–171. [Google Scholar] [CrossRef]
- Yoroba, F.; Diawara, A.; Kouadio, K.Y.; Schayes, G.; Assamoi, A.P.; Kouassi, K.B.; Kouassi, A.A.; Toualy, E. Analysis of the West African Rainfall Using a Regional Climate Model. Int. J. Environ. Sci. 2011, 1, 1339–1349. [Google Scholar]
- Van Der Werf, G.R.; Randerson, J.T.; Giglio, L.; Van Leeuwen, T.T.; Chen, Y.; Rogers, B.M.; Mu, M.; Van Marle, M.J.E.; Morton, D.C.; Collatz, G.J.; et al. Global Fire Emissions Estimates during 1997–2016. Earth Syst. Sci. Data. 2017, 9, 697–720. [Google Scholar] [CrossRef]
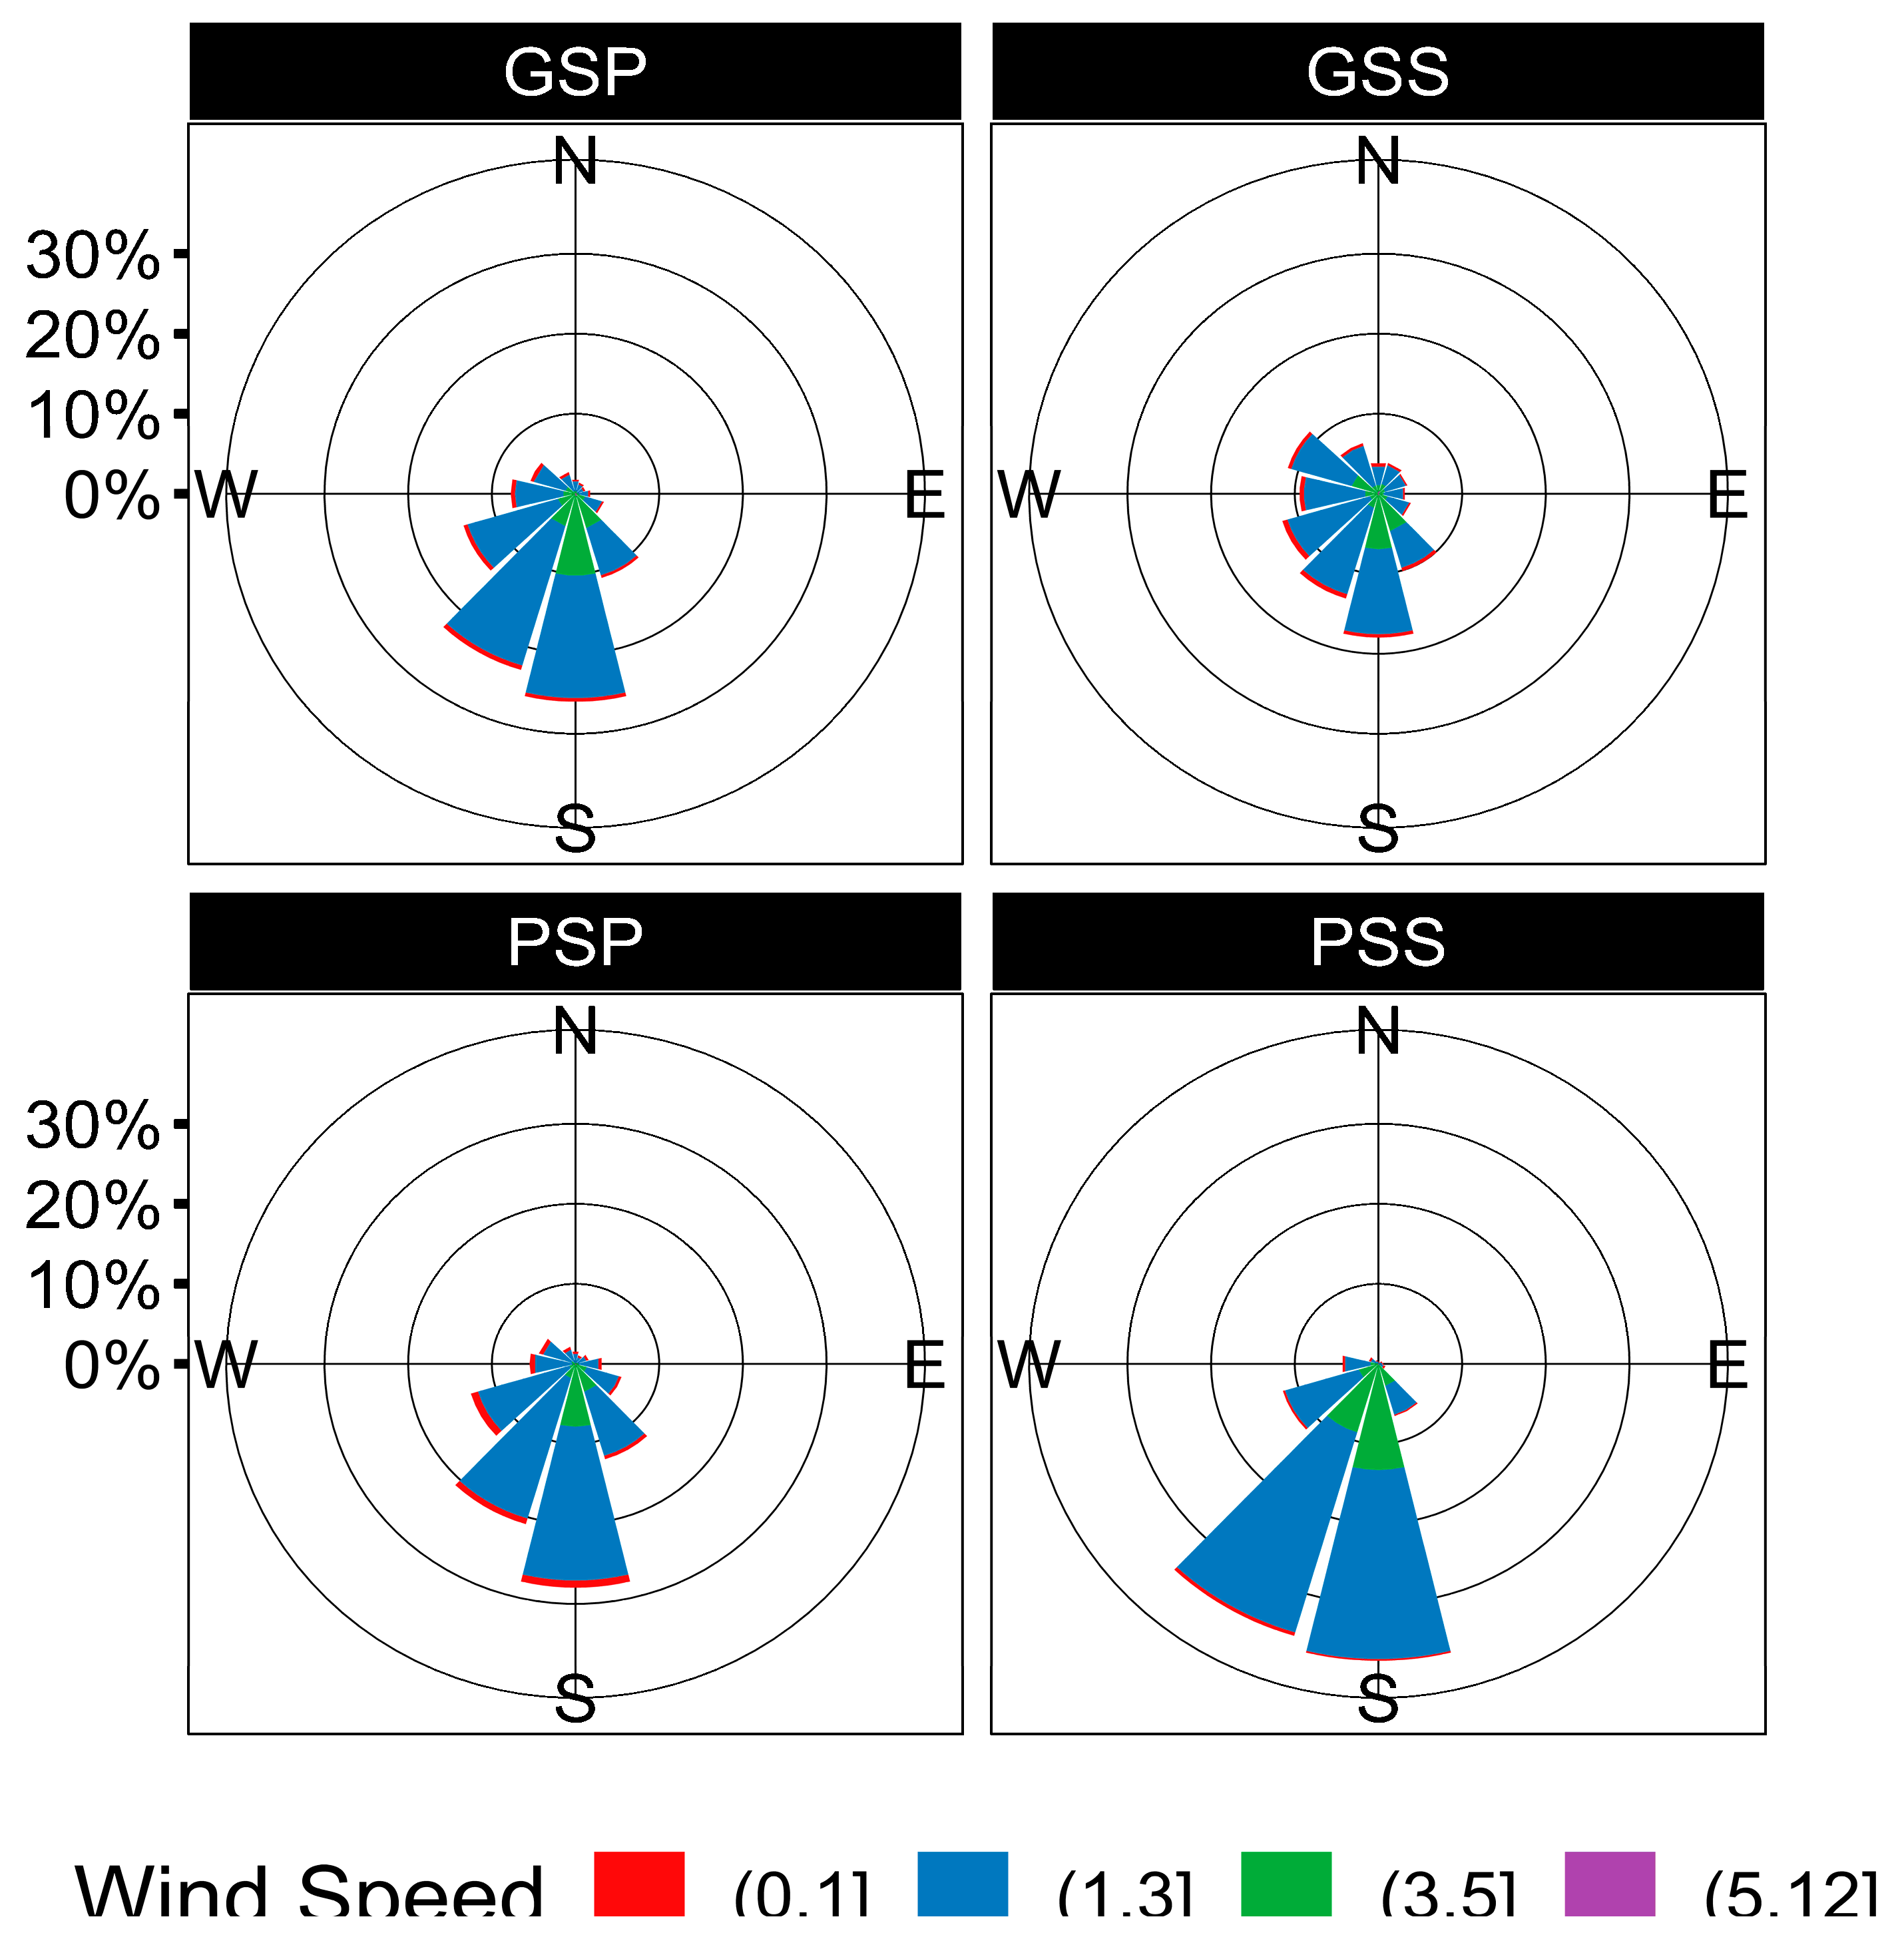
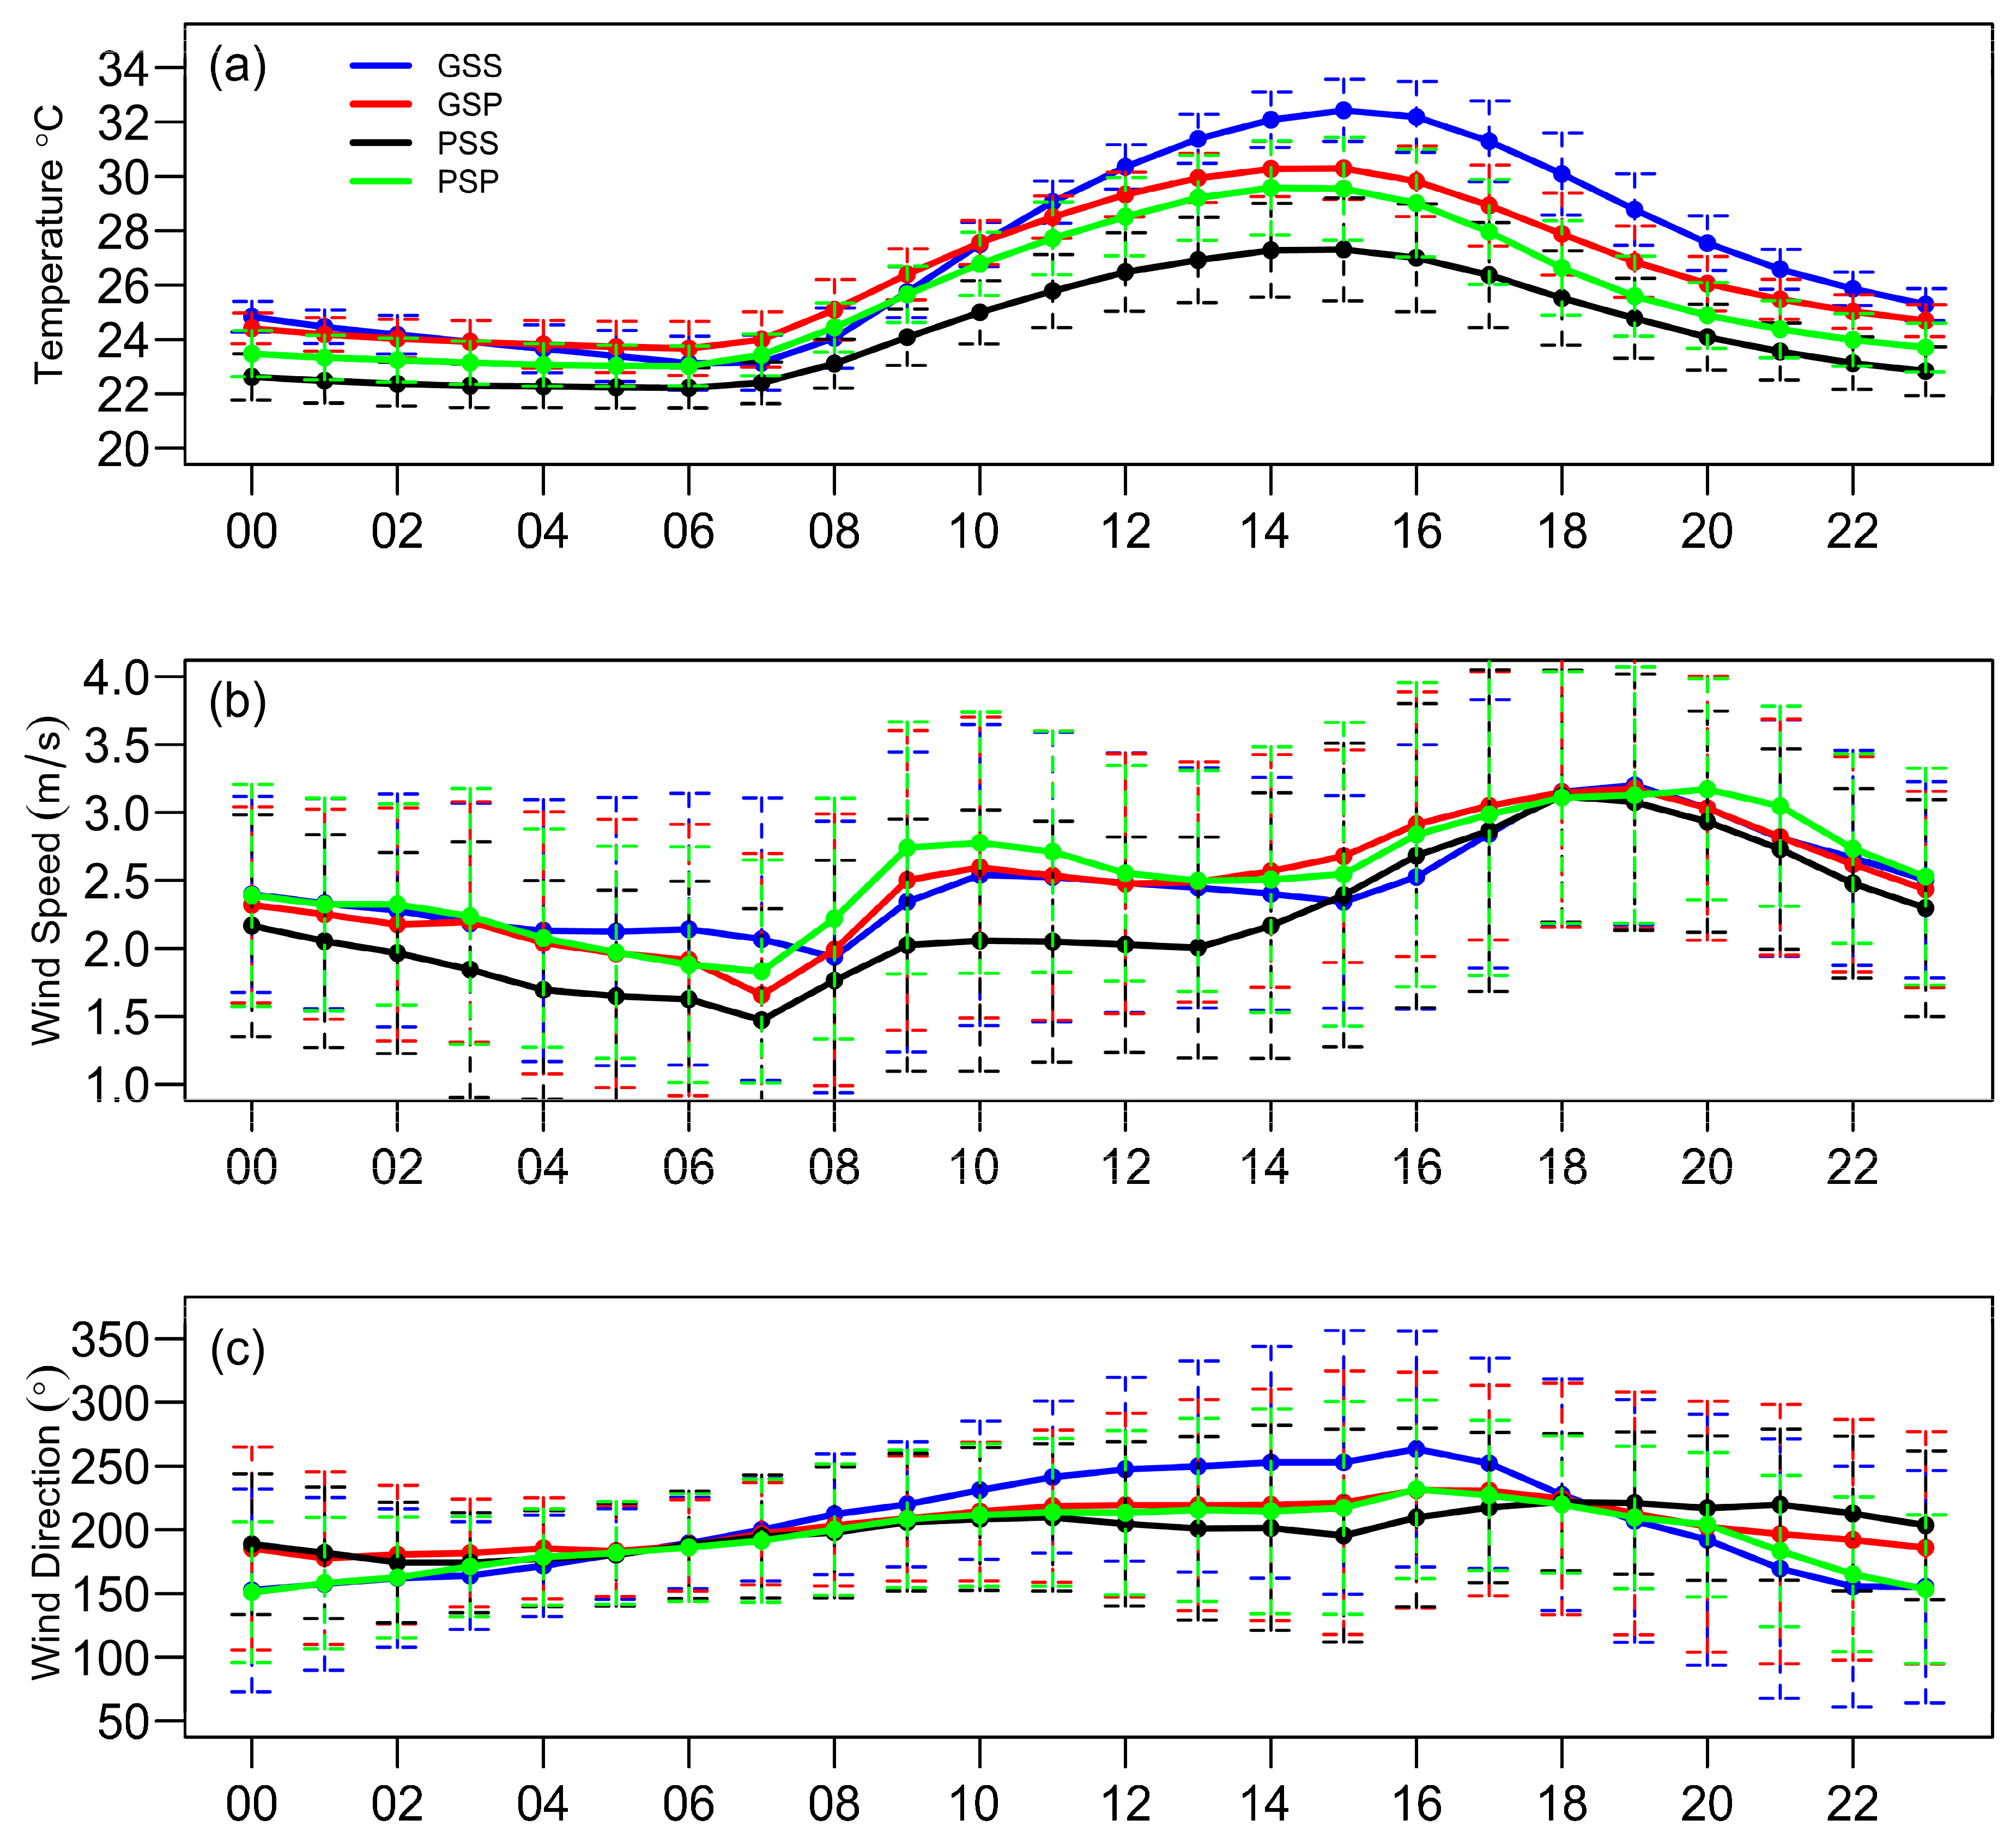
| Seasons | Wind Speed (m.s-1) | ||
|---|---|---|---|
| Average | Minimum | Maximum | |
| GSS | 2.48 | 0.21 | 10.84 |
| GSP | 2.49 | 0.15 | 11.15 |
| PSS | 2.55 | 0.26 | 9.36 |
| PSP | 2.21 | 0.23 | 8.35 |
| Seasons | Diurnal amplitude | |
|---|---|---|
| Temperature (°C) | Wind Speed (m.s-1) | |
| GSS | 9.30 | 1.26 |
| GSP | 6.63 | 1.52 |
| PSS | 5.09 | 1.65 |
| PSP | 6.55 | 1.34 |
Disclaimer/Publisher’s Note: The statements, opinions and data contained in all publications are solely those of the individual author(s) and contributor(s) and not of MDPI and/or the editor(s). MDPI and/or the editor(s) disclaim responsibility for any injury to people or property resulting from any ideas, methods, instructions or products referred to in the content. |
© 2023 by the authors. Licensee MDPI, Basel, Switzerland. This article is an open access article distributed under the terms and conditions of the Creative Commons Attribution (CC BY) license (http://creativecommons.org/licenses/by/4.0/).


