Preprint
Article

Bacterial Isolated from Oreochromis niloticus and Possible Use as Probiotic

Altmetrics

Downloads

153

Views

111

Comments

0

Submitted:

01 September 2023

Posted:

04 September 2023

You are already at the latest version

Alerts
Abstract
The aim of this paper was to test isolated and pre-selected bacteria strains from Nile tilapia intestinal mucus, collected in Brazilian commercial fish farming, to use as probiotics in the feeding. The variable were growth performance, hematology, microbiology and immunology. These strains were submitted to in vitro inhibition tests of pathogenic bacteria. Then, they were identified by PCR and sequencing, and comparing using the BLAST software. The experiment was carried out in the Fisheries Institute, Sao Paulo, Brazil, for 84 days, following the randomized experiment design with seven treatments and three replicates (21 experimental units): T0 – control, T1 – Bacillus velezensis, T2 – Bacillus pumilus, T3 – Bacillus subtilis, T4 –Enterococcus hirae T5 – Enterococcus faecium and T6 – mix of bacteria strains used to this experiment. The variables analyzed were: growth performance, DGGE (Denaturing gradient gel electrophoresis), phagocytes respiratory burst activity, hematology and bromatology. As result, the bacteria strains B. pumilus (T2) and all bacteria mix (T6), included in Nile tilapia diet, promoted better biomass values, with similar feed conversion rate of control group (p<0,05). Apparently, the microorganisms use does not affect the health and well-fare of the fish. The hematology index, except basophils and thrombocytes numbers do not demonstrated differences among the groups, as well as glycemia, lactate level, respiratory burst and lysozyme activities. In conclusion, the isolated and pre-selected bacteria from intestinal mucus of Nile tilapia, B. pumilus (T2) and mix (T6 - B. velezensis, B. pumilus, B. subtilis, E. hirae and E. faecium) improve the growth performance and may be used as probiotics for Nile tilapia.
Keywords: 
Subject: Biology and Life Sciences  -   Aquatic Science

1. Introduction

Nile tilapia (Oreochromis niloticus) produced in Brazil reached 550,060 tons in 2022, that corresponding to 63.93% of the total volume of fish. The performance of tilapia was the best among all farmed fish species. Production grew 3% in relation to the previous year (534,005 tons) [1], being a species of great national importance. This species has ability to adapt to various types of intensive breeding systems [2], by converting foodstuffs, such as algae and detritus (filter-feeders). into high quality protein [2,3].
In intensive production systems, the ability to maintain animal health involves planning and generating appropriate protocols to reduce or eliminate the fish exposure to hazards that may impair productivity and animal welfare. The excessive and continuous medications use are flaws demonstrate in the management and production system [4].
For El-Saadony et al. [5] probiotics are live beneficial bacteria introduced into the gastrointestinal tract through food or water, promoting good health by enhancing the internal microbial balance. The probiotics use can be a viable alternative for avoid stress and pathogens, and promoting improved animals zootechnical performance [6].
Commercial probiotics, developed for other non-aquatic species, have shown low efficiency when tested in farmed fish relative to zootechnical productive performance. However, in experiments conducted by Dias et al. [7}, these additives provided improvement in the immune system and optimized reproductive rates (mature female rate, fecundity and surviving larval rate) in fish “matrinxã” (Brycon amazonicus).
Another commercial probiotics problem is the introduction of exotic bacteria strains into aquatic environments. These bacteria from animals or terrestrial environments are different from the aquatic one, it can justify this research with probiotic bacteria isolate from fish to be used with fish [8,9,10].
Autochthonous probiotic origin can be more competitive with resident microorganisms. However, these microorganisms must be compatible with industrial processes required for commercial production, remain viable during storage, and be active to promote beneficial effects [11,12].
The beneficial probiotics effects are inhibitory substances production, competition for adhesion sites and facilitating nutrients absorption that cause hostile environments to pathogens [13]. In morphological terms, studies have demonstrated the efficacy of different probiotics in the intestine, promoting an increase in the defense cells number [14,15], increasing and preserving the intestinal villi integrity [15,16,17,18].
Therefore, it is important to test new probiotic potential bacteria strains, pre-selected from Nile tilapia collected from different regions of Brazil, to evaluate their ability to improve the zootechnical performance and fish immunity.
This work aimed to study the potential of bacterial isolated from Nile tilapia intestinal mucus with possible use as probiotics and evaluate the fish zootechnical performance, hematology and immunological parameters on feeding.

2. Materials and Methods

2.1. Ethical Statement

The procedures have been authorized by the Animal Ethics Committee for Experiments by Fisheries Institute (number 02/2015). Experiment had proceeded in Pirassununga, SP, Brazil (NRP/Aquaculture Research and Development Centre/Fisheries Institute/APTA/SAA) above norms and recommendations of Resolution n.592 of June 1992, of the Federal Council of Veterinary Medicine, and precepts of Ethical Principles of Animal Experimentation.

2.2. Potential probiotic bacteria identification

Healthy tilapia (no previous treatment with antimicrobials or chemicals) n=75, weighting 2.71+0.53g, were collected from fish farms of the Northeast, Southeast and South Brazil regions. Animals were euthanized by eugenol anesthetic overdose (100 mg L−1), asepsis performed with 70% alcohol, and necropsied. Intestines were aseptically removed, incised, and washed with sterile saline solution (0.9% NaCl). Two serial dilutions 1:10 were done with intestine and skin mucus washed, and platted in TSB (tryptic soy broth) with 0.75% agar plates. Plates were incubated for 48 hours at 35oC. After incubation, colonies were removed with an aqueous solution containing maltodextrin, and lyophilized for 48 hours. Bacterial DNA was extracted using GenElute Bacterial Genomic DNA kit (Sigma Aldrich) and PCR was performed with 16S rDNA primers fD1 (5’ – AGAGTTTGATCCTGGCTCAG – 3’) e rP1 (5’ – ACGGTTACCTTGTTACGACTT – 3’). For the Bacillus strains, gyrB gene was amplified with in-house designed primers gyrB-F (5'- GTNYAYCGTGAYGGNAAAATYCA -3') and gyrB-R (5'- GCAGARTCWCCCTCTACRATATA -3'. Sequences were compared with those of type strains deposited in the GenBank, using BLASTn.

2.3. Experimental Diets

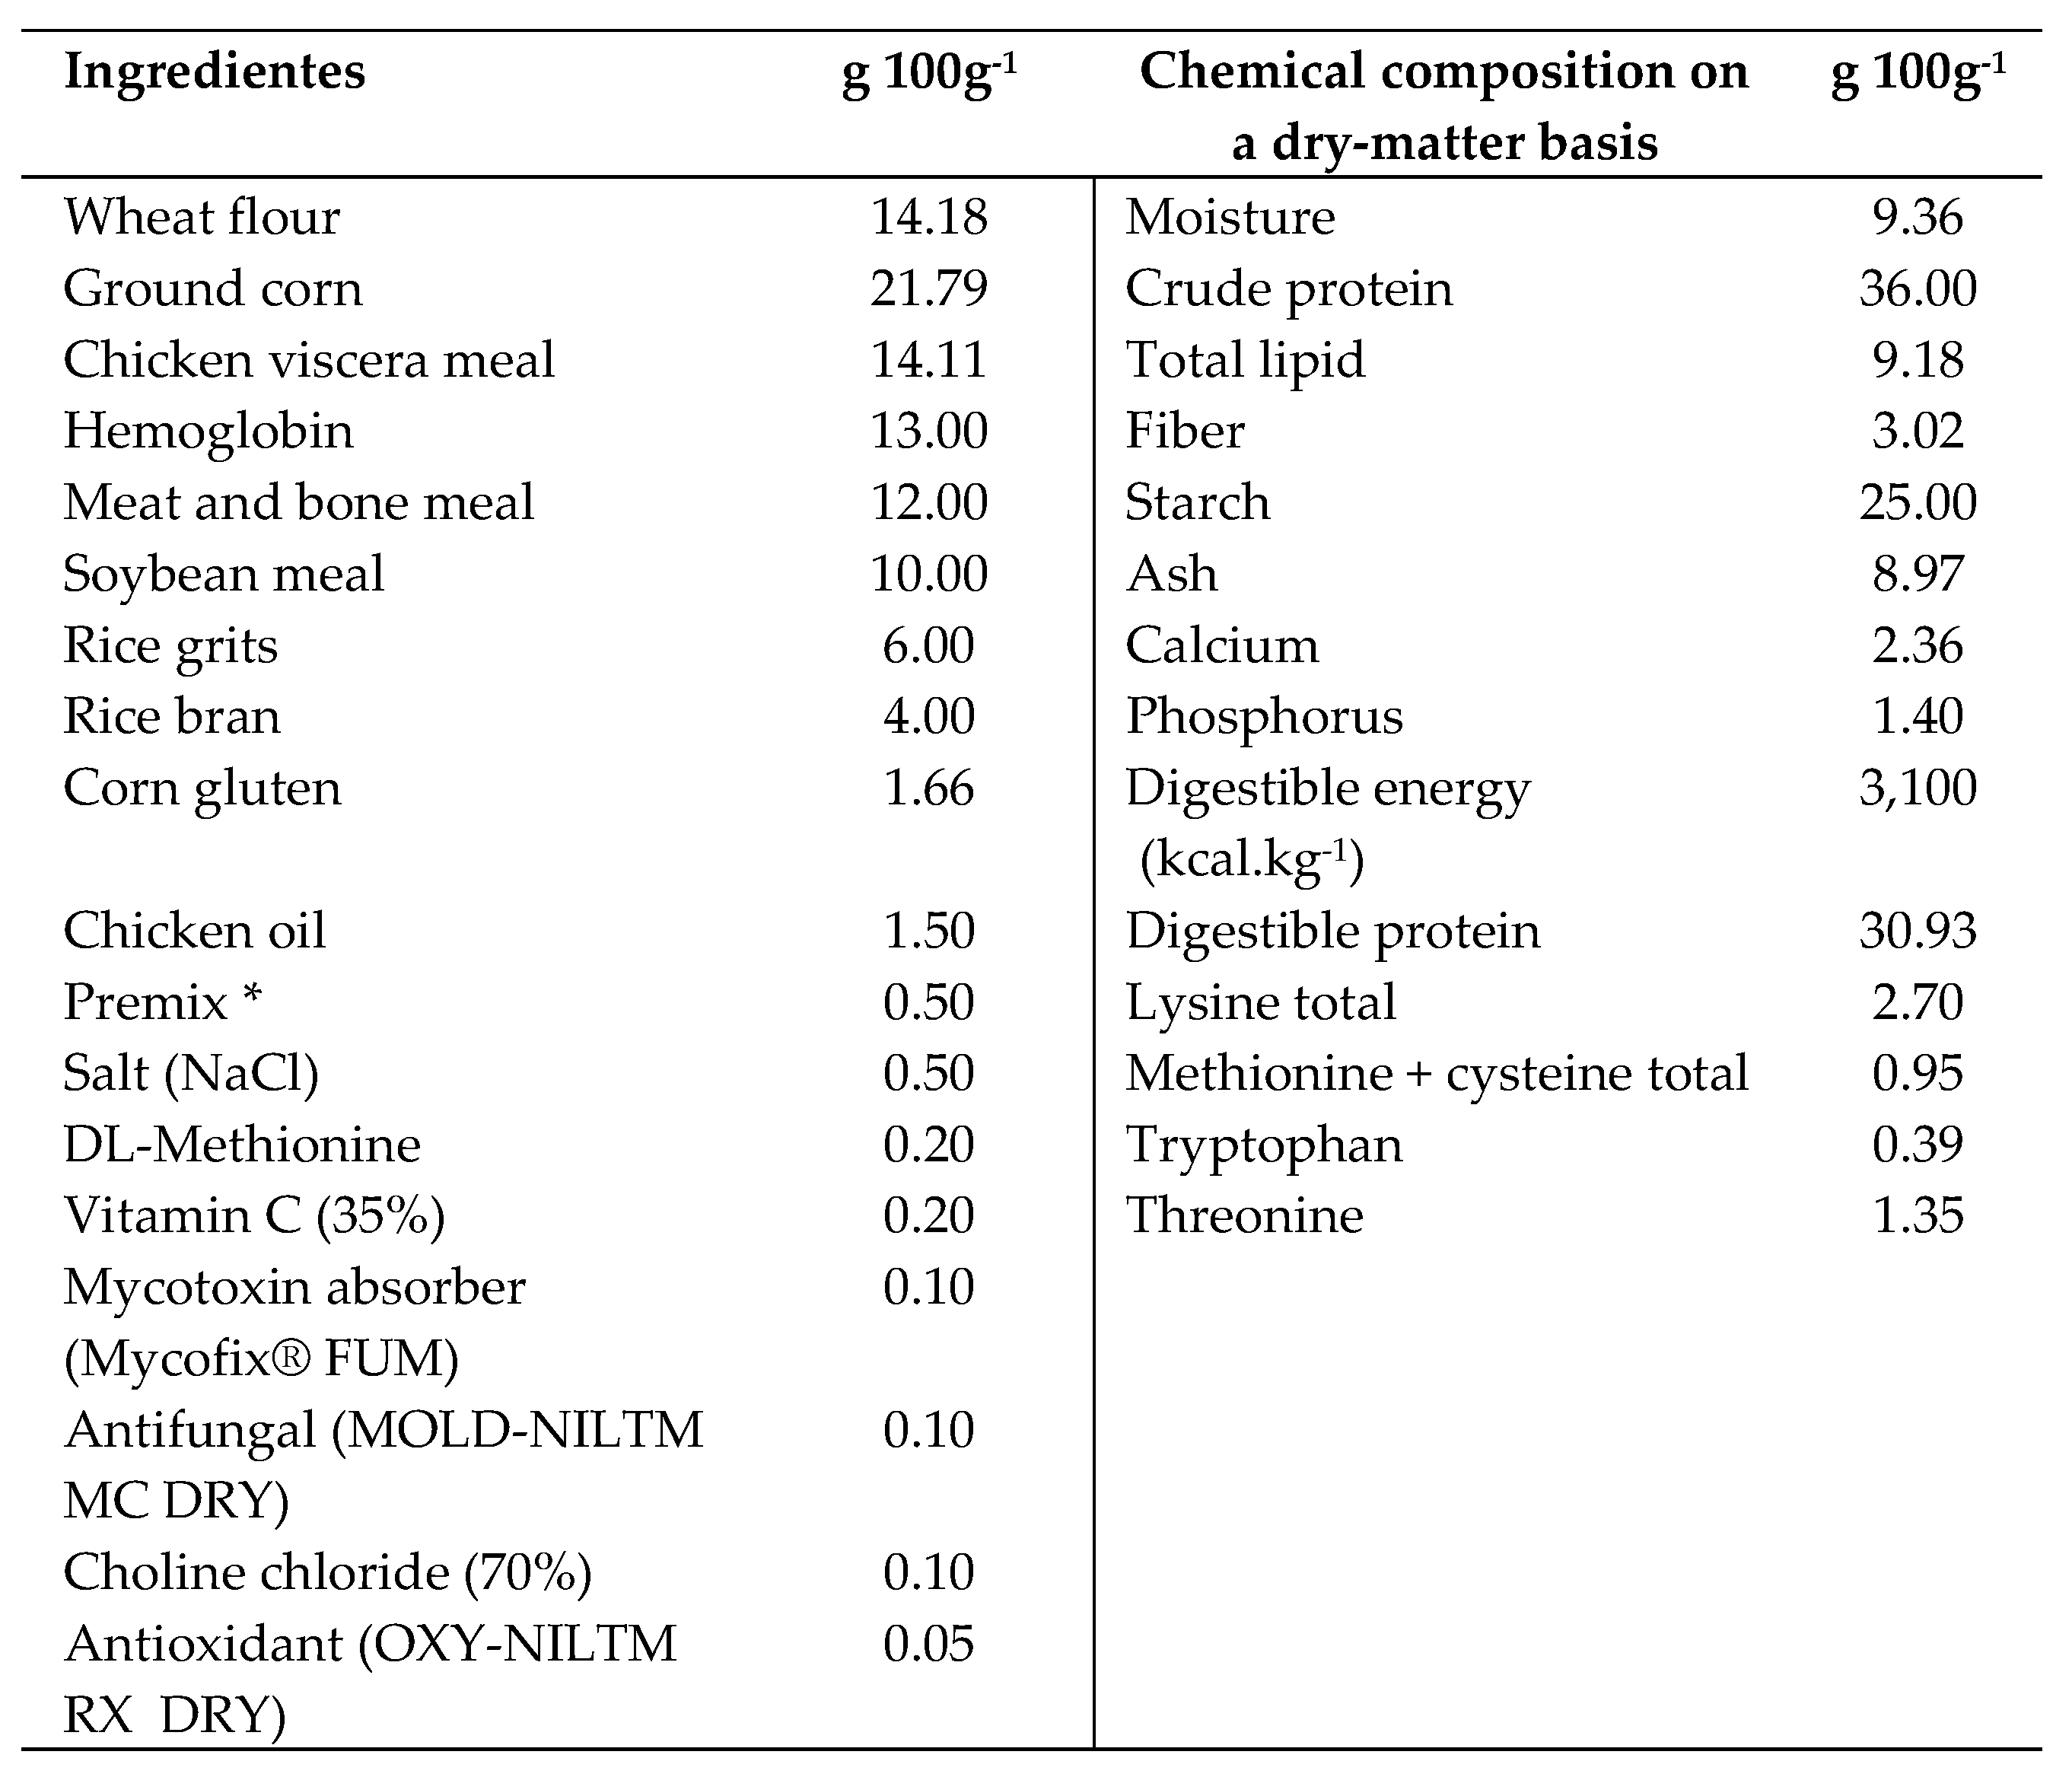
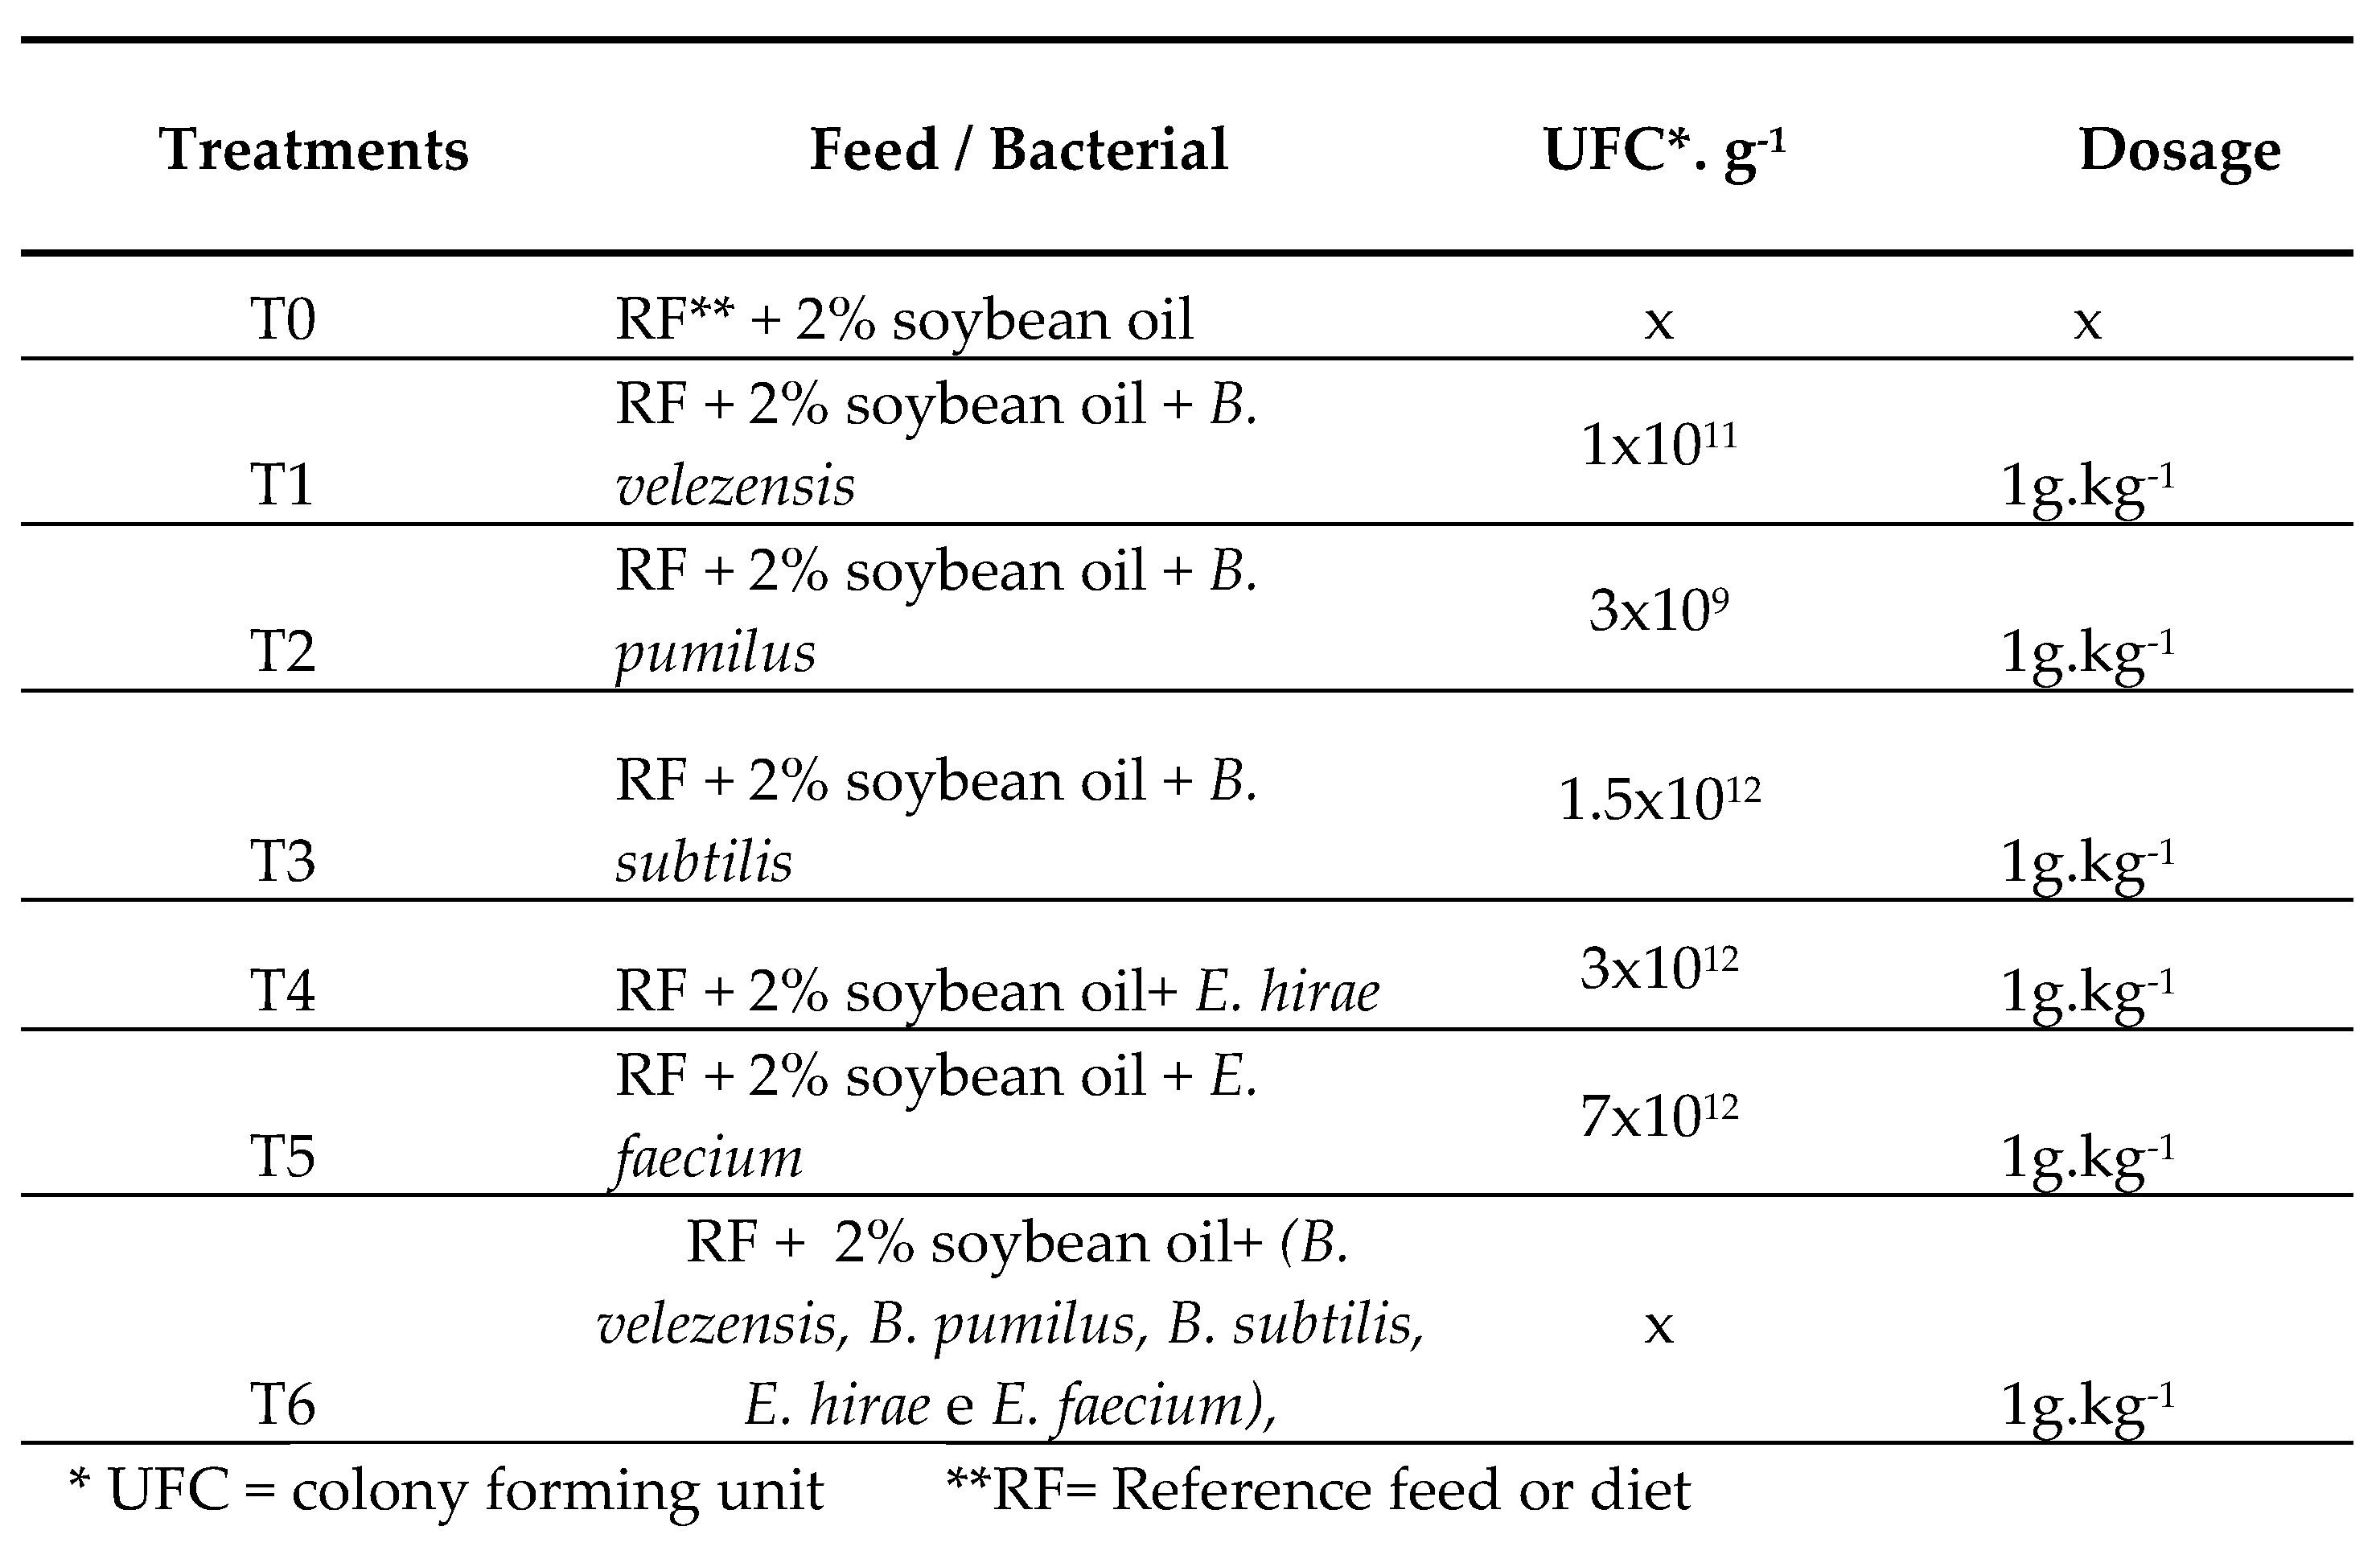
A total of seven diets were prepared, including a control diet containing reference feed (RF) (Table 1) formulated with 36% crude protein (CP), 3,100 kcal.kg−1 digestible energy (ED) and 30.93% digestible protein. In another six diets was added each different bacterial [12] showed in Table 2. The treatments were T0=control (RF more soybean oil), T1=RF plus Bacillus velezensis, T2=RF plus B. pumilus, T3= RF plus B. subtilis, T4= RF plus Enterococcus hirae, T5= RF plus E. faecium, T6= RF and mix of bacterial (B. velezensis, B. pumilus, B. subtilis, E. hirae e E. faecium).
The bacteria unit formation count (UFC) added into RF in the diet are demonstrated at Table 2. Thus, the bacteria (T1-T6) were mixed with soybean oil (2% of feed weight) to form a uniform mixture with probiotic and sprayed on the RF. The experimental diets were stored at 4°C and the fish were fed three times a day ad libitum for 84 days.

2.4. Experimental Design and Fish

The fish were kept in tanks at Pirassununga Regional Research Center, where the experiment was conducted. The fish were weighed and measured. The experiment was conducted with 1,680 tilapias with an average weight of 2.71g ± 0.53 and length of 5.66 cm ± 0.35. A total of 80 fish were stocked in 21 cages with a volume of 0.7 m3 (1.0 × 1.0 x 1.0 m) each. The cages were made of polyamide wire covered with PVC and 5.0 mm mesh. The cages were installed in a 200 m2 and 1.20 m depth excavated pond, with an earthen bottom, concrete walls and with 5% water exchange per day. The cages aeration and water renewal system were composed of a water pump (1.0 hp) and PVC pipes with holes (2.0mm diameter) above each cage.
The experimental design was total randomized with seven treatments and three replicates. During the feeding period, fish were fed twice daily (8:30 am and 16:00 pm) and the water temperature (oC), dissolved oxygen (mg L−1), pH and ammonia (Kit LabconTM) (mg L−1) were measuring, every week, until 84 days.

2.5. Zootechnical performance

During the experimental period, the zootechnical performance variables were evaluated by biometry every 21 days until 84 days. The following variables were calculated: weight gain GP = [(final weight) - (initial weight)]; survival S = [(100 x number of final animals)/number of initial animals]; apparent feed conversion AAC= [(feed consumption)/(weight gain)]; specific growth rate: SGR = {100 x [(ln final weight - ln initial weight)/period]}; protein efficiency ratio: TEP=GP/(daily consumption (DC) x% PB of diet) and total biomass= total weight of fish.

2.6. Microbiology and Denaturant gradient gel electrophoresis (DGGE).

Eight fish from each treatment were anesthetized with eugenol (100 mg L−1) and killed until deep sedation. Alcohol 70° was sprayed on surface for decontamination, and the midgut was collected, stored in 2.0 mL cryotubes, and preserved in liquid nitrogen. In the laboratory, the intestines were stored at -80°C.
Total DNA from Nile tilapia intestinal mucus (n=8) were extracted according to Trisure kit (Bioline, Spain) and purified by precipitation with sodium acetate (20 µL of DNA was precipitated with 2 µL of 3 M sodium acetate and 46 µL of isopropanol). The DNA was centrifuged for 3 min at 12,000 g, at 4 °C. The supernatants were discarded, and the pellets were washed with 70% ethanol and centrifuged for 15 min at 12,000 g, 4 °C. The supernatants were discarded again, and the DNA pellets were resuspended in water. DNA quality and integrity was checked by 1% agarose gel electrophoresis stained with GelRed Nucleic Acid Stain 20000x (InTRON Biotechnology, Seoul, Korea). The concentration and purity were determined using the Qubit 2.0 fluorometer (Thermo Fisher Scientific, Germany). DNA was stored at -20 °C and used for subsequent analyses.
DNA was amplified, using the 16S rDNA bacterial domain-specific primers 677R-GC (5'CGGGGCGGGGGCACGGGGGGATMTCTACGCATTTCACCGTAC-3') and 309-F (5'ACTCCTACGGGAGGCWGCAG-3') and submitted to equipment Real-time qPCR using the dye SYBR GREEN (Applied Biosystems). Amplification was performed in a 96-well plate of 20µL volume containing 2µL of sample and 8 µL of PCR solution (2µL purified water, 10µL of 2xSYBR Green supermix, 4µL of bacteria-specific primer). The PCR products obtained were separated by DGGE using a Dcode TM system (Bio-Rad Laboratories, Hercules, CA, USA). Electrophoresis was performed in 8% polyacrylamide gel (37.5:1 acrylamide-bisacrylamide; with 18 cm x 18 cm x 0.01 cm dimension). The gel containing a denaturing gradient of 30 to 55% urea and formamide towards electrophoresis. The 100% denaturant solution was prepared with 7M urea and 40% v/v deionized formamide. A total of 4 μL of PCR product and 2 μL of race buffer were applied to the gel wells and subjected to electrophoresis for 16 h at 85V in 0.5X TAE buffer (20mM Tris base, 10mM acetic acid, 0.5mM EDTA [pH 8.0]) at 60°C constant temperature. The markers used were 1kb and 100 bp DNA ladder.
The gels were submitted to the photodocumentator (BioRad) for image analysis. Bands were cut out of the gel and sent for sequencing and identification. Libraries were constructed by Chunlab, Inc (Seoul, South Korea) using the ilumina MiSeq platform. Briefly, sequencing of base pairs from each sample was performed using primers 341F CCTACGGGNGGCWGCAG and 805R GACTACHVGGGTATCTAATCC (ChunLab), for targeting the V3-V4 regions of the 16S rRNA gene.
A similarity matrix of densitometric curves of the band patterns was calculated using Pearson's similarity coefficient, which considers the location of the bands and their intensities. Clustering of the DGGE band patterns was represented by constructing a dendogram as the clustering algorithm, using the Unweighted Pair Groups Method using Arithmetic Averages (UPGMA). To verify which Operational Taxonomic Units (OTUs) were mainly responsible for the difference among the three samples groups, a SIMPER analysis was used, based on the relative values of the band intensities obtained by the DGGE gel image.
To analyze the banding patterns of the gels (DGGE), the following ecological parameters were calculated: 1. Shannon diversity index (H)- H = -ΣPi ln Pi where, Pi = ni/N, ni = number of copies of each species, N = total number of copies of all species [19; 20]. 2. species richness (R)- R = Σb where b = each of the bands present in the DGGE gel [19,20]. 3. Habitability (Rr) - Rr = N2 x Dg where, N= total number of bands in each column, Dg = denaturing gradient between the first and the last band in that column [21].

2.7. Hematological analyses

For the hematological analyses, at the end of the experiment, nine fish were collected from each treatment, anesthetized with eugenol (75 mg. L−1) and aliquots of blood were withdrawn by puncture of the tail vessel, with the aid of heparinized syringes, for the determination of: a) total cell count in a Neubauer chamber (RBC); b) differential and total leukocyte count (WBC) and thrombocyte count by the indirect method in blood extensions stained by May-Grünwald-Giemsa; c) hematocrit (Ht), by the microhematocrit method; d) hemoglobin rate (Hb), by the cyanometahemoglobin method and glucose, measured using a portable glucometer Accu-Chek® Performa. With the results of the hemoglobin (Hb) rate, hematocrit (Ht) and number of red blood cells (RBC), the hematimetric indexes were calculated: mean corpuscular volume (MCV), mean corpuscular hemoglobin (MCHC) and mean corpuscular hemoglobin concentration (MCHC) [22].

2.8. Lysozyme activity

At the end of the experiment, blood was drawn from nine fish per treatment, with a syringe without anticoagulant, and after centrifugation, aliquots of serum were taken for lysozyme analysis determined according to Kim & Austin [23] modified. For the determination of lysozyme activity, a Micrococcus solution was prepared [1 mg.mL−1 lyophilized Micrococcus lysodekticus in 0.05 M sodium phosphate buffer (pH = 6.3)]. The assay was performed in 96-well flat-bottomed microplates. To each well, 200 μL of Micrococcus solution and 10 L of serum was added. The plates were incubated at 20°C under shaking and the optical density was measured at 540 nm at times between 0 and 5 minutes. One unit of lysozyme was taken as the amount needed to reduce the absorbance by 0.001 min−1. The calculations were obtained using the equation: ∆ABS*1,000 min−1 mL−1 [24].

2.9. Phagocyte respiratory burst activity

After the 84 days of the experiment, blood was collected from nine fish per treatment for the phagocyte respiratory burst activity evaluation, by the nitroblue tetrazolium (NBT) test, following the method described by Aly et al. [8], modified. Fifth µL of blood and 50 µL of NBT (0.2%) were added to glass test tubes. The tubes were incubated for 30 minutes at room temperature. After this period, 1.0 mL of N, N-dimethylformamide (DMF) was added to each tube and then the tubes were centrifuged (3,000 g) for 5 minutes. The supernatant was transferred to cuvettes and the absorbance was determined in a spectrophotometer (620 nm).

2.10. Lactate test

The enzymatic lactate was determined by the enzymatic methodology - Trinder using a Labtest kit. The system uses the enzyme lactate oxidase to determine the concentration of lactate present in a sample.

2.11. Bromatological analysis

For the bromatological analysis, nine fish from each treatment were sent to the Food Technology Institute of the University of São Paulo - Pirassununga, to perform the body composition analyses. The collected samples were frozen, ground, homogenized and lyophilized for determination of ether extract (Soxhlet), crude protein (micro Kjeldahl - Nx6.25) and ash (muffle at 550°C for 12h) according to the methods proposed by AOAC [25].

2.11. Data analysis

The data were evaluated for normality (Shapiro-Wilk) and homoscedasticity of variances (Levene test), and after verification, the employed tests (parametric or non-parametric) were defined: analysis of variance (ANOVA) and Tukey, for parametric data; Kruskal-Wallis and Post Dunn Hoc, for non-parametric data; at a 5% significance level, through the Past software.

3. Results

3.1. Bacterial identification

Based on the 16S rDNA gene sequences, plus gyrB gene for Bacillus, the bacterial isolates were identified as Bacillus velezensis (T1), B. pumilus (T2), B. subtilis (T3), Enterococcus hirae (T4), and E. faecium (T5).

3.2. Water quality

Table 3 shows the water quality where the experiment was conducted during 84 days. These parameters showed that water quality was maintained according with limit established for the conservation of fish life [26].
According to the results of zootechnical performance (Table 4), the oral application of bacterial probiotics had a positive influence on total final biomass (Figure 1) in treatments T1 (B. velezensis), T2 (B. pumilus), T3 (B. subtilis) and T6 (mixture of all probiotics) providing higher means compared to the control. The apparent feed conversion (AAC) and protein efficiency ratio (PEE) of fish fed bacteria T2 (B. pumilus) and T6 (mixture of all bacteria) were similar with T0 (control). However, for the groups fed with treatments T1 (B. velezensis), T3 (B. subtilis), and T5 (E. faecium), these indices were lower. There were no significant differences for the other variables among the treatments.

3.3. Denaturing gradient gel electrophoresis (DGGE)

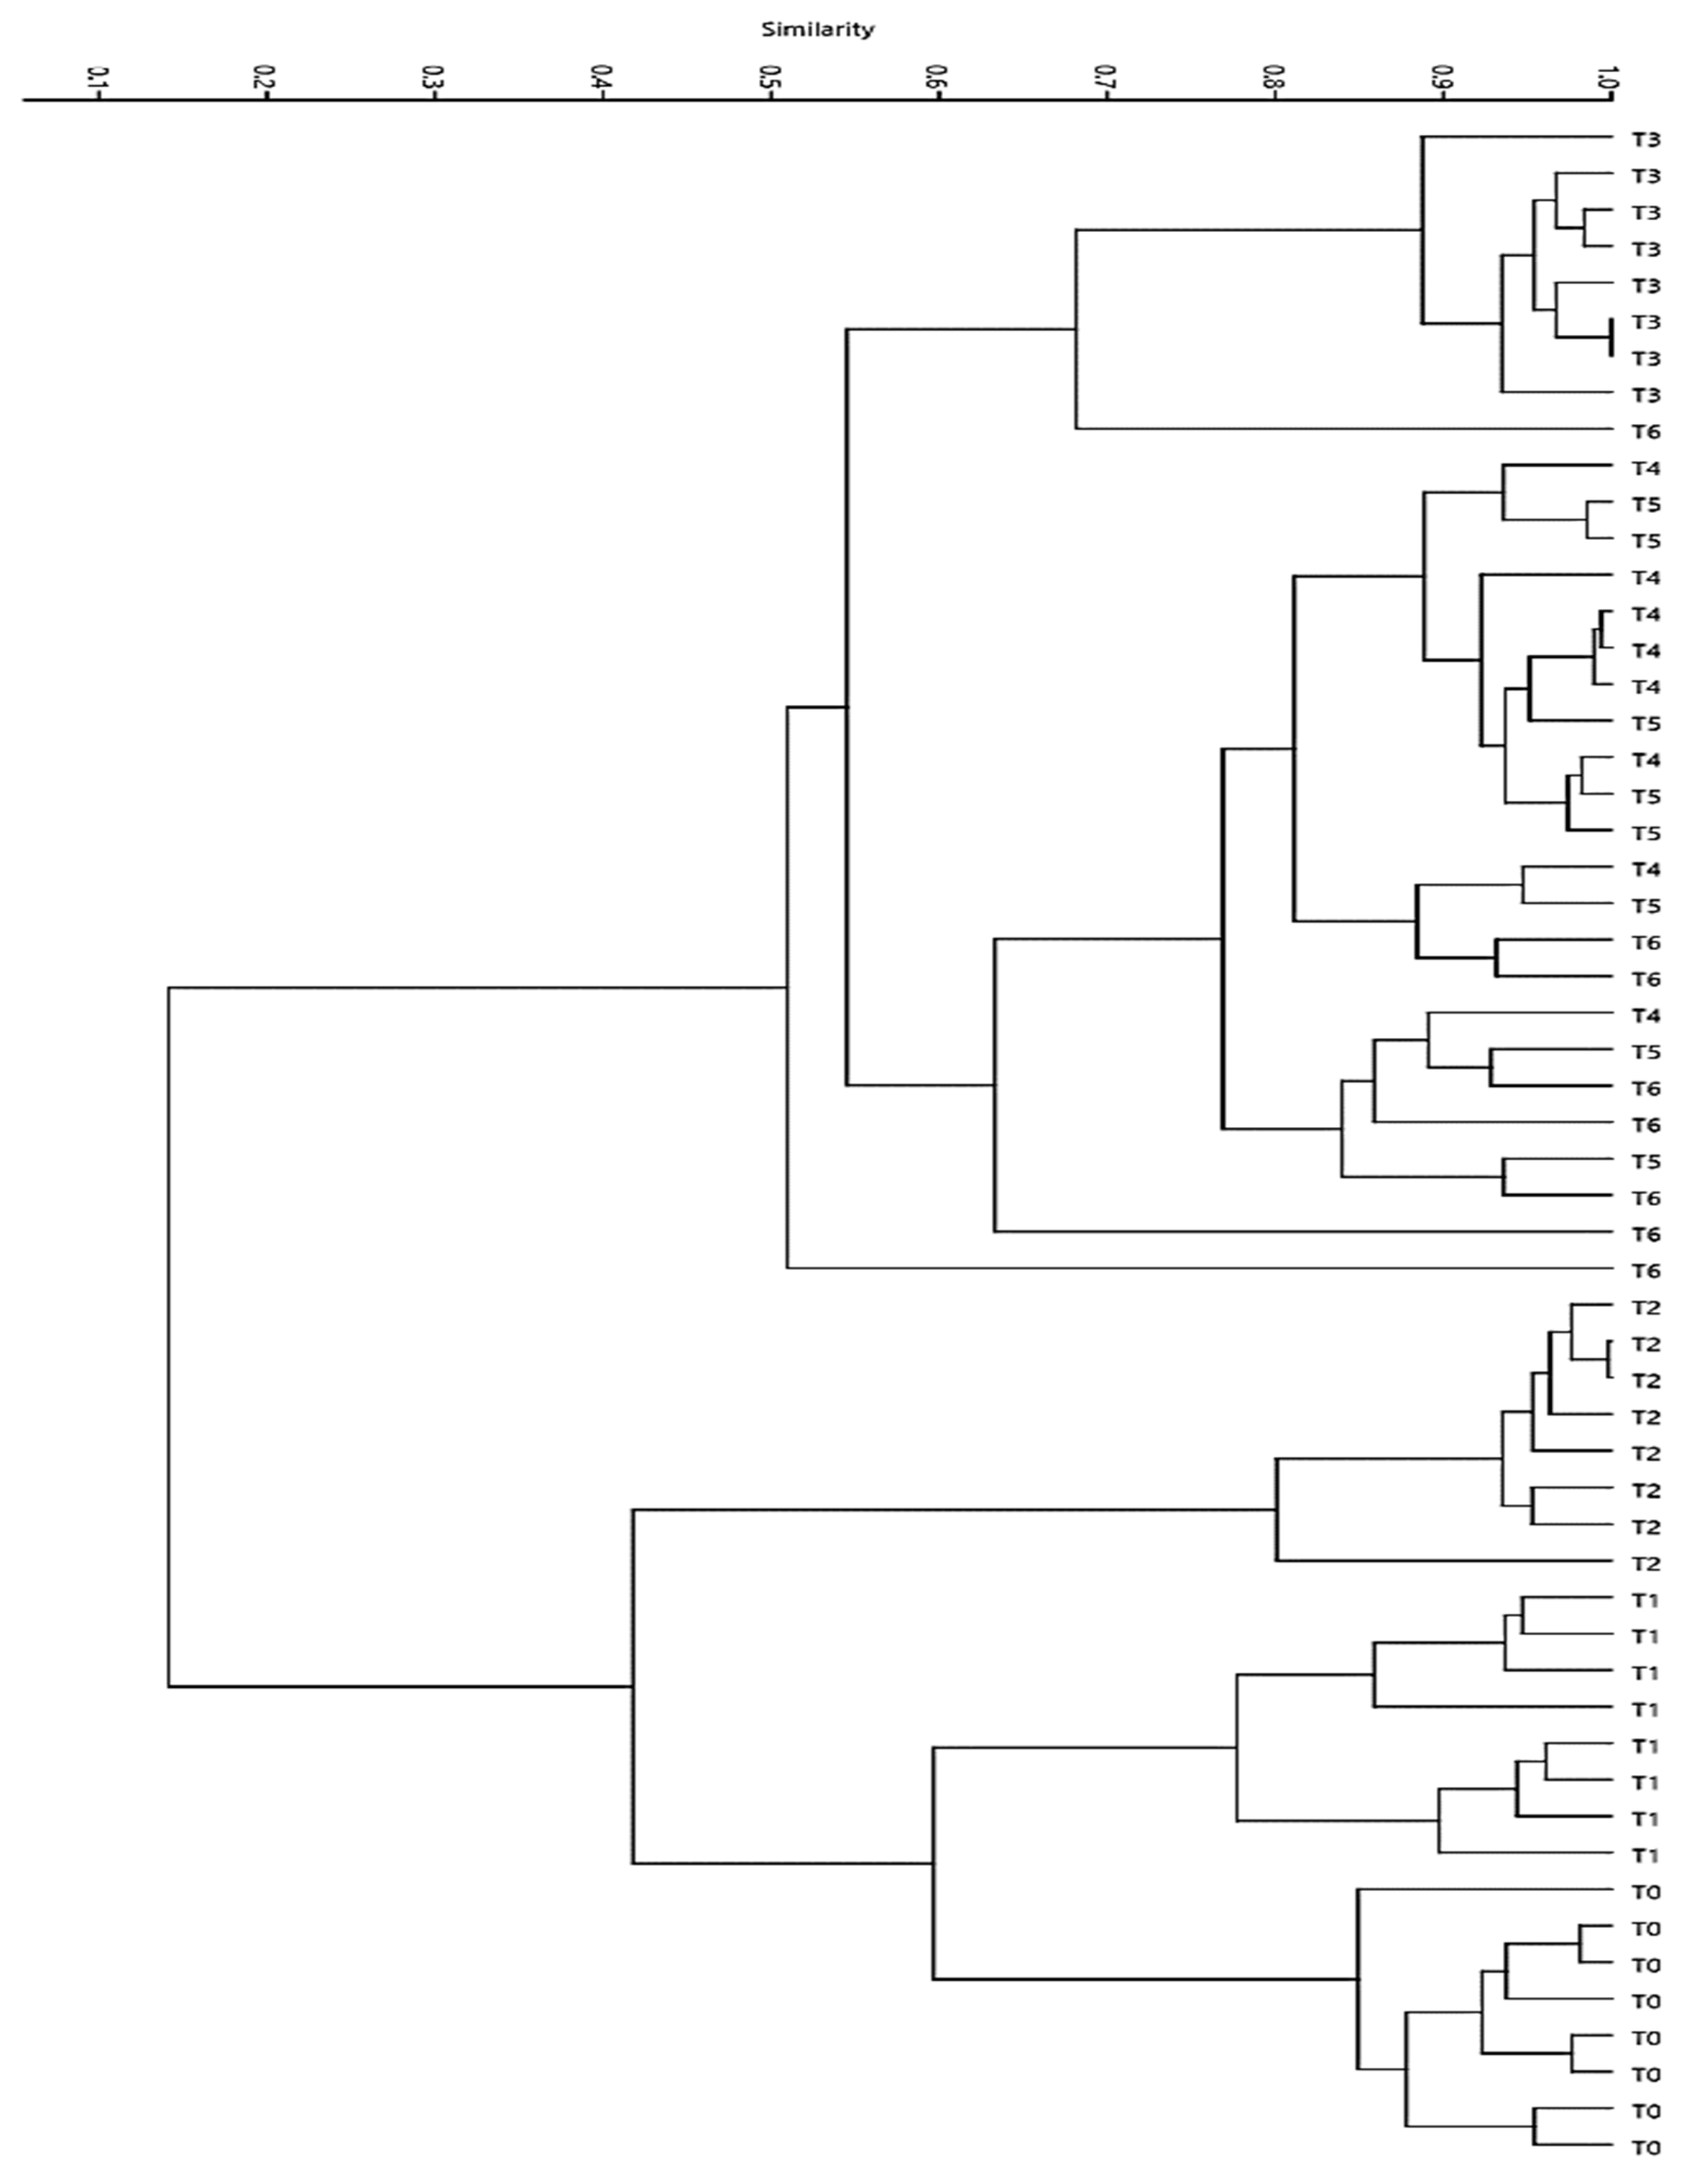
The dendogram (Figure 2) demonstrate the similarity degree of the microbiological intestine fish profile fed control (T0) and experimental diets (T1, T2, T3, T4, T5 and T6). The control, T1, T2 and T3 (intergroups) showed similarity about 0.4. Values about 0.80 is the similarity among the specimens of each treatment (intragroup). However, the same trend was not seen in T4, T5 and T6, indicating different results for the same treatment. The bacteria E. hirae (T4), E. faecium (T5) or the mix (T6) provided divergent effects on the gut microbiota, among Nile tilapia individuals.
When comparing the control (T0) with other treatments, fish from T3 (B. subtilis), T4 (E. hirae), T5 (E. faecium) and T6 (mix of all probiotics) showed different microbial profiles, values below 0.2 (20%) similarity degree. The similarity degree was higher for T1, with 0.6 (60%), followed by T2, with 0.4 (40%). Another point is that are not significant differences regards to control, but T5 showed the lowest value.
Based on bands number and position, the ecological parameters calculated showed significant differences among treatments (Table 5), when applying Shannon (H), richness (R) and habitability (Rr) indices.
In this study, the H value (Shannon diversity index) for T4 was higher than T1 and T5, the latter being lower than T2. The control group showed a similar index compared to the other treatments. For species richness (R), fish fed diets T0 and T1 showed significantly lower numbers of species than the other treatments, nevertheless, groups T3 and T4 showed the highest R values.

3.4. Hemogram, glycemy, lactate, lysozyme, respiratory burst

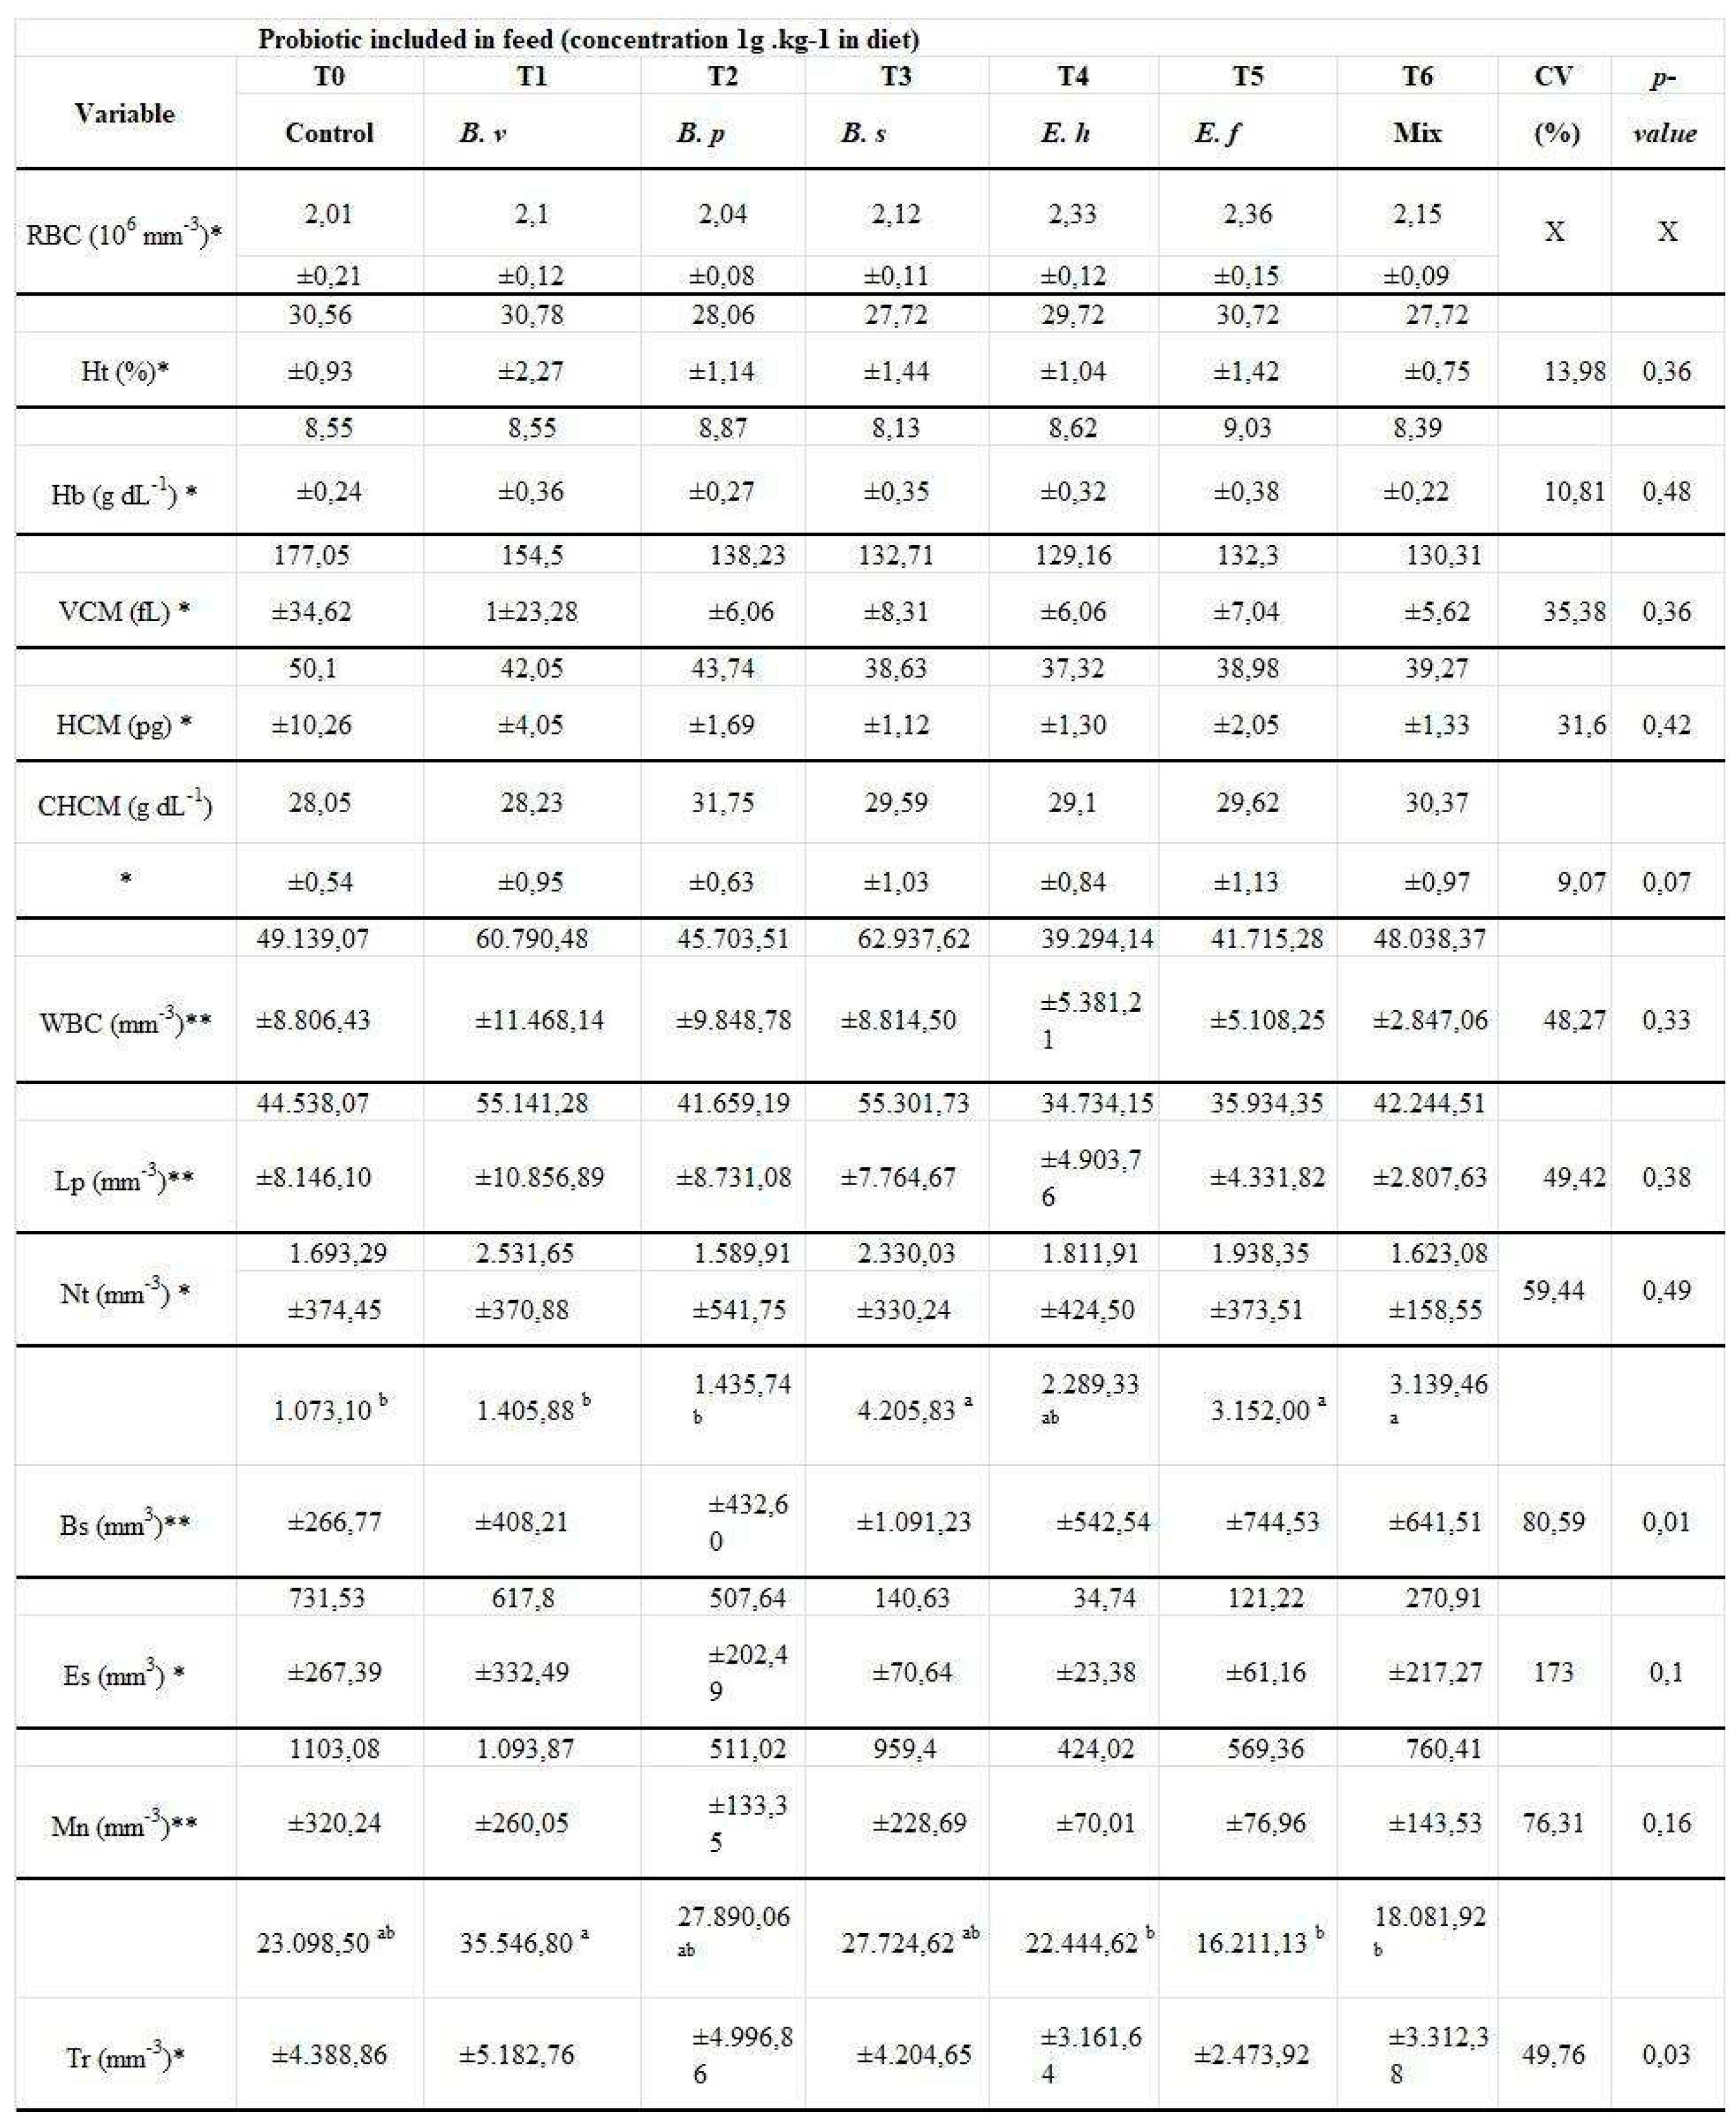
Hematological analyses showed that the red blood series were similar among the treatments (Table 6). Thrombocyte and basophil counts were significantly different (P<0.05) among treatments (Table 6). The number of fish thrombocytes from T1 (B. velezensis) was higher compared to T4 (E. hirae), T5 (E. faecium) and T6 (mixture of all probiotics), and similar to T0 (control) and T2 (B. pumilus). For basophils, fish fed with T3 (B. subtilis), T5 (E. faecium) and T6 (mixture of all probiotics) had higher values than those fed T0 (control), T1 (B. velezensis) and T2 (B. pumilus). Blood glucose, lactate, lysozyme activity, and respiratory burst, the results were also similar among experimental groups (Table 7).

3.5. Bromatological analyses

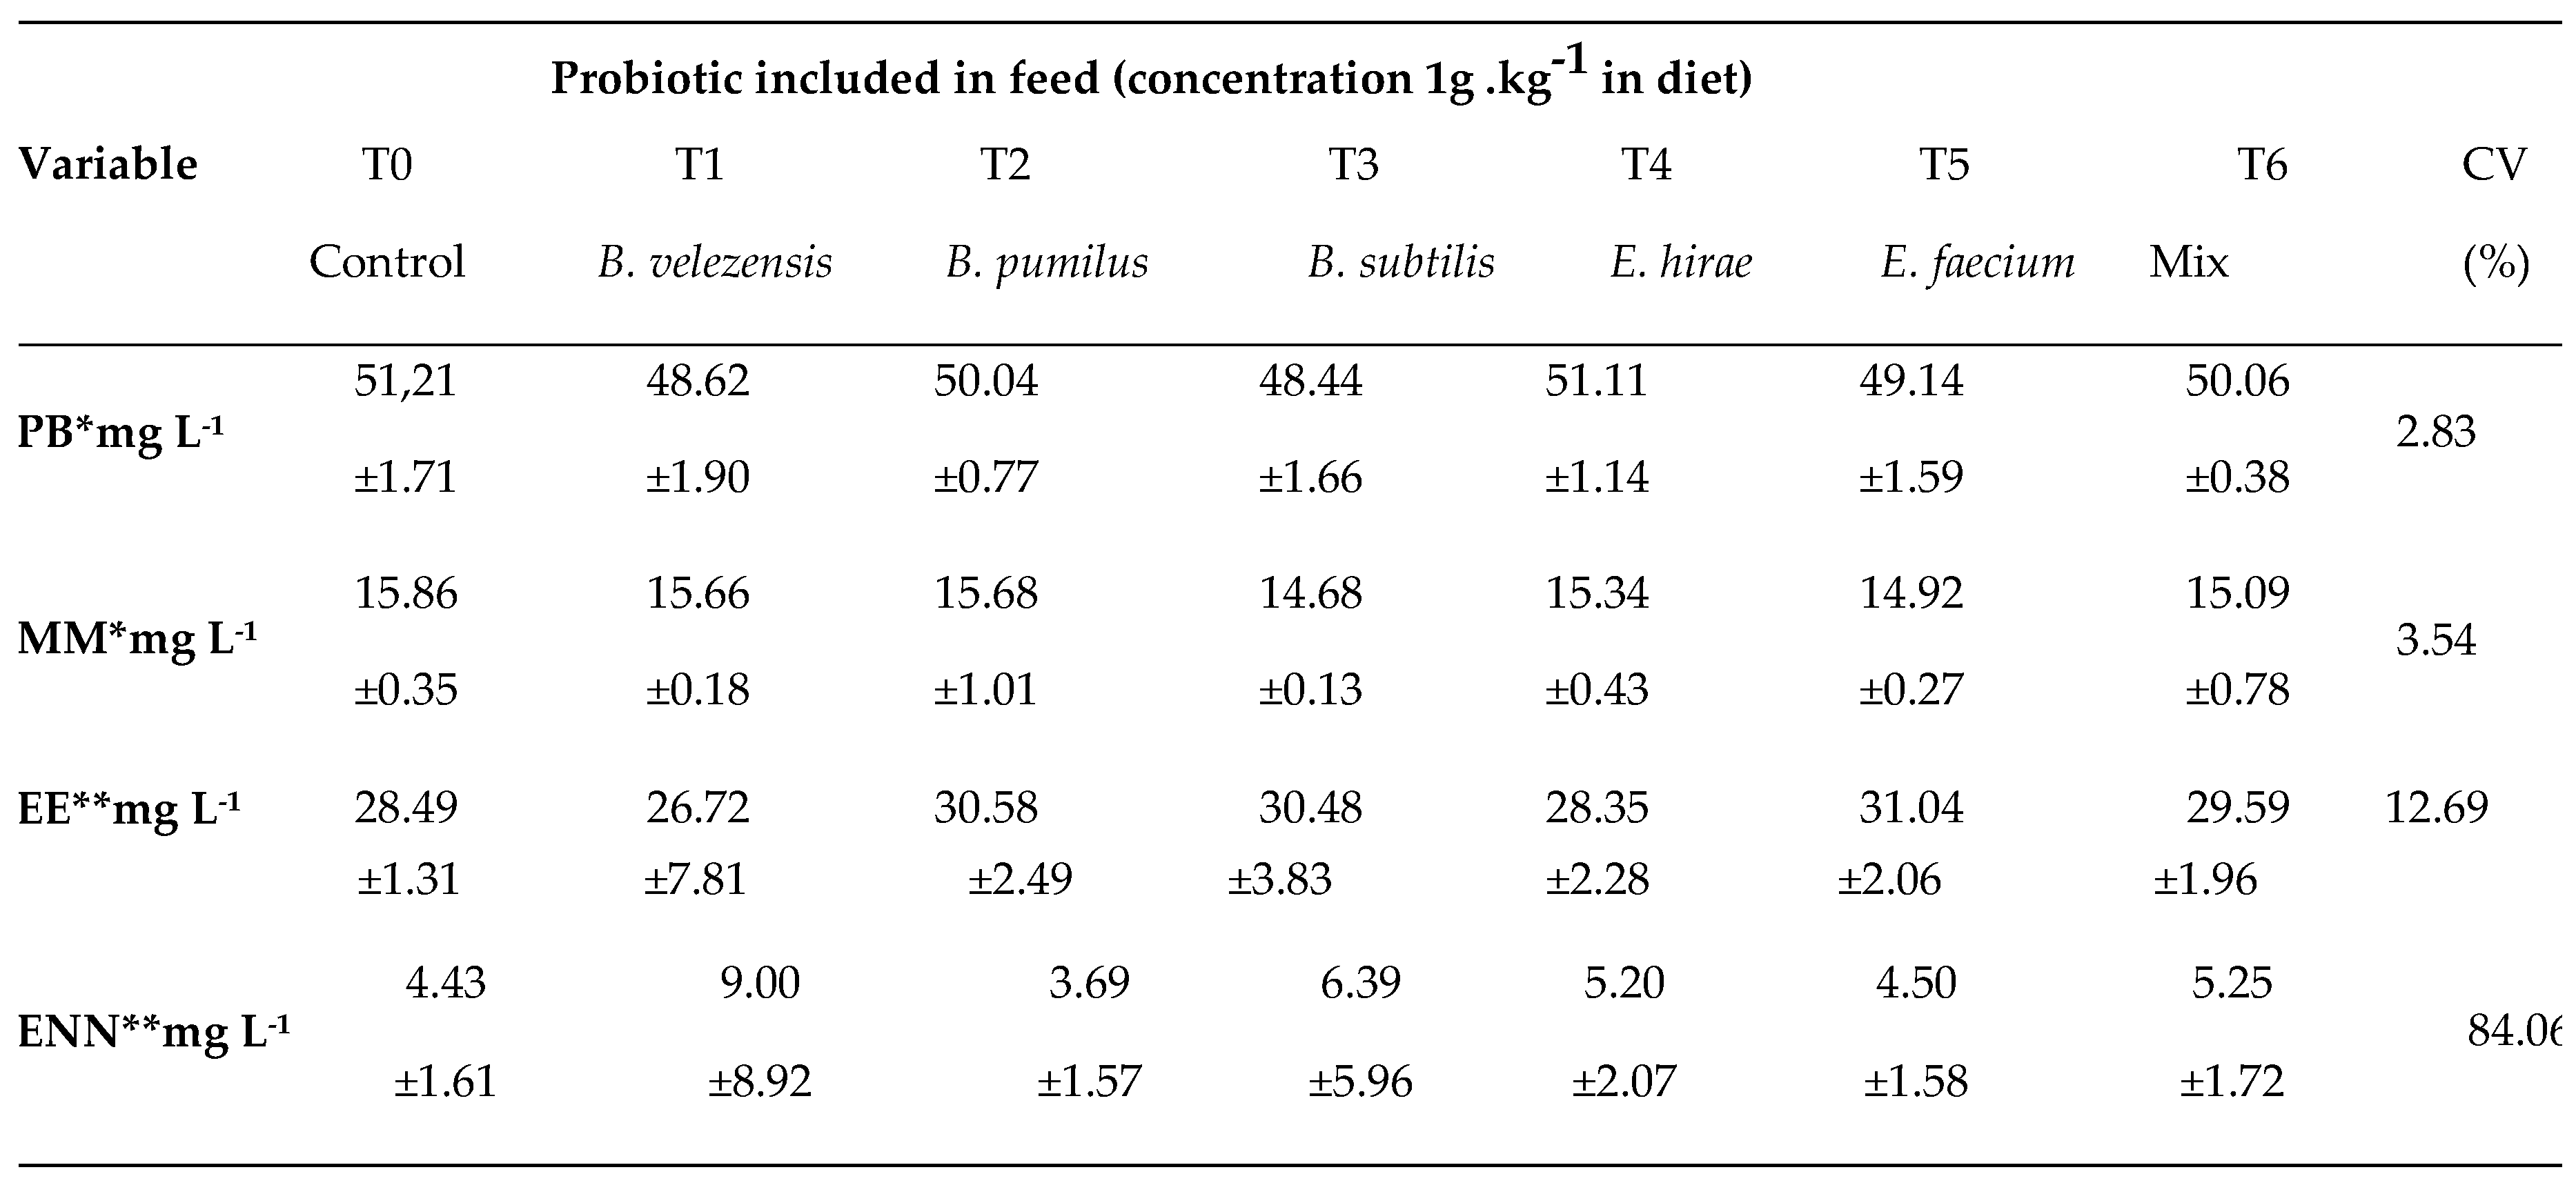
The results of chemical composition of the whole fish, or bromatological analysis, showed that the probiotics did not promote relevant changes compared to the control group (Table 8).

4. Discussion

Many probiotics available on the fish farming market are considered with low effectivity for fish, because these bacteria was isolated from terrestrial animals, and not from fish [27]. The gut microbiota interactions is different between animals species, and these factors limit the probiotic potential of microorganisms [28]. Therefore, we recommend selected probiotics from autochthonous host origin. In this study, potential bacterial for tilapia were isolated with possible use as probiotics from different regions of Brazil.
Feeding the fish with probiotic bacteria promoted positive effects on Nile tilapia zootechnical growth performance after 84 days. Compared to the control, animals fed containing Bacillus (B. velezensis, B. pumilus and B. subtilis) had higher final biomass values, and with only B. pumilus, the feed conversion rate was similar. These results can be explained by Bacillus enzymes production that can improve the ration digestibility [29] and thus contribute to the animal's weight gain and increase in feed efficiency. Liu et al. [17] found that B. subtilis HAINUP40 strain added to the feed increased the enzymatic activity of proteinase and amylase in Nile tilapia, possibly stimulating its endogenous production of these enzymes.
The intestinal microbiota of fish contributes to essential functions, such as inhibition of pathogenic bacteria, competition for nutrients and adhesion to the intestinal mucosa, production of antimicrobial factors that aid in the immune response and food digestion [31].
However, probiotics compete with other microorganisms for adhesion sites on the intestinal epithelium surface and by nutrients, thereby inhibiting the attachment and survival of pathogens. The probiotics adherence to intestinal epithelial cells stimulates the mucus production which are protective function substances against pathogens on the intestinal surface [32]. Probiotic microorganisms, when adapted to the host microbiota, can metabolize nutrients more rapidly, reducing the availability to pathogenic bacteria and controlling their proliferation [33].
According with Sun et al. [34], the inclusion of B. pumilus and B. clausii improved the feed conversion rate of grouper (Epinephelus coioides) after 60 days of experimentation. According to Aly et al. [8], Nile tilapia fed a diet containing B. pumilis isolated from tilapia gonads showed an increase in their growth performance.
Therefore, the time of probiotic administration is an important factor to promote the beneficial effects, such as the production of digestive enzymes, inhibition of pathogenic bacteria, among others [35]. In this study, we verified significant difference in biomass between the 63rd and 84th days of the experiment.
In this study, intestinal microbiota modulation of Nile tilapia fed with diets containing probiotics was observed in two groupings, with different band patterns in relation to the T0 control, T1 B.velezensis and T2 B. pumilus treatments. The use of Bacillus sp. in the diet modulated the intestinal microbiota of grouper and stimulated the development of beneficial microorganisms such as Enterococcus ssp. and B. pumilis, inhibiting the colonization of pathogenic bacteria such as Staphylococcus and Vibrio ponticus [36]. He et al. [37] also observed that the probiotic bacteria B. subtilis modulates the intestinal microbiota, this can be attributed to the substances like biomodulation activity such as iturin and lipoproteins.
Animals fed diets containing B. subtilis (T3) and E. hirae (T4) showed a higher ecological index of richness and habitability compared to the other treatments. This fact may indicate some antagonism or divergent growth rates between the T6 bacteria (B. velezensis, B. pumilus, B. subtilis, E. hirae and E. faecium), since a greater effect of these ecological index was expected in relation to the others, since B. subtilis and E. hirae are present in this treatment.
Ramos et al. [38], found a synergistic effect of probiotics composed of Bacillus sp., Pediococcus sp., Enterococcus sp. and Lactobacillus sp. on the ecological parameters Shannon and Richness Index for rainbow trout (Oncorhynchus mykiss). For these authors, the concentration of probiotics interferes with animal growth and microbiota modulation, and they observed an increase in the Shannon index in fish fed with a lower level of inclusion.
Tapia-Paniagua et al. [20] observed intestinal microbiota modulation ability and immune system of gilthead seabream provoked by the probiotic yeast Debaromycess hansonii L2 and prebiotic inulin with genes immunological expression detected when fish received fed + symbiotic diet for 4 weeks.
The bacteria species selection to compose the probiotic mix should consider the synergistic or antagonistic effects, between then. Sun et al. [40] attributes the intestinal microbiota modulation to competition between probiotic and pathogenic bacteria, improving conditions for commensal bacteria.
Fish fed diets containing probiotic bacteria showed differences in hematological variables, basophils, and thrombocytes number. Similar results were found by Nakandakare et al. [41], that added the probiotic before and after the ration pelleting processing, on Nile tilapia juveniles’ diet, and did not observe significant differences between treatments in the count of lymphocytes, leukocytes, neutrophils, monocytes.
The use of probiotic promoted higher thrombocyte counts compared to control, in surubim hybrid (Pseudoplatystoma corruscans × P. reticulatum) [18,42,43]. Individuals fed with the bacteria B. velezensis (T1) had higher numbers of thrombocytes compared to the mix (T6). It can be inferred that the presence of E. hirae and E. faecium bacteria in the mix may have interfered on Bacillus, since these strains also showed lower thrombocytes values. Thrombocyte phagocytic activity was observed in flounder (Psetta maxima L.) by Burrows et al. [44]. Tavares-Dias et al. [45] studying Colossoma macropomum and Prochilodus lineatus thrombocytes suggested that the peroxidase positivity presence in this cell could be associated with efficient bactericidal activity functioning as a defensive mechanism.
In the study, fish cells are well immunoprotected and prepared for contact with pathogens. Jatobá et al. [10] obtained higher numbers of erythrocytes and thrombocytes for animals fed a diet containing Lactobacillus plantarum and challenged with Enterococcus durans.
Thrombocytes from carp (Cyprinus carpio) blood samples demonstrated the ability to ingest bacteria (0.50 to 3 µm) [46]. However, Passantino et al. [47], when analyzing blood biofilm samples from rainbow trout (Oncorhynchus mykiss) accidentally infected Candida albicans¸ did not verify phagocytosis by thrombocytes, but interacting with erythrocytes, macrophages, lymphocytes, and granulocytes, suggesting interface between the innate and acquired immune systems.
Basophils are leukocytes, which are rarely found in fish blood [22]. The function of basophils seems to be linked to allergic processes, parasite infestations, and phagocytosis [48] since they have histamine in their granules.
The probiotics addition to diet can improve the innate immune response, with a lysozyme blood concentration increasing and respiratory burst, observed in fish fed Bacillus subtilis [18,30]. According to Díaz-Rosales et al. [49], the ability to stimulate the respiratory burst activity of phagocytes may be correlated with the characteristics of the strain, rather than the genus of the bacterium.
In this work, no significant differences were found in the lysozyme and respiratory burst activity, perhaps because the immunological analyzes (respiratory burst and lysozyme) were performed at the end of the experiment (after 81 days of probiotic administration), which could be the difference detected at the beginning of experiment. For common snook (Centropomus undecimalis) fed a diet supplemented with Bacillus subtilis, in an alternating regime of seven days, showed a better response in the respiratory burst, which indicates that the time of probiotic administration interferes on animal's immune system [50]. These authors established the time of seven days based on a previous study, carried out with sea bass fingerlings, fed with ration supplemented with B. subtilis, after seven days, the fish showed a better respiratory burst response and after another seven days, there was a reduced response. The pathogenic agent detection by phagocytes generates free radicals (superoxide (O2-), known as oxidative burst, and triggers to produce high bactericidal potential substance, such as hydrogen peroxide, hypochlorous acid and peroxy-nitrite [51]. The increase in lysozyme activity can be observed during fish stress, in the pathogen presence [52].
In stress moments, glycemia and lactate increase as a secondary response, to provide energy to the animal [53; 54]. The probiotic Shewanella putrefaciens Pdp11 utilization in Sparus auratus diet Varela et al. [55] described lower levels of blood glucose and lactate in animals subjected to high stocking density– stress. In the present study, there is a higher glucose value (P=0.07) for the control in relation than other treatments. However, for lactate levels, values were similar among fish fed with control and test diets.
Telli et al. [18] did not observe significant differences on chemical composition when Nile tilapia were fed with ration + probiotic B. subtilis and attributed a higher moisture value to the high stocking density, which directly interferes in the animal growth. Ramos et al. [56], observed in rainbow trout post-larval phase and fingerlings a possible effect on carcass composition using a mix of probiotics (Bacillus sp., Pediococcus sp., Enterococcus sp. and Lactobacillus sp.). Lara-Flores et al. [57] verified the increase of lipids in Nile tilapia fingerlings fed with yeast and commercial probiotic ALL-LACTM, composed of Streptococcus faecium and Lactobacillus acidophilus. In addition, diet composition (high and low percentage of protein) also contributed to changes in protein and lipid values in the fish carcass.

5. Conclusion

Isolated and pre-selected bacteria from Nile tilapia intestinal mucus of the groups T2 (B. pumilus) and T6 (B. velezensis, B. pumilus, B. subtilis, E. hirae and E. faecium), in feed, can be used as a probiotic to improve the growth performance and modulation of the intestinal microbiota.

Author Contributions

Conceptualization: Luciana Yuri Sato, Danielle de Carla Dias and Leonardo Tachibana; methodology: Luciana Yuri Sato, Mariene Miyoko Natori, Miguel Frederico Fernandez Alarcon, Luara Lucena Cassiano, Carlos Massatoshi Ishikawa, Mateus Cardoso Guimarães, Silvana Tapia-Paniagua; validation, Erna Elisabeth Bach, Leonardo Tachibana; formal analysis: Maria José Tavares Ranzani-Paiva, Miguel Angel Moriñigo and Silvana Tapia-Paniagua; investigation: Luciana Yuri Sato, Danielle de Carla Dias, Ricardo Harakava and Leonardo Tachibana; resources, Leonardo Tachibana; data curation, Danielle de Carla Dias and Leonardo Tachibana, Erna Elisabeth Bach, Carlos Massatoshi Ishikawa and Maria José T. Ranzani-Paiva; writing—original draft preparation, Luciana Yuri Sato; writing—Maria José Tavares Ranzani-Paiva, Luara Lucena Cassiano, Carlos Massatoshi Ishikawa, Miguel Angel Moriñigo, Erna Elisabeth Bach, Ricardo Harakava, Leonardo Tachibana and Danielle de Carla Dias; review and editing, Maria José T. Ranzani-Paiva and Erna Elizabeth Bach; supervision, Leonardo Tachibana; project administration, Leonardo Tachibana; funding acquisition, Leonardo Tachibana. All authors have read and agreed to the published version of the manuscript.

Funding

This research received external funding of FAPESP Process no. FAPESP 2014/15390-1.

Institutional Review Board Statement

The experiment have been authorized by the Animal Ethics Committee for Experiments by Fisheries Institute (number 02/2015). Experiment had proceeded in Pirassununga, SP, Brazil (UPD/Aquiculture Center/Fisheries Institute/APTA/SAA) above norms and recommendations of Resolution n.592 of june 1992, of the Federal Council of Veterinary Medicine, and precepts of Ethical Principles of Animal Experimentation.

Informed Consent Statement

Not applicable.

Data Availability Statement

The data are available in the manuscript.

Acknowledgments

We would like to thank FAPESP (process 2014/15390-1) for funding the project, CAPES for the master's scholarship, CNPq (315737/2021-2) for R. Harakava’s research scholarship and Aquabel for donating the fishes.

Conflicts of Interest

The authors declare no conflict of interest.

References

  1. 1. PeixeBR. Anuário 2023, /: Brazilian Association of Fish Culture - yearbook. Brazil, 2023; pp. 14. https, 2023.
  2. Watanabe, W.O. , Losordo, T. M., Fitzsimmons, K., Hanley, F. Tilapia production systems in the Americas: technological advances, trends, and challenges. Rev. Fish. Sci. 2002, 10, 465–498. [Google Scholar] [CrossRef]
  3. Wang, M. , Lu, M. Tilapia polyculture: a global review. Aquac. Res. 2016, 47, 2363–2374. [Google Scholar] [CrossRef]
  4. Conte, F. Stress and the welfare of cultured fish. Appl. Anim. Behav. Sci. 2004, 86, 205–223. [Google Scholar] [CrossRef]
  5. El-Saadony, M.T.; Alafawany, M.; Patra, A.K.; Kar, I.; Tiwari, R.; Dawood, M.A.O.; Dhama, K.; Abdel-Latif, H.M.R. The functionality of probiotics in aquaculture: an overview. Fish & Shellfish Immunology, 117: 36-52, 2021. [CrossRef]
  6. 6- Hai, N. Van Research findings from the use of probiotics in tilapia aquaculture: A review. Fish Shellfish Immunol. 2015, 45, 592–597. [Google Scholar] [CrossRef]
  7. Dias, D.C. , Leonardo, A. F.G., Tachibana, L., Corrêa, C.F., Bordon, I.C.A.C., Romagosa, E., Ranzani-Paiva, M.J.T. Effect of incorporating probiotics into the diet of matrinxã (Brycon amazonicus) breeders. J. Appl. Ichthyol. 2012, 28, 40–45. [Google Scholar] [CrossRef]
  8. Aly, S.M. , Mohamed, M.F., John, G. Effect of probiotics on the survival, growth and challenge infection in Tilapia nilotica (Oreochromis niloticus). Aquac. Res. 2008, 39, 647–656. 39. [CrossRef]
  9. Del'Duca, A. , Cesar, D.E., Diniz, C.G., Abreu, P.C. Evaluation of the presence and efficiency of potential probiotic bacteria in the gut of tilapia (Oreochromis niloticus) using the fluorescent in situ hybridization technique. Aquaculture. [CrossRef]
  10. Jatobá, A. , Vieira, F.D.N., Neto, C.B., Silva, B.C., Mouriño, J.L.P., Jerônimo, G.T., Dotta, G., Martins, M.L. Utilização de bactérias ácido-lácticas isoladas do trato intestinal de tilápia-do-nilo como probiótico. Pesqui. Agropecu. Bras. 2008, 43, 1201–1207. [Google Scholar] [CrossRef]
  11. Etyemez, M. , Balcazar, J. L. Isolation and characterization of bacteria with antibacterial properties from Nile tilapia (Oreochromis niloticus). Res. Vet. Sci. 2016, 105, 62–64. [Google Scholar] [CrossRef]
  12. Pérez-Sánchez, T. , Ruiz-Zarzuela, I. , de Blas, I., Balcázar, J.L. Probiotics in aquaculture: a current assessment. Rev. Aquac. 2014, 6, 133–146. [Google Scholar] [CrossRef]
  13. Balcázar, J.L. , Decamp, O. , Vendrell, D., De Blas, I., Ruiz-Zarzuela, I. Health and nutritional properties of probiotics in fish and shellfish. Microb. Ecol. Health Dis. 2006, 18, 65–70. [Google Scholar] [CrossRef]
  14. Picchietti, S. , Fausto, A. M., Randelli, E., Carnevali, O., Taddei, A.R., Buonocore, F., Scapigliati, G., Abelli, L. Early treatment with Lactobacillus delbrueckii strain induces an increase in intestinal T-cells and granulocytes and modulates immune-related genes of larval Dicentrarchus labrax (L.). Fish Shellfish Immunol. 2009, 26, 368–376. [Google Scholar] [CrossRef]
  15. Pirarat, N. , Pinpimai, K. , Endo, M., Katagiri, T., Ponpornpisit, A., Chansue, N., Maita, M. Modulation of intestinal morphology and immunity in nile tilapia (Oreochromis niloticus) by Lactobacillus rhamnosus GG. Res. Vet. Sci. 2011, 91, e92–e97. [Google Scholar] [CrossRef] [PubMed]
  16. Gisbert, E. , Castillo, M., Skalli, A., Andree, K.B., Badiola, I. Bacillus cereus var. toyoi promotes growth, affects the histological organization and microbiota of the intestinal mucosa in rainbow trout fingerlings. J. Anim. Sci. 2013, 91, 2766–2774. [Google Scholar] [CrossRef] [PubMed]
  17. Picchietti, S. , Mazzini, M. , Taddei, A.R., Renna, R., Fausto, A.M., Mulero, V., Carnevali, O., Cresci, A., Abelli, L. Effects of administration of probiotic strains on GALT of larval gilthead seabream: Immunohistochemical and ultrastructural studies. Fish Shellfish Immunol. 2007, 22, 57–67. [Google Scholar] [CrossRef] [PubMed]
  18. Telli, G.S. , Ranzani-Paiva, M. J.T., Dias, D.C., Sussel, F.R., Ishikawa, C.M., Tachibana, L. Dietary administration of Bacillus subtilis on hematology and non-specific immunity of Nile tilapia Oreochromis niloticus raised at different stocking densities. Fish Shellfish Immunol. 2014, 39, 305–311. [Google Scholar] [CrossRef]
  19. Brakstad, O.G. , Nonstad, I., Faksness, L., Brandvik, P.J. Responses of microbial communities in arctic sea ice after contamination by crude petroleum oil. Microb. Ecol. 2008, 55, 540–552. [Google Scholar] [CrossRef]
  20. Tapia-Paniagua, S.T.; Reyes-Becerril, M.; Ascencio-Valle, F.; Esteban, M.A.; Clavijo, E.; Balebona, M. C.; Moriñigo, M.A. Modulation of the intestinal microbiota and immune system of farmed Sparus aurata by the administration of the yeast Debaryomyces hansenii L2 in conjunction with inulin. J. Aquac. Res. Develop. 2011, S1. [Google Scholar] [CrossRef]
  21. Marzorati, M. , Wittebolle, L. , Boon,N., Daffonchio, D., Verstraet, W. How to get more out of molecular fingerprints: practical tools for microbial ecology. Environ. Microbiol. 2008, 10, 1571–1581. [Google Scholar]
  22. Ranzani-Paiva, M.J.T. , Pádua, S.B., Tavares-Dias, M., Egami, M.I. 2023. Methods for hematological analysis in fish, /: São Paulo, Brazil, 2023. 138 pp. https, 2023. [Google Scholar]
  23. Kim, D. H; Austin, B. Innate immune responses in rainbow trout (Oncorhynchus mykiss, Walbaum) induced by probiotics. Fish Shellfish Immunology 2006, 21, 513–524. [Google Scholar] [CrossRef]
  24. Lie, Ø. , Lied, E., Lambertsen, G. Liver retention of fat and of fatty acids in cod (Gadus morhua) fed different oils. Aquaculture. [CrossRef]
  25. AOAC AOAC® PRE-PUBLICATION DRAFT AOAC® Standards Development AOAC INTERNATIONAL Methods Committee Guidelines for Validation of Microbiological Methods for Food and Environmental Surfaces, 2002.
  26. Sipaúba-Tavares Limnologia aplicada a aquicultura. 1fst ed; FUNEP-UNESP: Jaboticabal SP, Brazil, 1995; 70p. [Google Scholar]
  27. Ramesh, D. , Vinothkanna A., Rai A.K., Vignesh V.S. Isolation of potential probiotic Bacillus spp. and assessment of their subcellular components to induce immune responses in Labeo rohita against Aeromonas hydrophila. Fish Shellfish Immun 2015, 45, 268–276. [Google Scholar] [CrossRef]
  28. Lazado, C.C. , Caipang C.M.A. Atlantic cod in the dynamic probiotics research in aquaculture. Aquaculture 2014, 424/425, 53–62. [Google Scholar] [CrossRef]
  29. Soto, J.O. Bacillus probiotic enzymes: external auxiliary apparatus to avoid digestive deficiencies, water pollution, diseases, and economic problems in marine cultivated animals In: Advances in Food and Nutrition Research. Elsevier Inc.: Amsterdam, The Netherlands 2017. pp. 15–35. [CrossRef]
  30. Liu, H. , Wang, S. , Cai, Y., Guo, X., Cao, Z., Zhang, Y., Liu, S., Yuan, W., Zhu, W., Zheng, Y., Xie, Z., Guo, W., Zhou, Y. Dietary administration of Bacillus subtilis HAINUP40 enhances growth, digestive enzyme activities, innate immune responses and disease resistance of tilapia, Oreochromis niloticus. Fish Shellfish Immunol. 2017, 60, 326–333. [Google Scholar] [CrossRef]
  31. Soltani, M. , Pakzad, K. , Taheri-Mirghaed, A., Mirzargar, S., Shekarabi, S.P.H., Yosefi, P., Soleymani, N. Dietary application of the probiotic Lactobacillus plantarum 426951 Enhances immune status and growth of rainbow trout (Oncorhynchus mykiss) vaccinated against Yersinia ruckeri. Probiotics Antimicrob. Proteins 2019, 11, 207–219. [Google Scholar] [CrossRef] [PubMed]
  32. Lebeer, S.; Vanderleyden, J.O.S.; Keersmaeckeret, S.C.J. Host interactions of probiotic bacterial surface molecules: comparison with commensals and pathogens. Nat. Ver. Microbiol. 2010, 8, 171–184. [Google Scholar] [CrossRef] [PubMed]
  33. Markowiak, P. , Slizewska, K. Effects of probiotics, prebiotics, and synbiotics on human health. Nutrients 2017, 9, 1021–1051. [Google Scholar] [CrossRef] [PubMed]
  34. Sun, Y.Z. , Yang, H. L., Ma, R.L., Lin, W.Y. Probiotic applications of two dominant gut Bacillus strains with antagonistic activity improved the growth performance and immune responses of grouper Epinephelus coioides. Fish Shellfish Immunol. 2010, 29, 803–809. [Google Scholar] [CrossRef]
  35. Guimarães, M.C. , Dias, D. de C., Araujo, F. von A.P., Ishikawa, C.M., Tachibana, L. Probiotic Bacillus subtilis and Lactobacillus plantarum in diet of Nile tilapia. Bol. do Inst. Pesca 2019, 45, 252. [Google Scholar] [CrossRef]
  36. Yang, H.L. , Sun, Y.Z., Ma, R.L., Ye, J.D. PCR-DGGE analysis of the autochthonous gut microbiota of grouper Epinephelus coioides following probiotic Bacillus clausii administration. Aquac. Res. 2012, 43, 489–497. [Google Scholar] [CrossRef]
  37. He, S. , Zhang, Y. , Xu, L., Yang, Y., Marubashi, T., Zhou, Z., Yao, B. Effects of dietary Bacillus subtilis C-3102 on the production, intestinal cytokine expression and autochthonous bacteria of hybrid tilapia Oreochromis niloticus ♂×Oreochromis aureus ♀. Aquaculture, 2013, 412/413, 125–130. [Google Scholar] [CrossRef]
  38. Ramos, M.A.; Weber, B.; Gonçalves, J.F.; Santos, G.A.; Rema, P.; Ozório, R.O.A. Dietary probiotic supplementation modulated gut microbiota and improved growth of juvenile rainbow trout (Oncorhynchus mykiss). Comp. Bioch. Physiol. Part A: Molecular & Integrative Physiology 2013, 166, 302-307. [CrossRef]
  39. Forssten, S.D. , Ouwehand, A. C. Microbial ecology in health and disease simulating colonic survival of probiotics in single- strain products compared to multi-strain products. Microb. Ecol. Health Dis. 2017, 28. [Google Scholar] [CrossRef]
  40. Sun, Y.Z. , Yang, H. L., Ma, R.L., Huang, K.P., Ye, J.D. Culture-independent characterization of the autochthonous gut microbiota of grouper Epinephelus coioides following the administration of probiotic Enterococcus faecium. Aquac. Int. 2012, 20, 791–801. [Google Scholar] [CrossRef]
  41. Nakandakare, I.B.; Iwashita, M.K.P.; Dias, D.C.; Tachibana, L.; Ranzani-Paiva, M.J.T.; Romagosa, E. Incorporation of probiotics in the diet for juvenile Nile tilapias: Hematological, immunological and microbiological parameters. Bol. do Inst. Pesca 2013, 39, 121–135. [Google Scholar]
  42. Mouriño, J.L.P. , Nascimento Vieira, F. , Jatobá, A.B., da Silva, B.C., Jesus, G.F.A., Seiffert, W.Q., Martins, M.L. Effect of dietary supplementation of inulin and W. cibaria on haemato-immunological parameters of hybrid surubim (Pseudoplatystoma sp). Aquac. Nutr. 2012, 18, 73–80. [Google Scholar] [CrossRef]
  43. Mouriño, J.L.P. , Vieira, F. N., Jatobá, A., Silva, B.C., Pereira, G. V., Jesus, G.F.A., Ushizima, T.T., Seiffert, W.Q., Martins, M.L. Symbiotic supplementation on the hemato-immunological parameters and survival of the hybrid surubim after challenge with Aeromonas hydrophila. Aquac. Nutr. 2017, 23, 276–284. [Google Scholar] [CrossRef]
  44. Burrows, Fletcher, Manning, M. J. Haematology of the turbot, Psetta maxima (L.): ultrastructural, cytochemical and morphological properties of peripheral blood leucocytes. J. Appl. Ichthyol. 2003, 17, 77–84. [CrossRef]
  45. Tavares-Dias, M.; Moraes, F. R.; Onaka, E. M.; Rezende, P. C. B. Changes in blood parameters of hybrid tambacu fish parasitized by Dolops carvalhoi (Crustacea, Branchiura), a fish louse. Veterinarski Arhiv, /: http, 2007. [Google Scholar]
  46. Nagasawa, T. , Nakayasu, C. , Rieger, A.M., Barreda, D.R., Somamoto, T., Nakao, M. Phagocytosis by thrombocytes is a conserved innate immune mechanism in lower vertebrates. Front. Immunol. 2014, 5, 36–39. [Google Scholar] [CrossRef]
  47. Passantino, L. , Cianciotta, A. , Patruno, R., Ribaud, M.R., Jirillo, E., Passantino, G.F. Do fish thrombocytes play an immunological role? Their cytoenzymatic profiles and function during an accidental piscine candidiasis in aquarium. Immunopharmacol. Immunotoxicol. 2005, 27, 345–356. [Google Scholar] [CrossRef]
  48. Satake, F.; Pádua, S. B. de; Ishikawa, M. M. Distúrbios morfológicos em células sanguíneas de peixes em cultivo: uma ferramenta prognóstica. In: Tavares-Dias, M. (Org.). Manejo e sanidade de peixes em cultivo, 2009. [Google Scholar]
  49. Díaz-Rosales, P. , Arijo, S. , Chabrillón, M., Alarcón, F.J., Tapia-Paniagua, S.T., Martínez-Manzanares, E., Balebona, M.C., Moriñigo, M.A. Effects of two closely related probiotics on respiratory burst activity of Senegalese sole (Solea senegalensis, Kaup) phagocytes, and protection against Photobacterium damselae subsp. piscicida. Aquaculture 2009, 293, 16–21. [Google Scholar] [CrossRef]
  50. Noffs, A.P. , Tachibana, L., Santos, A.A., Ranzani-Paiva, M.J.T. Common snook fed in alternate and continuous regimens with diet supplemented with Bacillus subtilis probiotic. Pesqui. Agropecu. Bras. 2015, 50, 267–272. [Google Scholar] [CrossRef]
  51. Biller, J.D. , Takahashi, L.S. Oxidative stress and fish immune system: phagocytosis and leukocyte respiratory burst activity. An. Acad. Bras. Cienc. 2018, 90, 3403–3414. [Google Scholar] [CrossRef]
  52. Saurabh, S. , Sahoo, P.K. Lysozyme: An important defense molecule of fish innate immune system. Aquac. Res. 2008, 39, 223–239. [Google Scholar] [CrossRef]
  53. Barton, B.A. Stress in fishes: a diversity of responses with particular reference to changes in circulating corticosteroids. Integr. Comp. Biol. 2002, 42, 517–525. [Google Scholar] [CrossRef] [PubMed]
  54. Martínez Cruz, P. , Ibáñez, A.L., Monroy Hermosillo, O.A., Ramírez Saad, H.C. Use of Probiotics in Aquaculture ISRN Microbiol. 2012, 1–13. [CrossRef]
  55. Varela, J.L. , Ruiz-Jarabo, I., Vargas-Chacoff, L., Arijo, S., León-Rubio, J.M., García- Millán, I., Martín del Río, M.P., Moriñigo, M.A., Mancera, J.M. Dietary administration of probiotic Pdp11 promotes growth and improves stress tolerance to high stocking density in gilthead seabream Sparus auratus. Aquaculture 2010, 309, 265–271. [CrossRef]
  56. Ramos, M.A. , Batista, S. , Pires, M.A., Silva, A.P., Pereira, L.F., Saavedra, M.J., Ozório, R.O.A., Rema, P. Dietary probiotic supplementation improves growth and the intestinal morphology of Nile tilapia. Animal 2017, 11, 1259–1269. [Google Scholar] [CrossRef] [PubMed]
  57. Lara-Flores, M. , Olvera-Novoa, M.A., Guzmán-Méndez, B.E., López-Madrid, W. Use of the bacteria Streptococcus faecium and Lactobacillus acidophilus, and the yeast Saccharomyces cerevisiae as growth promoters in Nile tilapia (Oreochromis niloticus). Aquaculture 2003, 216, 193–201. [CrossRef]
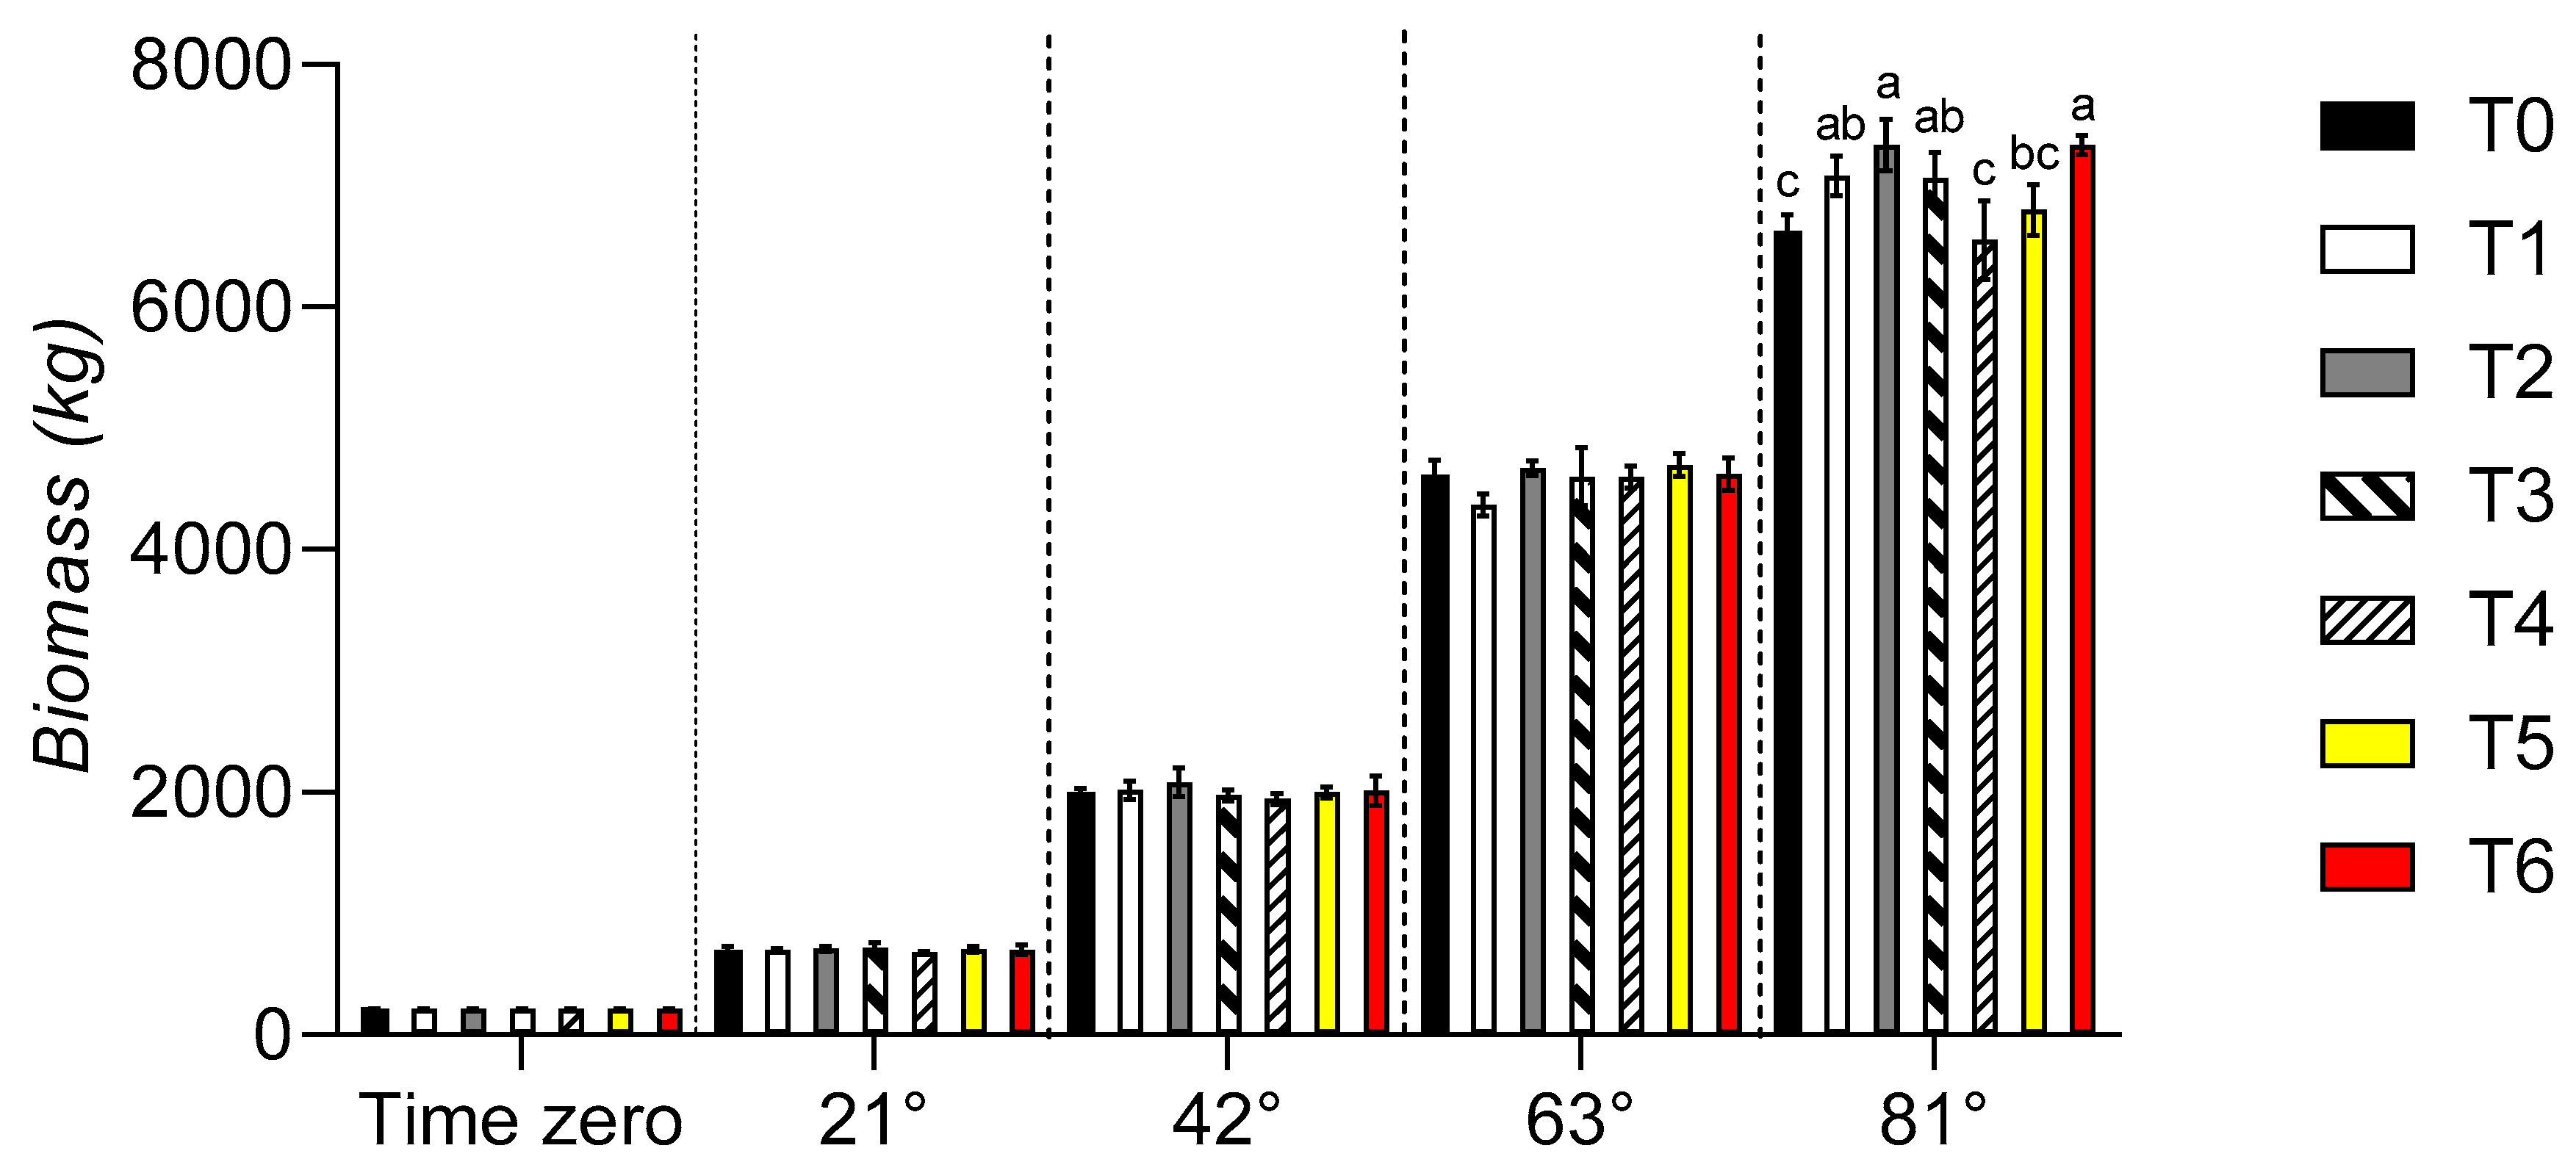
Figure 1. Means and standard deviations of Nile tilapia (O. niloticus) total biomass of (g), fed with different probiotic bacteria at different times (T0 - control, T1 - Bacillus velezensis in the feed, T2 - Bacillus pumilus in the feed, T3 - Bacillus subtilis in the feed, T4 - Enterococcus hirae in the feed, T5 - Enterococcus faecium in the feed and T6 – mix B. velezensis, B. pumilus, B. subtilis, E. hirae and E. faecium). *Different letters in the same line show a significant difference (p<0.05) between the means of the values by Duncan's test.
Preprints 84034 g001
Figure 2. Dendogram of the intestinal microbiota analysis of Nile tilapia fed diets containing probiotics during 84 days (T0 - control, T1 - Bacillus velezensis in the feed, T2 - Bacillus pumilus in the feed, T3 - Bacillus subtilis in the feed, T4 - Enterococcus hirae in the feed, T5 - Enterococcus faecium in the feed, and T6 - mix - B. velezensis, B. pumilus, B. subtilis, E. hirae and E. faecium).
Preprints 84034 g002
Table 1. Composition of the reference feed (RF) used in experimental diets (g 100g−1).
Preprints 84034 i001
* Premix: vit A 12,000 IU; vit D3 3000 IU; vit E 150 mg; vit K3 15 mg; vit B1 20 mg; vit B2 20 mg; vitB6 17,50 mg; vit B12 40 mg; vit C 300 mg; nicotinic acid 100 mg; pantothenic acid 50 mg; biotin 1 mg; folic acid 6 mg; antioxidant 25 mg; Cu 17,50 mg; Fe 100 mg; Mn 50 mg; Zn 120 mg; I 0,80 mg; Se 0,50 mg; Co 0,40 mg; inositol 125 mg; choline 500 mg [19].
Table 2. Treatments used in Nile tilapia as feed with probiotic.
Preprints 84034 i002
Table 3. Water quality in treatments for Nile tilapia fed with ration containing probiotic bacteria during 84 days.
Water quality parameters
21o day 42o day 63o day 84o day
Oxigen (mg L−1) 5.90±0.365 6.11±0.737 6.60±2.60 4.13±0.12
pH 7.25±0.071 7.61±0.127 7.49±082 7.24±0.06
Temperature (oC) 26.43±1.150 28.05±0.810 30.57±1.25 32.67±0.58
Ammonia (mg L−1) 0.25±0.00 0.25±0.00 0.00±0.00 1.00±0.00
Table 4. Weight gain (WG), survival rate (TS), apparent feed conversion ratio (AFRC), specific growth rate (SGR), protein efficiency ratio (PET) and total fish biomass, with the respective coefficients of variation (CV) of the experiment with tilapia, O. niloticus, after 84 days of different probiotic bacteria feeding.
Variable TO T1 T2 T3 T4 T5 T6 CV P-value
control B.v B.p B.s E.h E.f mix %
Wg (g) 88.57 92.66 94.30 91.91 88.92 90.99 92.71 3.85 0.4300
± 3.33 ± 3.06 ± 2.64 ± 1.35 ± 5.78 ± 4.08 ± 2.76
TS (%) 90.80 92.90 94.60 93.30 89.60 90.80 96.30 4.40 0.1243
± 0.72 ± 1.44 ± 2.60 ± 1.91 ± 5.77 ± 1.91 ± 2.17
AFRC (5) 1.10c 1.14ab 1.10c 1.13b 1.16a 1.13b 1.11c 1.08 0.0004
± 0,01 ± 0.01 ± 0.02 ± 0.02 ± 0.01 ± 0.01 ± 0.02
SGR (%dia−1) 4.37 4.43 4.42 4.36 4.37 4.40 4.43 0.53 0.2854
± 0.06 ± 0.03 ± 0.01 ± 0.01 ± 0.08 ± 0.05 ± 0.06
PET (%) 2.45a 2.38b 2.46a 2.39b 2.34c 2.39b 2.44a 0.56 0.0006
± 0.01 ± 0.02 ± 0.05 ± 0.04 ± 0.01 ± 0.01 ± 0.03
abc Different letters in the same line shows a significant difference (p<0.05) between the means of the values by Duncan's test. Bv=B.velezensis; Bp= B. pumilus; Bs= B.subtilis; Eh= E.hirae; Ef= E.faecium
Table 5. - Results from ecological parameters calculated among treatments and explained by Shannon (H), richness (R) and habitability (Rr) indices in Nile tilapia feeding with probiotic bacteria during 84 days.
Probiotics included in feed (concentration 1g.kg-1 of diet)
Variable T0
Control
T1
B.
velezensis
T2
B.
pumilus
T3
B.
subtilis
T4
E.
hirae
T5
E.
faecium
T6 MIX CV (%) P-value
H 2.59abc
± 0.08

2.47bc
± 0.14

2.69ab
± 0.33

2.57abc
± 0.10

2.76a
± 0.25

2.38c
± 0.16
2.54abc
± 0.15
7.92 0.0108
R 16.13c
± 2.12
16.5c
± 2.12
21.25b
± 4.76
29.00a
± 1.58
27.88a
± 1.83
21.13b
± 5.55
21.63b
± 2.18
15.9 <.0001
Rr 49.19c
± 15.27
51.2c
± 13.00
90.55b
± 37.69
134.96a
± 14.83
124.86a
± 16.46
76.34bc
± 37.35
75.58bc
± 14.95
29.43 <.0001
T0 – control; T1 – Bacillus velezensis; T2 – Bacillus pumilus; T3 – Bacillus subtilis; T4 – Enterococcus hirae; T5 – Enterococcus faecium; T6 –mix - B. velezensis, B. pumilus, B. subtilis, E. hirae; E. faecium; H- index de Shannon; R- richness; Rr- habitability. abc Different letters in the same line shows a significant difference (p<0.05) between the means of the values by Duncan's test.
Table 6. Nile tilapia erythrogram, leukogram and thrombogram fed with probiotics during 84 days.
Preprints 84034 i003
T0 – control; T1 – Bacillus velezensis; T2 – Bacillus pumilus; T3 – Bacillus subtilis; T4 – Enterococcus hirae; T5 – Enterococcus faecium; T6 – mix - B. velezensis, B. pumilus, B. subtilis, E. hirae e E. faecium; RBC = Red blood cells; Ht = Hematocrit; Hb = Hemoglobin rate; MCV= Mean Corpuscular Volume; MCH = Mean Corpuscular Hemoglobin; CHCM = Mean Corpuscular Hemoglobin Concentration; WBC= Total Leukocytes; LF= Lymphocytes; Nt = Neutrophil; BS = Basophil; Es = Eosinophil; Mn = Monocyte; Tr = Thrombocyte. * ANOVA (parametric analysis). Different letters in the same line shows significant difference between means by Duncan test (p<0.05). ** Kruskall-Wallis test (non-parametric analysis). Different letters in the same line shows significant difference between the medians by Dunn's Post Hoc test (p<0.05).
Table 7. Blood glucose, lactate, serum lysozyme and respiratory burst of Nile tilapia fed with probiotics bacteria during 84 days.
Probiotic included in feed (concentration 1g .kg−1 in diet)
Variable T0 T1 T2 T3 T4 T5 T6 CV
Control B. velezensis B. pumilus B. subtilis E. hirae E. faecium Mix (%) P-value
Blood glucose* 53.78 49.33 44.67 48.78 45.00 42.11 43.78 18.06 0,07
mg dL−1 ±10.56 ±5.00 ±11.39 ±8.72 ±7.19 ±7.56 ±6.98
19.76 16.82 20.71 21.86 16.70 18.36 18.08
Lactate* mmol L−1 ±4.05 ±5.17 ±5.45 ±4.84 ±3.76 ±8.51 ±9.09 32.60 0,49
819.17 934.07 688.89 717.04 1,002.59 783.75 804.,07
Lysozyme* ±224.68 ±623.04 ±181.13 ±275.74 ±639.82 ±206.78 ±375.48 49.75 0,67
mg L−1
Respiratory Burst** 0.473 0.481 0.469 0.428 0.482 0.500 0.527
Positive NBT cells (%) ±0.09 ±0.19 ±0.09 ±0.14 ±0.07 ±0.17 ±0.06 26.74 0,67
T0 – control; T1 – Bacillus velezensis; T2 – Bacillus pumilus; T3 – Bacillus subtilis; T4 – Enterococcus hirae; T5 – Enterococcus faecium; T6 –mix - B. velezensis, B. pumilus, B. subtilis, E. hirae e E. Faecium *ANOVA (parametric analysis) **Kruskal-Wallis analysis (non-parametric analysis).
Table 8. Fish centesimal composition, dry matter basis (%) of Nile tilapia, fed with probiotics bacteria during 84 days.
Preprints 84034 i004
T0 – control; T1 – Bacillus velezensis; T2 – Bacillus pumilus; T3 – Bacillus subtilis; T4 – Enterococcus hirae; T5 – Enterococcus faecium; T6 – mix - B. velezensis, B. pumilus,B. subtilis, E. hirae; E. faecium; PB – total protein, MM-mineral material, EE - ether extract, ENN- non-nitrogenous extractive *ANOVA (parametric analysis) **Kruskal-Wallis analysis (non-parametric analysis).
Disclaimer/Publisher’s Note: The statements, opinions and data contained in all publications are solely those of the individual author(s) and contributor(s) and not of MDPI and/or the editor(s). MDPI and/or the editor(s) disclaim responsibility for any injury to people or property resulting from any ideas, methods, instructions or products referred to in the content.
Copyright: This open access article is published under a Creative Commons CC BY 4.0 license, which permit the free download, distribution, and reuse, provided that the author and preprint are cited in any reuse.
Prerpints.org logo

Preprints.org is a free preprint server supported by MDPI in Basel, Switzerland.

Subscribe

© 2024 MDPI (Basel, Switzerland) unless otherwise stated