1. Introduction
In today’s world, energy and climate change are one of the biggest problems of humanity. Especially considering that humanity’s level of development is closely linked to its level of energy use and society’s well-being is same level dependent on the availability of energy. Also, with climate change, getting energy itself is not solving the problem for a long time, especially by using fossil fuels we are speeding the process. So, a lot of attention is going to new and possibly clean energy areas. One of them is hydrogen energy which is more of a carrier rather than an energy source itself. Hydrogen possesses a substantially larger energy density per unit mass of 142 MJ/kg compared to other fossil fuels or hydrocarbon fuels (Mahato et al., 2020). And for conversion of hydrogen to energy fuel cells are used which is quite efficient considering the traditional internal combustion engines used today widely, and fuel cell’s by-product is water and there is no carbon emission in the conversion process itself when used fuel is hydrogen. But like everything there are some drawbacks to this technology, preventing this technology from getting daily used. The first one is like the all-new technology economical side of technology considering the considering standard energy ways fairly more expensive and second problem is the storage of the hydrogen easy access of hydrogen when needed. There are different types of fuel cells, but the primary components of a fuel cell are an ion-conducting electrolyte, a cathode, and an anode (Haile, S. M., 2003). And in Proton Exchange Membrane Fuel (PEM) Cells or also known as Polymer Electrolyte Membrane fuel cells electrolyte part consists of polymers that have proton conductivity. And proton conductivity of the polymer membrane is one of the important properties of a fuel cell as it can have a limiting factor on the overall of the fuel cell. So, it is important to control the proton conductivity of the membrane while preparing fuel cells in the research of preparing new ones. Normally proton exchange capacity is measured using impedance spectroscopy to find the resistance of the PEM and then from resistance to conductivity is found using the relation between resistance and conductivity. But this method is not suitable for every lab as it is possible to have problems with access to the equipment needed. Another method of proton conductivity is an indirect measurement of proton conductivity which is ion exchange capacity measurement (IEC). IEC is basically an acid-base titration but needs an overnight bath in solution and even though it is fairly simple it does not give direct proton conductivity and needs a lot of waiting and measurement time.
2. FUEL CELLS
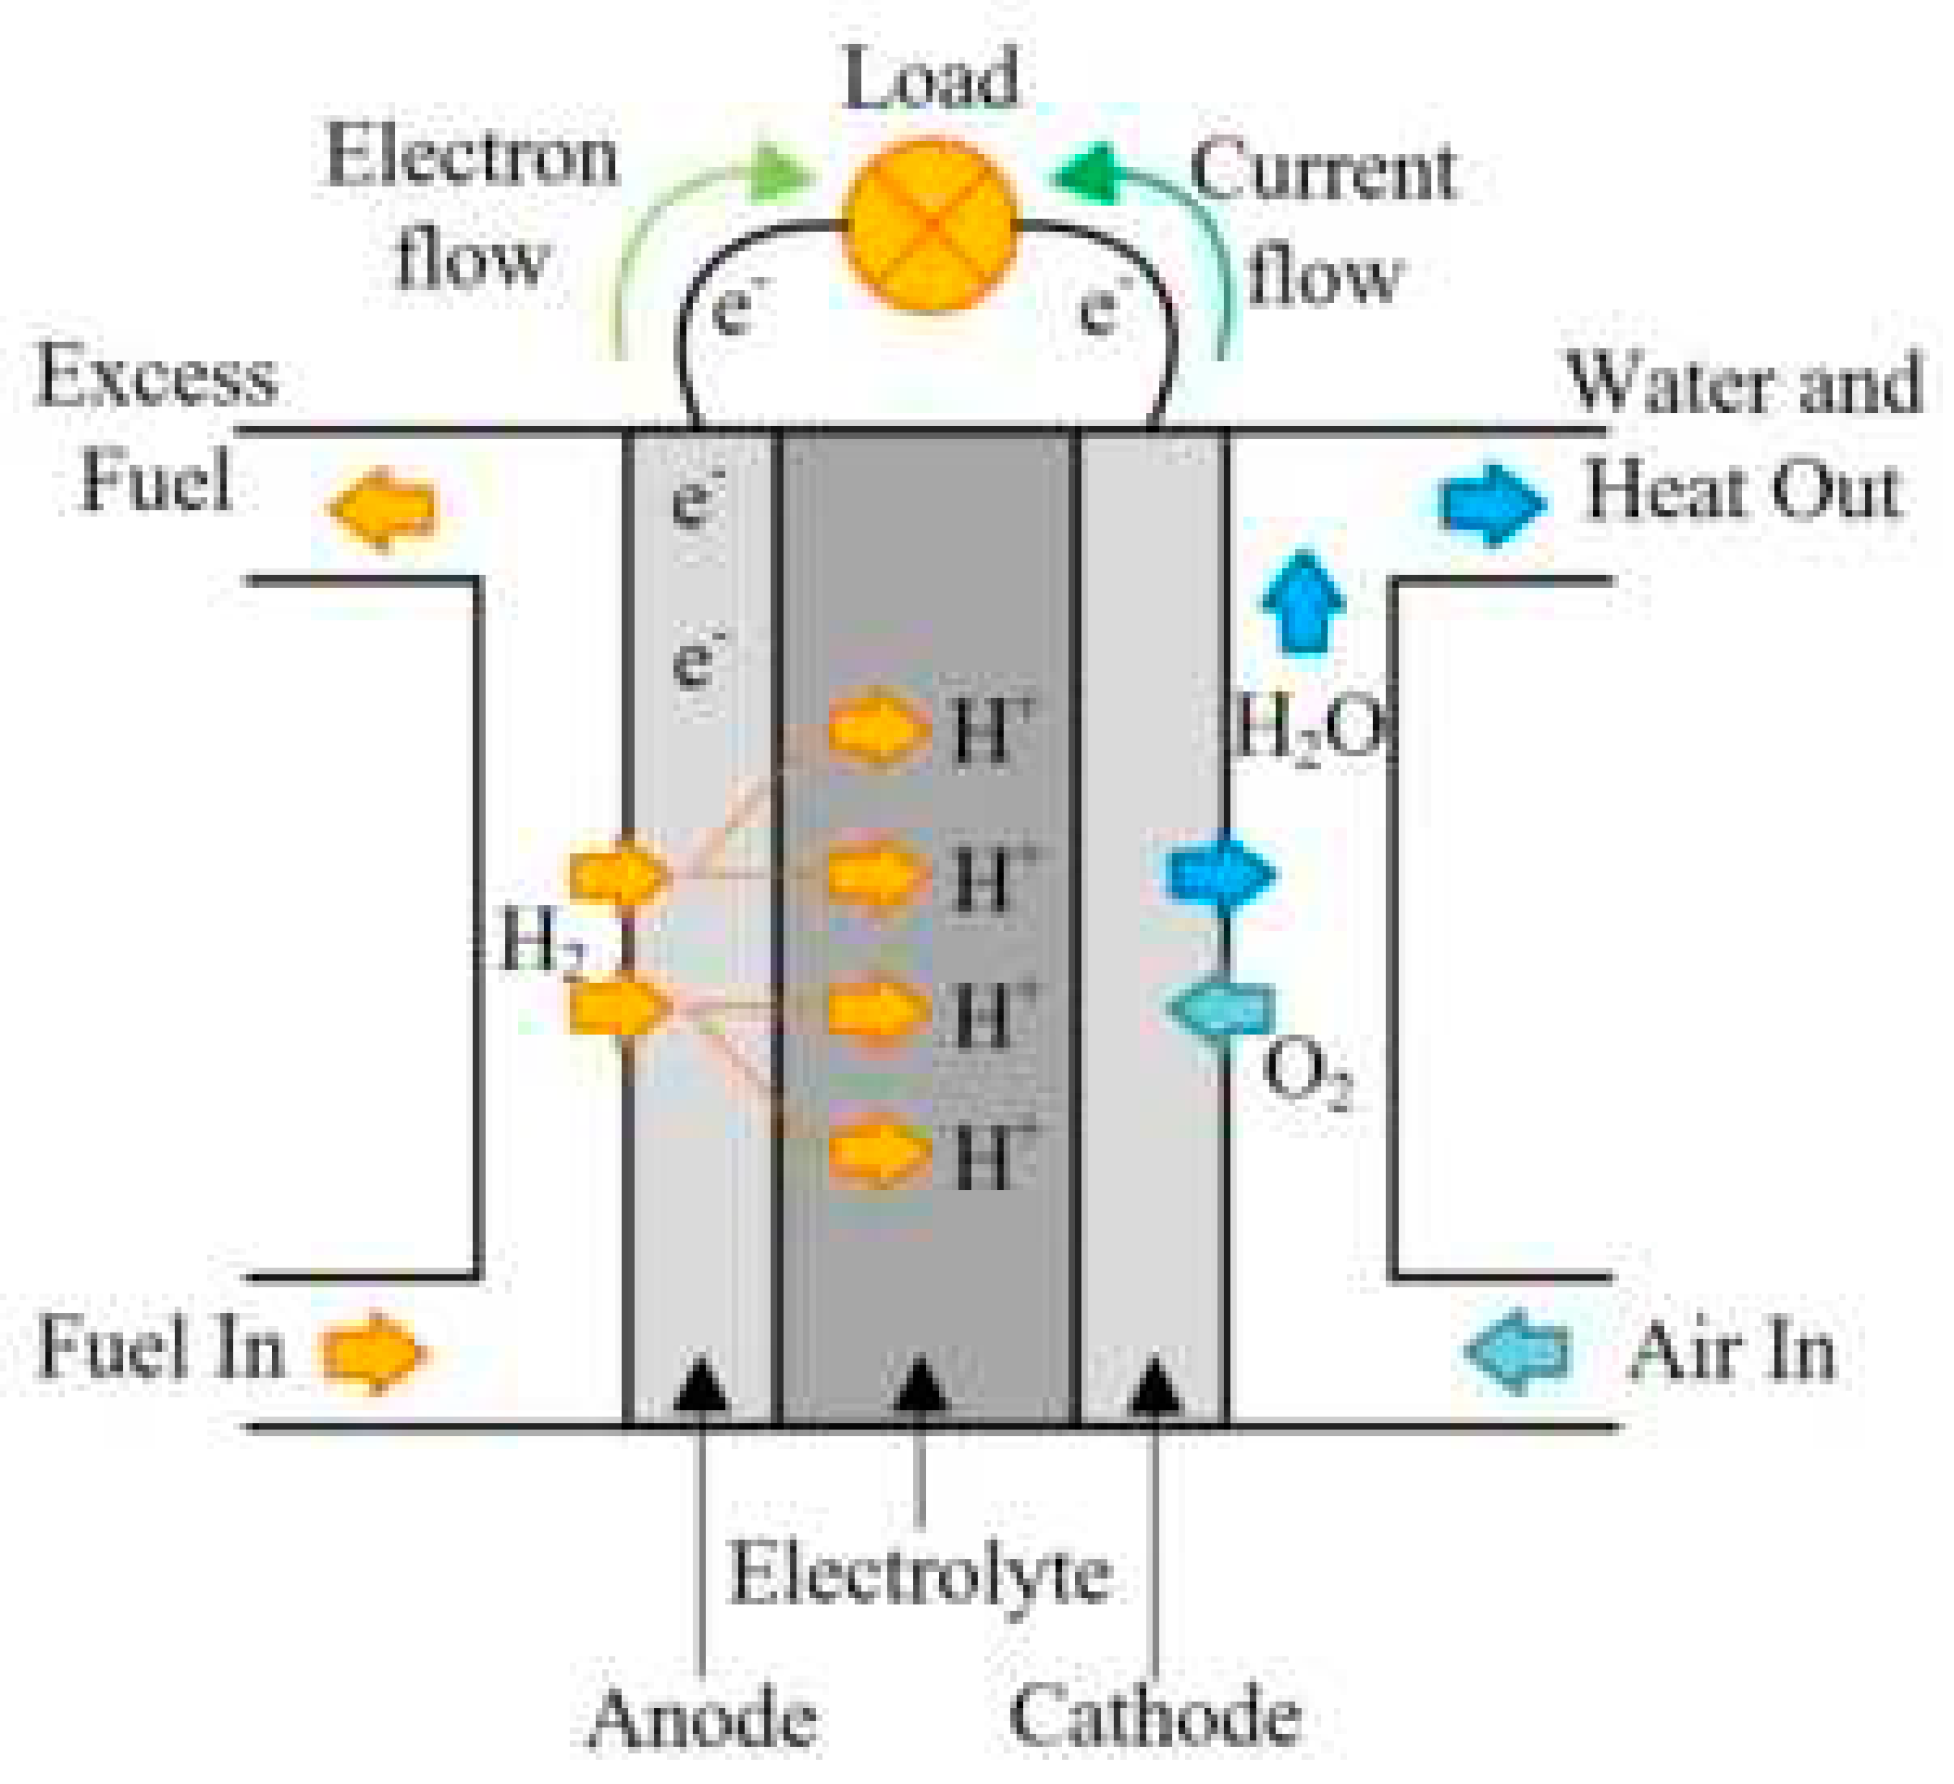
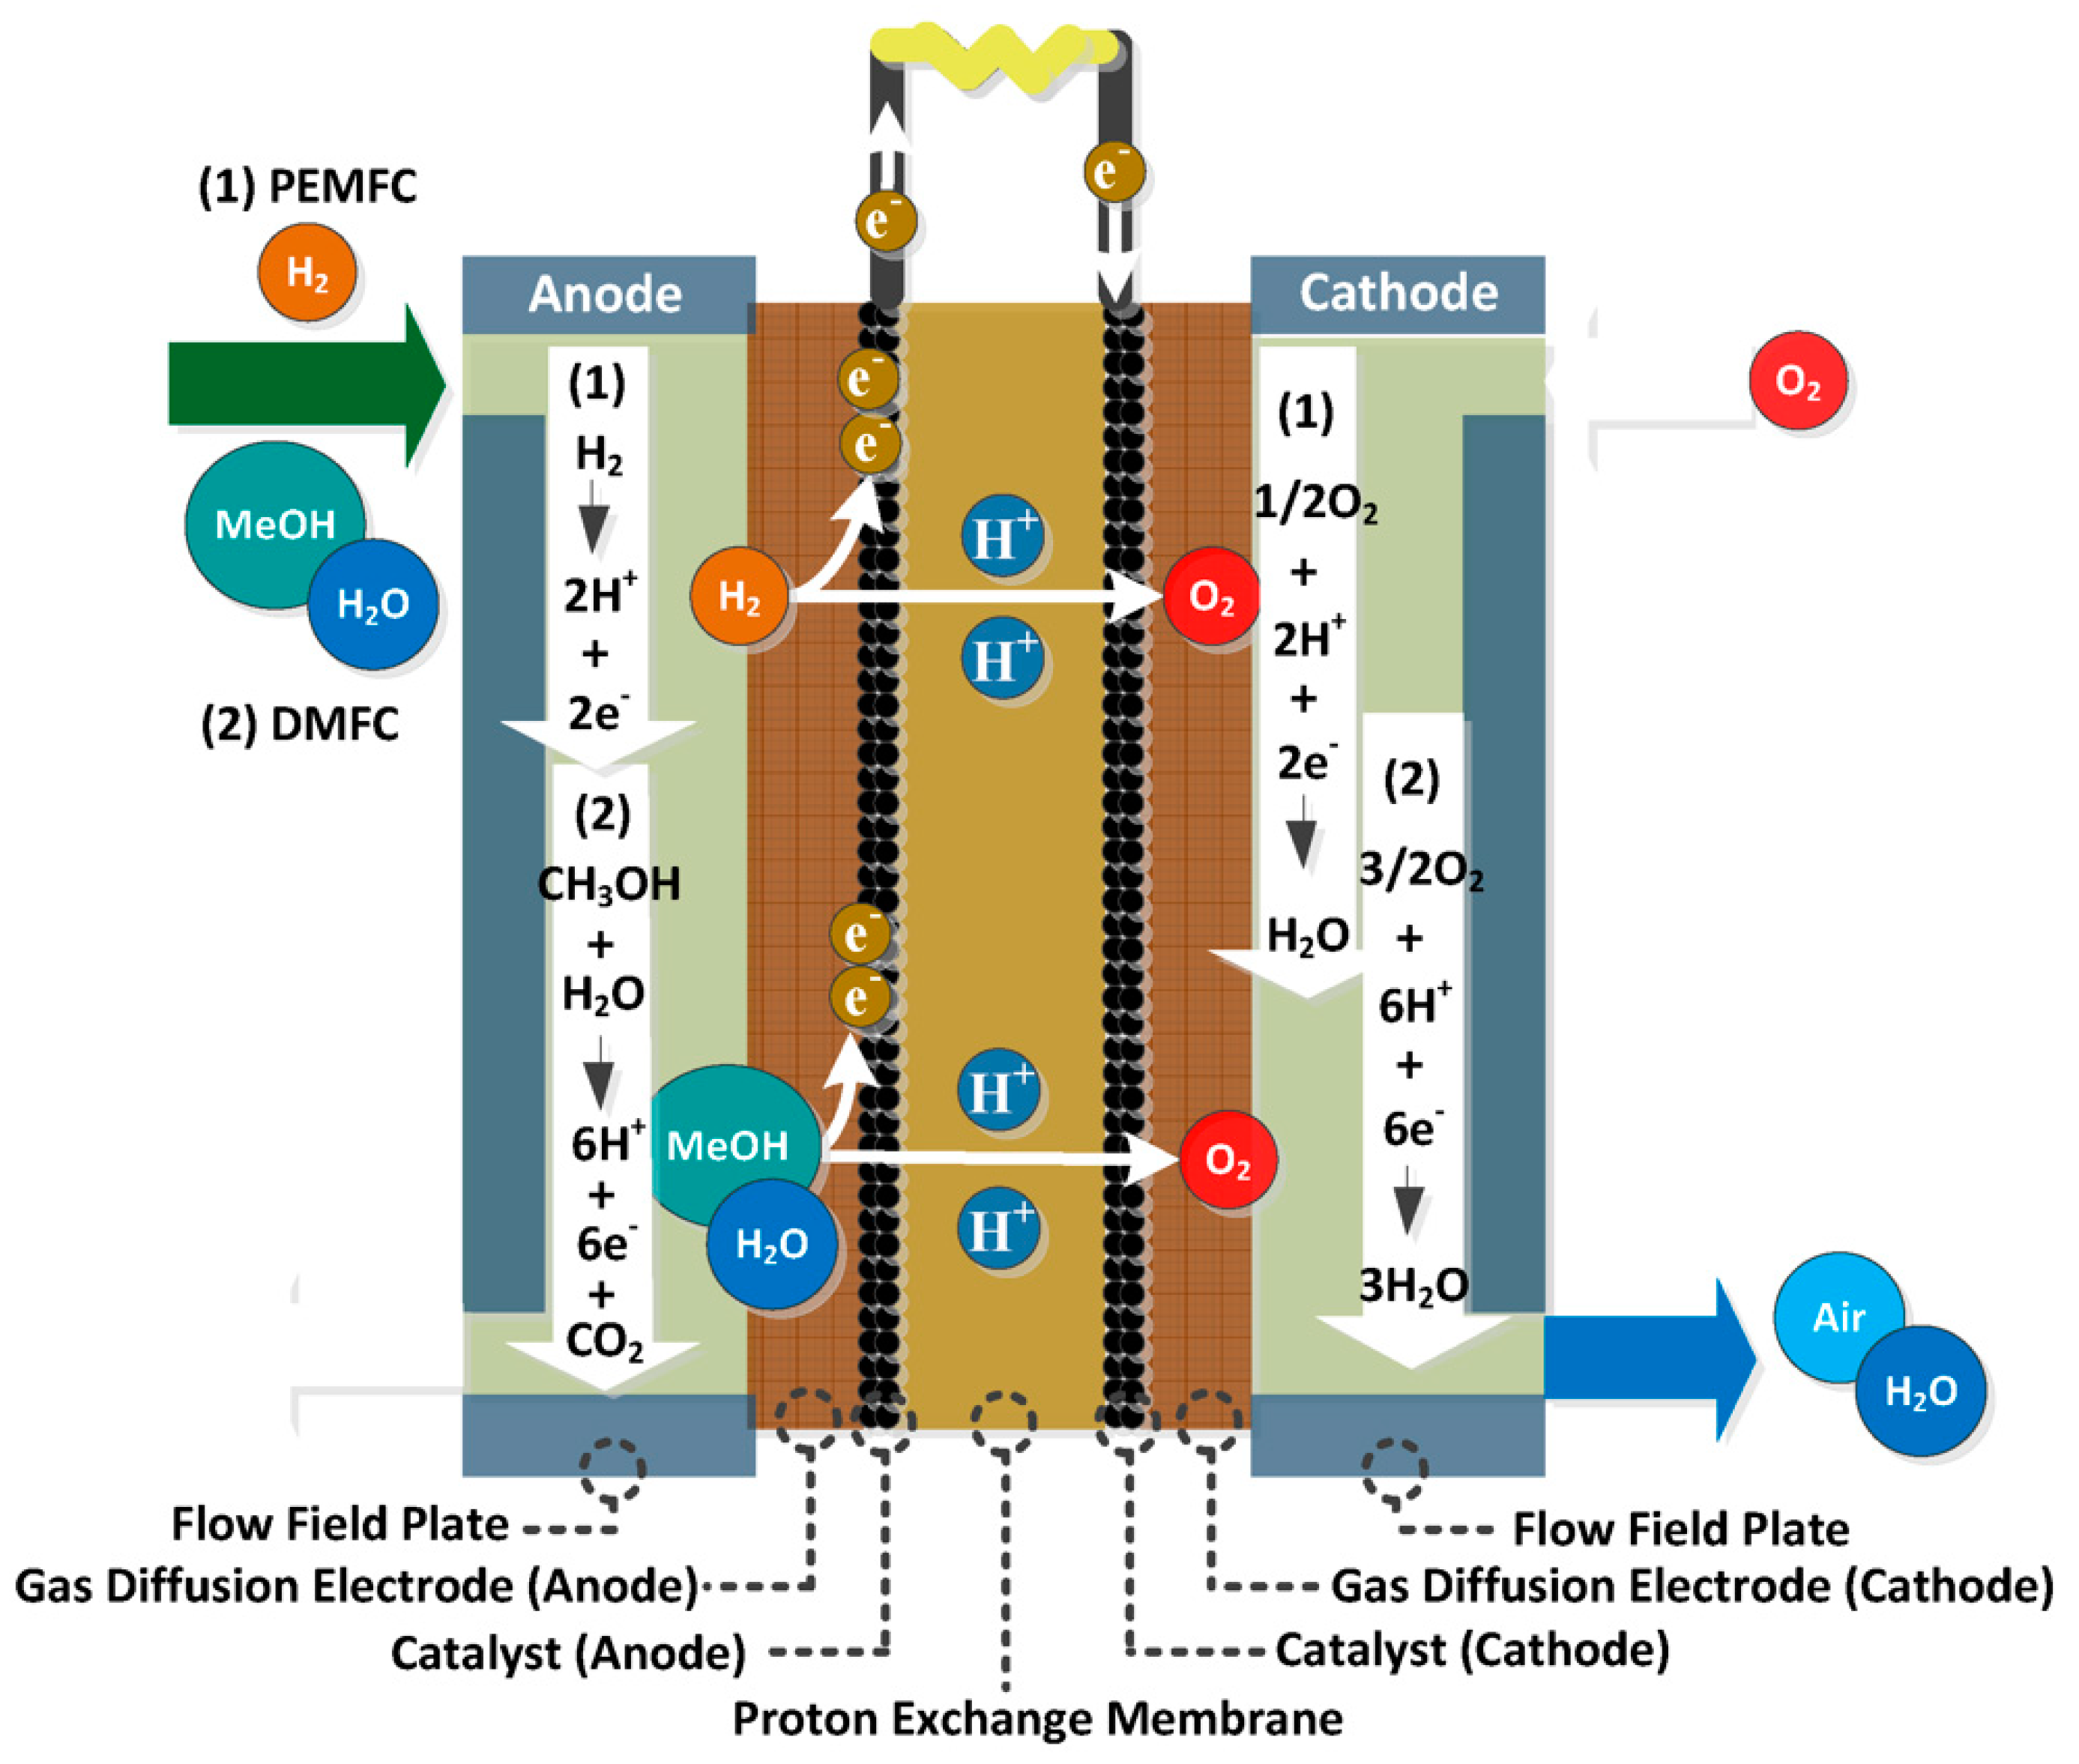
Fuel cells are basically electrochemical batteries that can convert hydrogen and oxygen to electricity. Unlike the batteries they do not need to be charged or run out, fuel cells continue to produce electricity as long as fuel is supplied. Fuel cells contains mainly 3 parts anodic electrode where oxidation reaction happens, electrolyte where the transfer of the ions happens trough the two half cells this part also responsible from preventing from transfer of fuels and electron directly so the electrons can only go from the external circuit and electricity can be produced. And in the cathode part where reduction happens and where exhaust or by-product generated if the fuel in the case is hydrogen and oxygen exhaust would be water. A simple figure that shows the processes and parts of the fuel cell can be seen in Figure 2.1. Hydrogen enters the system in the anode turns into H+, released electron travels through external flow, hydrogen ion goes through the electrolyte meets with O2 in the cathode and reacts and give H2O.
Figure 2.1.
Simple Fuel Cell Diagram [1].
Figure 2.1.
Simple Fuel Cell Diagram [1].
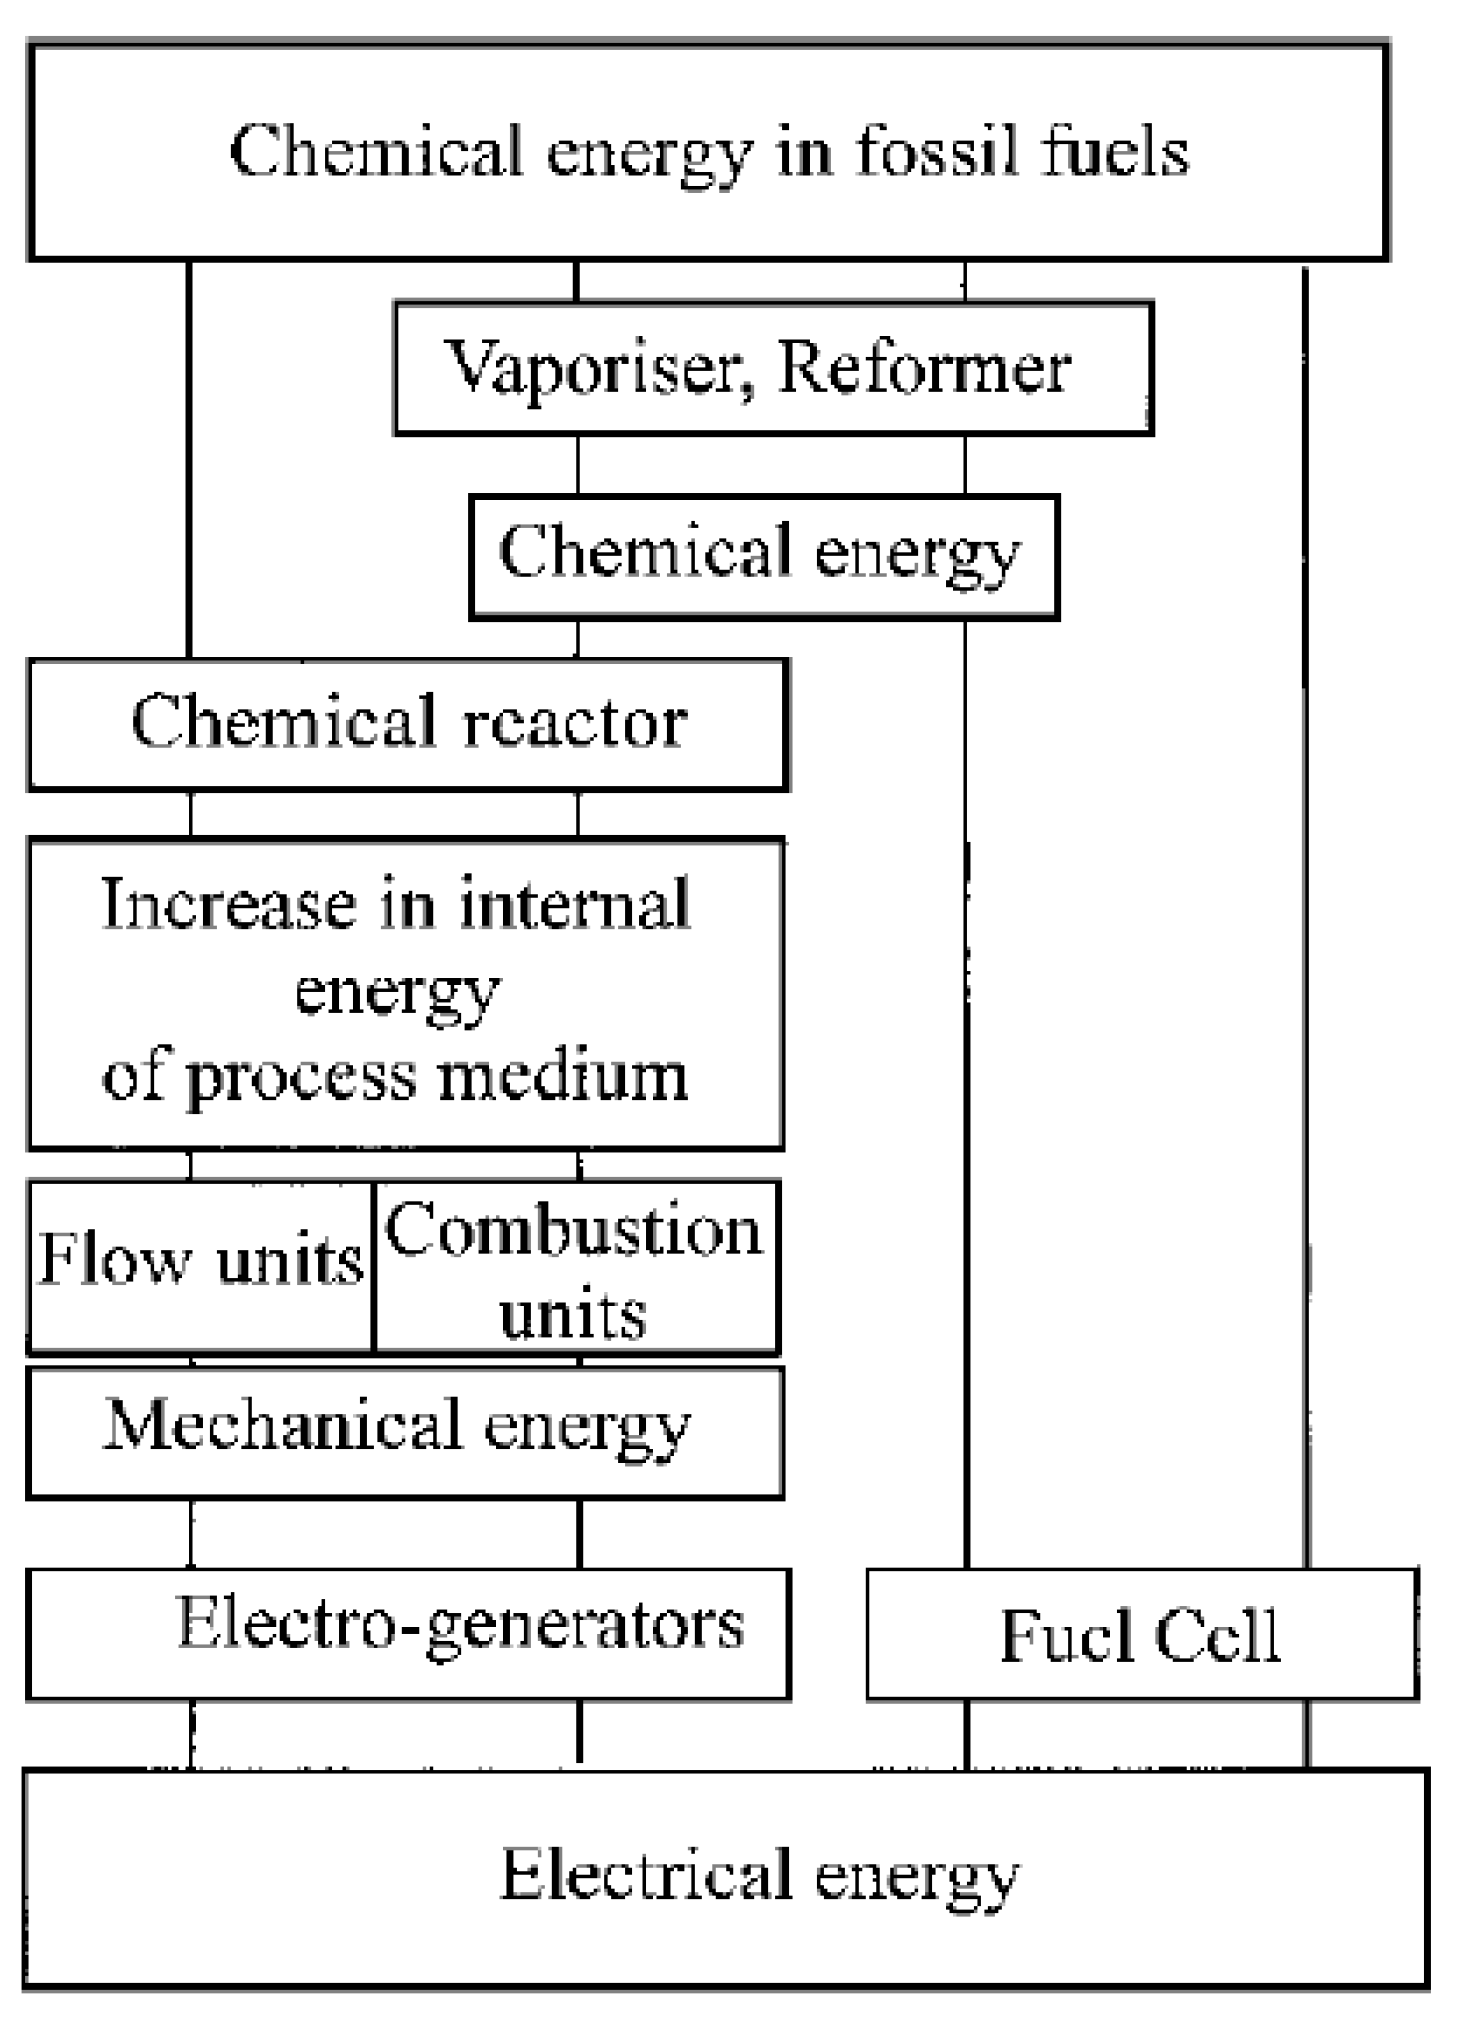
Also considering internal combustion engines (ICE) or any traditional energy conversion system there are always mechanical parts, moving parts, and a lot of different conversion happens in the system continuously. This can also be seen from Figure 2.2 clearly for the ICE after fuel is taken into the system there are lots of different processes, which also affects the maximum efficiency of system too.
Figure 2.2.
Comparison of the processes involved in an ICE and a fuel cell (Carrette et al., 2000).
Figure 2.2.
Comparison of the processes involved in an ICE and a fuel cell (Carrette et al., 2000).
As ICE will rise in the temperature while working which leads to the expansion of the gasses then this expansion is converted the mechanical work after this point this mechanical work have to take to electro-generators which again causes another decrease in the efficiency as it has lots of moving parts. The maximum efficiency of the ICE is known as Carnot efficiency and depended on a lot of factors and another drawback system cannot work in one cycle and clearly bounded by the thermodynamic rules. But for the Fuel Cell case it is far clearer, and it has only one step conversion from chemical energy to directly electrical energy, and having no moving part prevents any losses from fraction of the system. The environment is also clearly an important topic in energy systems today. As climate change is an important problem for all the humanity so all the world is trying to move from carbon emitting energy choices to more environmentally friendly choices. In these part fuel cells also have the upper hand as it only gives water as a by-product. But in this step, it becomes important how the hydrogen is produced in the fuel cells. Hydrogen is the most abundant element in the universe, making up approximately 75% of all matter (Baykara, 2018).
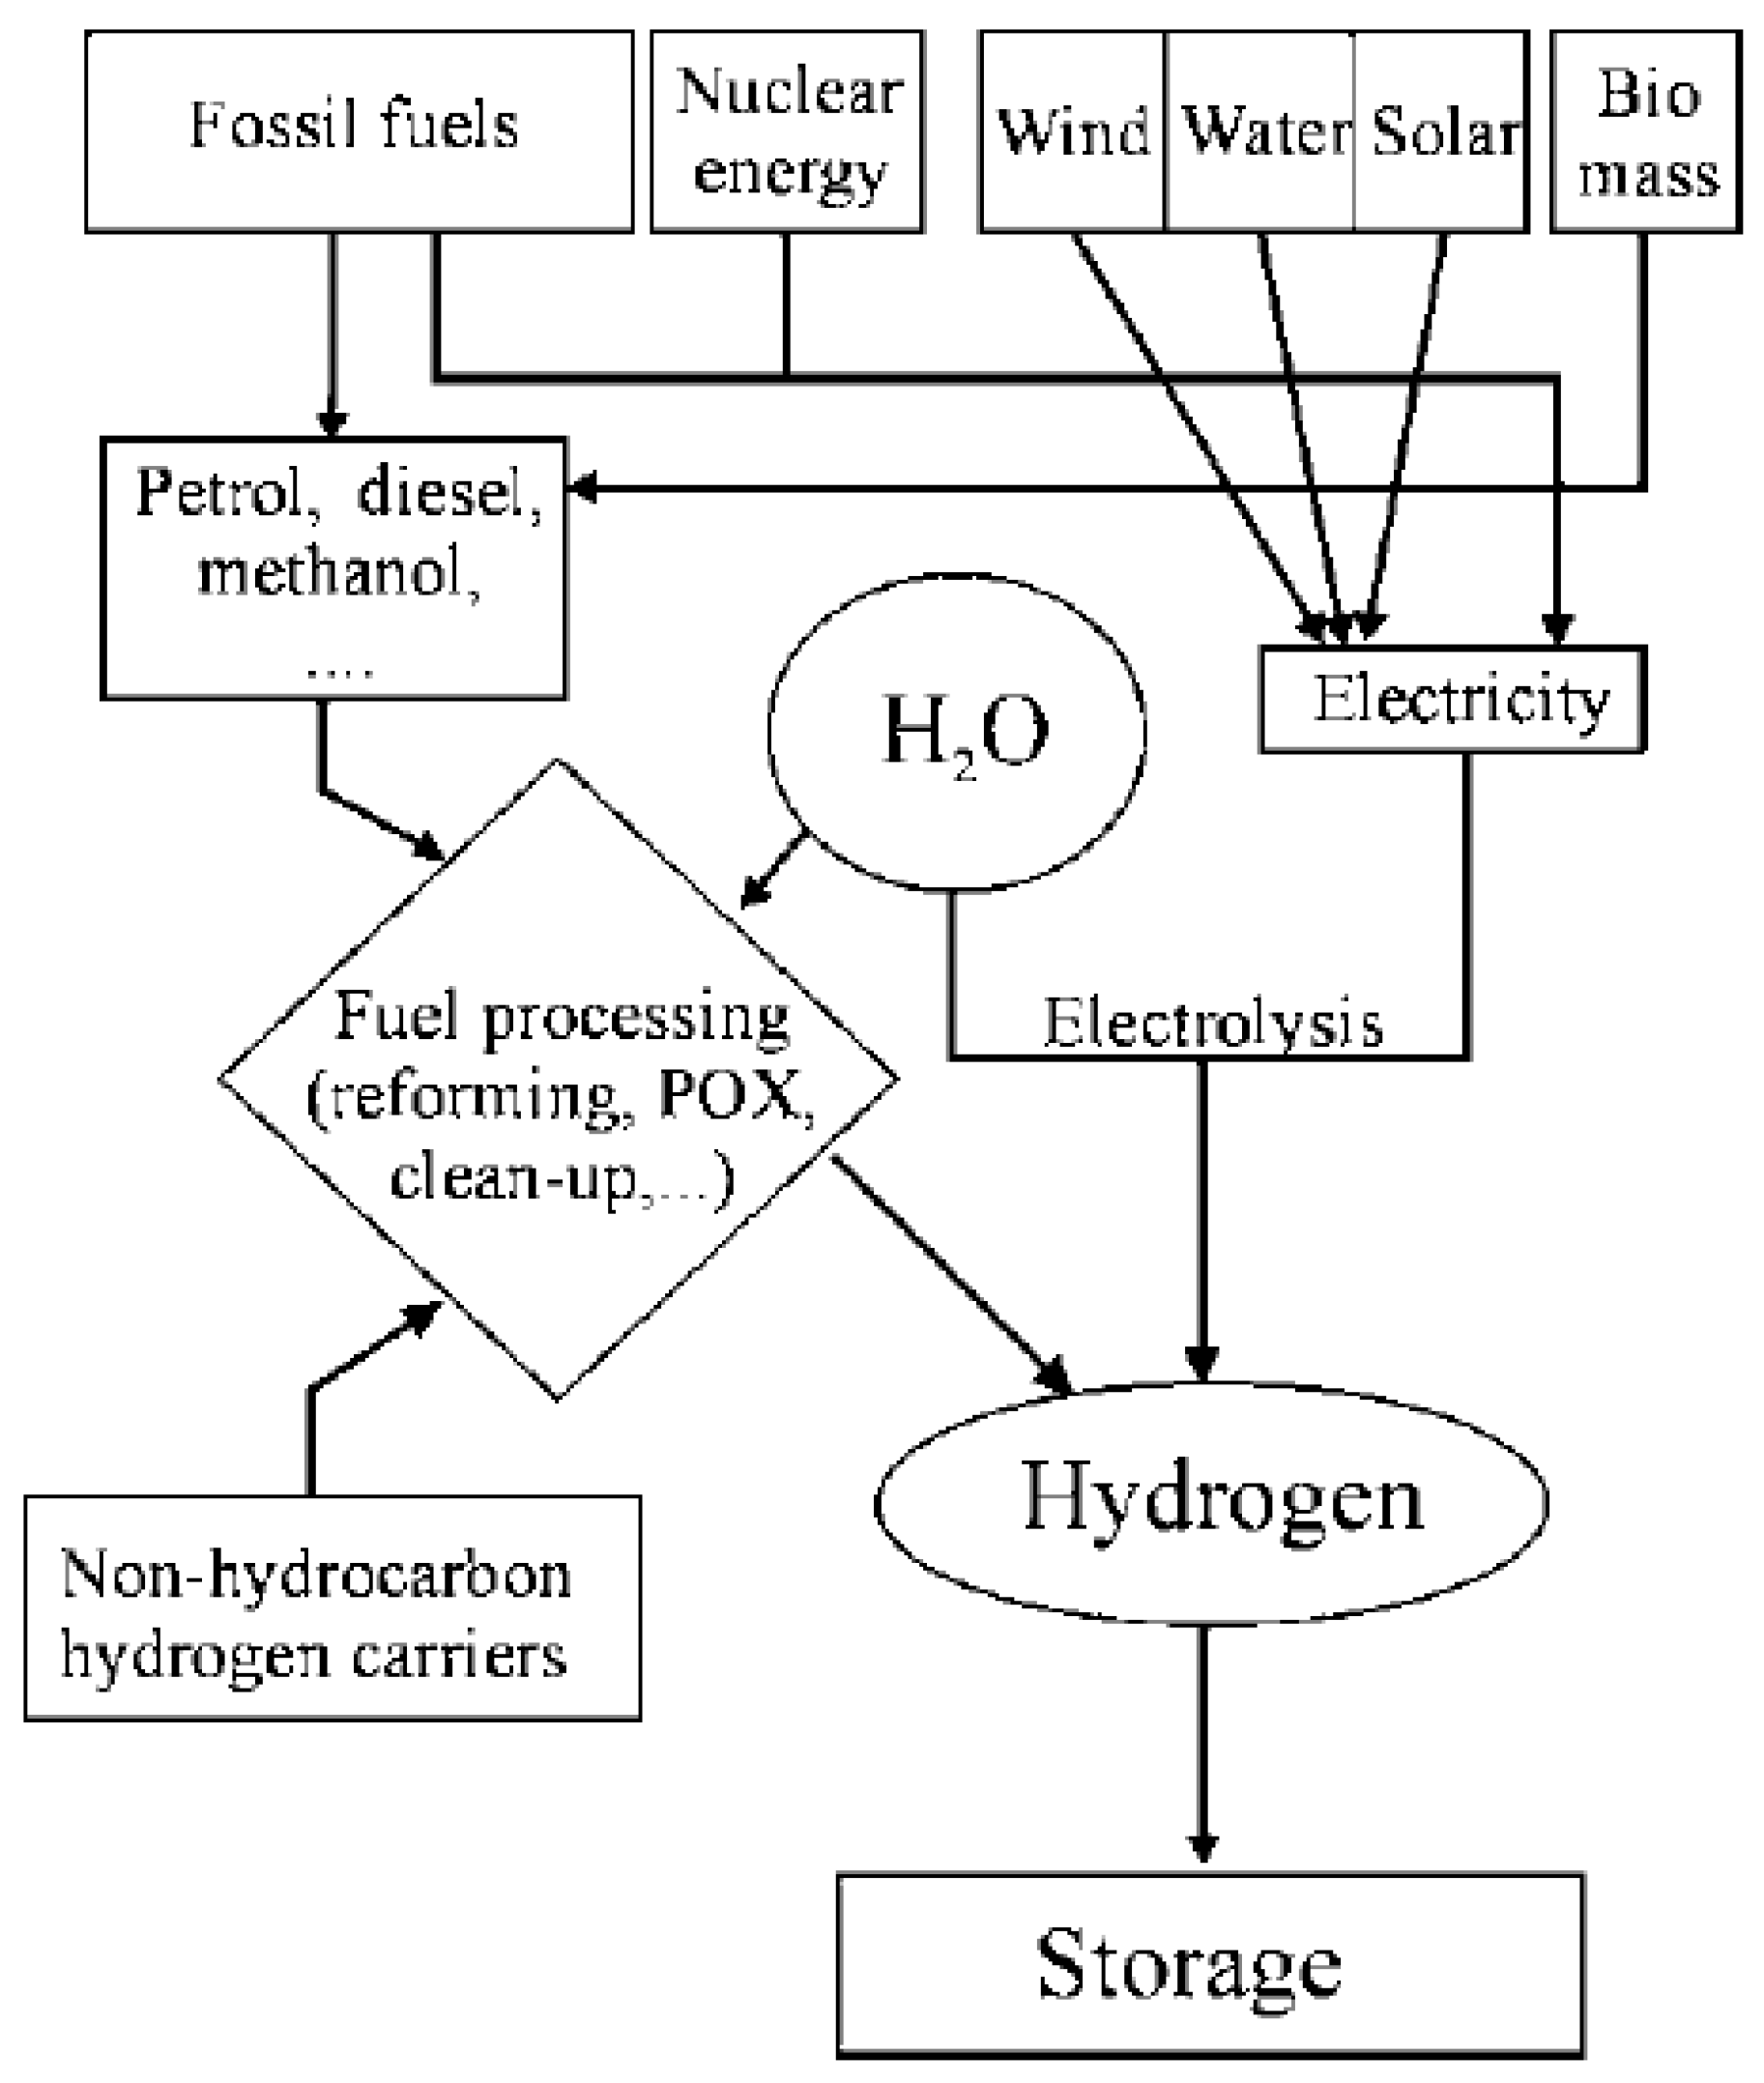
Hydrogen can be produced by different methods using coal, natural gas, hydrocarbons, electrolysis which can be seen in Figure 2.3. As long as the production methods include CO2 emission it is still not a carbon free energy source. So, to use environmental benefits of the fuel cells hydrogen should be also produced using carbon-free sources like solar or wind power. It could be seen unnecessary converting electricity produced using renewable sources to hydrogen and converting it back to electricity using fuel cells in the first look but as mentioned before hydrogen here is mostly an energy carrier rather than source itself. It solves the problem of renewable energy sources being time and condition depending. For example, solar power directly depends on the weather and cannot produce electricity at night so storage hydrogen can help a secure and continues power for all time. Also, it can be used for not only stationary power needs but can be used for transportation needs like cars, buses etc. And like bigger transported power needs like festivals camps etc. if hydrogen source could be transported also. And it is important to mention space travel as it is one of the main things that make fuel cells popular in the first place as they had important role in the Apollo mission as fuel cells produced both electricity and water of the space shuttles.
Figure 2.3.
The different pathways of hydrogen production (Carrette et al., 2000).
Figure 2.3.
The different pathways of hydrogen production (Carrette et al., 2000).
2.1. History of Fuel Cells
There are some different sources showing first discovery of fuel cells principals to Christian Friedrich Schönbein or Sir William Robert Grove which both worked around almost same time around 1838. And had a little rivalry going on starting from who first discovered principles of the fuel cells first. Grove discovered that by immersing two platinum electrodes on one end in a solution of sulfuric acid and the other two ends separately sealed in containers of oxygen and hydrogen, a constant current was found to be flowing between the electrodes (Andújar & Segura, 2009). n 1893, Friedrich Wilhelm Ostwald, considered the founder of the chemistry–physics, experimentally determined the interconnection of various components of a fuel cell: electrodes, electrolyte, oxidizing and reducing agents, anions, and cations (Boudghene Stambouli & Traversa, 2002). Throughout the 19th century and 20th century research are made by lots of different research but most of them done from scientific interest point especially considering abundance and chap oil, coal sources and no interest in environmental impact as harms of fossil fuels at that time was not considered or know much. This continued until the space missions as it was perfect solution for shuttles both water and electricity need. At the end of the 1950s NASA developed fuel cells for space missions: Willard Thomas Grubb and Leonard Niedrach designed the first Polymer Electrolyte Membrane Fuel Cell, used by NASA in Gemini space program, while a 1.5 kW Alkali Fuel Cell has been used in Apollo space missions, providing the astronauts both power and drinking water; later, a 12 kW AFC has been used in space shuttle (Lucia, 2014). In the 21st century fuel cells technology started to commercialize and started to become accessible to people even though it needs still a lot of development. Lots of tries made specially in the car industry around 2007-2008 years a lot of different models produced working with fuel cells and hybrid models even tough cars were working price and accessibility of hydrogen were big problems.
2.2. Types of Fuel Cells
Fuel cells are mostly named by their electrolyte type or their fuel type and in some cases by their working temperature.
In Table 2.1 and Table 2.2 can be seen different types of properties of the different types of fuel cells. They have different and unique properties which leads to suitability for different kinds of applications in the field. There are some main distinctions like start-up time, portability, capacity, temperature range, work time, fuel type, sensibility to impurities, and of course price plays important role in the choosing the suitable type of the cell for suitable applications. But it should not be forgotten that in most cases fuel cells are not the only alternative, so these parameters are also looked for other types of energy sources and with the current situation of the fuel cells they are not chosen in most scenarios. The potential of fuel cells can be seen from today, but they have a long way to go and hopefully will overcome the challenges today seen with the help of the extensive research going on the topic.
Table 2.1.
Comparison table of different fuel cell types [3].
Table 2.1.
Comparison table of different fuel cell types [3].
| Fuel Cell Type |
Common Electrolyte |
Operating Temperature |
Electrical Efficiency (LHV) |
Applications |
| Polymer electrolyte membrane (PEM) |
Perfluorosulfonic acid |
<120°C |
60% direct H2; 40% reformed fuel |
• Backup power
Portable power
Distributed generation
Transportation
Specialty vehicles |
| Alkaline (AFC) |
Aqueous potassium hydroxide soaked in a porous matrix, or alkaline polymer membrane |
<100°C |
60% |
• Military
Space
Backup power
Transportation |
| Phosphoric acid (PAFC) |
Phosphoric acid soaked in a porous matrix or imbibed in a polymer membrane |
150°–200°C |
40% |
Distributed generation |
| Molten carbonate (MCFC) |
Molten lithium, sodium, and/or potassium carbonates, soaked in a porous matrix |
600°–700°C |
50% |
• Electric utility
Distributed generation |
| Solid oxide (SOFC) |
Yttria stabilized zirconia |
500°–1,000°C |
60% |
• Auxiliary power
Electric utility
Distributed generation |
Table 2.2.
Comparison of different types of fuel cell's advantages and challenges [3].
Table 2.2.
Comparison of different types of fuel cell's advantages and challenges [3].
| Fuel Cell Type |
Advantages |
Challenges |
| Polymer electrolyte membrane (PEM) |
• Solid electrolyte reduces corrosion and electrolyte management problems
Low temperature
Quick start-up and load following |
• Expensive catalysts
Sensitive to fuel impurities |
| Alkaline (AFC) |
• Wider range of stable materials allows lower cost components
Low temperature
Quick start-up |
• Sensitive to CO2 in fuel and air
Electrolyte management (aqueous)
Electrolyte conductivity (polymer) |
| Phosphoric acid (PAFC) |
• Suitable for CHP
Increased tolerance to fuel impurities |
• Expensive catalysts
Long start-up time
Sulfur sensitivity |
| Molten carbonate (MCFC) |
• High efficiency
Fuel flexibility
Suitable for CHP
Hybrid/gas turbine cycle |
• High temperature corrosion and breakdown of cell components
Long start-up time
Low power density |
| Solid oxide (SOFC) |
• High efficiency
Fuel flexibility
Solid electrolyte
Suitable for CHP
Hybrid/gas turbine cycle |
• High temperature corrosion and breakdown of cell components
Long start-up time
Limited number of shutdowns |
2.2.1. Alkaline fuel cells
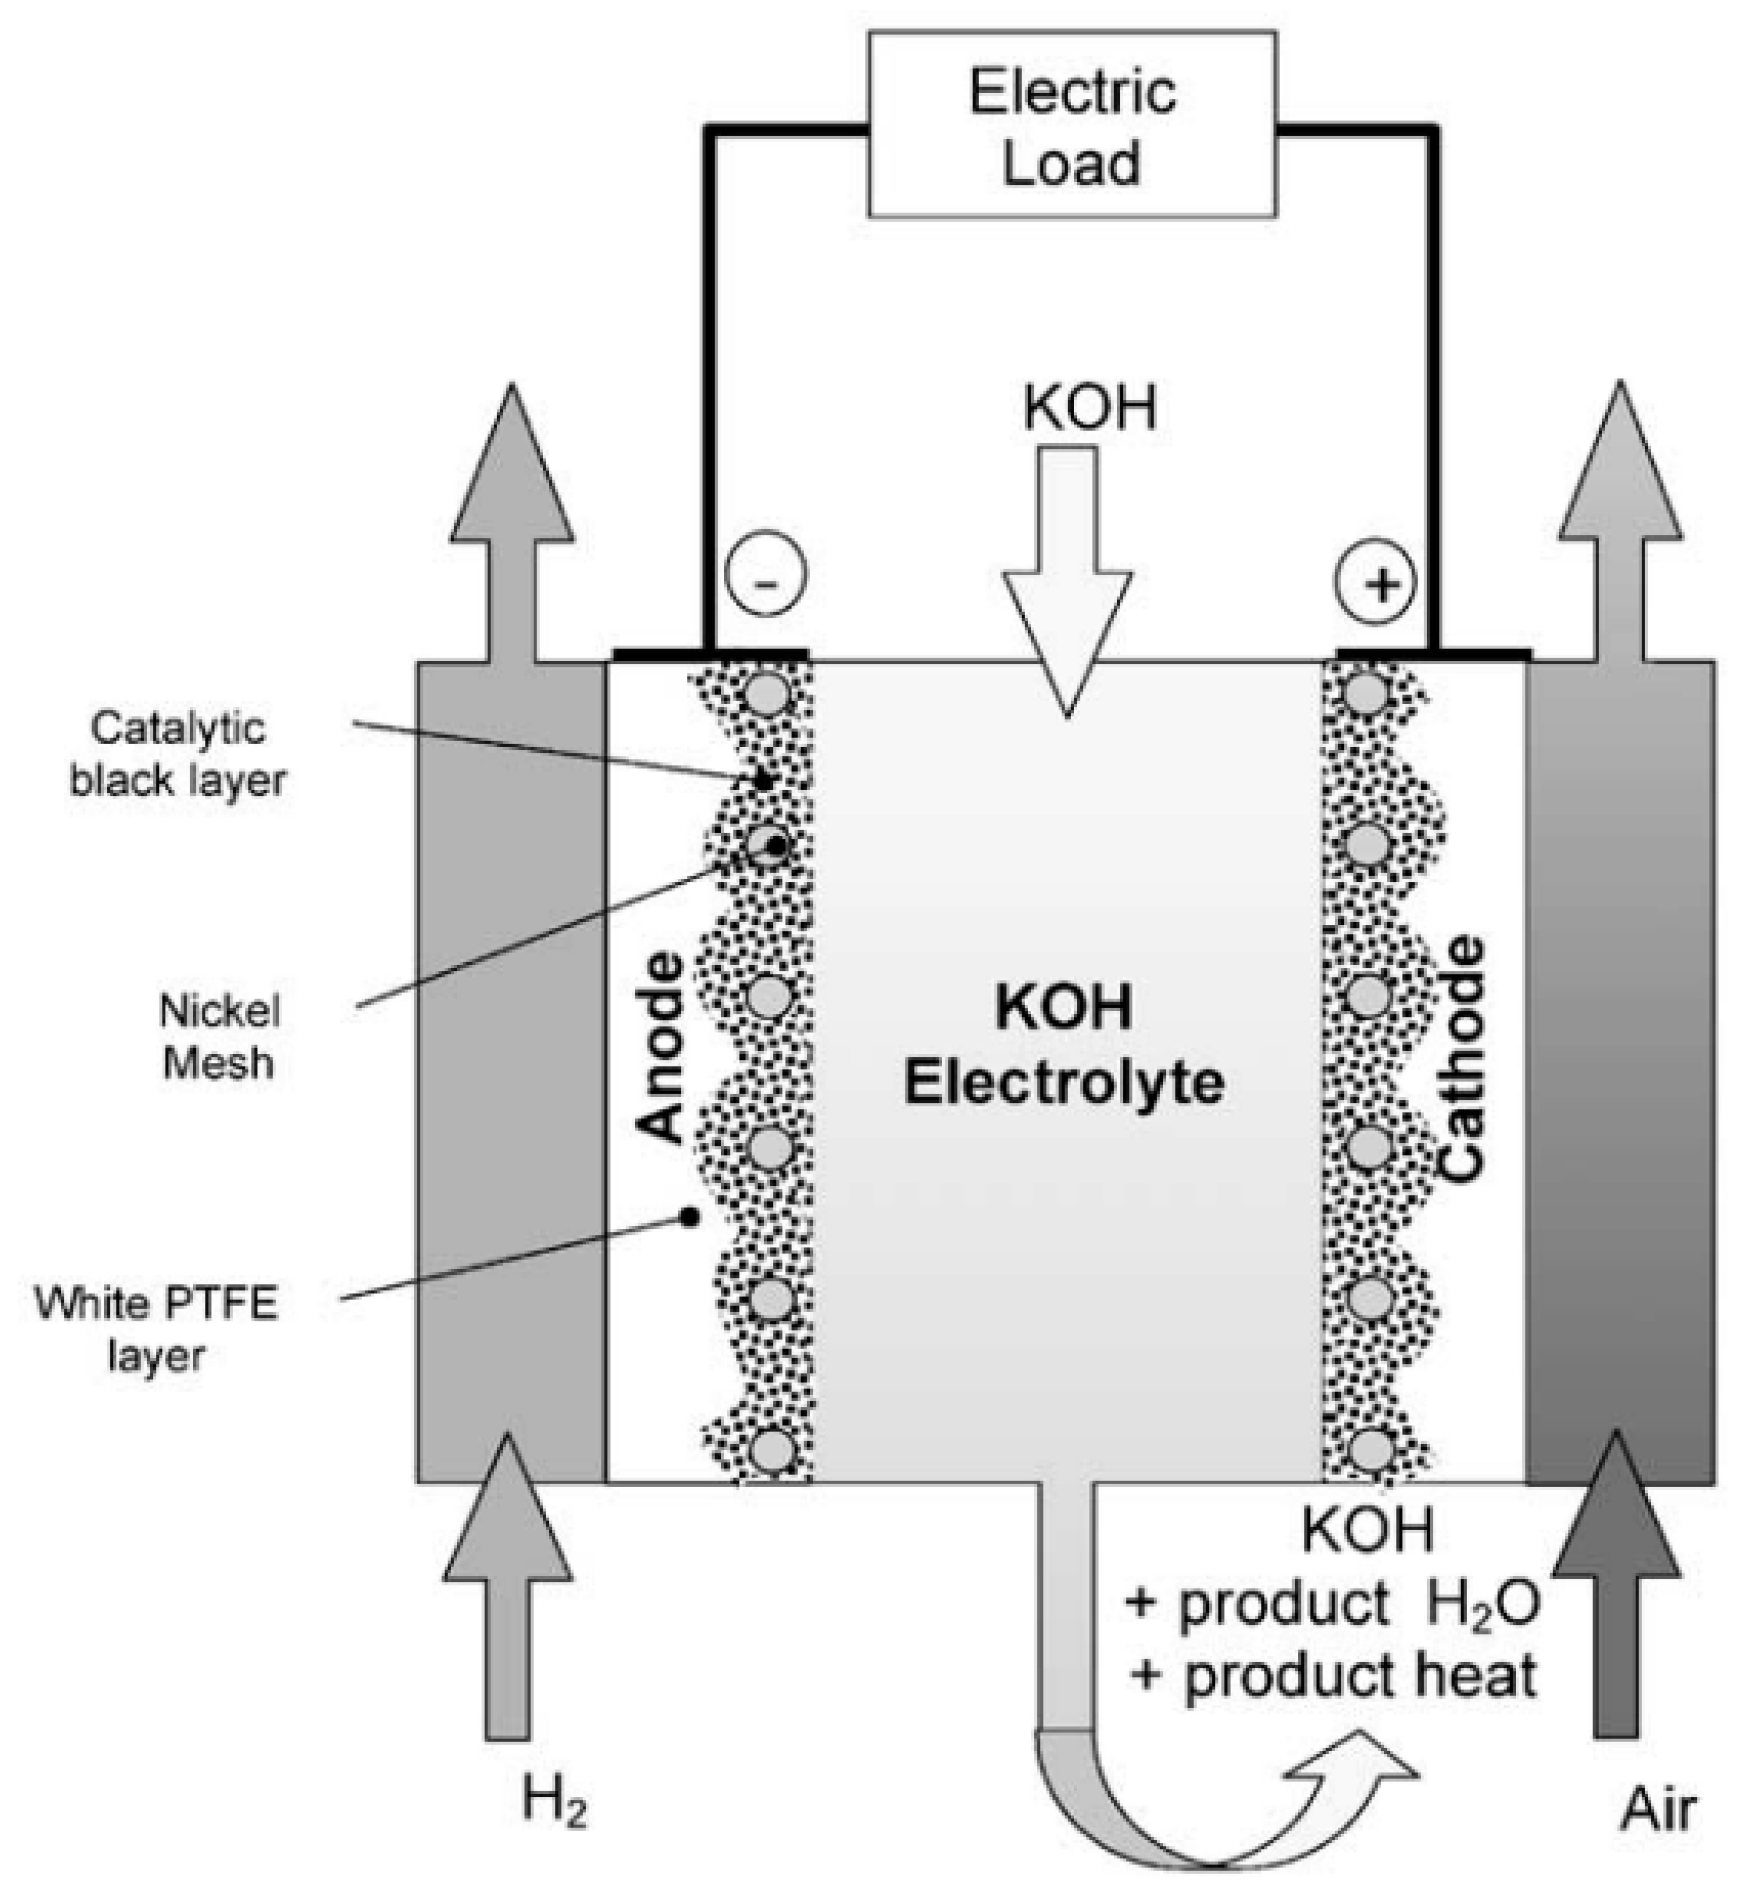
Figure 2.4.
Alkaline fuel cell diagram (McLean, 2002).
Figure 2.4.
Alkaline fuel cell diagram (McLean, 2002).
Alkaline fuel cells are the one of the first types of fuel cells that are used. Especially with the moon missions their popularity is increased, they had no moving parts, worked in high efficiency and for the moon missions even provided drinking water for the crew. But its popularity was not for long as the appearance of proton exchange membranes took the fame from the alkaline fuel cells. The reactions of the alkaline fuel cell can be seen in the below Equation 2.1,2.2 and 2.3.
Its name comes from electrolyte it uses KOH. It can be in different forms like gel-like materials, or direct KOH solutions witch around %30 concentration but one of the most preferable methods is circulating electrolyte. In the circulating electrolyte as it moves it gives a protection against the gas leakage from anode to cathode or vice versa, and same time it can help the fuel cell as it acts like a cooling liquid as it circulates trough the cell (Carrette et al., 2000).
One of the biggest advantages of alkaline fuel cells is it can use non-precious metals as catalyst which can reduce costs greatly. And one of the biggest problems of alkaline fuel cells is that alkaline fuel cells can easily be poisoned by the CO
2 in the environment. This happens due to potential reactions which are mentioned below (McLean, 2002).
Equation 2.4 and 2.5 can happen both at the same time or one by one.
2.2.2. Proton exchange membrane fuel cells
Proton exchange membrane fuel cells use polymer membranes as electrolytes which is the reason for the naming. Used proton exchange membrane has double use in the system both makes ionic transfer in the system or in this case lets protons transfer while preventing electrons from passing through, also prevents hydrogen and oxygen from passing through each other’s side and reducing the performance of the reaction. The reactions happening in the PEMFC can be seen in Equation 2.6,2.7, and 2.8.
Figure 2.5.
Diagram of proton exchange membrane fuel cell (Ye et al., 2012).
Figure 2.5.
Diagram of proton exchange membrane fuel cell (Ye et al., 2012).
PEMFC are quite useful for transportation solutions as they are lightweight, have high efficiency, can operate in lower temperatures compared to other fuel cells, and has high power density. Even some companies produced some hydrogen cars, but hydrogen storage and hydrogen power density problem are one of the main problems of preventing spread of this technology through the transportation sector. They can also be used in stationary power solutions. But as the especially due to expenses of membranes and platinum-based catalyst they are not still a commercially available choice. The proton exchange membrane prices can go up to %30 of the total cell and can be reason of some shortcomings which can lead to bad fuel cell performance (Sudhakar et al., 2018). One of the most problems coming from membranes can be maximization of proton conductivity and control of the water in the system as decrease in the water can lower the proton conductivity and increase of water can led to the flood of electrons.
Excessive research focused on the PEMFC is showing a great potential for future alternative green energy, as the problems based on need of precious metals, and different alternatives to new and cheaper polymer membranes are solved PEMFC can be a future energy trend.
2.2.3. Direct methanol fuel cells
Direct methanol fuel cells use methanol as fuel instead of hydrogen or high concentration hydrogen mixture gases. It can be accepted as sub type of the proton exchange membrane as it uses PEM as electrolyte same as the PEMFCs only difference being the using methanol as fuel. The reactions taking place in the direct methanol fuel cells can be seen below in Equation 2.9, 2.10 and 2.11.
Which can be seen unlike the other types of fuel cells as the fuel contains carbon the byproduct will be CO2 which is only water in the other cases. But using methanol solves the problems faced by the PEMFC by usage of hydrogen due to hydrogen storage and hydrogen density problems. As the proton conductivity of electrolyte or polymer membrane plays a big role in the efficiency of the DMFC, only acidic polymer membranes can be used in DMFCs. It also helps with the emission of carbon dioxide. But still commercialization of the DMFCs is long way ahead the same methanol crossover, swelling, limited operation temperatures and like every other fuel cell high costs.
2.2.4. Phosphoric acid fuel cells
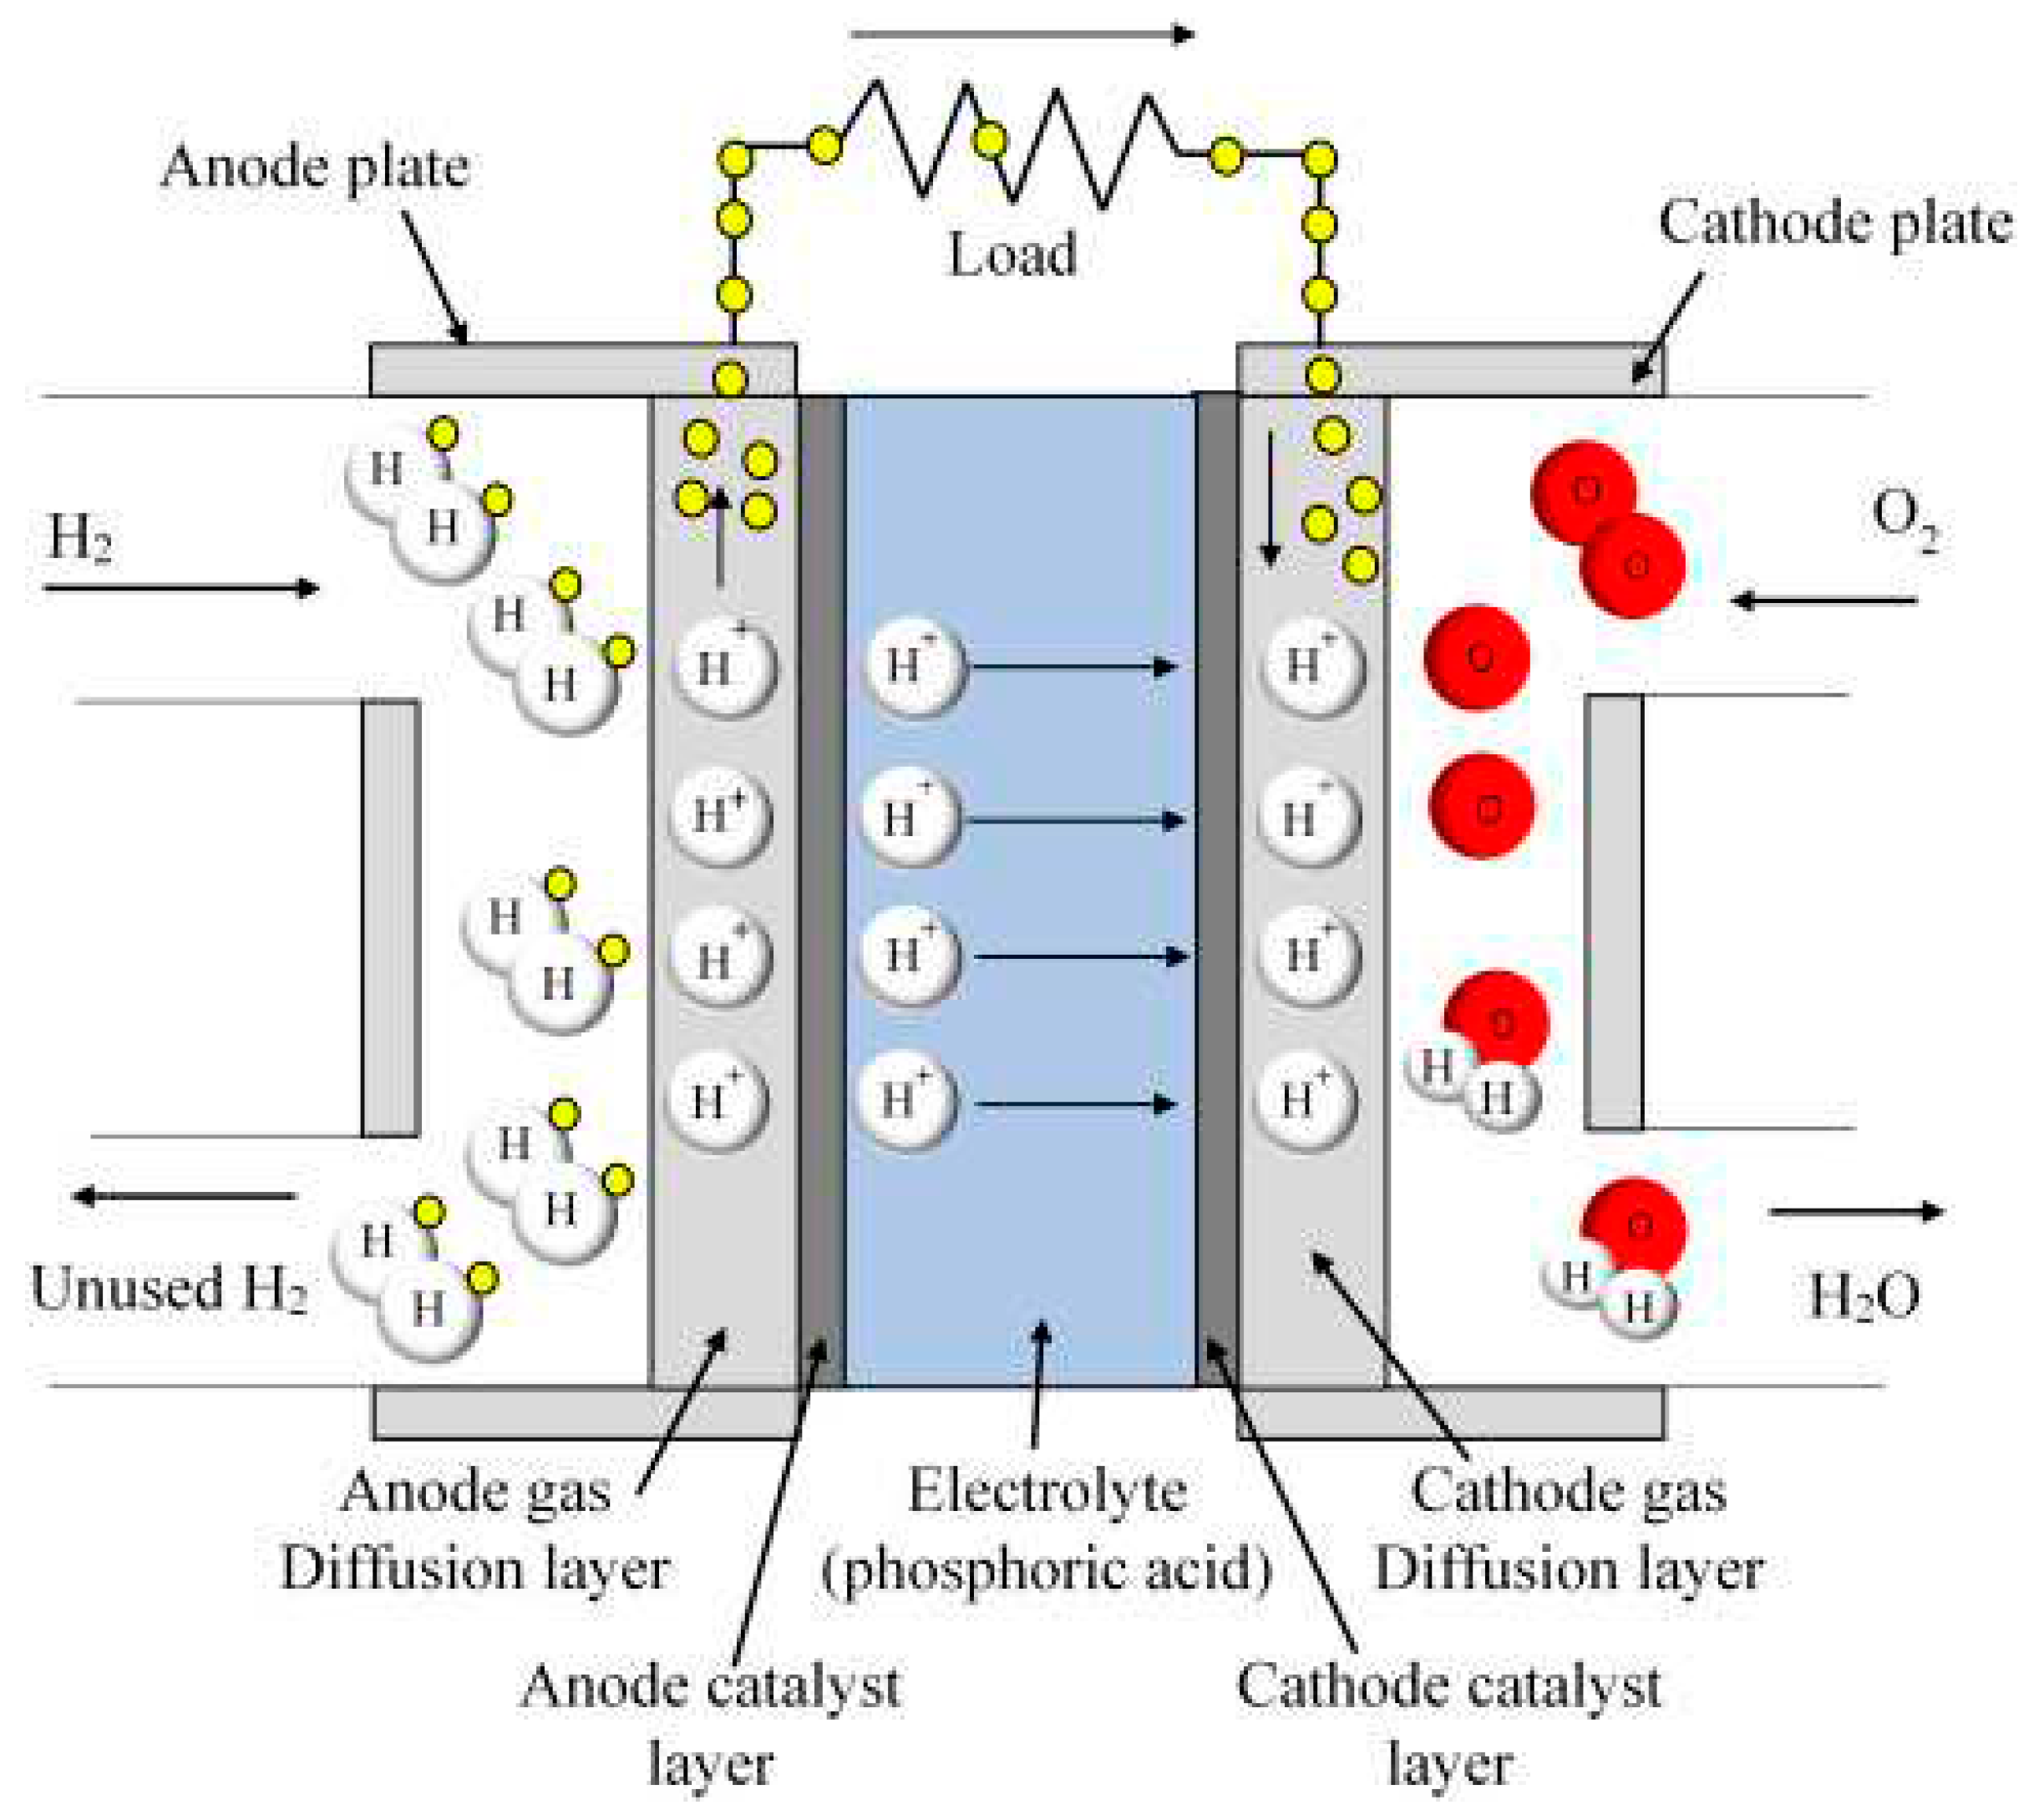
Phosphoric acid fuel cells are especially beneficial for stationary energy needs, combined heat, and power (CHP) generation systems. They are mostly used in big capacities and their efficiency is only a little higher than the traditional fossil fuel-based energy conversion methods if they are only used for electricity production but if they are used in CHP system their efficiency goes up to almost %85. They can be built in places like hospitals, hotels, and shopping malls for optimum use as this type of system is generally suitable for CHP systems already. The reactions for the phosphoric acid fuel cells are exactly the same as the PEMFC reactions and can be seen in the Equation 2.9, 2.10, and 2.11. Of course, cathode reactions are a little faster in the phosphoric acid fuel cells due to increased temperature conditions relative to PEMFC.
Figure 2.6.
Diagram of the phosphoric acid fuel cell (Kamran, 2021).
Figure 2.6.
Diagram of the phosphoric acid fuel cell (Kamran, 2021).
Phosphoric acid fuel cells use phosphoric acid as electrolytes of the fuel cell as it can understood from the name itself. Concentration of the H3PO4 is generally bigger than %90 in new cells but in the development phase of phosphoric acid fuel cells to prevent any corrosion of acid it was used in much lower concentrations. But with the increased concentration the ion conductivity is improved greatly which increases the efficiency of the cell. And generally, electrolyte of the H3PO4 used in stabilized forms like Silicon carbide (SiC) matrixes or in polymer membrane matrixes.
One of the biggest advantages of phosphoric acid fuel cells is that they are resistance to impurities in the fuel cells and carbon dioxide poisoning. Even work under CO environment until %1.5 carbon monoxide concentration (Sudhakar et al., 2018). Tolerability of carbon monoxide and carbon dioxide allows the use of gases made from coal, biogas, natural gas, and hydrogen produced from steaming of organic fuels like hydrocarbons can be used.
One of the biggest disadvantages comes from the catalyst and electrode part as it uses Pt with porous carbon as base and as the fuel cell itself is generally in big capacities it needs bigger amounts of catalyst. Which can lead to big production costs and operation costs.
2.2.5. Solid oxide fuel cells
Figure 2.7.
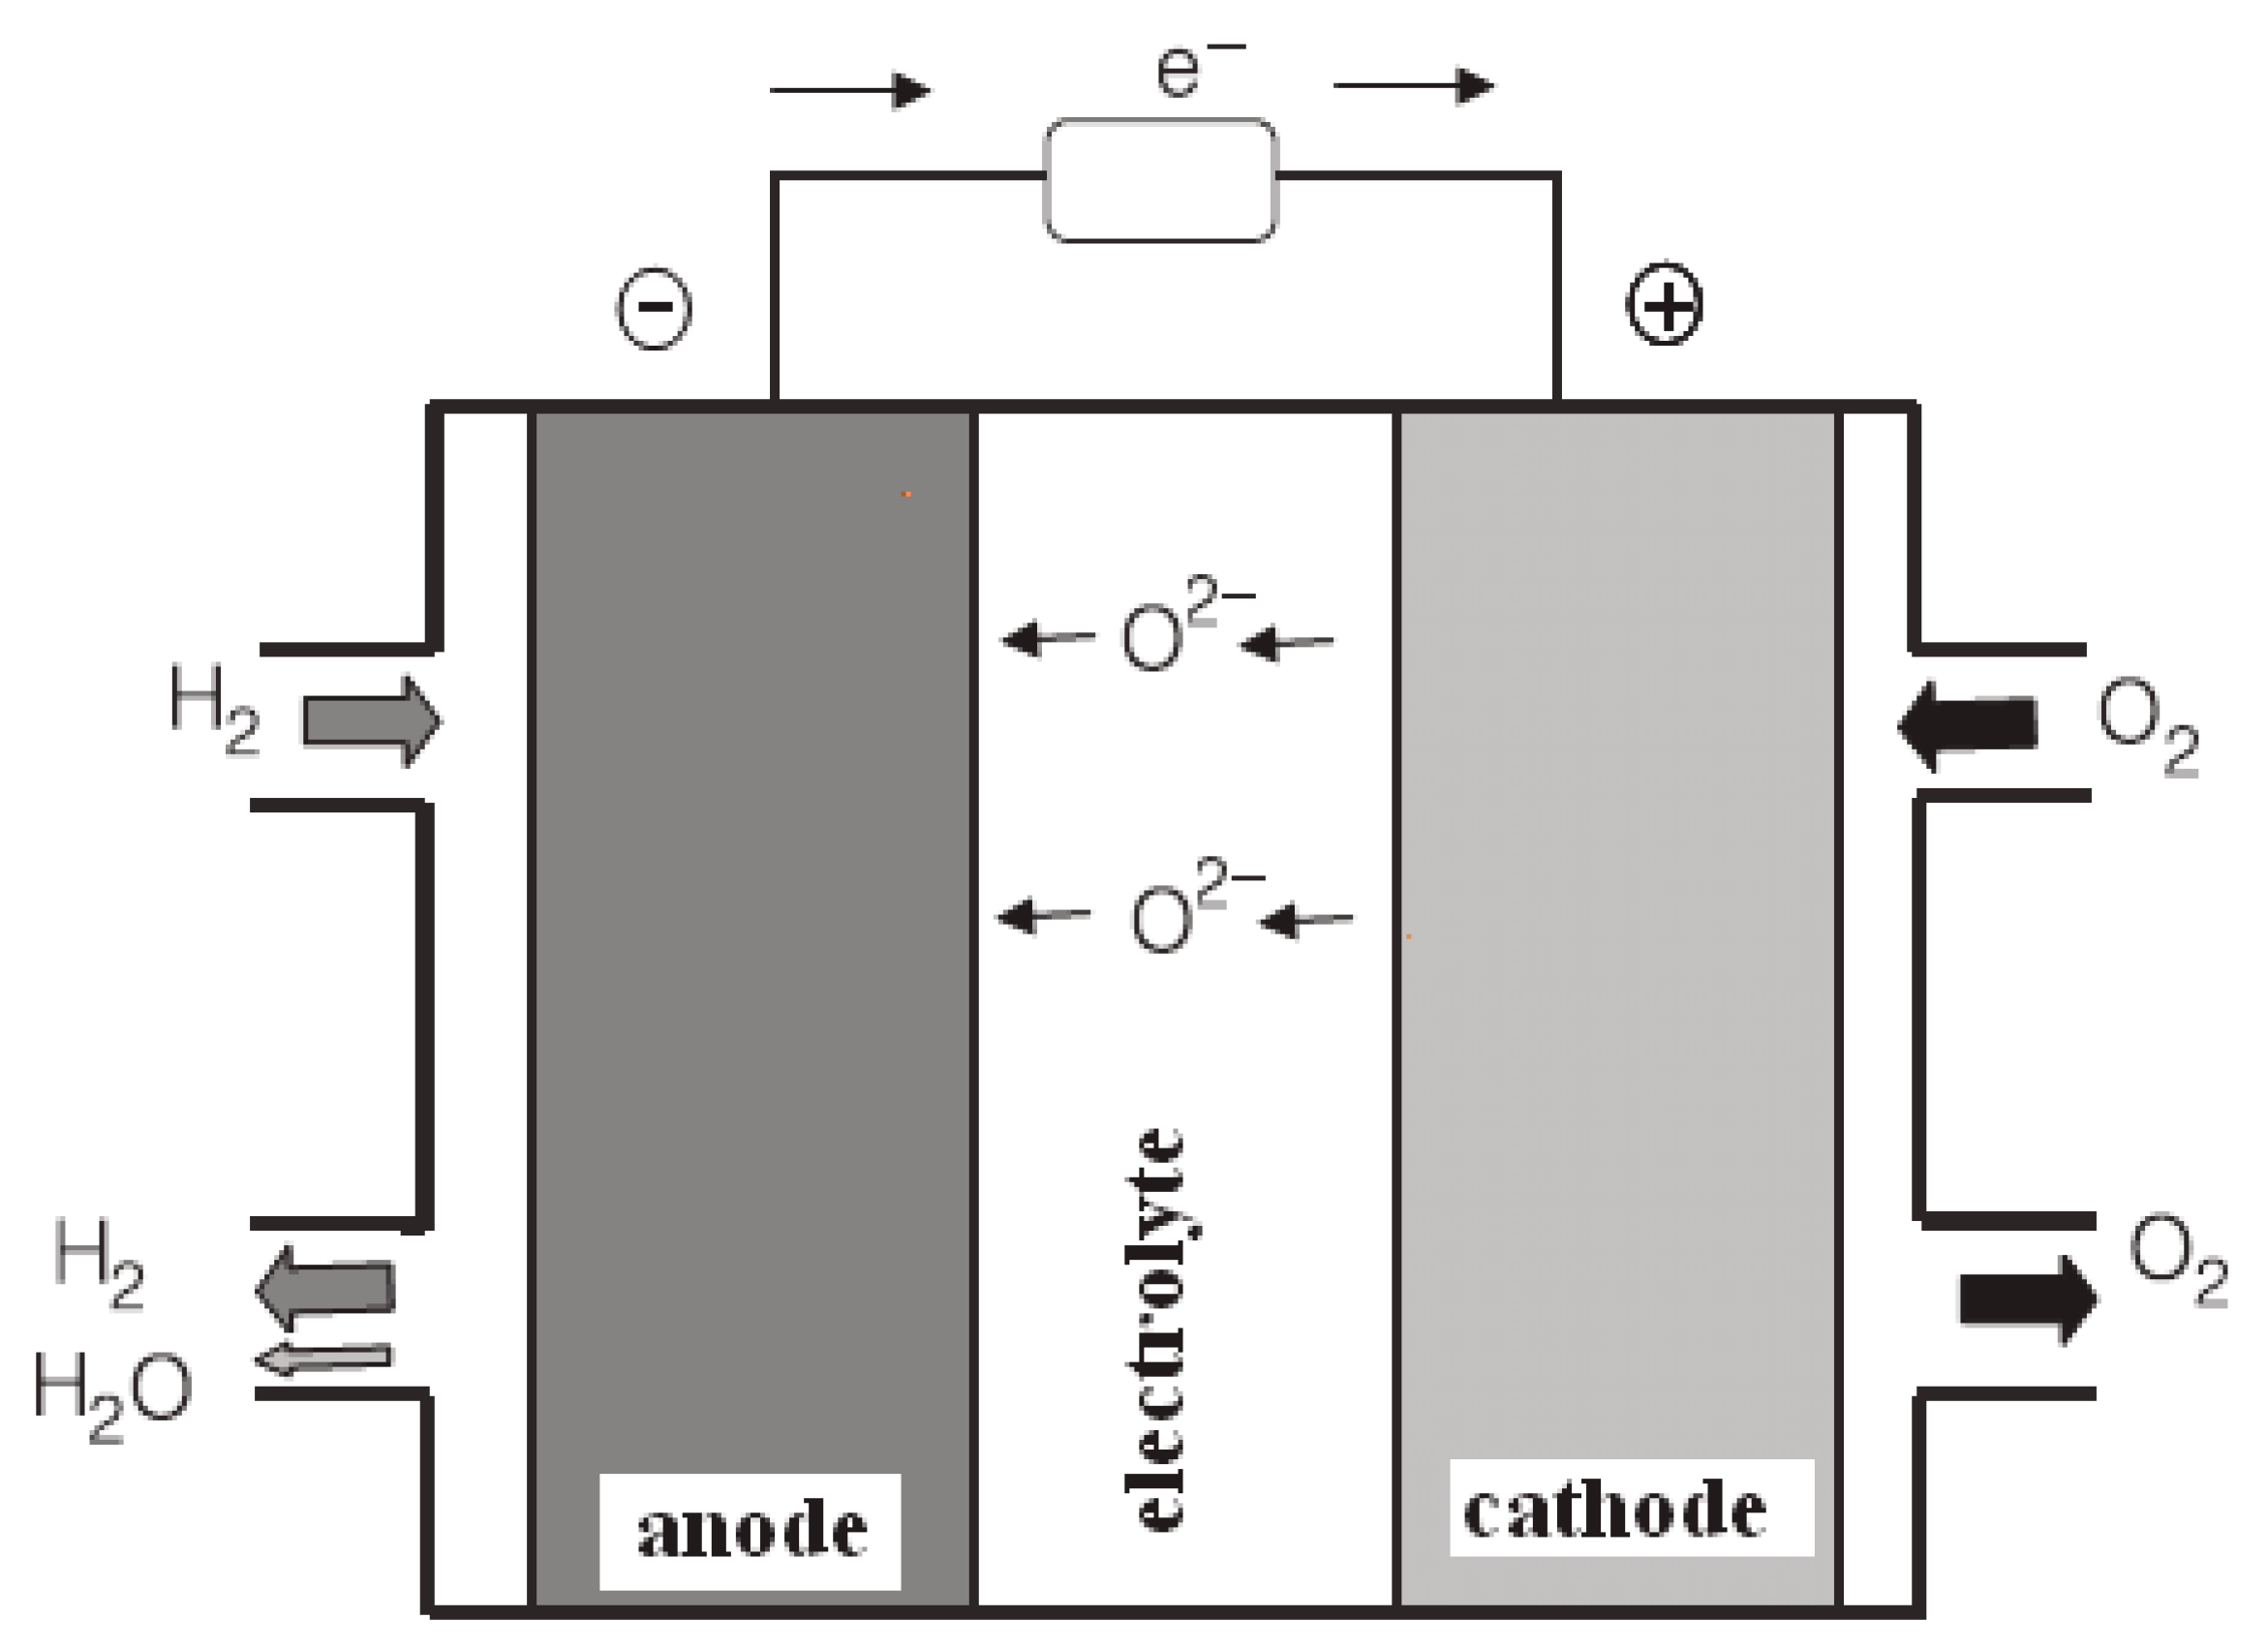
Diagram of the solid oxide fuel cell (A. et al., 2011).
Figure 2.7.
Diagram of the solid oxide fuel cell (A. et al., 2011).
Solid oxide fuel cells work under exceedingly high temperatures around 1000°C. They are used in large-scale operations for stationary power needs and can supply whole factories, even whole towns. As electrolyte zirconium oxide-based ceramics are used and as fuel both hydrogen and carbon monoxide can be used. Because of the high temperature conditions this time directly oxygen ions can transport through the ceramic electrolyte. So, fuel in the anode is directly oxidized by the oxygen ions and this time water by product occurs in the anode side. Solid oxide fuel cells are also extremely suitable for CHP systems as they already need to work under high temperatures. With the CHP system integrations, the efficiency can go up to %85 levels. But high temperature conditions do not always do good and are also responsible for the possible cracks. Reactions for hydrogen and carbon monoxide as fuel can be seen in the Equation 2.12, 2.13, 2.14, 2.15, and 2.16.
3. PROTON EXCHANGE MEMBRANES
3.1. Proton Conductivity Mechanism
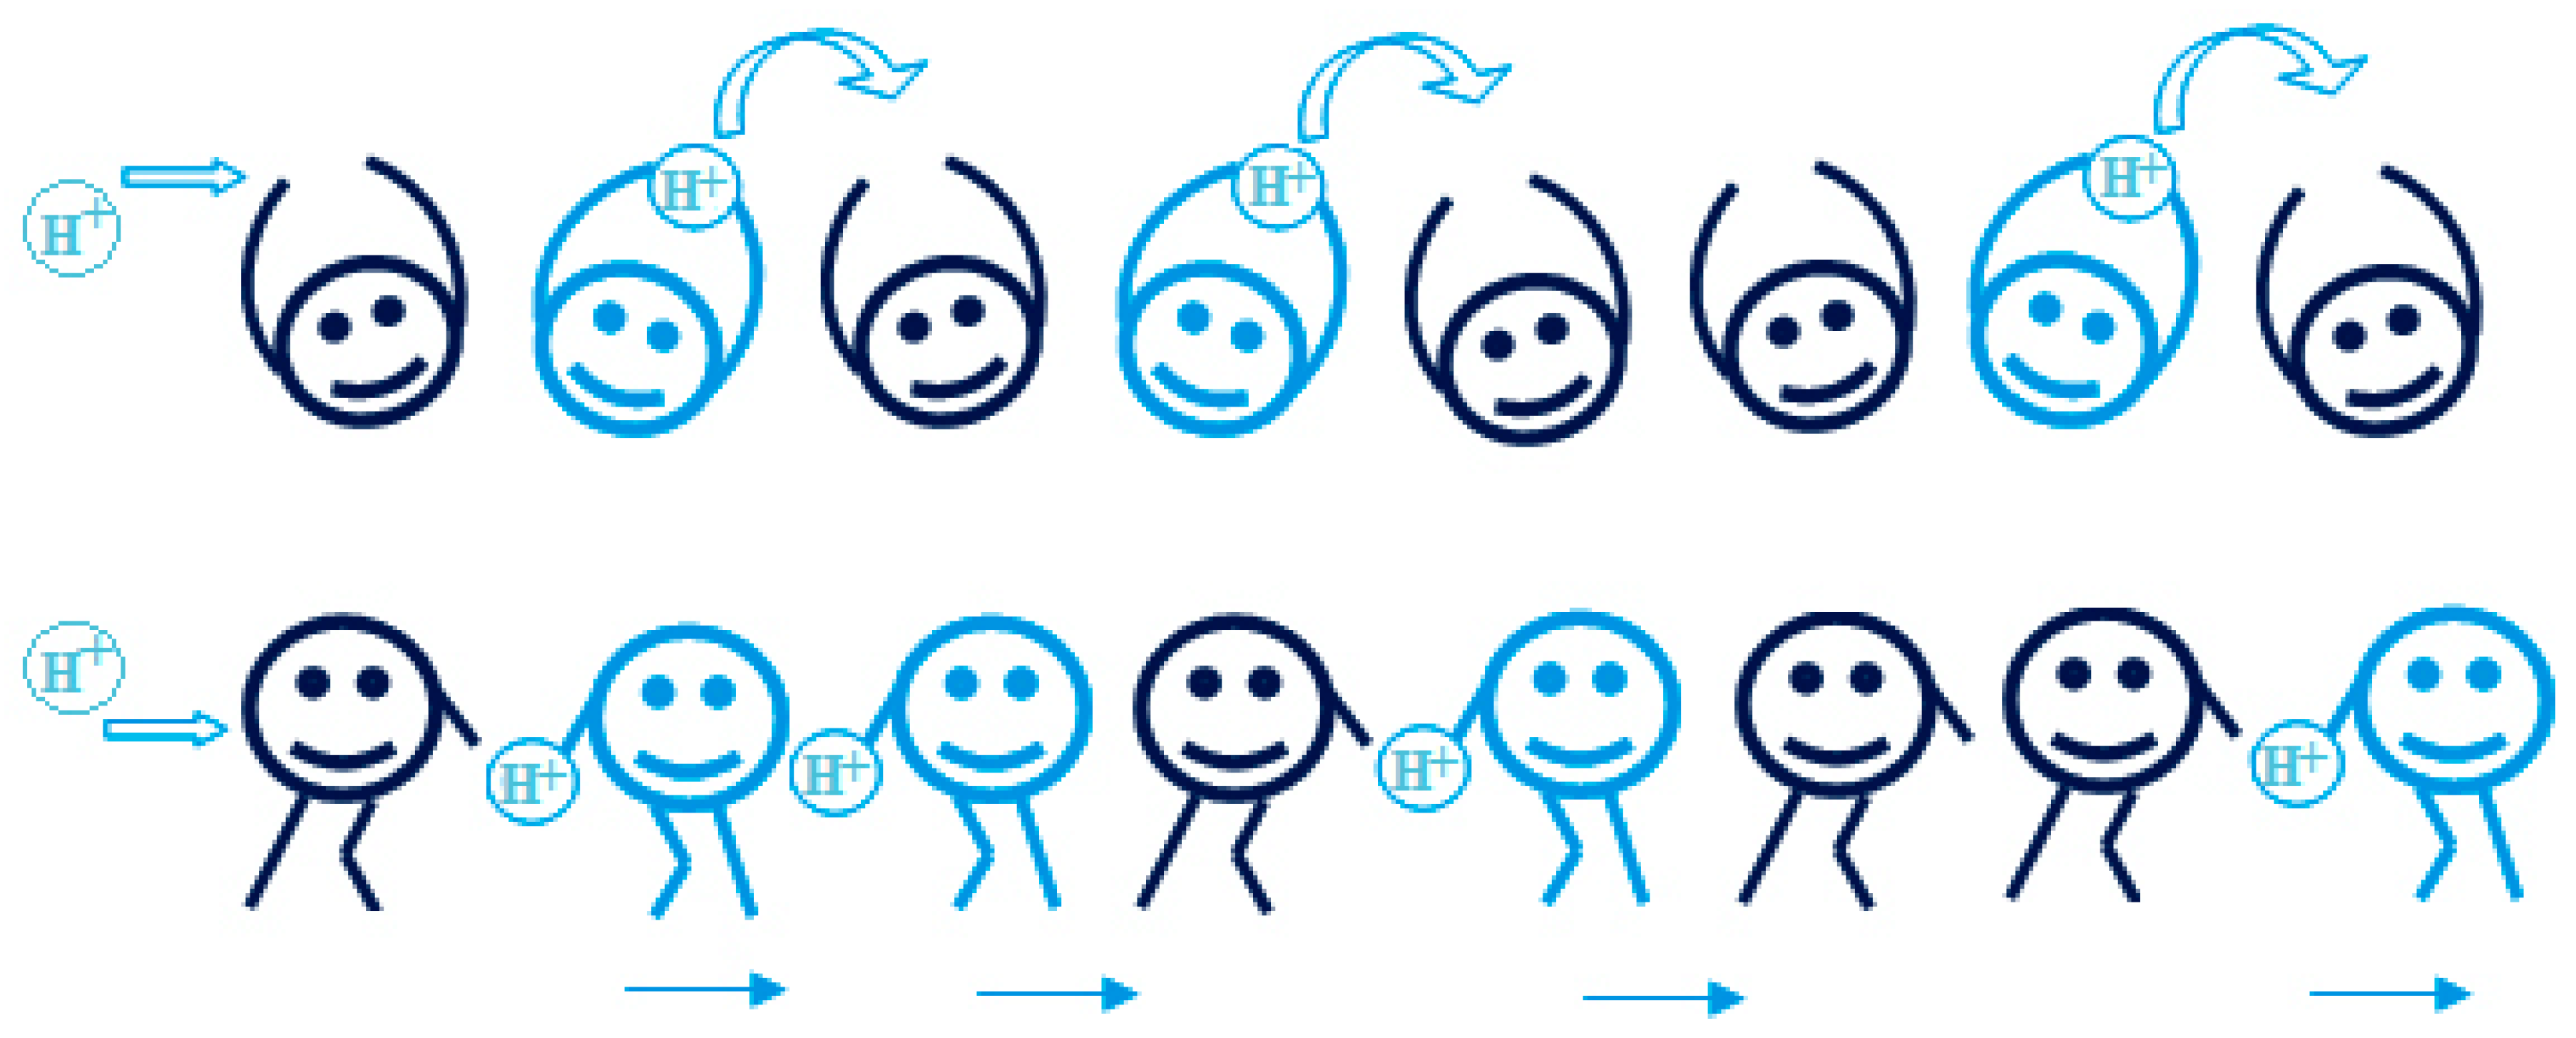
There are two types of mechanisms for proton conductivity vehicle mechanism and Grotthuss mechanism which is also known as the hopping mechanism. In the vehicle mechanism protons use a vehicle as medium and moves with it, in the most cases this would be proton solvent like H3O+, H5O2+ and, H5O2+ (Zuo et al., 2012). And this can be understood in most cases as proton sticks to the water molecules and diffuses through the membrane. For the vehicle mechanism diffusion rate of the vehicle is the main factor that affects the proton conductivity rate. For the Grotthuss mechanism (Hopping Mechanism) it is a little bit different as protons jump from ionic sites to ionic sites. Protons go from site to site by formation of hydrogen bonds and breaking of hydrogen bonds so there is no need for a proton solvent in this case. In Grotthuss type formation and breaking rate and transfer rate between the sites are the main things that affect the proton conductivity. In most cases with acid PEMs in the low temperatures dominant mechanism would be vehicle mechanism with the contribution of the Grotthuss mechanism with the hydrogen bonding and breaking to the water. As the for high temperature dry fuel cells as the water is not in the system Grotthuss mechanism becomes the dominant transport mechanism in the system. In these kinds of systems proton solvents like imidazole can be used to assist in the transport of protons. So, transport mechanisms can change from fuel cell to fuel cell and in some cases one of the mechanisms can be wanted to get more performance. For example, in methanol fuel cells diffusion of the methanol is not wanted so favoring the Grotthuss mechanism would give better results in that case.
3.2. Proton Conductivity Measurement Methods
Proton conductivity is the most important property of proton exchange membranes as it can clearly understood from the name. Most known method of measuring of proton conductivity is four probe electrochemical impedance spectroscopy (EIS). EIS is an electrochemical measurement method which different frequency range of alternative current (AC) is applied trough the probes in this case a four-probe system and then impedance or resistance of the system is recorded using device known as impedance analyzer. EIS measurements can be taken in two different humidity levels either fully liquid water conditions or water vapor which will have direct effect on the measurement results as water content of membrane improves the conductivity of the proton massively. It is also possible to make same measurement with a two-probe system but as that system cannot differentiate the many different impedances so in the four probe method conductivity results are more than two times higher than two probe method (Lee et al., 2005). As the system is measuring not proton conductivity but resistance, proton conductivity [σ, (Ω·cm)
-1] is calculated based on the Equation 3.1.
where the R is membrane resistance (Ω), A is the cross-section area (cm2), l is the distance between the two electrodes (cm) (Colpan et al., 2018).
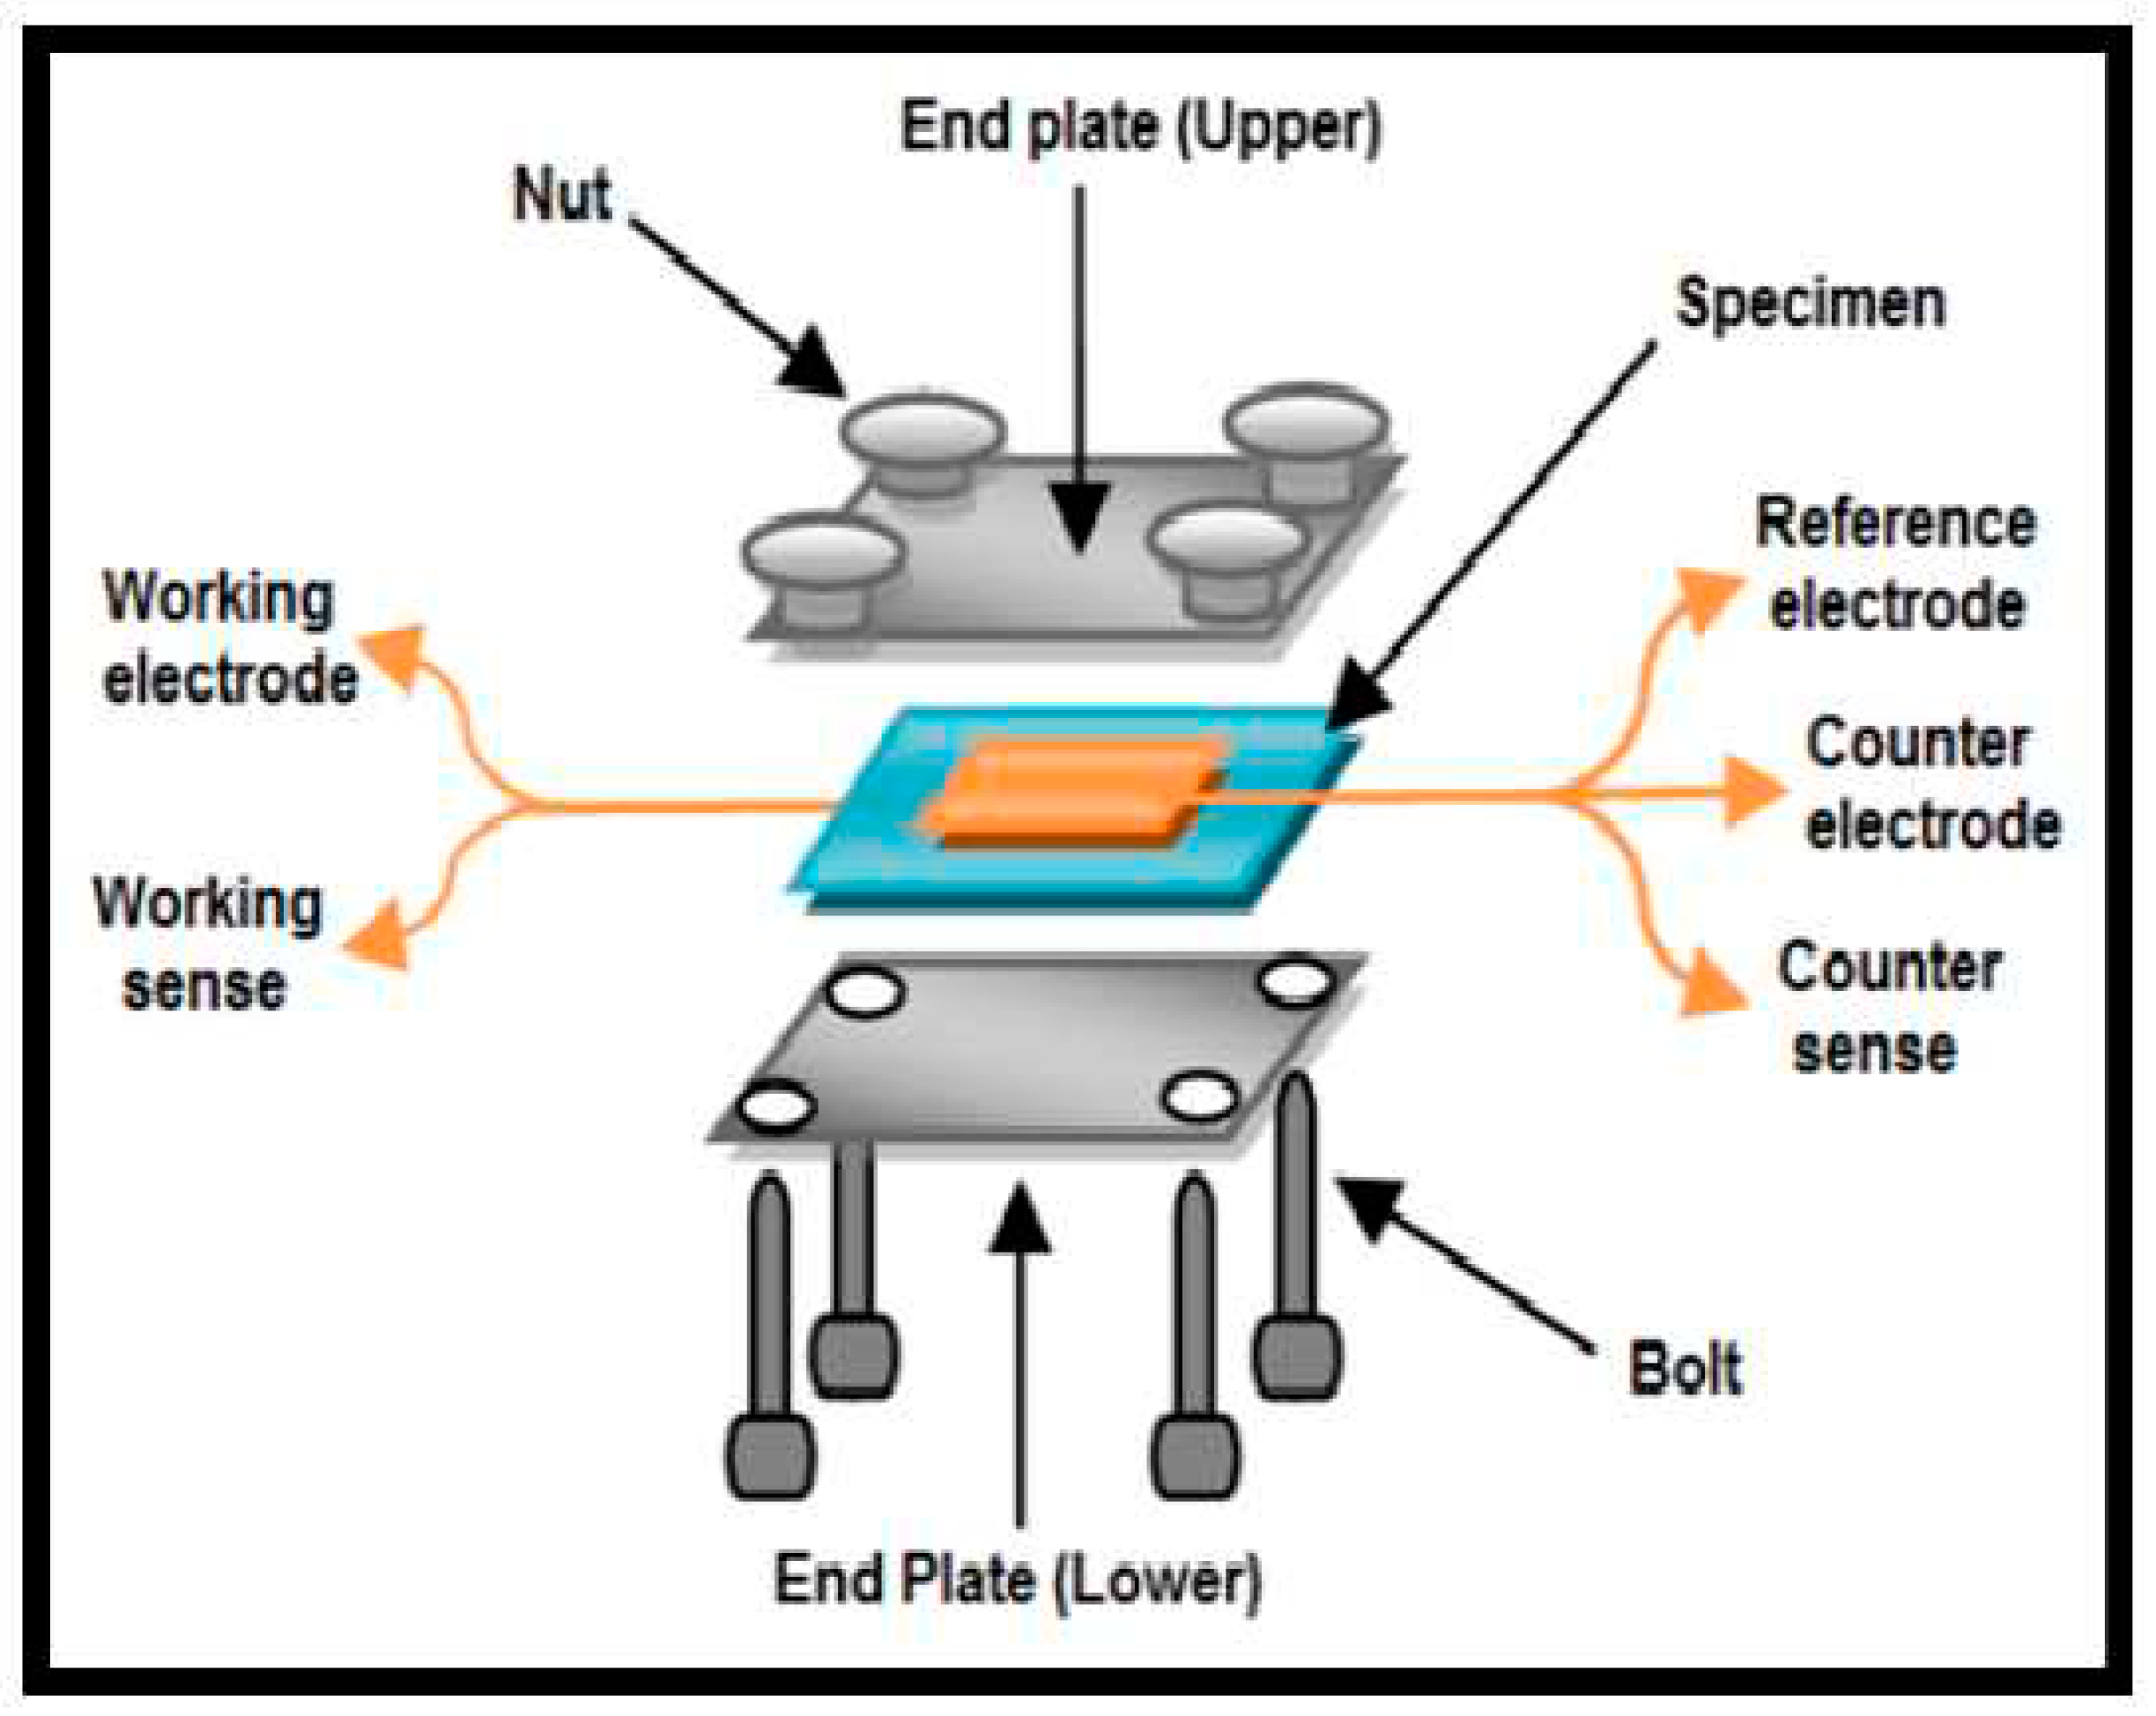
And both of this measurement needs preparation of fuel cell like measurement setup which can be seen in Figure 3.1 including platinum probes so this can be not possible for every research laboratory specially thinking even after that need of a suitable impedance analyzer.
Another method of proton conductivity is IEC which is not a direct measurement of the proton conductivity but rather an indirect one. IEC shows the acid groups in the polymer matrix which are the primary reasons of the proton conductivity on the PEMs (Smitha, 2003). In this method acid membranes are placed in NaCl solution so Na+ cations would replace H+ in membrane and then free H+ is titrated using back titration method with sodium hydroxide with phenolphthalein indicator. And it can be calculated using Equation 3.2 given below.
where W
dry is mass of the membrane measured as dry, C
NaOH concentration of NaOH in mol per liter and V
NaOH volume of sodium hydroxide used in milliliter (Pourzare et al., 2016).
Figure 3.1.
Illustration of proton conduction models Grotthuss mechanism (top) and vehicle mechanism (bottom) (Pourzare et al., 2016).
Figure 3.1.
Illustration of proton conduction models Grotthuss mechanism (top) and vehicle mechanism (bottom) (Pourzare et al., 2016).
Figure 3.2.
Setup for analyzing proton conductivity (Kumar et al., 2015).
Figure 3.2.
Setup for analyzing proton conductivity (Kumar et al., 2015).
3.3. Some Types of Proton Exchange Membranes
3.3.1. Perfluorosulfonic acid (PFSA) membranes
PFSA membranes are one of the most known and oldest membranes used in the PEMFCs. Their history starts almost in 1960s and even used in the Apollo moon missions. They have fairly good proton conductivity, good mechanical, and thermal stability and chemically inert in most cases (Alberti, 2009). But even in the PFSA membranes one of them is most popular among all PEMs Nafion®. Nafion® is also can be accepted as the most researched PEM in the fuel cell area currently. It has a well-deserved position for this high praise in both application wise and application wise. As Nafion® has high proton conductivity (9*10-3 to 12*10-2 S cm-1 at the range of 80 °C between 34% to %100 relative humidity), has highly acidic nature and has more than 60 thousand hours (about 7 years) work life in a fuel cell system (Rozière & Jones, 2003). Even though it has these good properties because of some drawbacks such as price, need of humidity for work, limited temperature range and in some cases like methanol fuel cells poor separation which leads to poisoning of the cathode.
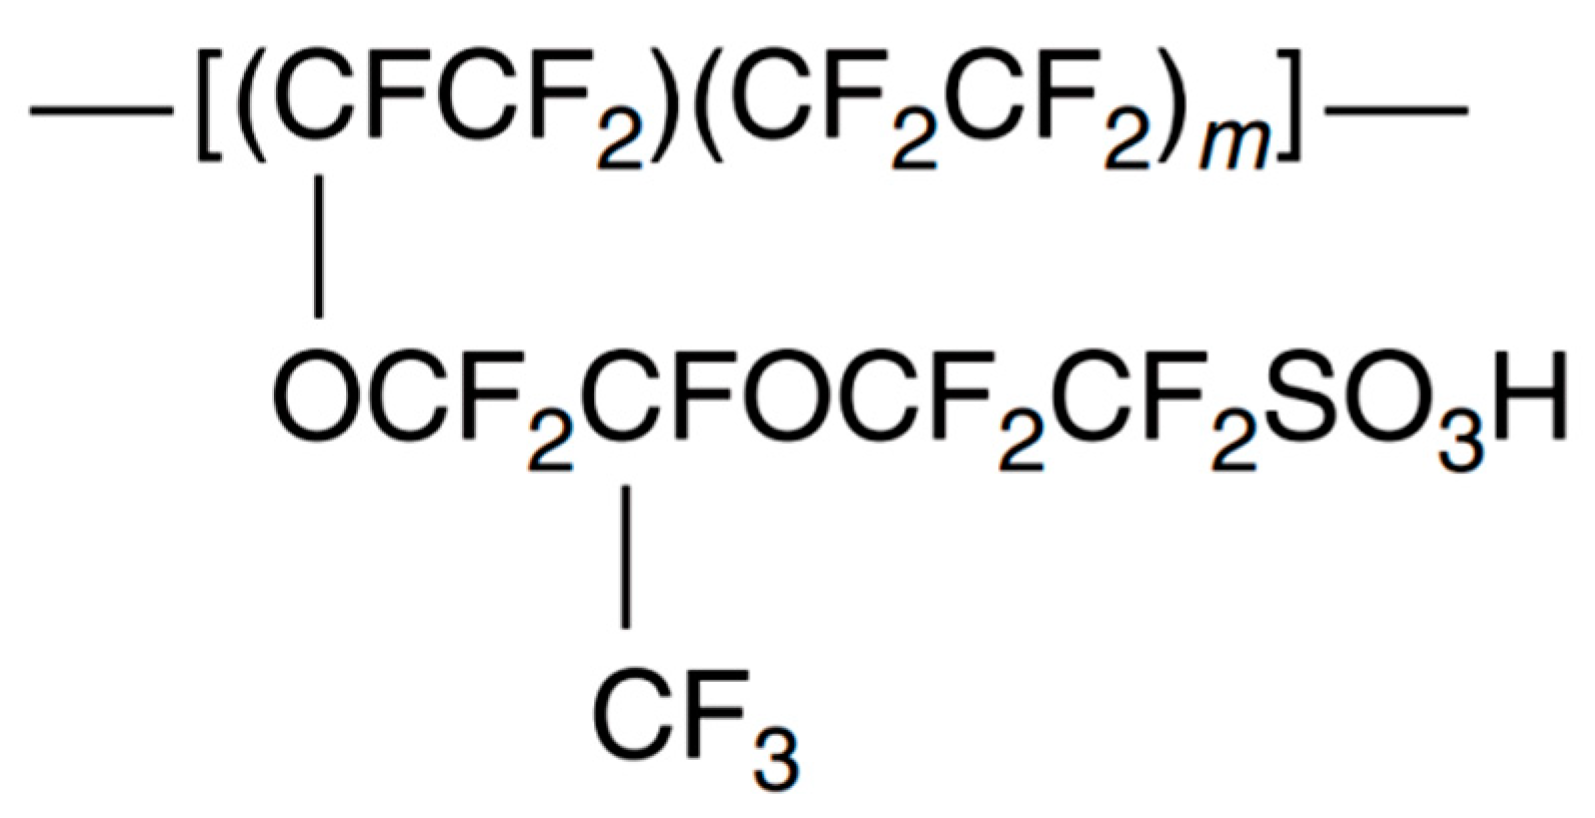
Co-polymerization of sulfonylfluoridevinylether with tetrafluoroethylene yielded a sulfonyl fluoride precursor for Nafion® membranes. Because the -SO3F is thermoplastic it can be extruded into membranes with the desired thickness. This membrane has a crystallinity similar to the Teflon when converted to the Na+ form. Conversion to the -SO3H is fairly important as it is essential for the clustered structure which is fairly important for the proton conductive properties (Alberti, 2009). Also, the properties of the Nafion® can change according to the m number which can be seen in Figure 3.3. In the commercial products m can change between 5 to 11 which will have different ion exchange capacity as the concentration of sulfonic acids in the membrane will change according to the m number. As the main mentioned PFSA is Nafion® in here it should not be perceived as it is the only one different company produce different PFSA membranes like Aciplex and Flemion by Asahi, Hyflon Ion by Solvay, Furnion by Furnatech and Dow membranes by the Dow.
Figure 3.3.
Structure of Nafion®.
Figure 3.3.
Structure of Nafion®.
3.3.2. Sulfonated polymer membranes
Sulfonated polymer membranes are one of the types of PEMs. They have good proton conductivity and because of the sulfur they can either prepared as directly polymers that have sulfur in their composition, or they can be prepared as polymer matrixes that has directly some kind of agent which will give matrix the sulfur in the acid form (-SO3H). It is also possible to prepare in the form of esters (-SO3R) or salt form as -SO3-Na+). The degree of sulfonation can be controlled using time of the reaction and concentration of the sulfonation agent in the direct polymerization method. For the polymerization matrix degree of sulfonation directly affected only by the used concentration as the sulfonation agent does not react and produce a polymer or co-polymer unlike the other case. Sulfonated polymer membranes create a great interest as a potential replacement for the PFSA membranes. Even tough sulfonated polymers cannot compete the properties of the PFSA membranes in most cases being very cheap compared to PFSA creates the interest in the sulfonated membranes. And have some potential overcome some of the drawbacks of the PFSA like the high methanol permeability and they can work in the low humidity and high temperatures unlike the PFSA membranes which leads to potential research in the dry fuel cells prepared by the sulfonated membranes but in this research, it will not be mentioned in the detail. Another advantage of sulfonation is that it can be applied to any polymer that has either double bonds or aromatic rings which creates a lot of different options of polymers, co-polymers, and block copolymers. But it should be in the mind while using sulfonation for membrane preparation with the increase in the degree of the sulfonation along the proton conductivity also hydrophilicity which after a point prepared membrane will be water soluble and it will not pe possible to use these membranes in the water solutions.
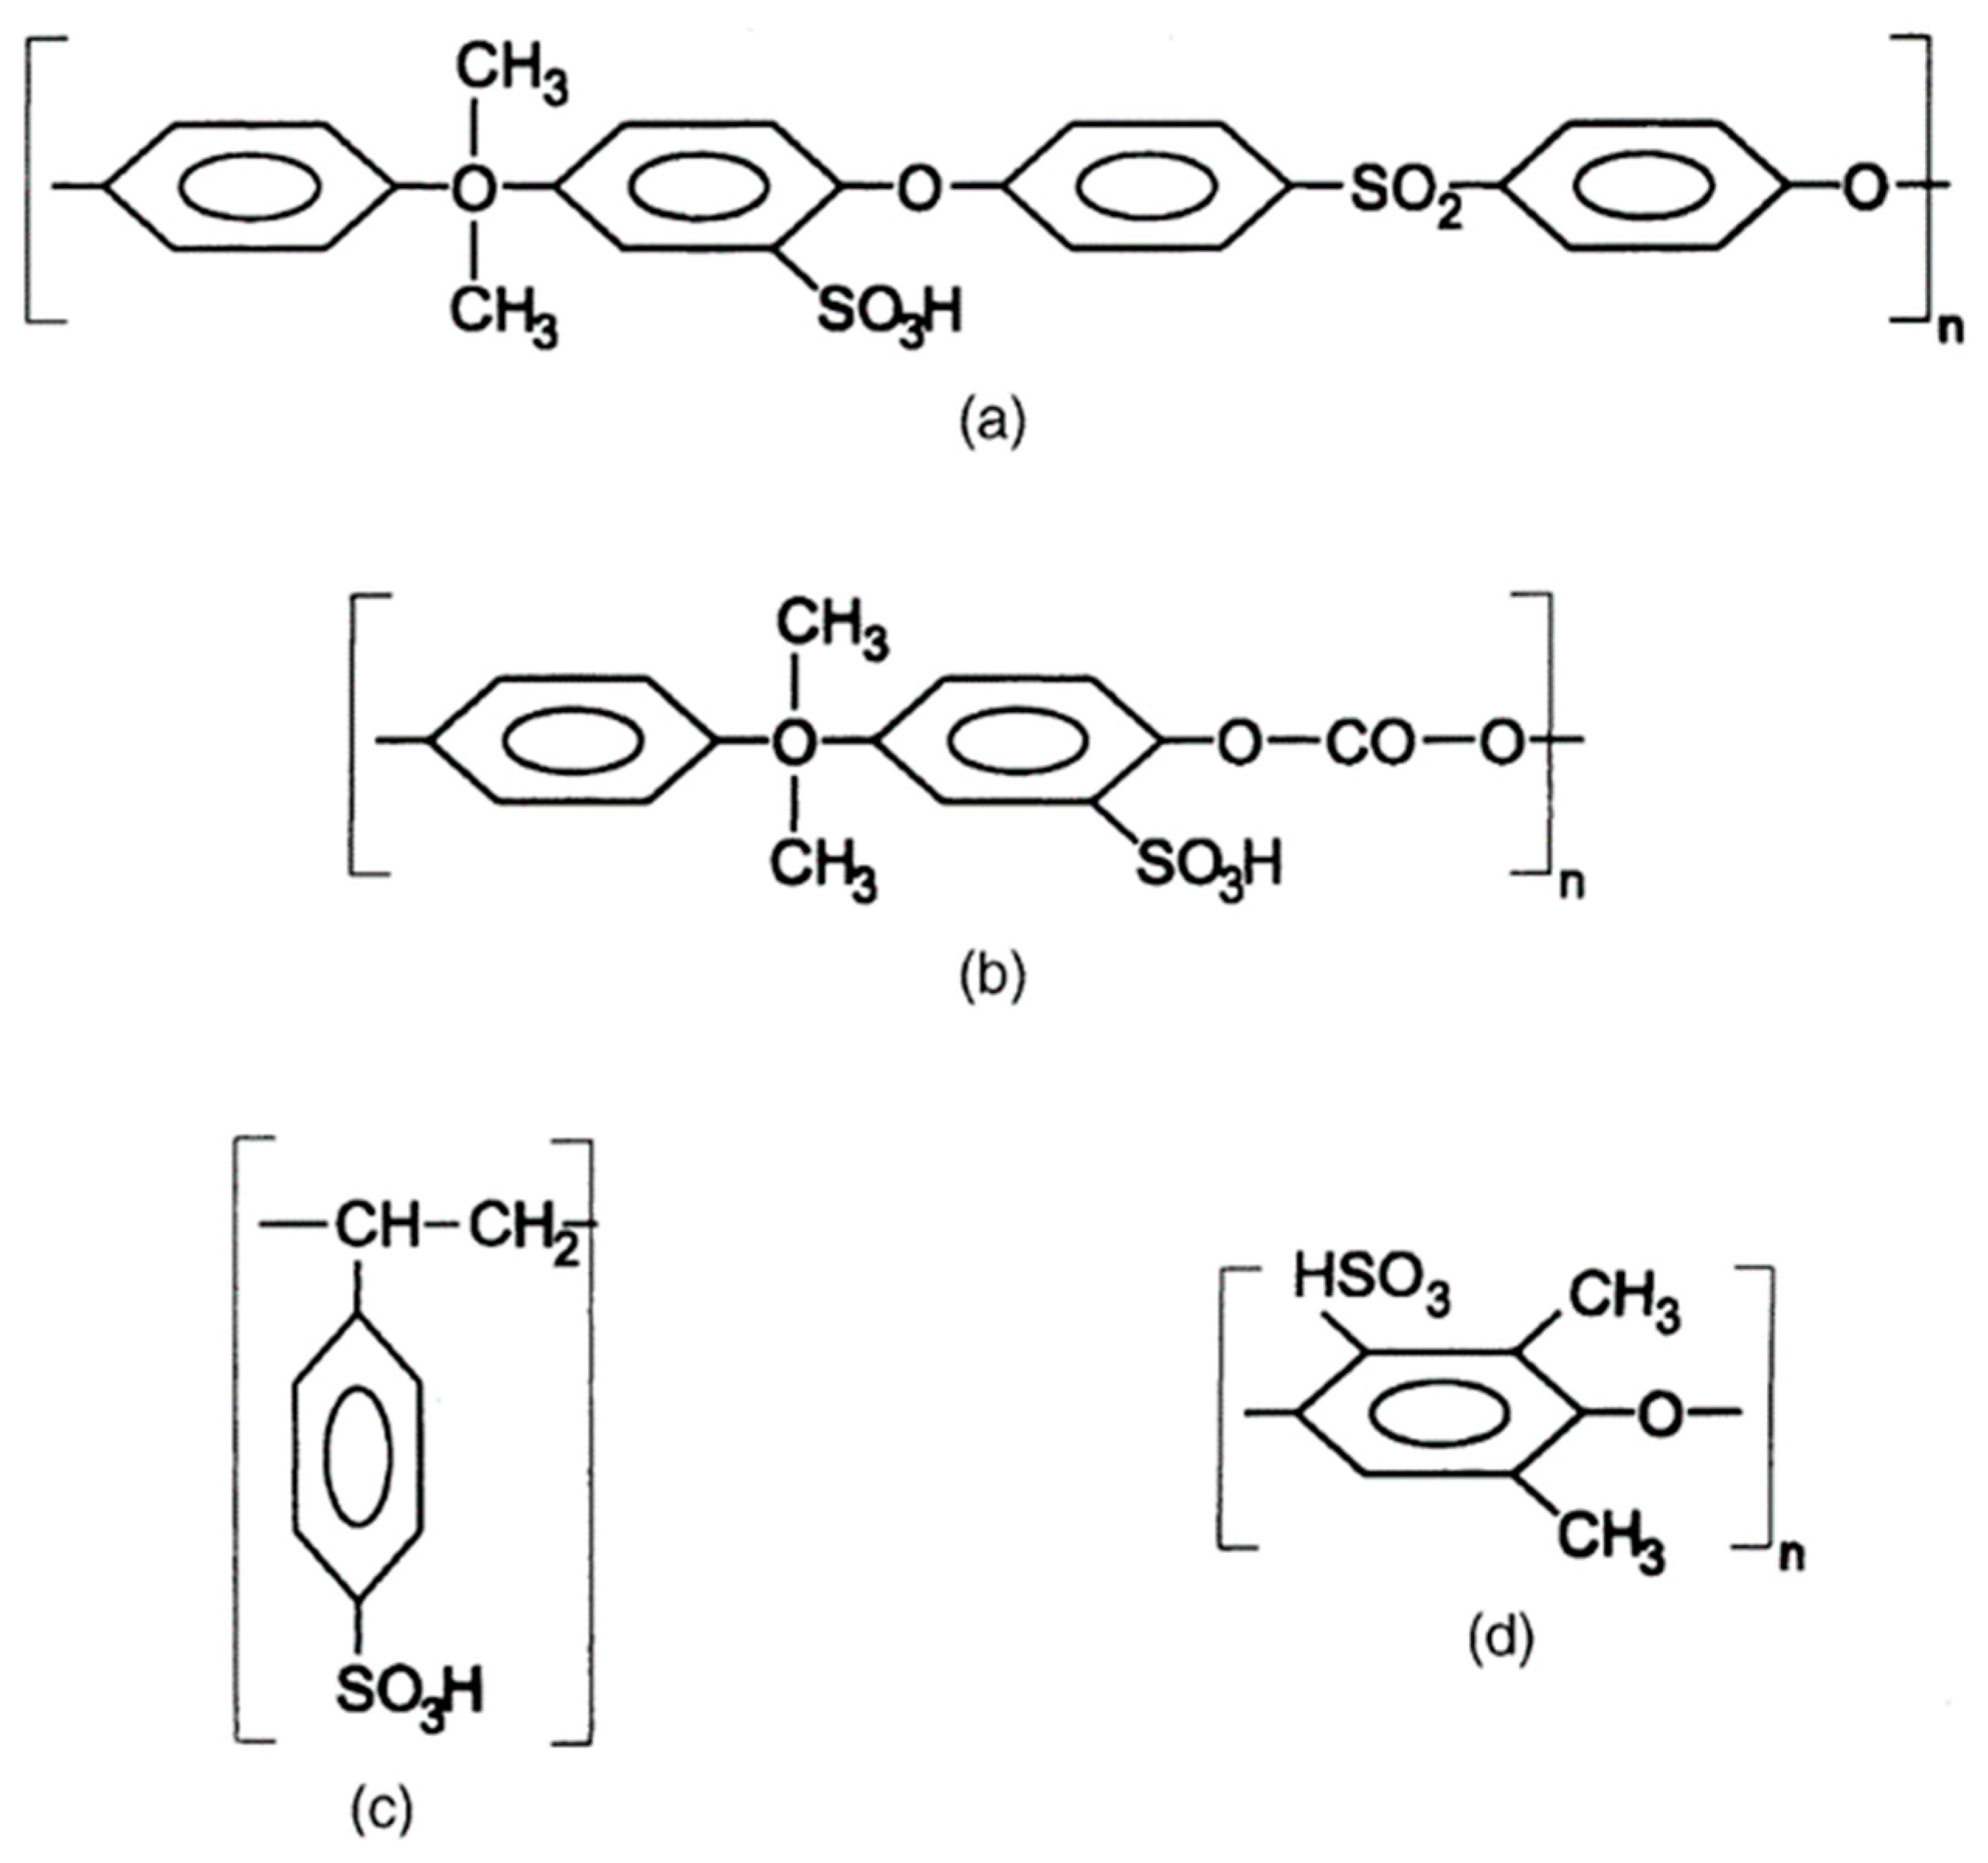
There are a lot of different polymers that can be sulfonated, some of them can be seen in Figure 3.4. Different sulfonation agents can be used in the different cases of sulfonated polymer membranes. As the sulfonation agent the first coming the mind would be naturally sulfuric acid but in the most cases prepared membranes would be challenged by the problem mentioned previously and will be dissolved in the water completely. In these case chlorosulfonic acid and acetyl sulfate can be given as examples of the sulfonation agents for membrane preparation. Chlorosulfonic acid can be used for preparation of sulfonated poly (phenylene oxide) and sulfonated polysulfone but cannot be used for the polystyrene and polycarbonate these precipitated without any reaction and change. For acetyl sulfate things are the opposite as it can be used for polystyrene and polycarbonate but cannot be used for poly (phenylene oxide) and polysulfone as they are not compatible with acetyl sulfate. General sulfonation would start with choosing a solvent for polymer that will be sulfonated then the polymer and solvent would be added to three neck reaction flasks and will be dissolved in necessary conditions while vigorously mixing. After that, a solution of sulfonation agent would be added gradually to reaction flask and it will let react for wanted time according to desired degree of sulfonation. Polymer that precipitated would be washed with distilled water, collected, and dried at the end of the reaction. After preparation of the desired sulfonated polymer, it is time for preparation of the membrane. For this step generally solution casting method is used, this time for sulfonated polymer a solvent is chosen, and polymer dissolved in this solvent in the necessary conditions while rigorously mixing then polymer spread on to either clean glass plates or petri dishes. The films that are cast on to glass plates are dried at room temperature then vacuum dried if it is possible. Other than sulfonated polystyrene other 3 shows reasonable results in both stability wise and proton conductivity wise but for the sulfonated polystyrene because of the temperature decrease in the glass transition temperature it cannot operate well under necessary fuel cell conditions. But it still shows potential in case co-polymerization or crosslinking of the sulfonated polystyrene with suitable other polymers to increase its stability under necessary conditions. It should also mention that sulfonated polycarbonate showed the closest values of the Nafion® membrane with good proton conductivity, mechanical, and thermal strength also with the low cost. All of the above information about preparation of sulfonated membranes are obtained from (Smitha, 2003) which has more detailed information about the preparation steps directly for sulfonation of different polymers which includes numerical information of necessary steps.
Figure 3.4.
Chemical structure of: (a) sulfonated polysulfone, (b) sulfonated polycarbonate, (c) sulfonated polystyrene and (d) sulfonated poly (phenylene oxide) (Smitha, 2003).
Figure 3.4.
Chemical structure of: (a) sulfonated polysulfone, (b) sulfonated polycarbonate, (c) sulfonated polystyrene and (d) sulfonated poly (phenylene oxide) (Smitha, 2003).
3.3.3. Polymer matrixes
Also, there are other attempts to get the desired membrane using polymer matrixes instead of using reaction or copolymers these kinds of membranes generally use a type of polymer as stabilizer of the system and use polymer as a construction point for hosting proton conductive acids or salts. To this kind of polymer research of the (Sheha, 2010) can be given as example which prepared a polymer membrane based on Poly (vinyl alcohol) (PVA), NH4B4 as the salt and H2SO4 as the proton conductors. Prepared polymer matrix can be shown as the (PVA)0.75(NH4Br)0.25(H2SO4)xM which first two indexes show the ratio of the PVA and NH4B4 respectively and xM shows the added molarity of acid in the matrix. And even without H2SO4 this polymer matrix shows the proton conductivity properties in (PVA)0.75(NH4Br)0.25 polymer membrane and conductivity are around 5.7 × 10⁻⁴ S cm−1 (Hema et al., 2008). Which is happening due to good proton donor capacities of the NH4Br salt in the matrix system. This proton donor capacity is generally true for all of the ammonium salts and has great potential of use for polymer matrixes which are prepared for PEMs. But it should not be forgotten in these matrixes are not strong as the other direct polymers that are prepared with reaction methods like the before mentioned sulfonation method. As in that systems proton donors or acceptors are the direct part of the polymer and cannot leave the system. But for the polymer matrixes the salt and acid in the polymer matrix can leave the system according to the interaction between polymer and any other attraction from the other sources from outside. For example, there is a possibility of NH4Br or H2SO4 leaving the polymer matrix if washed away by the water.
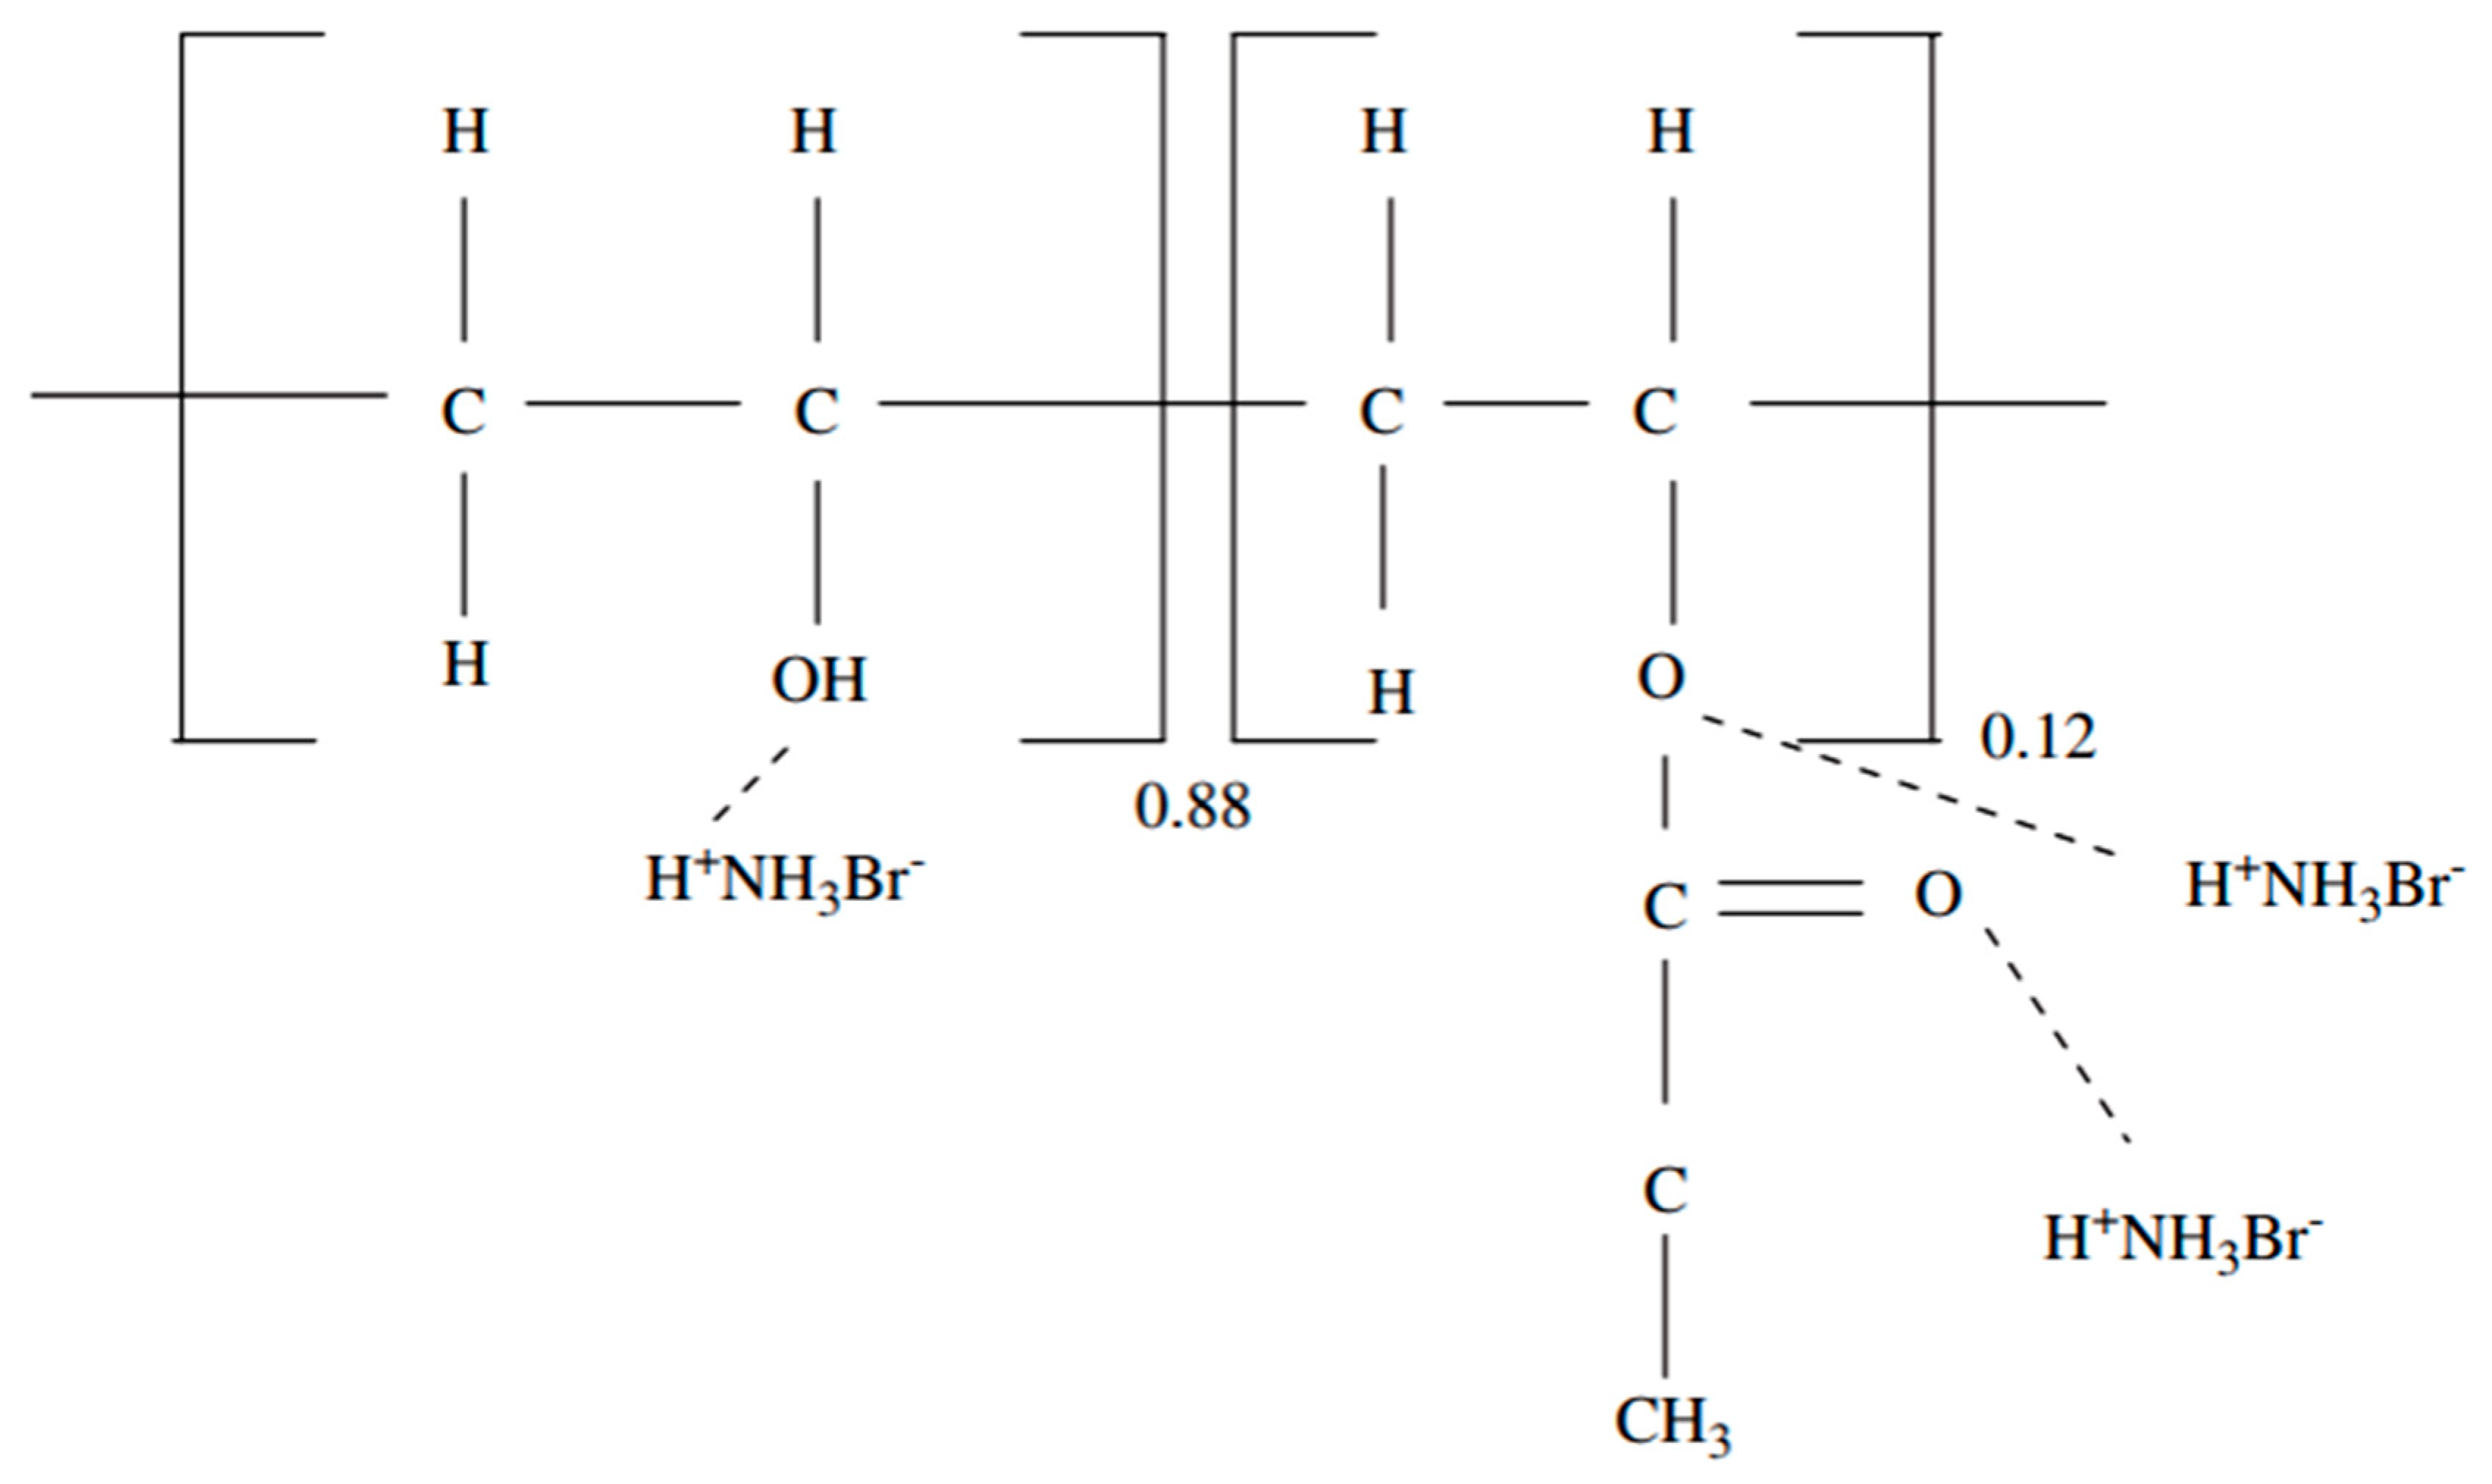
In Figure 3.5 weak interactions between the PVA and NH4Br dopant in the polymer matrix can be clearly seen.
Figure 3.5.
Possible interactions of (PVA)0.75(NH4Br)0.25 polymer matrix (Hema et al., 2008).
Figure 3.5.
Possible interactions of (PVA)0.75(NH4Br)0.25 polymer matrix (Hema et al., 2008).
Another polymer matrix which is seen in the literature is (PVA)0.7(NaBr)0.3(H3PO4)xM polymer matrix which is aiming to prepare a high proton conductive polymer membrane for the fuel cells (Ahmad & Sheha, 2013). In this research it also prepares different molar ratios of the polymer matrixes to show direct correlation between the acid concentration in the polymer matrix and polymer proton conductivity. But it is also important to find the optimum point as the salt and acid concentration in the polymer matrix also affects the stability, mechanical strength, and thermal strength of the whole polymer matrix. And these qualities are quite important for any fuel cell membrane as it should work in the desired conditions for a long time.
In Table 3.1 it can be clearly seen that conductivity of the membrane at room temperature increases greatly by the increase in the acid concentration of the polymer matrix. There are more than 1000 times increase in the proton conductivity of the membrane between 0 molar and 5.1 molar acid concentration polymer membranes.
Table 3.1.
Proton conductivity results at different frequencies of (PVA)0.7(NaBr)0.3(H3PO4)xM membrane (Ahmad & Sheha, 2013).
Table 3.1.
Proton conductivity results at different frequencies of (PVA)0.7(NaBr)0.3(H3PO4)xM membrane (Ahmad & Sheha, 2013).
| |
Conductivity at room temperature (S/cm) |
| H3PO4 concentration (M) |
100 Hz |
1 kHz |
100 kHz |
| 0.00 |
1.74*10-6
|
2.02*10-6
|
6.23*10-6
|
| 0.85 |
3.90*10-5
|
4.13*10-5
|
4.44*10-5
|
| 1.7 |
1.08*10-4
|
1.27*10-4
|
1.45*10-4
|
| 3.4 |
9.84*10-4
|
1.24*10-3
|
1.82*10-3
|
| 5.1 |
3.26*10-3
|
4.30*10-3
|
6.43*10-3
|
4. MATERIALS AND METHODS
4.1. Equipment
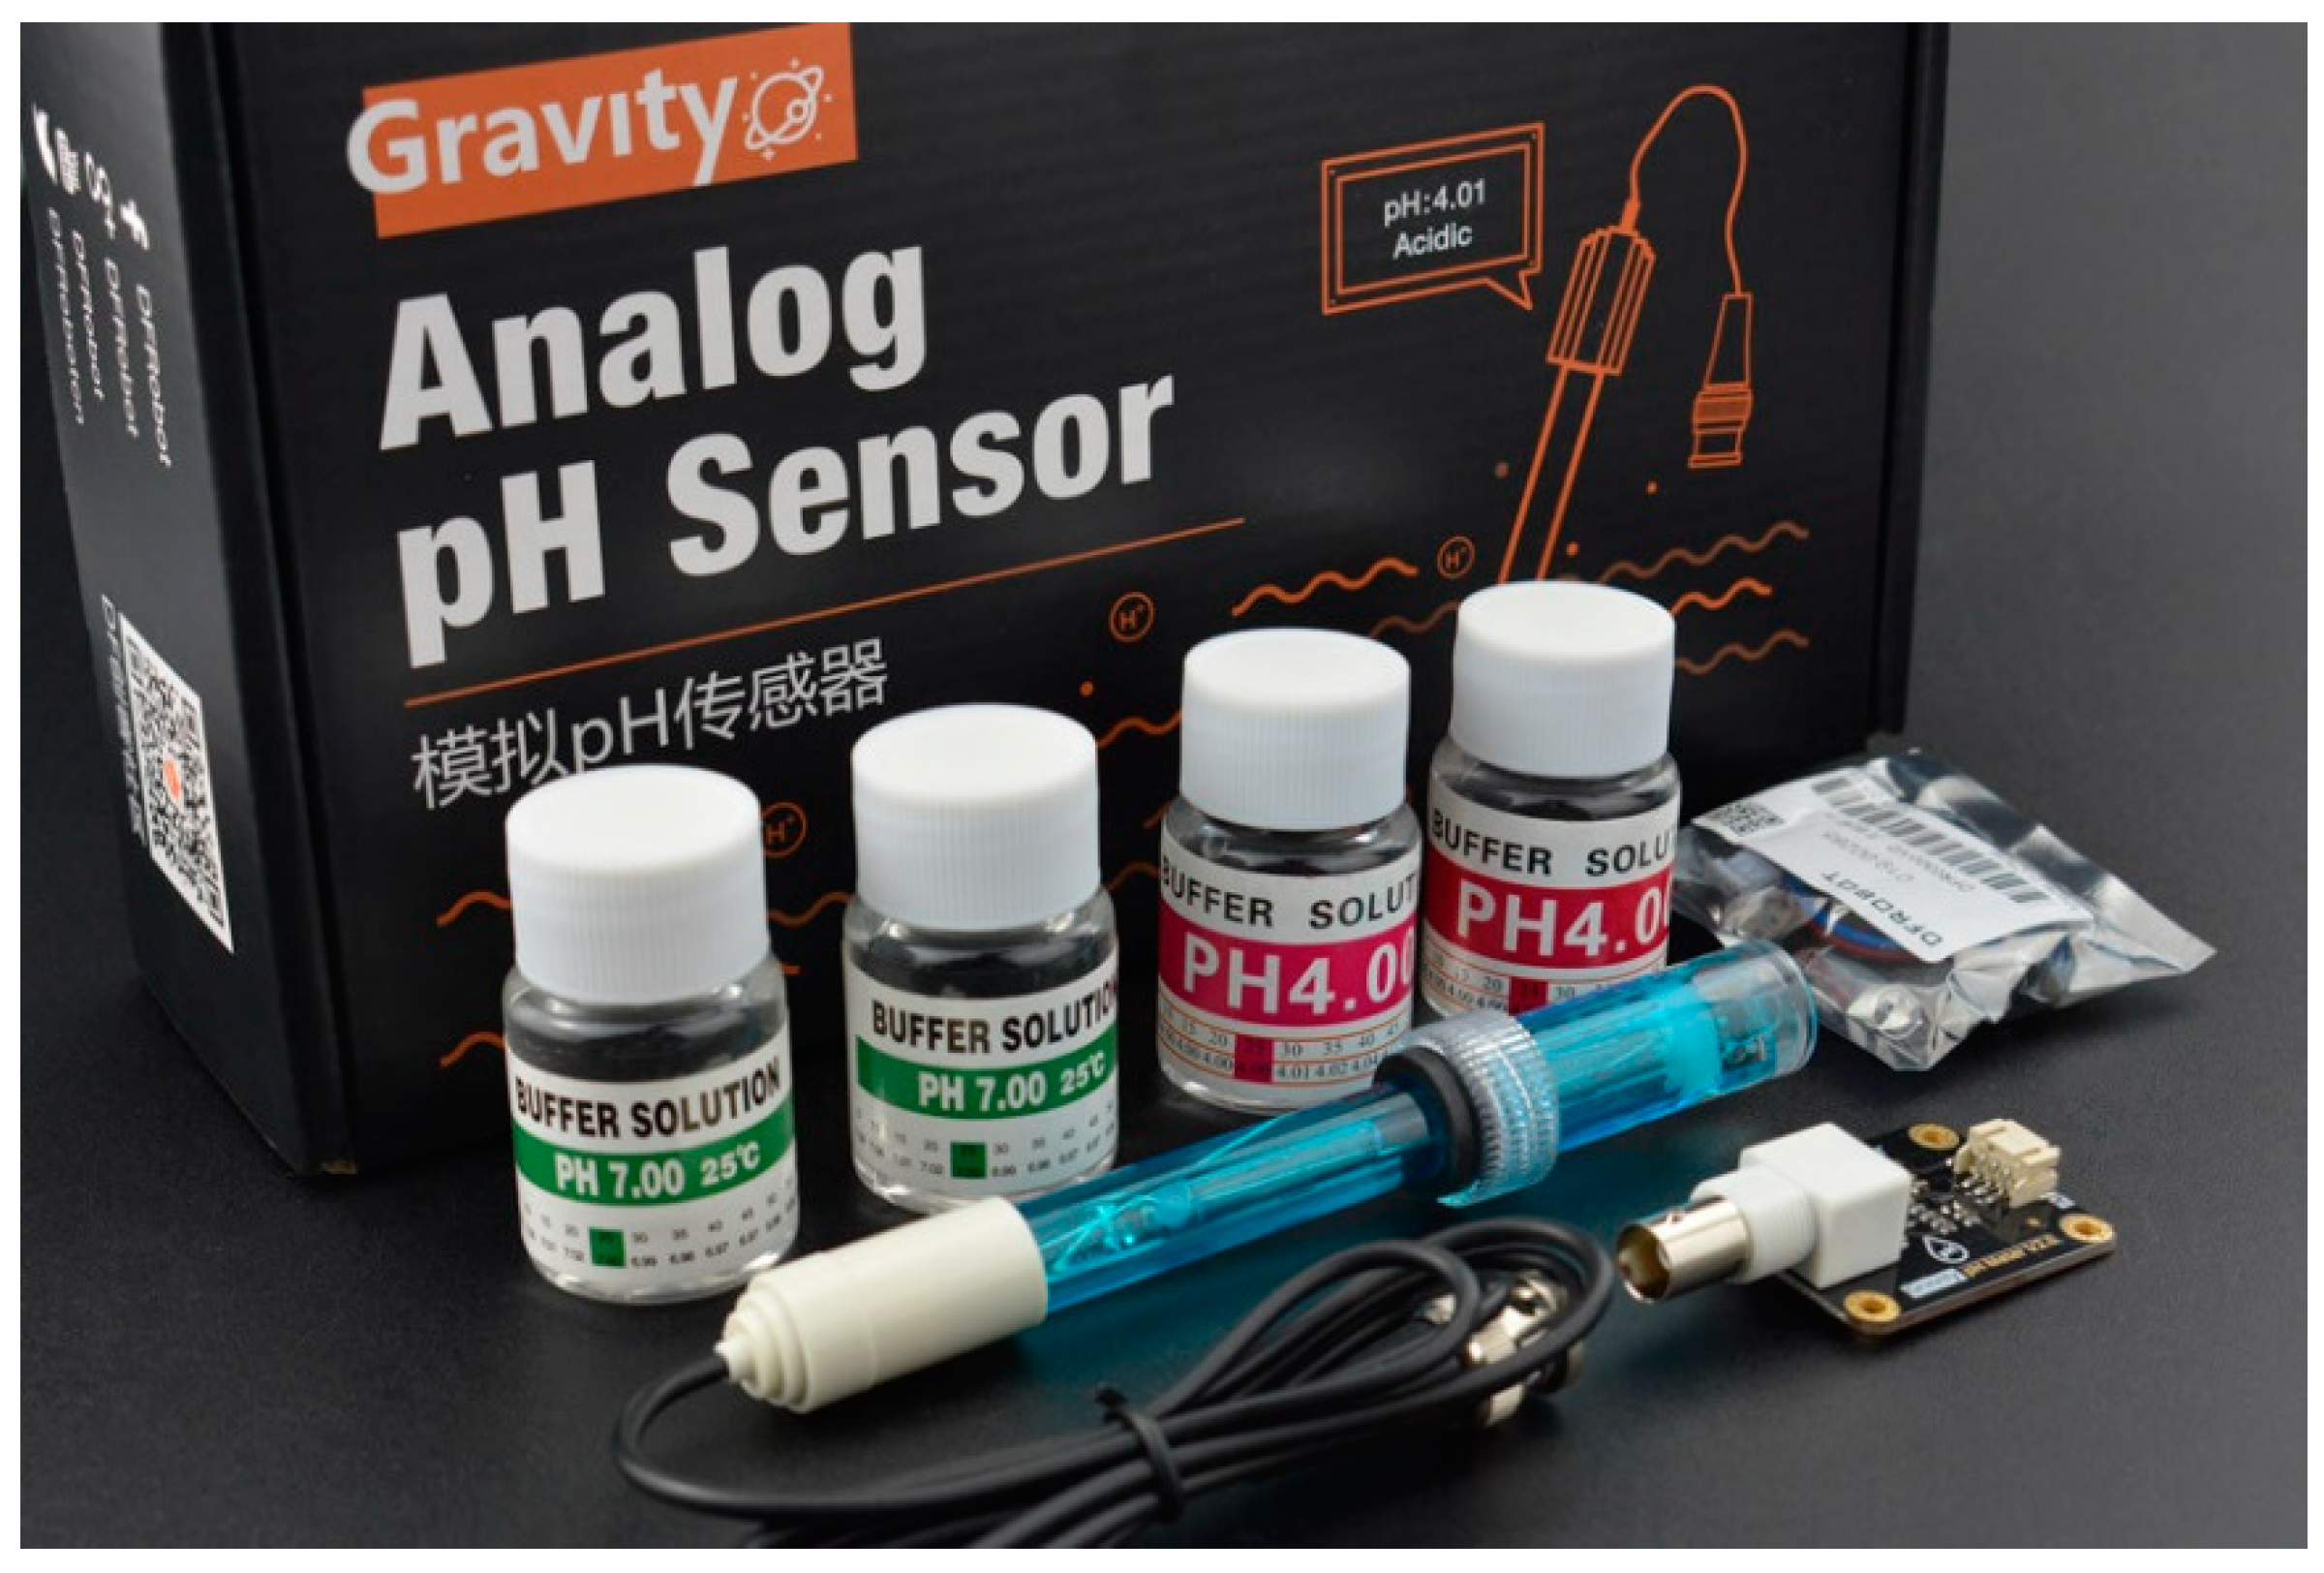
4.1.1. DFRobot’s Gravity: Analog pH Meter V2
Figure 4.1.
DFRobot's Gravity: Analog pH meter V2 [2].
Figure 4.1.
DFRobot's Gravity: Analog pH meter V2 [2].
The set includes two buffer solutions at pH 7 and pH 4, pH probe, signal conversion board for Arduino connection. Buffer solutions are needed for calibration of pH probe. Probe is left in 3N KCl solution for 8 hours before the first use and there should be always 3N KCl solution on in the cap after each measurement and probe should not left to dry.
Probe Type: Laboratory Grade
Detection Range: 0~14
Temperature Range: 5~60°C
Zero Point: 7±0.5
Response Time: <2min
Internal Resistance: <250MΩ
Probe Life: >0.5 year (depending on frequency of use)
Cable Length: 100cm
Supply Voltage: 3.3~5.5V
Output Voltage: 0~3.0V
Probe Connector: BNC
Signal Connector: PH2.0-3P
Measurement Accuracy: ±0.1@25℃
Dimension: 42mm*32mm/1.66*1.26in
All the specification data is taken from product website [1].
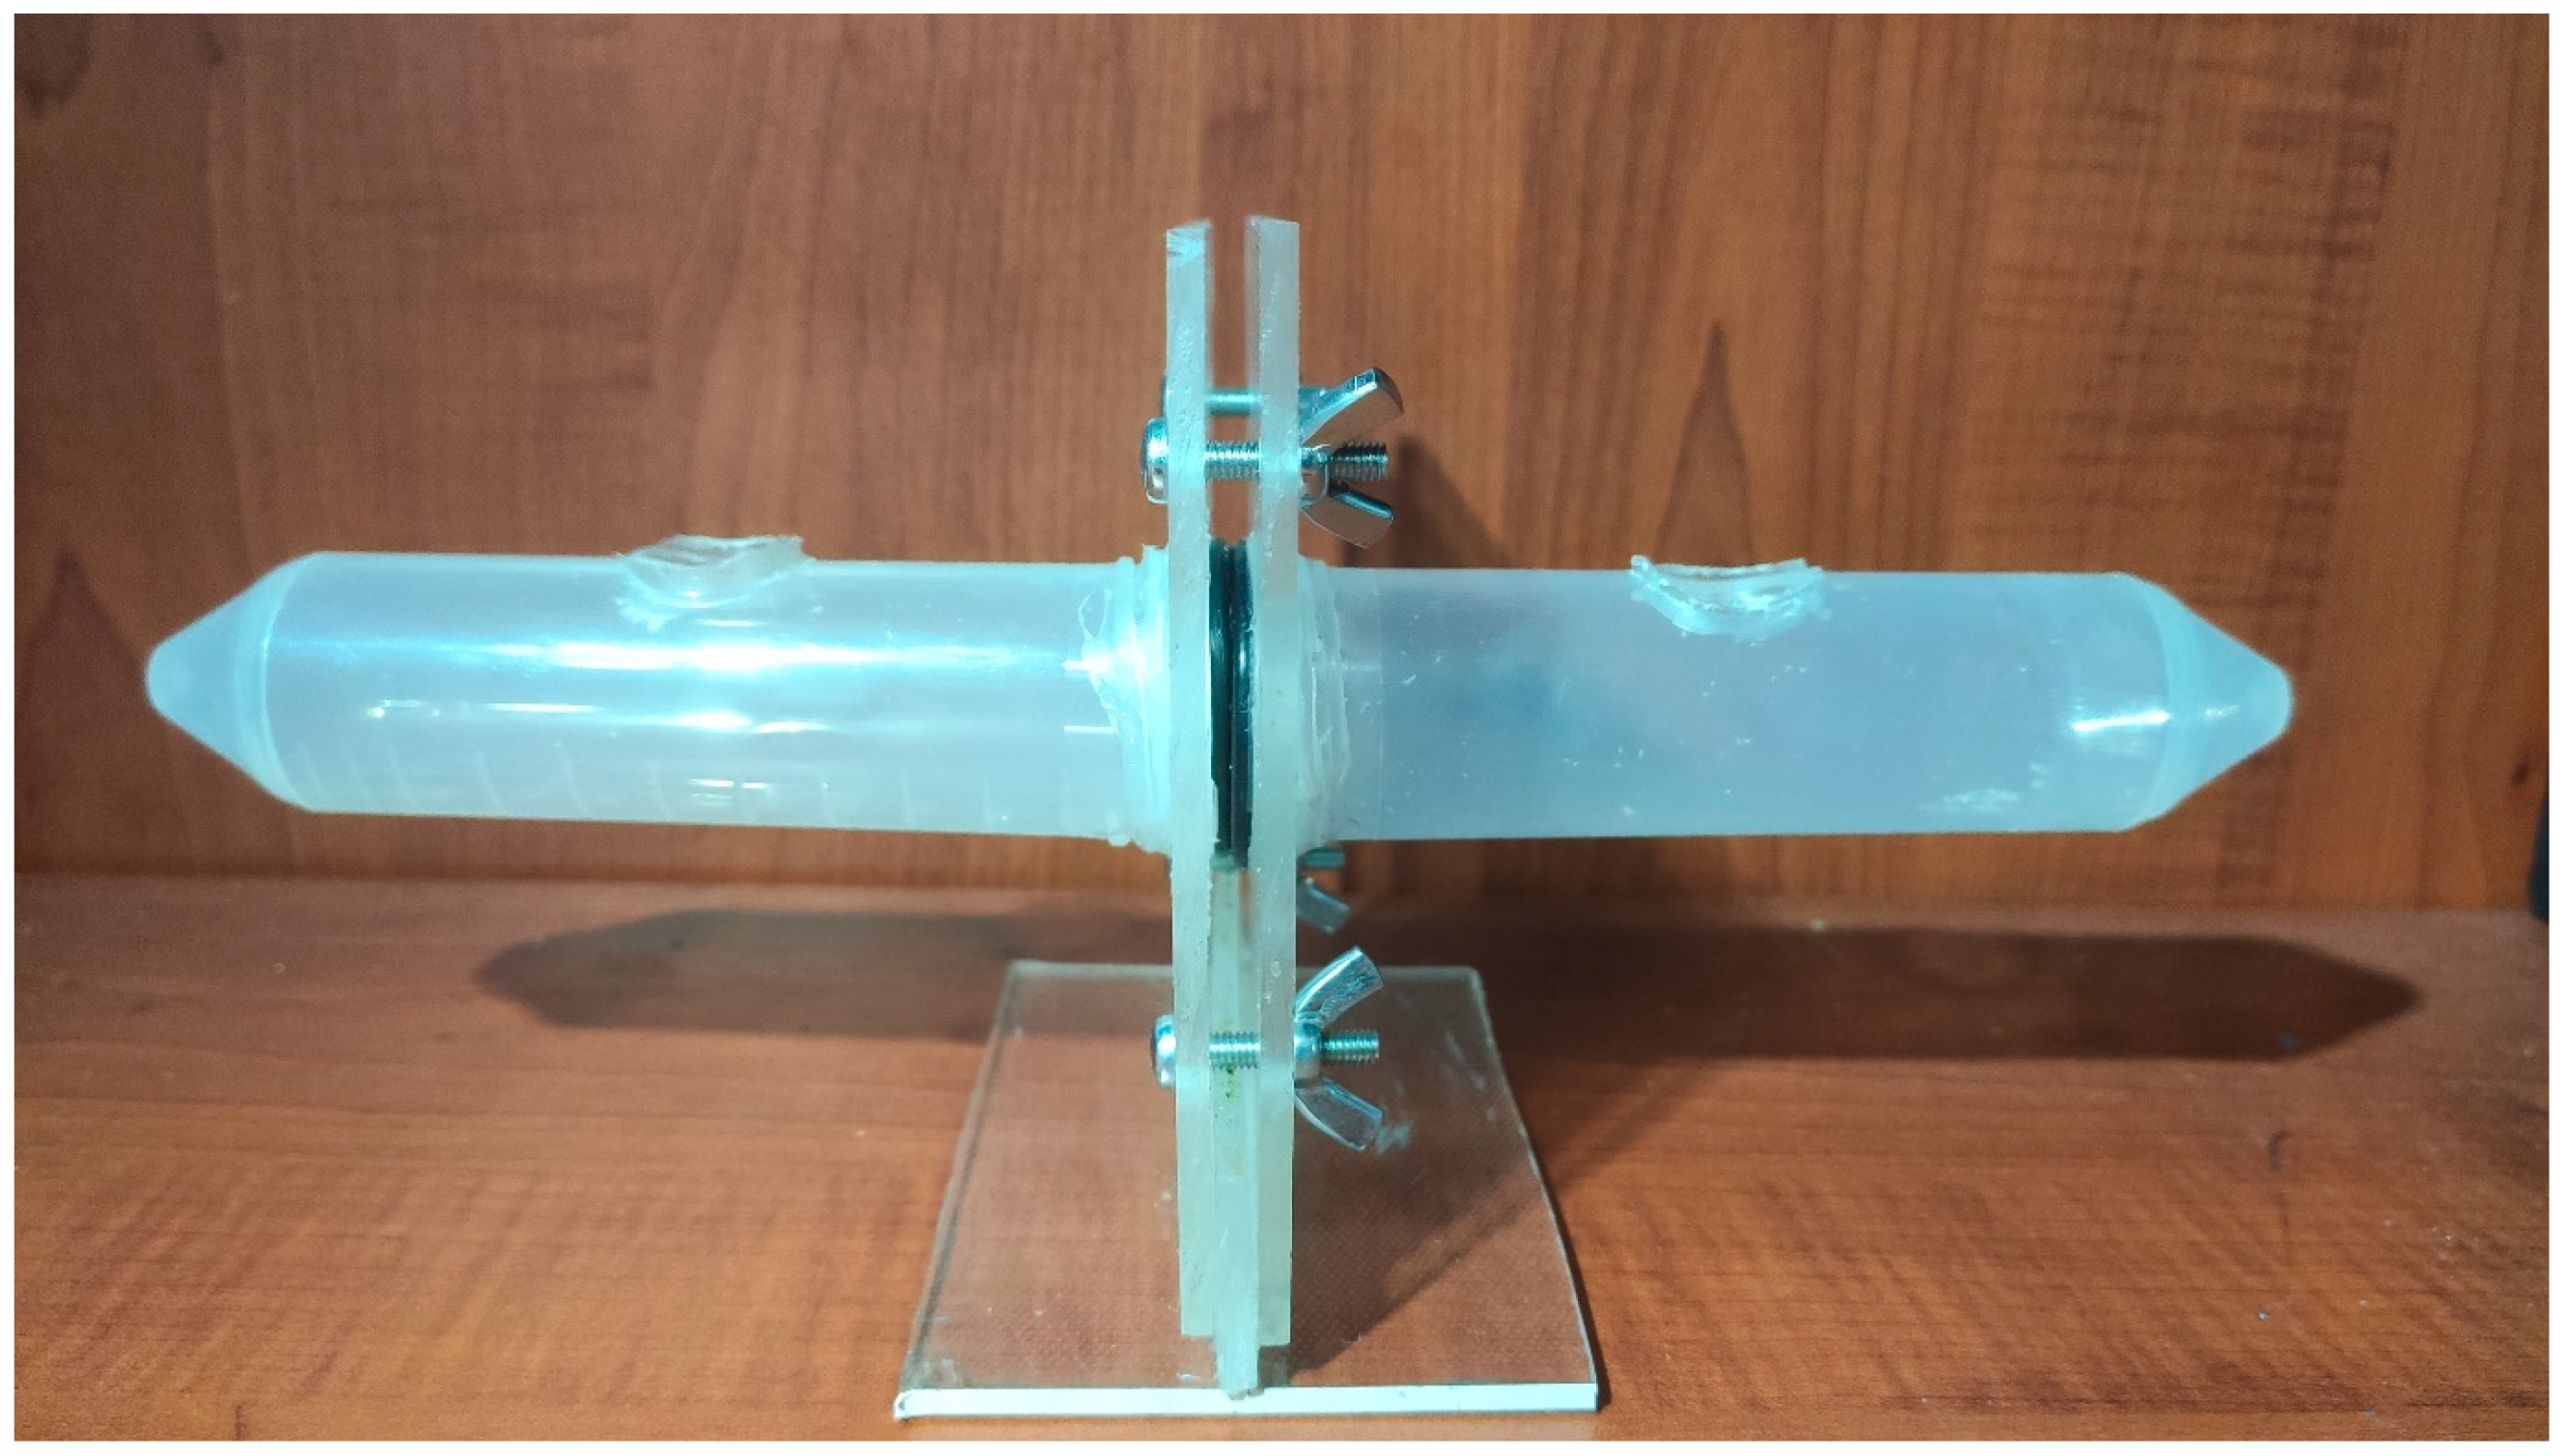
4.1.2. Experiment setup prototype
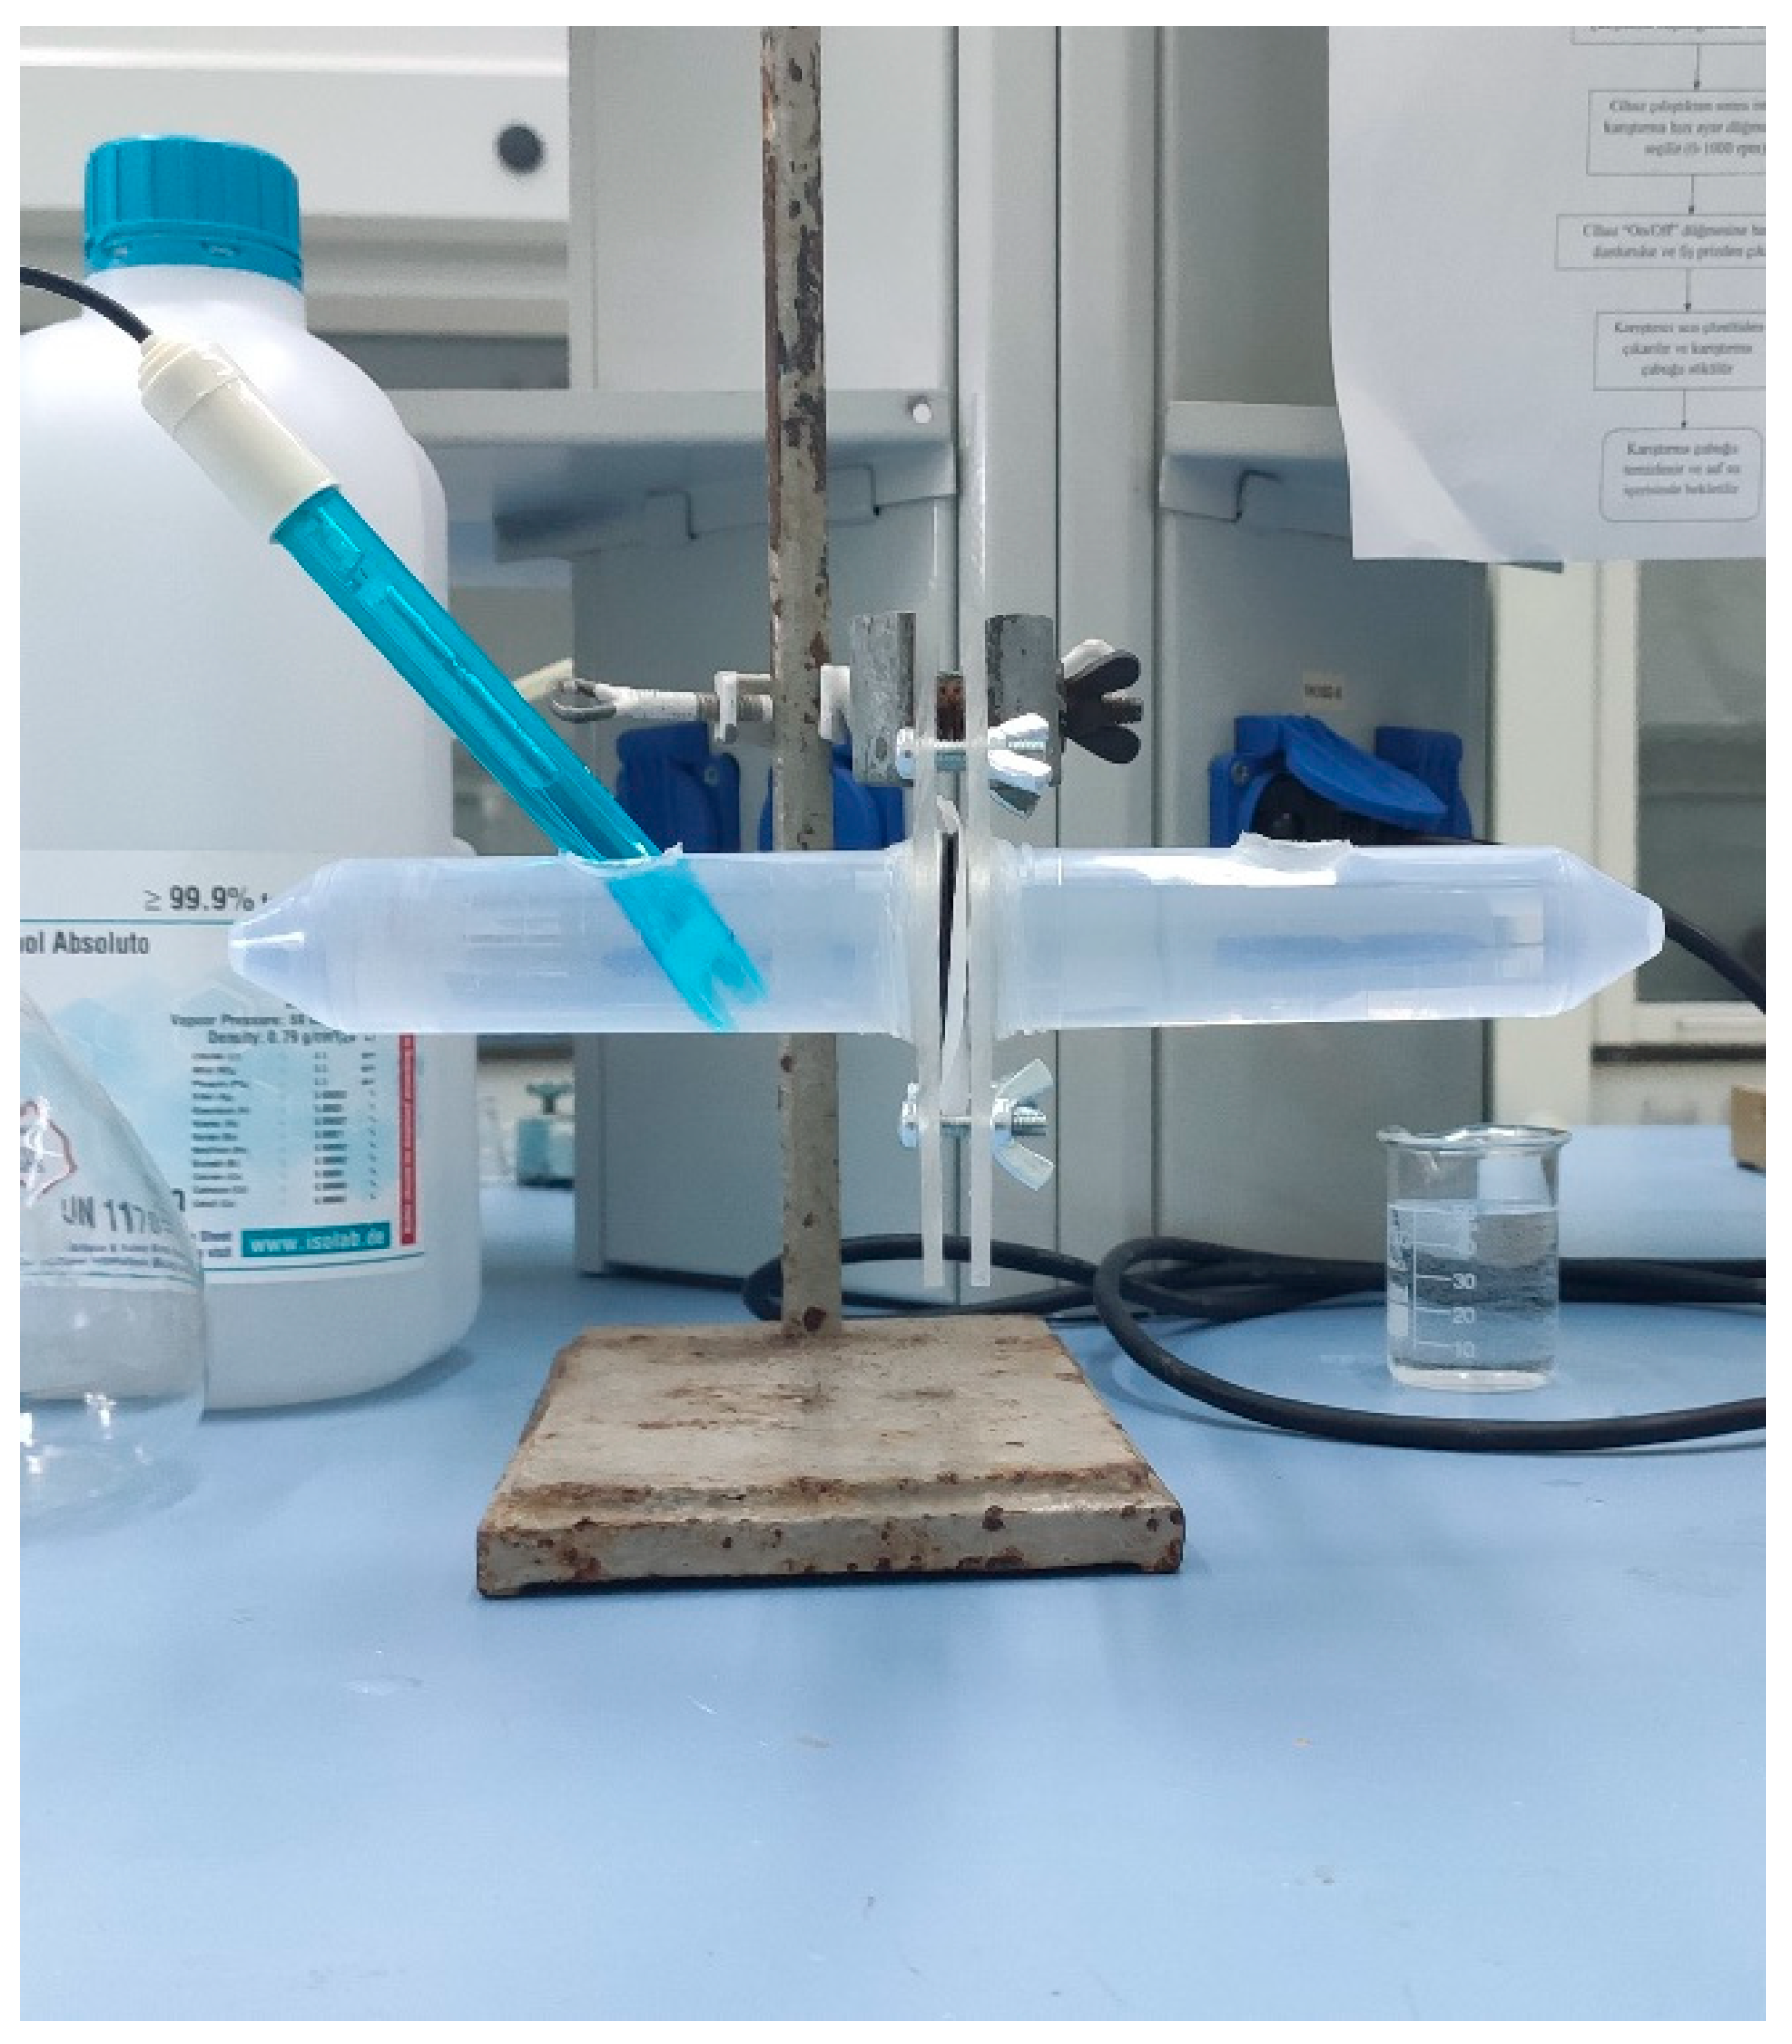
Figure 4.2.
Experiment Setup Prototype.
Figure 4.2.
Experiment Setup Prototype.
This device is prepared to test if proton conductivity of polymer membranes could be tested using pH change. This is prepared by using two 50 ml falcon tubes drilling holes onto them. Preparing two square plastic plates to hold them and drilling spaces according to the falcon tubes then applying silicone to stick each other. After those 4 holes in plates. O-ring seals are placed at the end of falcon tubes to the side which membrane will be placed to prevent any leakage. Usage of this is fairly easy prepared membrane for test will be placed between O-ring seals bolts nuts will be tightened it is important to not tighten too much and also each side should almost equal tightened to prevent any problems in future. From the holes in the falcon tubes acid to one side and base solution to other side will be filled and after that to the base side pH probe will be placed and pH change will be recorded until.
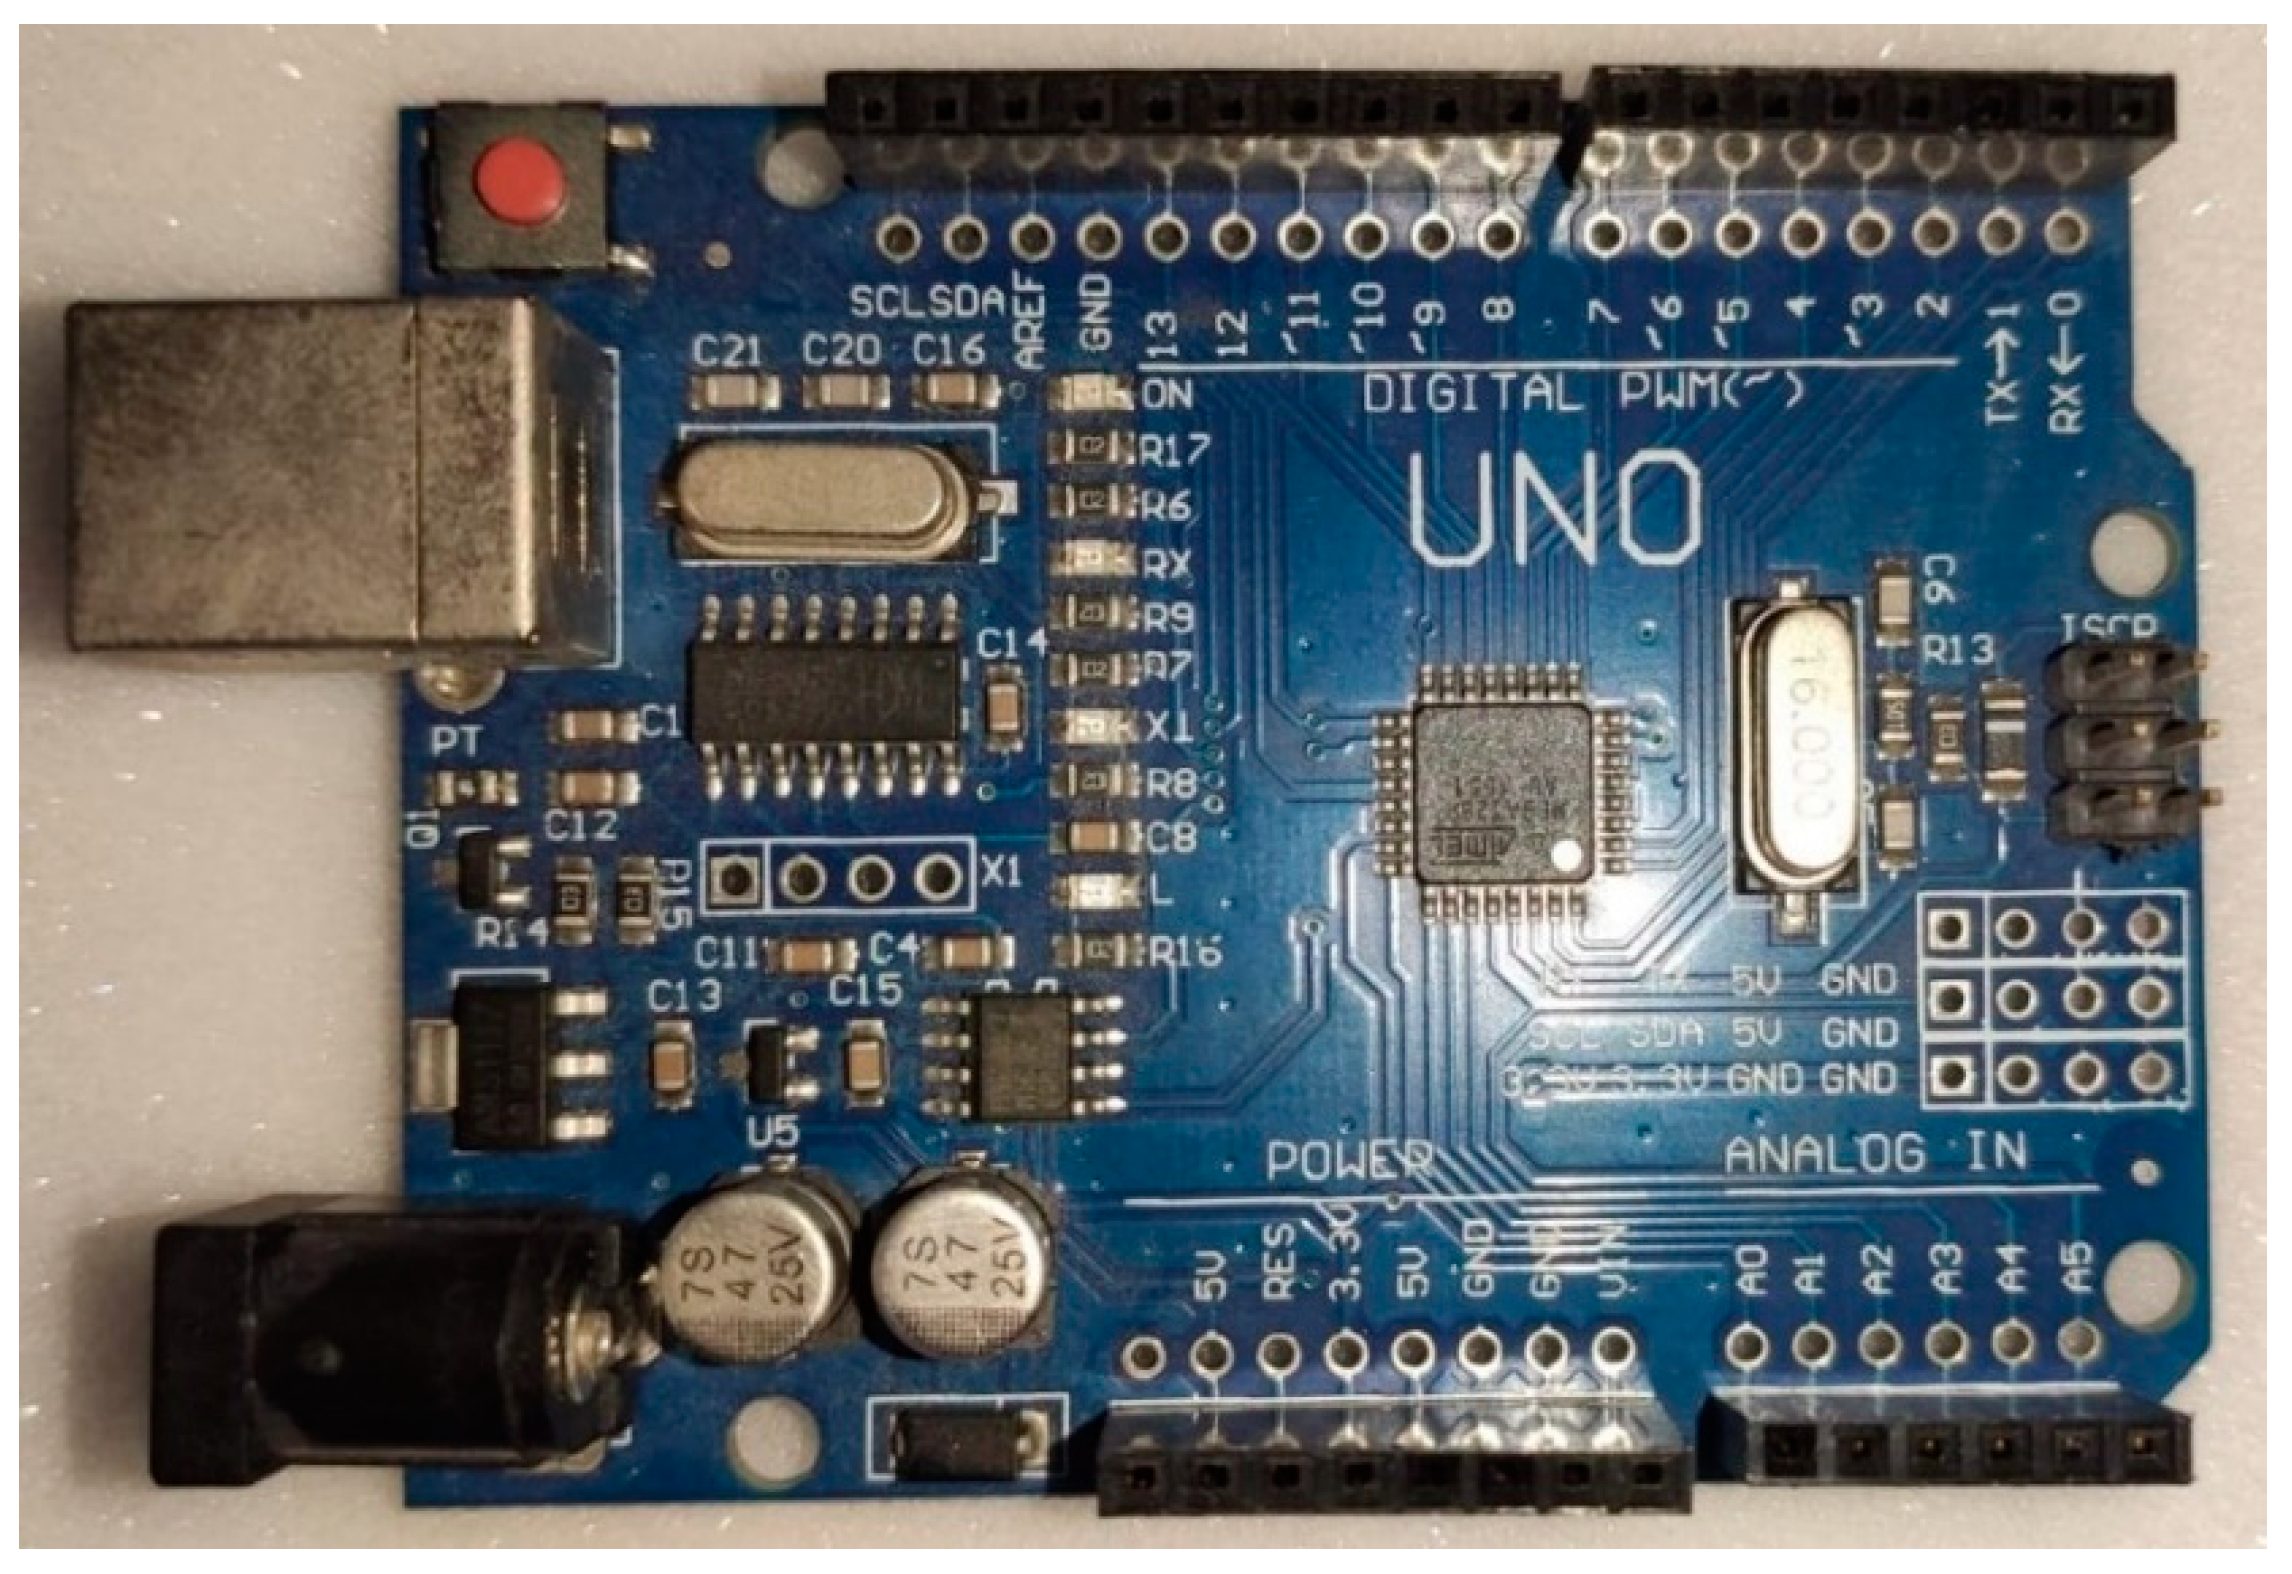
4.1.3. Arduino Uno
Arduino is an open-source electronic circuit hardware and software or mostly known as a microprocessor. In this research its main role is to make the connection of pH probe to the computer so the data can be recorded easily.
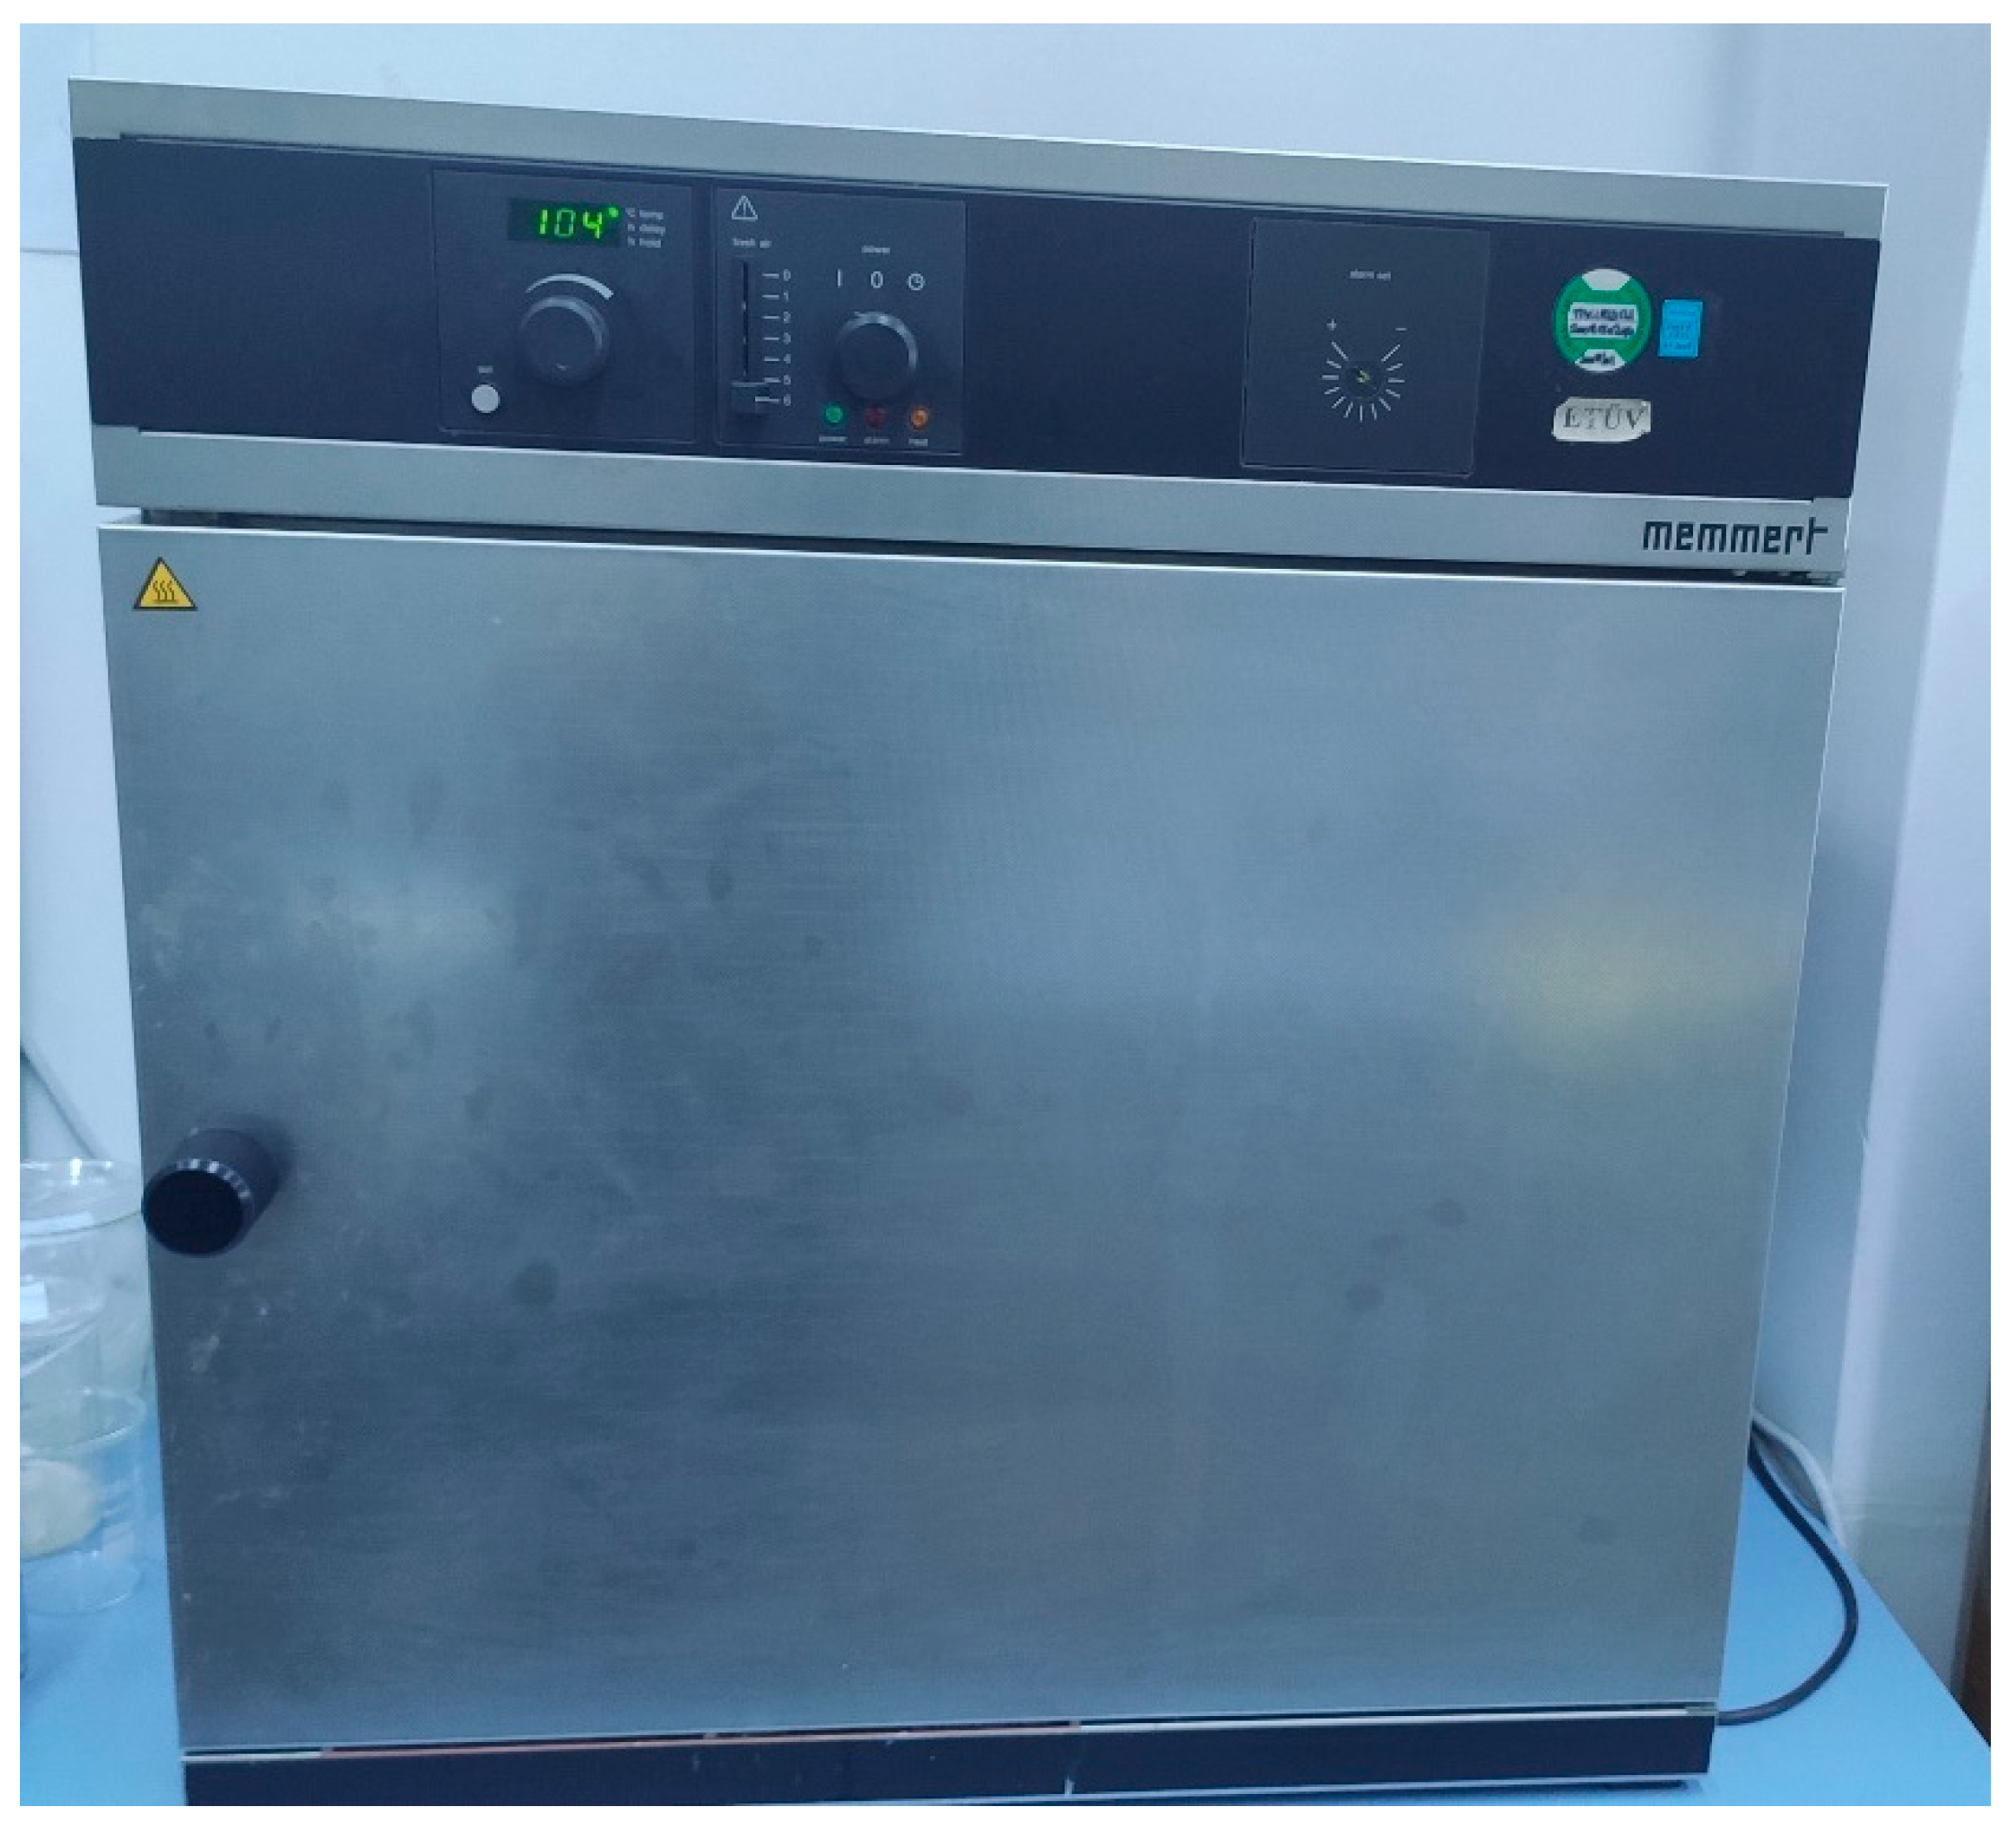
4.1.4. Memmert ULE 500 oven
Figure 4.4.
Memmert ULE 500 oven.
Figure 4.4.
Memmert ULE 500 oven.
The Memmert ULE500 is a forced convection oven that features a 6-step regulation of ventilation (fresh air supply); is constructed from acid resistant steel; has an auto-diagnostic system with failure indication; and manually set alarm for too high temperature [4]. The temperature range is between 20°C to 220°C.
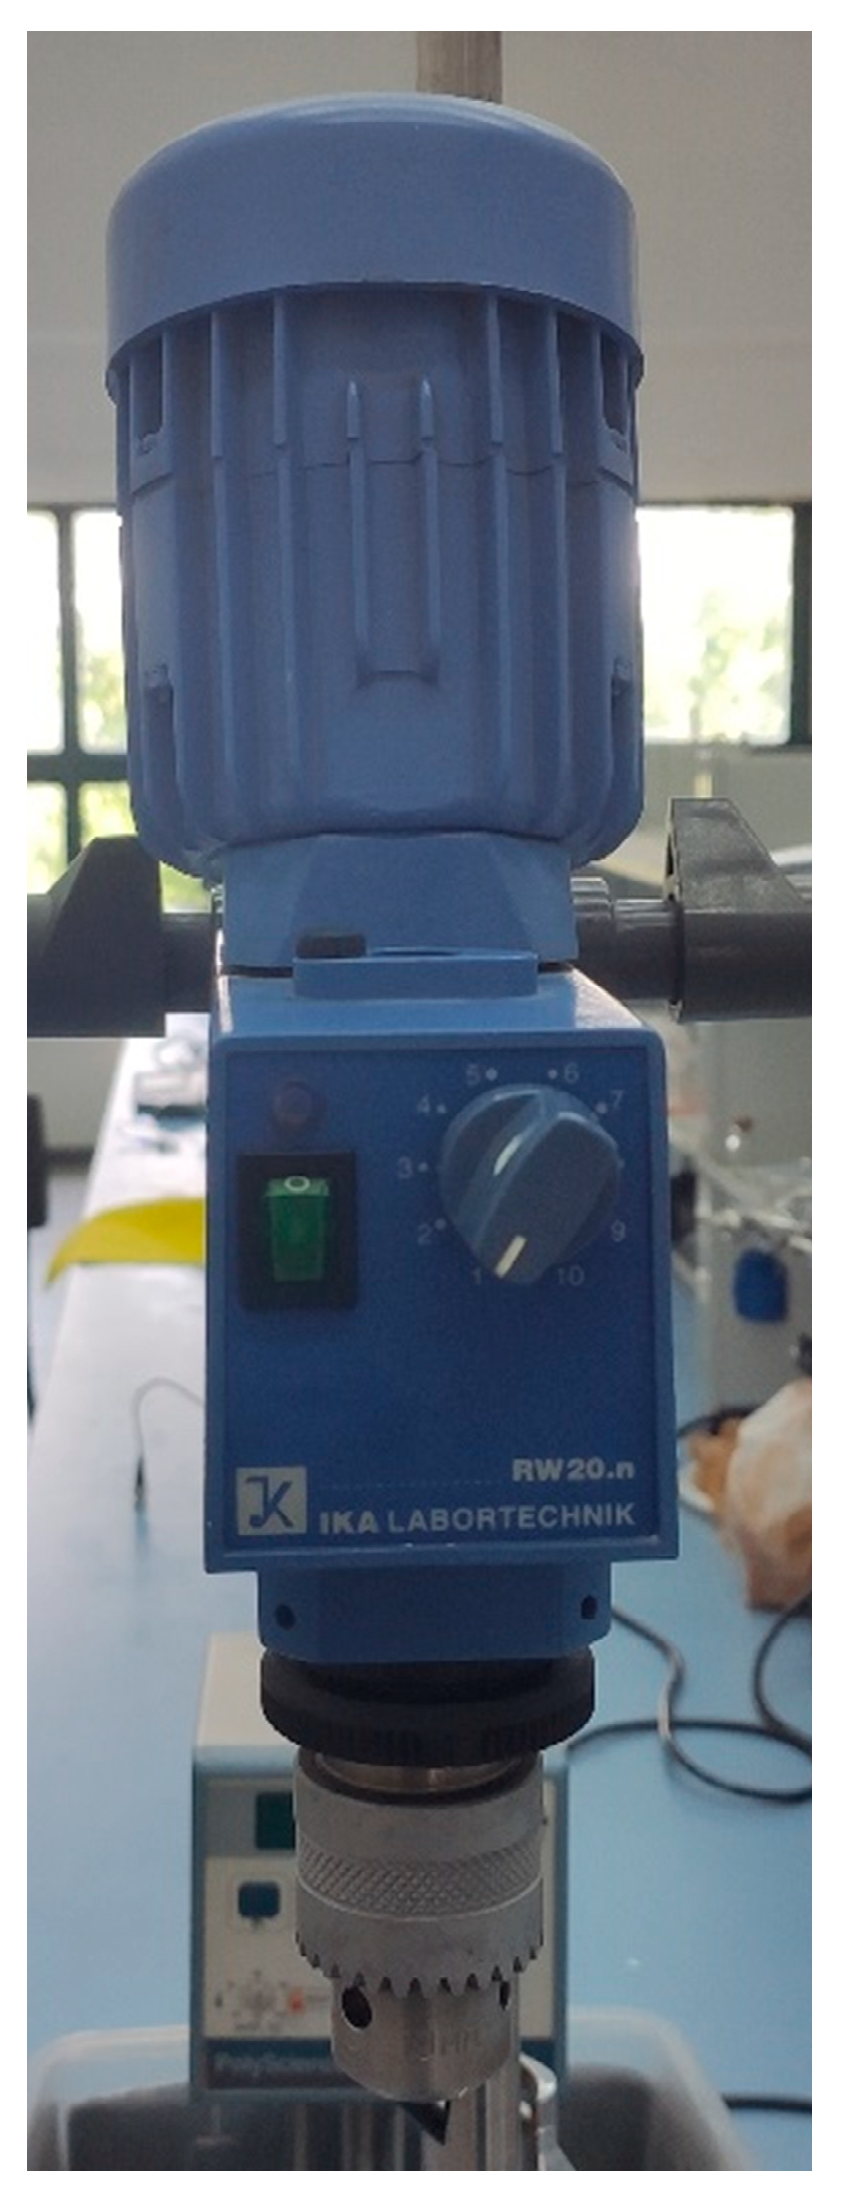
4.1.5. Ika works RW 20.n S1 overhead stirrer mixer
Figure 4.5.
Ika works RW 20.n S1 overhead stirrer mixer.
Figure 4.5.
Ika works RW 20.n S1 overhead stirrer mixer.
Overhead stirrer mixer with two different speed modes. Rpm range is from 60 rpm to 2400 rpm. Rpm ranges change according to the used electricity frequency being between 60 Hz or 50 Hz.
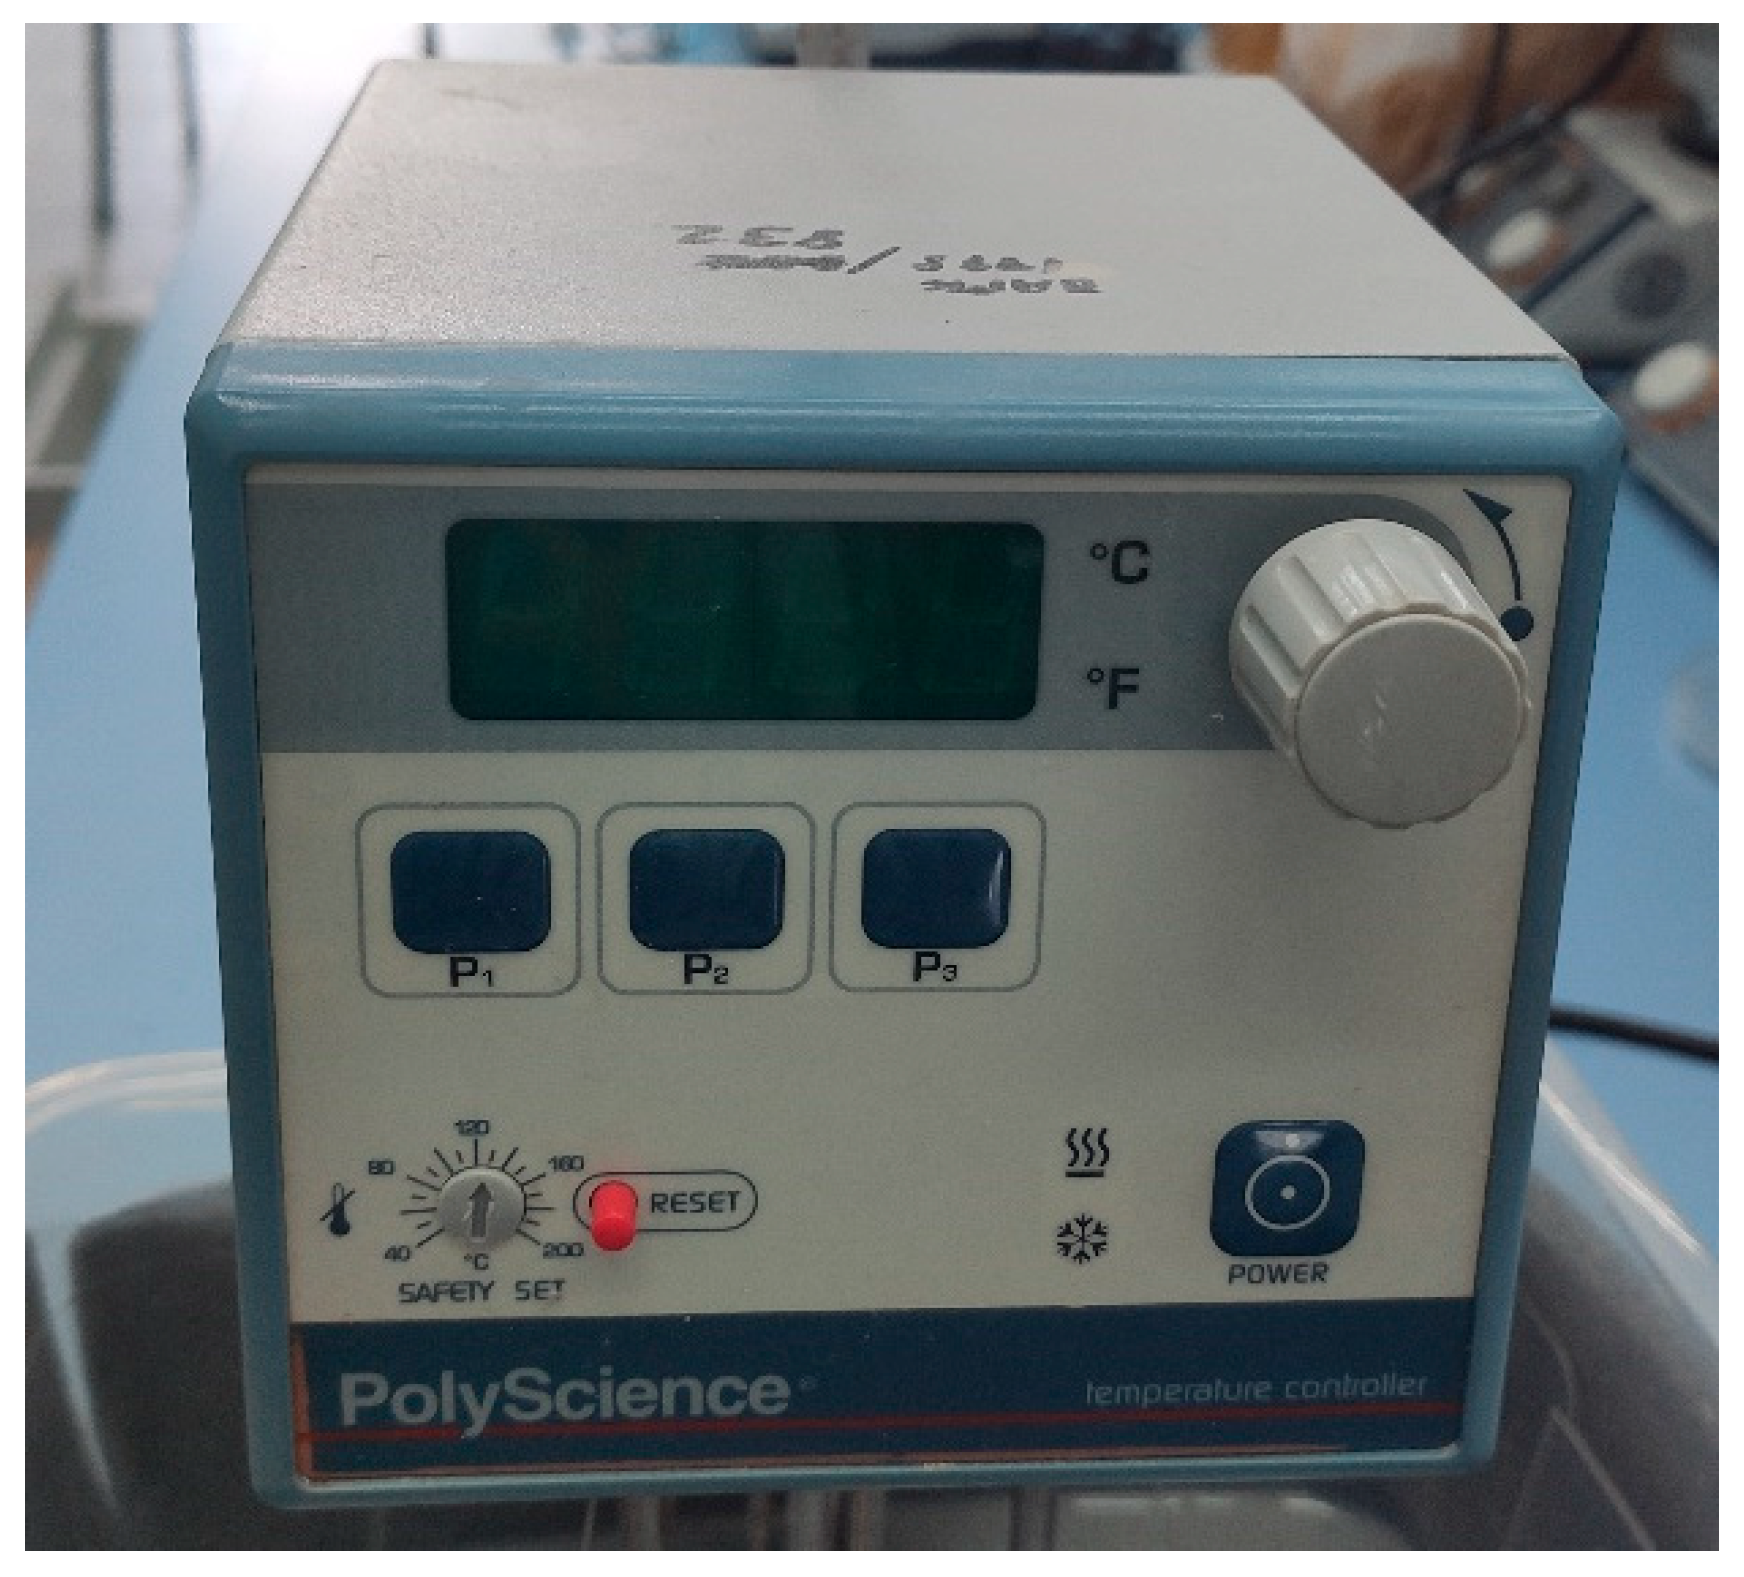
4.1.6. Polyscience immersion circulator
Figure 4.6.
Polyscience immersion circulator.
Figure 4.6.
Polyscience immersion circulator.
These immersion circulators feature proportional temperature control and high-temperature and low-level cutoff. Advanced multi-speed pump minimizes turbulence in small tanks while providing greater uniformity in large tanks. A directable nozzle lets you set the direction of pump flow and accepts 13-mm ID tubing LED display reads temperature in °C or °F. Rapidly change set point with rotary encoder or with three user-selectable preset temperature set points [5]. It can go up to 150°C and has 1000-Watt heater and can pump up to 15 L/min.
4.2. Experiment Design
In this search, the main goal is to prove that it is possible to use pH change to get information of proton conductivity of polymer membranes. The idea is simple if two different pH are provided across the membrane without any leakage from the sides, H
+ ions or protons in this case would travel from acidic side to basic side trough the membrane. So, if pH of one side constantly observed through the time and recorded it would show the information about proton conductivity of the membrane. It is possible to take samples periodically or use some pH meter to record its values periodically, but this would not give clear data. So, in this experimental setup DFRobot’s Gravity: Analog pH meter V2 set is used which can be seen in Figure 3.1. This is a pH probe set which includes an Arduino connection which will be connected to MATLAB and continuous recording of the pH values will be collected as a pH-time graph. From this point it would be possible to either compare graphs or get change rate of the H
+ ions trough membrane using some basic formulation.
If Equation 3.1 and 3.2 is used for second change of pH data, concentration change of hydrogen per second would be obtained and if two sides of the membrane have equal amount of solution in volume calculation could be continued using below equations.
Using Equation 3.4 it is possible to obtain mole change of hydrogen per second. Which will give clear correlation of proton change across to membrane. This data can be also prepared as a proton exchange rate – time graph and will be easier to compare. But while using this method should have to be careful as all the information indirect and comparative so while making comparison all the properties of setup should be same for compared membranes or a standard for the experiment should be prepared by the researcher to be able to use any data from any time to compare with each other.
Also, as the membrane needed to be still and have to liquid container two sides and there should be a place to fill and put probe in those containers also, will be different membranes tested, a membrane holder which can be easily changed for different membrane tests needed and a prototype is prepared which can be seen in Figure 3.2.
4.3. Materials
Poly Vinyl Alcohol 4-98 (Arkem Kimya A.Ş), Phosphoric Acid %85 (Food Grade) (Aromel Kimya Medikal A.Ş), NaBr Chem Pure (Aromel Kimya Medikal A.Ş), Hydroquinone, 1% w/v (Pharma Kimya), Poly (acrylic acid-co-maleic acid) solvent avg. Mw: 3000 50 wt.% in H2O (Aldrich Chemistry), L(+) Tartaric Acid (Carlo Erba Reagents S.A.S), Zeolite, type ; ZSM-5 (Acros Organics), Hydrochloric Acid Fuming %37 (Merck), Sodium Hydroxide (J.T. Baker) used during the experimental part of the research.
4.4. Preparation of the Membranes
4.4.1. (PVA)0.7(NaBr)0.3(H3PO4)xM membranes
This membrane preparation procedure is made according to the (Ahmad & Sheha, 2013) with some changes like decrease in the hydroquinone and not using ethylene carbonate. This membrane prepared as two sets one being without any acid, 0 Molar H3PO4 and one being with 5.1 Molar H3PO4 addition of 1 ml to the solution.
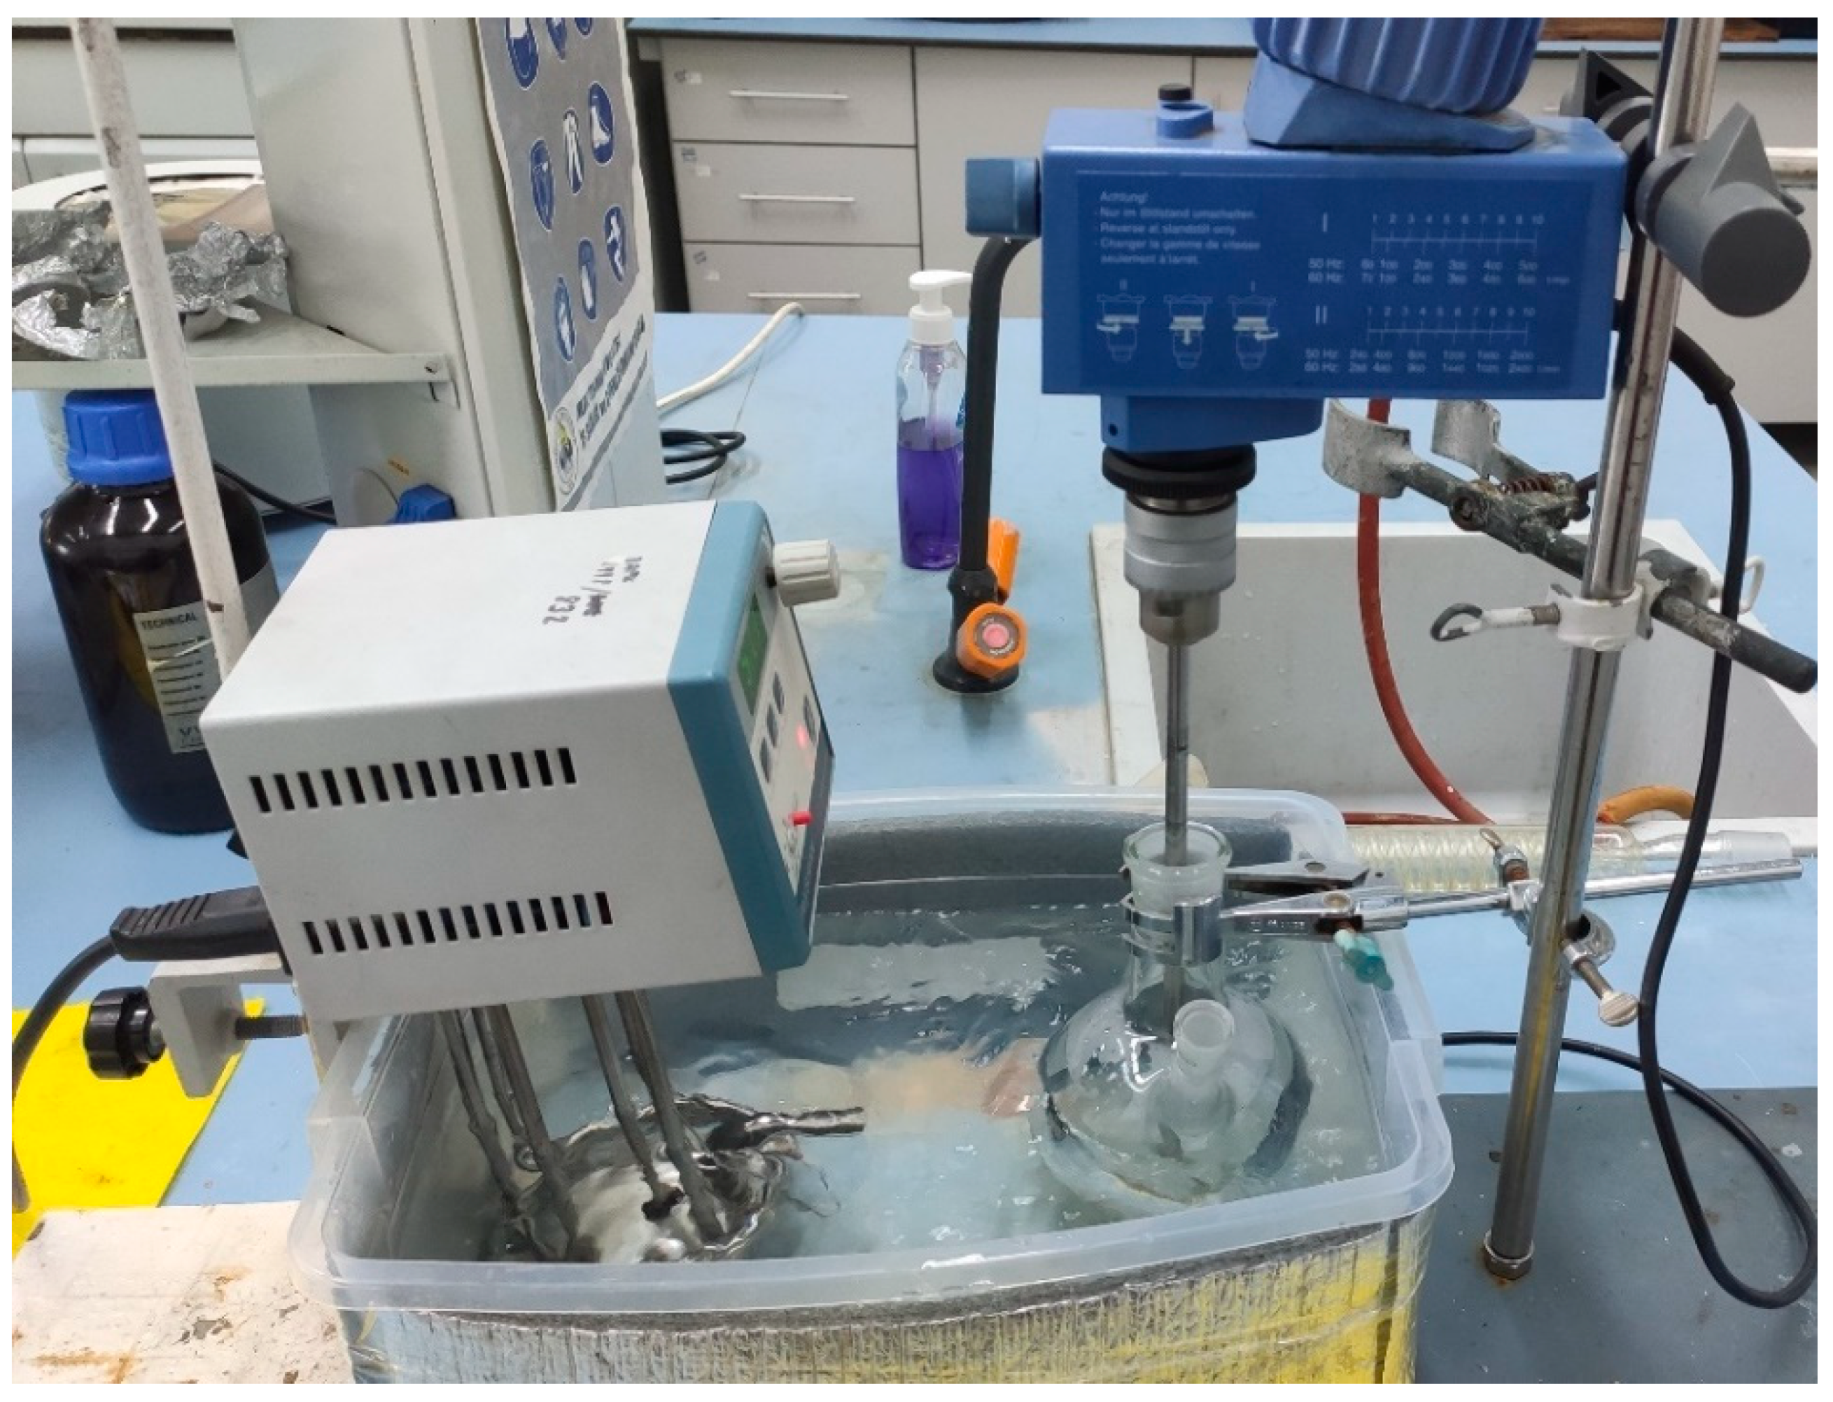
Figure 4.7.
Heating and mixing apparatus used for preparation of the polymer solution.
Figure 4.7.
Heating and mixing apparatus used for preparation of the polymer solution.
7% PVA (w/v), 3% NaBr (w/v), %0.4 Hydroquinone (w/v) solution prepared and put into the reactor flask. Reactor flask placed into the water bath that prepared using immersion circulator at 90°C, to obtain 90°C in the reaction area temperature is set to 95°C in the heater. After that prepared solution is mixed vigorously using overhead mixer. The used apparatus design can be seen in Figure 4.5. Also, after starting immersion circulator the open are closed by the aluminum foil to minimize any heat loss.
After all solid particles were dissolved in the solution prepared solution is taken and split into two. Two one of them 1 ml of 5.1 molar H3PO4 added. For membrane preparation solvent casting method used prepared solutions are casted to the petri dishes and left for drying at 50°C overnight.
4.4.2. PVA/PAMA (poly (acrylic acid-co-maleic acid) membranes
To obtain more water-resistant polymer to use in the experiment PVA is crosslinked with PAMA procedure is derived using the (Aung et al., 2019) which is evaluation of the thermally crosslinked PVA/PAMA polymers using the microneedle method. Even though this research solvent casting method used this article used as a base point for polymer procedures. Two different methods are tried in this type of membrane.
%20 PVA (w/v) solution is prepared in 90°C hot water bath with vigorous mixing the same way mentioned in (PVA)0.7(NaBr)0.3(H3PO4)xM preparation part in the same bath PAMA is added in the 1/4 ratio (v/v) of the PVA and mixing continued for 30 minutes. Again, two different sets prepared, one without any acid and one with 1 ml of 5.1 M H3PO4 solution is added. Prepared solutions casted to the petri dishes and plexiglasses and put into 100°C oven for 1.5 hours. After that they left for totally drying for at least 1 day.
In the second method the same things are done other than this time PAMA is not added to hot water bath conditions, but PVA and PAMA solutions are mixed in the room temperature conditions.
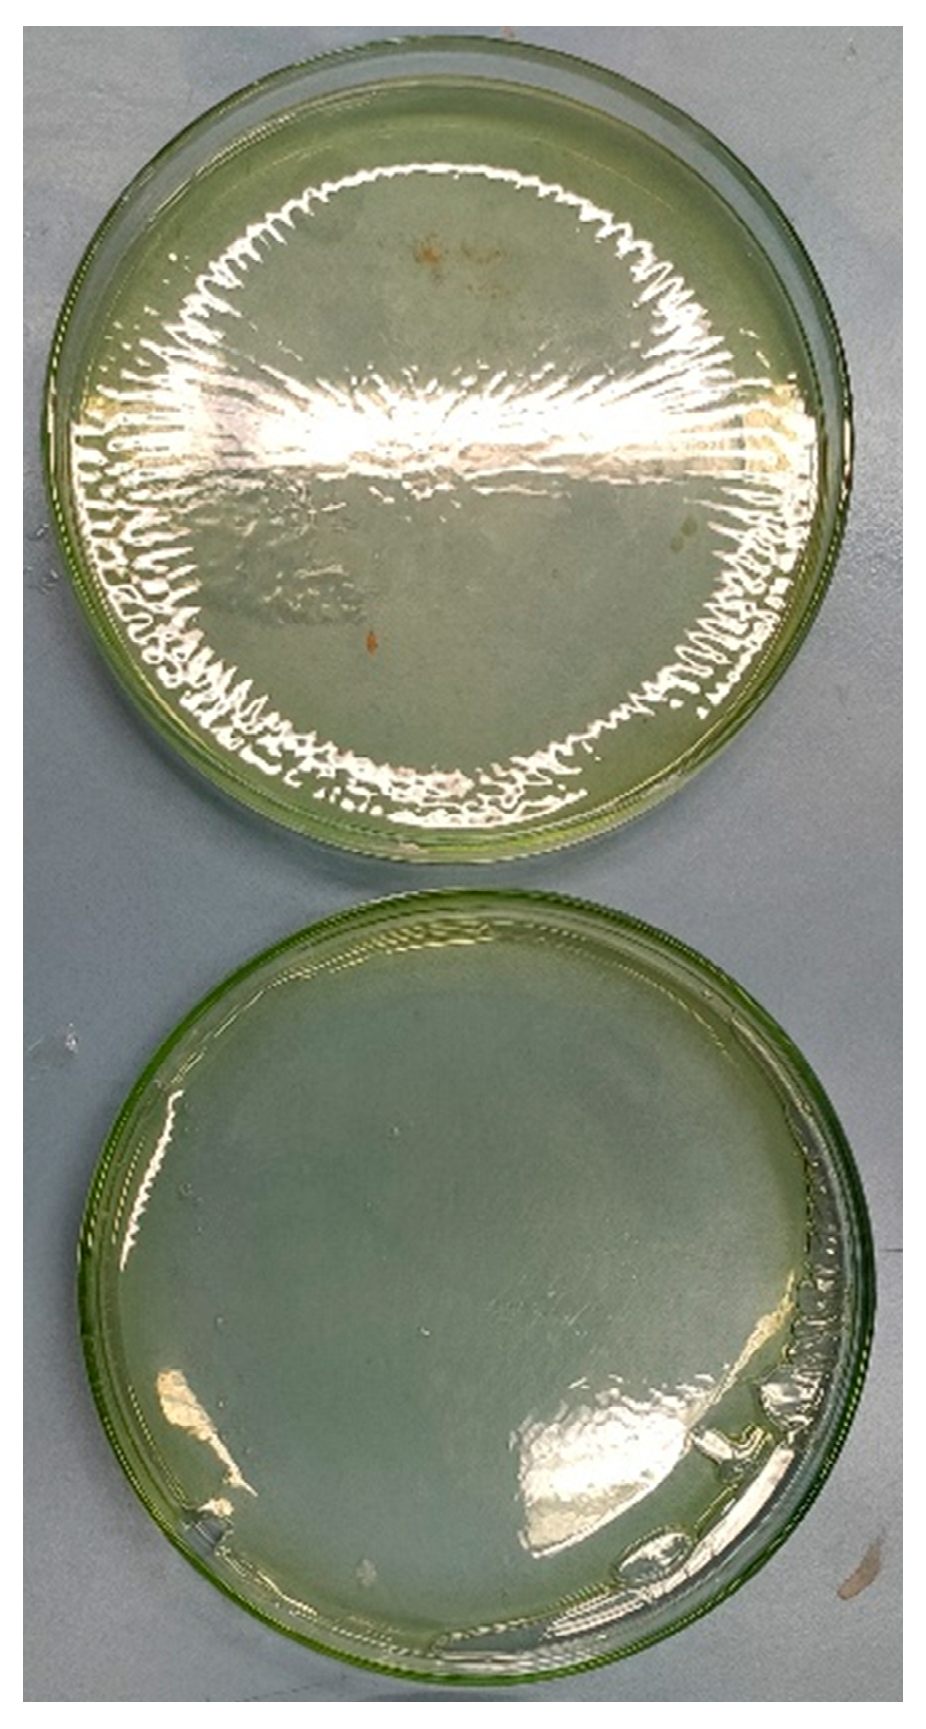
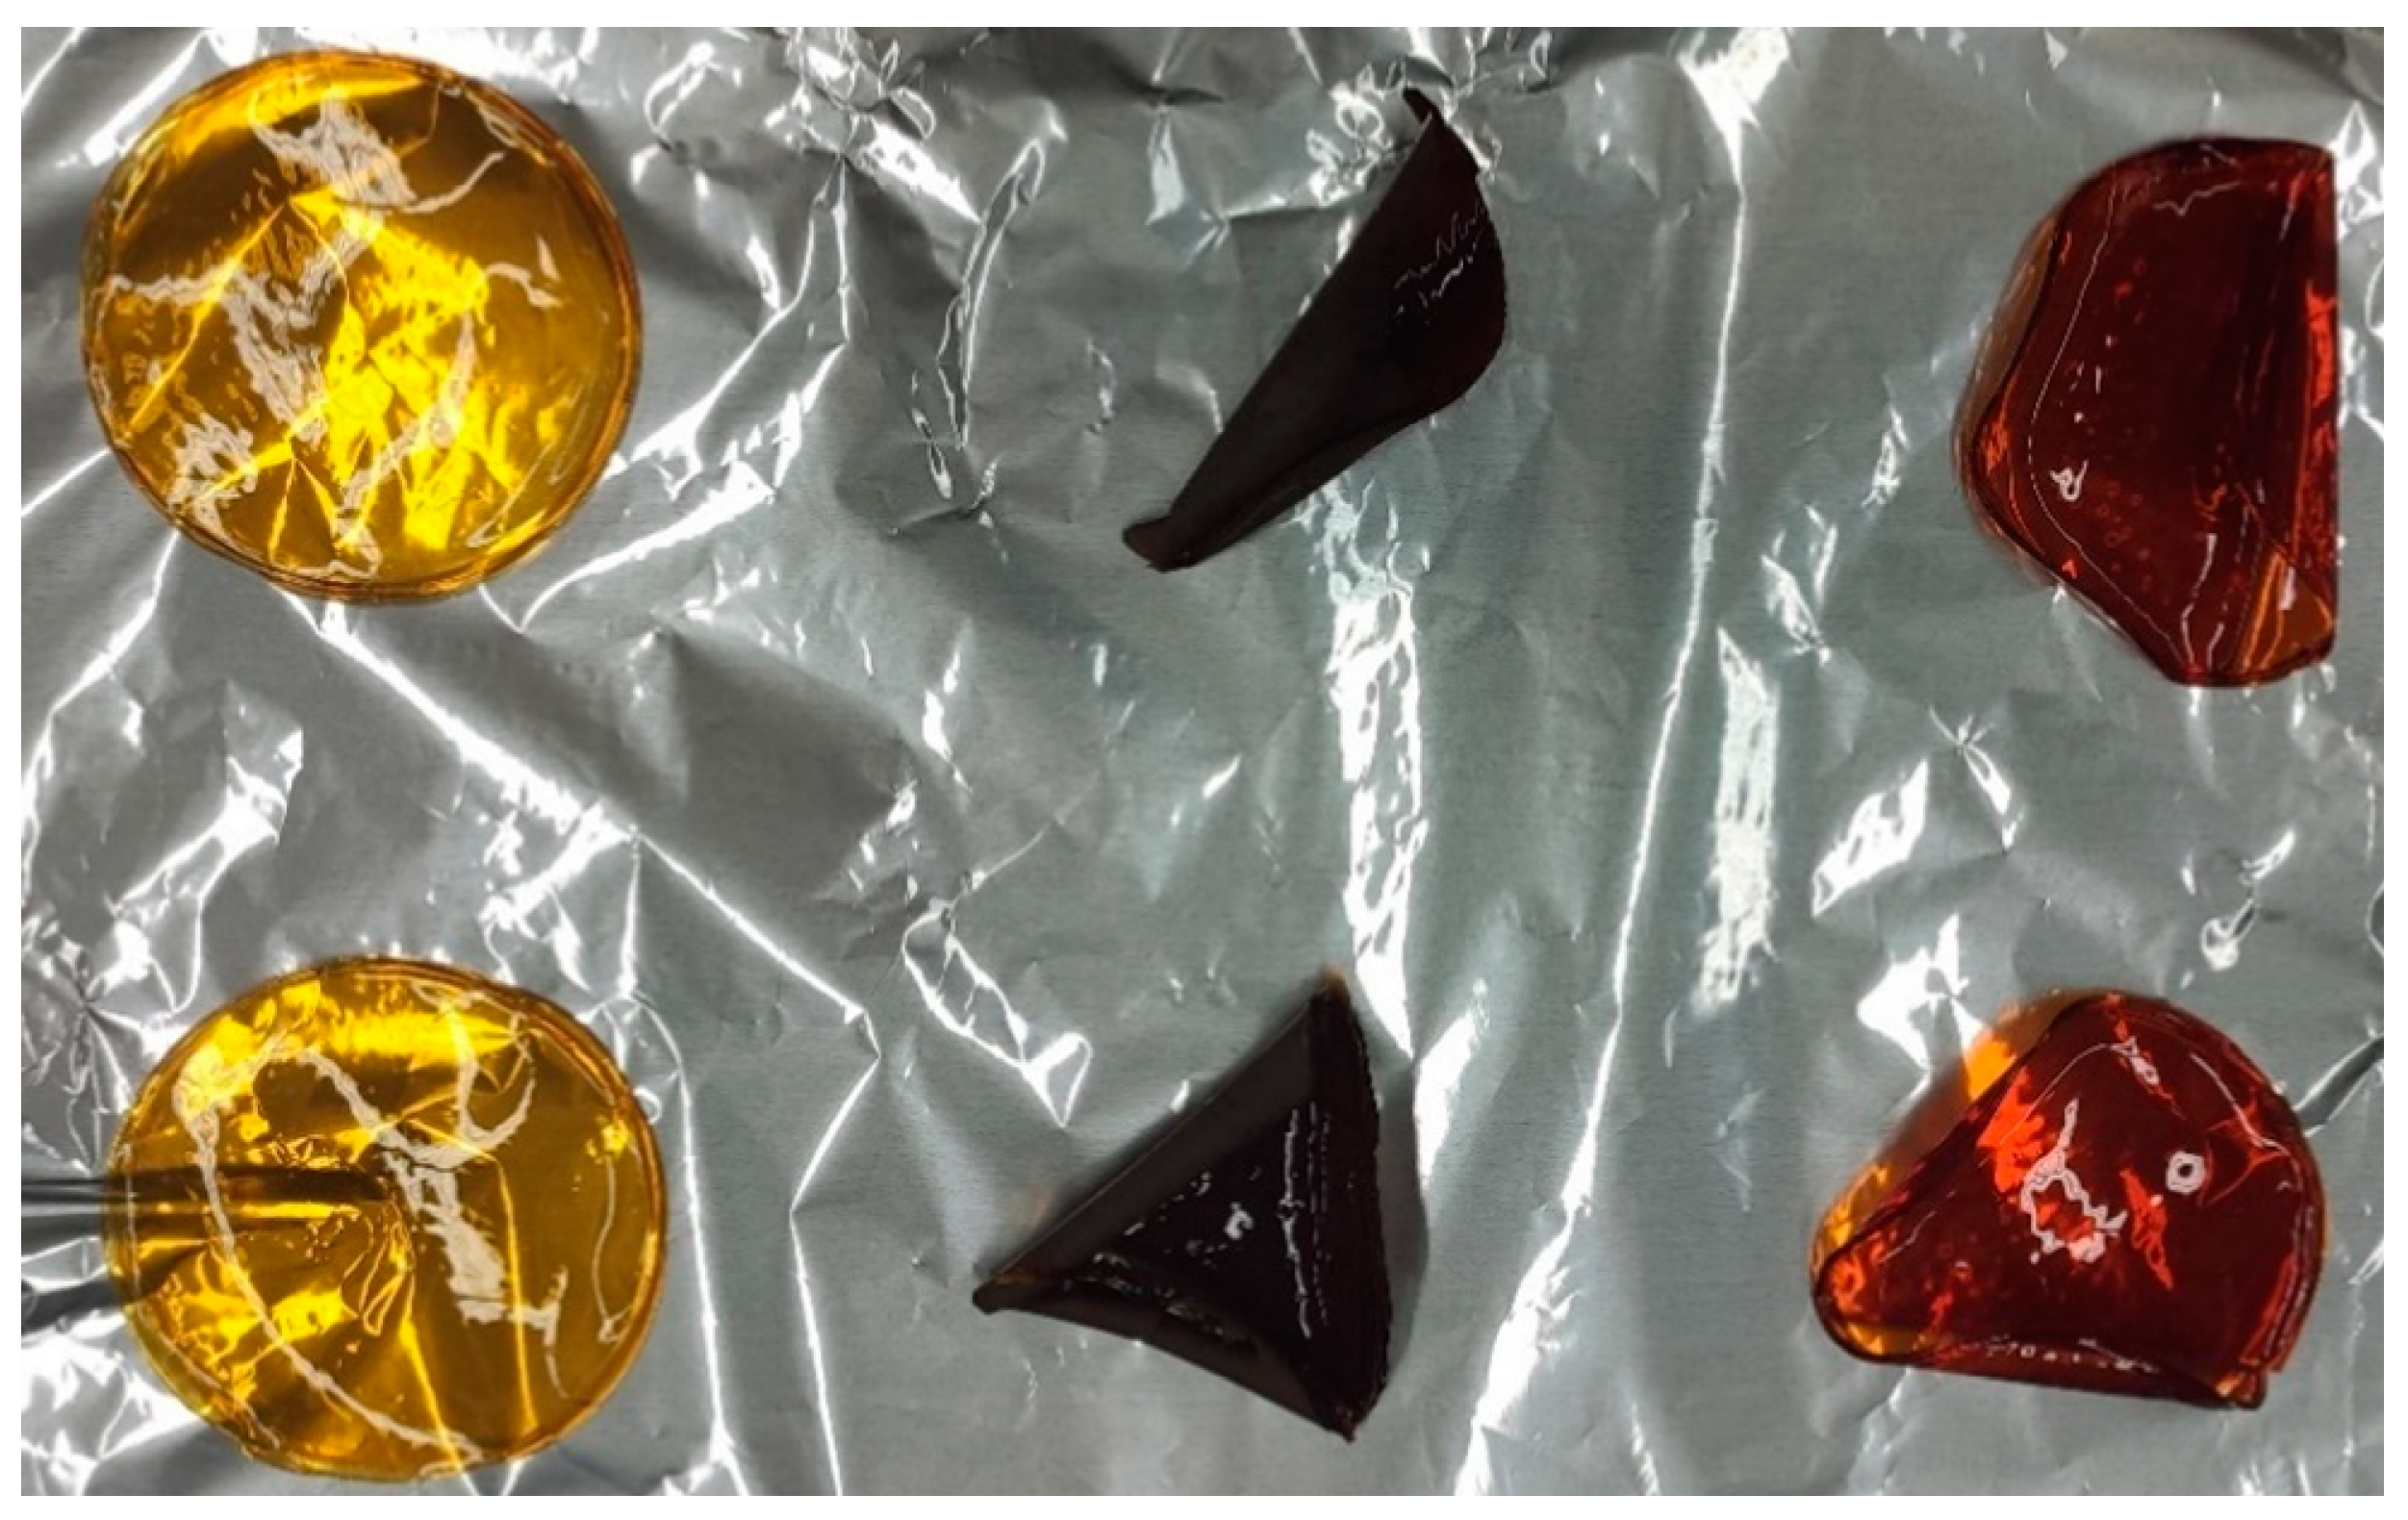
In Figure 4.8 two of the membranes can be seen which ended in yellowish colors. There is no noticeable difference between the H3PO4 added ones and others.
Figure 4.8.
PVA/PAMA membranes before peeling.
Figure 4.8.
PVA/PAMA membranes before peeling.
4.4.3. PVA tartaric acid membranes
Firstly %20 PVA (w/w) is prepared using 90°C hot bath and vigorously mixed until fully dissolved. After that %20 (w/w) solution of tartaric acid is prepared in room temperature conditions, and it is added to PVA solution as it would be %20 of solid mass of the PVA. As both solutions were in %20 ratio the solution is prepared as exactly 1:5 mass ratio to obtain necessary solution. After this step, the prepared solution is separated into 3 and 3 different solutions are prepared. First one is left as it is, to second one zeolite ZSM-5 is added accordingly to be %10 of solid mass of the PVA in the solution and to each 100 gr of the solution 1ml of 5.1 M H3PO4 is added. As for the 3rd one only 1 ml of 5.1 M H3PO4 is added for each 100gr of the solution. After all the solutions are prepared, they cast into petri dishes and left in oven at 50°C to dry overnight. The next day membranes are peeled from the petri dishes and to make thermal crosslink in the polymer left in the 150°Cat oven for 1 hour.
As can be seen in Figure 4.9 there are clear color differences between the 3 different prepared membranes. The zeolite one was not suitable for any membrane properties as during the thermal crosslinking it wrapped around itself due to the heat and also got drop like shaped little deformations and spaces on the surface. For the only H3PO4 added version even though it was not perfectly in the shape as middle part was straight as needed it was suitable in the use for experiment.
Figure 4.9.
PVA Tartaric Acid membranes respectively from left to right PVA/Tartaric acid, PVA/Tartaric Acid/ Zeolite/H3PO4 and PVA/Tartaric Acid/H3PO4.
Figure 4.9.
PVA Tartaric Acid membranes respectively from left to right PVA/Tartaric acid, PVA/Tartaric Acid/ Zeolite/H3PO4 and PVA/Tartaric Acid/H3PO4.
4.5. Connections of pH Meter
Figure 4.10.
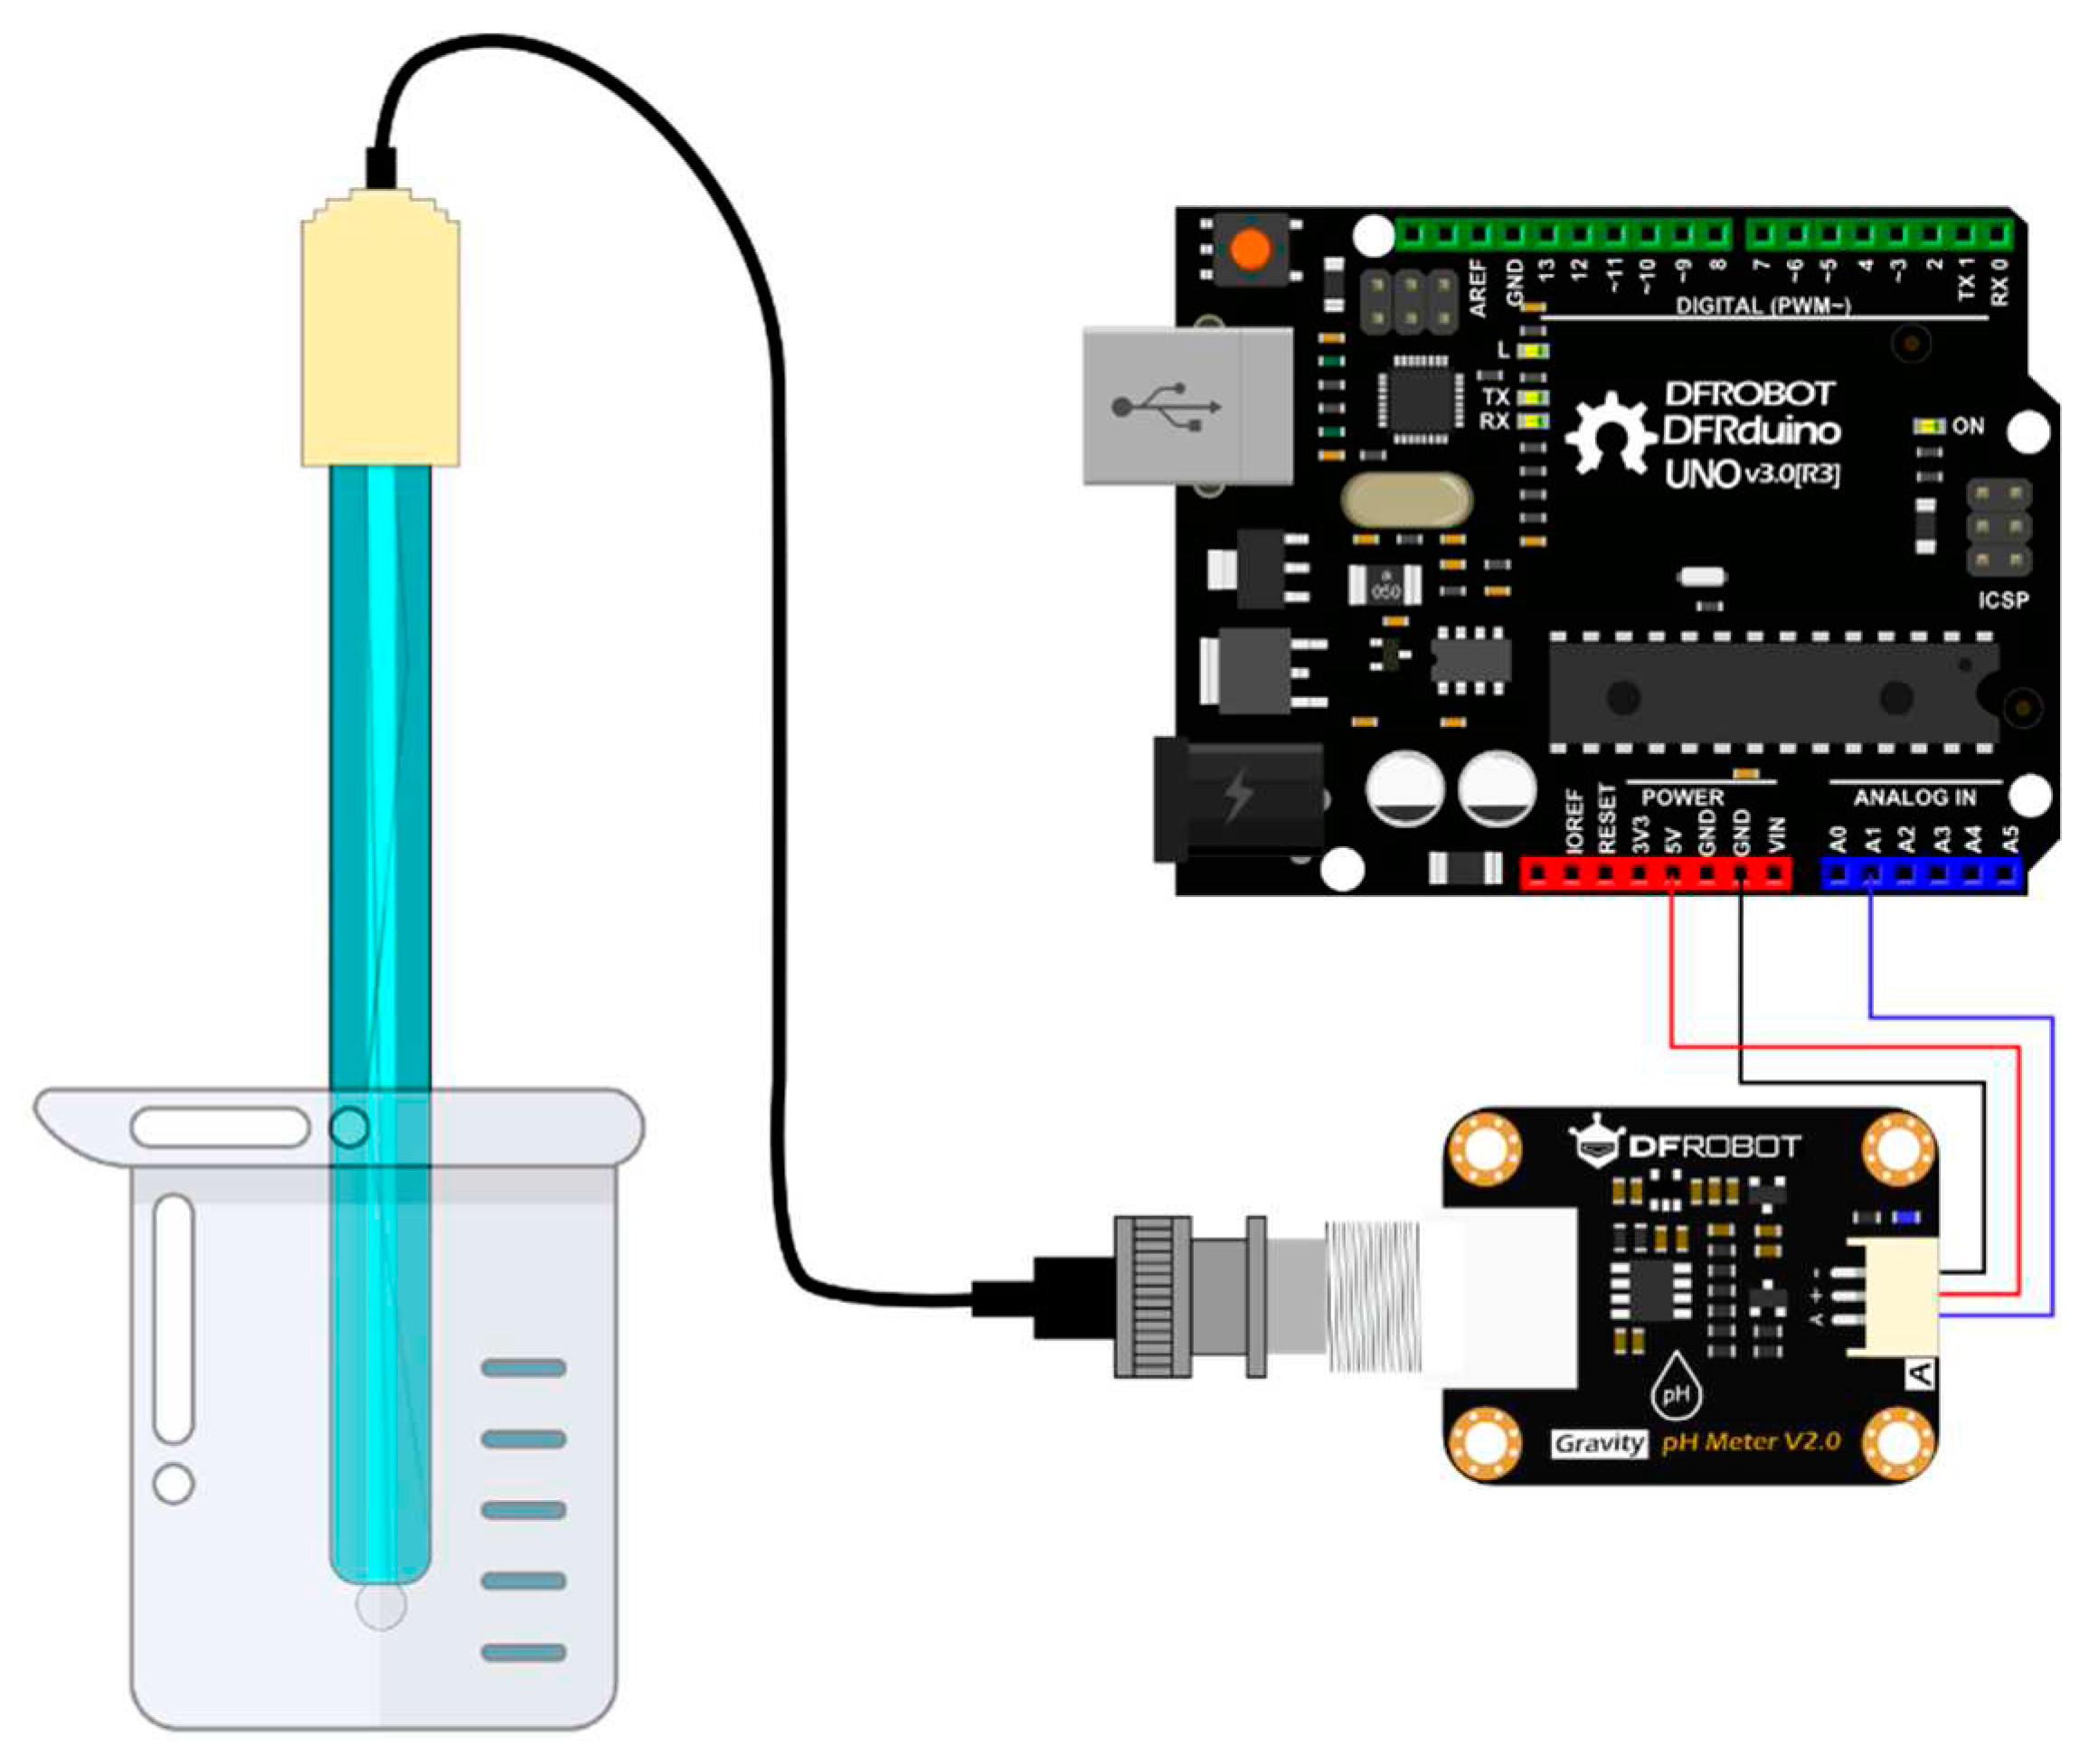
Connection diagram [1].
Figure 4.10.
Connection diagram [1].
Connection of the pH meter is made according to Figure 4.7 BNC connector is connected to signal conversion board. And signal conversion part is connected to Arduino as + of the board goes to 5 Volt port of Arduino, - goes to ground (GND) port of the Arduino and finally A port from board is connected to the desired analog port of the Arduino in this case A1. Even though a different model of Arduino is used in the research connections are still same as shown. Finally, the Arduino is connected to a suitable computer via USB.
4.6. MATLAB Codes
Normally the pH meter is used with Arduino using its own library prepared by the producer in Arduino compiler which uses very similar programming language like C. But in this case MATLAB wanted to use it to easily store, access and plot necessary data.
There are 2 different MATLAB program used during the experiment. First one which is the main code that was used during the experiment and the second one is an auxiliary code used for calibration of pH meter. To use pH meter with MATLAB, MATLAB Support Package for Arduino should be installed as only with this official add-on data can be obtained from the Arduino using MATLAB. The code takes electrical voltage readings from Arduino and changes it to the pH values for every second. Taken data is plotted as live in the graph and also pH values can be seen from MATLAB console every second. Intervals can be changed according to desired max time wanted to measure as when desired second goes to interval value the program will stop itself without manual stopping. But in this research, most of the time program is stopped manually after pH value gets to the stabilization point. After the program is stopped both graph and pH and time value are saved manually as .mat or .fig formats to gain access later.
Prepared MATLAB program uses linear equation method to calculate pH value from the electrical readings which can be seen in the Equation 4.5,4.6, and 4.7. These equations are taken from the Arduino library of the producer, but same changes are made to apply it in MATLAB.
In this matter pH7 and pH4 values are used as calibration points for the equations. PH is calculated as a linear equation. Equation 4.5 gives the slope; Equation 4.6 gives the intercept point and finally Equation 4.7 is used for calculation of the pH at any moment using that slope and the intercept point. The pH7 values and pH4 values in the equations are either used from the main value provided by the producer of the equipment or can be found using pH buffer solutions. Using provided values can get error in the measurements so it is better to get calibration of the pH meter yourself using buffer solutions. And calibration should be made from time to time to ensure the maximum accuracy of the measurement. For the calibration part another code is used to obtain pH4 and pH7 electrical readings values.
In this secondary code read voltage given in the format needed to use in the Equation 4.5,4.6, and 4.7. This code gives voltage values every second. To obtain pH4 value pH meter is immersed into the pH 4.00 buffer solution and voltage values read until it stabilizes and then noted. The same application is made for pH 7.00 buffer solution to obtain pH7 value and noted. This pH4 and pH7 value is inserted into the main Arduino code and calibration is completed.
4.7. Experiment Procedure
Figure 4.11.
Experiment setup.
Figure 4.11.
Experiment setup.
After the membranes which will be tested obtain experiment preparation can be start. Firstly, acidic, and basic solution is prepared, it is important to use same values of pH in acidic, and basic solutions for the membranes that will be compared. Acidic solutions and basic solutions are prepared in the desired pH values using NaOH and HCl. In this research mostly pH 3.04 and pH 10.45 are used, respectively. Solutions are also prepared using the same pH meter that was used during the experiment.
Before starting the experiment, the obtained membrane is cut into the right size to fit the prototype membrane area. After that dry weight measurements are taken for the membrane and noted. Then membrane is fit into protype, and all the bolts are tightened possibly equally. It is important to tighten bolts in the right amount as more or less can lead to leakage during the experiment which can be a big problem. Prototype set as in Figure 4.13 and pH meter connections are all made and finally connected to the computer. MATLAB program is started immediately after the addition of the basic solution in the side where is the pH meter. As the main idea is measuring the proton transfer through the membrane it is important to put pH meter to basic solution side as H+ ions will go from acidic side to basic side. After 1-minute acidic solution is added to the other side and now progress can be monitored as live from the figure window that popped up in the MATLAB. Program left to run until pH value is stabilized at a point for a very long time.
4.8. Data Smoothing
Figure 4.12.
Raw experiment result graph.
Figure 4.12.
Raw experiment result graph.
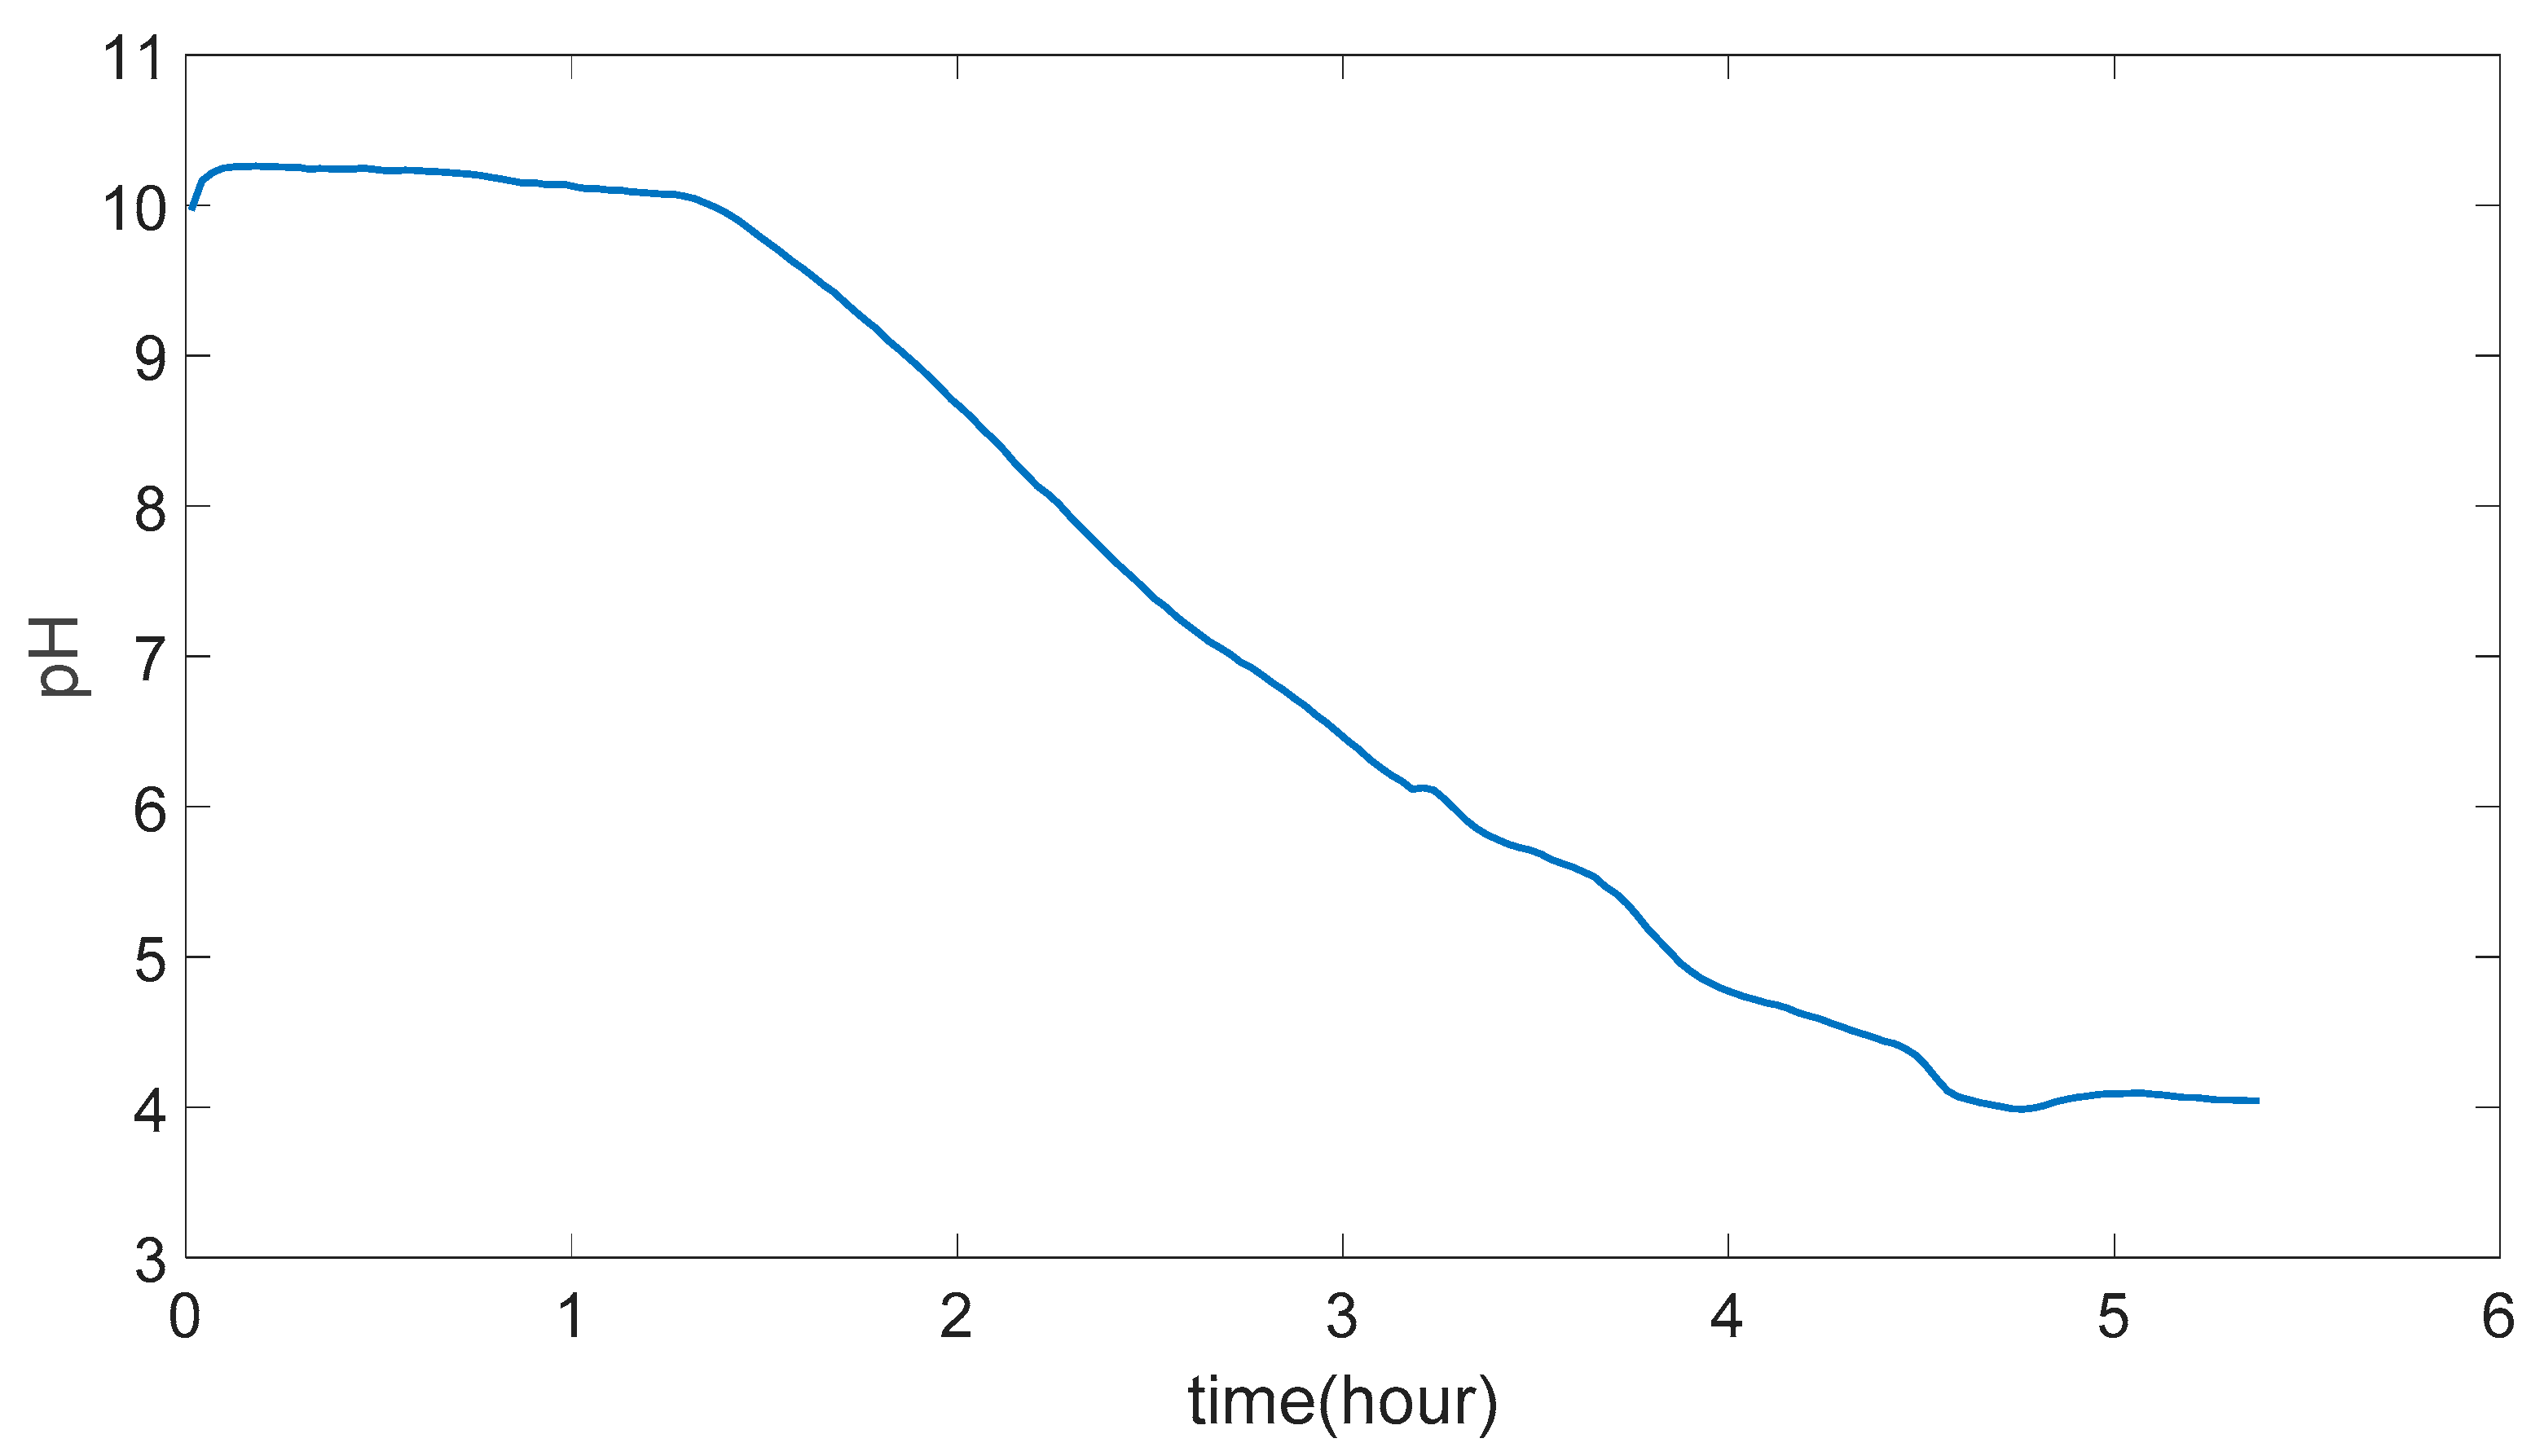
As seen from the graph there are a lot of fluctuations trough the graph as data is collected for every second as due to accuracy range of the pH meter which is ±0.1 pH and any electrical noise happens due the transformation between pH meter, signal board, Arduino or connection to the computer results can go up and down in a very close range and can lead to graphs like Figure 4.14. To get more reasonable and easier to analyze data, data should be smoothed.
Figure 4.13.
Code for data smoothing.
Figure 4.13.
Code for data smoothing.
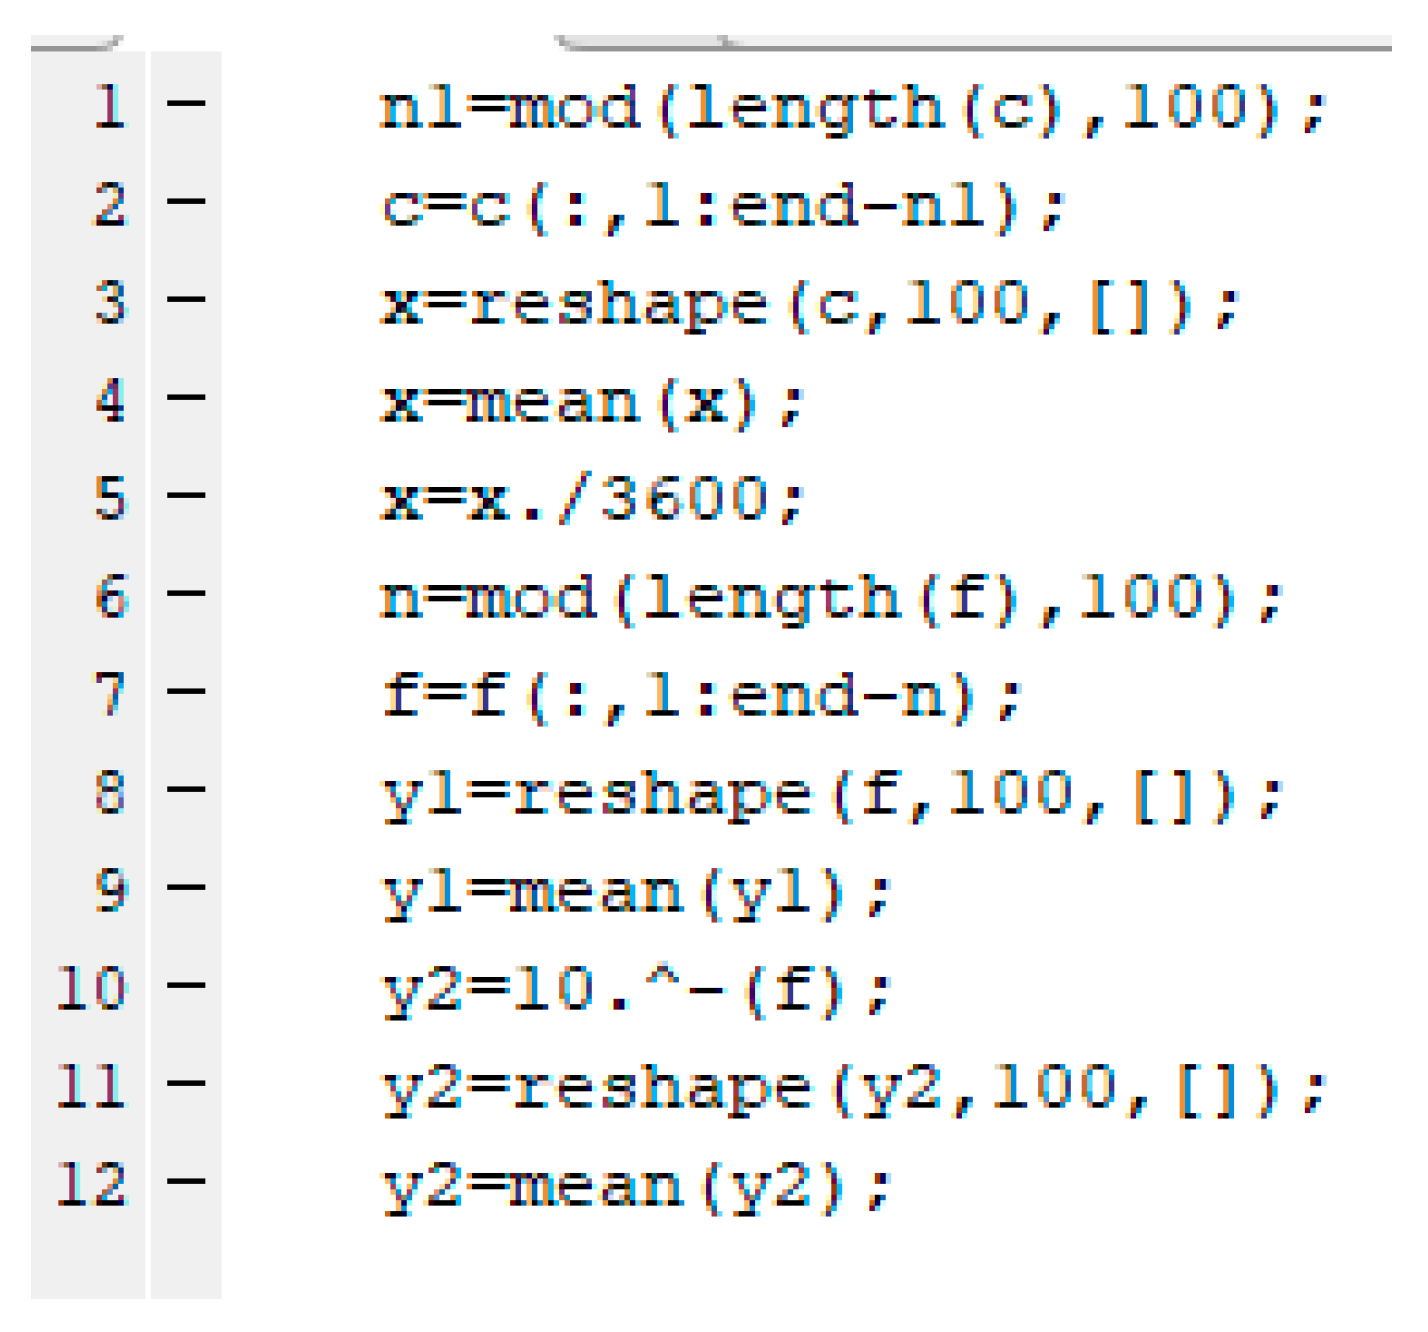
Code in Figure 4.15 is used to smoothen the data. c is recorded time and f is taken pH values as mentioned before both c and f mod is taken for 100 and if they are not divided to 100 excessive part is cut from the last of the data to make data dividable to 100. This does not affect the correctness of the data as the maximum deleted data can be 100 seconds from the last part and measurements are generally made between 3-4 hours. The data is divided into 100 and then means are taken for each 100 data. Also using the same code, the conversion between pH to [H+] is made according to the Equation 4.2 and given as different data which is y2 in this case and smoothing also done for this one. And, as making time in the second results in high values is that is unnecessary, so time is converted into hours. After smoothing desired plots can be made using the general plot command of the MATLAB.
Figure 4.14.
Graph after data is smoothened.
Figure 4.14.
Graph after data is smoothened.
4.9. Swelling Calculations
Prepared membranes are measured for swelling. Swelling calculations are made using the same equation, Equation 4.8.
And measurements are taken according to this procedure. First one piece of cut membrane weighed dry and then experimental measurement is conducted, after the experiment is finished excess water is taken by paper towel and then wet weight is measured. And finally swelling is calculated.
5. RESULTS AND DISCUSSION
5.1. (PVA)0.7(NaBr)0.3(H3PO4)xM Membranes Results
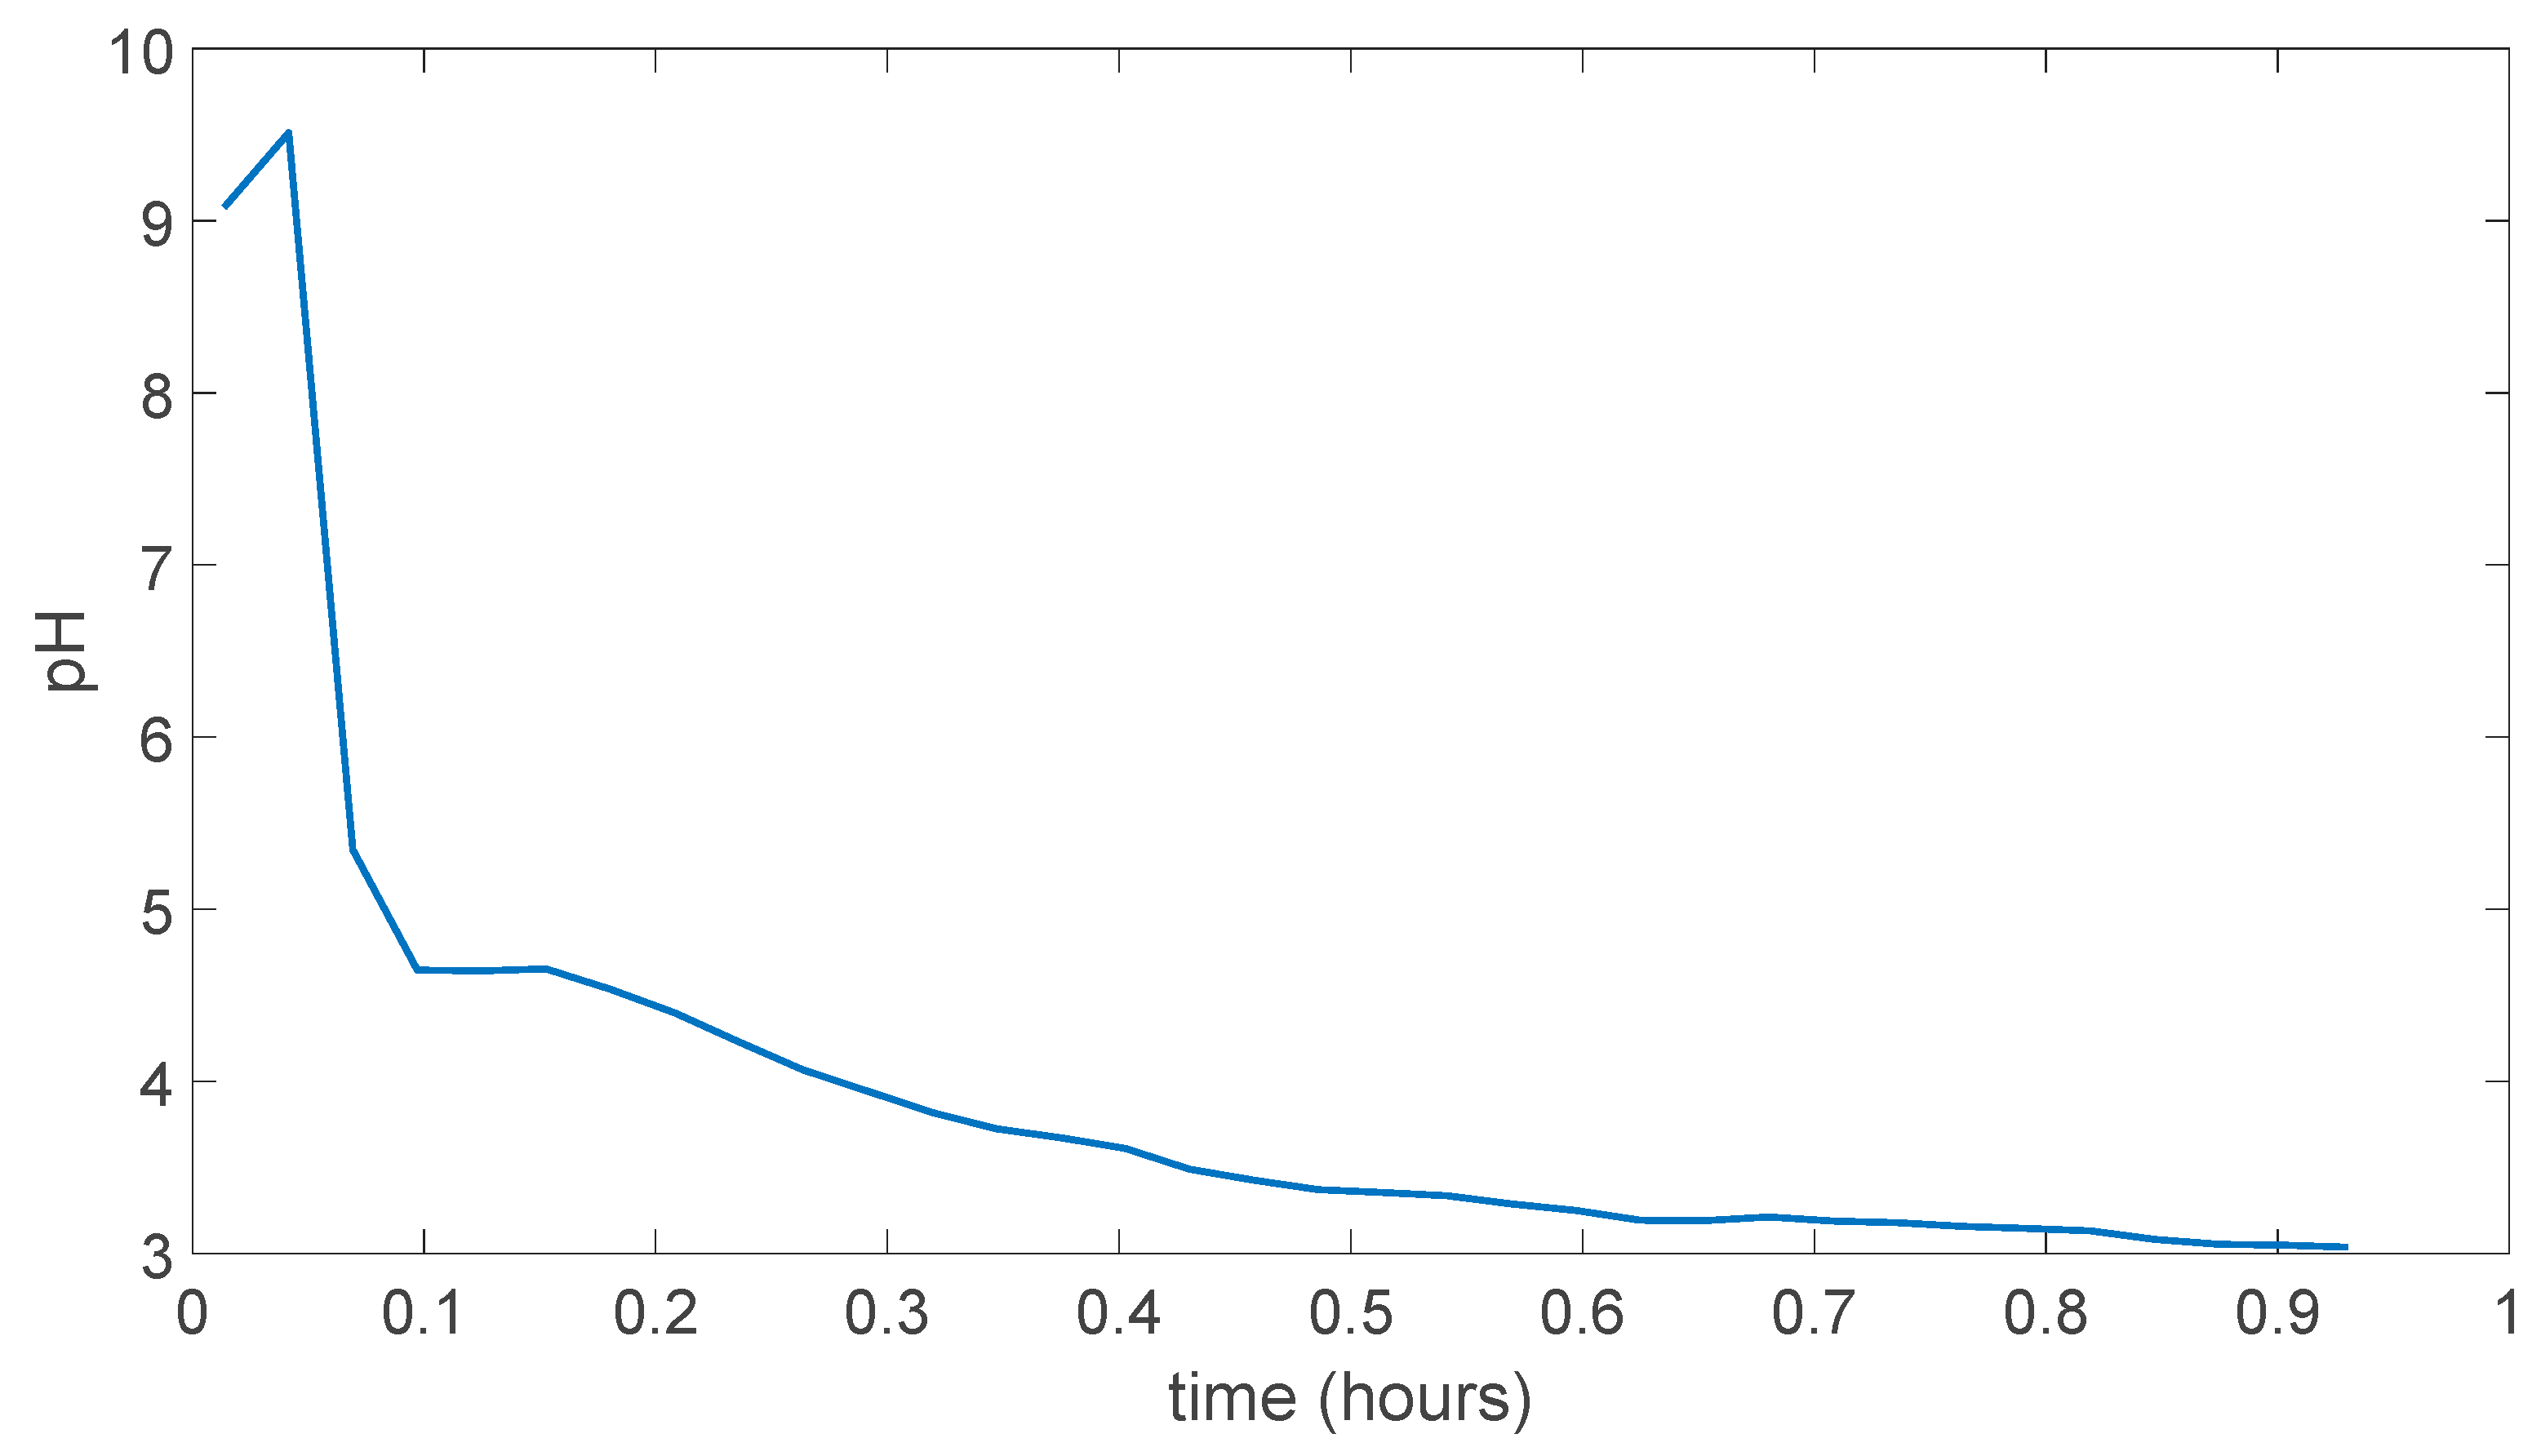
In Figure 5.1 the result of (PVA)0.7(NaBr)0.3(H3PO4)0M membrane experiment result can be seen but it is not possible to use this data to justify any conclusion as the membrane could not maintain its mechanical strength in the end of the experiment.
Figure 5.1.
(PVA)0.7(NaBr)0.3(H3PO4)0M membrane experiment result.
Figure 5.1.
(PVA)0.7(NaBr)0.3(H3PO4)0M membrane experiment result.
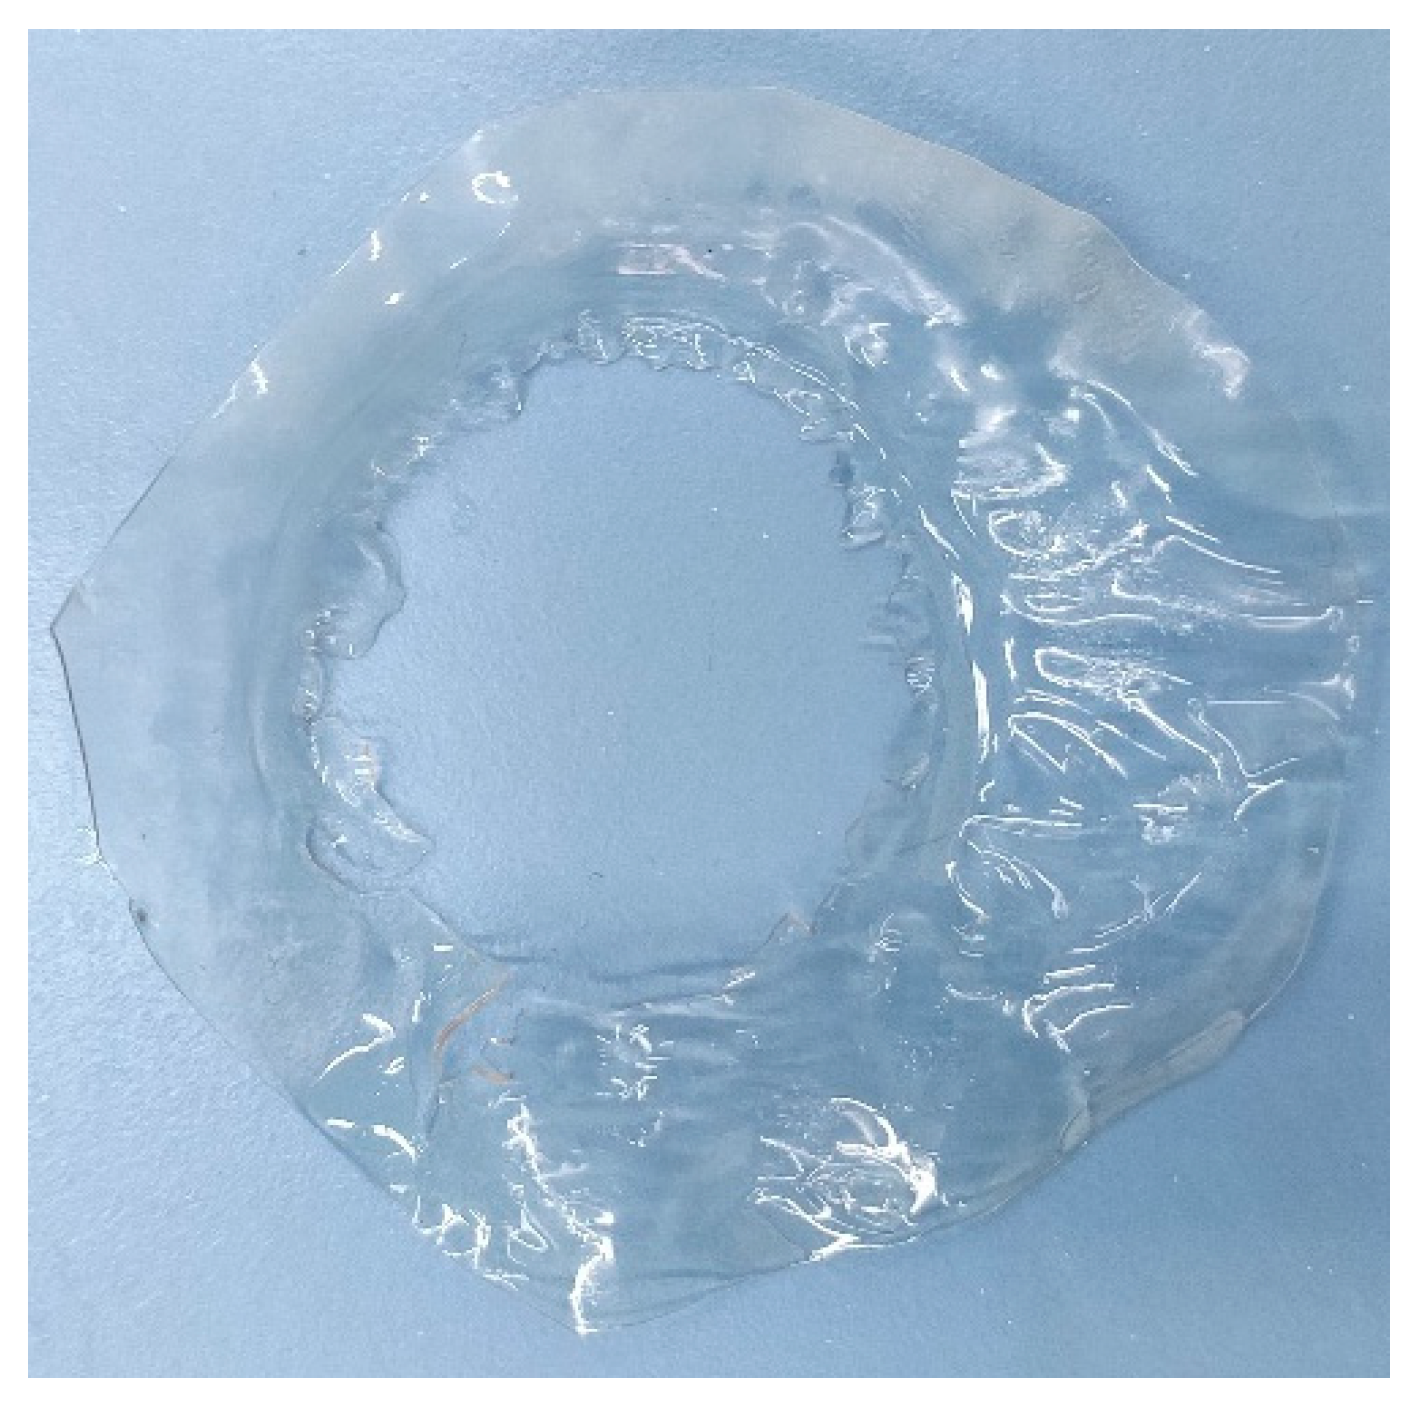
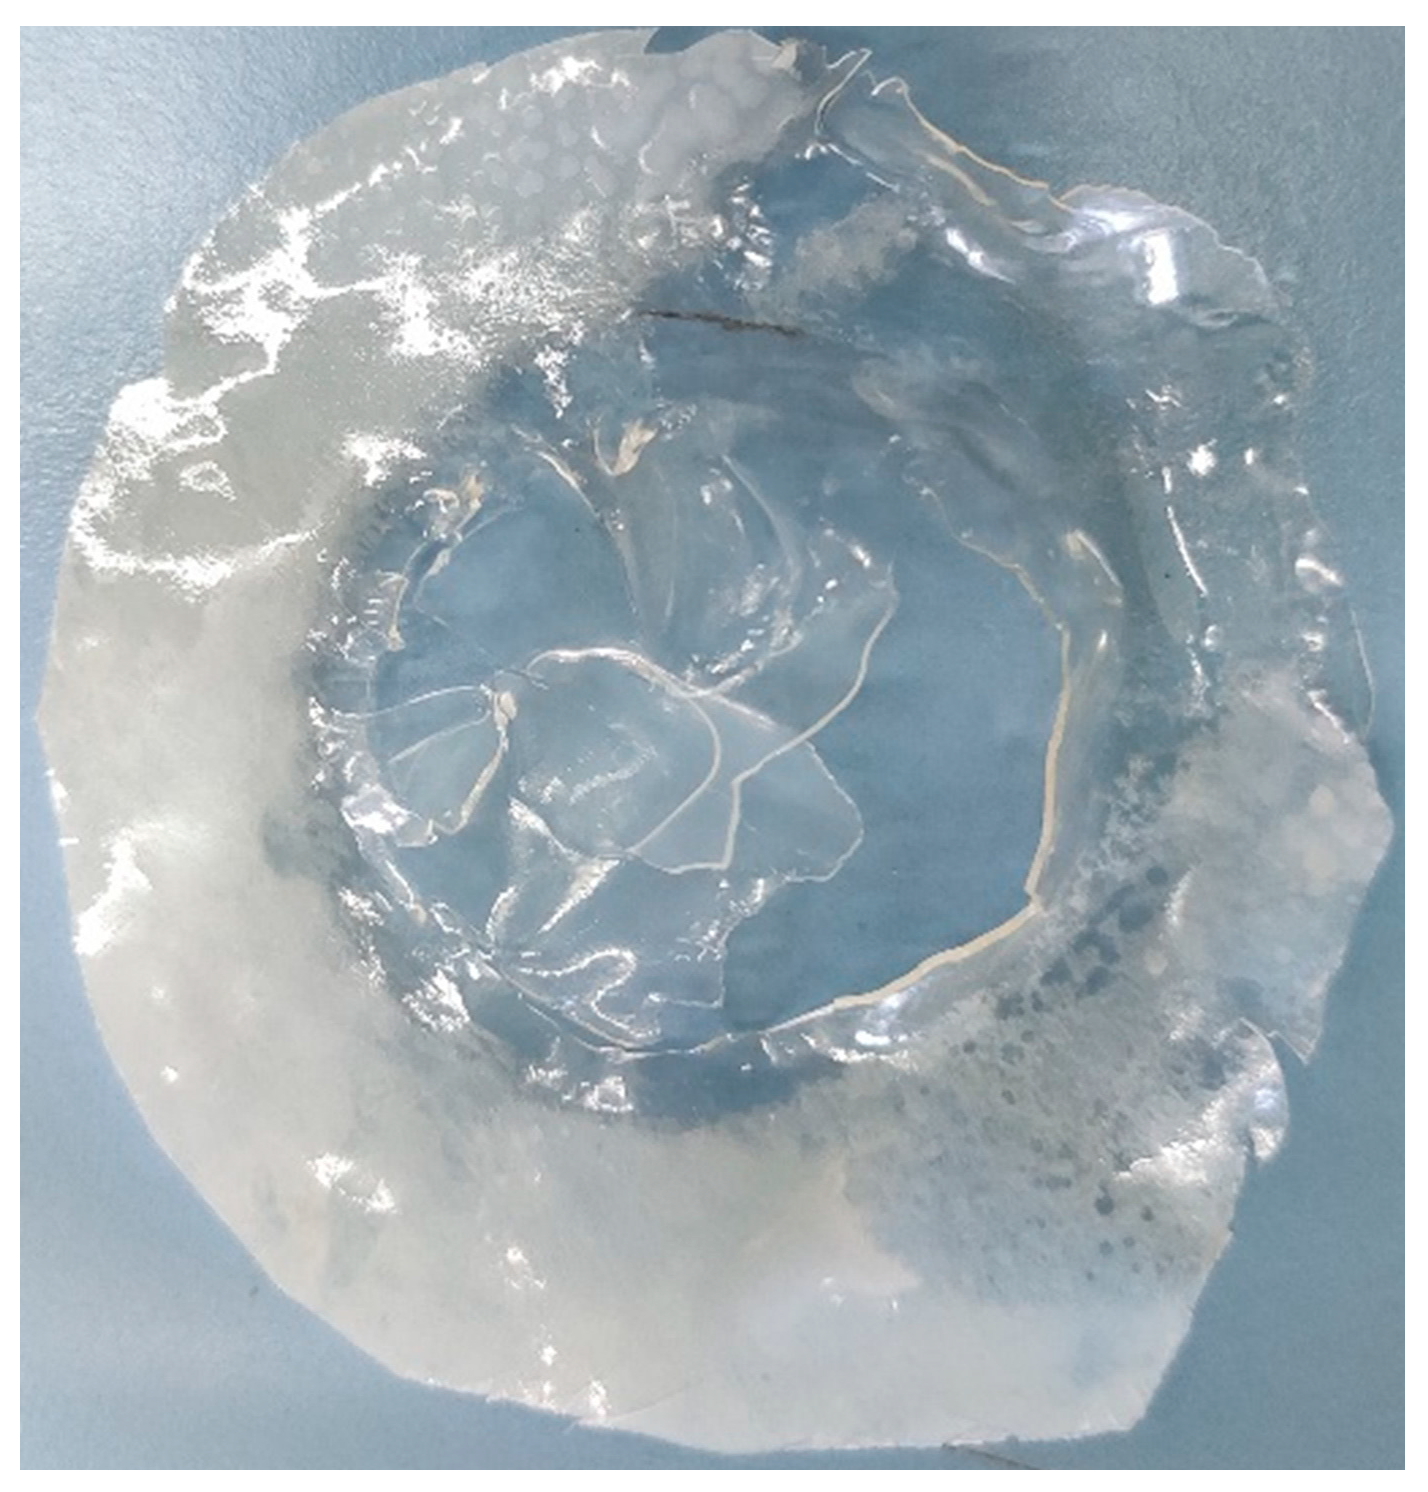
As can be seen from Figure 5.2 the area which was contacted in solutions is completely dissolved at the end of the experiment while loosening the bolts. So, it can be said that during the experiment the polymer membrane started to dissolve in the solutions, and this definitely affected the proton conductivity trough the membrane and increase its rate during the experiment so this data cannot be used for proton conductivity comparisons of the membranes.
Figure 5.2.
(PVA)0.7(NaBr)0.3(H3PO4)0M membrane at the end of experiment.
Figure 5.2.
(PVA)0.7(NaBr)0.3(H3PO4)0M membrane at the end of experiment.
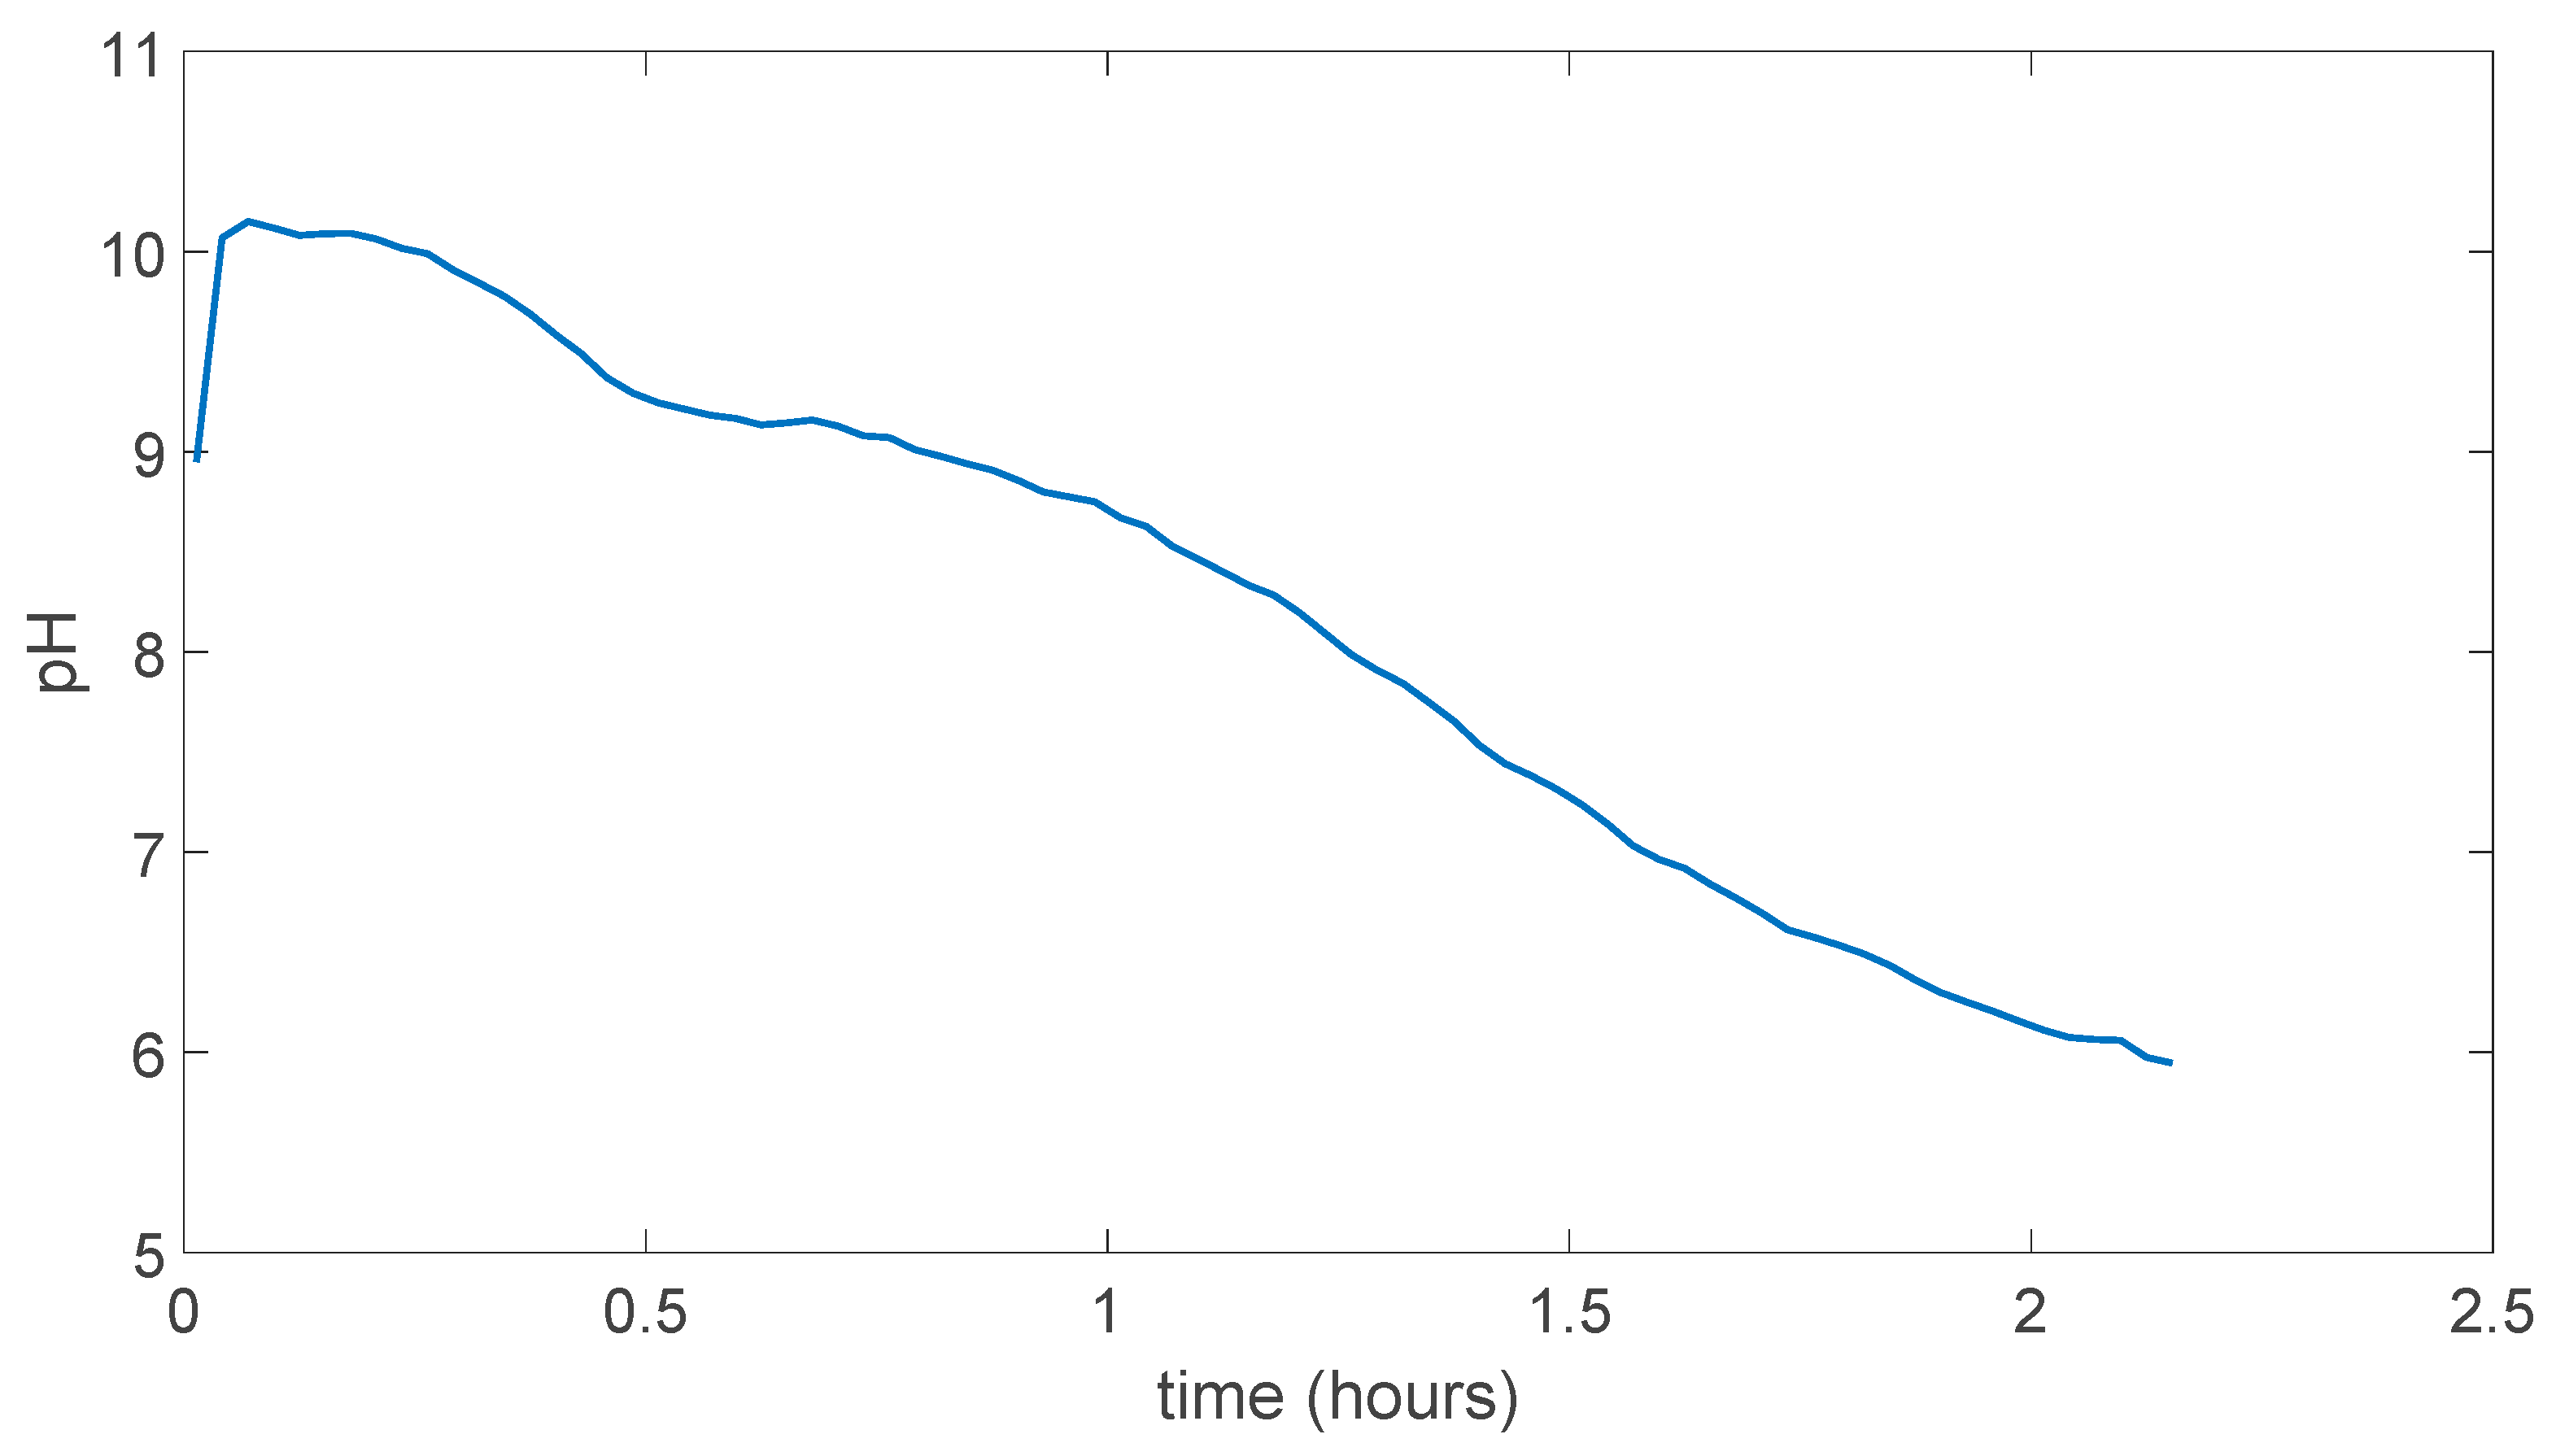
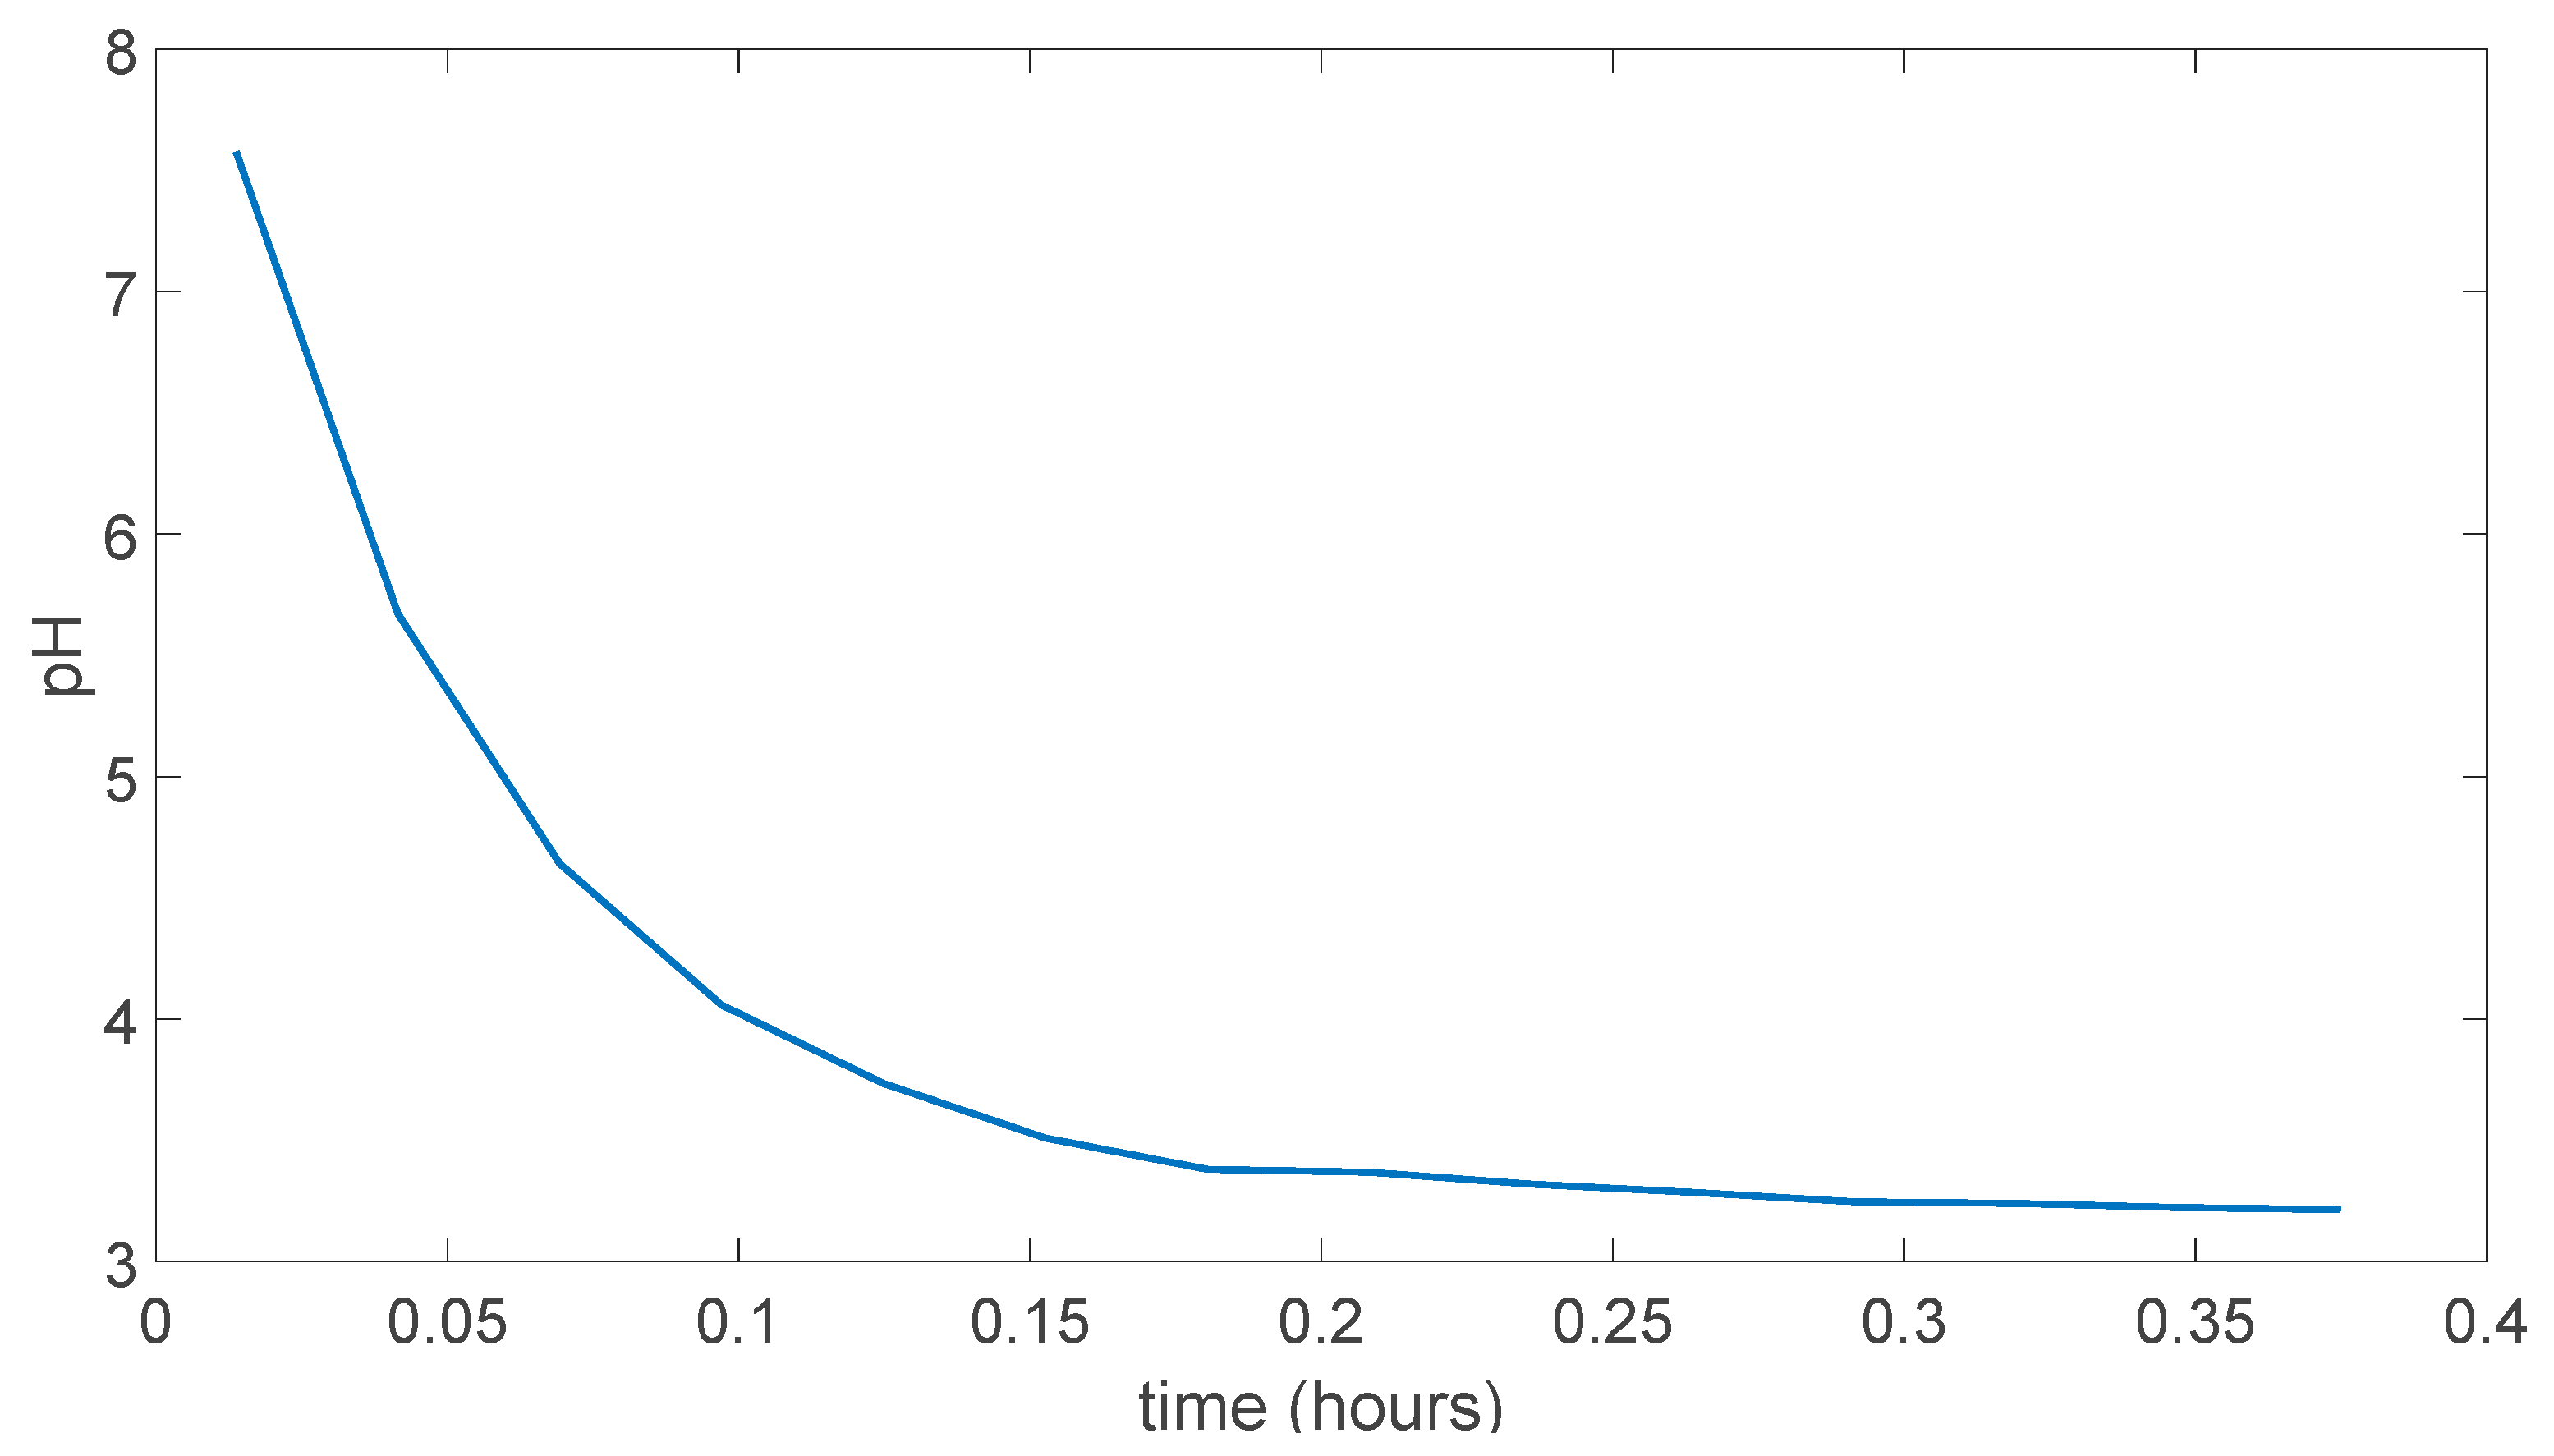
In the Figure 5.3 the experiment result can be seen in for the (PVA)0.7(NaBr)0.3(H3PO4)5.1M membrane, which is dissolved in the solution way faster than membrane prepared without H3PO4 which can be due to possible hydrophilicity increase in the membrane due to addition of acid. As can be seen pH is went the almost pH 3.2 in less than 0.35 hours.
Figure 5.3.
(PVA)0.7(NaBr)0.3(H3PO4)5.1M membrane experiment result.
Figure 5.3.
(PVA)0.7(NaBr)0.3(H3PO4)5.1M membrane experiment result.
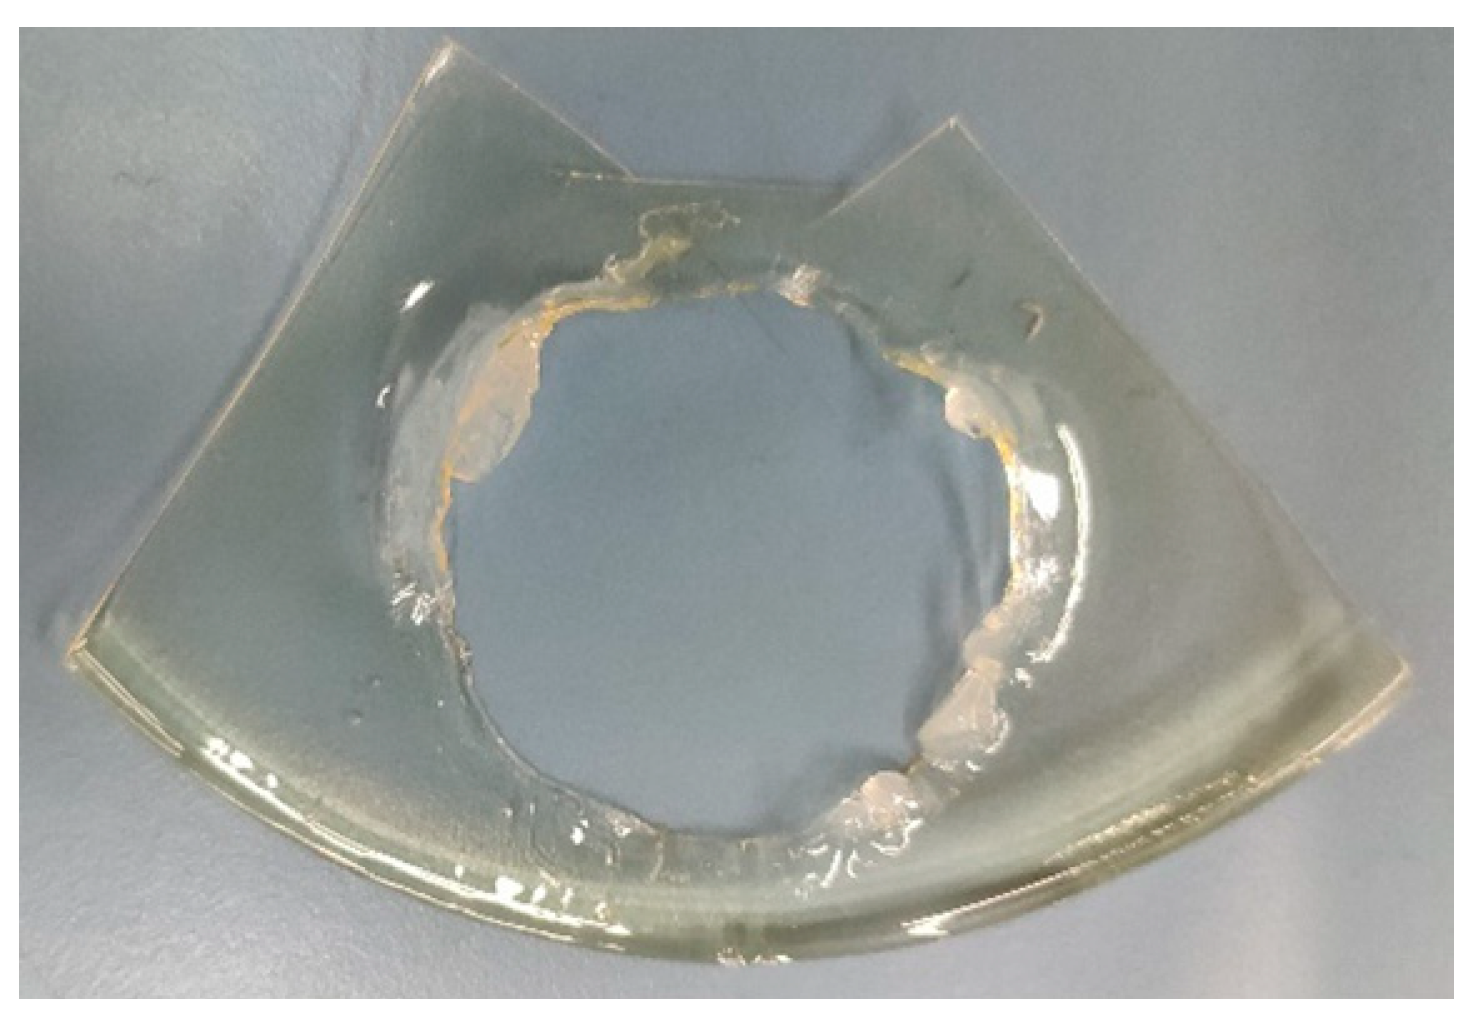
As can be seen from Figure 5.4 mechanical strength could not be maintained during the experiment and obtained data cannot be used to compare proton conductivity of the membranes as this would give inaccurate results.
At the and (PVA)0.7(NaBr)0.3(H3PO4)xM are not suitable for measurements of the proton conductivity using this experimental method due to their mechanical strength and dissolving problems in the acid, base solutions and generally in water. So, a comparison is not prepared for these membranes.
Figure 5.4.
(PVA)0.7(NaBr)0.3(H3PO4)5.1M membrane at the end of experiment.
Figure 5.4.
(PVA)0.7(NaBr)0.3(H3PO4)5.1M membrane at the end of experiment.
5.2. PVA/PAMA Membranes Results
As can be seen in Figure 5.5 pH change is very fast which is again due to dissolution of the membrane in the acidic, and basic solutions.
Figure 5.5.
PVA/PAMA membrane without acid experiment result.
Figure 5.5.
PVA/PAMA membrane without acid experiment result.
In Figure 5.6 it can clearly be seen that membrane is dissolved by the solution and the data obtained cannot be used for comparison of the proton conductivity of this membrane. Even tough PVA/PAMA with 5.1 M H3PO4 is prepared experiment is not conducted in that one as it has shown no mechanical strength in the swelling test in the distilled water and dissolved.
Figure 5.6.
PVA/PAMA membrane without acid in the end of experiment.
Figure 5.6.
PVA/PAMA membrane without acid in the end of experiment.
5.3. PVA/Tartaric Acid Membranes Results
Three different types of membranes are prepared using PVA/Tartaric acid. The first one is PVA/Tartaric acid, the second one is PVA/Tartaric Acid/Zeolite ZS-5/5.1 M H3PO4, and the third one is PVA/Tartaric Acid/5.1 M H3PO4. The second one which is prepared using Zeolite ZS-5 had shown no potential for usage as polymer membrane as it was fairly brittle and had small droplet like holes on the surface and wrapped itself around while thermally crosslinking. So only the first and third membrane composition is used for conducting this experimental measurement. And for the third one was also somehow brittle and little wrapped around the sides it has carefully cut without splitting or cracking the middle and obtained flat and suitable membrane part for usage of the experimental measurement.
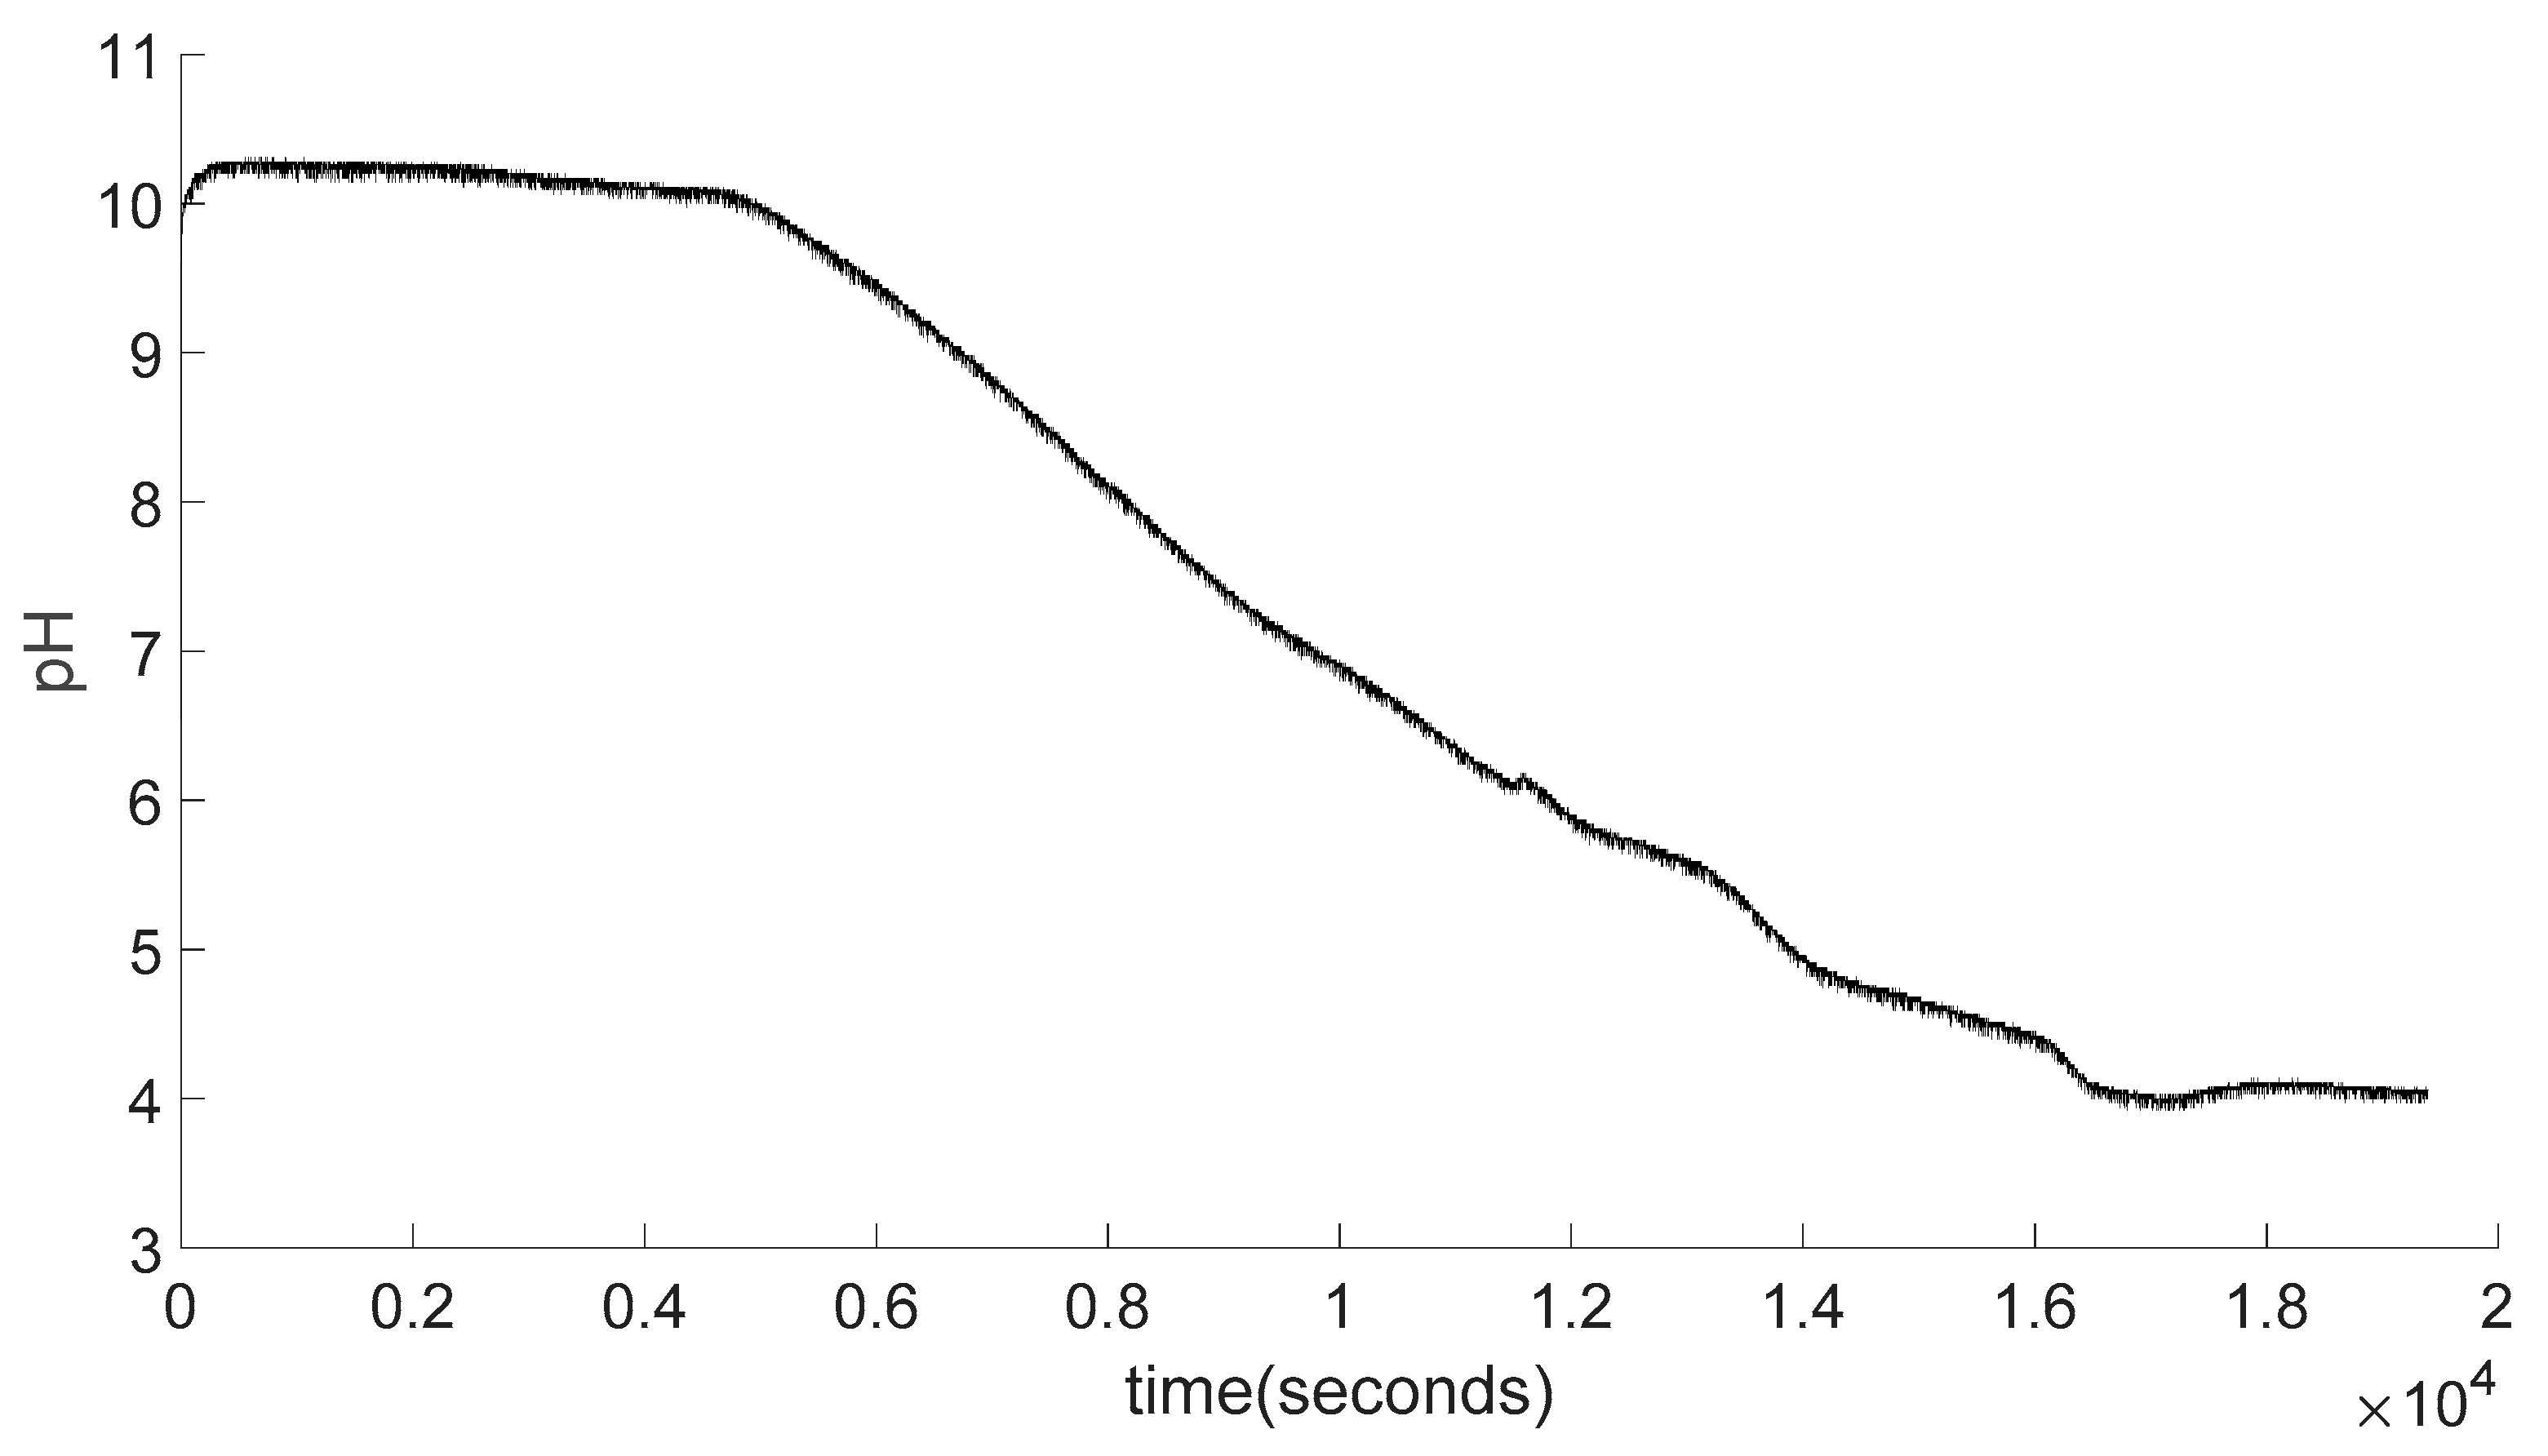
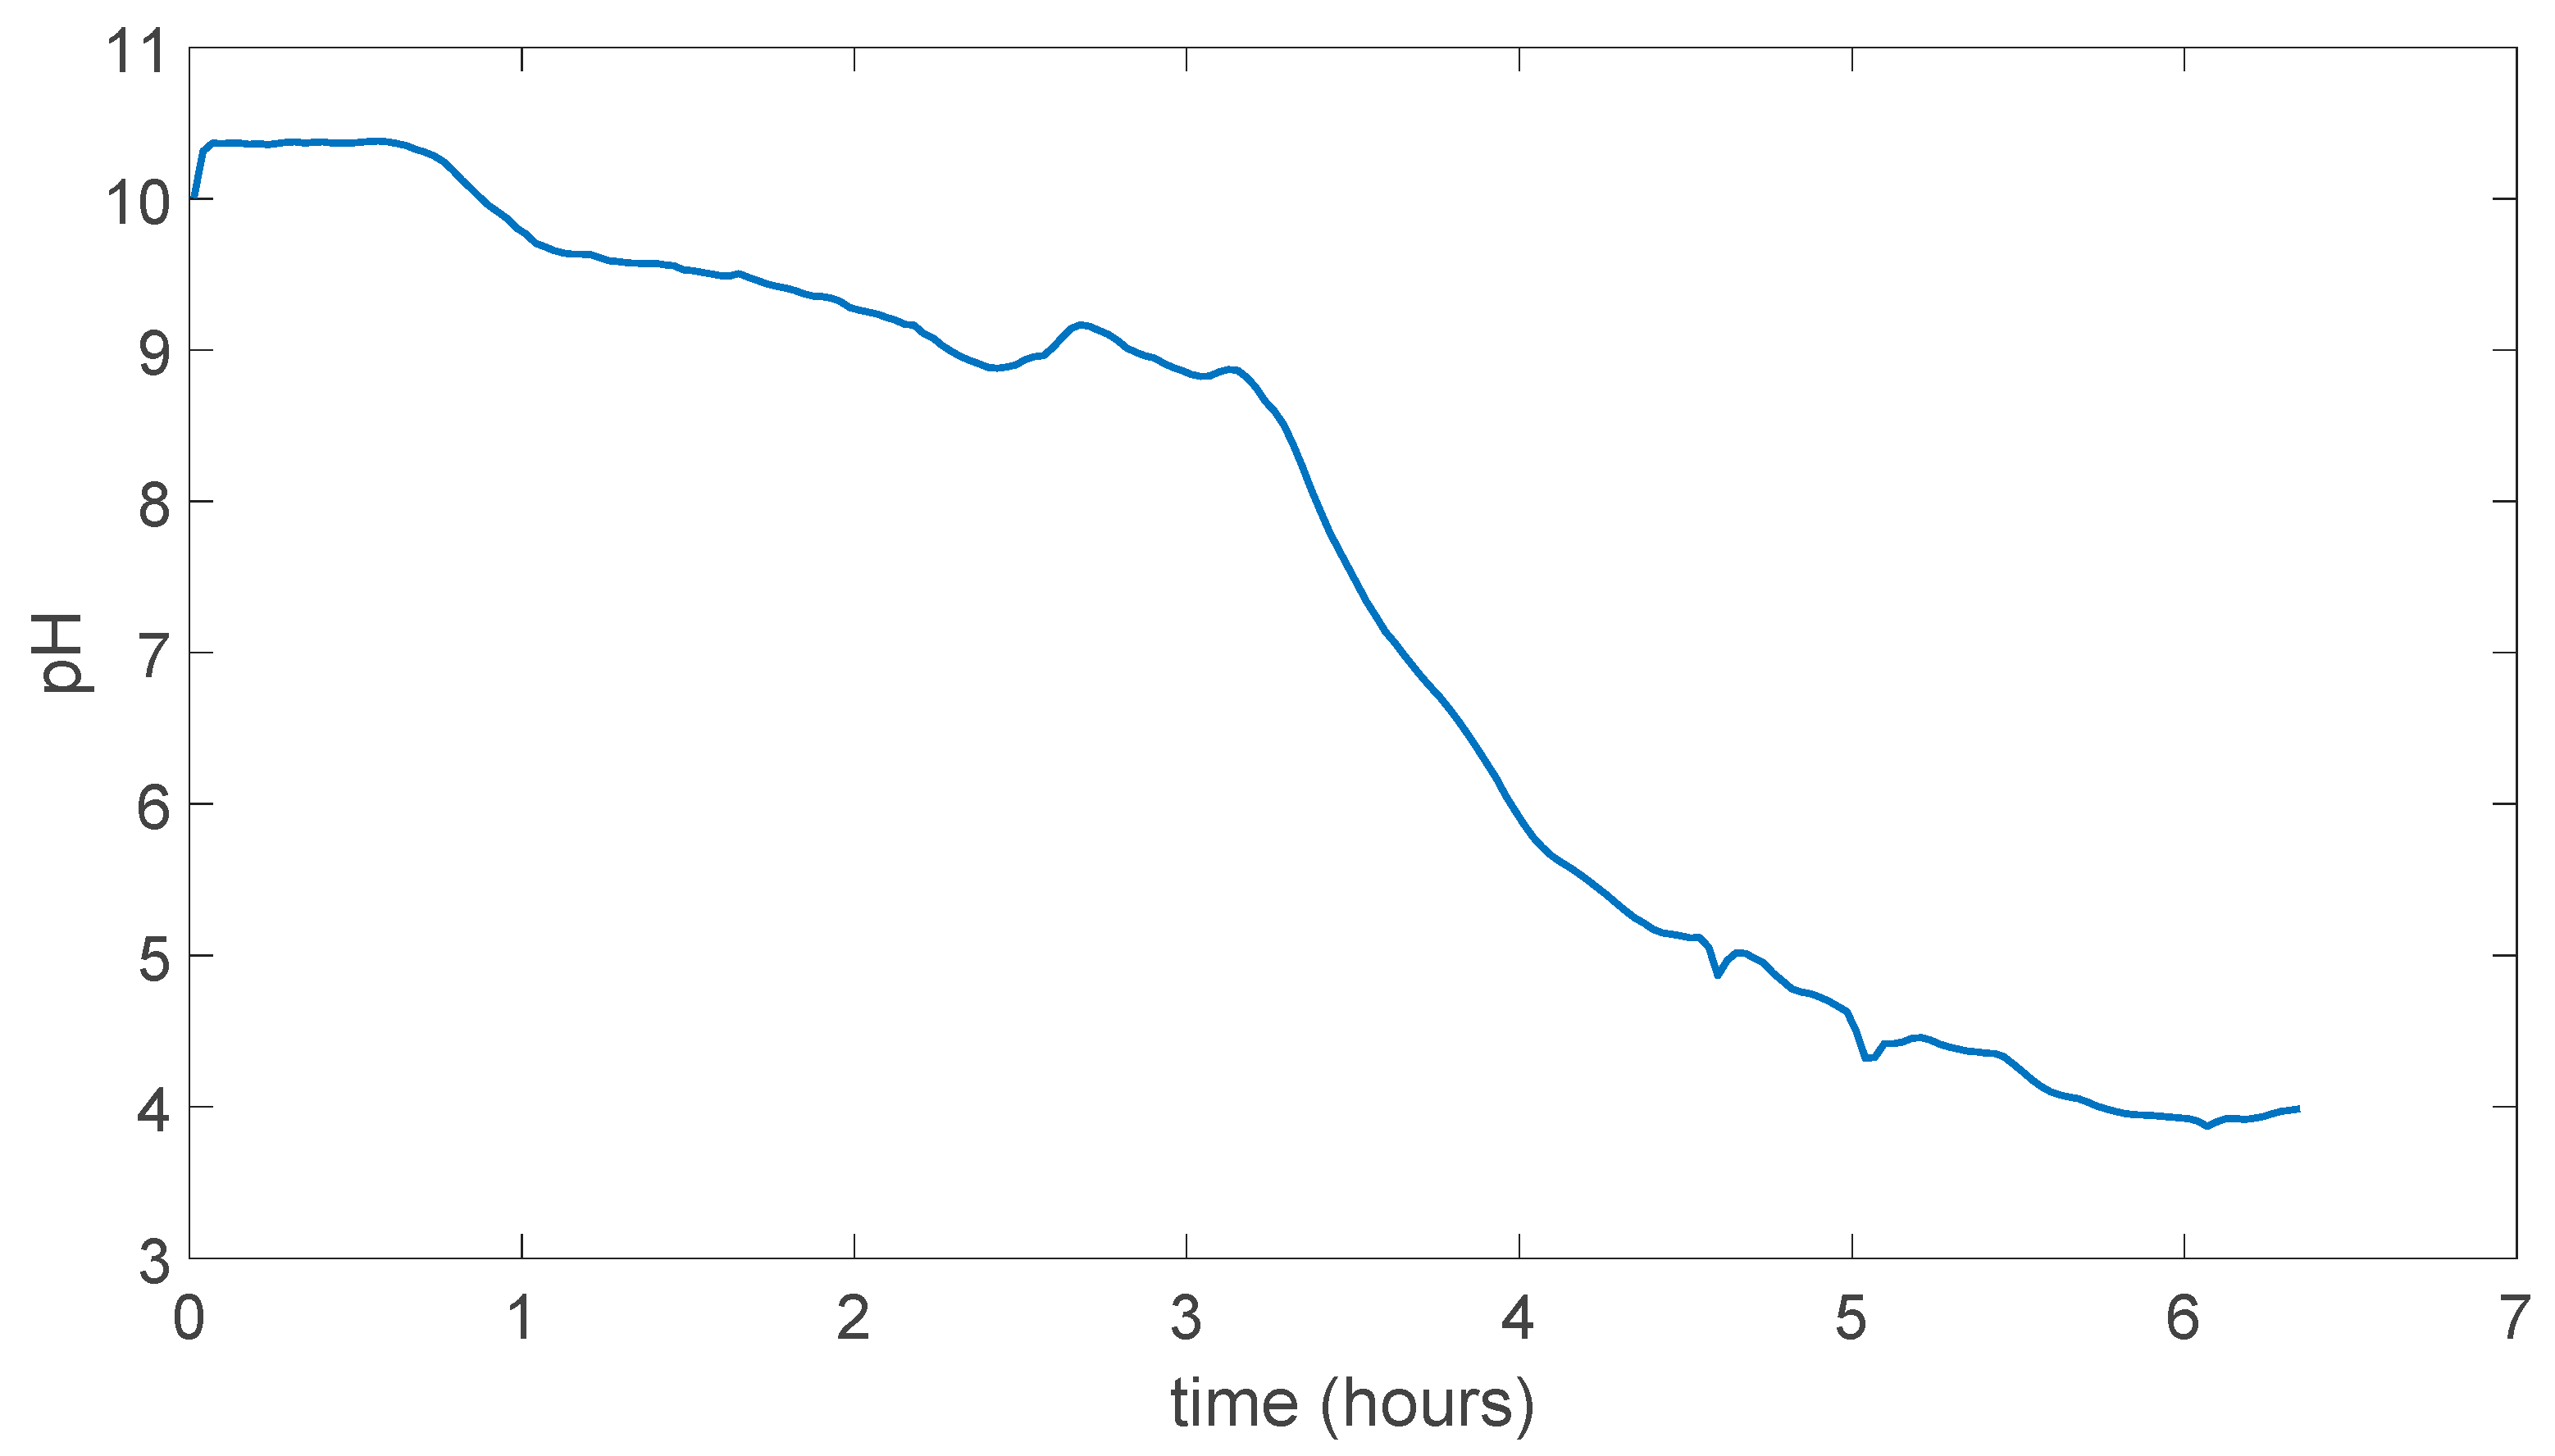
In Figure 5.7 pH change can be seen as this time membrane was not dissolved in the water and resistant to the water experiment took more than 6 hours to stabilize at a point. Which was around pH 4.
Figure 5.7.
PVA/Tartaric acid membrane experiment result.
Figure 5.7.
PVA/Tartaric acid membrane experiment result.
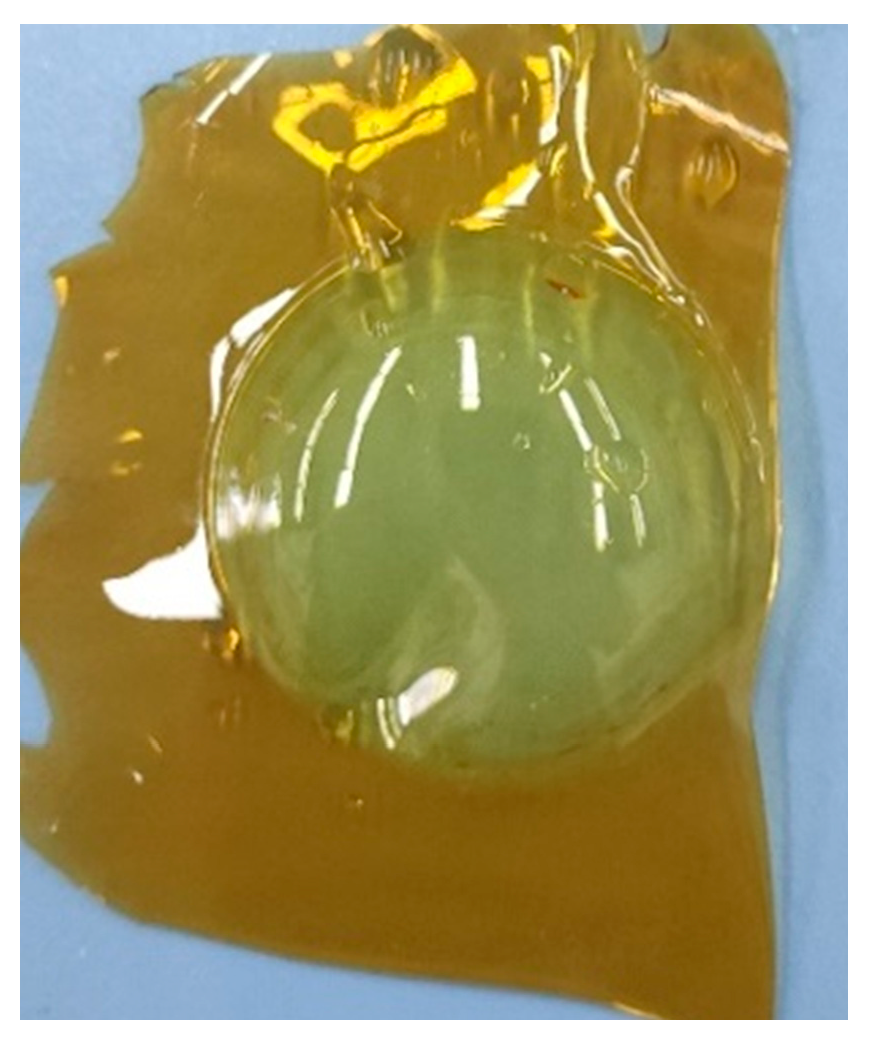
In Figure 5.8 membrane can be seen after the end of the experiment which is still intact and did not dissolve in the solutions. And membrane had taken a convex shape in the side of the basic solution.
Figure 5.8.
PVA/Tartaric acid membrane in the end of experiment.
Figure 5.8.
PVA/Tartaric acid membrane in the end of experiment.
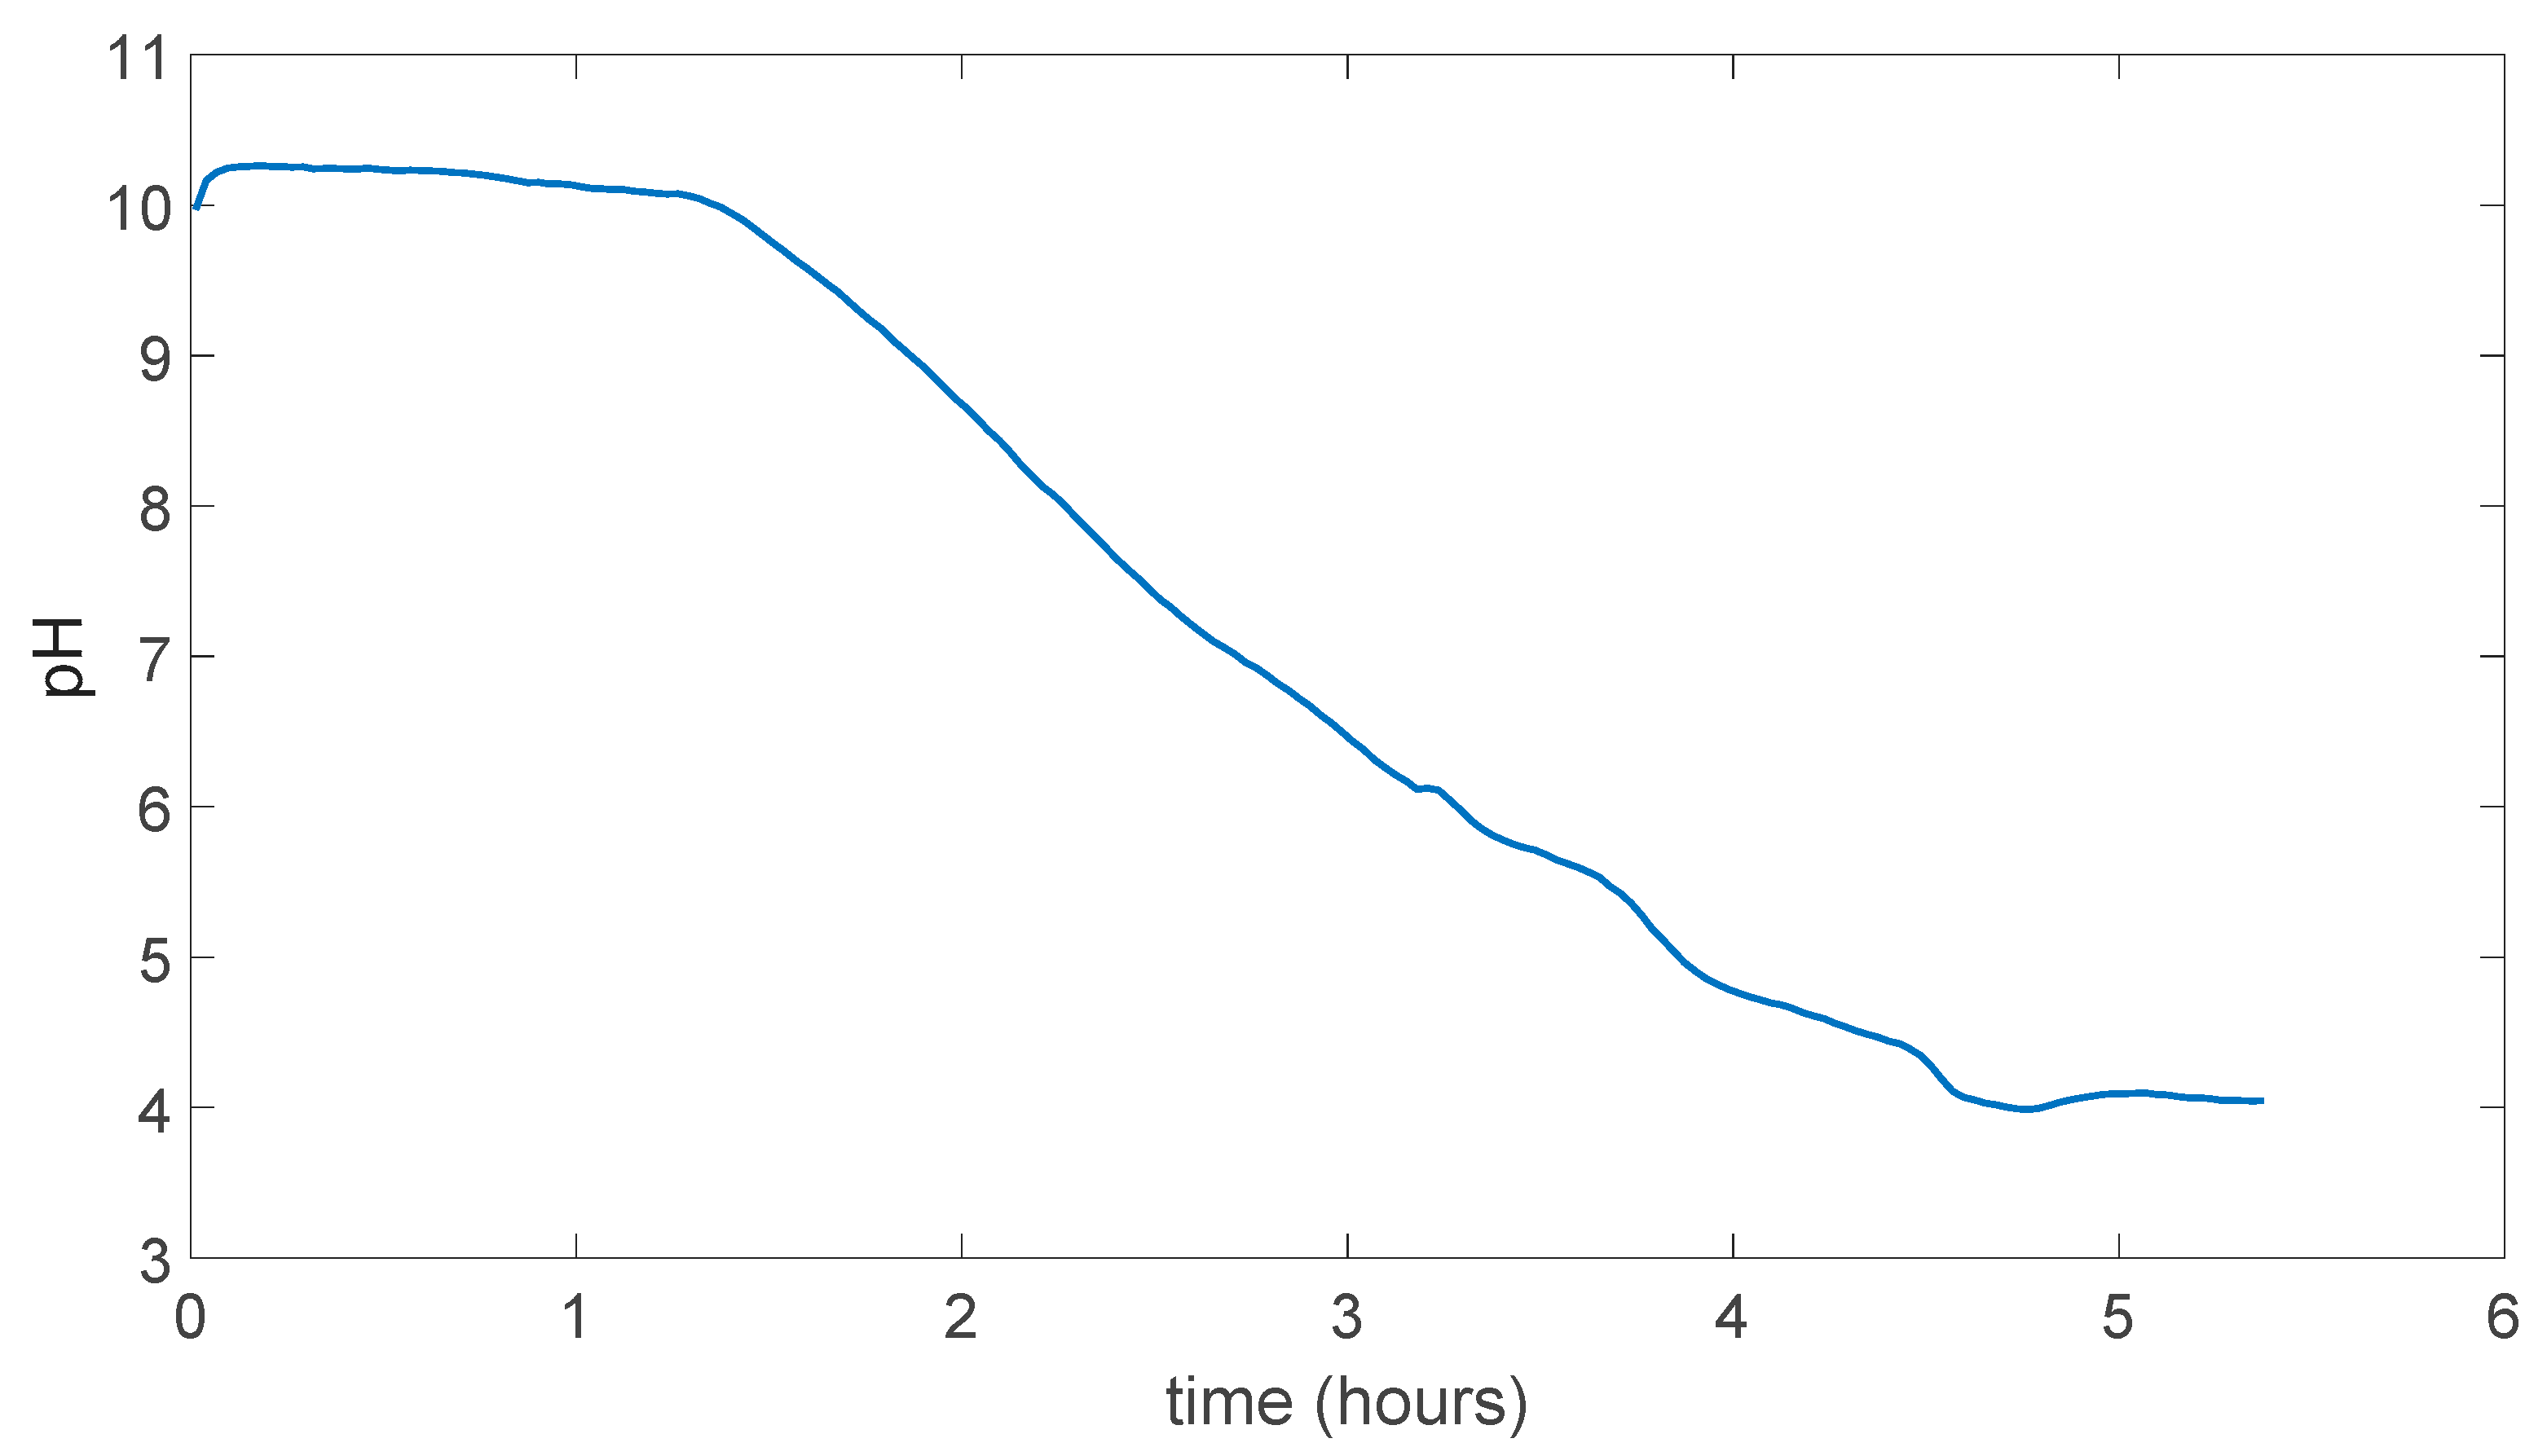
In Figure 5.9 result for membrane with 5.1 M H3PO4 can be seen as it looks very similar to in the Figure 5.8 and in the reasonable range for pH change time. Also, during the experiment there was no dissolution.
Figure 5.9.
PVA/Tartaric acid/5.1 M H3PO4 membrane experiment result.
Figure 5.9.
PVA/Tartaric acid/5.1 M H3PO4 membrane experiment result.
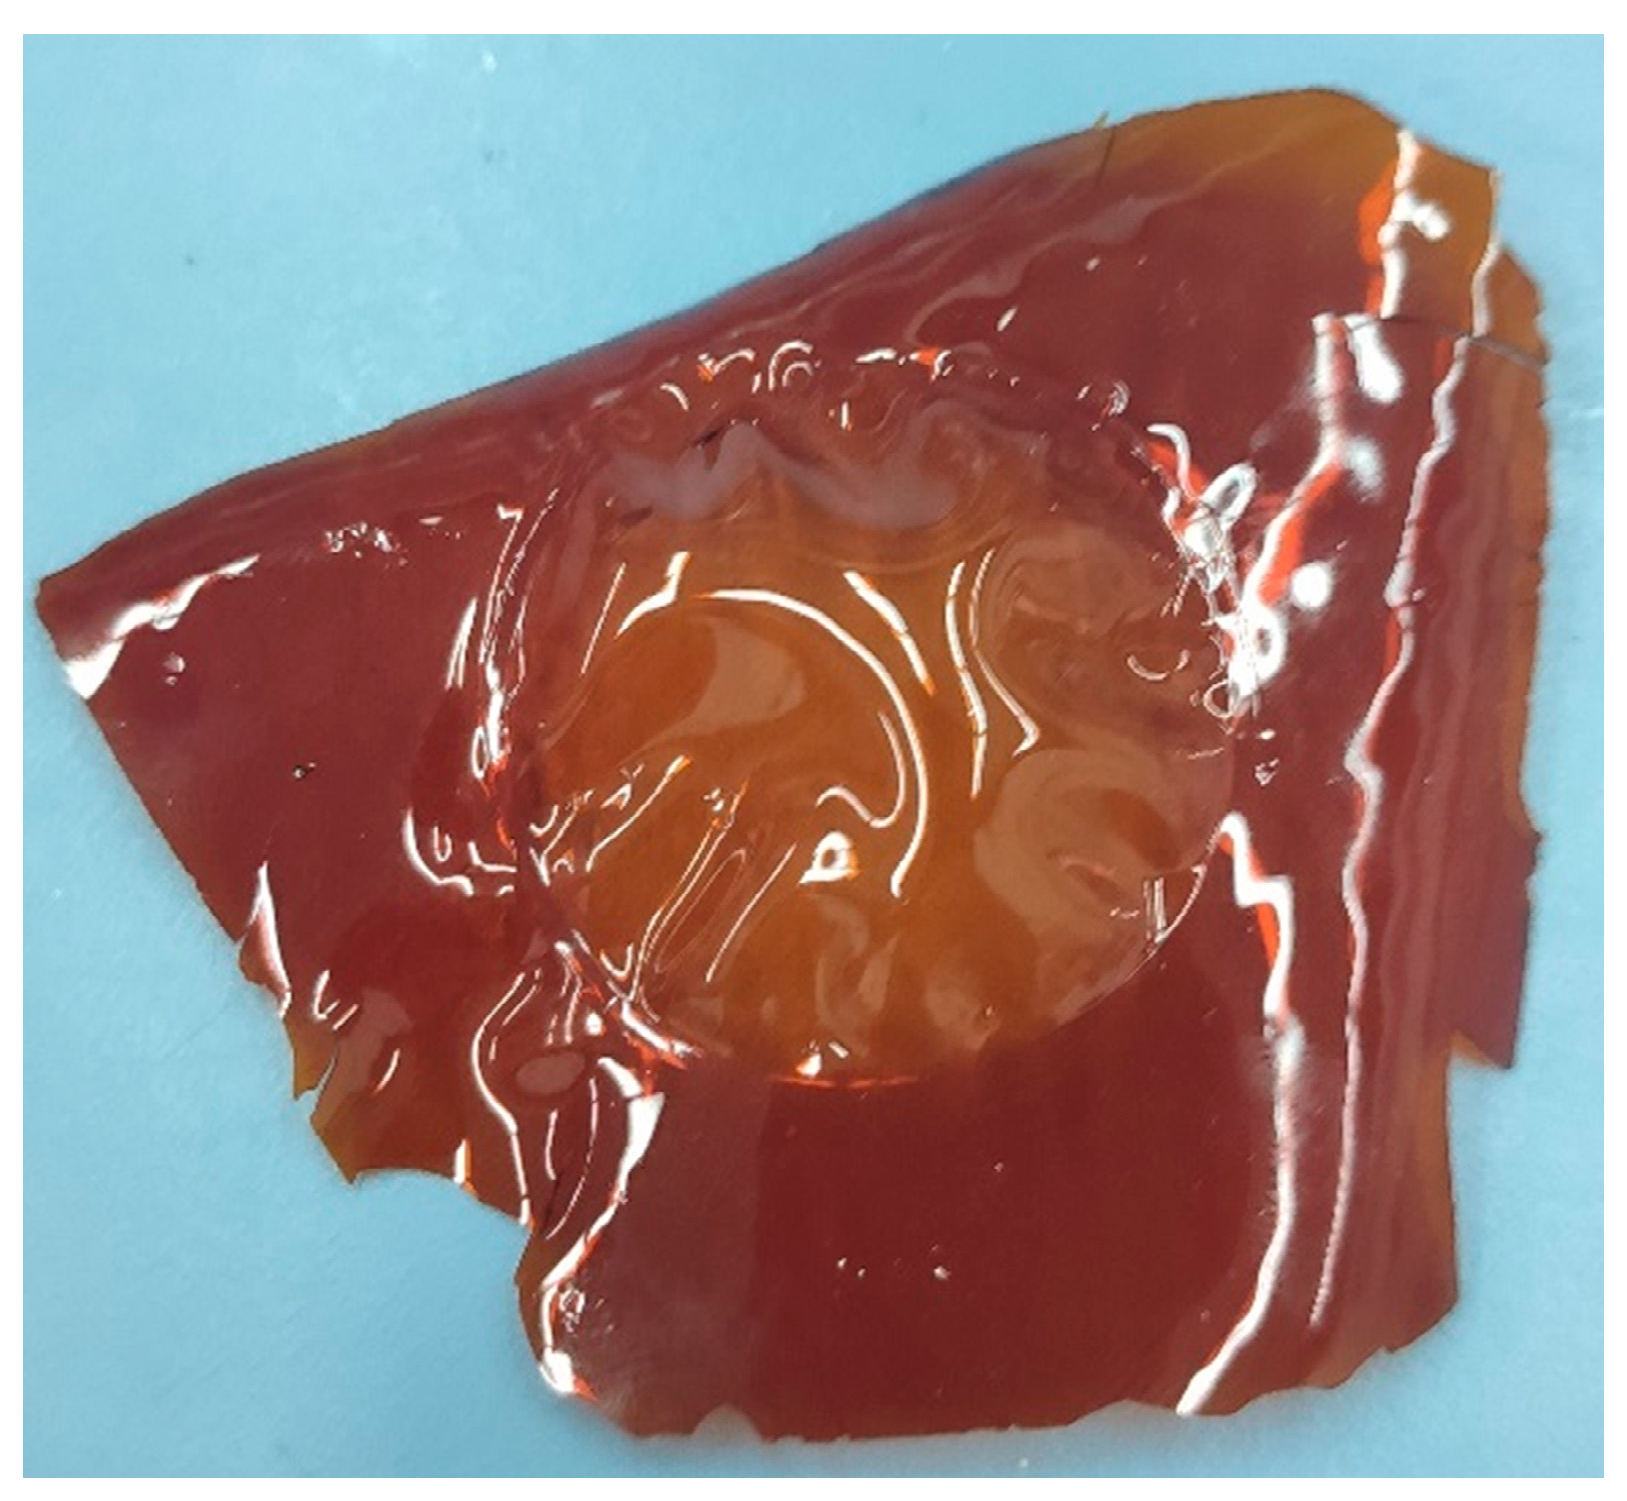
In Figure 5.10 the membrane can be seen after the end of the experimental measurement, and it had maintained its mechanical strength. And made the same convex shape in the basic solution side.
Figure 5.10.
PVA/Tartaric acid/5.1 M H3PO4 membrane in the end of experiment.
Figure 5.10.
PVA/Tartaric acid/5.1 M H3PO4 membrane in the end of experiment.
As both membranes PVA/Tartaric acid and PVA/Tartaric acid/5.1 M H3PO4 maintained their integrity even after the experiment ended obtained data from these two types of membrane can be compared. Even though they maintained their strength they also absorbed some water and lose their flat surface which led to the very small leakage from the experimental protype device trough sides of the O-ring but as these leakages were not resulted in the big amount lost in the solutions, it can be accepted as this leakage did not change the measurement reasonably.
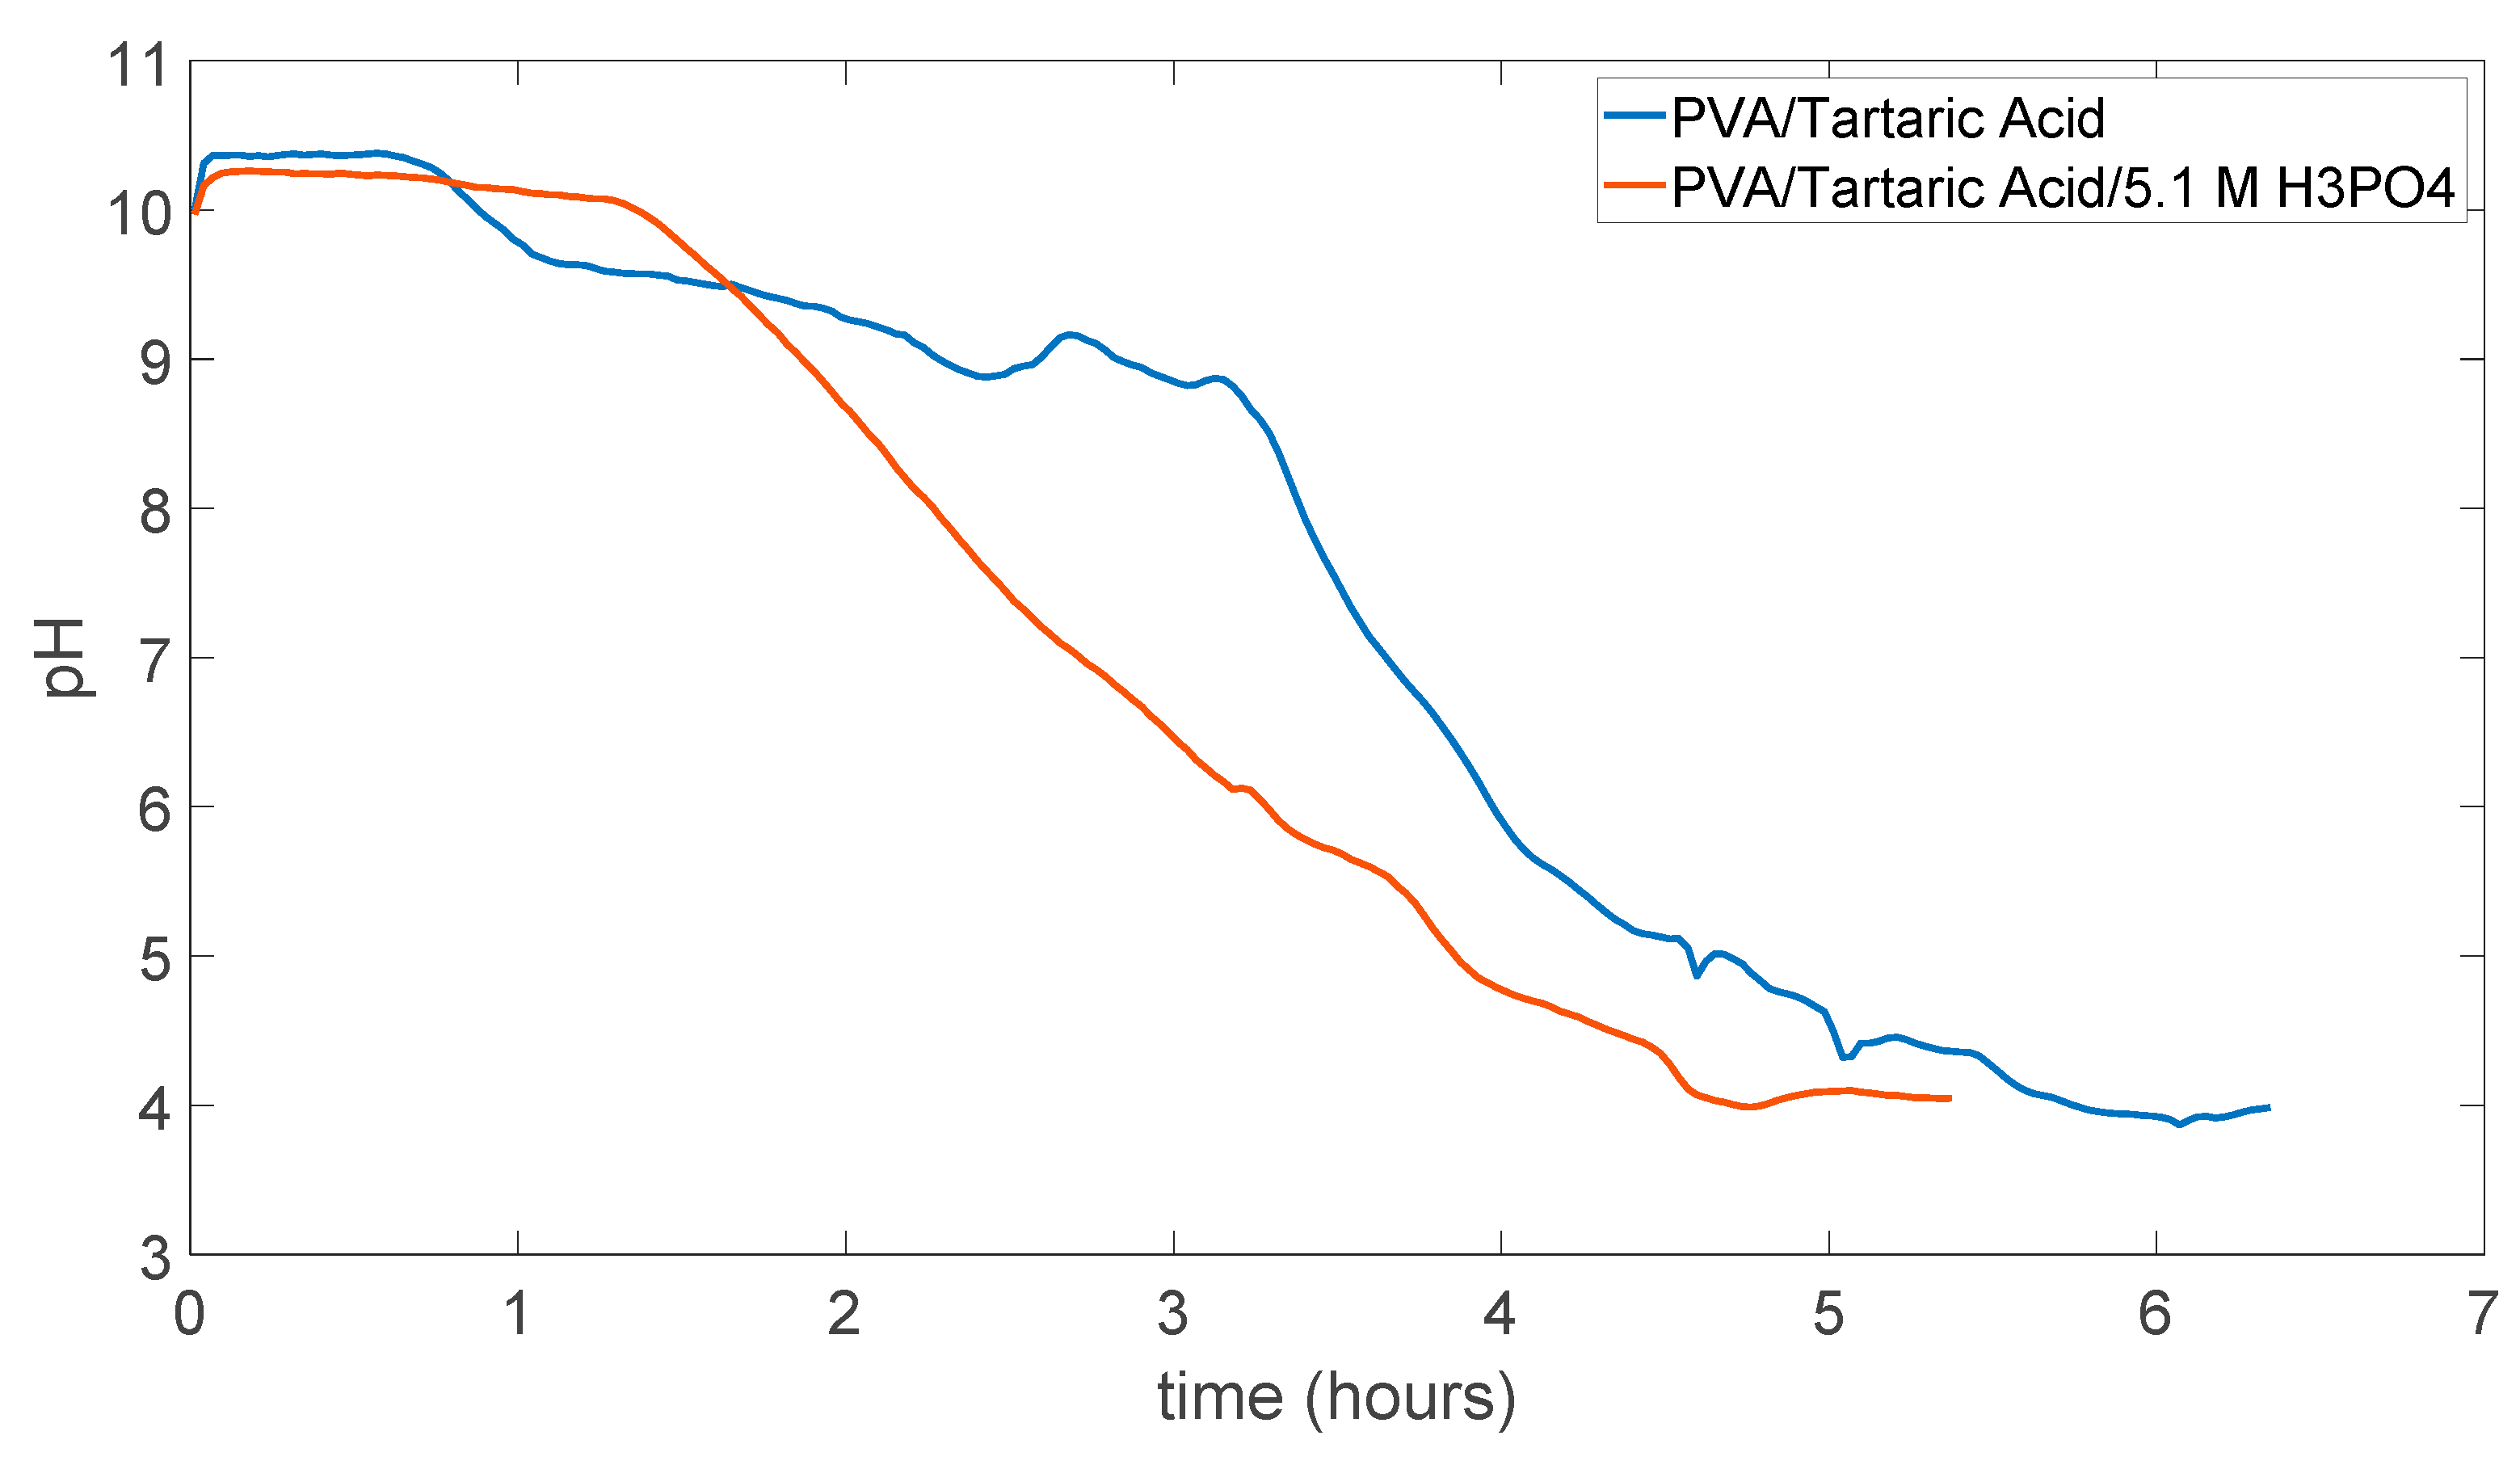
Figure 5.11 shows the comparison between the PVA/Tartaric acid membrane and PVA/Tartaric acid/5.1 M H3PO4 membrane experimental measurement results. As expected from the literature the H3PO4 added membrane is showing more rapid changes in the pH which can show us that pH change can be used to compare proton conductivity of different membranes using this experimental measurement method.
Figure 5.11.
Comparison of the results of PVA/Tartaric acid membranes with and without 5.1 M H3PO4.
Figure 5.11.
Comparison of the results of PVA/Tartaric acid membranes with and without 5.1 M H3PO4.
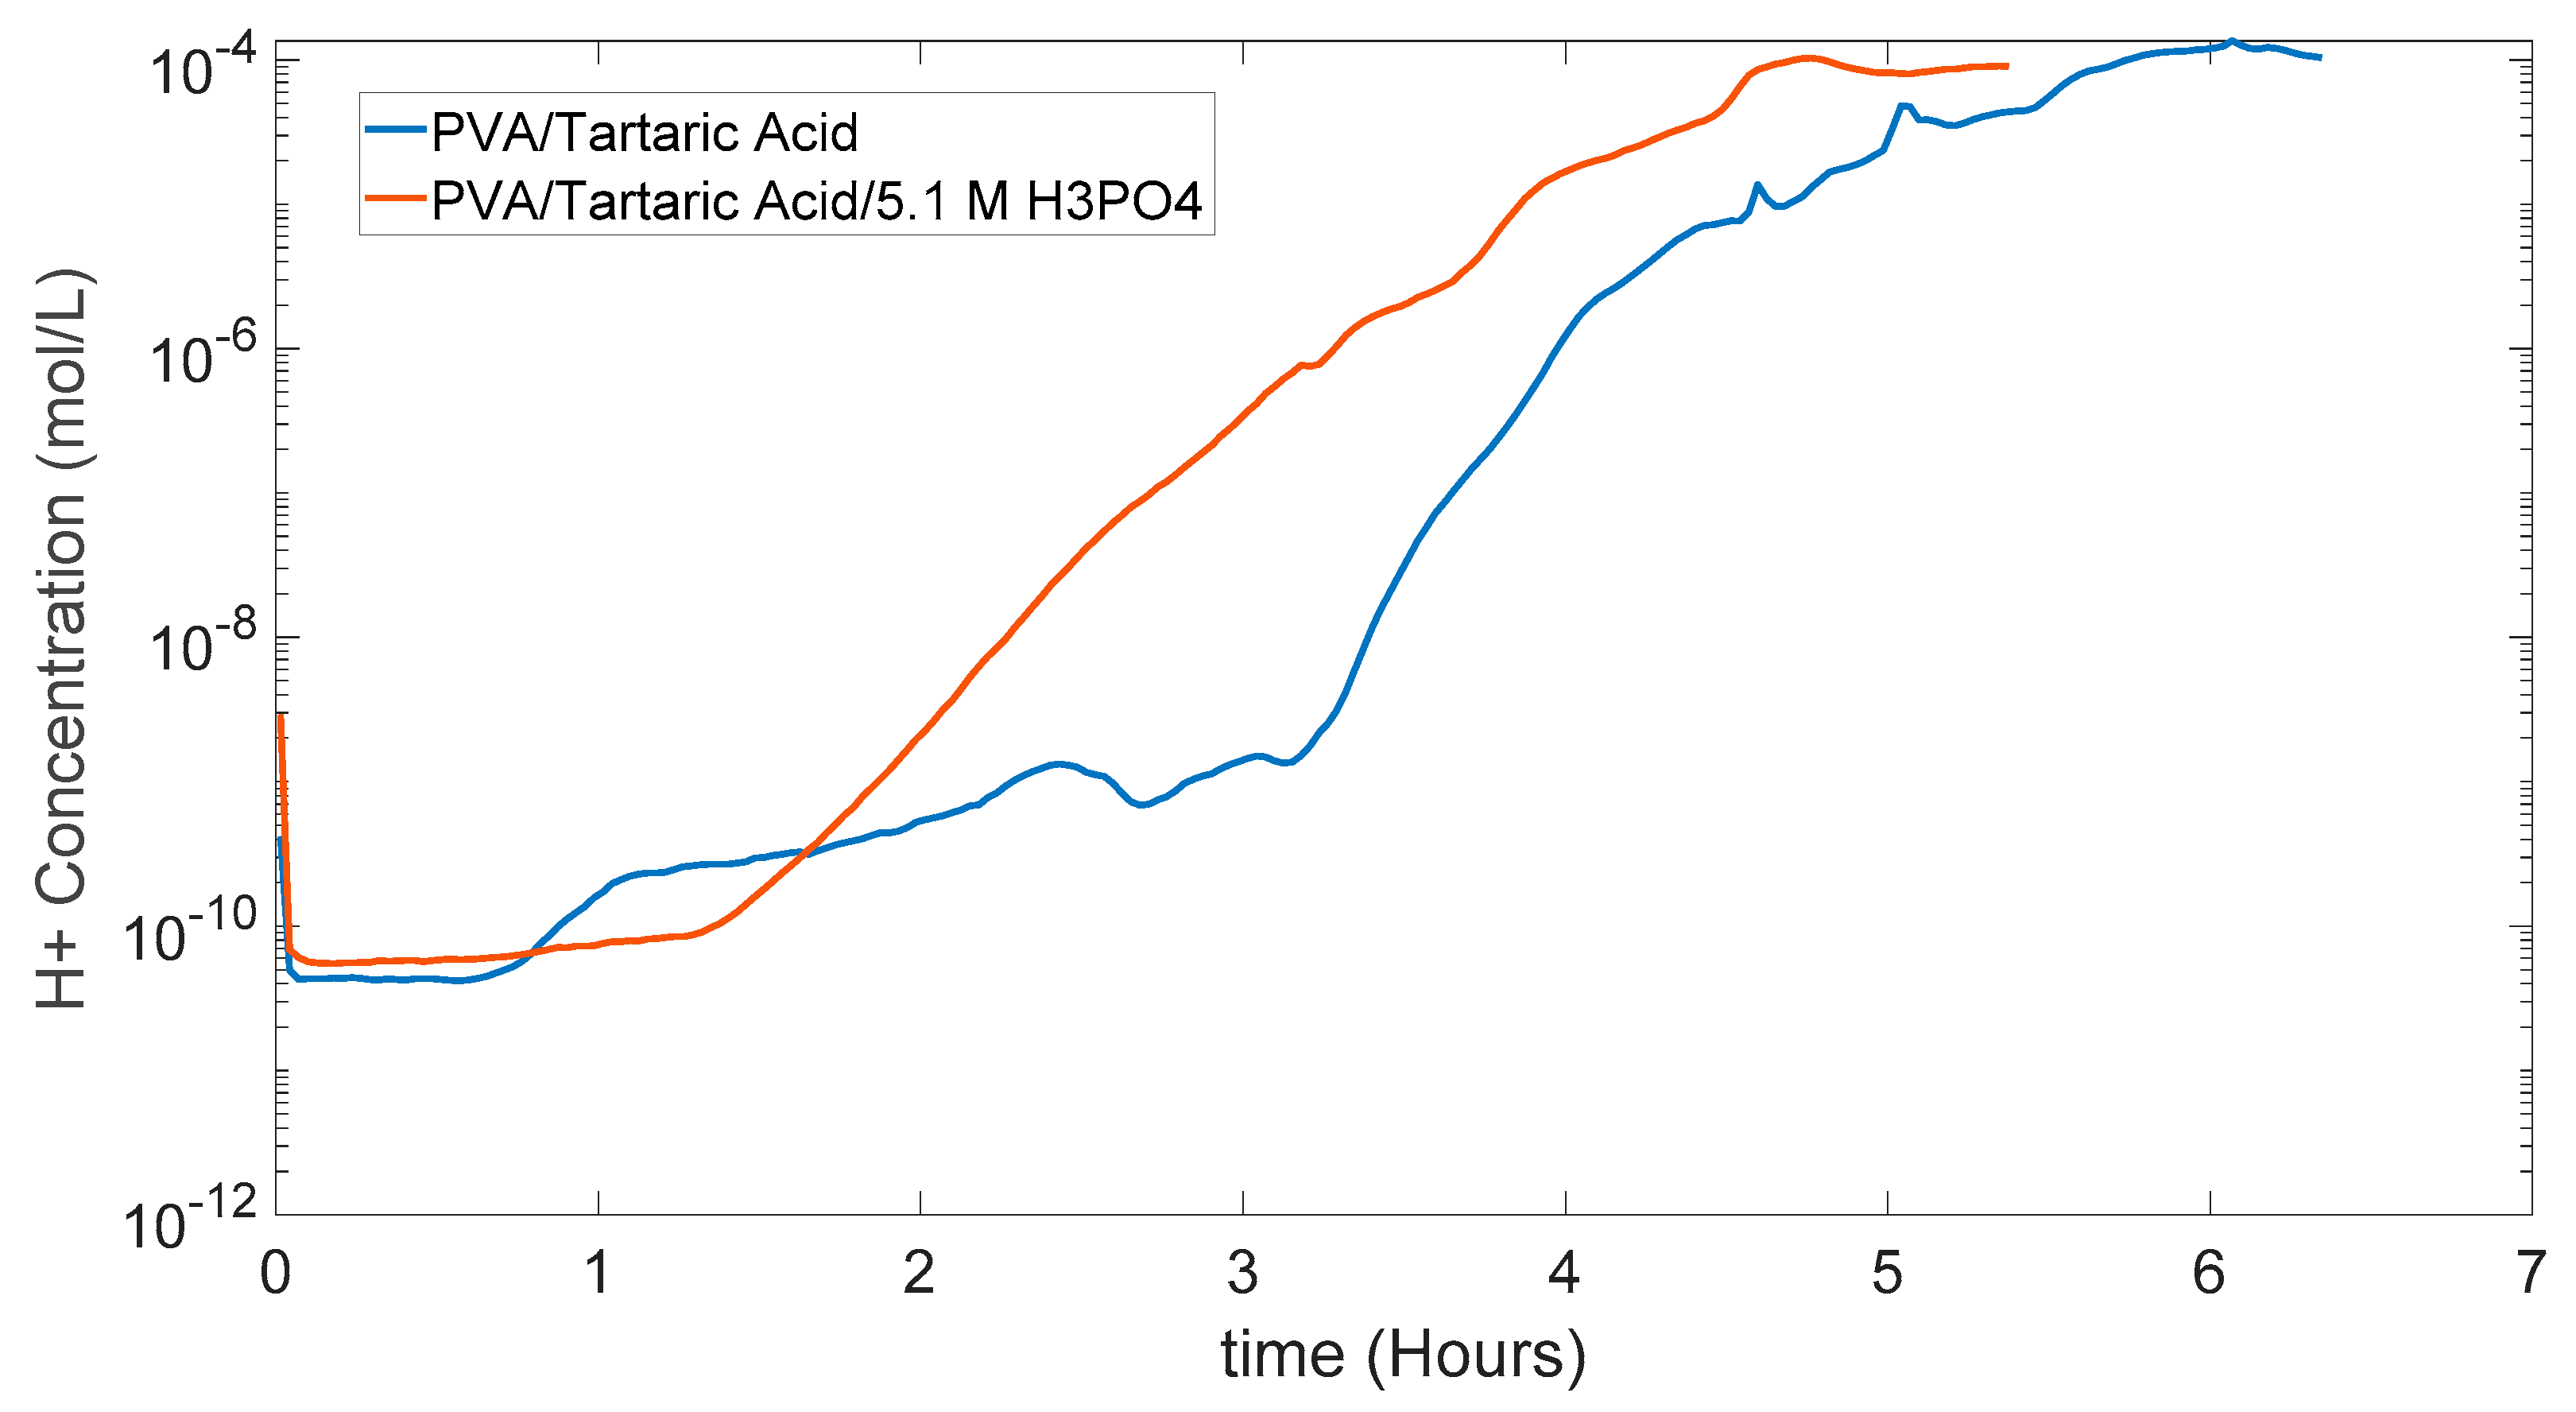
In Figure 5.12 [H+] can be seen in the semilogarithmic graph with y axis as log and x axis in linear form. This gives the same conclusion H+ concentration increases faster in the PVA/Tartaric Acid/5.1 M H3PO4 membrane as expected, and this shows again potential of this experimental measurement method to give information about the proton conductivity comparison between different membranes.
Figure 5.12.
[H+] graph of PVA/Tartaric Acid membranes with and without 5.1 M H3PO4.
Figure 5.12.
[H+] graph of PVA/Tartaric Acid membranes with and without 5.1 M H3PO4.
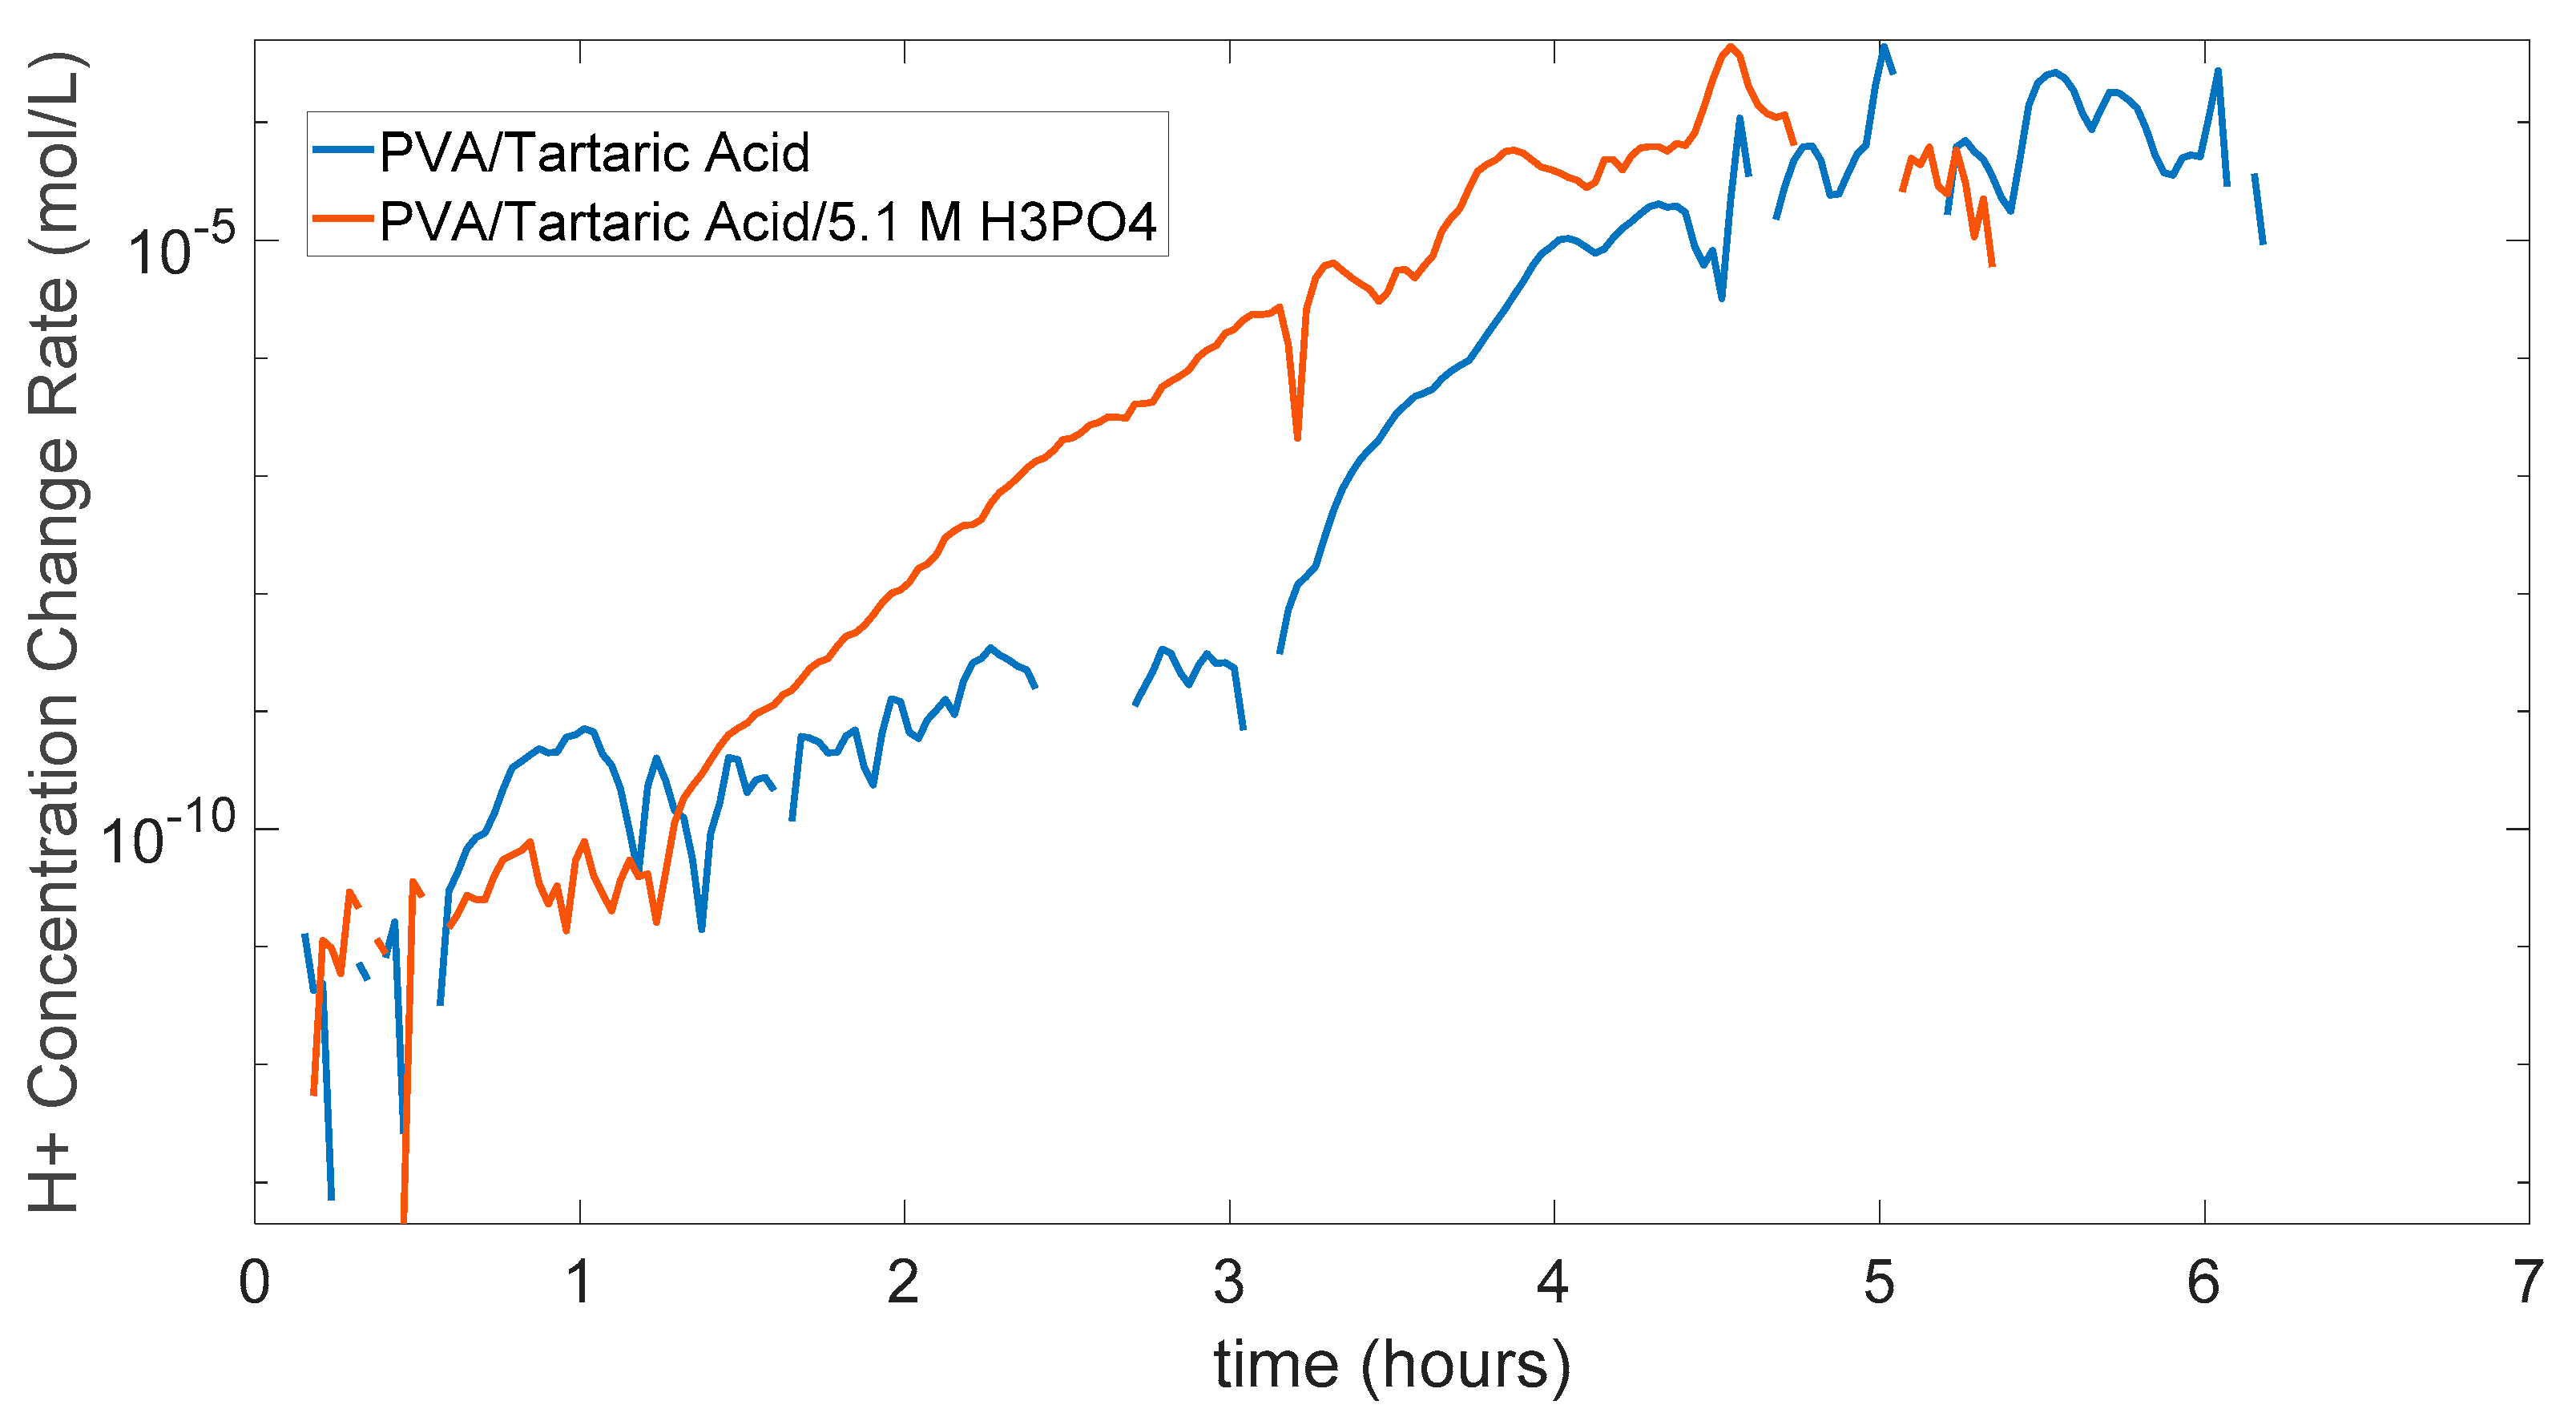
And in Figure 5.13 the change rate of [H+] can be seen for two membranes both with H3PO4 and without. There are some cuts in the graph because of fluctuations of data, the change rate can go minus in some cases, so this data is not included in this graph. But as can be seen from the general trend change rate of [H+] or which can be accepted as the proton conductivity is bigger in the PVA/Tartaric acid/5.1 M H3PO4 membrane. This can be seen especially in the between 1.5 hours to 5 hours range. At the first part up to 1.5 hours both membranes are still dry, and water or vehicle mechanism is not making full effect in the proton conductivity. And in the last part as the stabilization part comes near this time proton conductivity goes lower as the [H+] is getting lower in the acidic side.
Figure 5.13.
Graph of [H+] change rate of PVA/Tartaric acid membranes with and without 5.1 M H3PO4.
Figure 5.13.
Graph of [H+] change rate of PVA/Tartaric acid membranes with and without 5.1 M H3PO4.
5.4. PDMS (Polydimethylsiloxane) Membrane Results
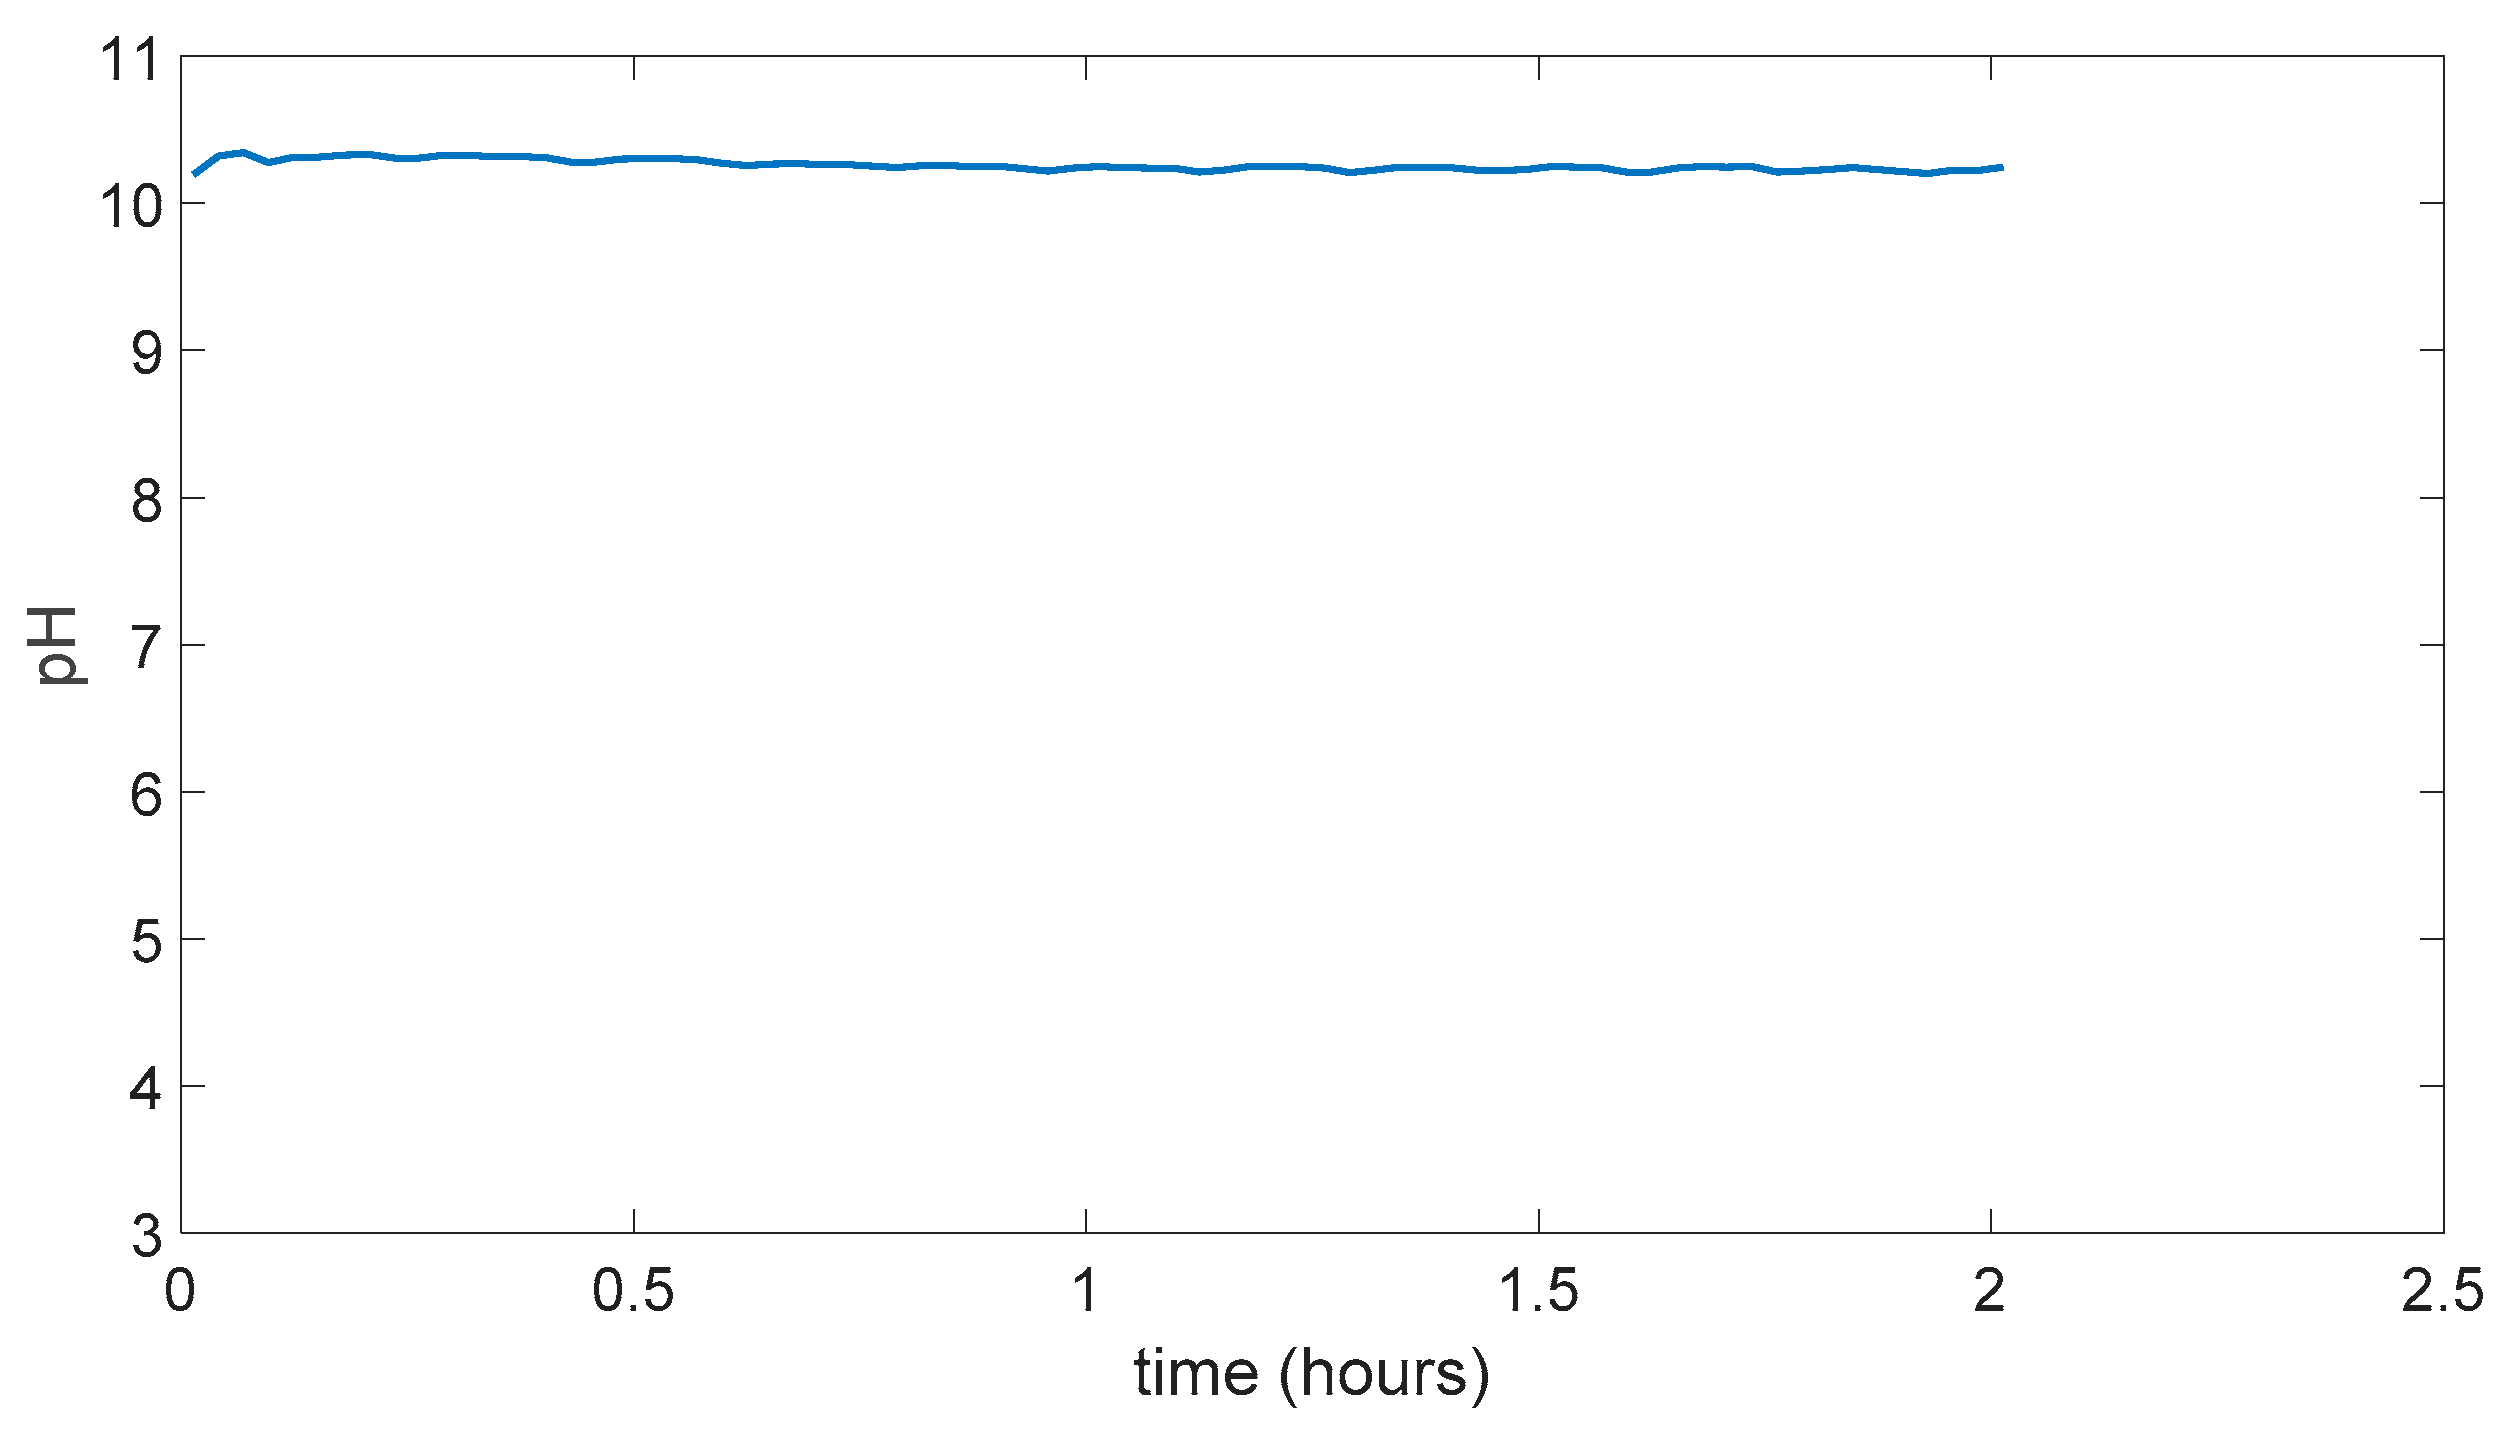
Even though PDMS is hydrophobic and known for its low proton conductivity as it was in the hand and to show that experimental measurement method can also show the expected low change rate the PDMS membrane is used in the experimental measurement method.
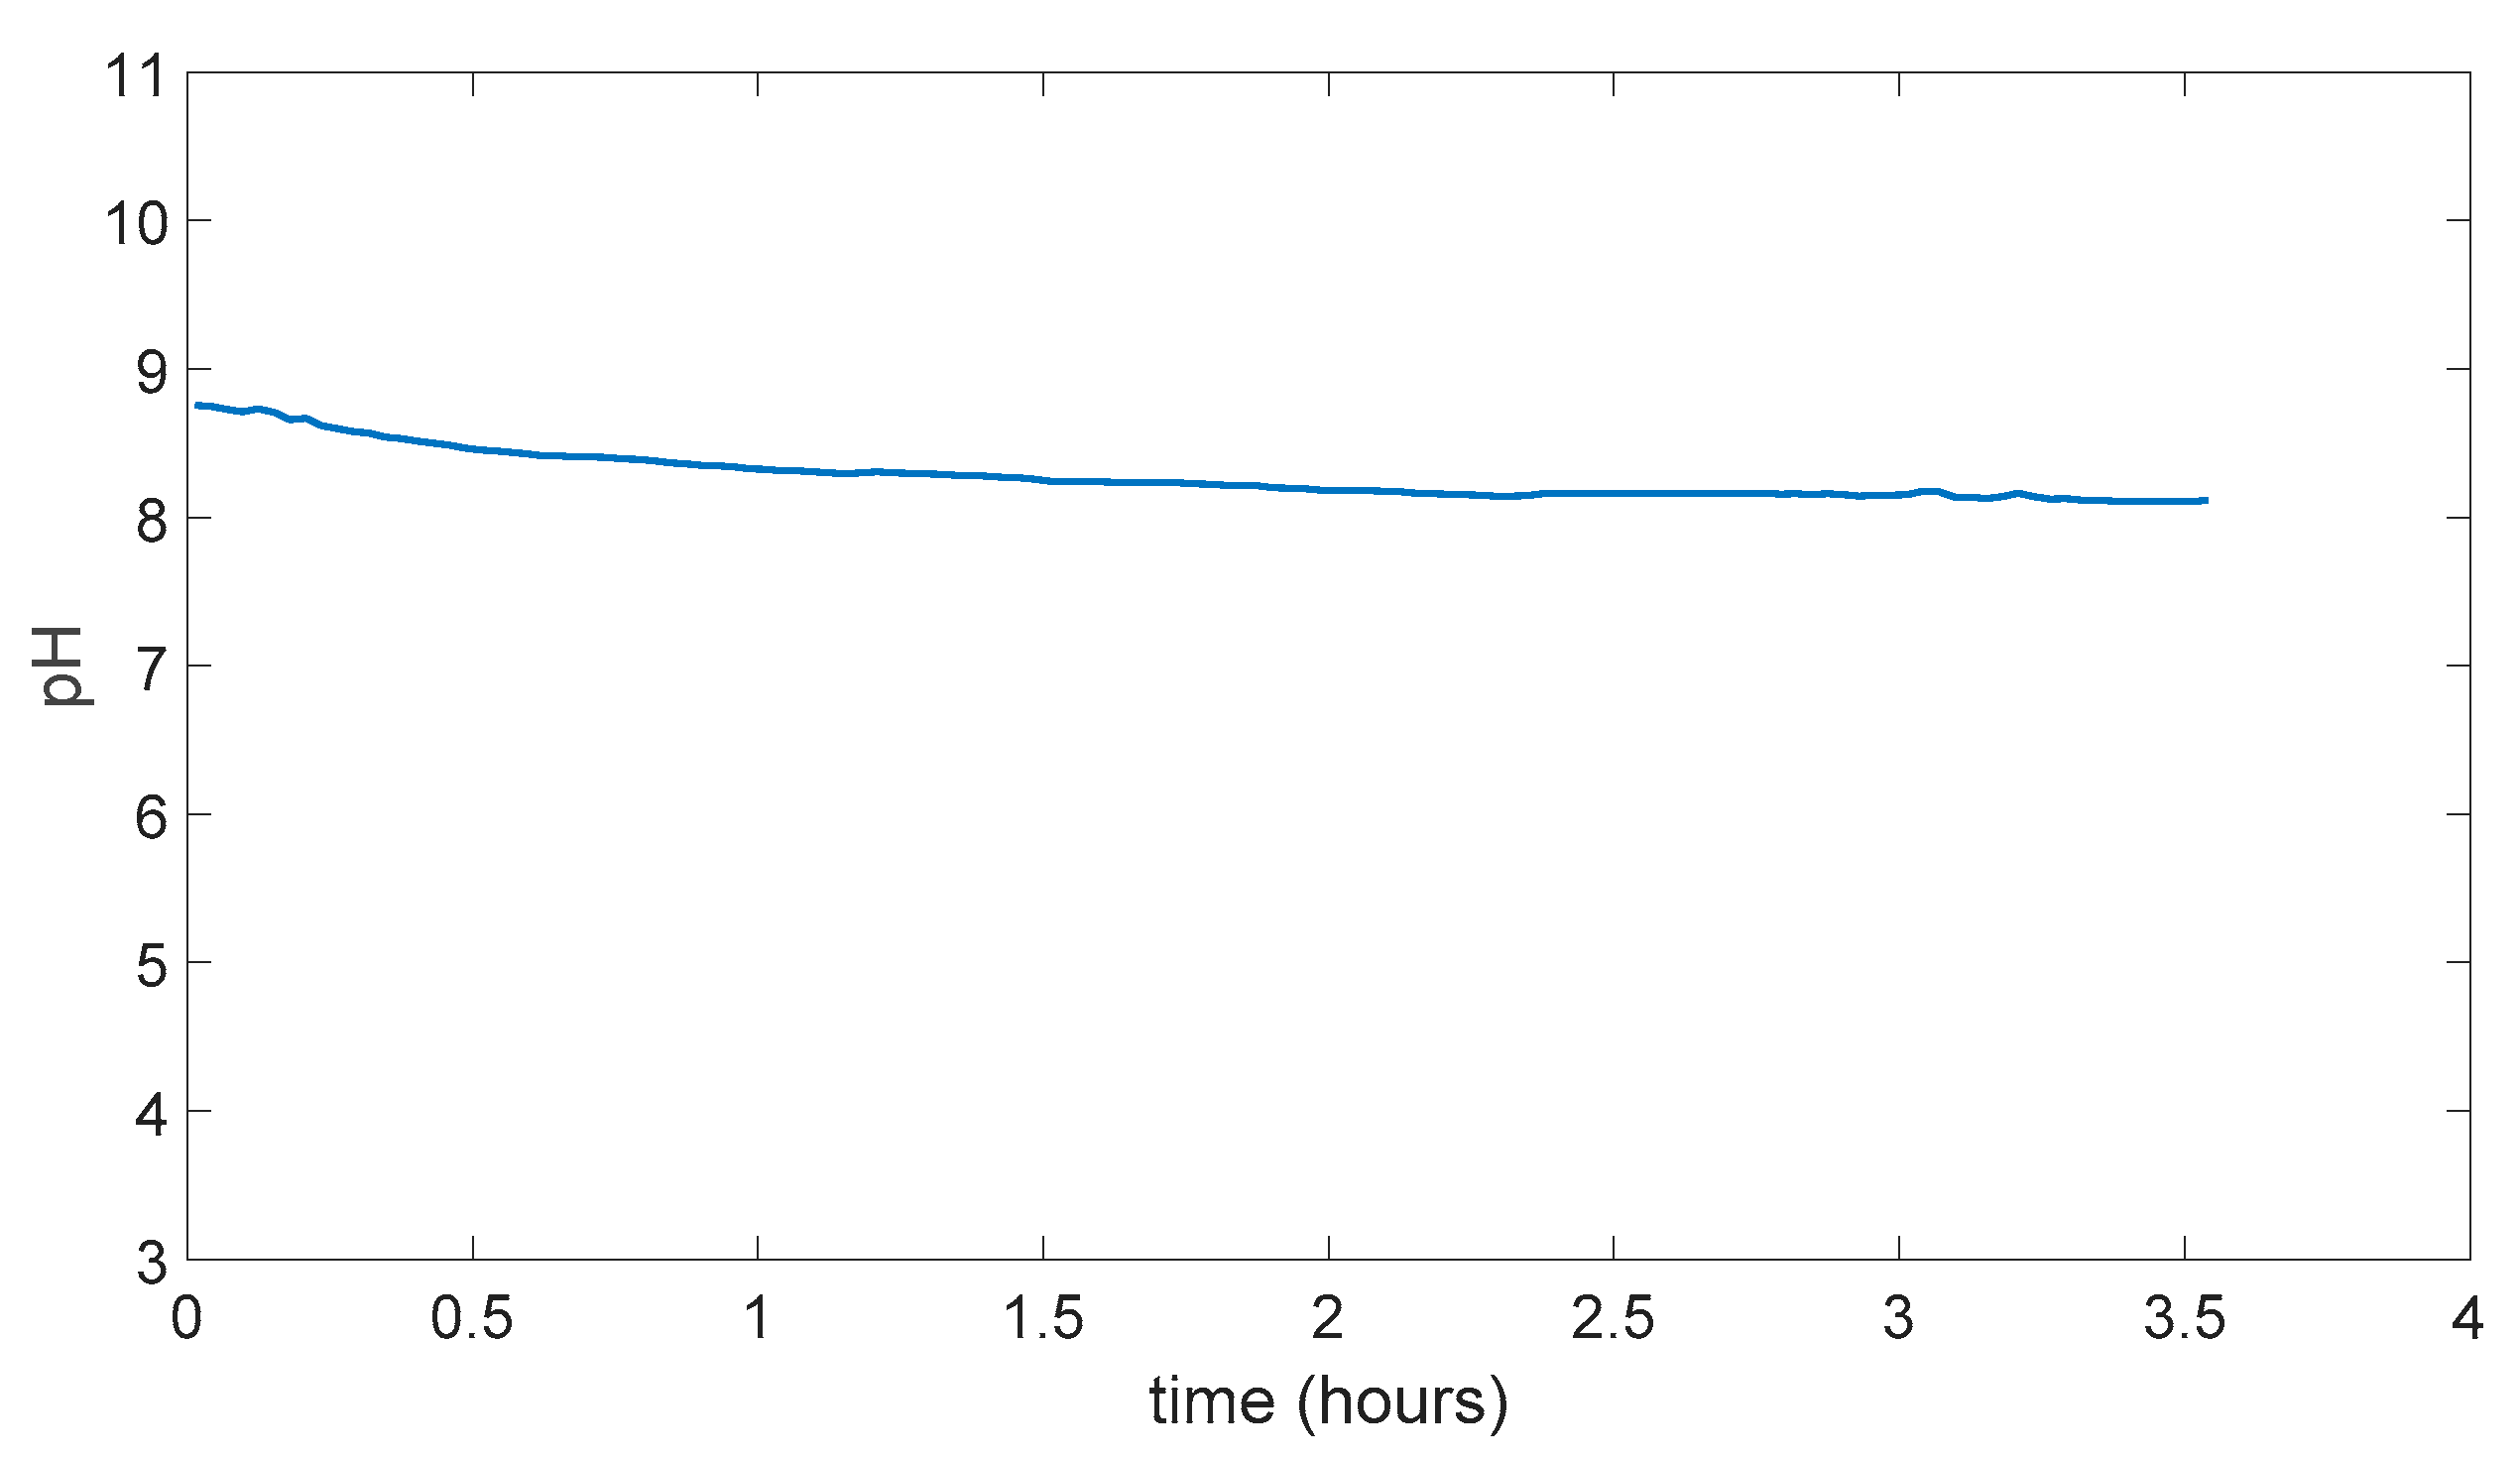
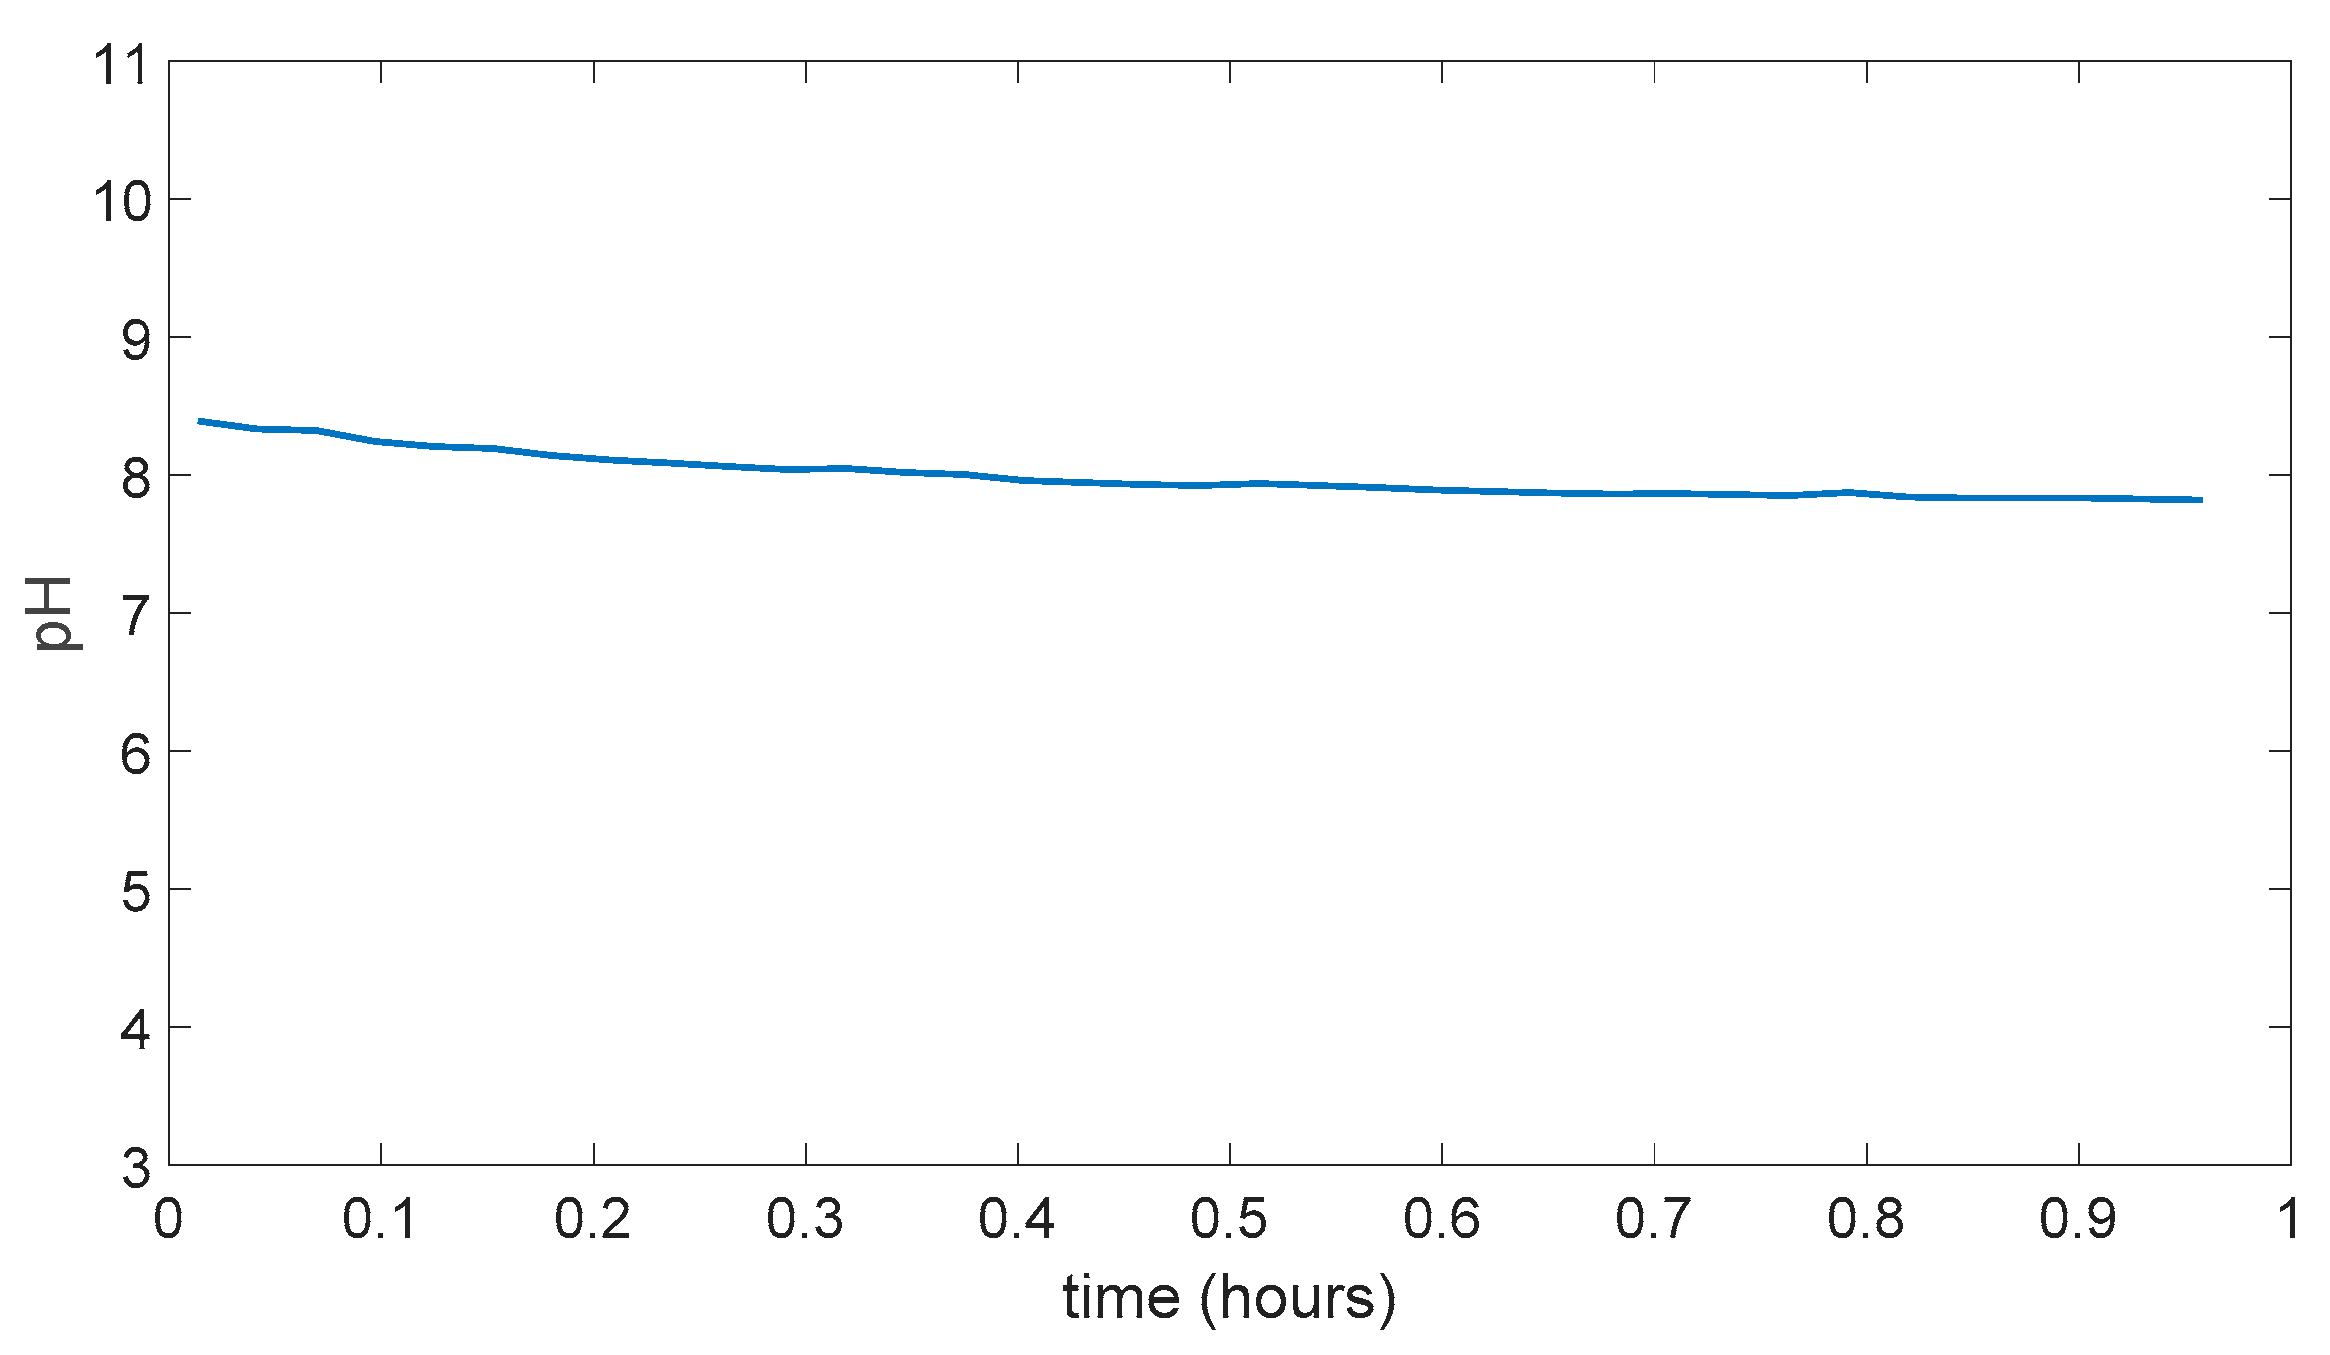
As the PDMS membrane proton conductivity is very low it takes a huge time to observe a pH change and unfortunately computer connection cannot be let for continuously experiment made in 3 days. First day measurement is taken as soon as the start of the experiment after ending it left for overnight and next day and again measurement taken this made for 2 days. In total 3 measurements are taken even though stabilization of pH is not happened as from the data it can be clearly seen that it would take lots of days to get stabilization point for PDMS membrane. And as can be seen from Figure 5.14, 5.13, and 5.12 even in the 3 days pH was only a little below 8. So experimental measurement again has given expected results as proton conductivity is low in PDMS.
Figure 5.14.
PDMS Membrane experiment result day 1.
Figure 5.14.
PDMS Membrane experiment result day 1.
Figure 5.15.
PDMS membrane experiment result day 2.
Figure 5.15.
PDMS membrane experiment result day 2.
Figure 5.16.
PDMS membrane experiment result day 3.
Figure 5.16.
PDMS membrane experiment result day 3.
5.5. Swelling Data
In Table 5.1 swelling data can be seen for only 3 membranes as others did not have mechanical integrity in the end of experiment and mostly dissolved or torn into little pieces in the experiment solutions so their swelling could not be calculated.
Table 5.1.
Swelling data obtained for different membranes.
Table 5.1.
Swelling data obtained for different membranes.
| Membrane |
Swelling (%) |
| (PVA)0.7(NaBr)0.3(H3PO4)0M
|
- |
| (PVA)0.7(NaBr)0.3(H3PO4)5.1M
|
- |
| PVA/PAMA |
- |
| PVA/PAMA/5.1 M H3PO4
|
- |
| PVA/Tartaric Acid |
%16.3 |
| PVA/Tartaric Acid/5.1 M H3PO4
|
%8.87 |
| PDMS |
%0.116 |
6. CONCLUSION
In the end, the prepared experimental measurement method based on pH change through the membrane showed the potential to compare the different membrane’s proton conductivity properties as can be seen from the PVA/Tartaric acid results with and without the H3PO4 addition. Also, the PDMS membrane showed the expected results and had a very long pH change time even though it did not stabilize in 3 days. But these results are fairly literature and knowledge-based results.
Also, it is seen that these prepared methods for proton conductivity cannot be used for polymer membranes or PEMs which can be dissolved in water or not resistant to the water. This is seen in (PVA)0.7(NaBr)0.3(H3PO4)XM and PVA/PAMA membranes results.
Another problem with the experimental measurement method is that the prepared prototype is not perfect and can have leakage problems which are led to the failure of some of the measurements which are not included in the results as they are retaken. Leakage can be caused by the acidic and basic solvents being corrosive and damaging silicone adhesive around the junction points or through O-ring points due to the shape changes in the membrane due to swellings.
Finally, this study can be a ground point for a potential proton conductivity measurement method, but the measurement prototype used should be improved to prevent leakage and more stable hold on the membrane. And also, experimental measurement should be tried on more and different types of membranes with different sets and their proton conductivity should also be measured using commonly used methods like IEC and EIS which was not possible in this research due to the inability to access equipment and time limitations. If IEC and EIS results show correlations with experimental measurement results that would be definitive evidence of this proton conductivity measurement method working.
Acknowledgments
First of all, I genuinely would like to express my deepest appreciation to my advisor Assoc. Prof. Dr. Yavuz SALT for his immense support throughout the whole stages of thesis as both scientific and personal guidance. Also, for giving me a safe and beneficial experimental study opportunity in this tough period. I feel grateful to have an opportunity to finish my studies safely and healthily. Last but not least, I would like to share our eternal gratefulness for my family which stood with me not only on my undergraduate studies but in my whole life, without them none of this would indeed be possible.
References
- A., H., F. Santos, J. A., Z., R., & Matencio, T. (2011). Ceramic materials for solid oxide fuel cells. Advances in Ceramics - Synthesis and Characterization, Processing and Specific Applications. [CrossRef]
- Ahmad, F., & Sheha, E. (2013). Preparation and physical properties of (PVA)0.7(NaBr)0.3(H3PO4)m solid acid membrane for phosphoric acid – fuel cells. Journal of Advanced Research, 4(2), 155–161. [CrossRef]
- Alberti, G. (2009). Fuel cells – proton-exchange membrane fuel cells membranes. Encyclopedia of Electrochemical Power Sources, 650–666. [CrossRef]
- Andújar, J. M., & Segura, F. (2009). Fuel cells: History and updating. A walk along two centuries. Renewable and Sustainable Energy Reviews, 13(9), 2309–2322. [CrossRef]
- Aung, N. N., Myat, Y. Y., Ngawhirunpat, T., Rojanarata, T., Patrojanasophon, P., Opanasopit, P., & Pamornpathomkul, B. (2019). Evaluation of thermally crosslinked poly(acrylic acid-co-maleic acid) (pama)/poly(vinyl alcohol) (PVA) Microneedle arrays. Key Engineering Materials, 819, 45–50. [CrossRef]
- Baykara, S. Z. (2018). Hydrogen: A brief overview on its sources, production and environmental impact. International Journal of Hydrogen Energy, 43(23), 10605–10614. [CrossRef]
- Boudghene Stambouli, A., & Traversa, E. (2002). Fuel cells, an alternative to standard sources of energy. Renewable and Sustainable Energy Reviews, 6(3), 295–304. [CrossRef]
- Carrette, L., Friedrich, K.A. and Stimming, U. (2000), Fuel Cells: Principles, Types, Fuels, and Applications. ChemPhysChem, 1: 162-193. [CrossRef]
- Colpan, C. O., Nalbant, Y., & Ercelik, M. (2018). 4.28 fundamentals of Fuel Cell Technologies. Comprehensive Energy Systems, 1107–1130. [CrossRef]
- Haile, S. M. (2003). Fuel cell materials and components. Acta Materialia, 51(19), 5981–6000. [CrossRef]
- Hema, M., Selvasekerapandian, S., Sakunthala, A., Arunkumar, D., & Nithya, H. (2008). Structural, vibrational and electrical characterization of PVA–NH4BR polymer electrolyte system. Physica B: Condensed Matter, 403(17), 2740–2747. [CrossRef]
- Kamran, M. (2021). Fuel cell. Renewable Energy Conversion Systems, 221–242. [CrossRef]
- Kumar, V., Kumar, P., Nandy, A., & Kundu, P. P. (2015). Crosslinked inter penetrating network of sulfonated styrene and sulfonated PVDF-co-HFP as electrolytic membrane in a single chamber microbial fuel cell. RSC Advances, 5(39), 30758–30767. [CrossRef]
- Lee, C. H., Park, H. B., Lee, Y. M., & Lee, R. D. (2005). Importance of proton conductivity measurement in polymer electrolyte membrane for fuel cell application. Industrial & Engineering Chemistry Research, 44(20), 7617–7626. [CrossRef]
- Lucia, U. (2014). Overview on fuel cells. Renewable and Sustainable Energy Reviews, 30, 164–169. [CrossRef]
- Mahato, N., Jang, H., Dhyani, A., & Cho, S. (2020). Recent progress in conducting polymers for hydrogen storage and fuel cell applications. In Polymers (Vol. 12, Issue 11, pp. 1–40). MDPI AG. [CrossRef]
- McLean, G. (2002). An assessment of Alkaline Fuel Cell Technology. International Journal of Hydrogen Energy, 27(5), 507–526. [CrossRef]
- Pourzare, K., Mansourpanah, Y., & Farhadi, S. (2016). Advanced nanocompositemembranes for fuel cell applications: A comprehensive review. Biofuel Research Journal, 3(4), 496–513. [CrossRef]
- Rozière, J., & Jones, D. J. (2003). Non-fluorinated polymer materials for proton exchange membrane fuel cells. Annual Review of Materials Research, 33(1), 503–555. [CrossRef]
- Sheha, E. (2010). Preparation and physical properties of (PVA)0.75(NH4BR)0.25(H2SO4)XM solid acid membrane. Journal of Non-Crystalline Solids, 356(43), 2282–2285. [CrossRef]
- Smitha, B. (2003). Synthesis and characterization of proton conducting polymer membranes for fuel cells. Journal of Membrane Science, 225(1-2), 63–76. [CrossRef]
- Sudhakar, Y. N., Selvakumar, M., & Bhat, D. K. (2018). Biopolymer electrolytes for fuel cell applications. Biopolymer Electrolytes, 151–166. [CrossRef]
- Ye, Y.-S., Rick, J., & Hwang, B.-J. (2012). Water soluble polymers as proton exchange membranes for fuel cells. Polymers, 4(2), 913–963. [CrossRef]
- Zuo, Z., Fu, Y., & Manthiram, A. (2012). Novel blend membranes based on acid-base interactions for fuel cells. Polymers, 4(4), 1627–1644. [CrossRef]
|
Disclaimer/Publisher’s Note: The statements, opinions and data contained in all publications are solely those of the individual author(s) and contributor(s) and not of MDPI and/or the editor(s). MDPI and/or the editor(s) disclaim responsibility for any injury to people or property resulting from any ideas, methods, instructions or products referred to in the content. |
© 2023 by the authors. Licensee MDPI, Basel, Switzerland. This article is an open access article distributed under the terms and conditions of the Creative Commons Attribution (CC BY) license (http://creativecommons.org/licenses/by/4.0/).
