Preprint
Article

Quantitative Investigation of the Fracture Aperture during Temporary Plugging and Diverting Fracturing

Altmetrics

Downloads

81

Views

20

Comments

0

A peer-reviewed article of this preprint also exists.

Submitted:

04 September 2023

Posted:

05 September 2023

You are already at the latest version

Alerts
Abstract
Hydraulic fracturing is an efficient method to develop oil/gas resources economically. Temporary plugging and diverting fracturing (TPDF) can generate diversion fractures perpendicular to the initial fractures and enhance the stimulated area. The aperture of the diversion fractures determines its conductivity and the oil/gas production. This work established a fluid-solid fully coupled simulation model to investigate the fracture aperture influenced by various factors during TPDF. The factors include the permeability of the tight plug, the length of the tight plug, Young’s modulus, rock tensile strength, in-situ stress contrast, the leak-off coefficient of the fracture surface, and fluid injection rate. Results show that the aperture of the previous fracture can be enlarged, and the aperture of the diversion fracture can be decreased by the tight plug. The aperture at the diversion fracture mouth is much smaller than that along the diversion fracture. Reservoirs with low Young’s modulus and high rock tensile strength can generate the diversion fracture with a wider aperture. Moreover, increasing the fluid injection rate can effectively increase the fracture mouth aperture. In this way, the risk of screenout can be lowered. This work is beneficial for the design of the TPDF and ensures safe construction.
Keywords: 
Subject: Engineering  -   Energy and Fuel Technology

0. Introduction

Unconventional oil and gas resources have become key to the world’s energy supply[1]. Unconventional reservoirs are characterized by low permeability and low porosity. There is no production naturally due to the low flow rate[2]. Hydraulic fracturing can efficiently promote the oil/gas flow into the wellbore by creating fractures within the reservoirs[3]. However, hydraulic fractures tend to propagate along the path with low resistance, and it is difficult to create complex fracture networks. Temporary plugging and diverting fracturing (TPDF) can plug the previous fracture (PF) paths by injecting self-degradable diverters. In this way, the injection pressure can be enhanced, and diversion fractures (DFs) can be created along other paths. After generating a complex fracture network, the diverters can degrade and flow out to the ground[4].
During TPDF, the PFs can induce additional stresses, and the apertures of the DFs are highly influenced by the existence of PFs[5]. Fracture aperture determines the effect of the proppant transportation and the conductivity of the propped fractures. Quantitative investigation of fracture aperture is of great value to optimize the design of TPDF. Various models have been established to calculate fracture apertures. Sneddon and Elliott established the model for calculating the aperture of a Griffith fracture under internal pressure. This model considers the distribution of stress in the interior of an infinite 2D elastic medium[6]. Penkins et al. reported that the fracture aperture is essentially controlled by fluid pressure drop within the fracture. Fractures of wide aperture can be generated by the high injection rate and viscous fluids. They derived the equations which permit the estimation of fracture apertures for a variety of flow conditions and both for vertical and horizontal fractures[7]. Palmer and Carroll proposed models of three-dimensional (3D) fracture propagation to investigate the effects of tresses on the fracture aperture. The model can give an upper or safe limit on the pumping parameters to ensure proppant transportation[8]. Morales described a pseudo-3D fracture model that can solve the coupled fluid flow and elastic rock deformation during fracture propagation. The fracture width was obtained from a plane-strain elasticity solution. The state of proppant transportation was tracked during the treatment[9]. Todd et al. estimated the fracture aperture for arbitrary pressure distribution in porous media. They pointed out that the fluid leak-off, the fluid flow in porous media, and the pressure response should be incorporated in predicting fracture aperture[10]. Guo et al. investigated the aperture of two fractures symmetrically located at the edge of a wellbore subjected to a uniform wellbore pressure. Detailed fracture aperture profiles for various in-situ stresses and fracture lengths are obtained. The closed-form solution for the fracture mouth aperture was derived based on dimensional analysis and the superposition principle[11]. Shahri et al. provided a fast-running, semi-analytical workflow to accurately predict fracture aperture distribution and fracture re-initiation pressure accurately. The algorithm and workflow can account for near-wellbore stress perturbations, far-field stress anisotropy, and wellbore inclination[12]. Zhang et al. developed a new semi-analytical line fracture solution that accounts for stress anisotropy. The new solution is simple to implement and has been verified against the finite element calculation[13]. Liu et al. proposed an inversion algorithm in which the strains are related to the fracture widths through a Green function. A 3D displacement-discontinuity method is used to construct the Green function[14]. Xu et al. developed the prediction model for dynamic fracture aperture based on the non-Newtonian fluid loss dynamic theory. The model is validated by field data. Parametrical analysis was conducted to investigate the effects of flow pattern index, pressure difference, and consistency coefficient on the dynamic fracture aperture[15].
The distribution of fracture aperture has also been investigated through experimental and numerical methods. True tri-axil hydraulic fracturing experiments have been applied to investigate the fracture geometry, the fluid injection pressure, and the fracture aperture distribution. Zheng et al. investigated the effect of pore pressure on the fracture geometry and the fracture aperture. They pointed out that when the pore pressure increases by 4 MPa, the breakdown pressure can increase by 22.8%[16]. Zhang et al. proposed a novel experimental process to model the propagation of multiple fractures. Rock splitting and 3D reconstruction technology were applied to characterize the fracture geometry. The fracture aperture was compressed by the existence of previous fractures[17]. Wu et al. performed numerous triaxial hydraulic fracturing experiments to investigate HF propagation behavior. Seven types of HF geometries were observed[18]. Shi et al. conducted a series of large-size hydraulic fracturing physical simulation experiments to investigate hydraulic fracture propagation in massive-distributed hydrate-bearing reservoirs. The effects of massive hydrate size, approaching angle, and fracturing fluid displacement were analyzed[19]. Chang et al. conducted laboratory fracturing tests to investigate the influence of injection scenarios on the initiation, propagation, and aperture of hydraulic fractures. They concluded that the cyclic injection method can reduce the breakdown pressure by 24%. Pulse fracturing creates the most complex fracture geometry[20]. Shi et al. performed true triaxial hydraulic fracturing experiments on gravel rocks with acoustic emission monitoring. Results show that the fracture aperture for a penetration fracture is the largest due to high fracturing energy. The diversion fracture exhibits the smallest fracture width[21]. Wang et al. conducted hydraulic fracturing experiments to investigate the injection pressure and the overall fracture geometry during TPDF. The fracture aperture was also investigated by numerical methods[22]. Wang et al. applied the 3D finite element method to investigate the fracture mouth aperture influenced by the previous fracture along a vertical well. The effects of the previous fracture can be neglected due to the small induced stress vertically[23]. Wu and Olson applied the 3D boundary element method to analyze the methods for promoting uniform development of simultaneous multiple-fracture propagation in horizontal wells. Fractures can divert and compress with each other. Screenout is more likely to occur at the mouth of the inner fractures[24].
In conclusion, the pattern of fracture aperture during hydraulic fracturing can be effectively investigated by the theoretical model, the experimental method, and the numerical method. The theoretical model can calculate the aperture of a single fracture, not multiple fractures. The size of the experimental samples is limited and the effects of the boundary condition cannot be neglected. The reported numerical simulations have not considered the effects of the previous fractures perpendicular to the diversion fracture during TPDF. In this work, a 2D fluid-solid coupling model is established to investigate the effects of 7 factors on the apertures of the initial and diversion fractures. The plug model is proposed to simulate the effect of the tight plug, and the propping model is proposed the simulate the effect of the proppant. This work finds out the dominant factors that determine the fracture aperture. Moreover, measurements are proposed to lower the risk of screenout.

1. Mathematical Equation

The simulation of hydraulic fracturing is a complex problem because multiple physical processes should be considered, including rock deformation, fracture initiation, fracture propagation, fluid flow within porous media, and fracture flow within the fracture. The controlling equations can be referred to Wang et al.[25] Moreover, the reliability of the finite element method in simulating hydraulic fracturing has been verified by several researchers[26-30].

1.1. Rock Deformation

The rock equilibrium equation can be described by[25]
V ( σ ¯ p w I ) δ ε d V = S t δ v d S + V f δ v d V
Where t is the surface traction vector per unit area, N/m2; f is the body force vector per unit volume, N/m3; I is the identity matrix, dimensionless; δε is the matrix of virtual strain rate, s-1; δv is the matrix of virtual velocity, m/s. σ ¯ is the matrix of effective stress, Pa.

1.2. Fluid Flow in Porous Media

The fluid continuity equation within the porous rock is [25]
1 J t ( J ρ w n w ) + x ( ρ w n w v w ) = 0
Where J is the volume change ratio of porous media, dimensionless; ρw is the fluid density, kg/m3; nw is the porosity ratio, dimensionless; vw is the seepage velocity of the fluid, m/s; x is space vector, m.

1.3. Fluid Flow within Fractures

The tangential flow rate qf within hydro-fractures is [25]
q f = w 3 12 μ p f
Where qf is the average fluid velocity, m3/s; w is the fracture width, m; μ is the fluid viscosity, cp; pf is the fluid pressure within the fracture, Pa.
The fluid continuity equation within fracture is [25]
q f w t + q b + q t = 0
Where qb and qt are the normal flow velocity at the bottom fracture surface and the top fracture surface, respectively, m/s.

1.4. Fracture Initiation Law

The quadratic fracture initiation law is applied to determine the time when the fracture element begins to degrade: [25]
t n t n 0 2 + t s t s 0 2 + t t t t 0 2 = 1
Where t n , t s , t t are the real stresses in the three directions, t n 0 , t s 0 , t t 0 are the corresponding tensile and shear strength.

1.1. Fracture Propagation Law

The Benzeggagh-Kenane fracture criterion is applied to simulate the fracture propagation state:
G e q u i v C = G I C + ( G I I C G I C ) ( G I I C + G I I I C G I C + G I I C + G I I I C )
Where GequivC is the computed equivalent fracture energy release rate; GIC, GIIC, and GIIIC, are Model I (tension failure), Model II (shear failure under sliding), and Model III (shear failure under tearing) fracture energy release rates, respectively; in BK roles, GIIC equals to GIIIC.

2. Model Establishment and Simulation Methods

2.1. Model Establishment

The more complex the hydraulic fracture, the higher the well production. During TPDF, the initial fracture propagates along the direction of the less resistance (i.e., the direction of the maximum horizontal stress). The self-degradable diverters can effectively plug the initial fracture mouth and enhance the fluid pressure. Then the subsequent fluid will divert into the diversion fracture and generate a fracture perpendicular to the initial fracture (as shown in Figure 1a). After that, the diverter will degrade and dissolve within the fracturing fluid and flow out on the ground. In this way, the target formation can be fully treated, and it generates a high oil/gas production rate.
In this work, the finite element based on the cohesive zone model (FEM-based CZM) was applied to establish the simulation model[25]. As shown in Figure 1b, the whole model has 54000 elements. The red transverse line represents the propagation path of the initial fracture, and the red vertical line represents the propagation path of the diversion fracture. The circular model has a diameter of 60 m, and there is a circle wellbore with a diameter of 0.2 m. The central region has fine elements, while the boundary region has coarse elements. It can guarantee both the accuracy and the speed of the calculation. Two sets of initial cracks were preset at the wellbore, and the fluid can flow into the initial and the diversion fractures smoothly. The whole simulation process includes four steps: balancing the pore pressure and the stress conditions, propagating the initial fracture, plugging and propping the initial fracture, and propagating the diversion fracture. The boundary elements are fixed normal displacement to eliminate rigid body displacement.

2.2. The Propping Effect of the Proppant

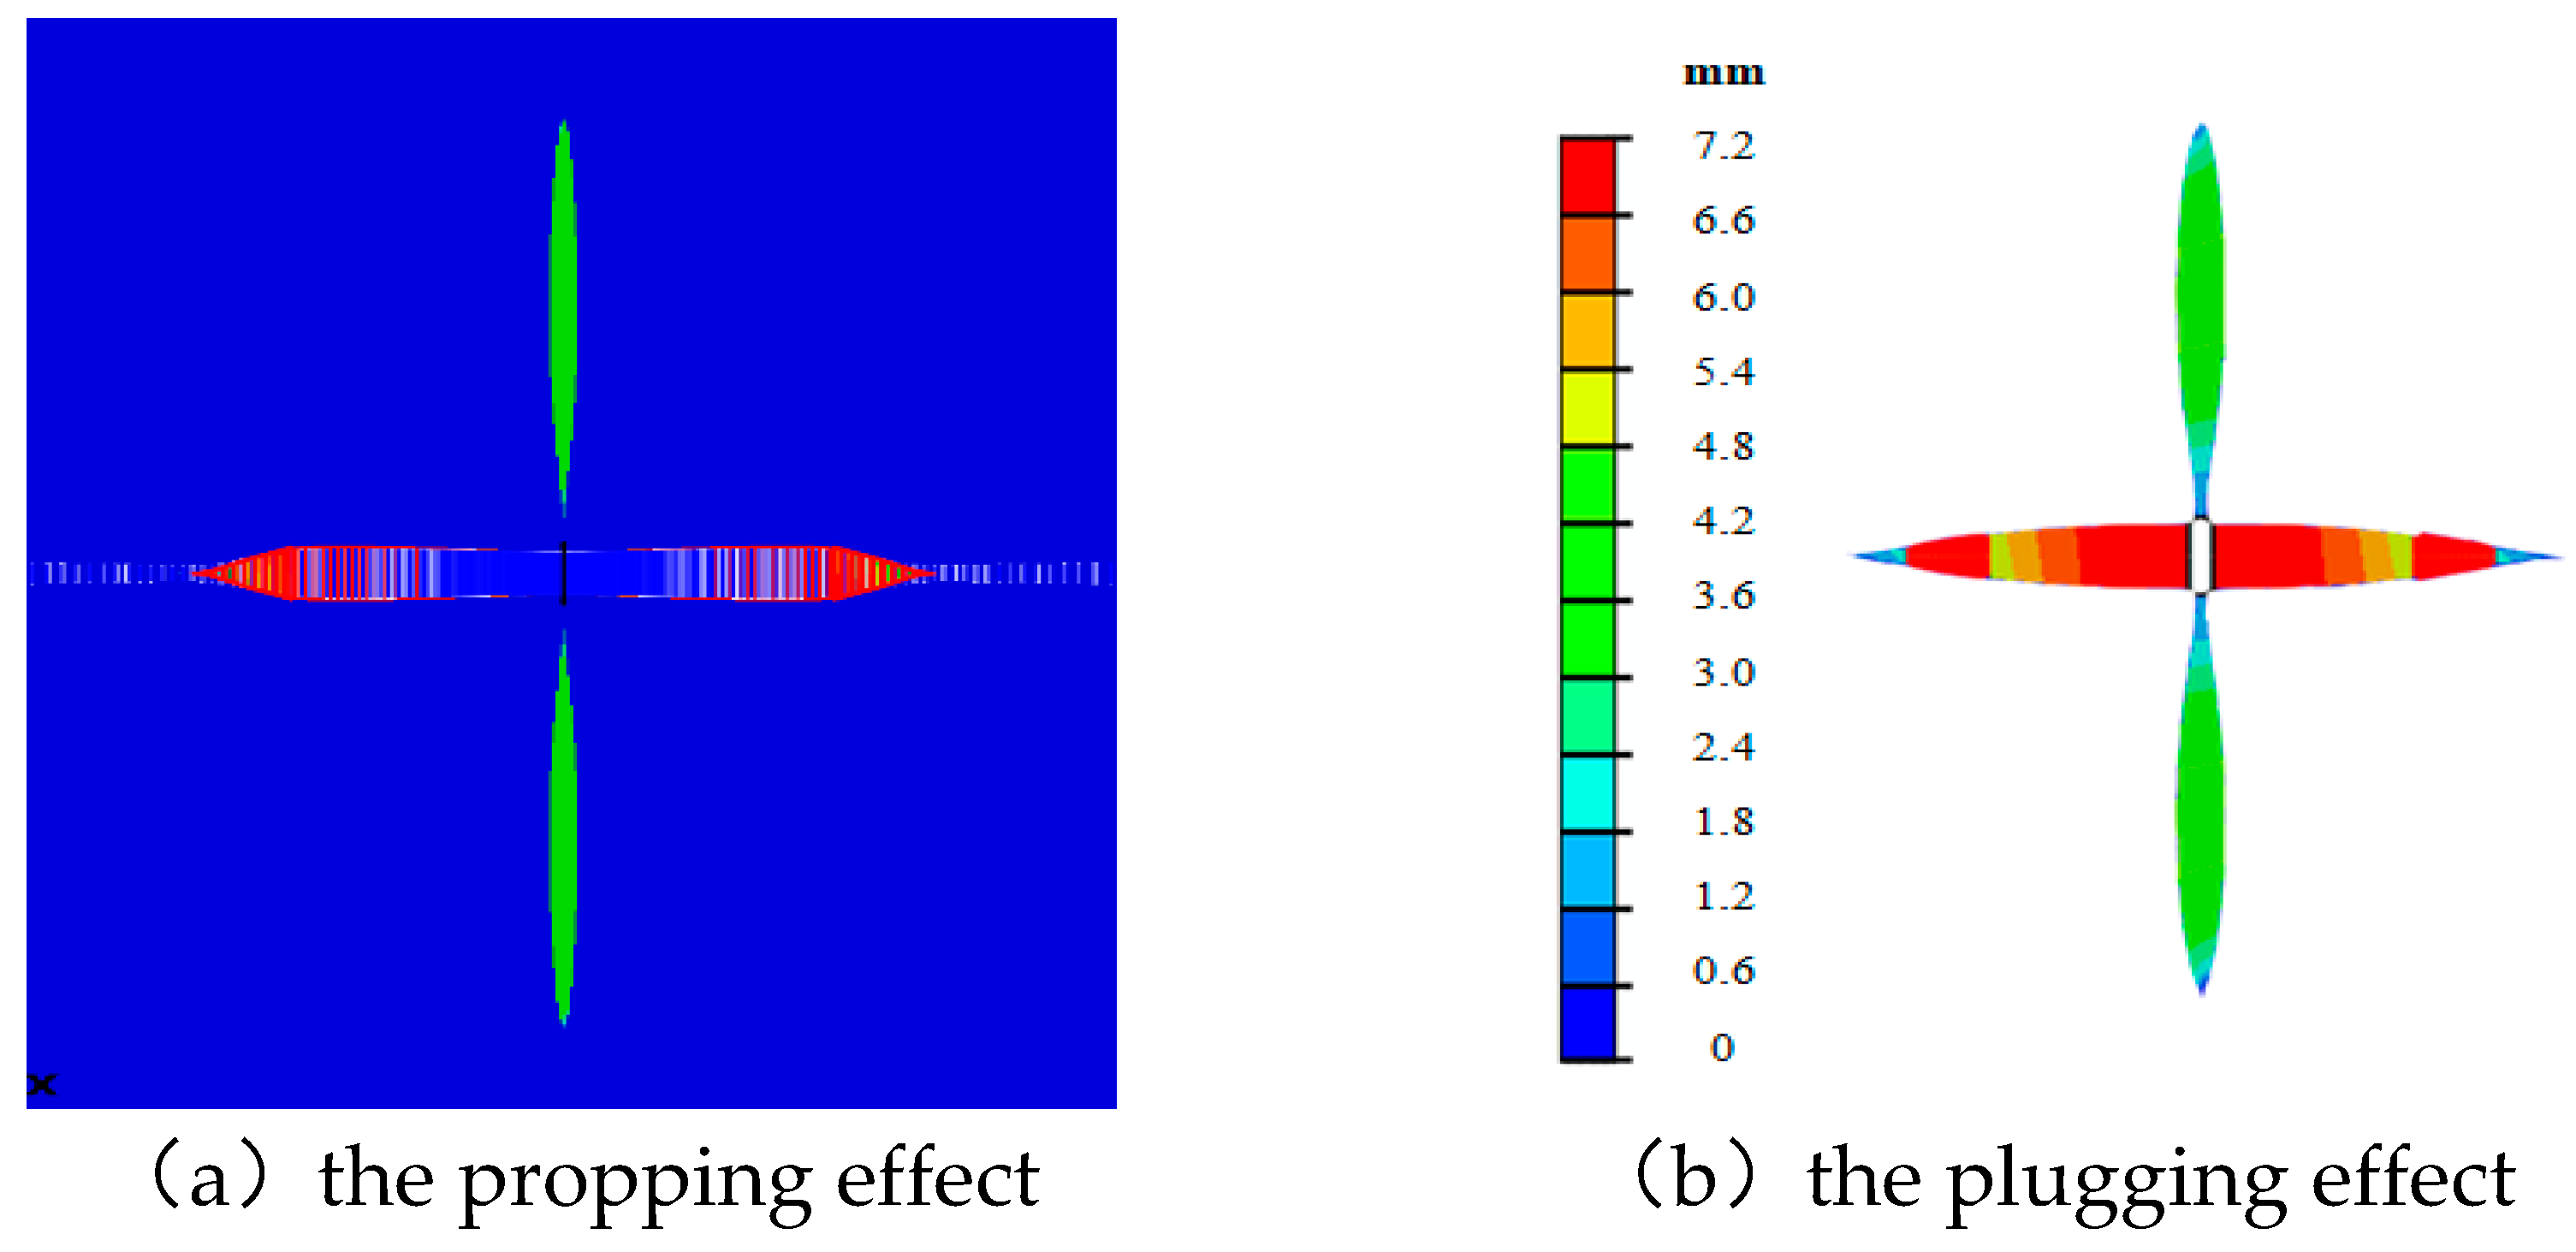
The initial fracture will be propped after injecting a large amount of proppant. The propped fracture will induce extra stress that compresses the diversion fracture aperture. In this work, a truss model is proposed to simulate the propping effect of the proppant. As shown in Figure 2a, the truss model comprises a series of truss elements. The truss model can avoid the closure of the initial fracture but cannot prevent the initial fracture from opening. During the simulation process, the initial fracture first propagates forward. Then the initial fracture is plugged, and the truss model is activated to prop the initial fracture. At last, the diversion fracture begins to propagate under the influence of the propped initial fracture.

2.3. The Plugging Effect of the Tight Plug

During TPDF, self-degradable diverters are injected to plug the initial fractures. A tight plug can be formed within the initial fractures. To simulate the plugging effect of the tight plug, this work assumes that when there is no tight plug, fluid flow accords with Reynold’s equation, and when there is a tight plug, fluid flow accords with Darcy’s equation. It defines the diffusive term from Darcy’s equation equals to the conductivity term in Reynold’s equation
w 3 12 μ f = k A μ filtrate
Where a is the tight plug area; μf is the hypothesized fluid viscosity within the initial fracture; μfiltrate is the fluid viscosity when flowing through the tight plug; k is the permeability of the tight plug. Eq. (15) can be deformed to
μ f = w 3 μ filtrate 12 k A
The plugging effect of the tight plug can be effectively considered by adjusting the hypothesized fluid viscosity of μf. As shown in Figure 2b, the initial fracture is plugged, and the fluid pressure cannot transfer to the fracture tip. Then it stops propagating, and the diversion fracture propagates forward.

2.4. Model Input Parameters

Table 1 gives the input parameters corresponding to the reservoir of Chenghai oilfield, east of China. The vertical depth is about 3700 m with a pore pressure of 37 MPa. The closure pressure is 55 Mpa and the reservoir temperature is 147 ℃. The reservoir has a porosity of 9.82% and a permeability of 9.83 mD. Hydraulic fracturing is necessary to develop the oil resources economically.

3. Simulation Results

Based on the established model in Figure 1, this work investigates the effects of various factors on the aperture of the initial and diversion fractures. The factors include the permeability of the tight plug, the length of the tight plug, rock Young’s modulus, rock tensile strength, in-situ stress contrast, the leak-off coefficient of the fracture surface, and the fluid injection rate.

3.1. The Permeability of the Tight Plug

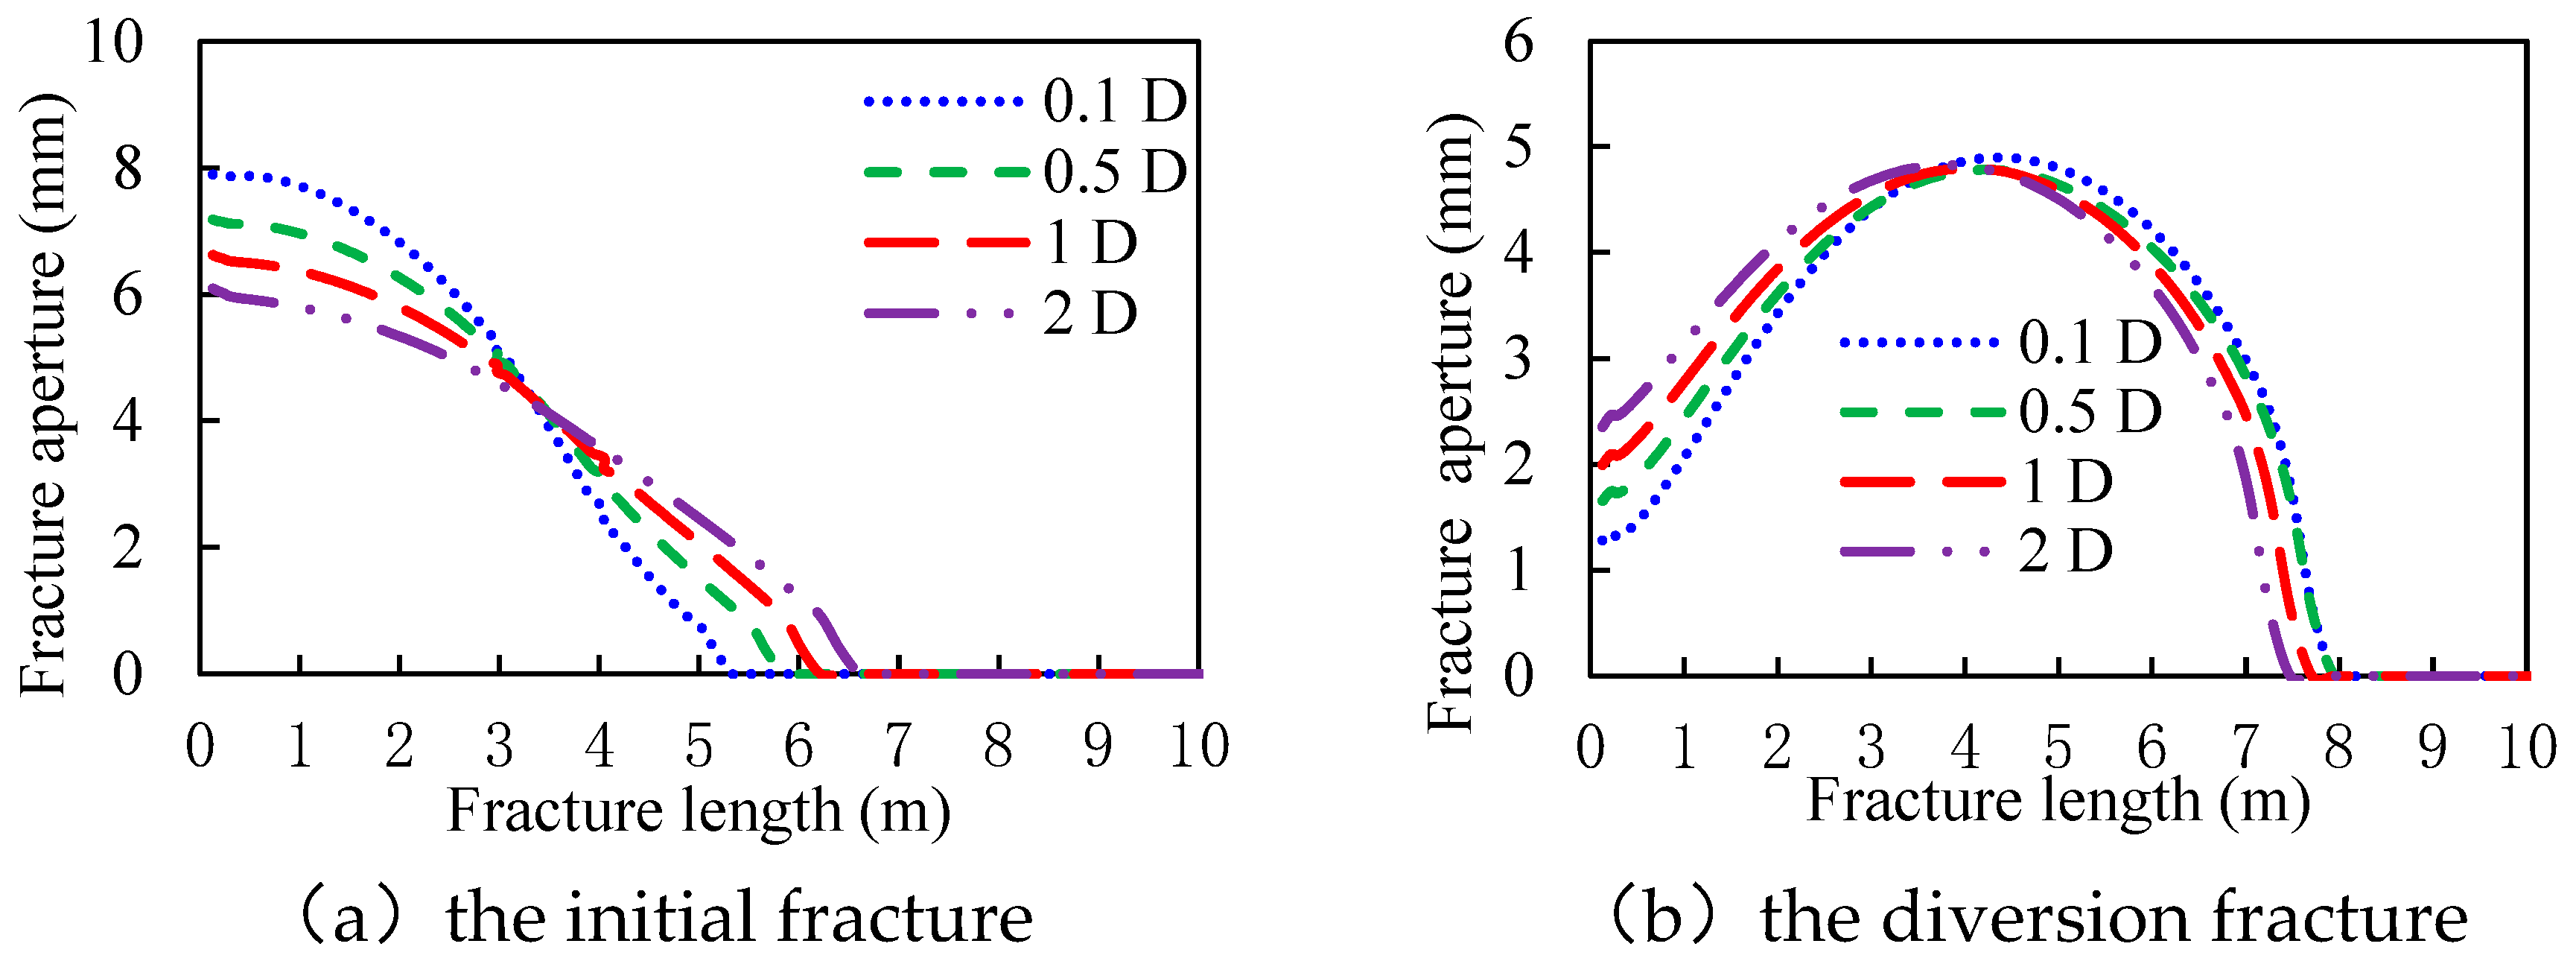
The permeability of the tight plug highly influences the transmission capability of the fluid pressure within the hydraulic fracture. In this part, the permeabilities of the tight plugs were set as 0.1 D, 0.5 D, 1 D, and 2 D, respectively. The other parameters are listed in Table 1. Figure 3 gives the aperture curves of the initial and the diversion fractures. It shows that the aperture at the initial fracture mouth increase with the permeability of the tight plug and the length decreases with the permeability of the tight plug. The apertures of the initial fractures are respectively 7.90 mm, 7.19 mm, 6.63 mm, and 6.10 mm, and the apertures of the diversion fractures are respectively 1.28 mm, 1.65 mm, 1.99 mm, and 2.35 mm. The reason is that the transmission efficiency of the fluid pressure increases with the permeability of the tight plug. Then the initial fracture can be effectively plugged with a low permeability of the tight plug. It will increase the fluid pressure, the aperture of the initial fracture, and the circular stresses around the wellbore. In this way, the diversion fracture will be compressed and the aperture of the diversion fracture will decrease.

3.2. The Length of the Tight Plug

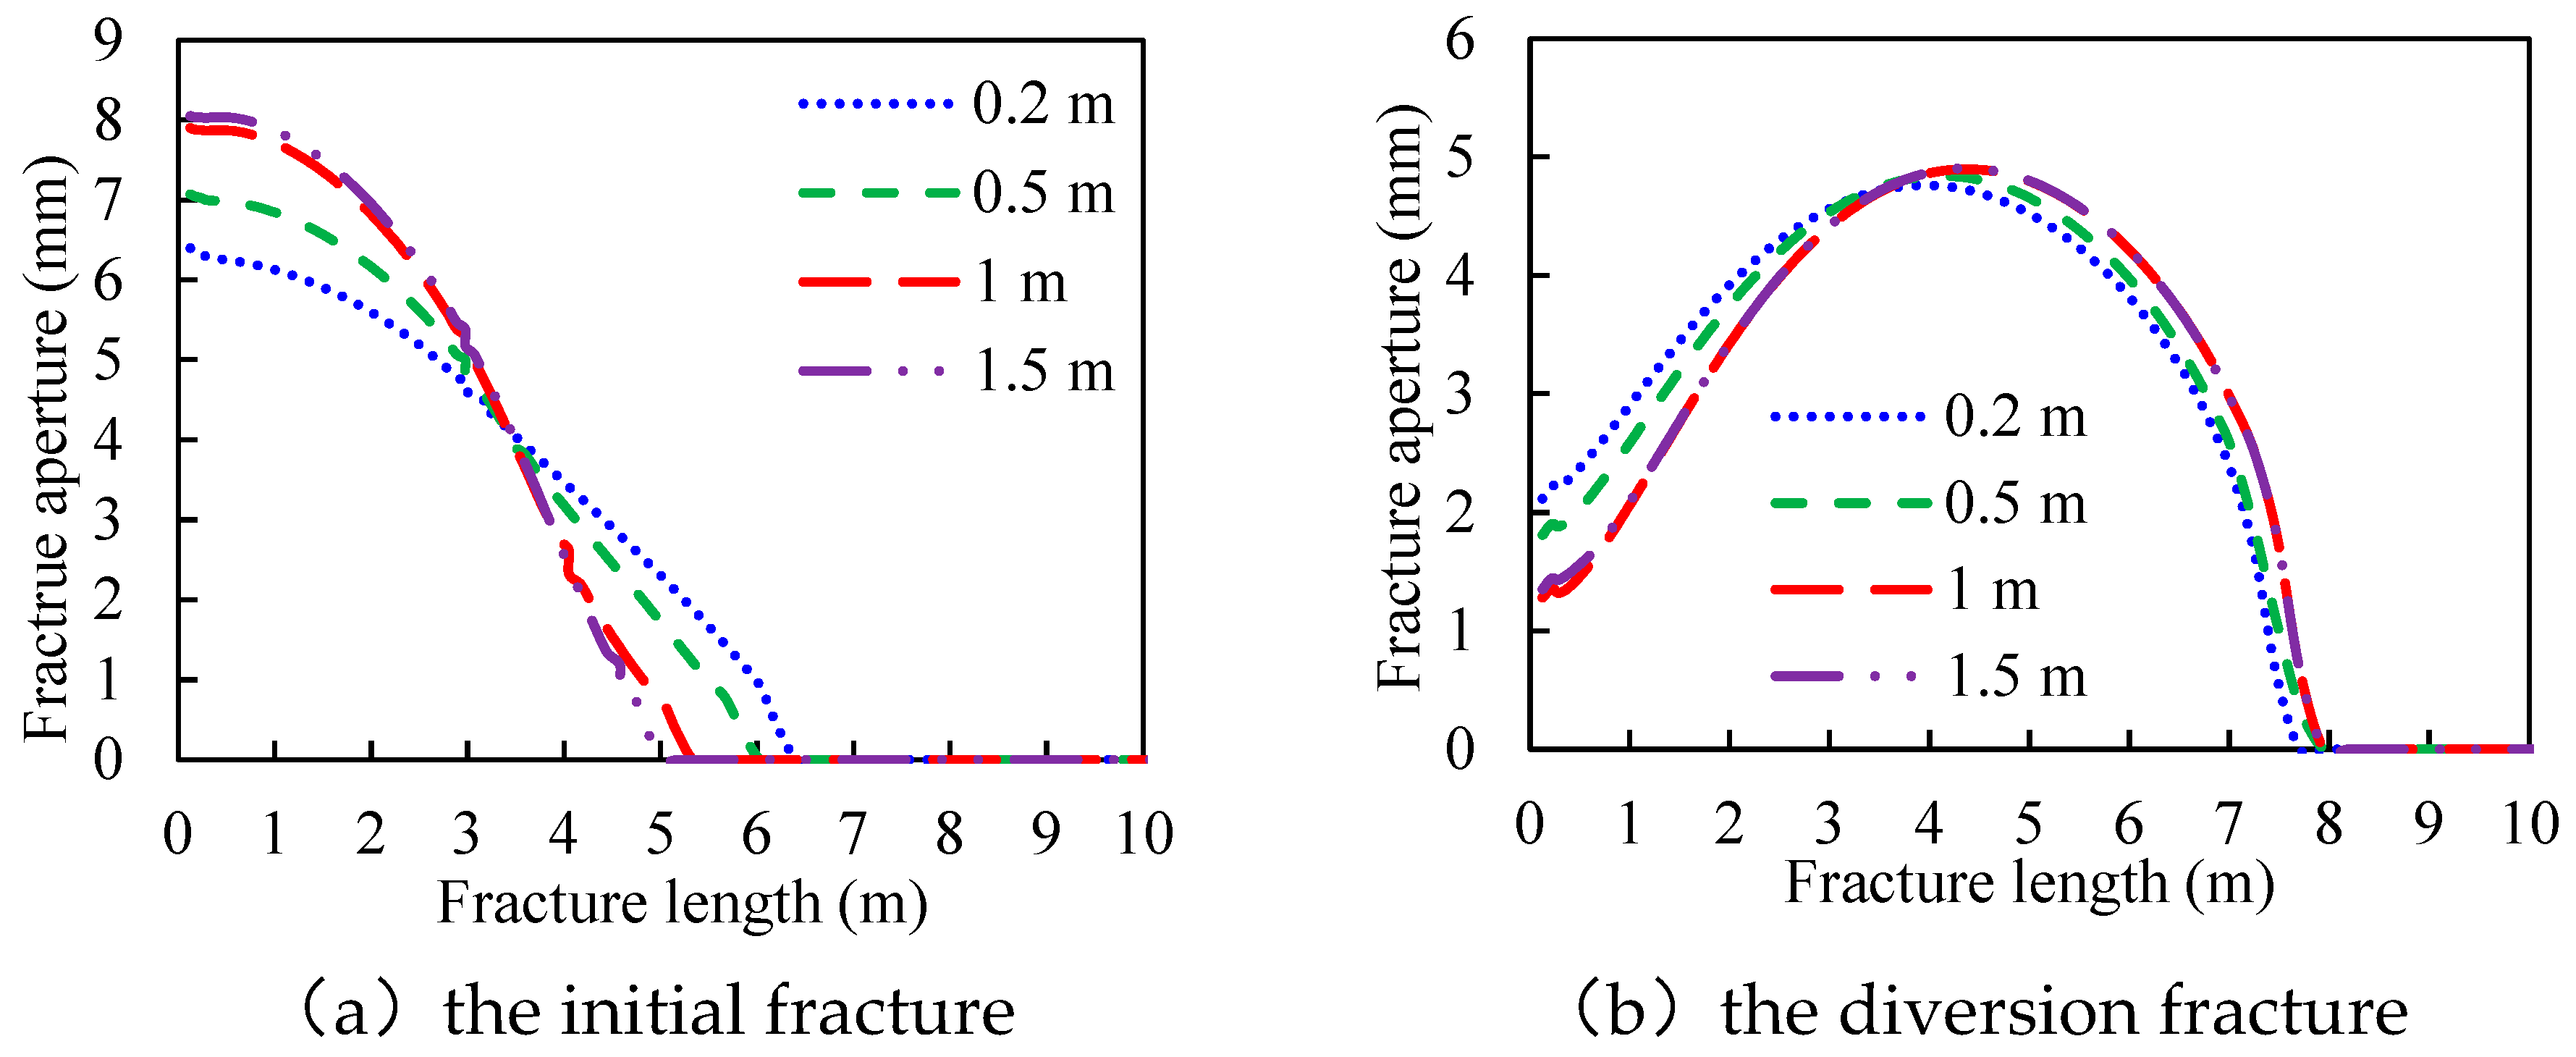
The dosage of the diverter determines the length of the tight plug. The plugging effect can be enhanced by increasing the length of the tight plug. In this part, the lengths of the tight plugs are set as 0.2 m, 0.5 m, 1 m, and 1.5 m, respectively. The other parameters are listed in Table 1. Figure 4 gives the aperture curves of the initial and the diversion fractures. It shows that the aperture at the initial fracture mouth increases with the length of the tight plug, and the fracture length decreases with the length of the tight plug. The apertures of the initial fractures are respectively 6.40 mm, 7.07 mm, 7.90 mm, and 8.05 mm, and the apertures of the diversion fractures are respectively 2.12 mm, 1.81 mm, 1.28 mm, and 1.35 mm. The reason is that the fluid pressure cannot pass through the tight plug of a large length. The fluid pressure within the fracture and the fracture mouth aperture will be enlarged, which will compress the diversion fracture.

3.3. Young’s Modulus

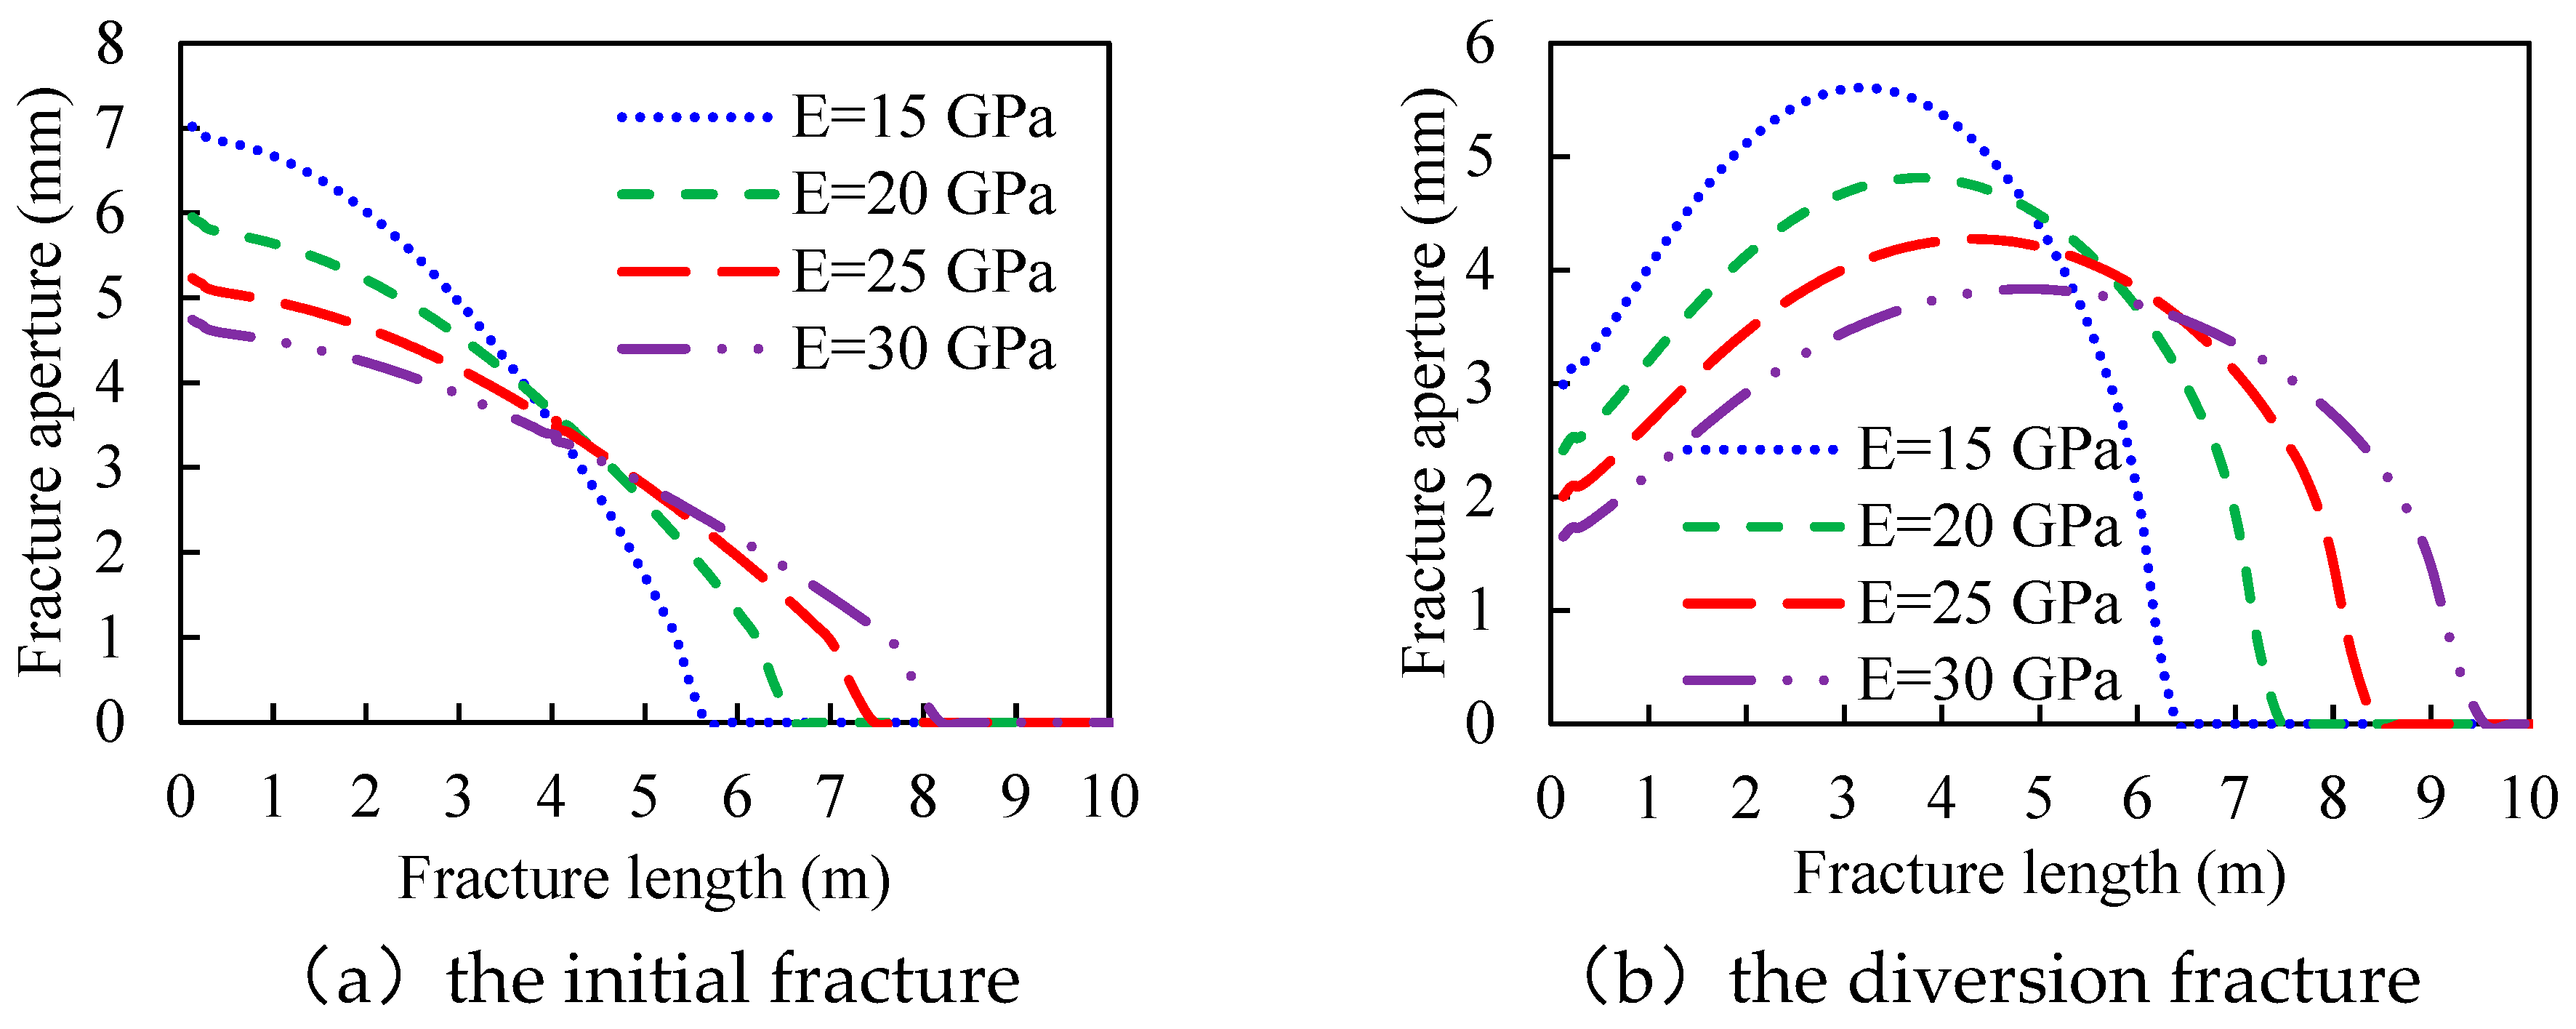
Young’s modulus determines the rock’s capability of resisting deformation. Reservoirs with high Young’s modulus will generate fractures with low aperture. In this part, the rock Young’s modulus is set as 15 GPa, 20 Gpa, 25 Gpa, and 30 Gpa, respectively. The other parameters are listed in Table 1. Figure 5 gives the aperture curves of the initial and the diversion fractures. It shows that the apertures at the initial and the diversion fracture mouth decrease with Young’s modulus, and the lengths of the initial and the diversion fractures increase based on the principle of fluid volume conservation. The apertures of the initial fractures are respectively 7.02 mm, 5.95 mm, 5.23 mm, and 4.74 mm, and the apertures of the diversion fractures are respectively 2.99 mm, 2.41 mm, 2.00 mm, and 1.65 mm. The reason is that Young’s modulus dominates the fracture aperture, and the plugging effect of the tight plug further increases the aperture of the initial fracture and decreases the aperture of the diversion fracture.

3.4. Rock Tensile Strength

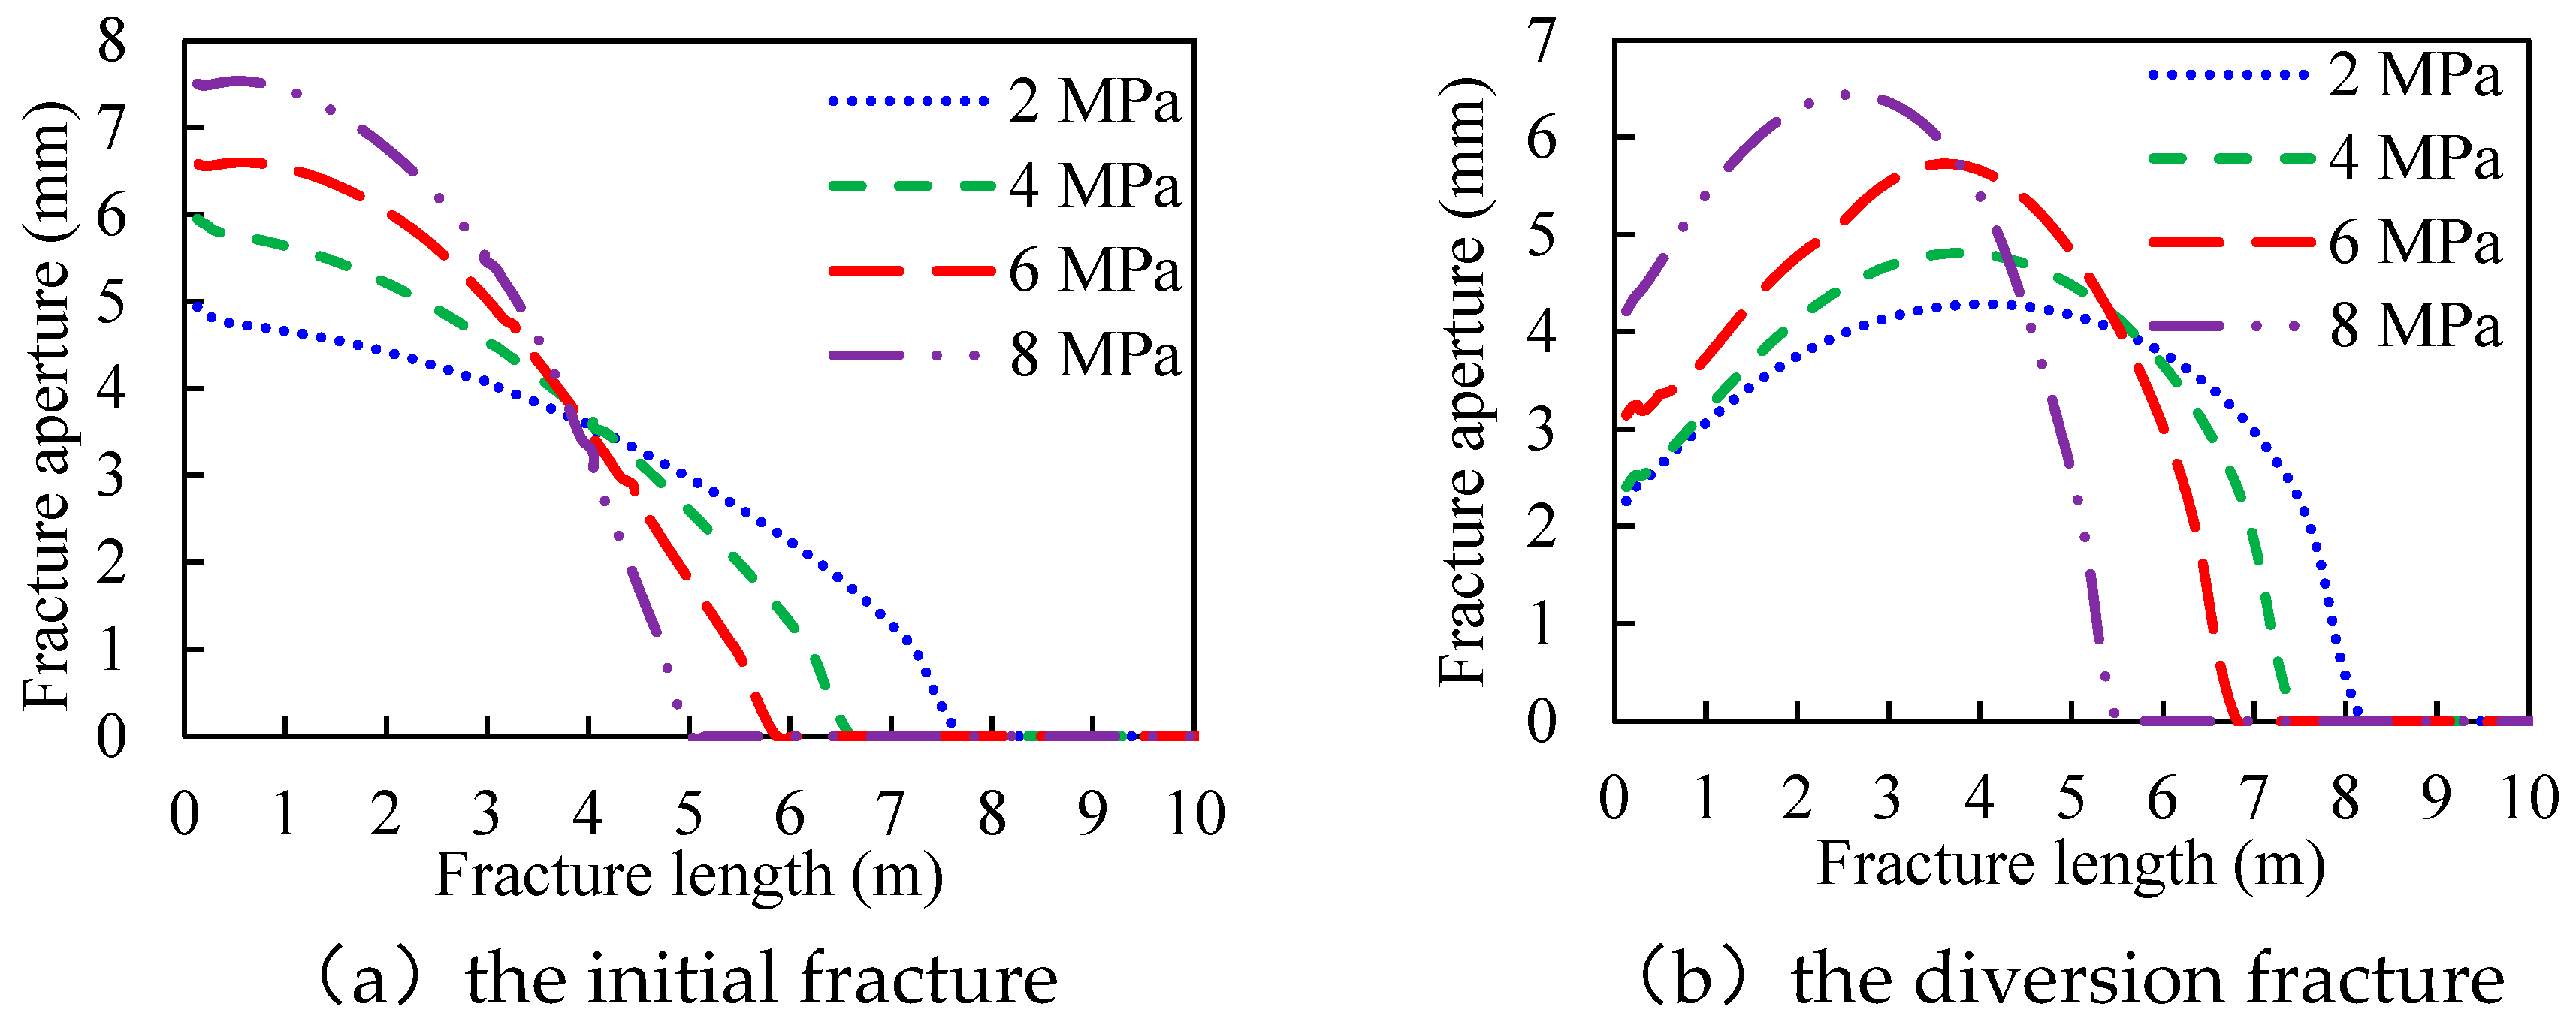
Rock tensile strength determines the difficulty in creating fractures and highly influences fluid pressure. In this part, the rock tensile strength is set as 2 MPa, 4 Mpa, 6 Mpa, and 8 Mpa. The other parameters are listed in Table 1. Figure 6 gives the aperture curves of the initial and the diversion fractures. It shows that the apertures both at the initial and the diversion fracture mouth increase with rock tensile strength, and fracture length decrease with rock tensile strength based on the principle of fluid volume conservation. The apertures of the initial fractures are respectively 4.95 mm, 5.94 mm, 6.57 mm, and 7.50 mm, and the apertures of the diversion fractures are respectively 2.25 mm, 2.40 mm, 3.15 mm, and 4.23 mm. The reason is that high fluid pressure is necessary to create a new fracture element and the fracture aperture will increase. The tight plug can enlarge the aperture of the initial fracture but decreases the aperture of the diversion fracture.

3.5. In-Situ Stress Contrast

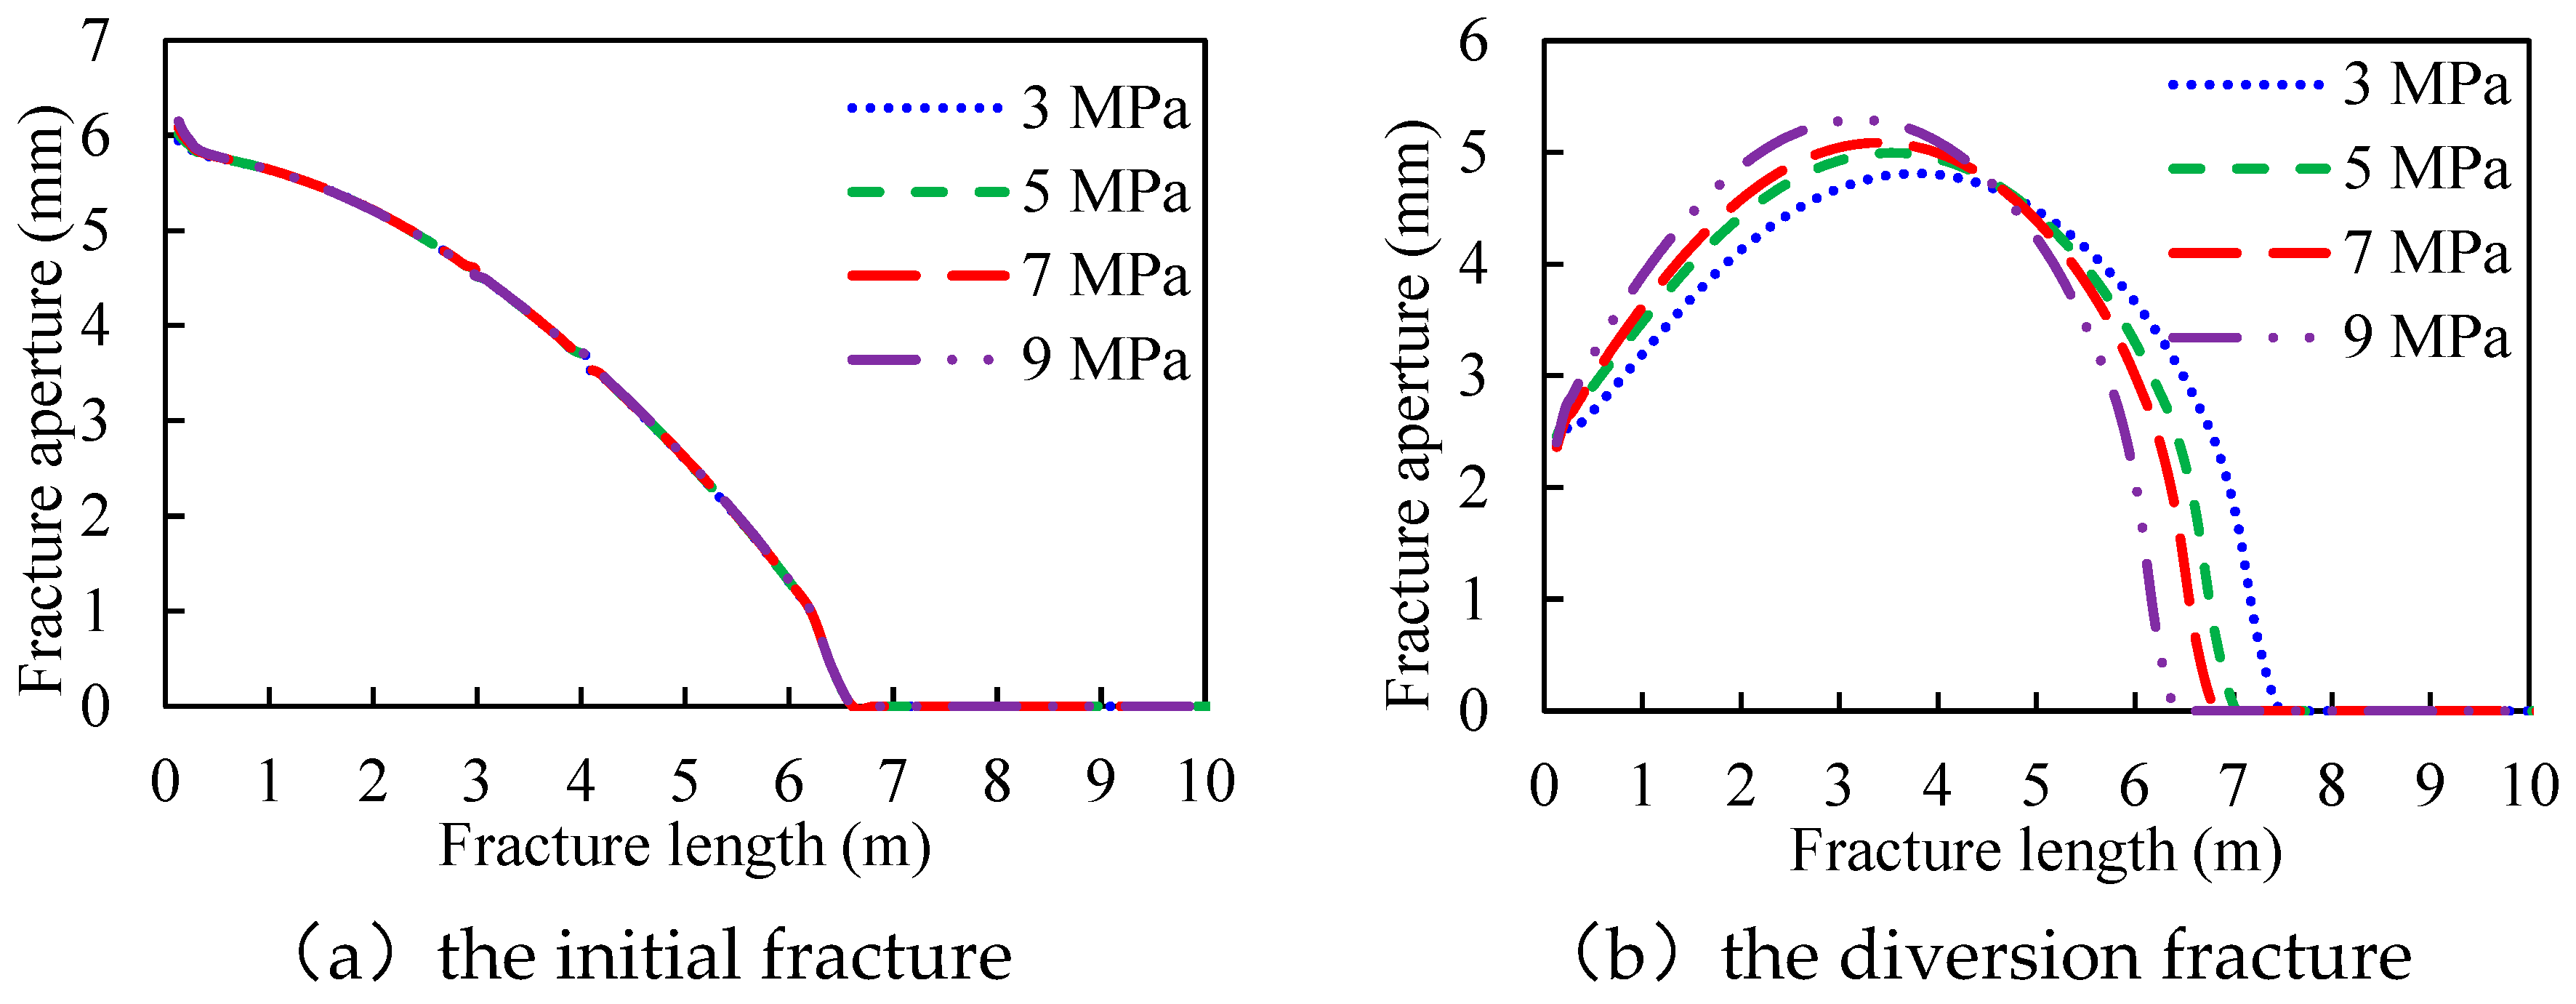
Hydraulic fracture tends to propagate along the direction of the minimum horizontal stress with high in-situ stress contrast. In this part, the in-situ stress contrasts are set as 3 MPa, 5 Mpa, 7 Mpa, and 9 Mpa, while the minimum horizontal stress remains constant. The other parameters are listed in Table 1. Figure 7 gives the aperture curves of the initial and the diversion fractures. It shows that in-situ stress contrast has a negligible effect on the apertures at the initial and the diversion fracture mouth. The apertures along the diversion fractures have an obvious gap under different stress contrasts. The reason is that the initial fractures propagate along the direction of the maximum horizontal stress, and the diversion fractures propagate along the direction of the minimum horizontal stress. The aperture of the initial fracture overcomes the minimum horizontal stress, and the aperture of the diversion fracture overcomes the maximum horizontal stress. The constant values of the minimum horizontal stress generate an equal value of the aperture along the initial fracture, and the different values generate the various apertures along the diversion fracture.

3.6. The Leak-Off Coefficient of the Fracture Surface

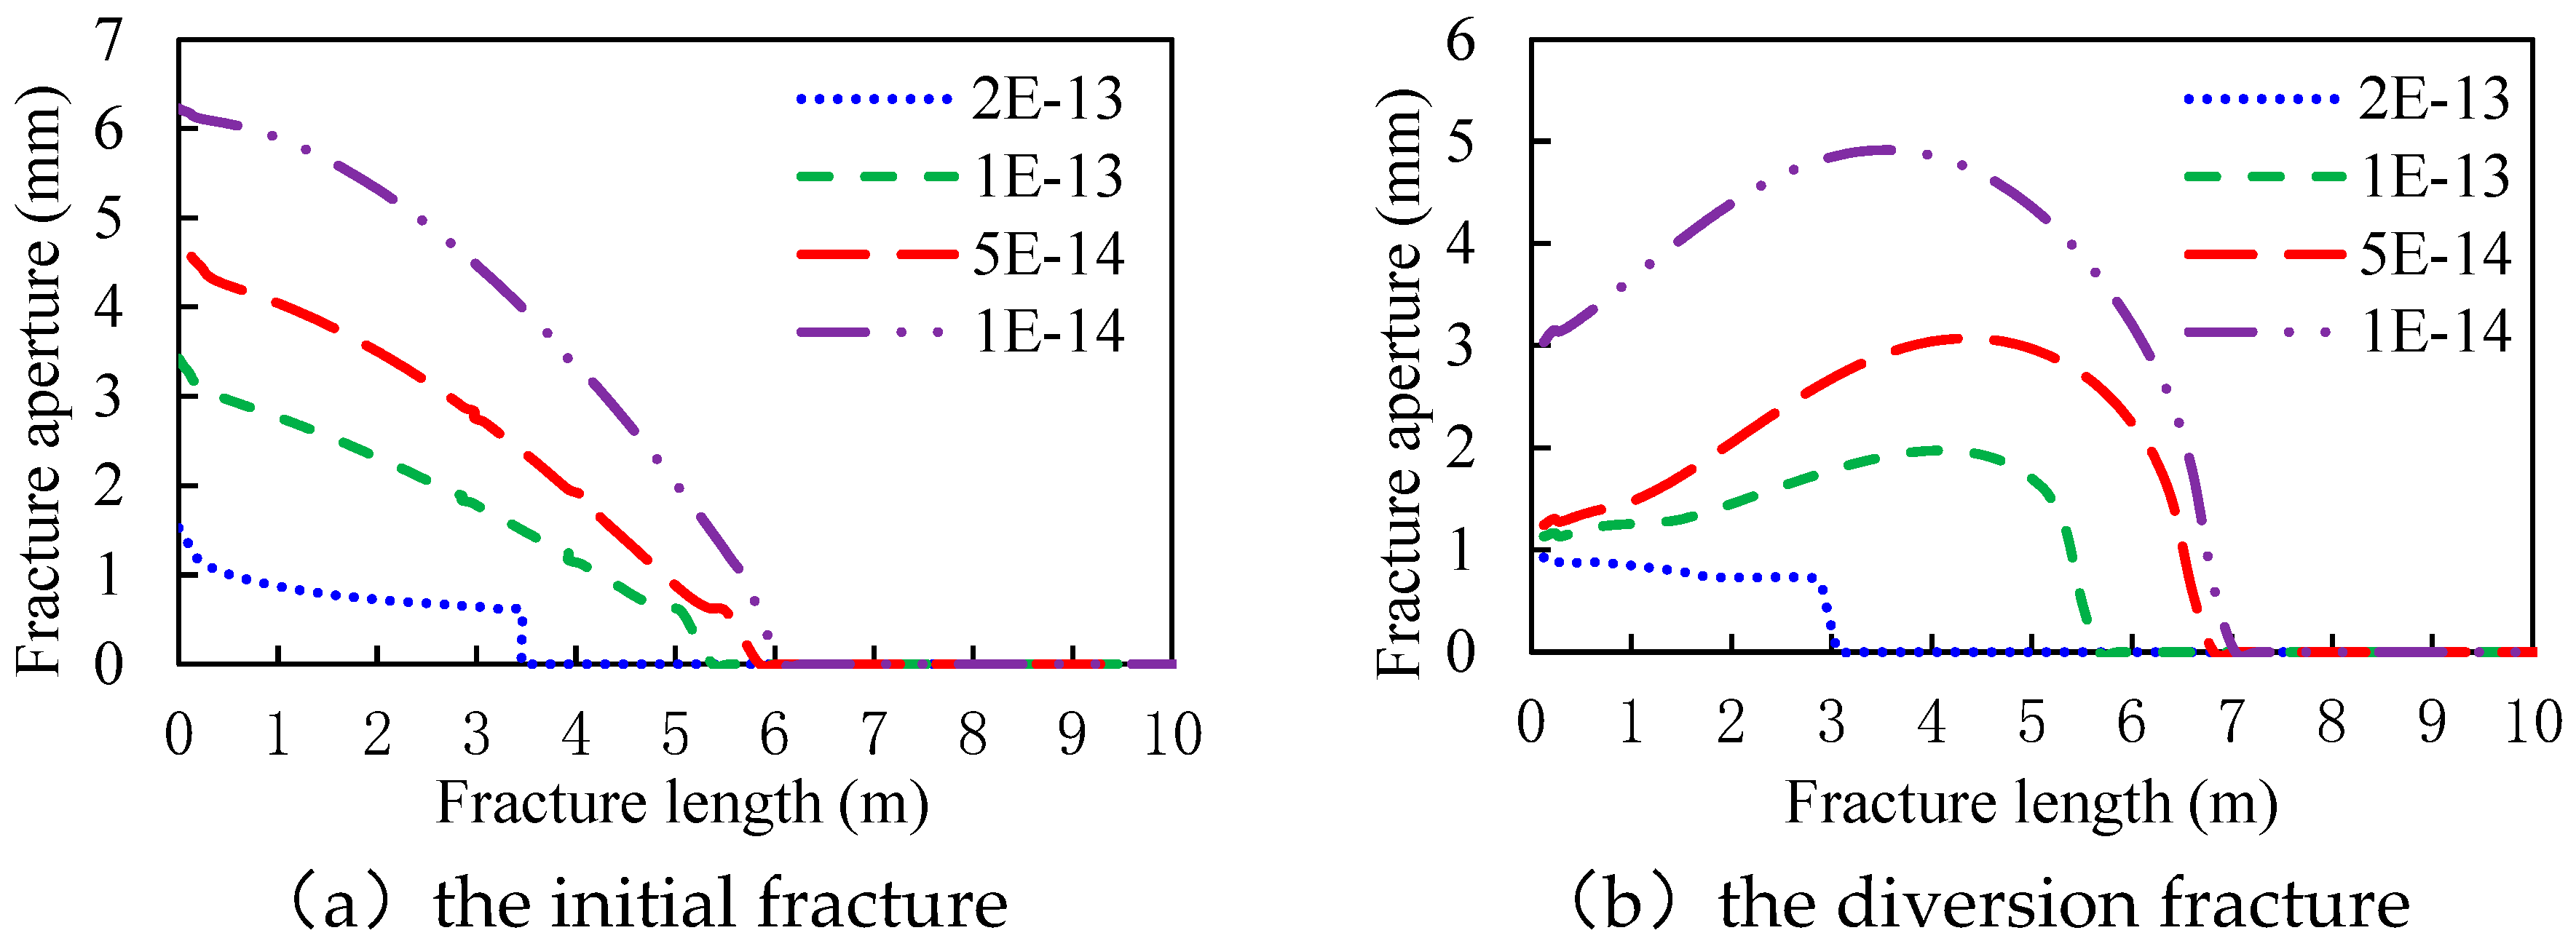
The leak-off coefficient of the fracture surface determines the fluid efficiency and the overall fracture volume. In this part, the fluid leak-off coefficients are set as 2×10-13 m/s, 1×10-13 m/s, 5×10-14 m/s, and 1×10-14 m/s, respectively. The other parameters are listed in Table 1. Figure 8 gives the aperture curves of the initial and the diversion fractures. It shows that the aperture and the length of the two kinds of fractures decrease with the leak-off coefficient of the fracture surface. The apertures of the initial fractures are respectively 1.53 mm, 3.42 mm, 4.57 mm, and 6.23 mm, and the apertures of the diversion fractures are respectively 0.93 mm, 1.13 mm, 1.25 mm, and 3.03 mm. The reason is that more fluid will filter into the reservoir, and less fluid will be retained within hydraulic fractures with a high leak-off coefficient. The fluid pressure is low, the narrow fractures will be generated.

3.7. Fluid Injection Rate

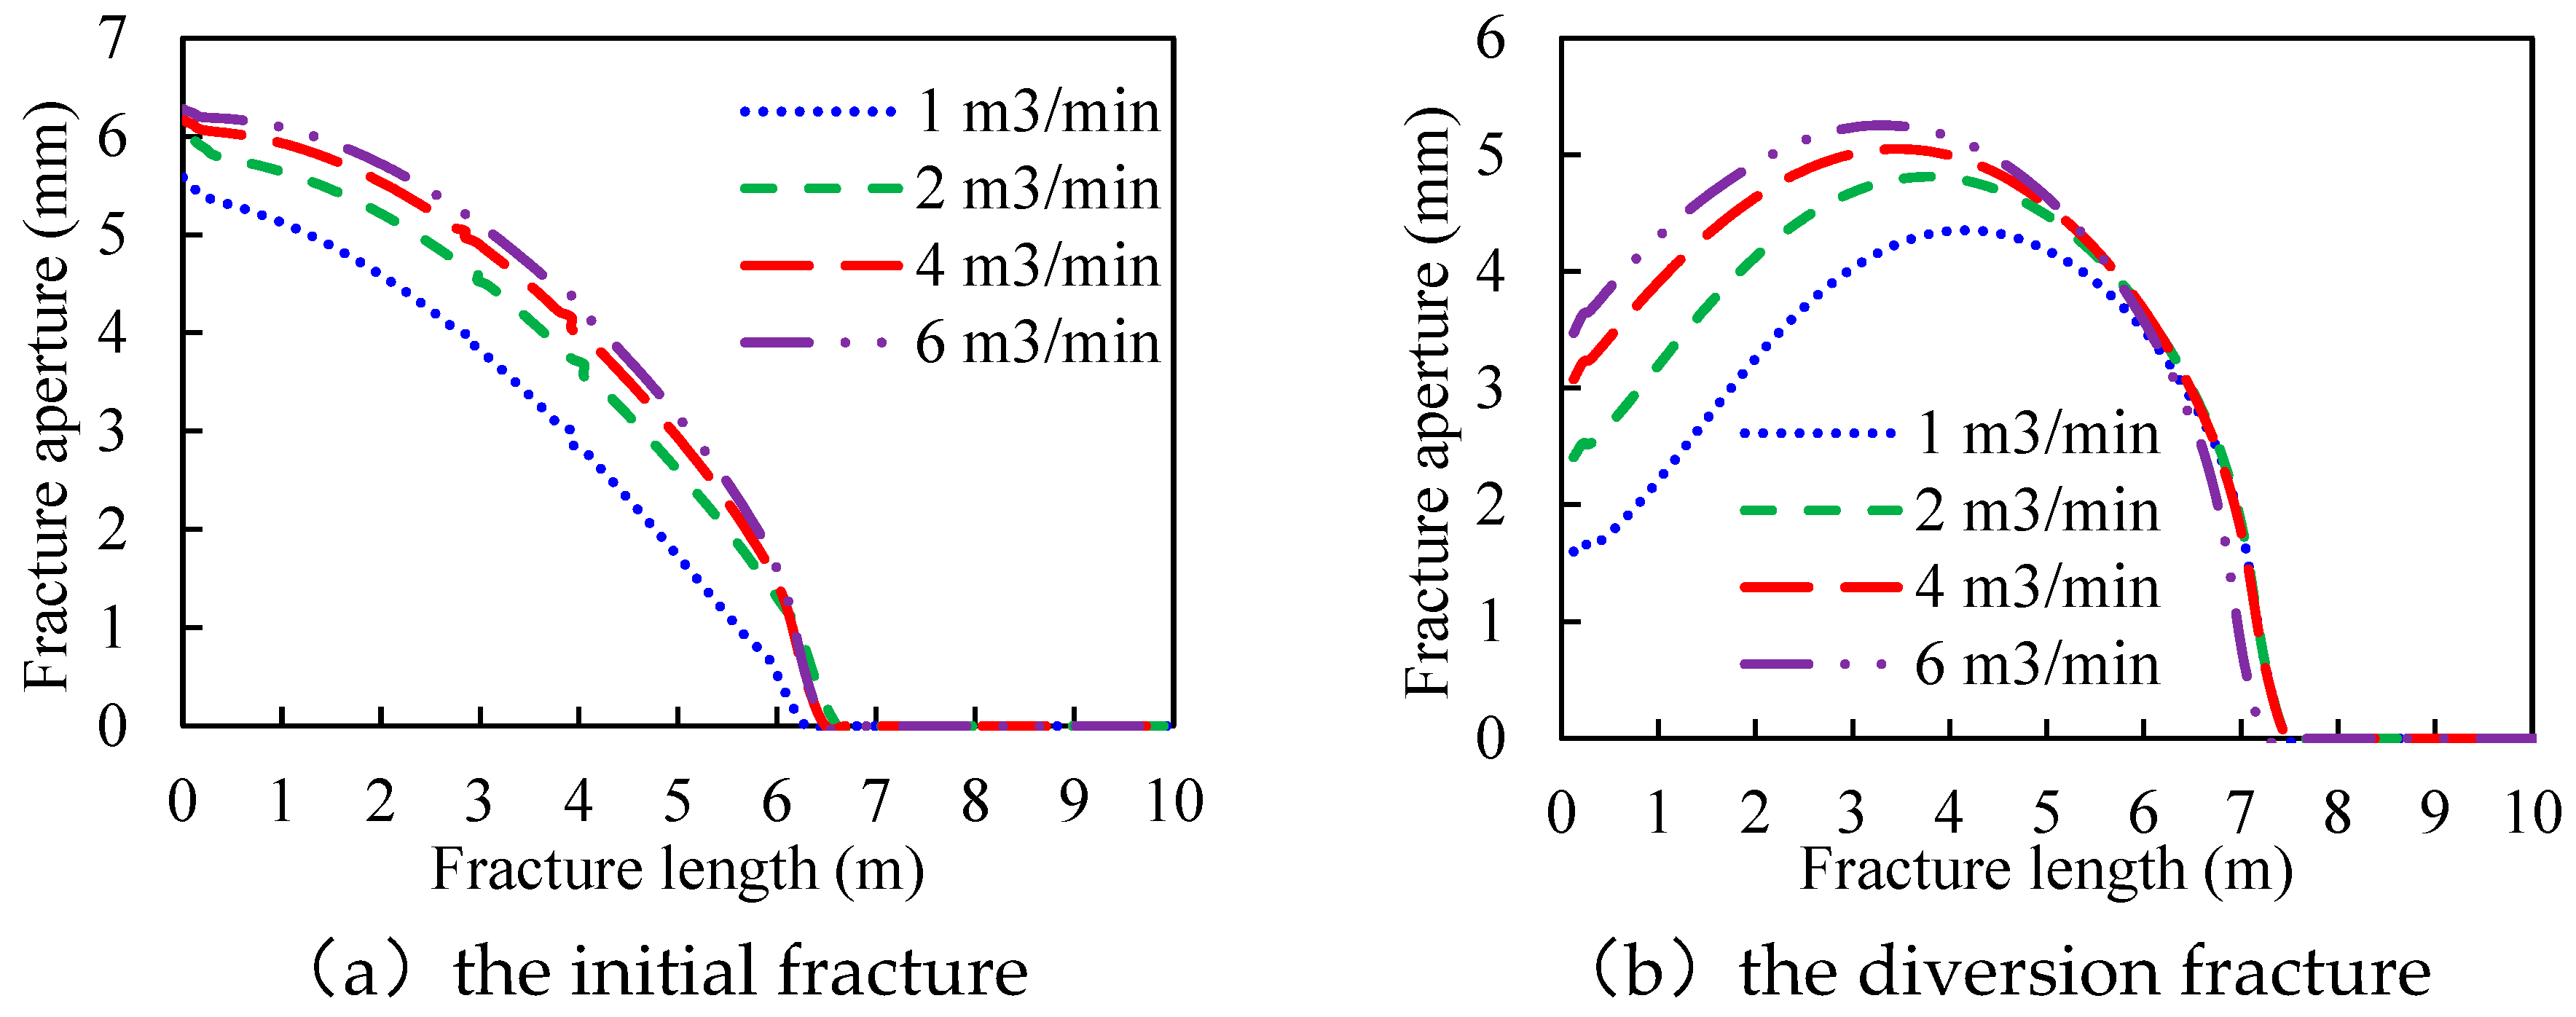
The fluid injection rate is a key controllable parameter that determines the fracture propagation rate and geometry. In this part, the fluid injection rates are set as 1 m3/min, 2 m3/min, 4 m3/min, and 6 m3/min, respectively. The other parameters are listed in Table 1. Figure 9 gives the aperture curves of the initial and the diversion fractures. It shows that the apertures of both the initial and the diversion fractures increase with the fluid injection rate. The apertures of the initial fractures are respectively 5.58 mm, 5.95 mm, 6.17 mm, and 6.28 mm, and the apertures of the diversion fractures are respectively 1.60 mm, 2.41 mm, 3.08 mm, and 3.47 mm. The reason is that fluid pressure can be enhanced by increasing the fluid injection rate, and a high fracture aperture can be obtained. The fracture length remains nearly constant due to the plugging effect of the tight plug.

4. Discussion

4.1. Multi-Parameter Comparative Analysis

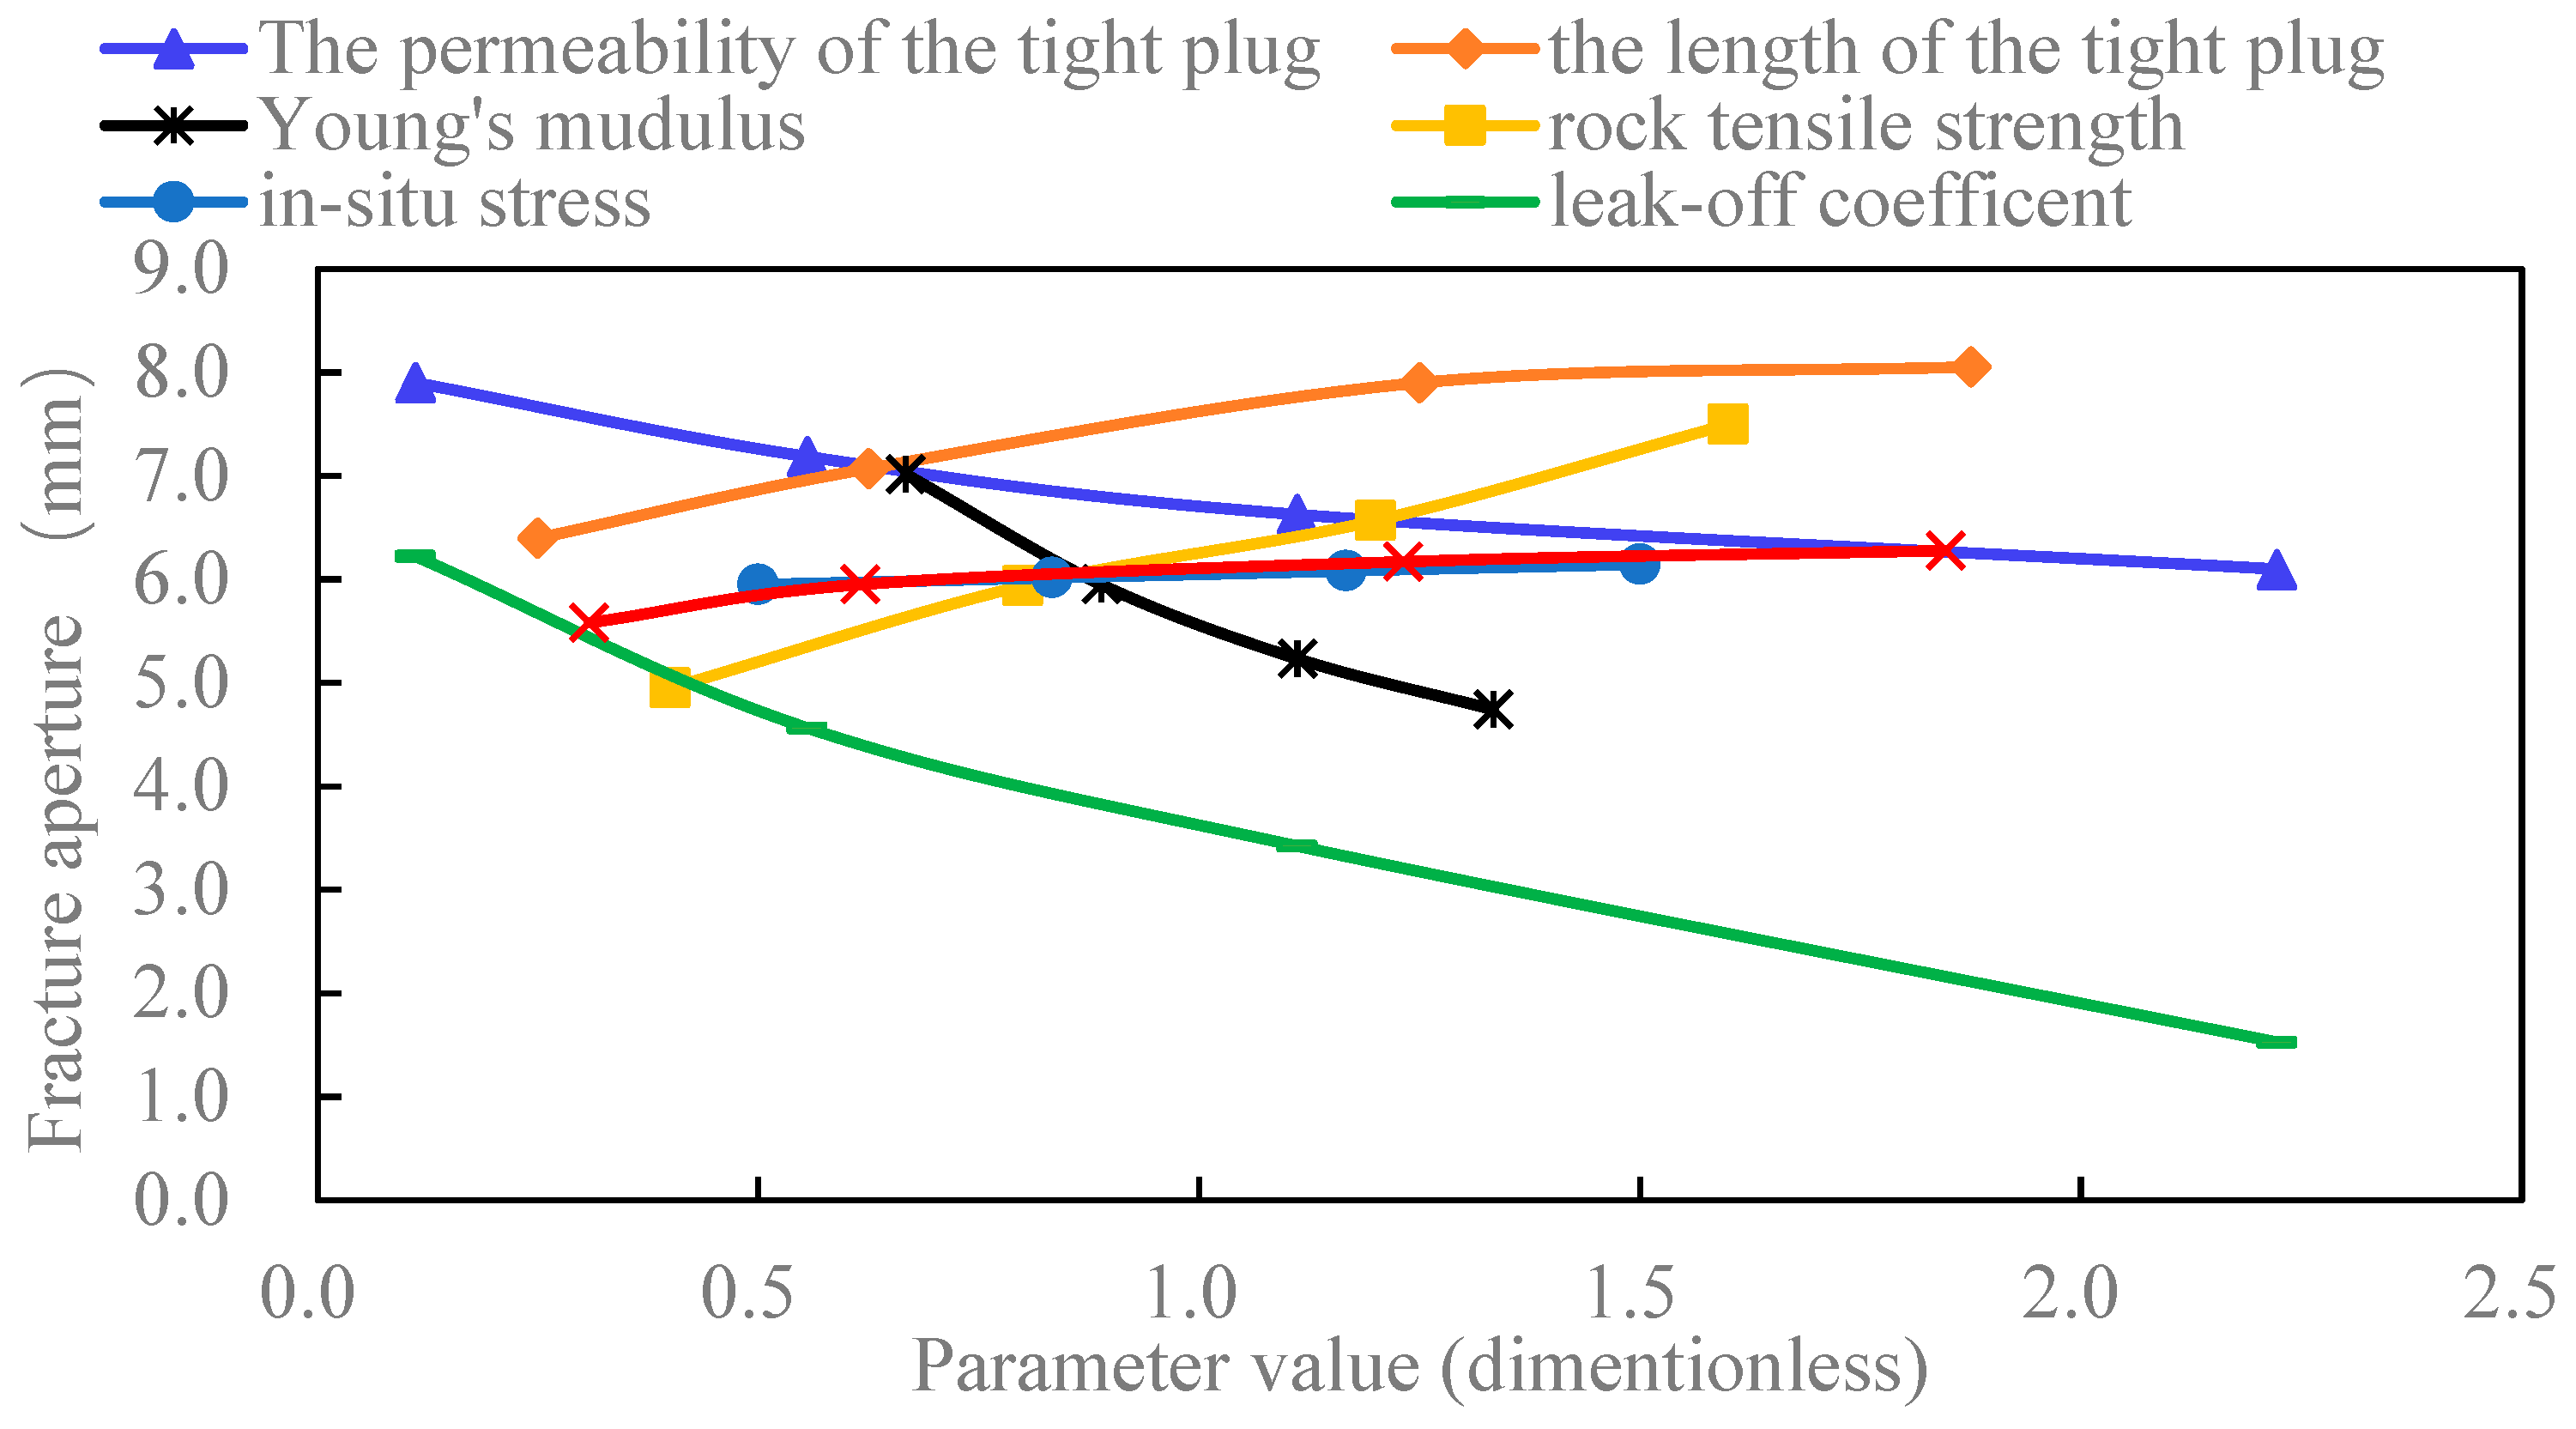
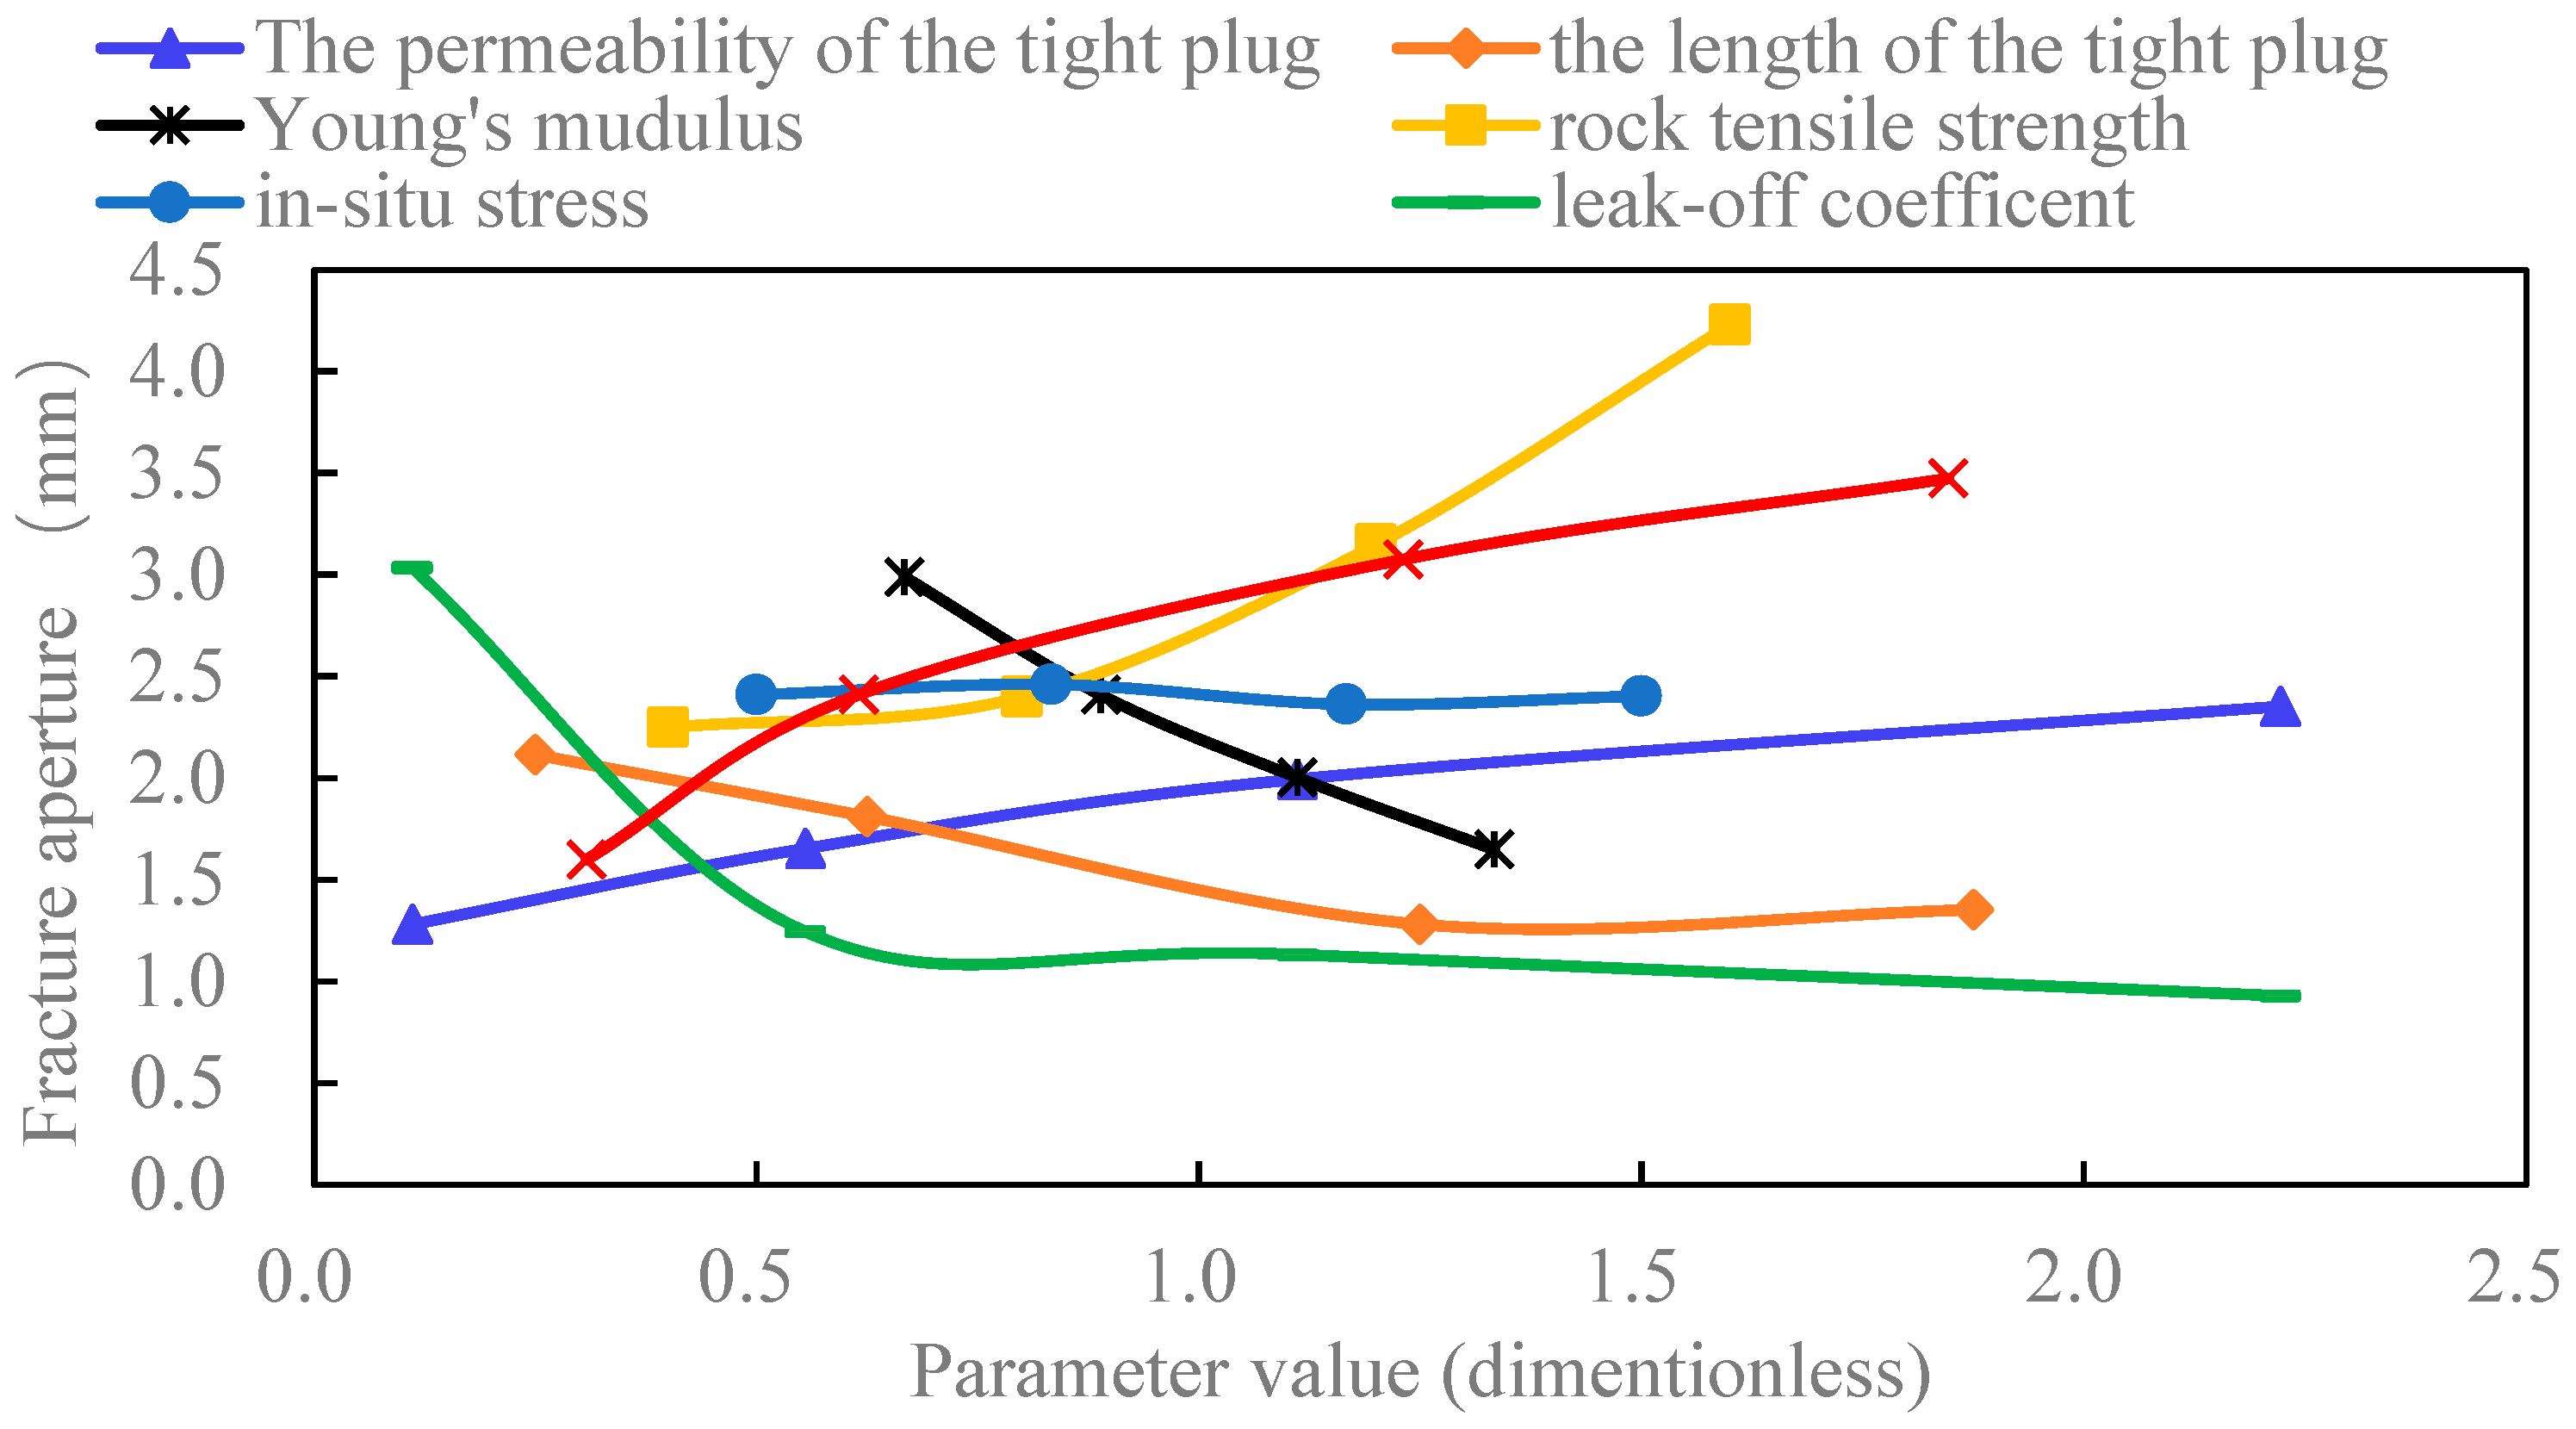
The above seven parameters are normalized to realize the comparative analysis. The four values of each parameter divide the average value as follows:
x * = x / x ¯
Where x * denotes the normalized value, x denotes the parameter value, x ¯ denotes the average parameter value.
As shown in Figure 10, the aperture at the initial fracture mouth has a positive correlation with the length of the tight plug, the rock tensile strength, and the fluid injection rate and has a negative correlation with the permeability of the tight plug, Young’s modulus, and the leak-off coefficient. By comparing the absolute value of the curve derivative, factors influencing the aperture at the initial fracture mouth can be sorted by sensitivity (strong to weak): Young’s modulus, the leak-off coefficient of the fracture surface, rock tensile strength, the length of the tight plug, the permeability of the tight plug, fluid injection rate, and in-situ stress contrast.
As shown in Figure 11, the aperture at the diversion fracture mouth has a positive correlation with the permeability of the tight plug, rock tensile strength, and the fluid injection rate and has a negative correlation with Young’s modulus, the length of the tight plug, and the leak-off coefficient. By comparing the absolute value of the curve derivative, factors influencing the aperture at the diversion fracture mouth can be sorted by sensitivity (strong to weak) Young’s modulus, rock tensile strength, fluid injection rate, the length of the tight plug, the permeability of the tight plug, the leak-off coefficient, and in-situ stress contrast.

4.2. The Risk of Screenout

During hydraulic fracturing, a large amount of proppant will be injected to prop the hydraulic fractures. Proppant size determines the propped fracture aperture and the fluid flow rate within the fracture. In the target formation, 40/70 mesh (0.212-0.425 mm) and 30/50 mesh (0.3-0.6 mm) ceramic proppant are selected to overcome the high closure pressure of 55 MPa. The throttling effect occurs when the proppant enters the fracture mouth. The proppants tend to accumulate and plug the fracture mouth. This phenomonen is called screenout. It can be effectively alleviated when the fracture mouth aperture is 5 times the proppant size. In this work, the safe value of the fracture mouth aperture is 3 mm for the maximum proppant size is 0.6 mm. Based on the simulation results, the aperture at the initial fracture mouth is beyond 3 mm, and the aperture along the initial fracture is larger than the aperture at the mouth. It brings a low risk of screenout. The aperture at the diversion fracture mouth is between 0.9 mm and 4.2 mm, much smaller than that along the diversion fracture. Screenout is more likely to occur at the mouth of the diversion fracture. The risk can be lowered when selecting reservoirs with low Young’s modulus and high rock tensile strength. Moreover, the aperture at the diversion fracture mouth can be enlarged by increasing the fluid injection rate.

5. Conclusions

(1)
The aperture at the initial or the diversion fracture mouth has a positive correlation with the rock tensile strength and the fluid injection rate. It has a negative correlation with Young’s modulus and the leak-off coefficient.
(2)
The aperture at the initial fracture mouth increases with the length of the tight plug and decreases with the permeability of the tight plug. The aperture at the diversion fracture mouth decreases with the length of the tight plug and increases with the permeability of the tight plug.
(3)
Screenout tends to occur at the mouth of the diversion fracture. And factors influencing the aperture at the diversion fracture mouth can be sorted by sensitivity (strong to weak): Young’s modulus, rock tensile strength, fluid injection rate, the length of the tight plug, the permeability of the tight plug, the leak-off coefficient, and in-situ stress contrast.
(4)
Reservoirs with low Young’s modulus and high rock tensile strength will generate wide initial and diversion fracture, which ensures the safe transportation of proppant at the fracture mouth. Moreover, increasing the fluid injection rate can effectively enlarge the fracture aperture and ensure safe construction.

Acknowledgment

This work was funded by the National Natural Science Foundation of China (No. 52104011), the Natural Science Foundation of Xinjiang Uygur Autonomous Region (2022D01B77), and the Karamay Innovative Environment Construction Plan (Innovative talents) project (NO. 20232023hjcxrc0037).

References

  1. Tong, X.; Zhang, G.; Wang, Z.; et al. Distribution and potential of global oil and gas resources. Petroleum Exploration and Development 2018, 45, 779–789. [Google Scholar] [CrossRef]
  2. Isaac, O.; Hui, P.; Oni, B.; et al. Surfactants employed in conventional and unconventional reservoirs for enhanced oil recovery—A review. Energy Reports 2022, 8, 2806–2830. [Google Scholar] [CrossRef]
  3. Chen, B.; Barboza, B.; Sun, Y.; et al. A review of hydraulic fracturing simulation. Archives of Computational Methods in Engineering 2021, 1–58. [Google Scholar] [CrossRef]
  4. Zhou, H.; Wu, X.; Song, Z.; et al. A review on mechanism and adaptive materials of temporary plugging agent for chemical diverting fracturing. Journal of Petroleum Science and Engineering 2022, 212, 110256. [Google Scholar] [CrossRef]
  5. Wang, B.; Zhou, F.; Wang, D.; et al. Numerical simulation on near-wellbore temporary plugging and diverting during refracturing using XFEM-Based CZM. Journal of Natural Gas Science and Engineering 2018, 55, 368–381. [Google Scholar] [CrossRef]
  6. Sneddon, I. N.; Elliot, H. A.; Elliot, H.A. The opening of a Griffith crack under internal pressure. Quarterly of Applied Mathematics 1946, 4, 262–267. [Google Scholar] [CrossRef]
  7. Perkins, T.; Kern, L. R. Widths of hydraulic fractures. Journal of petroleum technology 1961, 13, 937–949. [Google Scholar] [CrossRef]
  8. Palmer, I.; Carroll, H. B. Three-dimensional hydraulic fracture propagation in the presence of stress variations. Society of Petroleum Engineers Journal 1983, 23, 870–878. [Google Scholar] [CrossRef]
  9. Morales, R. ; Microcomputer analysis of hydraulic fracture behavior with a pseudo-three-dimensional simulator. SPE production engineering 1989, 4, 69–74. [Google Scholar] [CrossRef]
  10. Todd, B.; Choudhary, Y.; Bhamidipati, S. Fracture-width estimation for an arbitrary pressure distribution in porous media. In Brasil Offshore. OnePetro 2011.
  11. Guo, Q.; Feng, Y. Z.; Jin, Z. Fracture aperture for wellbore strengthening applications. In ARMA US Rock Mechanics/Geomechanics Symposium (pp. ARMA-11). ARMA 2011.
  12. Shahri, M.; Oar, T.; Safari, R.; et al. Advanced geomechanical analysis of wellbore strengthening for depleted reservoir drilling applications. In SPE/IADC Drilling Conference and Exhibition (pp. SPE-167976). SPE 2014.
  13. Zhang, J.; Alberty, M.; Blangy, J. A semi-analytical solution for estimating the fracture width in wellbore strengthening applications. In SPE deepwater drilling and completions conference. OnePetro 2016.
  14. Liu, Y.; Jin, G.; Wu, K.; et al. Hydraulic-fracture-width inversion using low-frequency distributed-acoustic-sensing strain data—Part I: Algorithm and sensitivity analysis. SPE Journal 2021, 26, 359–371. [Google Scholar] [CrossRef]
  15. Xu, C.; Yang, X.; Liu, C.; et al. Dynamic fracture width prediction for lost circulation control and formation damage prevention in ultra-deep fractured tight reservoir. Fuel 2022, 307, 121770. [Google Scholar] [CrossRef]
  16. Zheng, H.; Pu, C.; Wang, Y.; et al. Experimental and numerical investigation on influence of pore-pressure distribution on multi-fractures propagation in tight sandstone. Engineering Fracture Mechanics 2020, 230, 106993. [Google Scholar] [CrossRef]
  17. Zhang, Z.; Zhang, S.; Zou, Y.; et al. Experimental investigation into simultaneous and sequential propagation of multiple closely spaced fractures in a horizontal well. Journal of Petroleum Science and Engineering 2021, 202, 108531. [Google Scholar] [CrossRef]
  18. Xu, W.; Zhao, Y.; Wang, L.; et al. Experimental investigation of hydraulic fracture propagation behavior in layered continental shale. Energy Reports 2022, 8, 14362–14373. [Google Scholar] [CrossRef]
  19. Shi, H.; Zhao, H.; Zhou, J.; et al. Experimental investigation on the propagation of hydraulic fractures in massive hydrate-bearing sediments. Engineering Fracture Mechanics 2023, 289, 109425. [Google Scholar] [CrossRef]
  20. Chang, X.; Xu, E.; Guo, Y.; et al. Experimental study of hydraulic fracture initiation and propagation in deep shale with different injection methods. Journal of Petroleum Science and Engineering 2022, 216, 110834. [Google Scholar] [CrossRef]
  21. Shi, X.; Qin, Y.; Gao, Q.; et al. Experimental study on hydraulic fracture propagation in heterogeneous glutenite rock. Geoenergy Science and Engineering 2023, 225, 211673. [Google Scholar] [CrossRef]
  22. Wang, B.; Zhou, F.; Liang, T.; et al. Evaluations of fracture injection pressure and fracture mouth width during separate-layer fracturing with temporary plugging. Mathematical Problems in Engineering 2018, 2018. [Google Scholar] [CrossRef]
  23. Wang, B.; Zhou, F.; Yang, C.; et al. Experimental study on injection pressure response and fracture geometry during temporary plugging and diverting fracturing. SPE Journal 2020, 25, 573–586. [Google Scholar] [CrossRef]
  24. Wu, K.; Olson, J.; Balhoff; et al. Numerical analysis for promoting uniform development of simultaneous multiple-fracture propagation in horizontal wells. SPE production & operations 2017, 32, 41–50.
  25. Wang, B.; Zhang, G.; Zhou, F. Insights into the activation characteristics of natural fracture during in-fracture temporary plugging and diverting fracturing. Computers and Geotechnics 2023, 162, 105655. [Google Scholar] [CrossRef]
  26. Guo, J.; Zhao, X.; Zhu, H.; et al. Numerical simulation of interaction of hydraulic fracture and natural fracture based on the cohesive zone finite element method. Journal of Natural Gas Science and Engineering 2015, 25, 180–188. [Google Scholar] [CrossRef]
  27. Zhang, G. M.; Liu, H.; Zhang, J.; et al. Three-dimensional finite element simulation and parametric study for horizontal well hydraulic fracture. Journal of Petroleum Science and Engineering 2010, 72, 310–317. [Google Scholar] [CrossRef]
  28. Feng, Y.; &amp, *!!! REPLACE !!!*; Gray, K. E.; Gray, K.E. A fracture-mechanics-based model for wellbore strengthening applications. Journal of Natural Gas Science and Engineering 2016, 29, 392–400. [Google Scholar] [CrossRef]
  29. Chen, M.; Zhang, S.; Li, S.; et al. An explicit algorithm for modeling planar 3D hydraulic fracture growth based on a super-time-stepping method. International Journal of Solids and Structures 2020, 191, 370–389. [Google Scholar] [CrossRef]
  30. Chen, M.; Zhang, S.; Zhou, T.; et al. Optimization of in-stage diversion to promote uniform planar multifracture propagation: A numerical Study. SPE Journal 2020, 25, 3091–3110. [Google Scholar] [CrossRef]
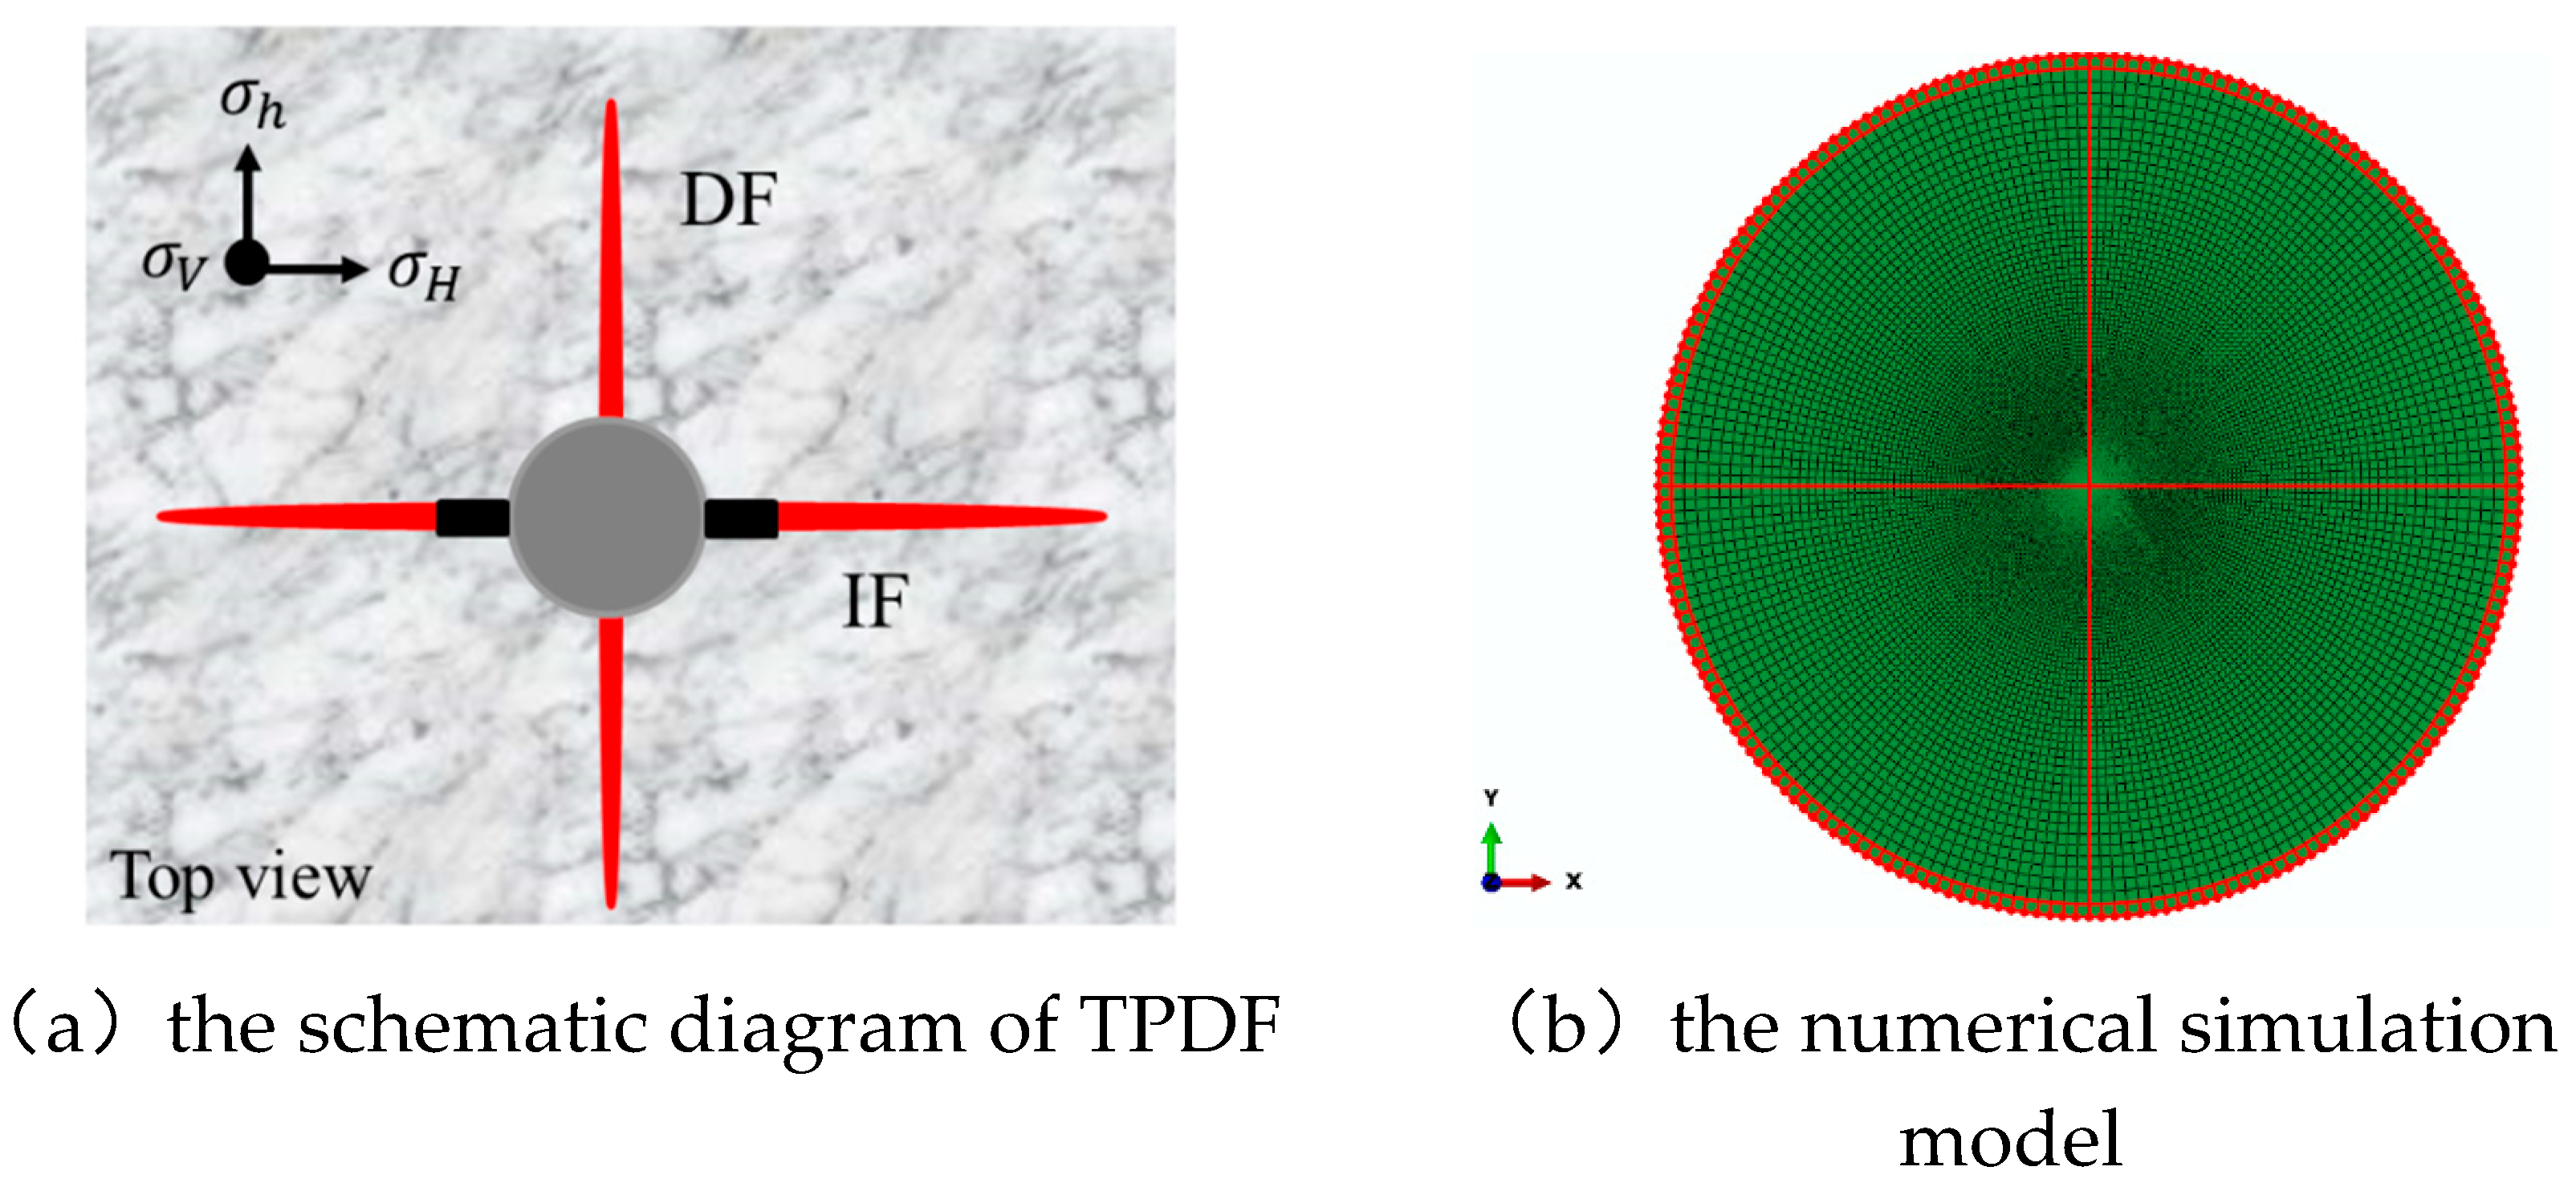
Figure 1. Illustration of the simulation models.
Preprints 84183 g001
Figure 2. Illustration of the simulation methods.
Preprints 84183 g002
Figure 3. The curves of the fracture aperture vs. length with different permeabilities of the tight plug.
Preprints 84183 g003
Figure 4. The curves of the fracture aperture vs. length with different lengths of the tight plug.
Preprints 84183 g004
Figure 5. The curves of the fracture aperture vs. length with different rock Young’s modulus.
Preprints 84183 g005
Figure 6. The curves of the fracture aperture vs. length with different rock tensile strengths.
Preprints 84183 g006
Figure 7. The curves of the fracture aperture vs. length with different in-situ stress contrasts.
Preprints 84183 g007
Figure 8. The curves of the fracture aperture vs. length with different leak-off coefficients of the fracture surface.
Preprints 84183 g008
Figure 9. The curves of the fracture aperture vs. length with different fluid injection rates.
Preprints 84183 g009
Figure 10. The comparative curves of the initial fracture aperture with different parameters.
Preprints 84183 g010
Figure 11. The comparative curves of the diversion fracture aperture with different parameters.
Preprints 84183 g011
Table 1. Input parameters.
Category Parameter Value
Rock property Young’s modulus, E (GPa) 25
Poisson’s ratio, v 0.22
Permeability, k (mD) 0.58
Fracture property Tensile strength of HF, σt (MPa) 8
Leak-off coefficient (m/s/Pa) 1e-14
Tight plug property Permeability of the tight plug, (mD) 500
Length of the tight plug, (m) 0.5
In-situ stress Minimum principle horizontal stress, σh (MPa) 55
Maximum principle horizontal stress, σH (MPa) 60
Fluid parameter Fluid viscosity, μ/(Pa·s) 0.1
Injection rate, Q/( m3/min) 4
Initial condition Initial pore pressure, po /(MPa) 37
Void ratio, Φ 0.08
Disclaimer/Publisher’s Note: The statements, opinions and data contained in all publications are solely those of the individual author(s) and contributor(s) and not of MDPI and/or the editor(s). MDPI and/or the editor(s) disclaim responsibility for any injury to people or property resulting from any ideas, methods, instructions or products referred to in the content.
Copyright: This open access article is published under a Creative Commons CC BY 4.0 license, which permit the free download, distribution, and reuse, provided that the author and preprint are cited in any reuse.
Prerpints.org logo

Preprints.org is a free preprint server supported by MDPI in Basel, Switzerland.

Subscribe

© 2024 MDPI (Basel, Switzerland) unless otherwise stated