Submitted:
04 September 2023
Posted:
05 September 2023
You are already at the latest version
Abstract
Keywords:
Introduction
Systemic approach to Stress
The intestinal mucosa, nutrition, bacteria and inflammation
Dysbiosis
- -
- Qualitative and quantitative alterations of the microbiota itself;
- -
- Changes in the metabolic activity of intestinal bacteria;
- -
- Variations of their local distribution.
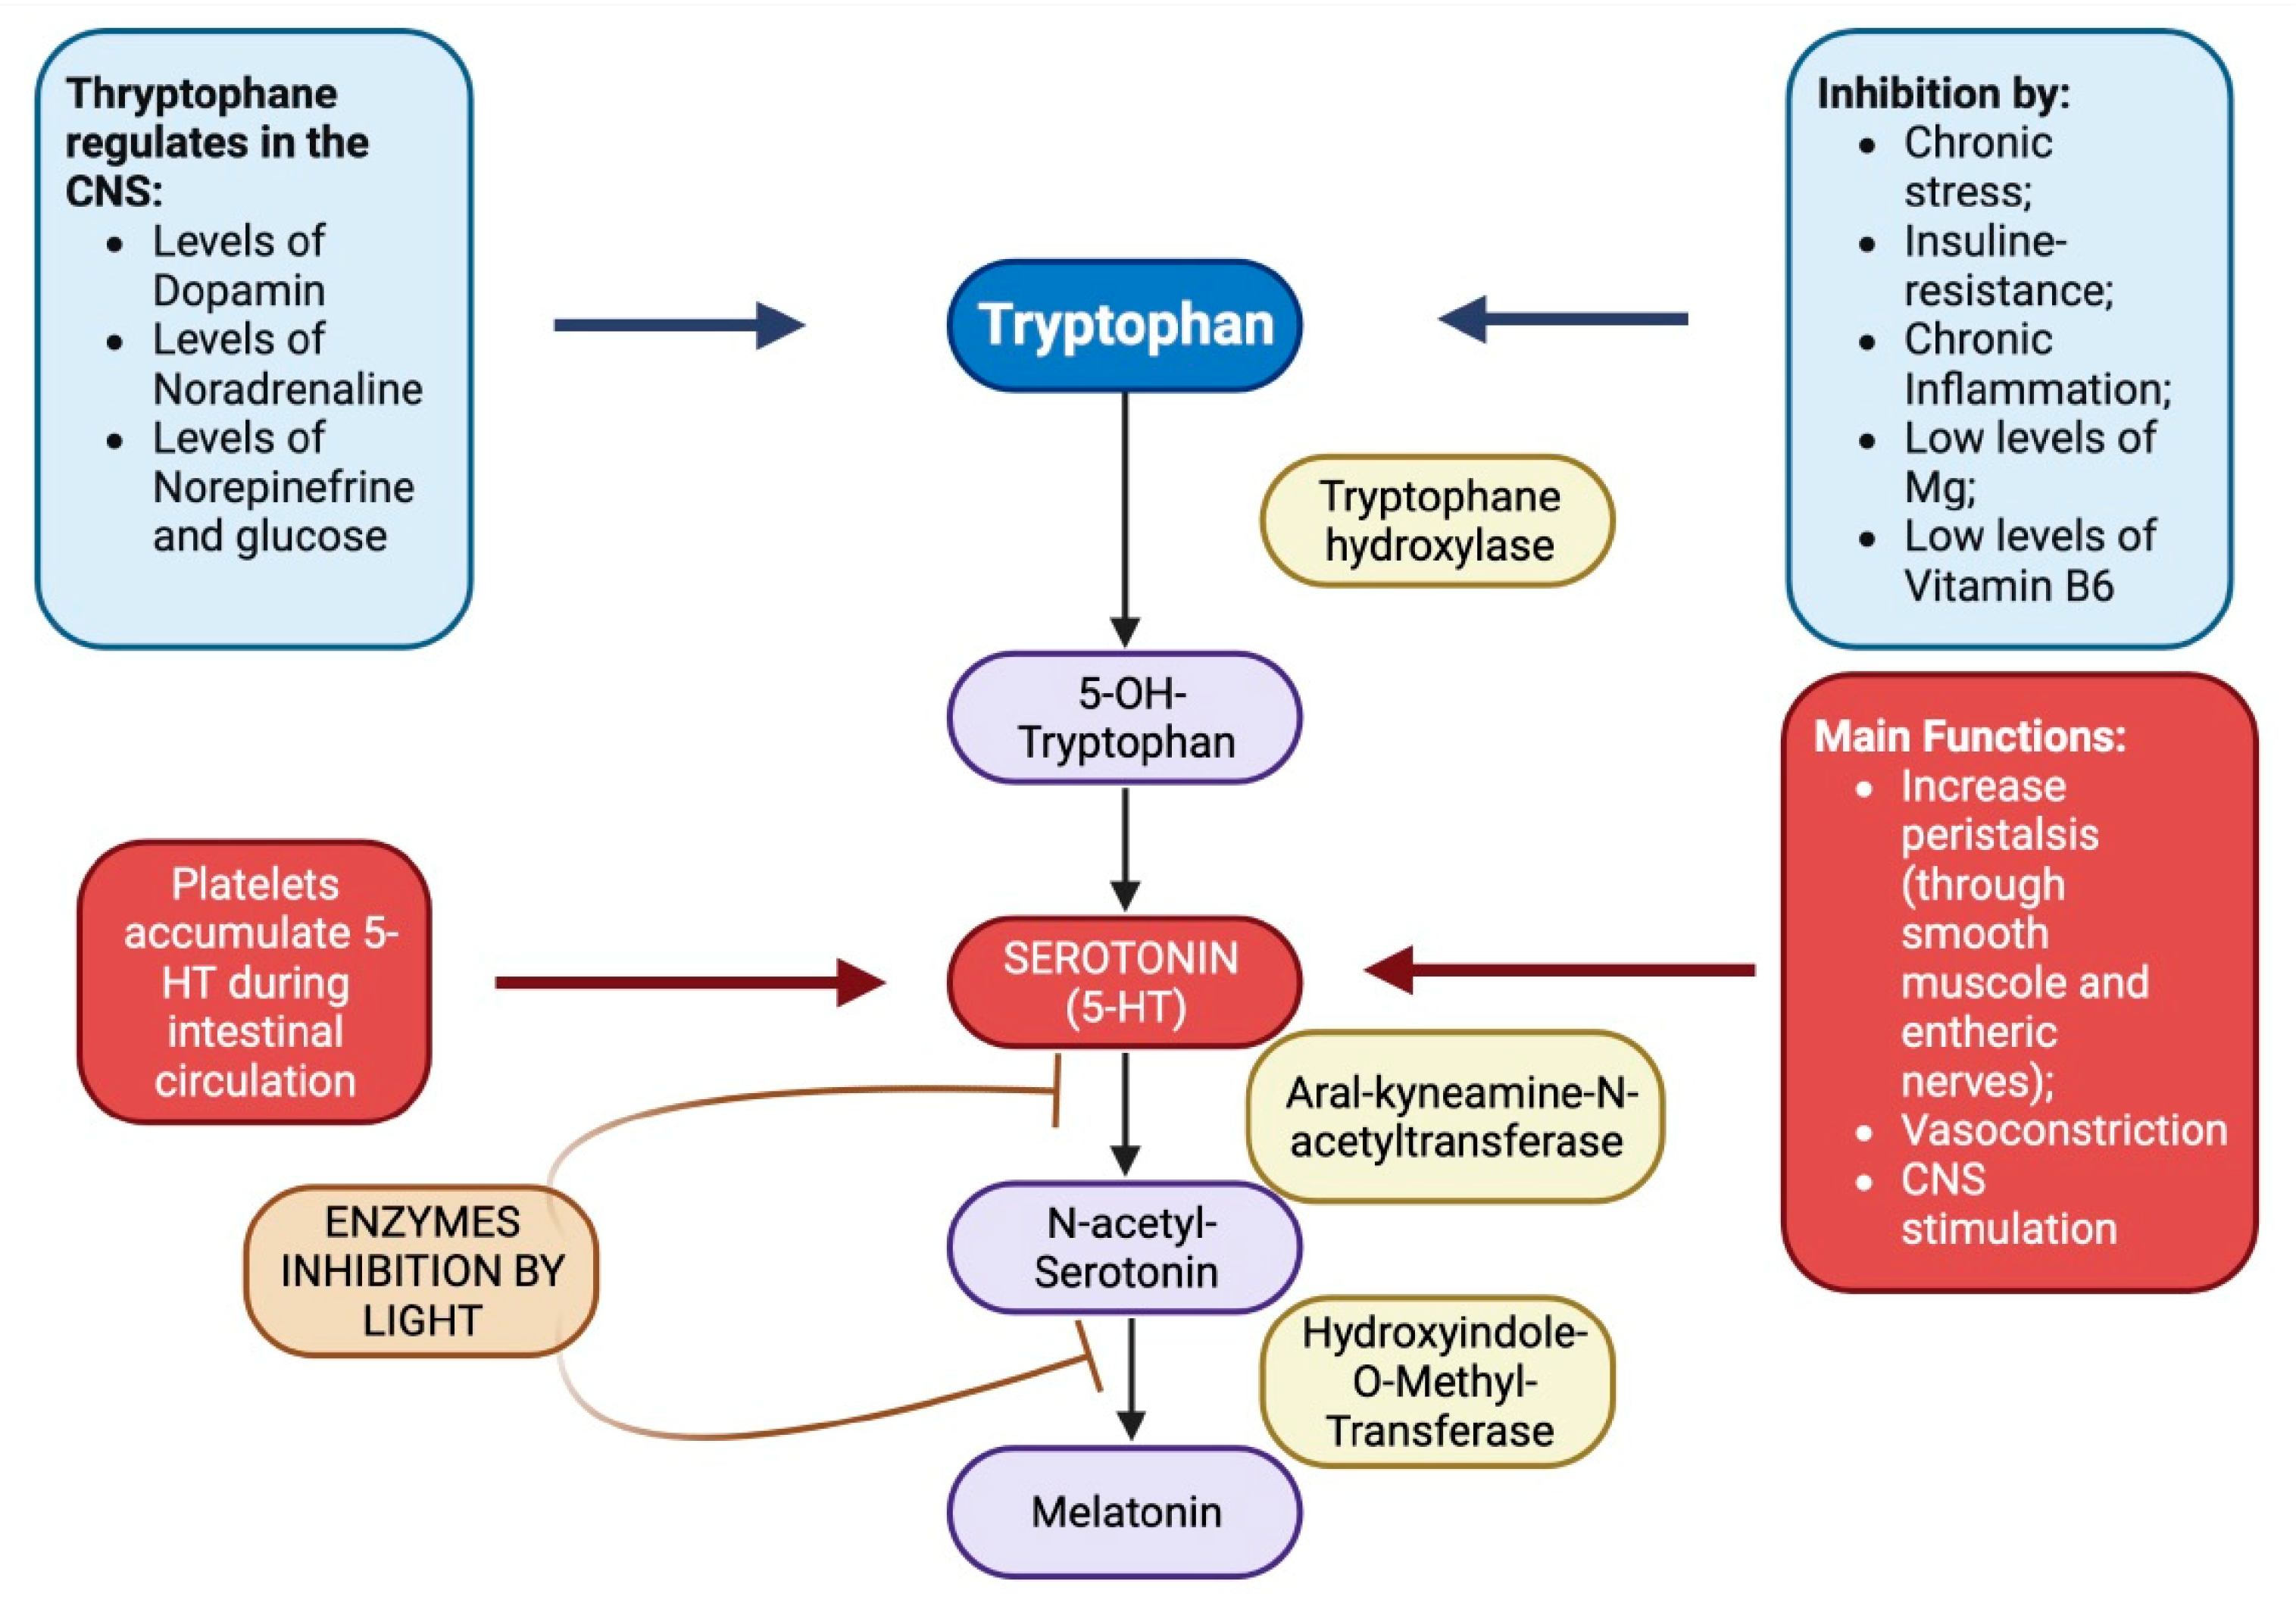
Tryptophan, serotonin, melatonin and intestines
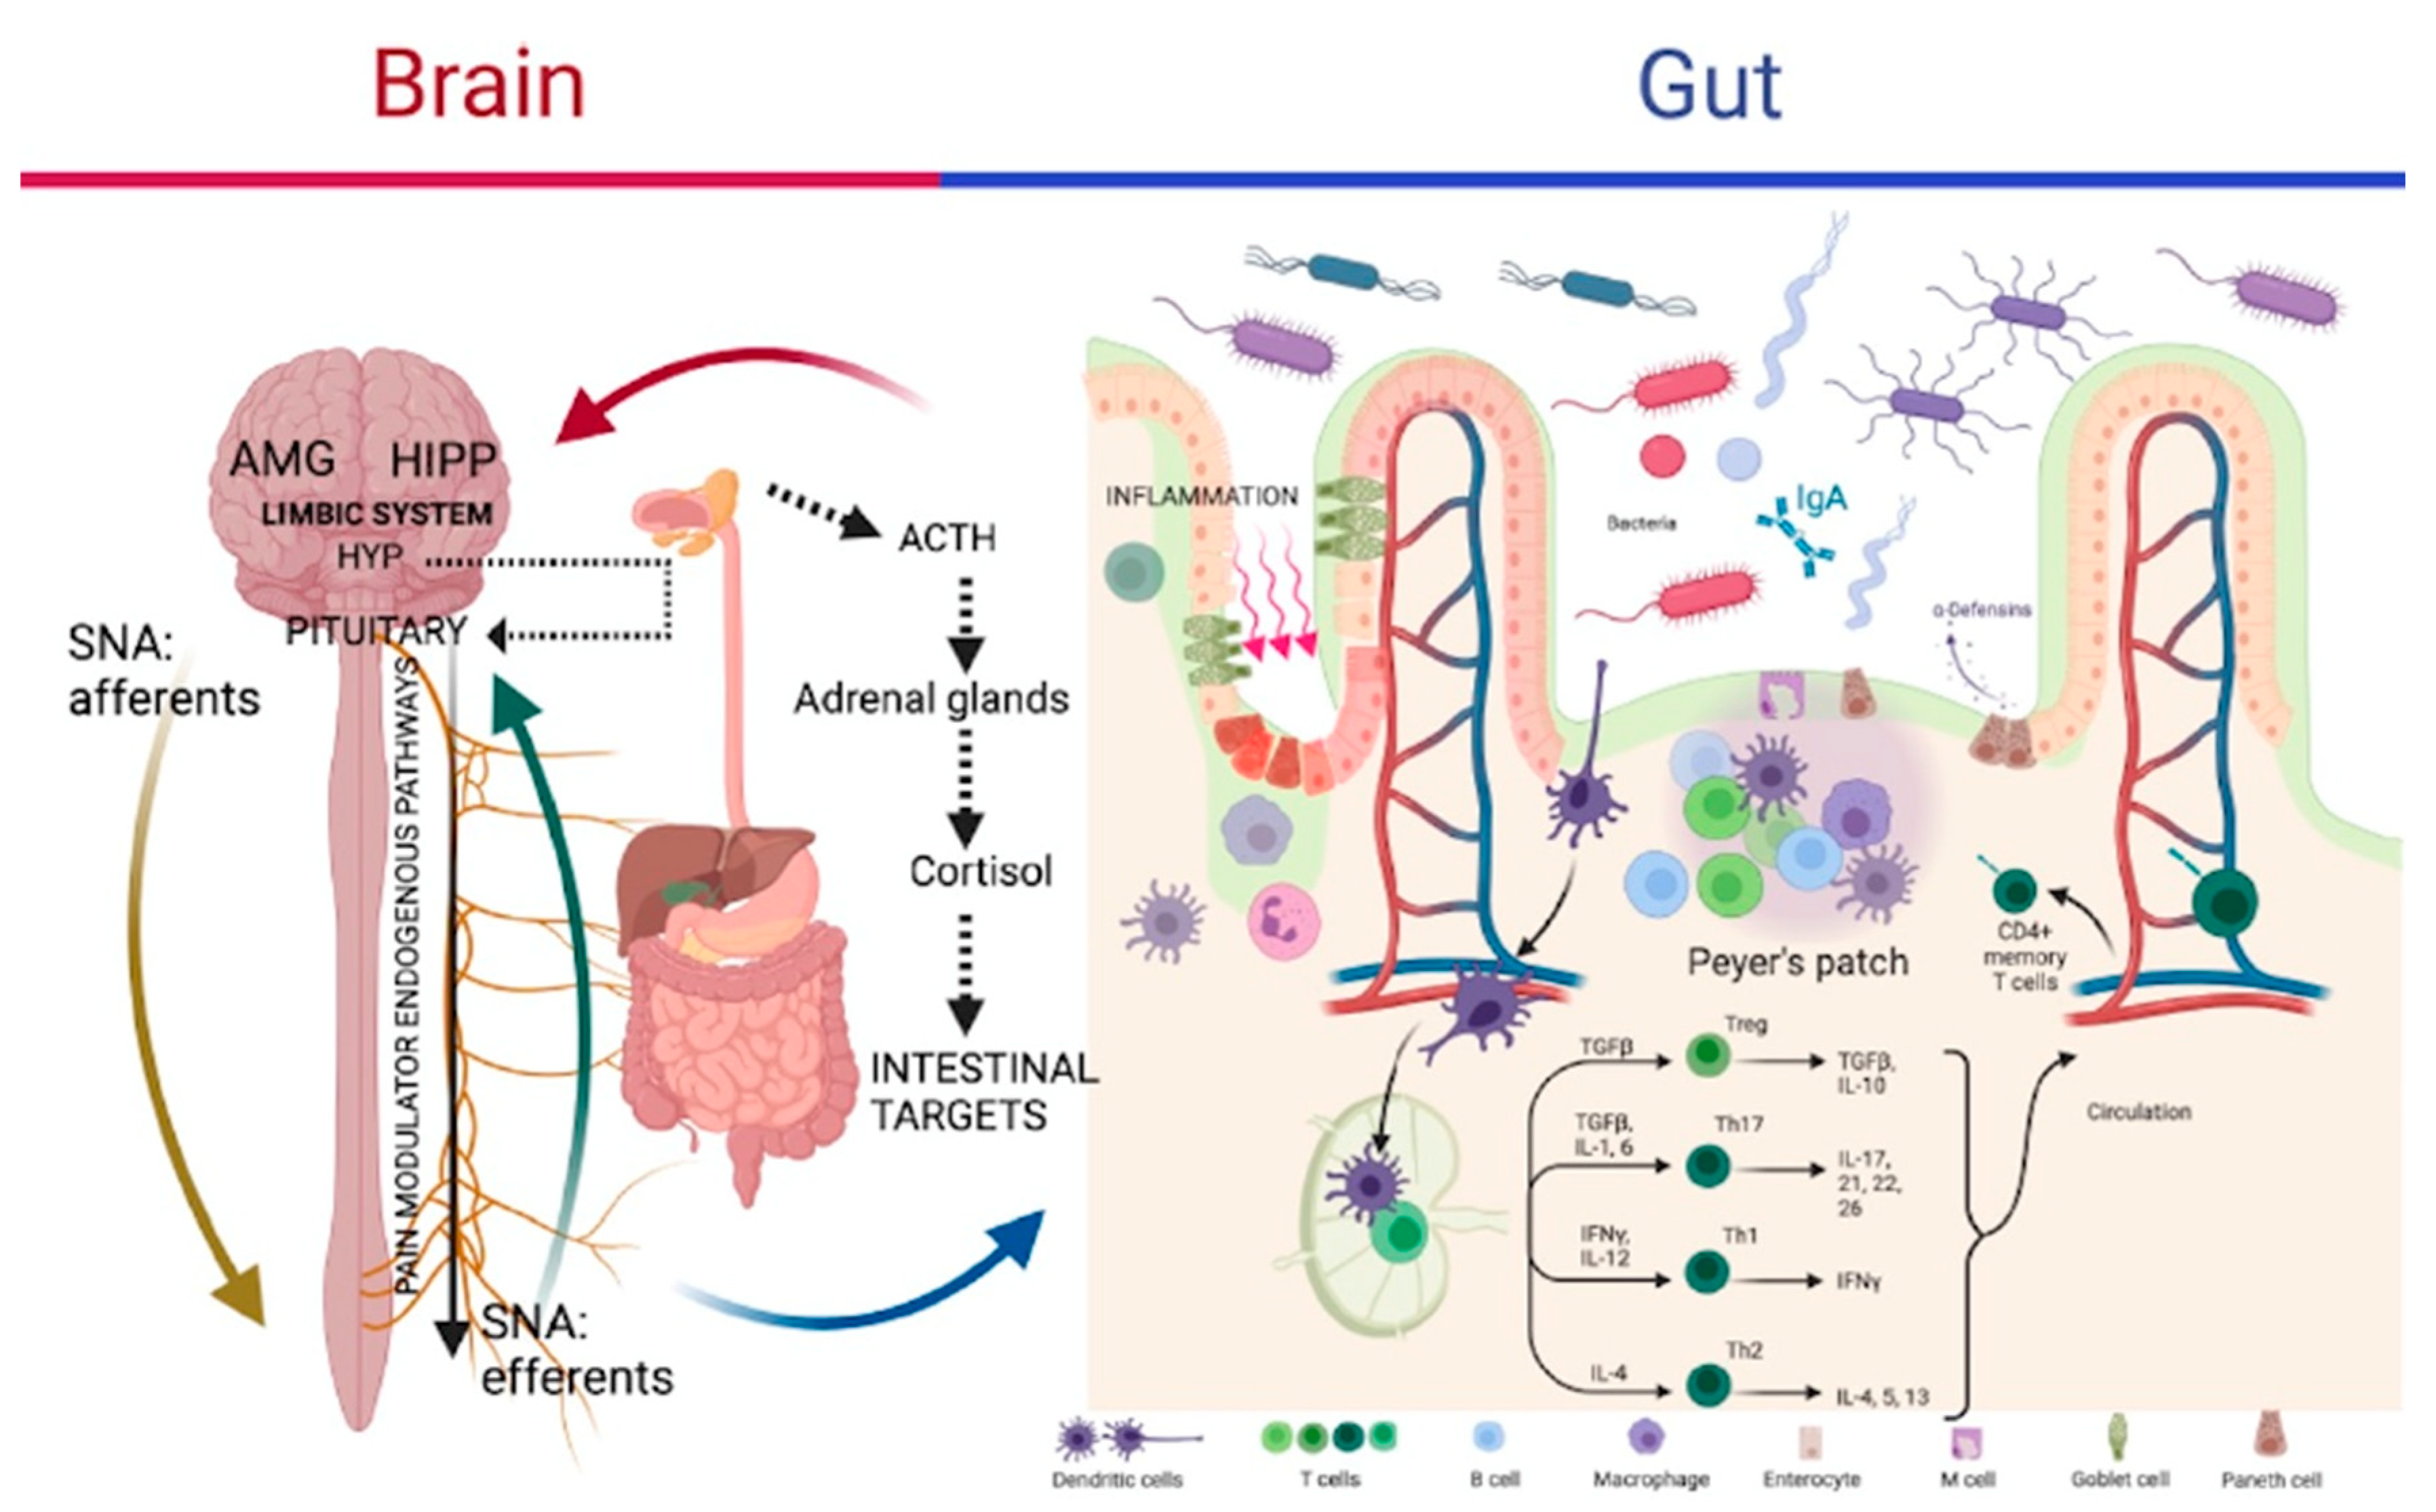
Gut-Brain Axis (GBA), stress and microbiota
Chronic Fatigue Syndrome
Omega-3 / Omega-6 ratio
Materials and Methods
Discussion
- -
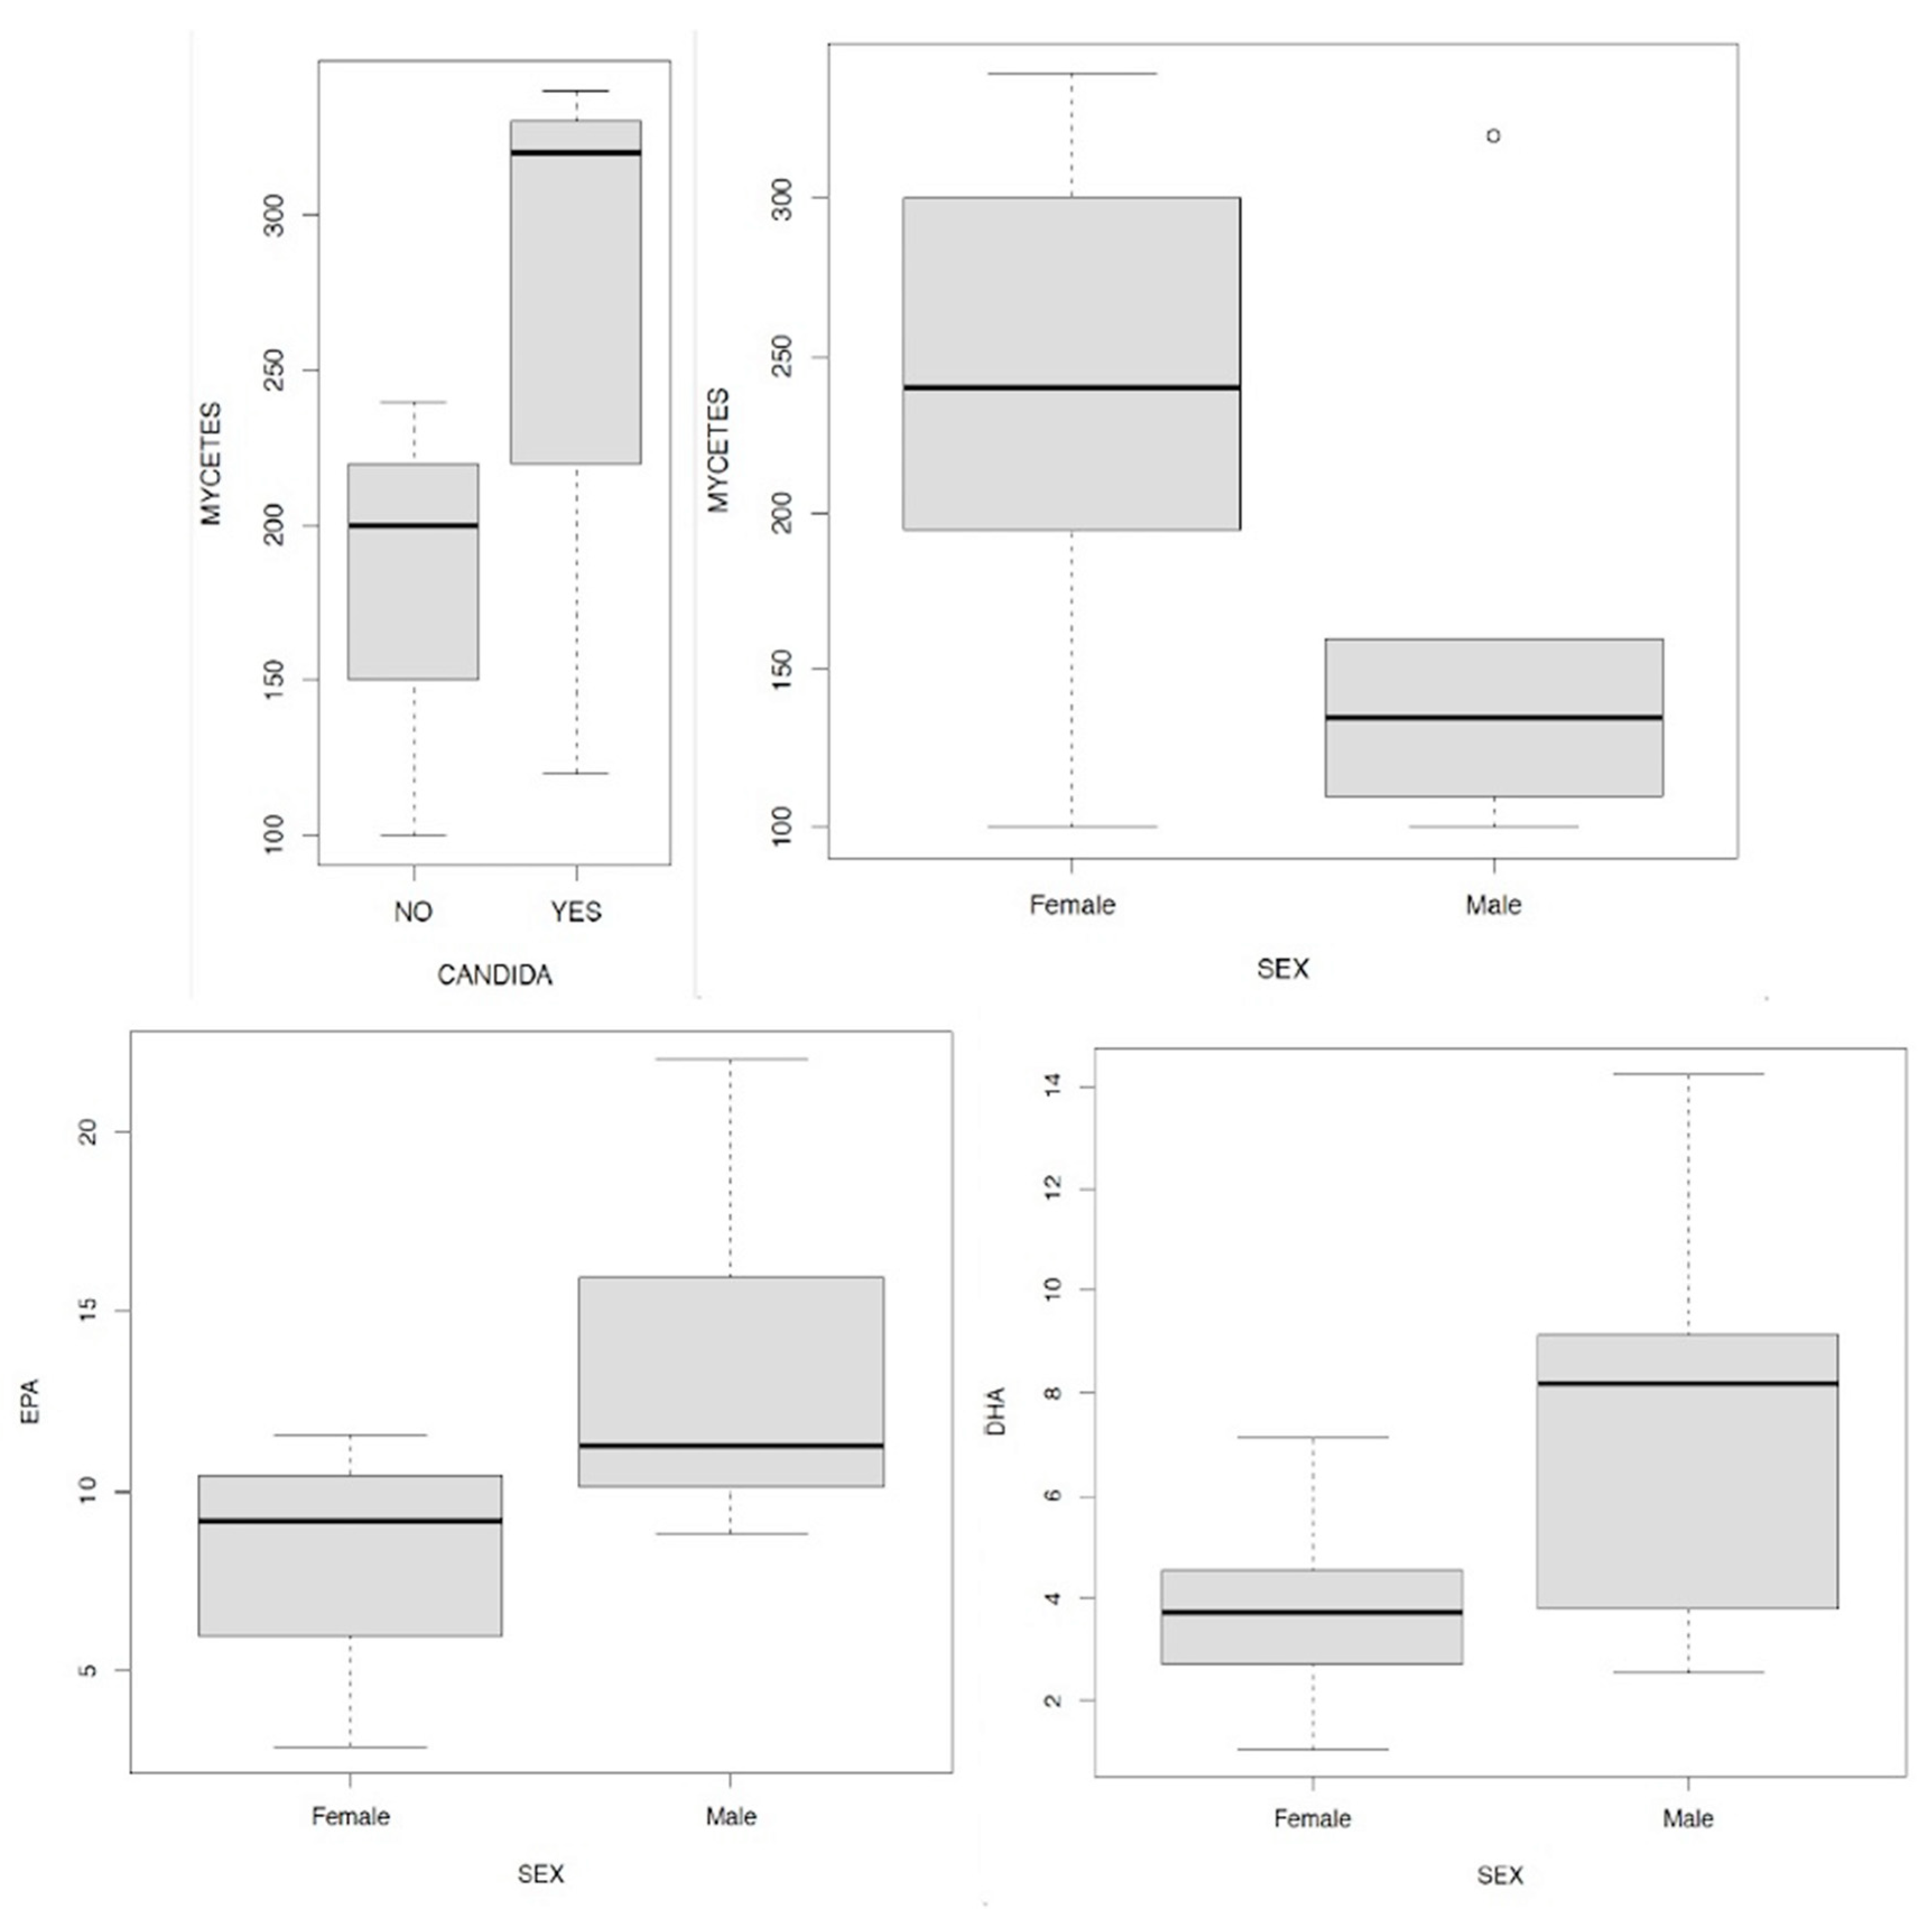
- men have a higher level of serotonin than women examined;
- -
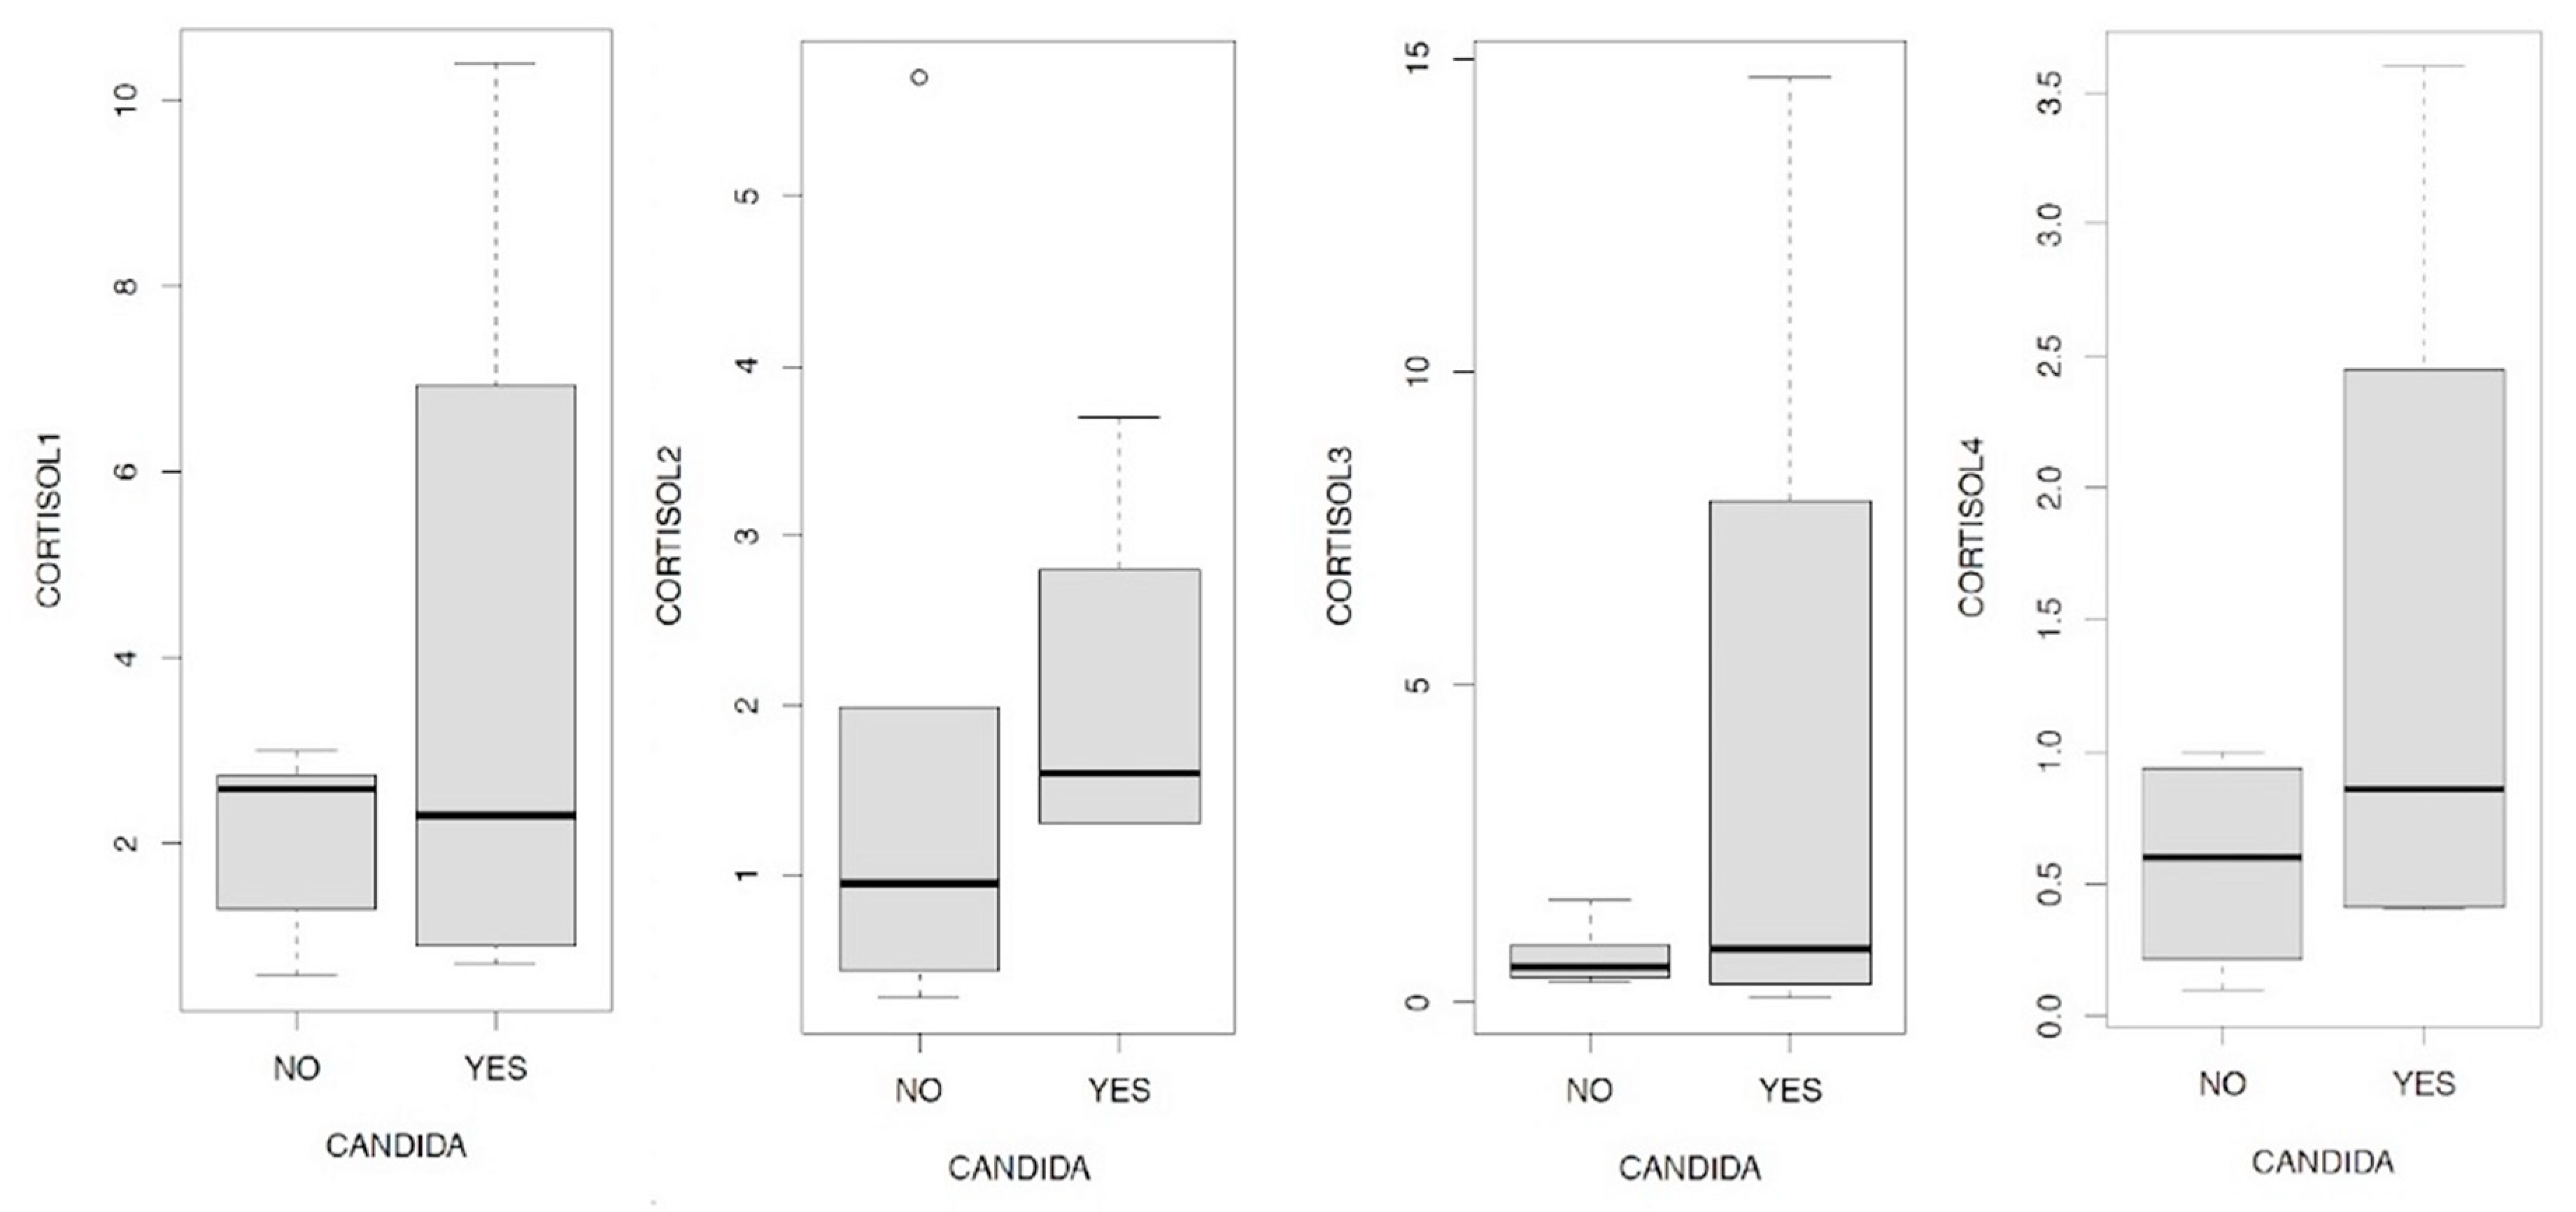
- in general, cortisol 1 and 3 have a positive and statistically significant effect on serotonin, while the increase in cortisol 4 there is a statistically significant reduction in serotonin values;
- -
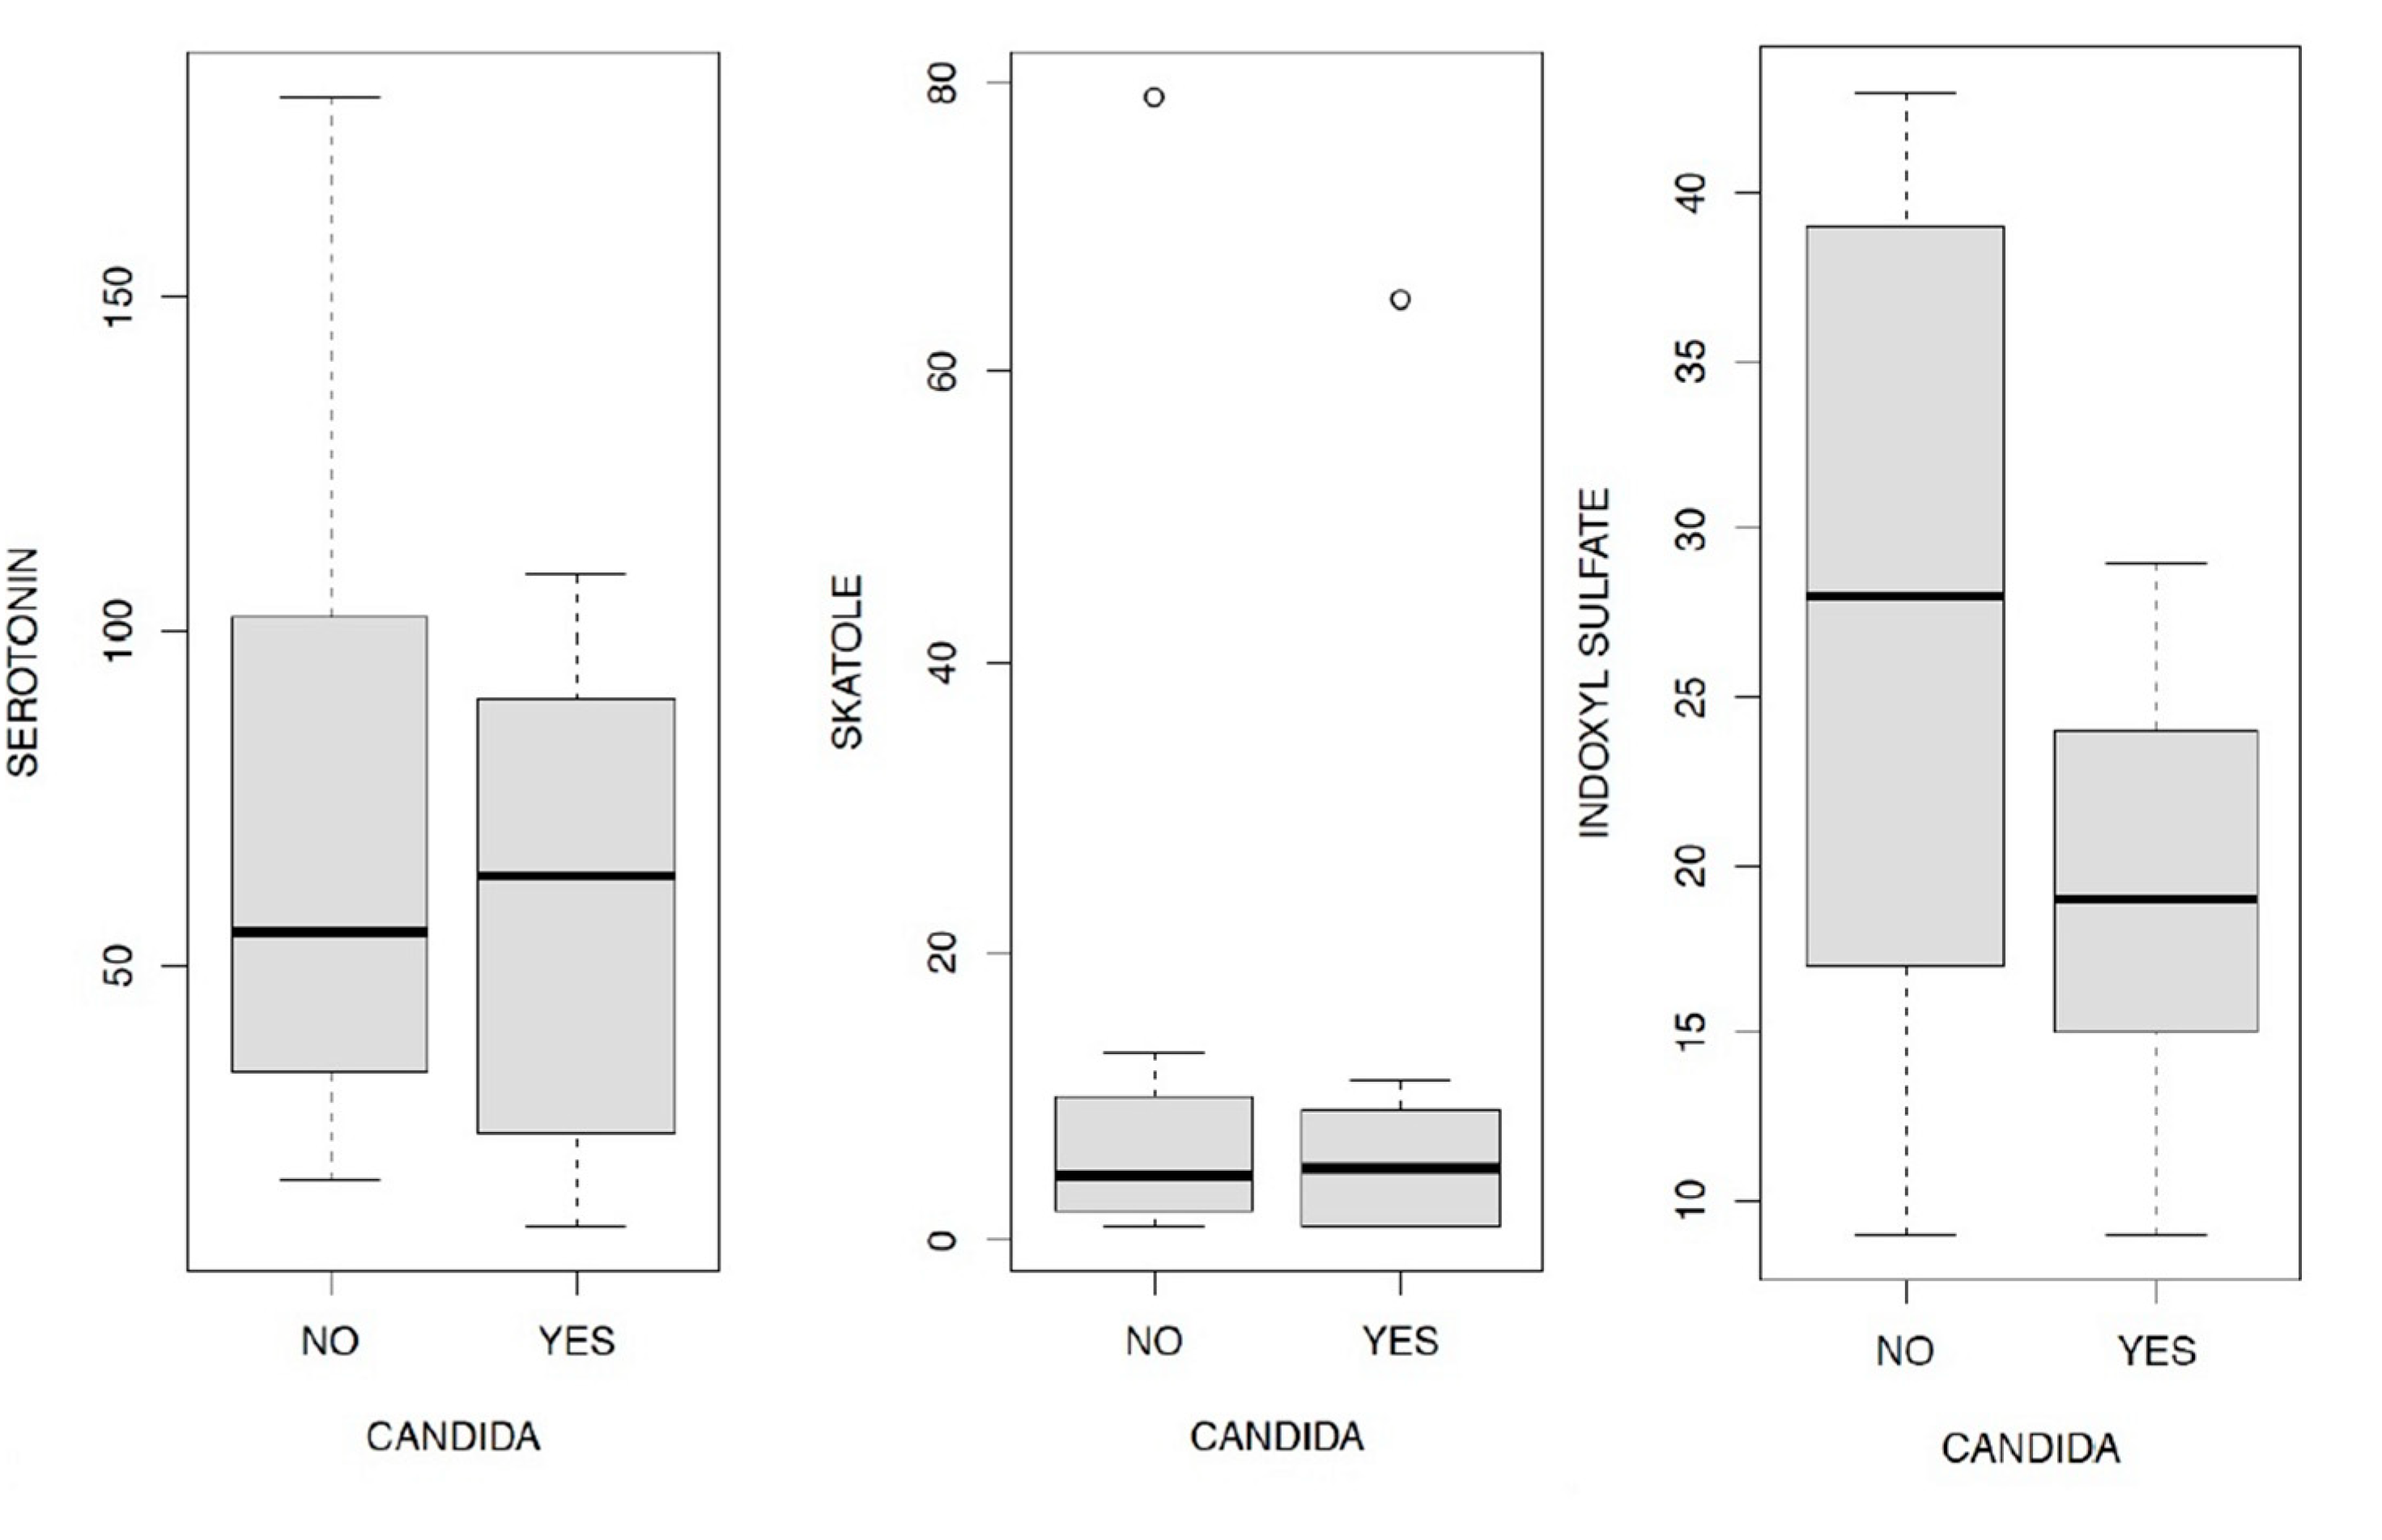
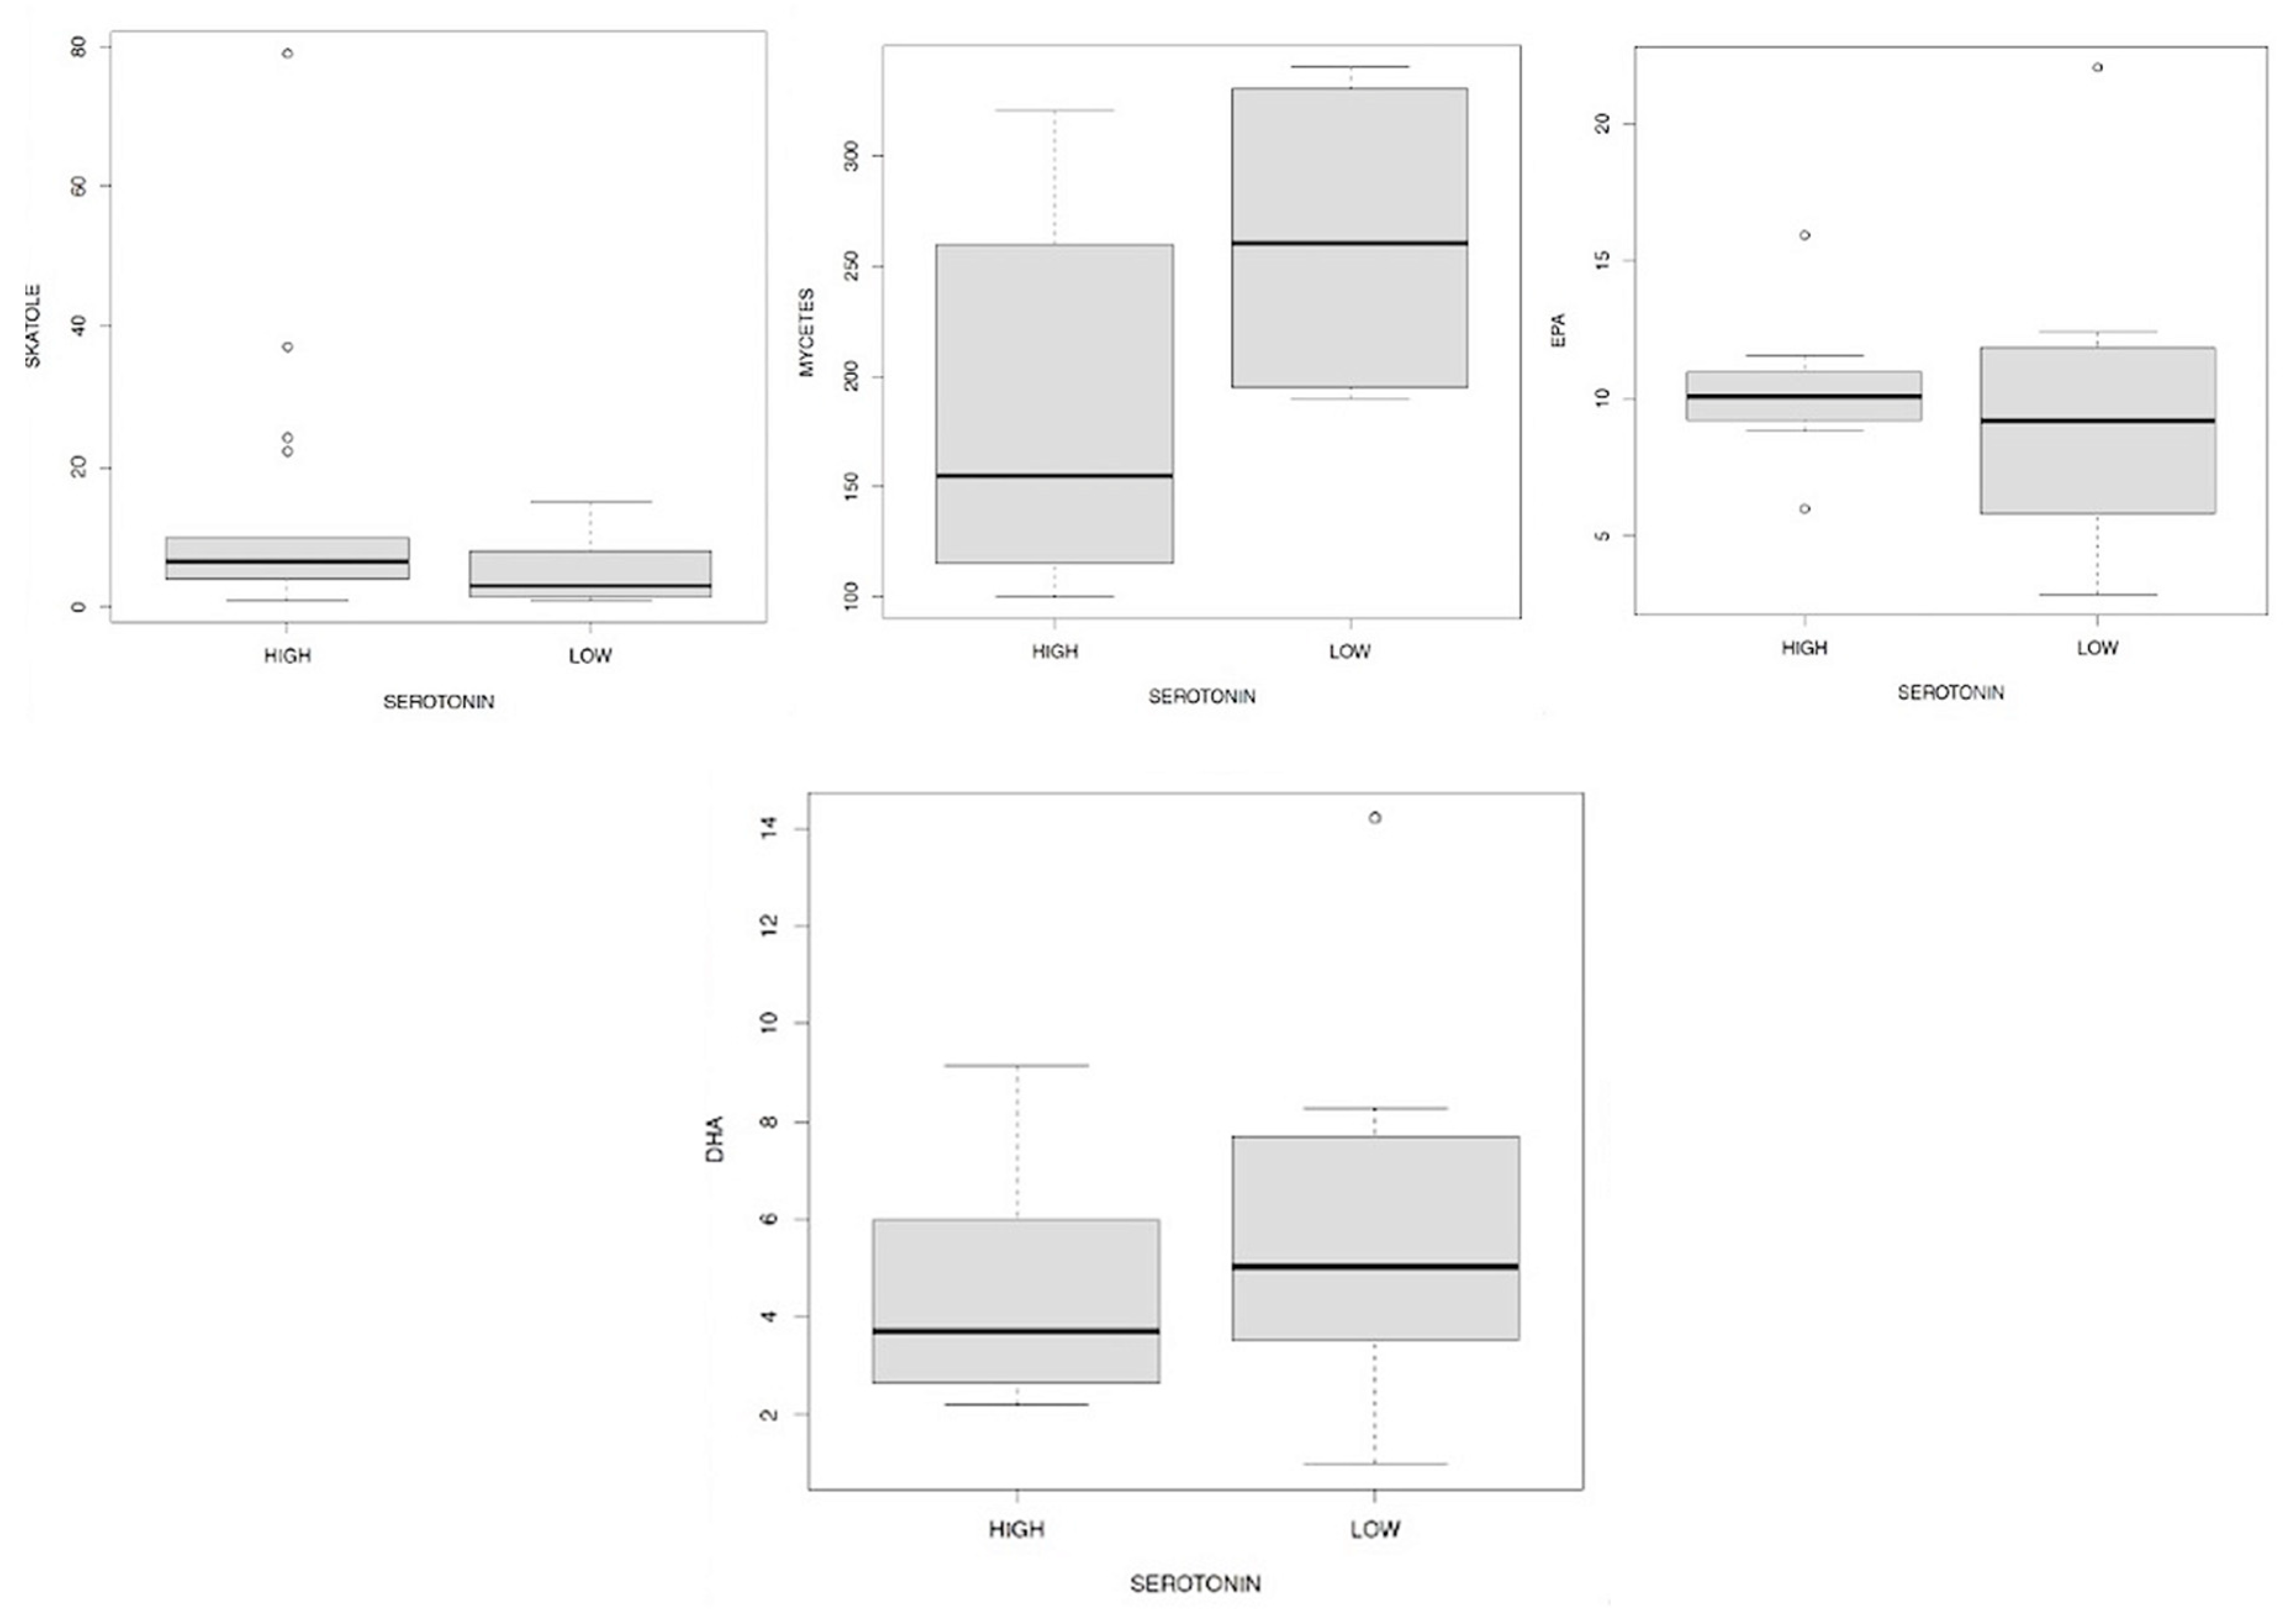
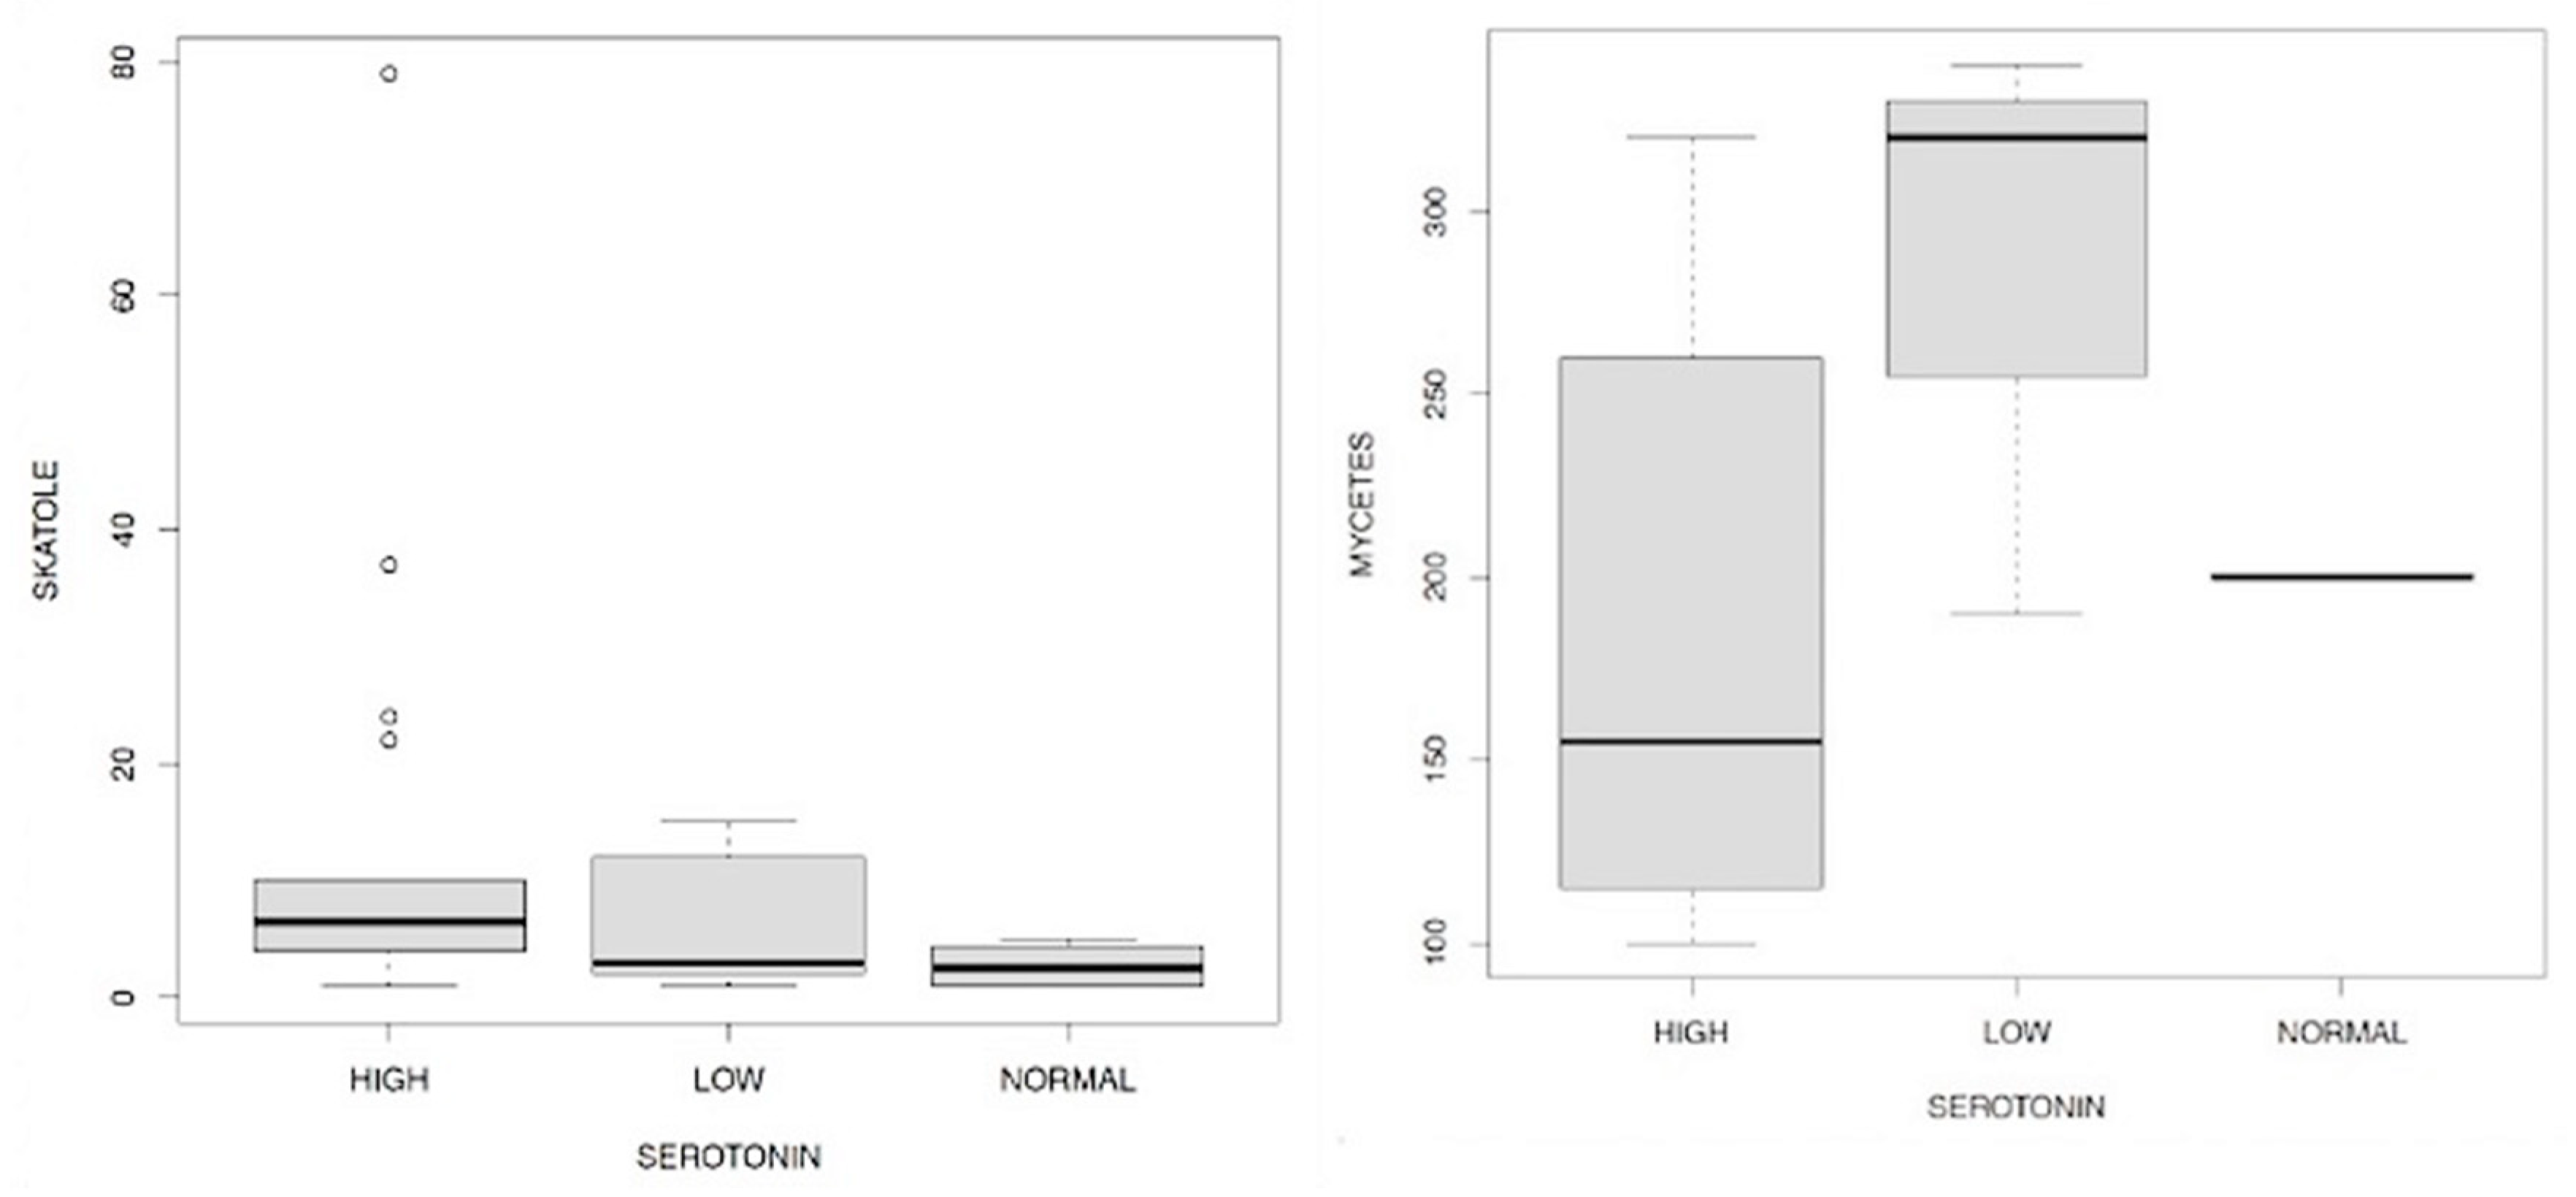
- in the presence of Candida a. and/or mycetes there is a lower level of serotonin than in subjects who do not have Candida a. and/or mycetes;
- -
- all three levels of indoxyl sulfate reported contribute to the determination of changes in serotonin in an inversely proportional way, compared to subjects with eubiosis. These relations, statistically significant, have different magnitudes and in particular, the strongest effect is associated with the average indicate levels. Patients in our sample who have an average indoxyl sulfate level (according to reference to physiological levels) also have a much lower level of serotonin. The empirical evidence goes in the same direction for the other two levels (mild and severe), however with a lower magnitude.
Conclusions
Statistics
References
- American Psychiatric Association (1980) DSM-III:. Manuale diagnostico e statistico dei disturbi mentali. 3ª ed. Masson, Milano 1983.
- Aardal, E.; Holm A.. Cortisol in saliva. Eur J Clin Biochem 1995; 33; 927-932 .
- Abrams, G.D.; Bishop, J.E. Effect of the normal microbial ora on gastrointestinal motility. Proc Soc Exp Biol Med 1967;126:301-304.
- Androulakis, P.; Ioannis. Circadian rhythms and the HPA axis: a systems view. WIREs Mech Dis. 2021 July; 13(4): e1518.
- Bach, J-F. The effect of infections on susceptibility to autoimmune and allergic diseases. N Engl J Med 2002; 347: 911–920.
- Bhattarai, Y.; Pedrogo, D.A.; Kashyap, P.C. Irritable bowel syndrome: a gut microbiota-related disorder? Am J Physiol Gastrointest Liver Physiol, 2017 Jan 1;312(1): G52-G62.
- Bailey, M.T.; Coe, C.L. Maternal separation disrupts the integrity of the intestinal microflora in infant rhesus monkeys. Dev Psychobiol 1999, 35(2):146–155. .
- Bailey, M.T.; Dowd, S.E.; Parry ,N.M.; Galley, J.D.; Schauer, D.B.; Lyte, M. Stressor exposure disrupts commensal microbial populations in the intestines and leads to increased colonization by Citrobacter rodentium. Infect Immun 2010, 78(4):1509–1519. [CrossRef]
- Ballanger, J.C.; et al. Consensus statement on depression, anxiety, and functional gastrointestinal disorders. J.Clini.Psychiatry 2001; 62 (supp.8).
- Balsari, A.; Ceccarelli, A.; Dubini, F.; Fesce, E.; Poli, G. The fecal microbial population in the irritable bowel syndrome. Microbiologica. 1982 Jul;5(3):185-94.
- Barbara, G.; Stanghellini, V.; Brandi, G.; et al. Interactions between commensal bacteria and gut sensorimotor function in health and disease. Am J Gastroenterol 2005;100:2560-2568. [CrossRef]
- Barouei, J.; Moussavi, M.; Hodgson, D.M. Effect of maternal probiotic intervention on HPA axis, immunity and gut microbiota in a rat model of irritable bowel syndrome. PLoS One 2012, 7(10):e46051. [CrossRef]
- Basso, A.; Costa Pinto, F.A.; Russo, M.; Giorgetti Britto, L.R.; de Sa-Rocha, L.C.; Palermo Neto, J. Neural correlates of IgE-mediated food allergy. J. Neuroimmunol 2003;140:69–77. [CrossRef]
- Benard, A.; Desreumeaux, P.; Huglo, D.; Hoorelbeke, A.; Tonnel, A.B.; Wallaert, B. Increased Intestinal Permeability in Bronchial Asthma. The Journal of Clinical Immunology, 1996, vol. 97-num 6, pag. 1173-1178. [CrossRef]
- Beier, W. Biophysic. 2 Aufl., Lipsia Thieme, 1962.
- Beier W. Einfuhrung in die theoretische biophysic. Stoccarda, Gustav Fisher, 1965.
- Bengmark S. Ecological control of the gastrointestinal tract. The role of probiotic flora. Gut 1998;42:2-7. [CrossRef]
- Berrill, J.W.; Gallacher, J.; Hood, K.; et al. An observational study of cognitive function in patients with irritable bowel syndrome and in ammatory bowel disease. Neurogastroenterol Motil 2013;25:918-e704.
- Bertalanffy von, L. General System Theory: Foundations, Development, Applications. 1967, G.Braziller Inc., USA.
- Bharwani, A.; et al. Oral treatment with Lactobacillus rhamnosus attenuates behavioural deficits and immune changes in chronic social stress. BMC medicine (2017). [CrossRef]
- Bonaz, B.; Bazin, T.; Pellissier, TS. The vagus nervea t the interface of the Microbiota-Gut-Brain Axis. Front.Neurosci., 2018 Feb;12:49.
- Bortolato, B.; Hyphantis,, T.N.; Valpione, S.; Perini,, G.; Maes, M.; Morris, G. Depression in cancer: The many biobehavioral pathways driving tumor progression. Cancer Treat Rev. 2017, 52, 58–70. [CrossRef]
- Bottaccioli F.; Carosella A. Mente inquieta. Ed. Tecniche Nuove, 2011.
- Bottaccioli F.; Carosella A. La saggezza del secondo cervello. Ed. Tecniche Nuove, 2007.
- Bottaccioli F.; Carosella A. Mente inquieta. Ed. Tecniche Nuove, 2011. .
- Bottaccioli F. PNEI. Ed. RED (1995).
- Bryant, R.A.; Harvey, A.G. Posttraumatic stress in volunteer fire-fighters. Predictors of distress. Journal of Nervous and Mental Disease, 1995, 183, 267-271. . [CrossRef]
- Brekhman, I.I. Man and Biologically Active Substances. Pergamon Press, Kronberg/Taunus, 1980. [CrossRef]
- Breuer, J.; Freud, S. Studies on hysteria: physical mechanism of hysteria. Tralated by Strachey J., New York, Penguin, 1973.
- Brodal, A. Neurological anatomy in relation to clinical medicine. Oxford University Press, V ed., Oxford (1992).
- Buffie, C.G.; Jarchum, I.; Equinda M.; Lipuma L.; et al. Profound Alterations of Intestinal Microbiota following a Single Dose of Clindamycin Results in Sustained Susceptibility to Clostridium difficile-Induced Colitis. Infection and Immunity, 2011, pag. 62-73. [CrossRef]
- Burton, A.C. The proterties of the steady state compared to those of equilibrium as shown in charateristic biological behavior. J. Cell. Comp. Physiol., 14 (1939), pp327-349.
- Cajochen, C.; Zeiter, J.M.; Czeisler, C.A; Dijk, D.J. Dose-response relationship for light intensity and ocular and electroencephaligraphic correlates of human alertness. Behav Brain Res., 2000, 115, 75-83. [PubMed]
- Caenepeel, P.; Janssens, J.; Vantrappen, G.; Eyssen, H.; Coremans, G. Interdigestive myoelectric complex in germ-free rats. Dig Dis Sci 1989;34:1180-1184. . [CrossRef]
- Caldarini, M.I.; Pons, S.; D’Agostino, D.; DePaula, J.A.; Greco, G.; Negri, G.; Ascione, A.; Bustos, D. Abnormal fecal flora in a patient with short bowel syndrome: An in vitro study on effect of pH on D-lactic acid production, Dig Dis Sci 41: 1649-1652, 1996. .
- Cannon, W.B. The wisdom of the body. Ed. Norton (1932), New York.
- Cannon, W.B. Organizationfor physiological homeostasis. Phys Rev, 9 (1929), 2nd edition, ed. Norton, New York.
- Cannon, W.B. Bodily changes in pain, hunger, fear and range. Ed. D. Applenton, 1932.
- Caparros, E.; Wiest, R.; Scharl, M.; Roglen, G.; et al. Dysbiotic microbiota interactions in Crohn’s disease. Gut Microbes, 2021, Vol.13, N.1. [CrossRef]
- Capra, F. La rete della vita. Ed. BUR, 2001.
- Carabotti, M.; Scirocco, A.; Maselli, M.A.; Severi, C. The gut-brain axis: interctions between enteric microbiota, central and enteric nervous systems. Annals of Gastroenterology 2015; 28, 203-209.
- Cassano, G.B.; D’Errico, A.; Pancheri, P.; Pavan, L.; Pazzagli, A.; Rossi, R.; Smeraldi, E.; Volterra, V. Trattato Italiano di Psichiatria. Ed. Masson, Milano, 1993, 1560-1585.
- Castex, N.; Fioramonti, J.; Fargeas, M.J.; Bueno, L. c-fos expression in specific rat brain nuclei after intestinal anaphylaxis:involvement of 5-HT3 receptors and vagal afferent fibers. Brain Res 1995;688:149–160. [CrossRef]
- Chadwick, V.S.; et al.. Activation of the mucosal immune system in irritable bowel syndrome. Gastroenterol 2002;120:1778–1783. [CrossRef]
- Clarke, G., Stillin R.M. et al.. Minireview: gut microbiota, the negletted endocrine organ. Mol Endocrinol, 2014 Aug;28(8): 1221-1238.
- Clarke, G.; Grenham, S.; Scully, P.; et al. The microbiome-gut-brain axis during early life regulates the hippocampal serotonergic system in a sex-dependent manner. Mol Psychiatry 2013;18:666-673.
- Collins, S.M.; Surette, M.; Bercik, P. The interplay between the intestinal microbiota and the brain. Nat Rev Microbiol. 2012;10:735–42. [CrossRef]
- Colombo, P.P.; Mantua, V. Post-Traumatic Stress Disorder in ordinary life. Rivista di psichiatria, 2001, 36, 2.
- Craig, A.D. Interoception: the sense of the physiological condition of the body. Curr. Opin. Neurobiol 2003;13:500–505. [CrossRef]
- Crouzet, L.; Gaultier, E.; Del’Homme, C.; et al. The hypersensitivity to colonic distension of IBS patients can be transferred to rats through their fecal microbiota. Neurogastroenterol Motil 2013;25:e272-e282. [CrossRef]
- Cryan, J.F.; Dinan, T.G. Mind-altering microorganisms: the impact of the gut microbiota on brain and behavior. Nat Rev Neurosci. 2012;13:701–12.
- Cummings, J.H.; Macfarlane, G.T. Role of intestinal bacteria in nutrient metabolism. JPEN J Parenter Enteral Nutr 1997;21:357- 365. [CrossRef]
- van Deventer, S.J.; Ten Cate, J.W.; Tytgat G.N. Intestinal endotoxemia. Clinical significance. Gastroenterology 1988;94:825-831.
- Devkota, S.; et al. Dietary-fat-induced taurocholic acid promotes pathobiont expansion and colitis in Il10−/− mice. Nature 2012; 487:104–108. [CrossRef]
- Diaz Heijtz, R.; Wang, S.; Anuar, F.; et al. Normal gut microbiota modulates brain development and Behavior. Proc Natl Acad Sci USA 2011;108:3047-3052. [CrossRef]
- Duncan, S.H.; et al. Reduced dietary intake of carbohydrates by obese subjects results in decreased concentrations of butyrate and butyrate-producing bacteria in feces. Appl Environ Microbiol 2007; 73:1073–1078. [CrossRef]
- Dupont, H.L. Review article: evidence for the role of gut microbiota in irritable bowel syndrome and its potential in uence on therapeutic targets. Aliment Pharmacol Ther 2014;39:1033-1042.
- Eckburg ,P.B.; Bik, E.M.; Bernstein, C.N.; Purdom, E.; et al. Diversity of the human intestinal microbial flora Science 308:1635–1638; 2005.
- Eder, W.; Ege, M.J.; von Mutius, E. The asthma epidemic. N Engl J Med 2006; 355: 2226–2235.
- Erdrich, S.; Hawrelak, J.A.; Myers, P.; Harnett, J. Determining the association between fibromyalgia, the gut microbiome and its biomarkers: a systematic review. BMC Musculo Dis, (2020) 21:181. [CrossRef]
- Evans, J.M.; Morris, L.S.; Marchesi, J.R. The gut microbiome: the role of a virtual organ in the endocrinology of the host. J Endocrinol. 2013;218:R37–R47. [CrossRef]
- Farley ,M.; Barkan, H. Prostitution, violence, and posttraumatic stress disorder. Women Health 1998, 27, 37-49.
- Farzi, A.; Frohlich, E.E.; Holzer, P. Gut microbiota and the neuroendocrine system. Neurotherapeutics 2018 15:5-22. [CrossRef]
- Femstrom, J.D.; Wurtman, R.J. Brain serotonin content: increase following ingestion of carbohydrate diet. Science 1971, dec.3; 174(4013): 1023-5.
- Foster R.; Kreitzman, L. I ritmi della vita. Ed. Longanesi, 2007.
- Foster, J.A.; McVey-Neufeld, K.A. Gut-brain axis: how the microbiome influences anxiety and depression. Trends Neurosci 2013;36:305-312. . [CrossRef]
- Freitas, R.D.S.; Campos, M.M. Protective effects of Omega-3 fatty acids in cancer-related complications. Nutrients 2019, 11, 945. [CrossRef]
- Furness, J.B.; Costa, M. The enteric nervous system. 1987, Churchill Livingstone, Edinburgh.
- Gabella, G. Structure of autonomic nervous system. 1976, Chapman and Hall, London. [CrossRef]
- Galley, J.D.; Nelson, M.C.; Yu, Z.; et al. Exposure to a social stressor disrupts the community structure of the colonic mucosa-associated microbiota. BMC Microbiol 2014;14:189. [CrossRef]
- Gershon, M.D. The second brain: a groundbreaking new understanding of nervous disorders of the stomach and intestine. 1998, Ed. Harper.
- Gilbert, S.F. Biologia dello sviluppo. IV ed. italiana 2012, ed. Zanichelli.
- Goehler, L.E.; et al. Infection-induced viscerosensory signals from the gut enhance anxiety: implications for psychoneuroimmunology. Brain Behav Immun 2007 August ; 21(6): 721–726. [CrossRef]
- Goehler, L.E; et al. Activation in vagal afferents and central autonomic pathways: early responses to intestinal infection with Campylobacter jejuni. Brain Behav Immun 2005;19:334–344. [CrossRef]
- Goehler, L.E.; Gaykema, R.P.A.; Anderson, K.; Hansen, M.K.; Maier S.F.; Watkins L.R. Vagal immune-to-brain communication: a visceral chemoreceptive pathway. Auton Neurosci 2000;85:49–59.
- Gomborone, J.E.; Gorard, D.A.; Dewsnap, P.A.; Libby, G.W.; Farthing M.J. Prevalence of irritable bowel syndrome in chronic fatigue. J R Coll Physicians Lond 30: 512-513, 1996. .
- Grider, J.R.; Piland, B.E. The peristaltic re ex induced by short-chain fatty acids is mediated by sequential release of 5-HT and neuronal CGRP but not BDNF. Am J Physiol Gastrointest Liver Physiol 2007;292:G429-G437. .
- Grundy D. Neuroanatomy of visceral nociception: vagal and splanchnic afferent. Gut 2002;51(Suppl I):i2–i5. [CrossRef]
- Hijazi, Z.; Molla, A.M.; Al-Habashi, H.; Muawad, W.M.R.A.; Sharma, P.N. Intestinal Permeability is Increased in Bronchial Asthma. Arch Dis Child 2004; 89:227-229. [CrossRef]
- Hawrelak, J.A.; Myers, S.P. The causes of intestinal dysbiosis: a review. Altern Med Rev 2004;9:180–197.
- Holzapfel, W.H.; Haberer, P.; Snel, J.; et al. Overview of gut flora and probiotics. Int J Food Microbiol 1998;41:85-101. [CrossRef]
- Hong-Yan, Qin; Chung-Wha, Chenh; Xu-Dong, Tang; Zhao-Xiang, Bian. Impact of psycological stress on irritable bowel syndrome. WJG, Oct 21 (2014), Vol.20, Issue 39.
- Hong-Xing, Wang; Yu-Ping, Wang. Gut-microbiota-brain axis. Chinese Medical Journal, October 2016, Vol. 129, Issue 19.
- Hubbard, T.D.; Murray, I.A.; Perdew, G. Indole and tryptophan metabolism: endogenuos and dietary routes to Ah receptors activation. Drug Metab Dispos, oct 2015, 43:1522-1535.
- Hudson, J.I.; Goldenberg, D.L.; Pope, H.G. Jr; Keck, P.E. Jr; Schlesinger, L. Comorbidity of fibromyalgia with medical and psychiatric disorders. Am J Med 92: 363-367, 1992. .
- Husebye, E.; Hellström, P.M.; Sundler, F.; Chen, J.; Midtvedt, T. Influence of microbial species on small intestinal myoelectric activity and transit in germ-free rats. Am J Physiol Gastrointest Liver Physiol 2001;280:G368-G380.
- Iwai, H.; Ishihara, Y.; Yamanaka, J.; Ito, T. Effects of bacterial ora on cecal size and transit rate of intestinal contents in mice. Jpn J Exp Med 1973;43:297-305. .
- James, W. Principles of psychology. 1890, ed. eBooks@Adelaide.
- James, W. Che cos’è un’emozione, In James, W. L’uomo come esperienza. Identità, istinti, emozioni. 1999, ed. L’Ancora, Ancona.
- James, W. Esiste la coscienza. In James W. L’uomo come esperienza. Identità, istinti, emozioni. 1999, ed. L’Ancora, Ancona.
- Janet, P. The mental state of histericals: a study of mental stigmata and mental accidents. Washington DC: University Publications of America (1893, 1901, 1977).
- Jurjus, A.; et al. Inflammatory bowel disease, colorectal cancer and type 2 diabetes mellitus: the links. BBA Clinical (2016), 16-24. [CrossRef]
- Kamiya, T.; et al. Inhibitory effects of Lactobacillus reuteri on visceral pain induced by colorectal distension in Sprague-Dawley rats. Gut 2006;55:191–196. doi: 10.1136/gut.2005.070987 . [CrossRef]
- Kamphuis, J.H.; Emmelkamp, P.M. Crime-related trauma: psychological distress in victims of bankrobbery. Journal Anxiety Disorder, 1998, 12, 199-208. [CrossRef]
- Kennedy, P.J.; Cryan, J.F.; Dinan, T.G.; Clarke, G. Irritable bowel syndrome: A microbiome-gut-brain axis disorder. World J Gastroenterol 2014;20:14105-14125. [CrossRef]
- Kimura, I.; Inoue, D.; Maeda, T.; et al. Short-chain fatty acids and ketones directly regulate sympathetic nervous system via G protein-coupled receptor 41 (GPR41). Proc Natl Acad Sci USA 2011;108:8030-8035. . [CrossRef]
- Kinashi, Y.; Hase, K. Partners in Leaky gut Syndrome: Intestinal Dysbiosis and Autoimmunity. Frontiers in Immunology, Apr 2021;12:673708. [CrossRef]
- King, D.E.; Mainous, A.G.; Lambourne, C.A. Trends in dietary fiber intake in the United States”, 1999-2008. J Acad Nutr Diet 2012; 112: 642–648.
- Kirschbaum, C.; Hellhammer, D. Salivary cortisol in psychoneuroendocrine resarch: recent developments and applications. Psychoneuroendocrinology, Vol. 19; 313-333, 1994. .
- Koboziev, I.; Reinoso-Webb, C.; Grisham, M.B. Role of the enteric microbiota in intestinal homeostasis and inflammation. Free Radic Biol Mol Med, Mar 2014, 68:122-33. [CrossRef]
- Konturek, P.C.; et al. Stress And The Gut: Pathophysiology, Clinical Consequences, Diagnostic Approach And Treatment Options. Journalnal of Physiology and Pharmacology 2011, 62, 6, 591-599.
- Lacosta, S.; Merali, Z.; Anisman, H. Behavioral and neurochemical consequences of lipopolysaccharide in mice: angiogenic-like effects. Brain Res 1999;818:291–303.
- Langley, J.N. The autonomic nervous system. Part I, 1921, Heffer, Cambridge. .
- Larsen, P.R. William’s textbook of endocrinology. 2003, ed. Saunders, Philadelphia. [CrossRef]
- David, L.A.; Maurice C.F.; et al. Diet rapidly and reproducibly alters the human gut microbiome. Nature, 2014 January 23; 505(7484): 559–563. [CrossRef]
- Lazarev, N. 7° All-union Congr.Physiol.Biochem., Moscow, p.579-1947.
- Leigh-Gibson, E.; et al. Increased salivary cortisol reliably induced by a protein-rich meal. Psychosom Med. 1999 Mar-Apr;61(2):214-24). [CrossRef]
- Ley, R.E.; Turnbaugh, P.J.; Klein, S.; Gordon, J.I. Microbial ecology: human gut microbes associated with obesity. Nature 2006; 444:1022–1023. [CrossRef]
- Lindheim, L.; Bashir, M.; Munzker, J.; Trummer, C.; Zachhuber, V.; Leber, B.; et al. Alterations in Gut Microbiome Composition and Barrier Function Are Associated with Reproductive and Metabolic Defects in Women with Polycystic Ovary Syndrome (PCOS): A Pilot Study. PLoS ONE 2017, 12(1): e0168390. [CrossRef]
- Liu C.Y. et al. Vagal modulation of intestinal afferent sensitivity to systemic lipopolysaccharide in the rat. Am J Physiol Gastrointest Liver Physiol 2007 May;292(5):G1213-20. Epub 2007 Jan 4.
- Liu, J.J.; Galfavy, H.C.; Cooper, T.B.; Oquendo, M.A.; Grunebaum, M.F.; Mann, J.J.; Sublette, M.E. Omega-3 Polyunsaturated Fatty Acid Status in Major Depression with Comorbid Anxiety Disorders. J Clin Psychiatry 2013 July; 74(7): 732-738. [CrossRef]
- Locker, A.; et al. Elemente einer systemtheoretischen betrachtung des stoffwechsels. Helgolander Wissenschaftliche Meeruntersuchungen, 14 (1966a), pp. 4-24. [CrossRef]
- Luna, R.A.; Savidge, T.C.; Williams, K.C. The Brain-Gut- Microbiome Axis: What Role Does It Play in Autism Spectrum Disorder? Curr Dev Disord Rep 2016;3:75-81.
- Lydiard, R.B. Social Anxiety Disorder: Comorbidity and Its Implications. J. Of Clin. Psych. 2001; 62 (supp 1): 17-24.
- Lydiard R.B. Irritable bowel syndrome, anxiety, and depression: what are the links? J. Clin. Psychiatry 2001;62:38–45.
- Macfarlane, G.T.; Macfarlane, S. Human colonic microbiota: ecology, physiology and metabolic potential of intestinal bacteria. Scand J Gastroenterol Suppl 1997;222:3-9.
- Macfarlane, S.; Macfarlane, G.T. Proteolysis and amino acid fermentation. In: Gibson GR, Macfarlane GT, eds.: Human Colonic Bacteria: Role in Nutrition, Physiology, and Pathology. Boca Raton, FL: CRC Press; 1995:75-100.
- Macfarlane, G.T.; Blackett ,K.L.; Nakayama, T.; Steed, H.; Macfarlane, S. The gut microbiota in inflammatory bowel disease. Curr Pharm Design. 2009;15:1528–36. [CrossRef]
- McGregor, N.R.; Dunstan, R.H.; Zerbes, M.; Butt, H.L.; Roberts, T.K.; Klineberg, I.J. Preliminary determiantion of a molecular basis to chronic fatigue syndrome. Biochem Mol Med 57: 73-80, 1996. .
- Mackos, A.R.; Eubank, T.D.; Parry, N.M.; Bailey, M.T. Probiotic Lactobacillus reuteri attenuates the stressor-enhanced severity of Citrobacter rodentium infection. Infect Immun 2013, 81(9):3253–3263. . [CrossRef]
- Manichanh, C.; Rigottier-Gois, L.; Bonnaud, E.; et al. Reduced diversity of faecal microbiota in Crohn’s disease revealed by a metagenomic approach. GUT; 2006;55:205–11. [CrossRef]
- Marazziti, D.; et al. New development on the serotonin hypothesis of depression: shunt of tryptophan. Riv. Psichiatr. 2013; 48(1): 23-34.
- Marmar, C.R.; Weiss, D.S.; Schlenger, W.E.; Fairbank, J.A.; Jordan, B.K.; Kulka, R.A.; Hough, R.L. Peritraumatic dissociation and post-traumatic stress in male Vietnam theater veterans. American Journal of Psychiatry 1994, 151, 902-907.
- Marrama, P.; Angeli, A. Manuale di endocrinologia. 1992, ed. Masson.
- Matthew A.; Odenwald and Jerrold R. Turner. Intestinal permeability defects: Is it time to treat? Clin Gastroenterol Hepatol, 2013 September ; 11(9): 1075–1083.
- Mayer, E. The mind-gut connection. Ed. Harper Wave (2016).
- Mayer, E.A.; Craske, M.; Naliboff, B.D. Depression, anxiety, and the gastrointestinal system. J. Clin. Psychiatry 2001;62:28–36.
- Mayer, E.A.; Padua, D.; Tillisch, K. Altered brain-gut axis in autism: comorbidity or causative mechanisms? Bioessays 2014;36:933-999. .
- Mengchao Jin, Zhiyuan Qian, et al. The role of intestinal microbiota in cardiovascular disease. J Cell Mol Med 2019;23:2343-2350.
- Metchnikoff, E. The Prolongation of Life: Optimistic Studies. London: William Heinemann; 1907:161-183. . [CrossRef]
- Miller-Fleming, L.; Olin-Sandoval, V.; et al. Remaining mysteries of molecular biology: the role of polyamines in the cell. J.Mol.Biol. 2015; 427:3389-3406.
- Morgan, M.Y. The treatment of chronic hepatic encephalopathy. Hepatogastroenterology 1991;38:377-387.
- Muegge, B.D.; et al. Diet drives convergence in gut microbiome functions across mammalian phylogeny and within humans. Science. 2011; 332:970–974. [CrossRef]
- Murray, M.; Pizzorno, J. Encyclopedia of Natural Medicine. Rocklin, CA: Prima Publishing; 1998:143.
- Naseribafrouei, A.; Hestad, K.; Avershina, E.; et al. Correlation between the human fecal microbiota and depression. Neurogastroenterol Motil 2014;26:1155-1162. . [CrossRef]
- Nauta, W.J.H. The problem of the frontal lobe: A reinterpretation. J. Psychiatry Res 1971;8:167–187. [CrossRef]
- Ni, J.; Wu, G.D.; Albenberg, L.; Tomov, V.T. Gut microbiota and IBD: causation or correlation? Nat Rev Gastroenterol Hepatol, 2017 Oct;14(10): 573-584.
- Nord, C.E.; Heimdahl, A.; Kager, L. Antimicrobial agents and the human oropharyngeal and intestinal microflor. Ann Ist Super Sanita 1986;22:883-892.
- O’Hara, A.M.; Shanahan, F. The gut flora as a forgotten organ. EMBO Reports 2006, 7 688–693. [CrossRef]
- Othman, M.; Aguero, R.; Lin, H.C. Alteration in intestinal microbial flora and human disease. Curr Opin Gastroenterol., 2008 Jan.; 24(1): 11-6. [CrossRef]
- Packard Amy, E.B.; Egan Ann, E.; et al. HPA axis- interaction with behavioral system. Compr. Physiol.; May 2020; 6(4): 1897-1934.
- Pettenkofer von, M. The roles of inflammation, nutrient availability and the commensal microbiota in enteric pathogen infection. Microbiology Spectrum, 2015, 3(3):MBP-008-2014.
- Pimentel, M.; Lembo, A; Chey, W.D.; et al. TARGET Study Group. Rifaximin therapy for patients with irritable bowel syndrome without constipation. N Engl J Med 2011;364:22-32. [CrossRef]
- Porges, S.W. The pocket guide to the polyvagal theory. The transformative power of feeling safe. Norton and Company Inc, 2017.
- Price, J.L. Prefrontal cortical networks related to visceral function and mood. Ann. NY. Acad. Sci 1999;877:383–396. [CrossRef]
- Puri, B.K. Long-chain polyunsatured fatty acids and the pathophysiology of myalgic encephalomyelitis (Chronic Fatigue Syndrome). J Clin Pathol 2007;60:122-124. [CrossRef]
- Rapozo, C.M.; Bernardazzi, C.; Siffert-Pereira de Souza, H. Diet and microbiota in inflammatory bowel disease: The gut in disharmony. WJG, 2017 March 28; 23(12): 2124-2140. .
- Rhee, S.H.; Pothoulakis, C.; Mayer, E.A. Principles and clinical implications of the brain-gut-enteric microbiota axis. Nat Rev Gastroenterol Hepatol 2009;6:306-314. [CrossRef]
- Rigottier-Gois, L. Dysbiosis in inflammatory bowel disease: the oxygen Hypothesis. International Society for Microbial Ecology, (2013) 7, 1256-1261. [CrossRef]
- Rodriguez, L.A.G.; Ruigomez, A. Increased risk of irritable bowel syndrome after bacterial gastroenteritis: cohort study. BMJ, volume 318, 27 february 1999. [CrossRef]
- Rooks, M.G.; Garret, W.S. Gut microbiota, metabolites and host immunity. Nat Rev Immunol 2016 May 27; 16(6): 341-352. .
- Rossi-George, A.; Urbach, D.; Colas, D.; Goldfarb, Y.; Kusnecov, A.W. Neuronal, endocrine and anorexic responses to the T-cell superantigen staphylococcal enterotoxin A: Dependence on tumor-necrosis factor-α. J. Neurosci 2005;25:5314–5322. [CrossRef]
- Rothbaum, B.O.; Foa, E.B. Subtypes of posttraumatic stress disorder and duration of symptoms, in Posttraumatic Stress Disorder: DSM IV and beyond. Edited by Davidson J.R.T., Foa E.B., Washington, DC, American Psychiatric Press, 1993, 23-35. .
- Ruigomez, A.; et al. One-year follow up of newly diagnosed IBS patients. Aliment Pharmacol Ther 1999; 13: 1097-1102.
- Schreiber, O.; Petersson, J.; Phillipson, M.; Perry, M.; Roos, S.; Holm, L. Lactobacillus reuteri prevents colitis by reducing P-selectin-associated leukocyte- and platelet-endothelial cell interactions”, Am J Physiol Gastrointest Liver Physiol 2009, 296(3):G534–G542.
- Selye, H. The stress of Life. McGraw-Hill (1976).
- Selye, H. Stress in health and disease. Butterworths, 1976. [CrossRef]
- Selye ,H. Endocronology. 21/2, 169-1937.
- Shah, M.; Beuerlein, M.; Danayan, K. An approach to the patient with a life-threatening acid-base disturbance: The acidemias. University of Toronto Medical Journal 78: 122-128, 2001.
- Sheedy, J.R.; Wettenhall, R.; et al. Increased D-lactiic acid intestinal bacteria in patients with chronic fatigue syndrome. In Vivo 2009, 23:621-628.
- Simrén, M.; Barbara, G.; Flint, H.J.; et al. Rome Foundation Committee. Intestinal microbiota in functional bowel disorders: a Rome foundation report. Gut 2013;62:159-176. [CrossRef]
- Smith, T. A modification of the method for determining the production of indol by bacteria. J Exp Med (1897) 2, 543–547. [CrossRef]
- Sonali, S; Ray, B.; et al. Mechanistic insights into the link between gut dysbiosis and major depression: an extensive review. Cells (2022), 11, 1362. [CrossRef]
- Song, Y.; Liu, C.; Finegold, S.M. Real-time PCR quantitation of clostridia in feces of autistic children. Appl Environ Microbiol 2004;70:6459-6465. [CrossRef]
- Spiller, R.C. Role of nerves in enteric infection. Gut 2002;51:759–762. [CrossRef]
- Spiller, R.; Lam, C. An Update on Post-infectious Irritable Bowel Syndrome: Role of Genetics, Immune Activation, Serotonin and Altered Microbiome. J Neurogastroenterol Motil 2012;18:258-268.
- Stanghellini, V. Relationship between upper gastrointestinal symptoms and lifestyle, psychosocial factors and comorbidity in the general population: results from the Domestic/International Gastroenterology Surveillance Study (DIGEST)”, Scand J Gastroenterol Suppl. 1999;231:29-37.
- Stanghellini, V. Three-month prevalence rates of gastrointestinal symptoms and the influence of demographic factors: results from the Domestic/International Gastroenterology Surveillance Study (DIGEST). Scand J Gastroenterol Suppl. 1999;231:20-8. [CrossRef]
- Stanghellini. V. International comparative study of the prevalence and impact of gastrointestinal symptoms: an introduction. Scand J Gastroenterol Suppl. 1999;231:1-2. [CrossRef]
- Stead, R.H.; et al. Vagal influences over mast cells. Auton. Neurosci., 2006 Apr 30; 125(1-2): 53-61. Epub 2006 Feb 24. [CrossRef]
- Stefanko, D.P.; Barrett, R.M.; Ly, A.R.; Reolon, G.K.; Wood, M.A. Modulation of long-term memory for object recognition via HDAC inhibition. Proc Natl Acad Sci USA 2009;106:9447-9452. [CrossRef]
- Stilling, R.M.; Dinan, T.G.; Cryan, J.F. Microbial genes, brain and behaviour - epigenetic regulation of the gut-brain axis. Genes Brain Behav 2014;13:69-86.
- Sudo, N.; Chida, Y.; Aiba, Y.; et al. Postnatal microbial colonization programs the hypothalamic-pituitary-adrenal system for stress response in mice. J Physiol 2004;558:263-275. . [CrossRef]
- Teradaira, R.; et al. Mental stress-induced changes in plasma serotonin, tryptophan, kynurenine concentration in healthy partecipants. International Congress Series 2007, 1304:175-179. [CrossRef]
- Turnbaugh, P.J.; et al. The effect of diet on the human gut microbiome: a metagenomic analysis in humanized gnotobiotic mice. Sci Transl Med. 2009; 1:6ra14. [CrossRef]
- Turner, J.R. Intestinal mucosal barrier function in health and disease. Nature Reviews Immunology, nov. 2009, Vol.9: 799-899. [CrossRef]
- Uribe, A.; Alam, M.; Johansson, O.; Midtvedt, T.; Teodorsson, E. Microflora modulates endocrine cells in the gastrointestinal mucosa of the rat. Gastroenterology 1994;107: 1259-1269. [CrossRef]
- Uribarri, J.; Oh, M.S.; Carroll, H.J. D-lactic acidosis. A review of clinical presentation, biochemical features, and pathophysiologic mechanisms. Medicine (Baltimore) 77: 73-82, 1998.
- Van der Kolk, B.A.; McFarlane, A.C.; Weisaeth, L. Traumatic stressthe effect of overwhelming experience on mind, body and society. New York NY: Guilford Press, 1996.
- Van der Kolk, B.A.; Greenberg, M.S.; Pitman R.K. Endogenous opioids stress induced analgesia, and post-traumatic stress disorder. Psychopharmacology Bullettin (1989), 25, 417-421.
- Van der Kolk, B.A.; Fisler, R. Dissociation and the fragmentary nature of traumatic memories: overview and exploratory study. Journal of Traumatic Stress (1995), 8, 505-525. [CrossRef]
- Vecsey, C.G.; Hawk, J.D.; Lattal, K.M.; et al. Histone deacetylase inhibitors enhance memory and synaptic plasticity via CREB: CBP-dependent transcriptional activation. J Neurosci 2007;27:6128-6140. [CrossRef]
- Walderhaug; E.; et al. Interactive effects of sex and 5-HTTLPR on mood and impulsivity during tryptophan depletion in healthy people. Biological Psychiatry 2007; 62:593-599. [CrossRef]
- Walker, A.W.; et al. Dominant and diet-responsive groups of bacteria within the human colonic microbiota. ISME J. 2011; 5:220–230. [CrossRef]
- Weiss, G.A.; Hennet, T. Mechanism and consequences of intestinal dysbiosis. Cellular and Molecular Life Sciences, 74(16):2959-2977. [CrossRef]
- Wiener, N. Cybernetics or Control and Communication in the Animal and the Machine. 1948.
- Williams, R.M.; Berthoud, H.R.; Stead, R.H. Vagal afferent nerve fibres contact mast cells in rat small intestinal mucosa. Neuroimmunomodulation 1997;5:266–270. [CrossRef]
- Wostmann, E.; Bruckner-Kardoss, E. Development of cecal distention in germ-free baby rats. Am J Physiol 1959;197:1345-1346.
- Wu, G.D.; et al. Linking long-term dietary patterns with gut microbial enterotypes. Science. 2011; 334:105–108. [CrossRef]
- Wurtman, R.J.; et al. Effects of normal meals rich in carbohydrates or proteins on plasma tryptophan and tyrosine ratios. American Journal of Clinical Nutrition 2003, 77: 128-132. [CrossRef]
- Xiao, L.; Liu, Q.; et al. Gut microbiota metabolites in Irritable Bowel Syndrome. Front.Cell.Infect.Microbiol., Sep.2021;11:729346. [CrossRef]
- Yang, T.; Santisteban, M.M.; Rodriguez, V.; et al. Gut dysbiosis is linked to hypertension. Hypertension, 2015;65:1331-1340. [CrossRef]
- Zagon, A. Does the vagus nerve mediate the sixth sense? TINS 2001;24:671–673.




Disclaimer/Publisher’s Note: The statements, opinions and data contained in all publications are solely those of the individual author(s) and contributor(s) and not of MDPI and/or the editor(s). MDPI and/or the editor(s) disclaim responsibility for any injury to people or property resulting from any ideas, methods, instructions or products referred to in the content. |
© 2023 by the authors. Licensee MDPI, Basel, Switzerland. This article is an open access article distributed under the terms and conditions of the Creative Commons Attribution (CC BY) license (http://creativecommons.org/licenses/by/4.0/).


