1. Introduction
Oral squamous cell carcinoma (OSCC) accounts for the majority of head and neck cancers and is one of the most common cancers worldwide [
1]. Lymphatic metastasis, which is associated with poor patient prognosis, is common in advanced tumor stages [
2].
Tumor cell dissemination requires the activation of the epithelial-to-mesenchymal transition (EMT) process, which promote the loss of basal-apical polarity, break down tight and adhesive junctions, and allow the gain of motility in a mesenchymal spindle-like morphology. Physiologically, EMT occurs during development and wound healing [
3], but in tumor cells it is associated with invasiveness, and metastasis, and contributes to tumor cell plasticity [
4]. The EMT process provides tumor cells with a high degree of motility that facilitates their movement through the extracellular matrix (ECM), invasion into a lymphatic or blood vessel, and extravasation into a regional lymph node or distant tissue [
5]. Some of the disseminated tumor cells (DTCs) colonize a distant organ, where they are likely to remain dormant [
6].
The onset of metastasis occurs when DTCs overcome quiescent signals in the local microenvironment (e.g., TGFβ2, BMP4, BMP7) [
7], and revert to the epithelial phenotype by inducing the mesenchymal-to-epithelial transition (MET) program, which stimulates their proliferation, macro metastasis formation, and cancer recurrence [
5,
8]. Metastatic cells exhibit plasticity and can be found in transition states expressing different phenotypes at different stages of this process.
Connexins (Cxs) are a group of transmembrane proteins involved in gap junction (GJ) formation that allow the direct passage of small molecules (e.g., ions, second messengers, metabolites, microRNAs) and mediate intercellular communication (GJIC) [
9]. They can also mediate the transport of cytosolic molecules to the extracellular milieu and thus play a central role in cellular homeostasis, cell growth and development [
9]. Cx43 is the best-known human Cx protein [
10] and we have shown that it is an independent prognostic factor in OSCC [
11]. Cx43 expression can change during tumor progression. During EMT, tumor cells decrease their membrane-bound Cx43 expression to allow cell detachment and increase cell motility [
12], whereas during implantation and MET, they increase it to support tumor cell contacts via GJs [
13] with the endothelial barrier and surrounding cells of the TME [
14,
15]. Cxs and GJIC have both pro- and anti-proliferative effects, depending on the cell type and microenvironment, in part through the exchange of molecules such as ATP, cAMP, or specific miRNAs between tumor cells and TME cells [
16]. These functions may depend on tumor type, tumor stage, type of interacting cells, and subtype of the Cx molecule and their degree of expression [
17]. Intracellular Cx43 is also associated with microtubules, regulation of migration, and inhibition of apoptosis [18-20]. Overexpression of Cx43 in MDA-MB-231 breast cancer cells increases the expression of the epithelial markers E-cadherin and ZO-1, whereas knockdown of Cx43 leads to the appearance of the mesenchymal protein N-cadherin [
21], establishing a link between Cx43 expression and MET. However, the exact role of Cx43 in EMT and MET has not been conclusively determined [
22].
EMMPRIN/CD147 is a multifunctional transmembrane glycoprotein that mediates the interaction between tumor and stromal cells [
23]. EMMPRIN is overexpressed in more than 70% of human tumors and its expression correlates with higher tumor grade and stage, metastasis, and poor prognosis [
24]. EMMPRIN is best known for its pro-angiogenic activity as a trigger of VEGF and MMPs through homophilic interactions, and we have identified an epitope in the extracellular domain I that is responsible for both activities [
25]. EMMPRIN is also a chaperone of the lactate transporters MCT-1 and MCT-4, facilitating lactate efflux, which is critical for tumor cells that rely primarily on glycolysis. Increased extracellular lactate levels have been shown to upregulate mesenchymal markers such as vimentin and N-cadherin [
26], indirectly linking EMMPRIN to EMT. EMMPRIN also regulates hyaluronan synthesis and can bind to its receptor CD44, a known cellular stem cell biomarker that contributes to tumor cell invasiveness and chemoresistance [
27]. Taken together, these properties suggest that EMMPRIN is involved in tumor cell metabolism, survival, proliferation, invasiveness, metastasis, and angiogenesis, and likely promotes EMT [
28].
In the present study, we mapped the metastatic process from healthy oral mucosa (OM) towards solid lymph node metastasis (LNM) in OSCC. We evaluated the expression profiles of Cx43 and EMMPRIN together with the known EMT markers E-cadherin and vimentin by immunohistochemistry and assessed the prognostic significance of all marker proteins and the combined marker system.
2. Materials and Methods
2.1. Patients
Sample size was calculated using the StatMate software (version 2, GraphPad Software, Boston, USA). A sample size of 24 provides 95% power to detect a difference between means of 56.31 at a significance level (alpha) of .05 (two-tailed). Tumor tissue samples from 24 OSCC patients treated primarily surgically between 2016 and 2019 were used for immunohistochemical evaluation. Tumor stages T1 and T2 and tumor stages T3 and T4 were grouped for evaluation of baseline clinical characteristics. In addition, American Joint Commission on Cancer (AJCC) clinical stages I and II and AJCC stages III and IV were grouped together. For analysis of nodal status, patients were divided into lymph node positive and lymph node negative groups. The primary clinical endpoints were disease-free survival (DFS) and overall survival (OS). Patients provided written informed consent prior to enrollment. The study was conducted in accordance with the tenets of the Declaration of Helsinki and was reviewed and approved by a clinical ethics committee (vote no. 07/06/09, updated April 2018).
2.2. Tissue sample processing and semi-automated semiquantitative immunohistochemical analysis
Patients' tumor tissue samples were collected immediately after surgical resection, fixed in neutral buffered 4% formalin, and embedded in paraffin. Immunohistochemical staining was performed on 2-µm sections using a fully automated slide stainer (Agilent Technologies, Santa Clara, USA), as specified in
Table 1.
Tissue slides were digitized using a Motic EasyScan One slide scanner (Motic, Hong Kong, China) at 20× magnification and 0.5 μm/pixel resolution. The open-source image analysis software quPath was used for semi-automated semiquantitative immunohistochemical evaluation [
29]. To map the entire metastatic process, tissue samples from primary tumors (with adherent healthy oral mucosa) and corresponding local cervical lymph node metastases (LNM), if present, were analyzed for each patient. Different regions of interest (ROI) were digitally defined as shown in
Figure 2,
Figure 3,
Figure 4, and
Figure 5. For OSCC tissue samples, three ROIs were defined in the adjacent healthy mucosa, three ROIs in the center of the primary OSCC, and three ROIs at the invasive front (IF). In LNM, three ROIs were distributed over the entire metastasis. All ROIs were defined to be approximately 1 cm
2 in size.
The quPath cell detection algorithm was performed within all ROIs. The software was trained to distinguish between tumor and stromal cells. This training was performed three times to increase accuracy using an artificial intelligence (AI) function. The immunohistochemically labeled marker proteins (Cx43, EMMPRIN, E-cadherin, and vimentin) were then semi-automatically scored based on the percentage of positively stained tumor cells and signal intensity using the software's default settings. The histoscore (H-score) was calculated by adding 3x the percentage of strongly stained tumor cells, 2x the percentage of moderately stained tumor cells, and 1x the percentage of weakly stained tumor cells, resulting in scores ranging from 0 (all tumor cells negative) to 300 (all tumor cells strongly positive).
2.3. Statistical analysis
Patient clinical data were summarized as absolute and relative frequencies or mean ± standard deviation (SD) and median (minimum; maximum), as appropriate. The time-to-event variables, disease-free survival (DFS) and overall survival (OS), were summarized by estimated median time-to-event with 95% confidence interval. Expression differences (Δ) were calculated as an indication of protein expression dynamics between different ROIs. For each protein, all pairwise expression differences between ROIs were estimated and tested using pairwise contrast tests on linear mixed effects models modeling expression by ROI. The resulting estimates are reported with 95% confidence intervals and Tukey adjusted P-values. A full linear mixed effect model for protein abundance was fitted with protein, tissue, and their interactions as predictors. Based on this model, the expected marginal means of the differences between 'neighboring' ROIs were estimated. Contrast tests were used to compare each of these differences between all pairs of proteins, and the resulting Holm adjusted P-values are reported alongside the expected marginal effects with their 95% confidence intervals. Univariable Cox proportional hazards regression models were used to test both clinical and protein expression data for potential association with DFS and OS. Each model was compared to the null model using likelihood ratio tests. For each survival type (DFS and OS), a multivariable Cox regression model was fitted using protein expression data only. For all proteins, the ROI/ROI difference with the best univariate association with survival (as assessed by the p-value from the likelihood ratio tests) was selected. Due to the small sample size, only the top three markers were selected. The resulting model coefficients were reported as hazard ratios (HR) with 95% confidence interval and associated P value. To visualize the effect, the model predictions were binarized at the maximally selected rank statistic and Kaplan-Meier curves were plotted in the resulting subgroups and compared using log-rank tests. The significance level was set at α = 5% for all statistical tests. All analyses were performed with the statistic software R (version 4.1.2; R Core Team 2021) [
30] using the R-package lme4 (version 1.1.28) [
31] for the mixed effect regression models and emmeans (version 1.7.2) [
32] for the expected marginal effects and contrast tests.
3. Results
3.1. Patients’ clinical baseline characteristics
The patient population consisted of 14 male and 10 female OSCC patients ranging in age from 55 to 81 years. OSCC was diagnosed in various regions of the oral cavity (floor of the mouth, buccal mucosa, gingiva, inside of the lips, palate, and tongue). 11 patients had an AJCC stage equal to or less than 2, while 13 patients had an AJCC stage greater than 2. Median overall survival was 3.5 years and median disease-free survival was 10.5 months. The baseline clinical characteristics of all patients are shown in
Table 2.
3.2. Marker protein expression in different regions of interest (ROI)
Semi-quantitative immunohistochemical analysis, depicted in
Figure 2,
Figure 3,
Figure 4 and
Figure 5 and summarized in
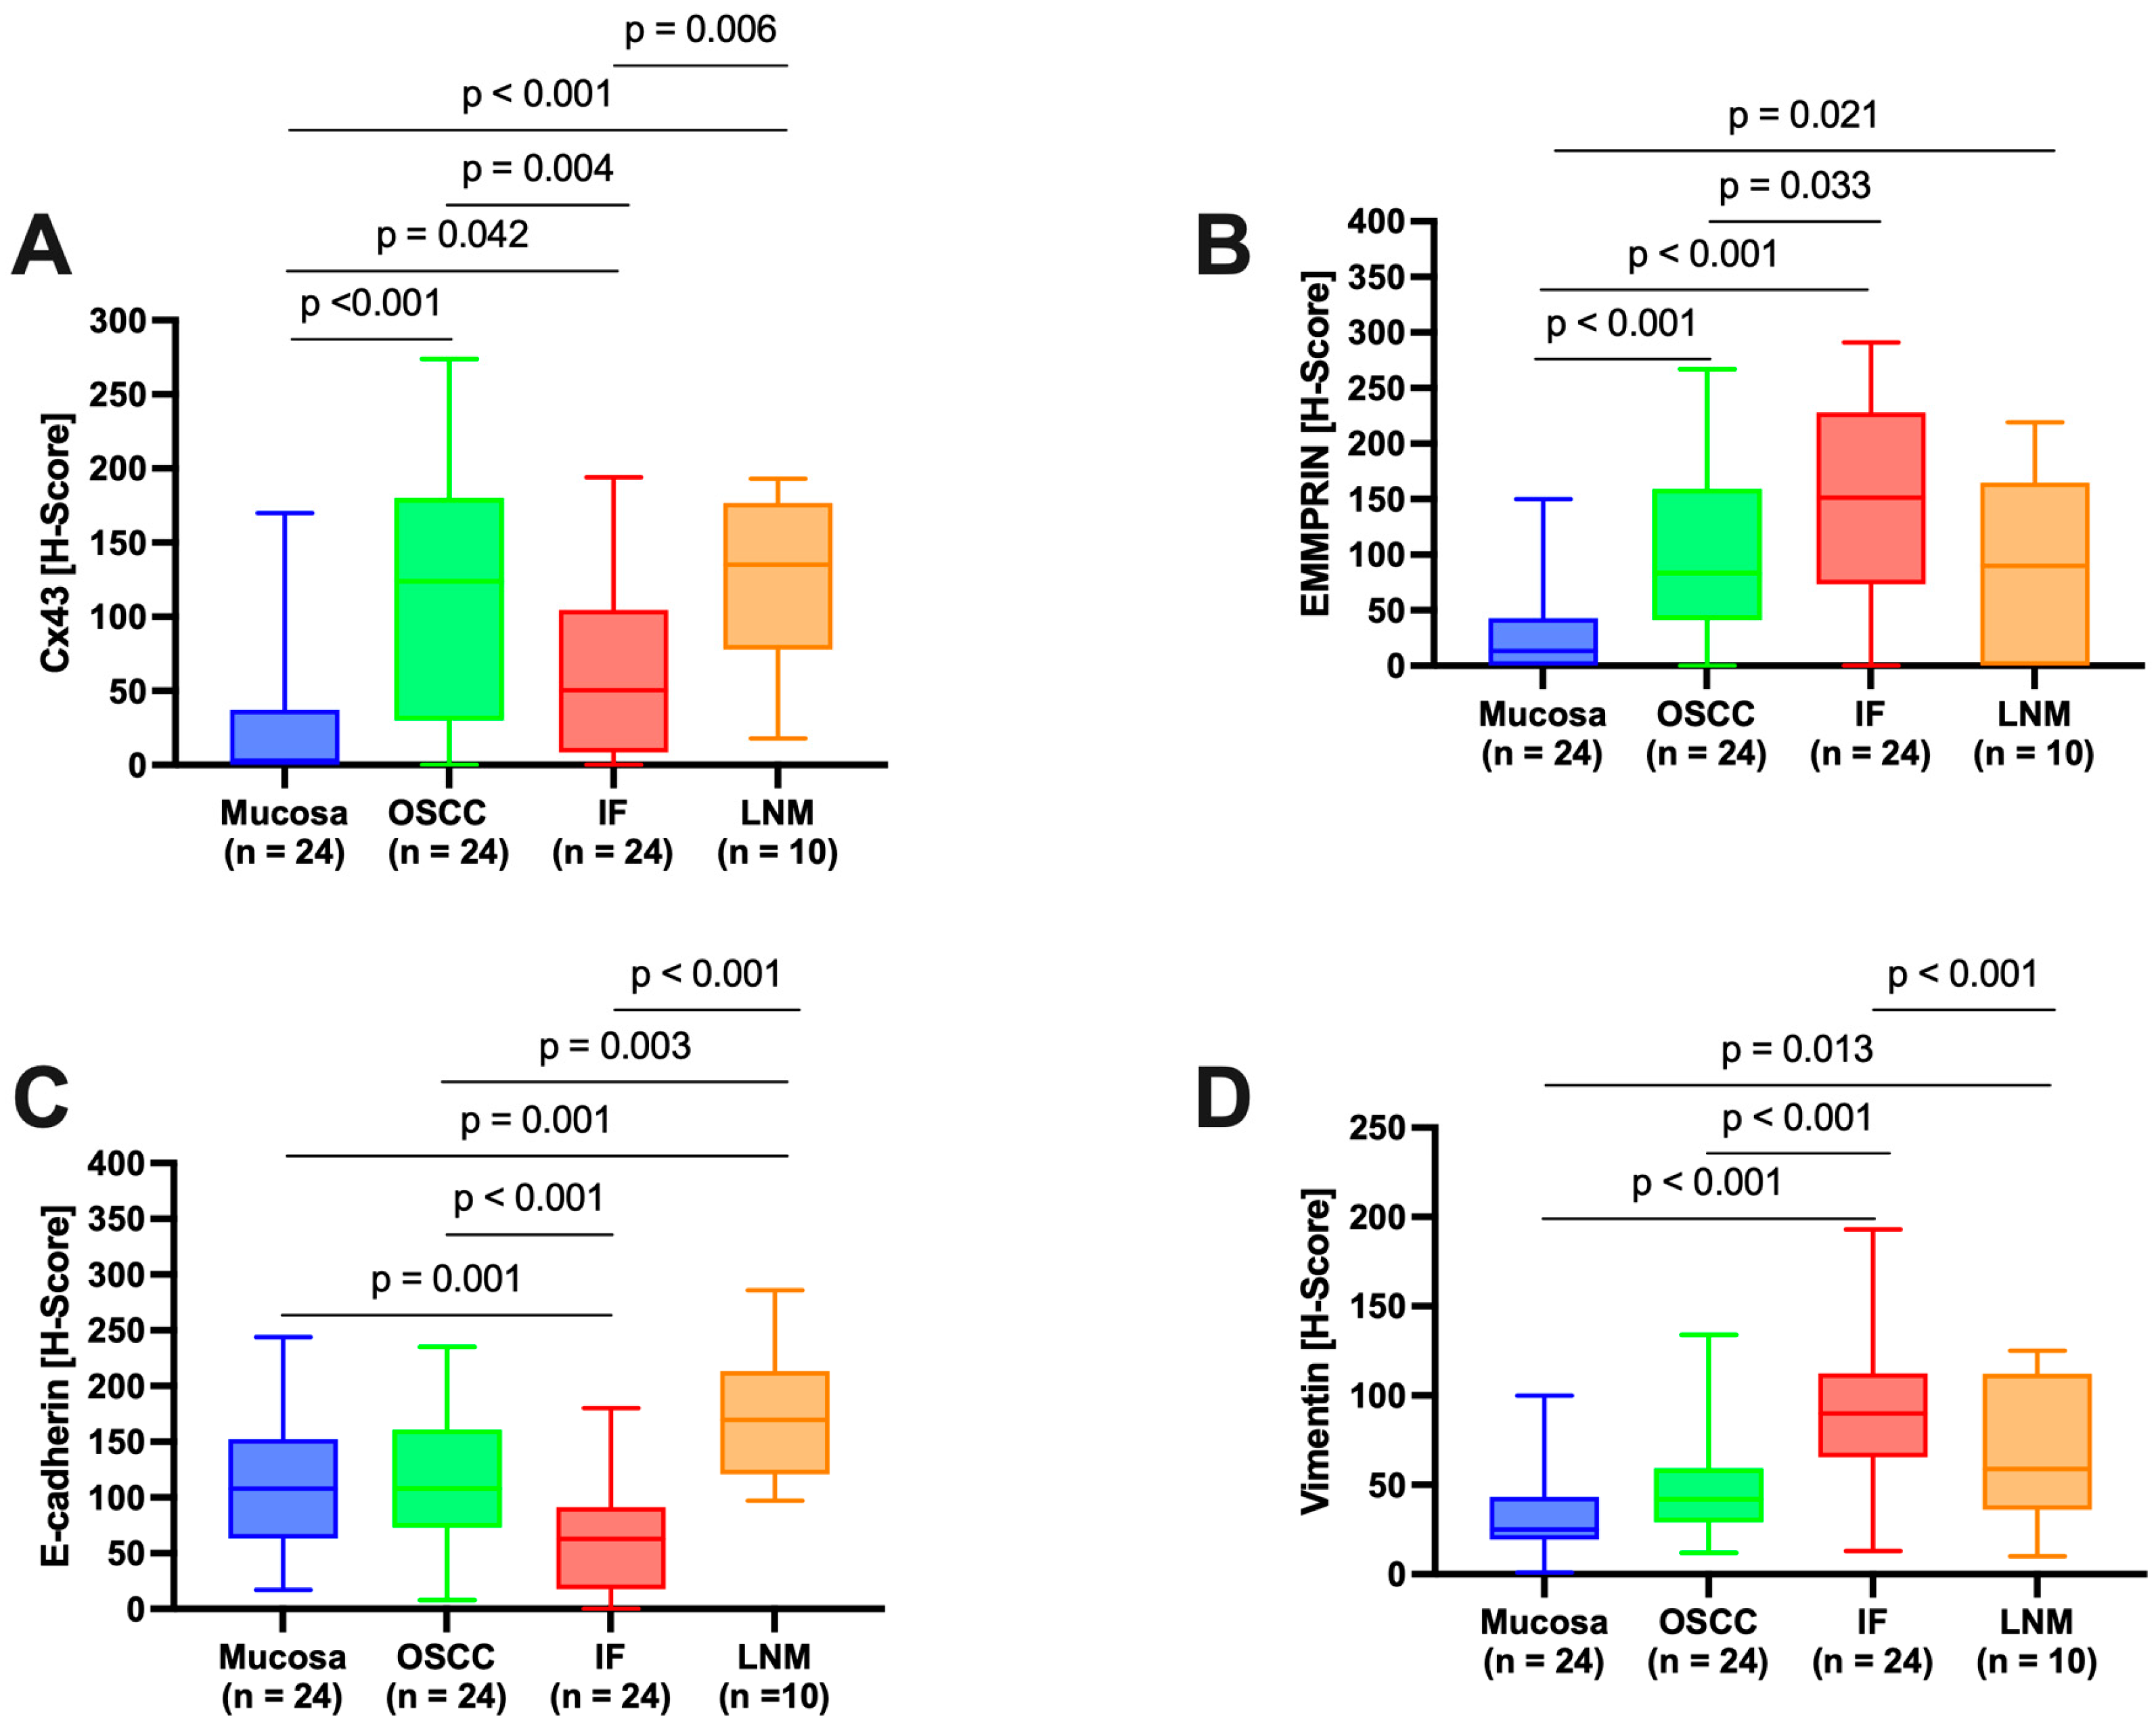
Figure 1, revealed differential expression profiles of the various marker proteins. Interestingly, Cx43 and E-cadherin displayed similar patterns of expression, and likewise, EMMPRIN and vimentin displayed similar patterns of expression.
3.2.1. Connexin 43 (Cx43)
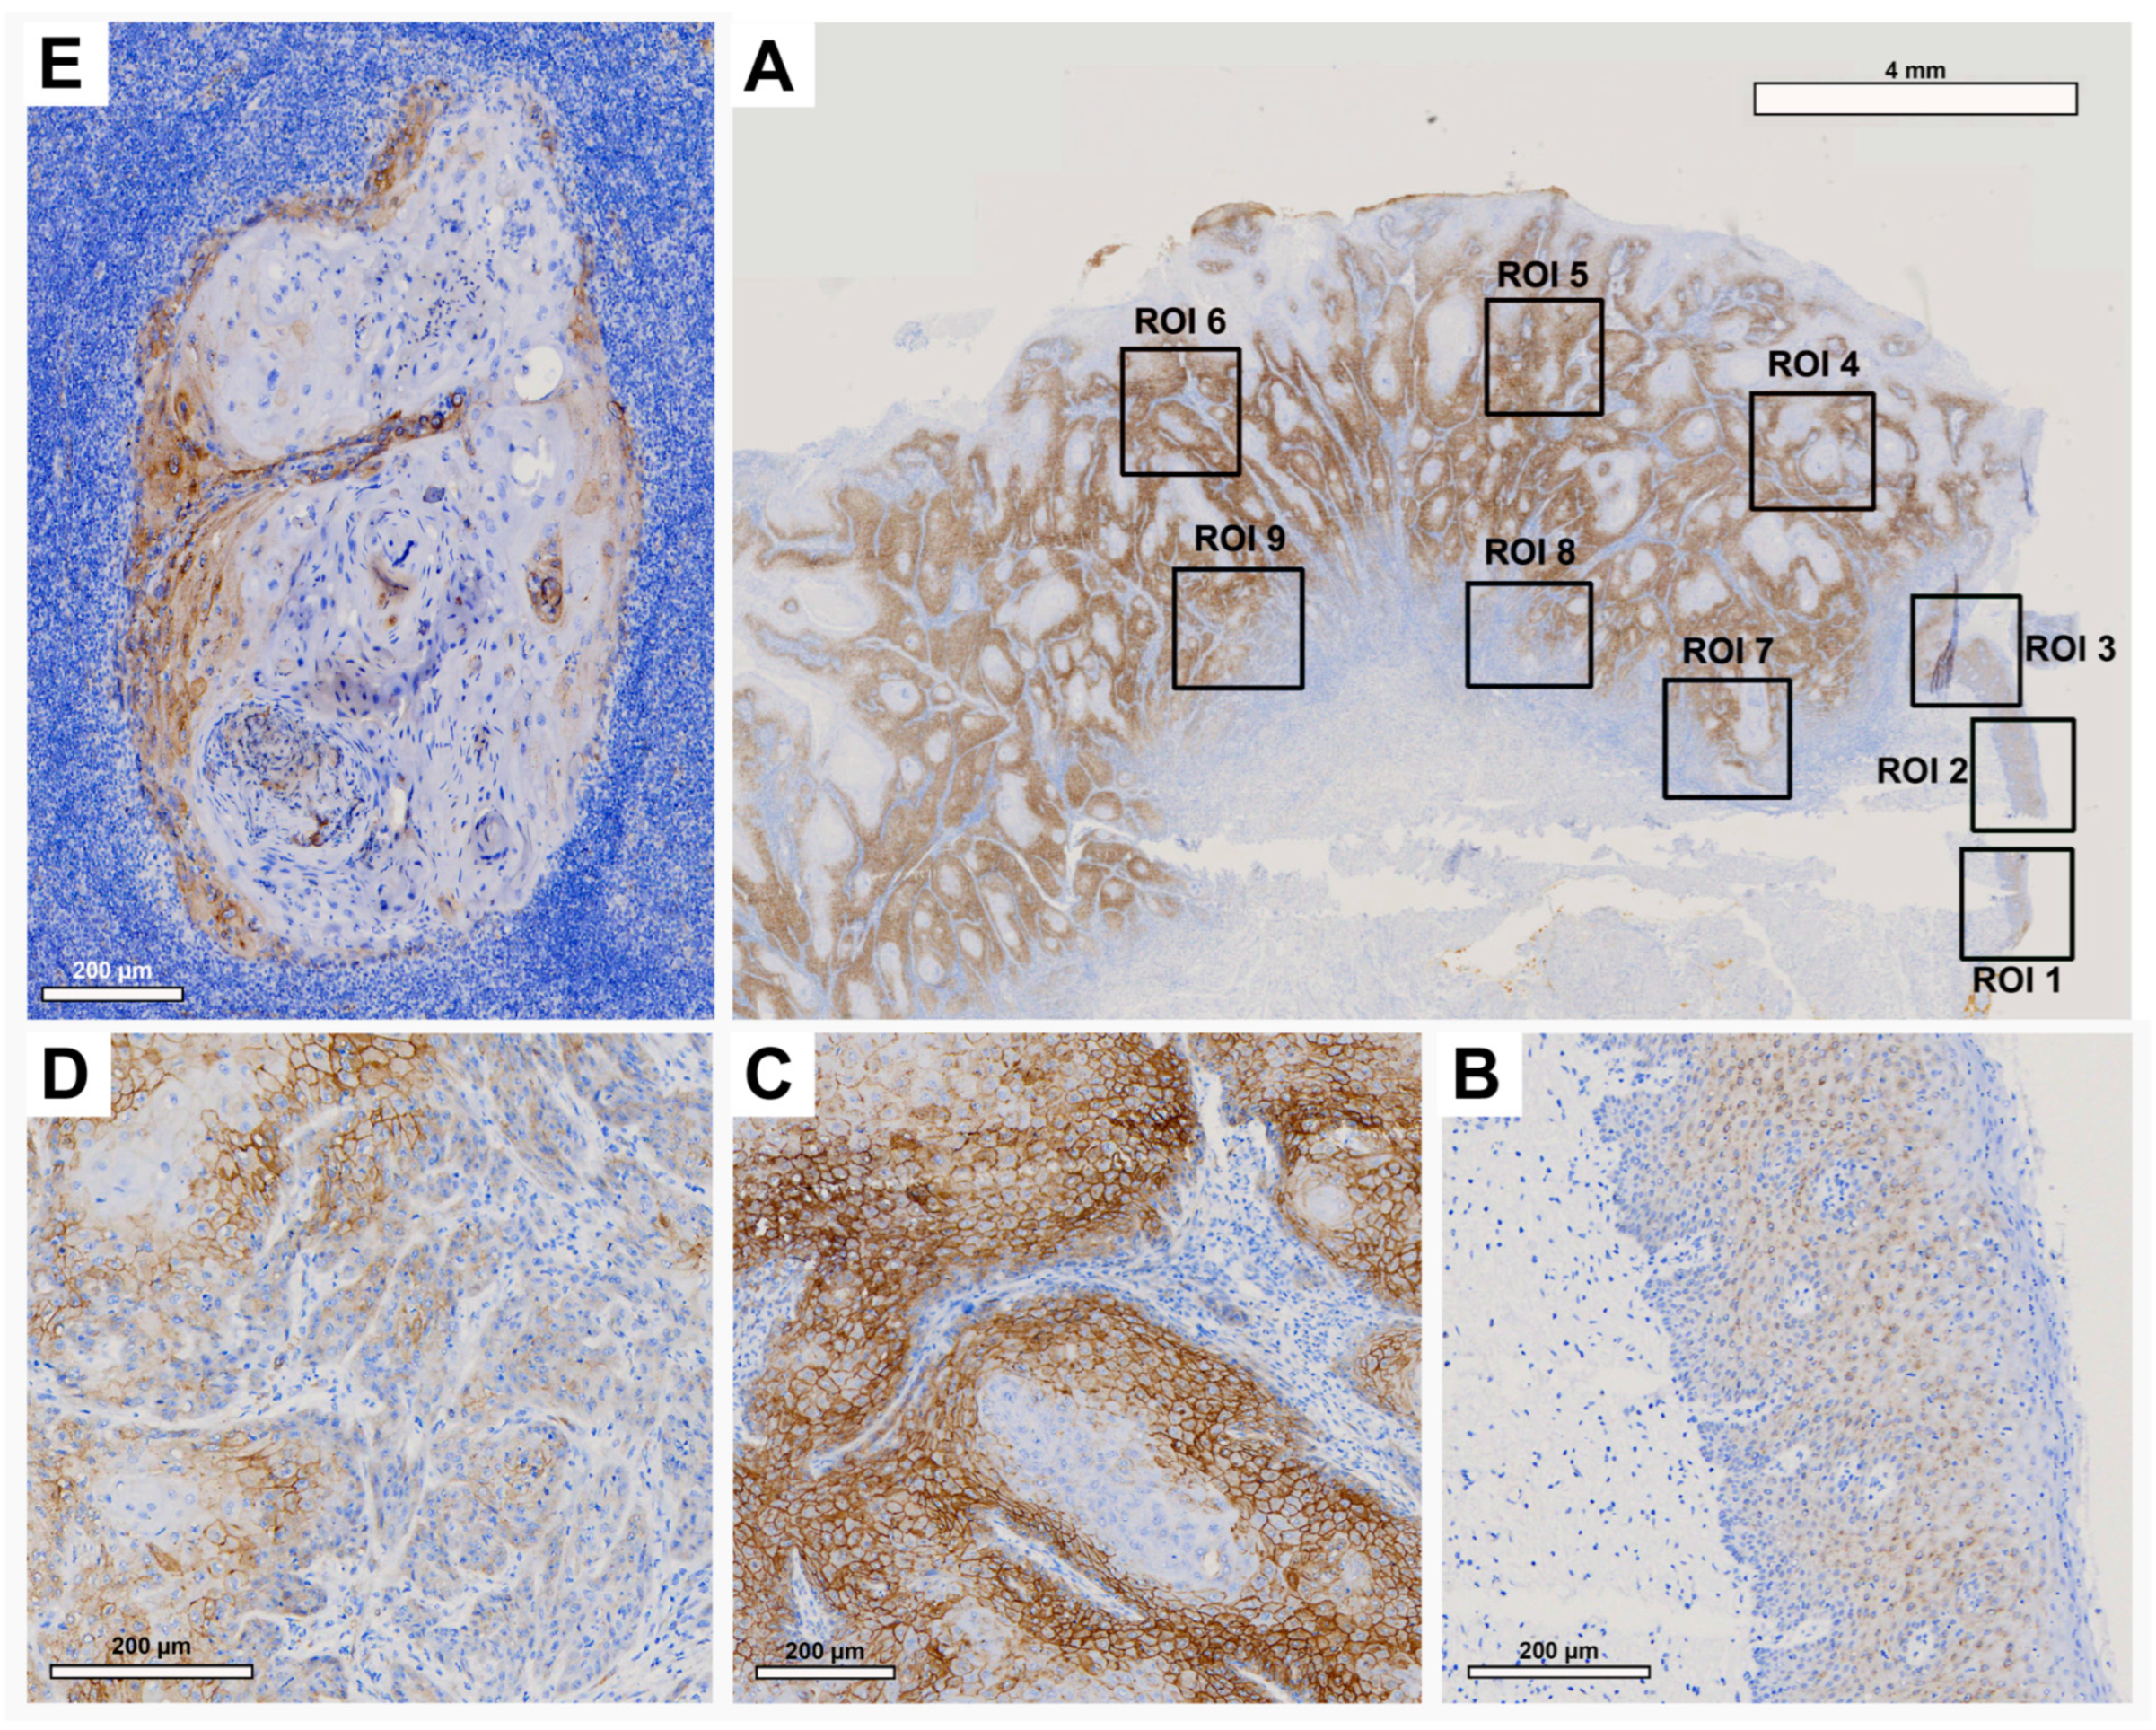
Histological evaluation in each ROI showed low Cx43 expression in the healthy OM (
Figure 2A, ROI 1-3 and
Figure 2B). There was an increase in Cx43 in the center of the primary OSCC (
Figure 2A, ROI 4-6 and
Figure 2C) and a decrease in the IF (
Figure 2A, ROI 7-9 and
Figure 2D). In the corresponding LNM, an increase in Cx43 expression was observed, mainly in the outer regions of tumor cell growth (
Figure 2E).
Pairwise contrast tests of H-score values confirmed a significant increase in Cx43 expression from the OM towards the center of the primary OSCC (p<0.001) and a decrease from the center of the primary OSCC towards the IF (p=0.004). A significant increase in Cx43 expression was observed in the LNM compared to the IF (p=0.006,
Figure 1A). Cx43 expression in LNM was comparable to that in the center of primary OSCC.
Figure 2.
Representative illustration of immunohistochemical evaluation in primary OSCC tissue sample and corresponding lymph node metastasis (LNM) based on Cx43 staining. (A) Overview of primary OSCC with individual ROIs. The upper right corner shows the transition to adjacent healthy oral mucosa (ROI 1-3). (B) Enlarged view of ROI 2 (OM), (C) ROI 6 = primary OSCC, and (D) ROI 9 = invasive front (IF). (E) Enlarged view of LNM. Scale bar, 4 mm and 200 μm.
3.2.2. EMMPRIN
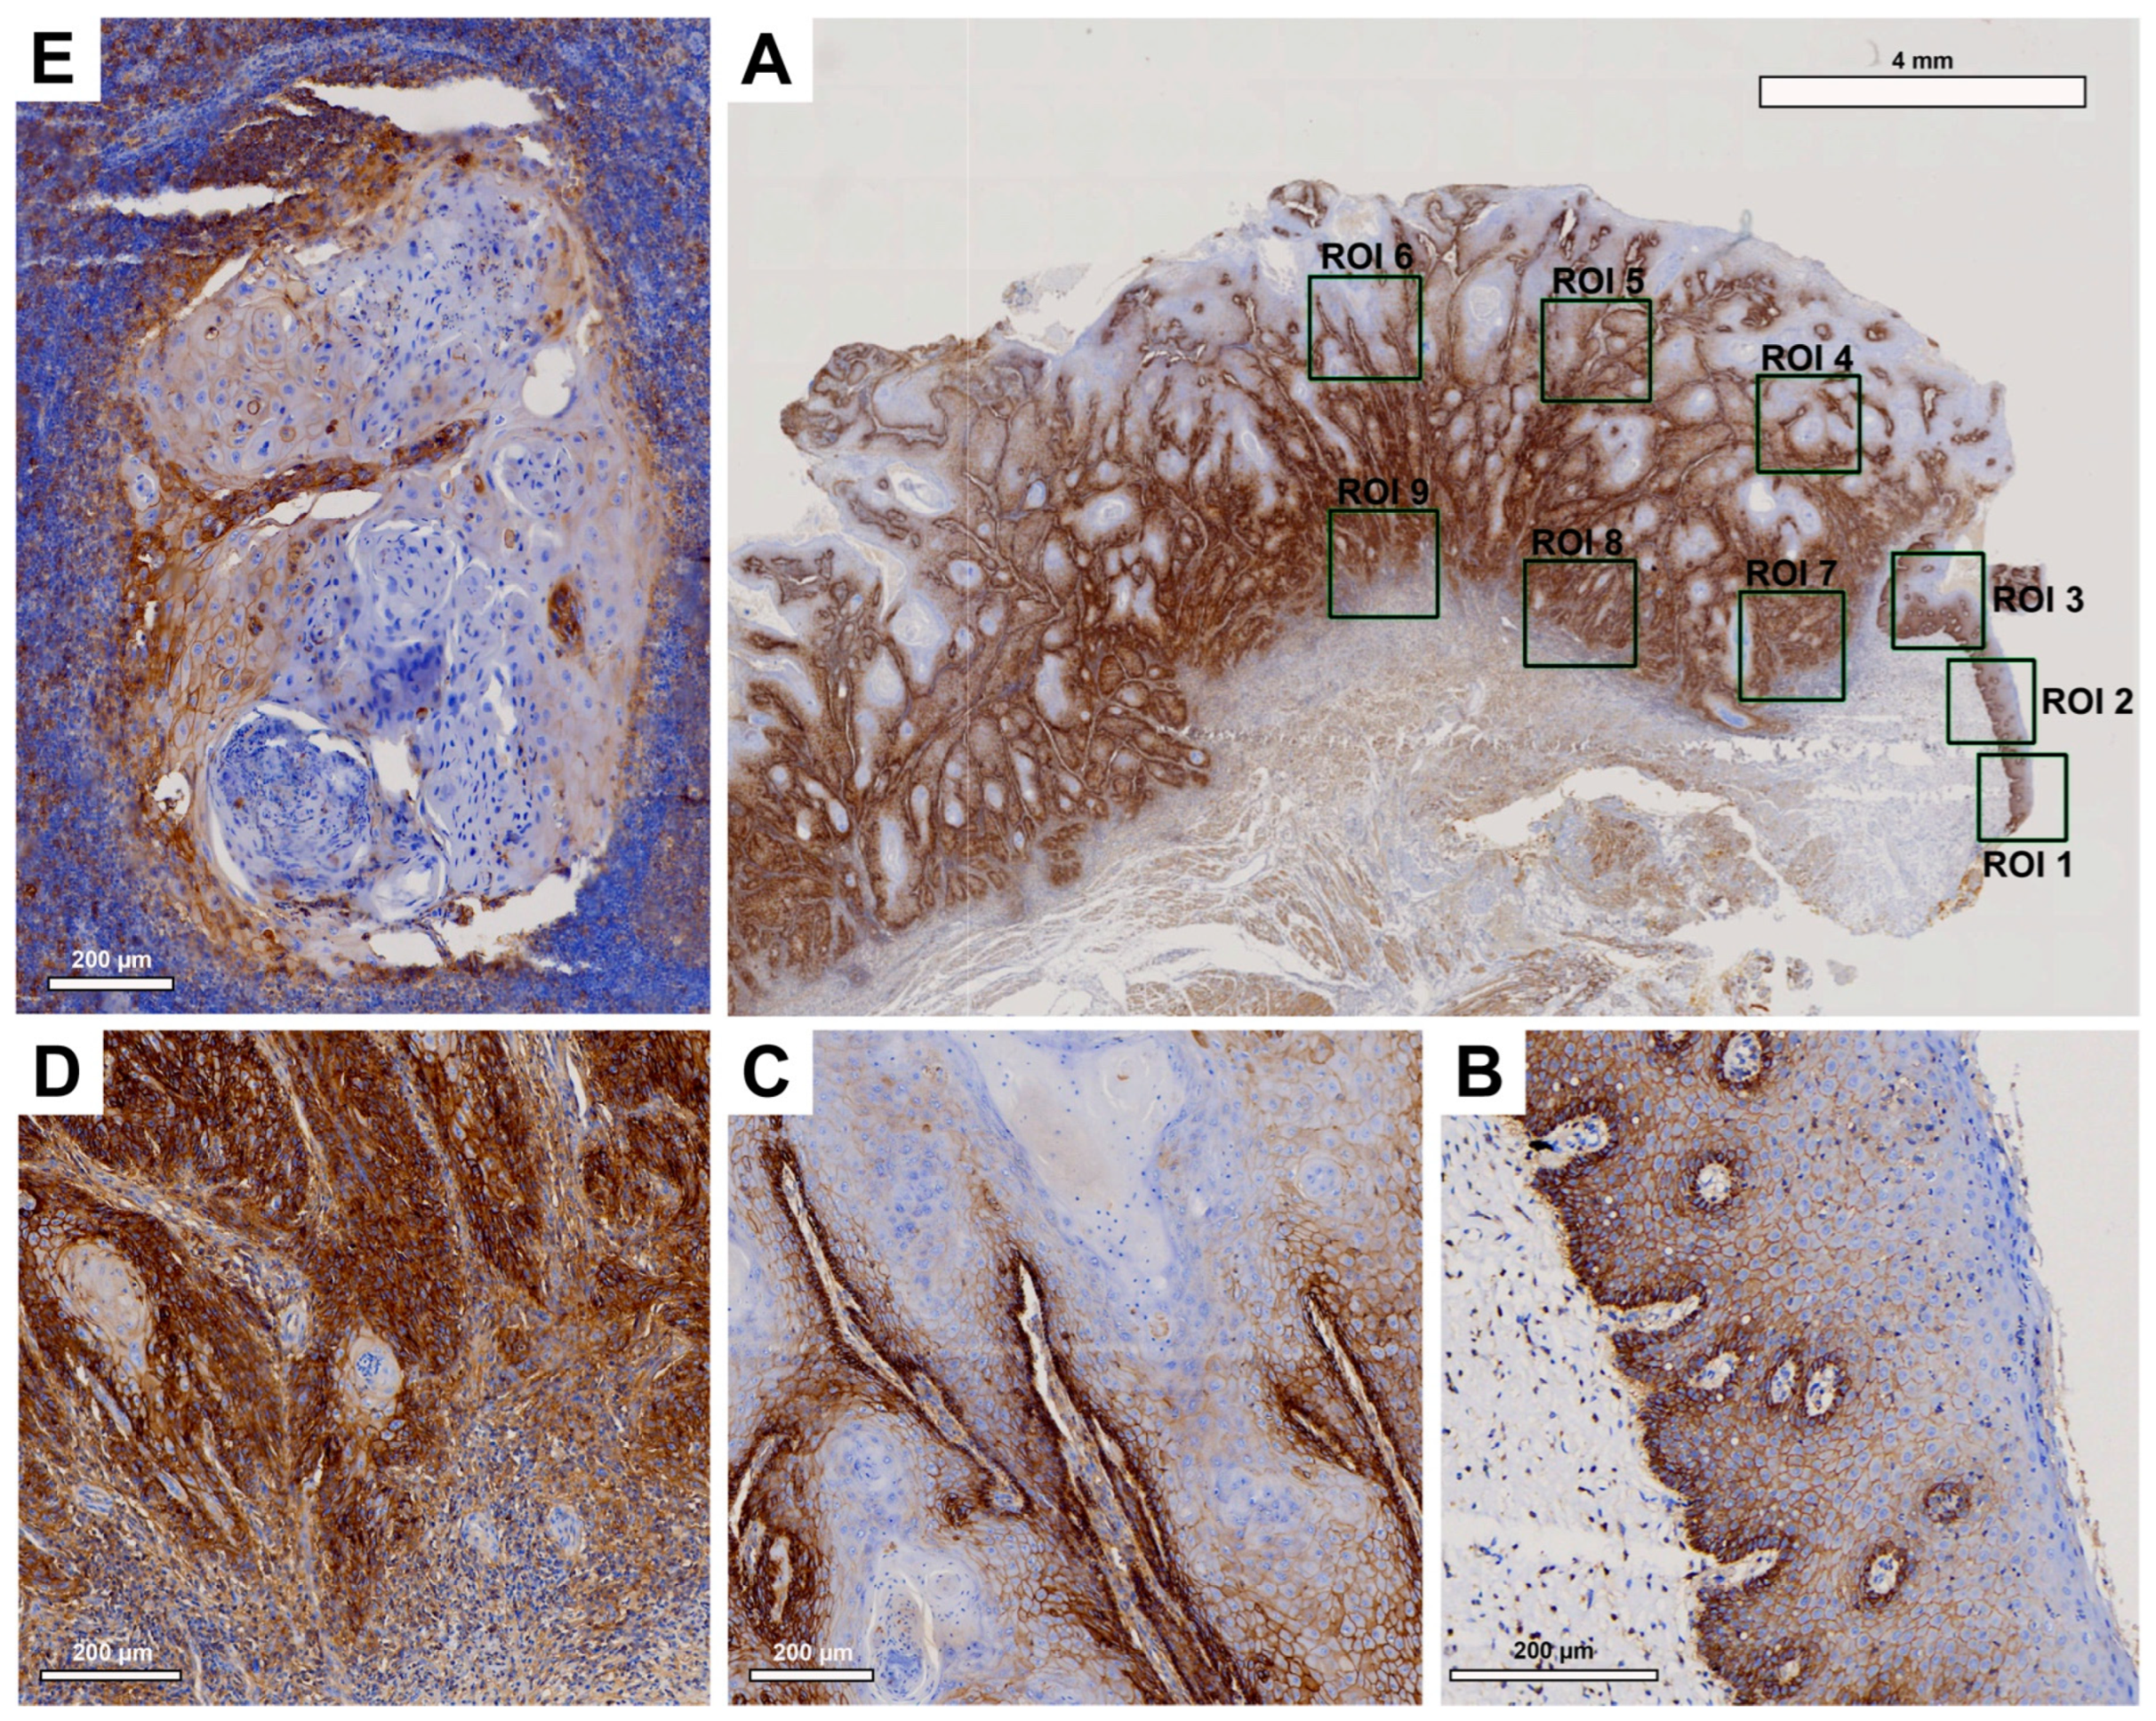
Histological evaluation revealed strong EMMPRIN expression in patient tissue samples (
Figure 3). While in healthy OM EMMPRIN was most abundant in the lower epithelial layers approaching the basement membrane (
Figure 3B), an increase in EMMPRIN expression was observed in the center of primary OSCC (
Figure 3C), which was particularly pronounced toward the IF (
Figure 3D). In contrast, lower EMMPRIN expression was observed in the corresponding LNM (
Figure 3E).
Pairwise contrast tests of EMMPRIN expression within the different ROIs revealed a significant increase in the expression profile from the healthy OM to the center of the primary OSCC (p<0.001) and a further significant increase towards the IF (p=0.033). In contrast, EMMPRIN expression in the LNM decreased again, but not significantly compared to the IF (p=0.122), reaching levels similar to the center of primary OSCC.
Figure 3.
Representative illustration of immunohistochemical evaluation in primary OSCC tissue sample and corresponding lymph node metastasis (LNM) based on EMMPRIN staining. (A) Overview of primary OSCC with individual ROIs. The upper right corner shows the transition to adjacent healthy oral mucosa (ROI 1-3). (B) Enlarged view of ROI 2 (OM), (C) ROI 6 = primary OSCC, and (D) ROI 9 = invasive front (IF). (E) Enlarged view of LNM. Scale bar, 4 mm.
3.2.3. E-cadherin
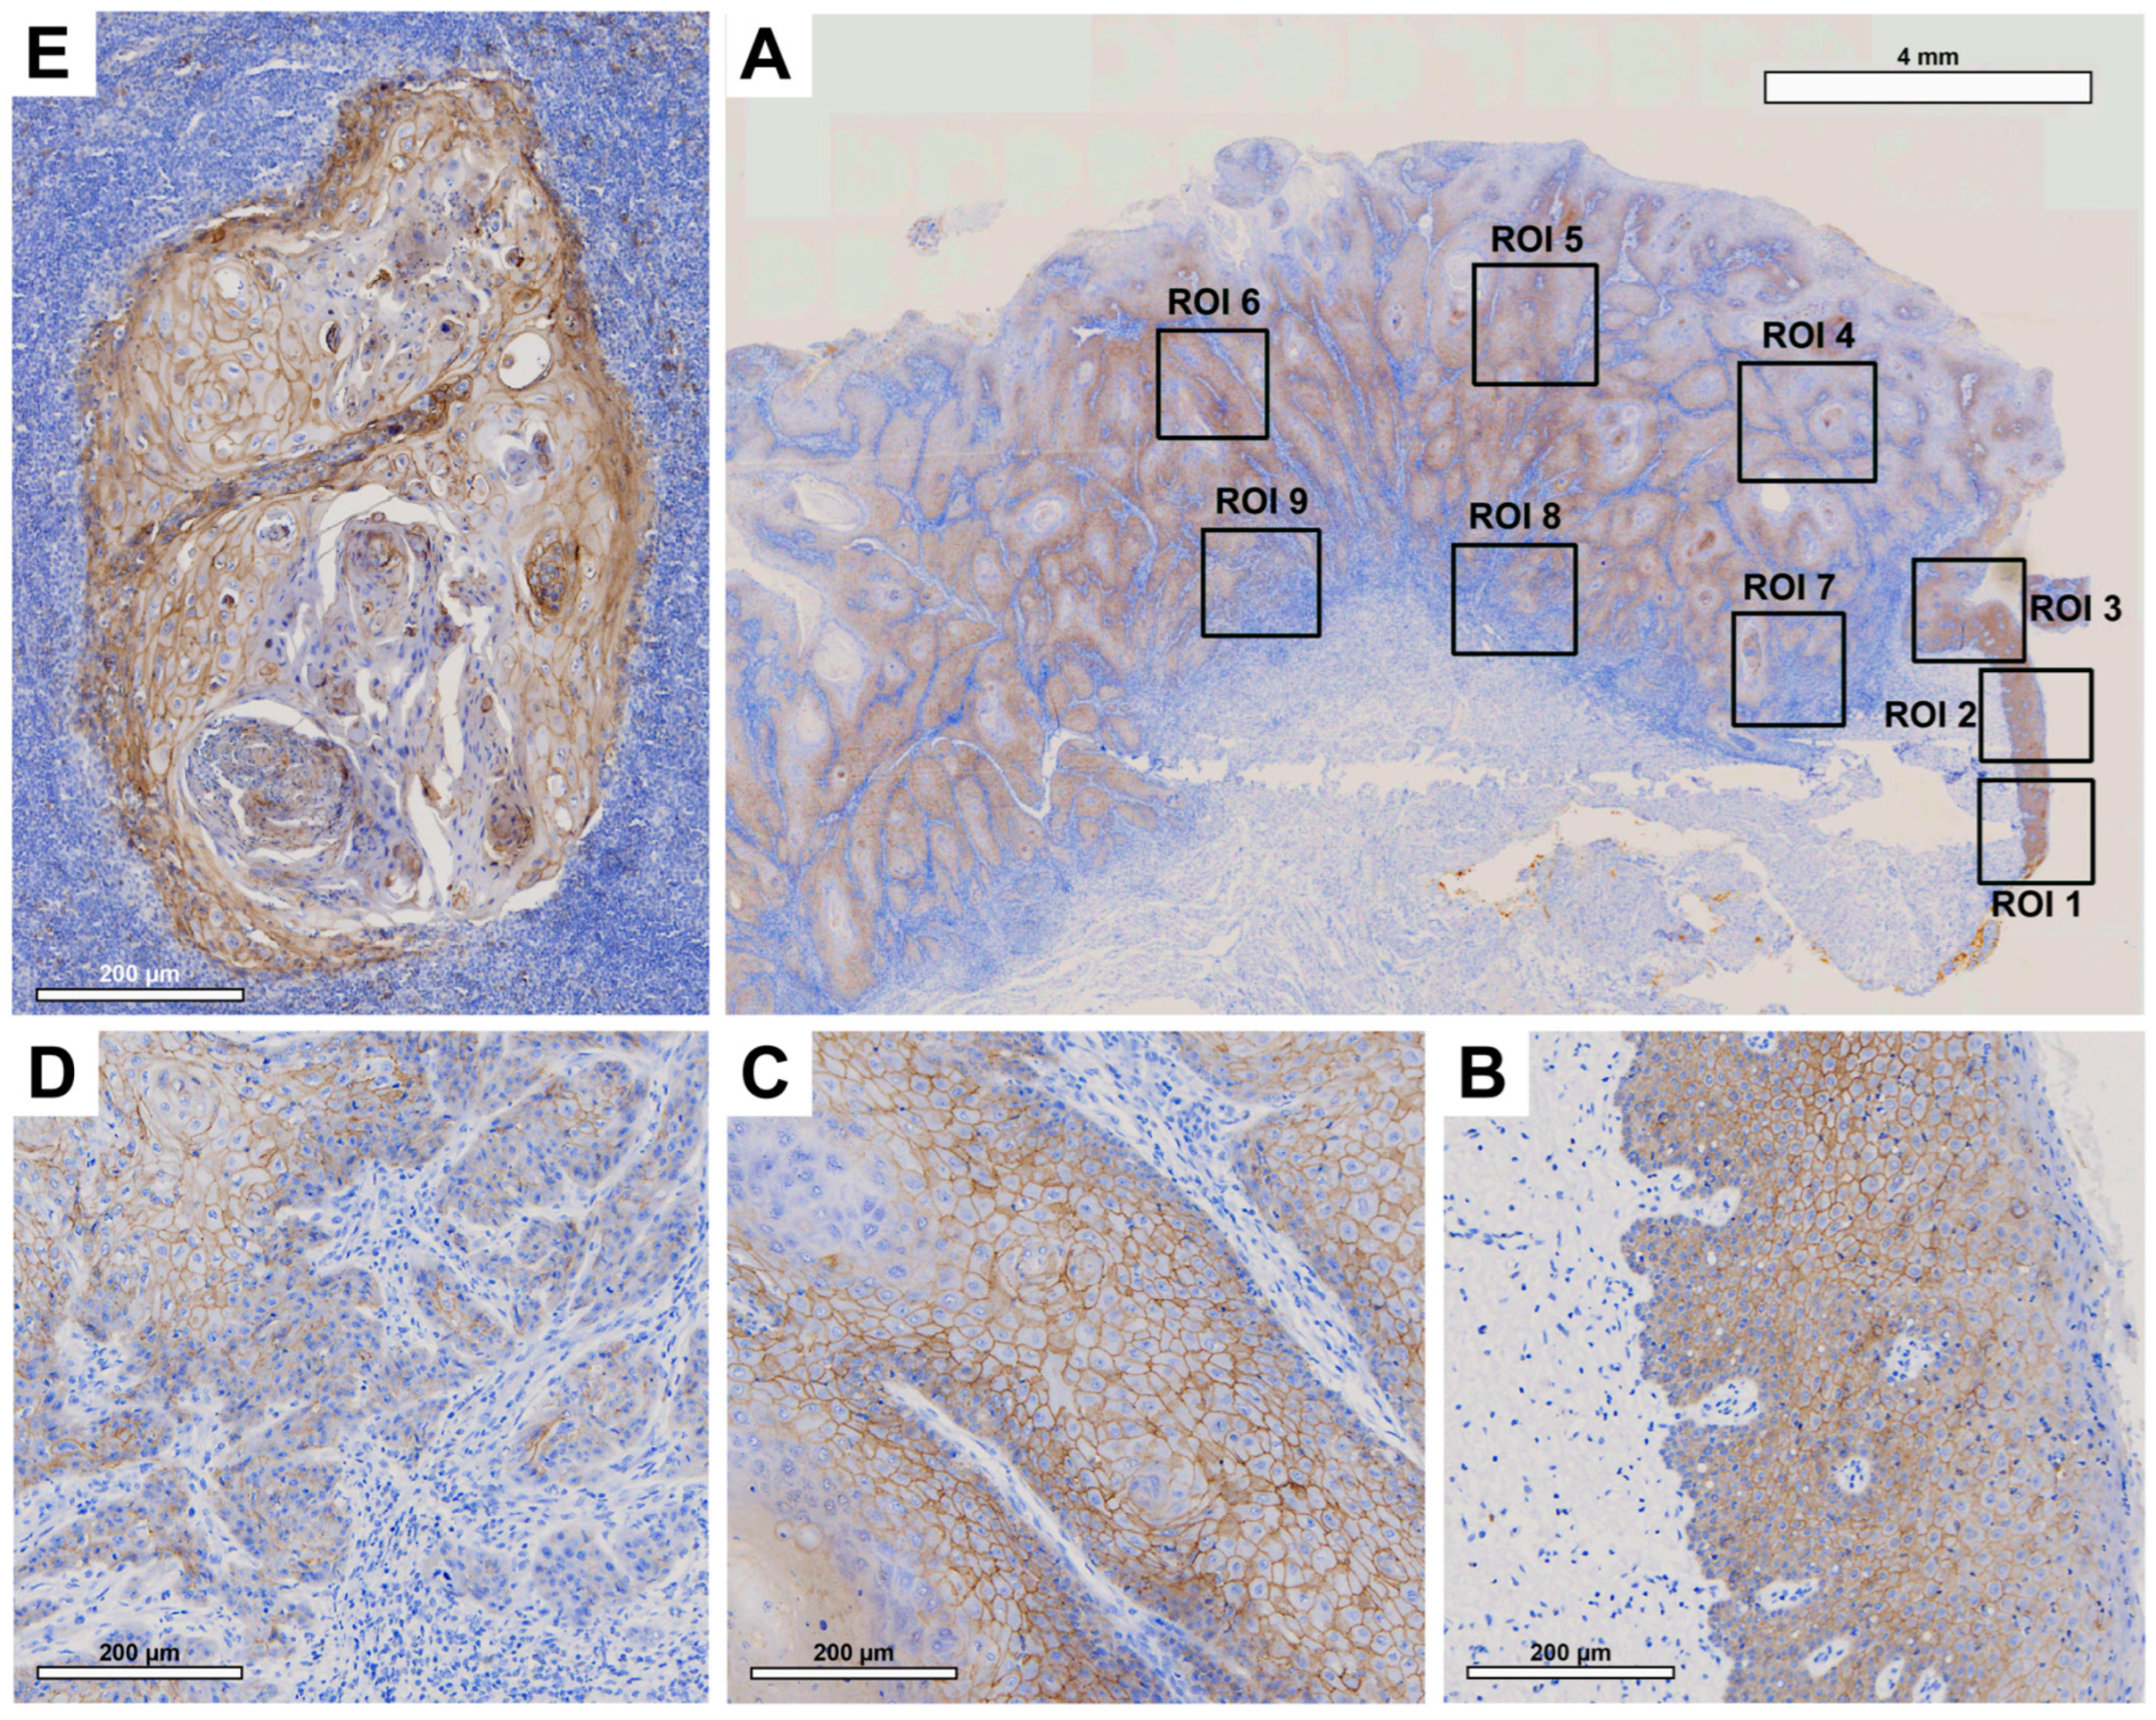
Histologically, patient tissue samples showed comparable membranous E-cadherin expression in the OM and in the center of the primary OSCC (
Figure 4B and C). This decreased significantly towards the IF (
Figure 4D). In the corresponding LNM, E-cadherin expression was again increased (
Figure 4E), reaching levels higher than the OM or the center of primary OSCC.
No significant difference was observed between E-cadherin expression in the healthy OM and the center of the primary OSCC (p=0.980). A significant decrease in E-cadherin expression was observed between the center of primary OSCC and IF (p<0.001). Additionally, a significant increase in E-cadherin expression was observed in LNM compared to IF (p<0.001) and the center of OSCC (p=0.003).
Figure 4.
Representative illustration of immunohistochemical evaluation in primary OSCC tissue sample and corresponding lymph node metastasis (LNM) based on E-cadherin staining. (A) Overview of primary OSCC with individual ROIs. The upper right corner shows the transition to adjacent healthy oral mucosa (ROI 1-3). (B) Enlarged view of ROI 2 (OM), (C) ROI 6 = primary OSCC, and (D) ROI 9 = invasive front (IF). (E) Enlarged view of LNM. Scale bar, 4 mm.
3.2.4. Vimentin
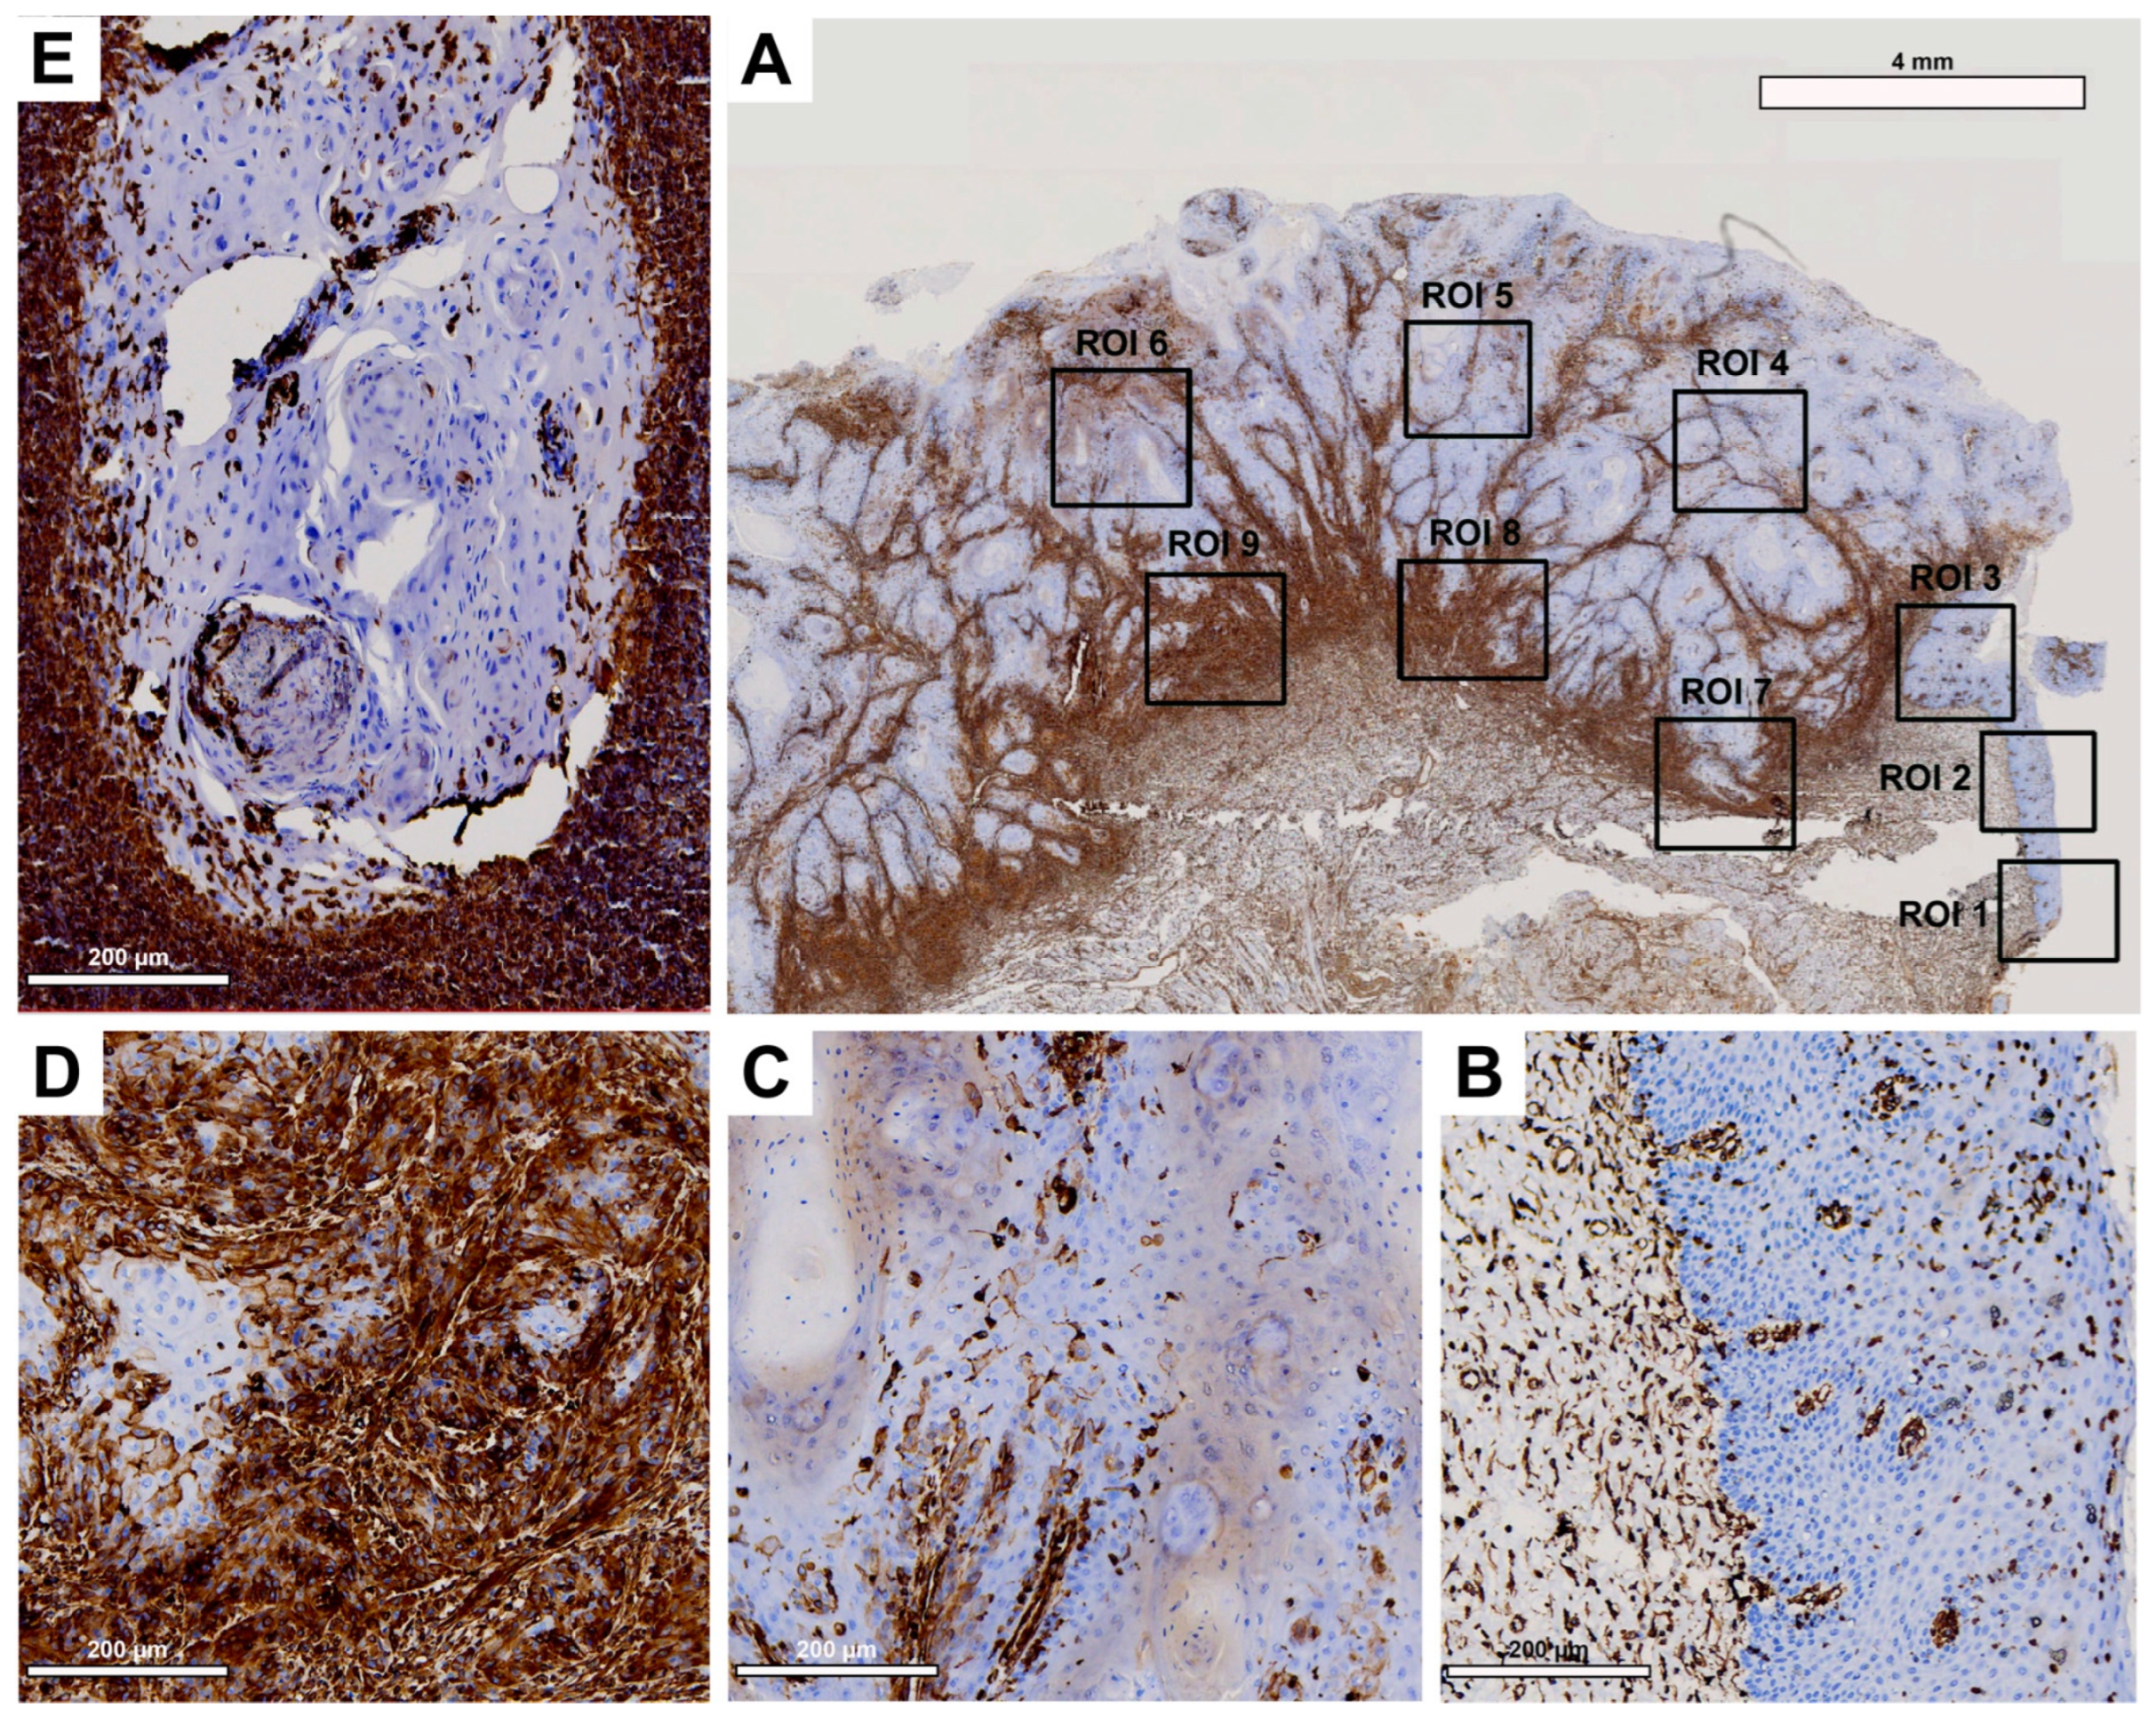
Histological evaluation revealed low vimentin expression in the healthy OM (
Figure 5B) and a small increase in the center of the primary OSCC (
Figure 5C), but a strong increase toward the IF (
Figure 5D). In the corresponding LNM, a decrease in vimentin expression was detected, mainly localized at the junction with the surrounding tissue (
Figure 5E), which was still higher than in the center of primary OSCC.
While evaluation of H-score values revealed no significant difference between healthy OM and the center of primary OSCC (p=0.222), a significant increase in vimentin expression was observed between the center of primary OSCC and IF (p<0.001). In LNM, vimentin expression was decreased compared to IF, but this difference was not significant (p=0.061).
Figure 5.
Representative illustration of immunohistochemical evaluation in primary OSCC tissue sample and corresponding lymph node metastasis (LNM) based on vimentin staining. (A) Overview of primary OSCC with individual ROIs. The upper right corner shows the transition to adjacent healthy oral mucosa (ROI 1-3). (B) Enlarged view of ROI 2 (OM), (C) ROI 6 = primary OSCC, and (D) ROI 9 = invasive front (IF). (E) Enlarged view of LNM. Scale bar, 4 mm.
3.3. Analysis for independent marker protein express
Analysis of independent protein expression profiles of the four marker proteins revealed no significant differences between the expression of EMMPRIN and vimentin (all p values > 0.05) across all ROIs. However, significant differences in the expression of Cx43 and E-cadherin were found between the healthy oral mucosa and the center of the primary OSCC (p = 0.005) and between the oral mucosa and the IF (p = 0.002;
Figure 6).
3.4. Patient prognosis prediction
3.4.1. Disease-free survival (DFS)
The initial univariable screening analysis revealed that the DFS was dependent on advanced age at initial diagnosis (>45 years; p=0.018), adjuvant therapy approach (radiation and/or chemotherapy; p=0.010), E-cadherin expression change from OM to IF (p=0.006), Cx43 expression within IF (p=0.045), and both high EMMPRIN expression within IF (p=0.014) and its expression change from healthy OM to IF (p=0.001).
All marker protein variables that yielded a p-value <0.1 in the initial screening analysis were re-tested for association with DFS, adjusted for AJCC stage and age at diagnosis. This analysis revealed a significant influence on DFS of high EMMPRIN expression in primary OSCC (p=0.004) and IF (p=0.014), as well as EMMPRIN expression change from healthy OM to IF (p=0.001). Additionally, a significant effect was observed for E-cadherin expression change from OM to IF (p=0.024) and Cx43 expression within IF (p=0.050).
In a final multivariable Cox regression model, only the protein expression differences between ROIs with the best univariable association with DFS were selected (EMMPRIN expression change from OM to IF; E-cadherin expression change from OM to IF; Cx43 expression within IF). This analysis revealed a significant effect of EMMPRIN expression change from healthy OM to IF on DFS [p=0.019; H(0.99); CI(0.99;1.00)], while no significant association was detected for E-cadherin [p=0.254; H(1.01); CI(1.00;1.00)] and Cx43 [p=0.107; H(1.01); CI(1.00;1.00)].
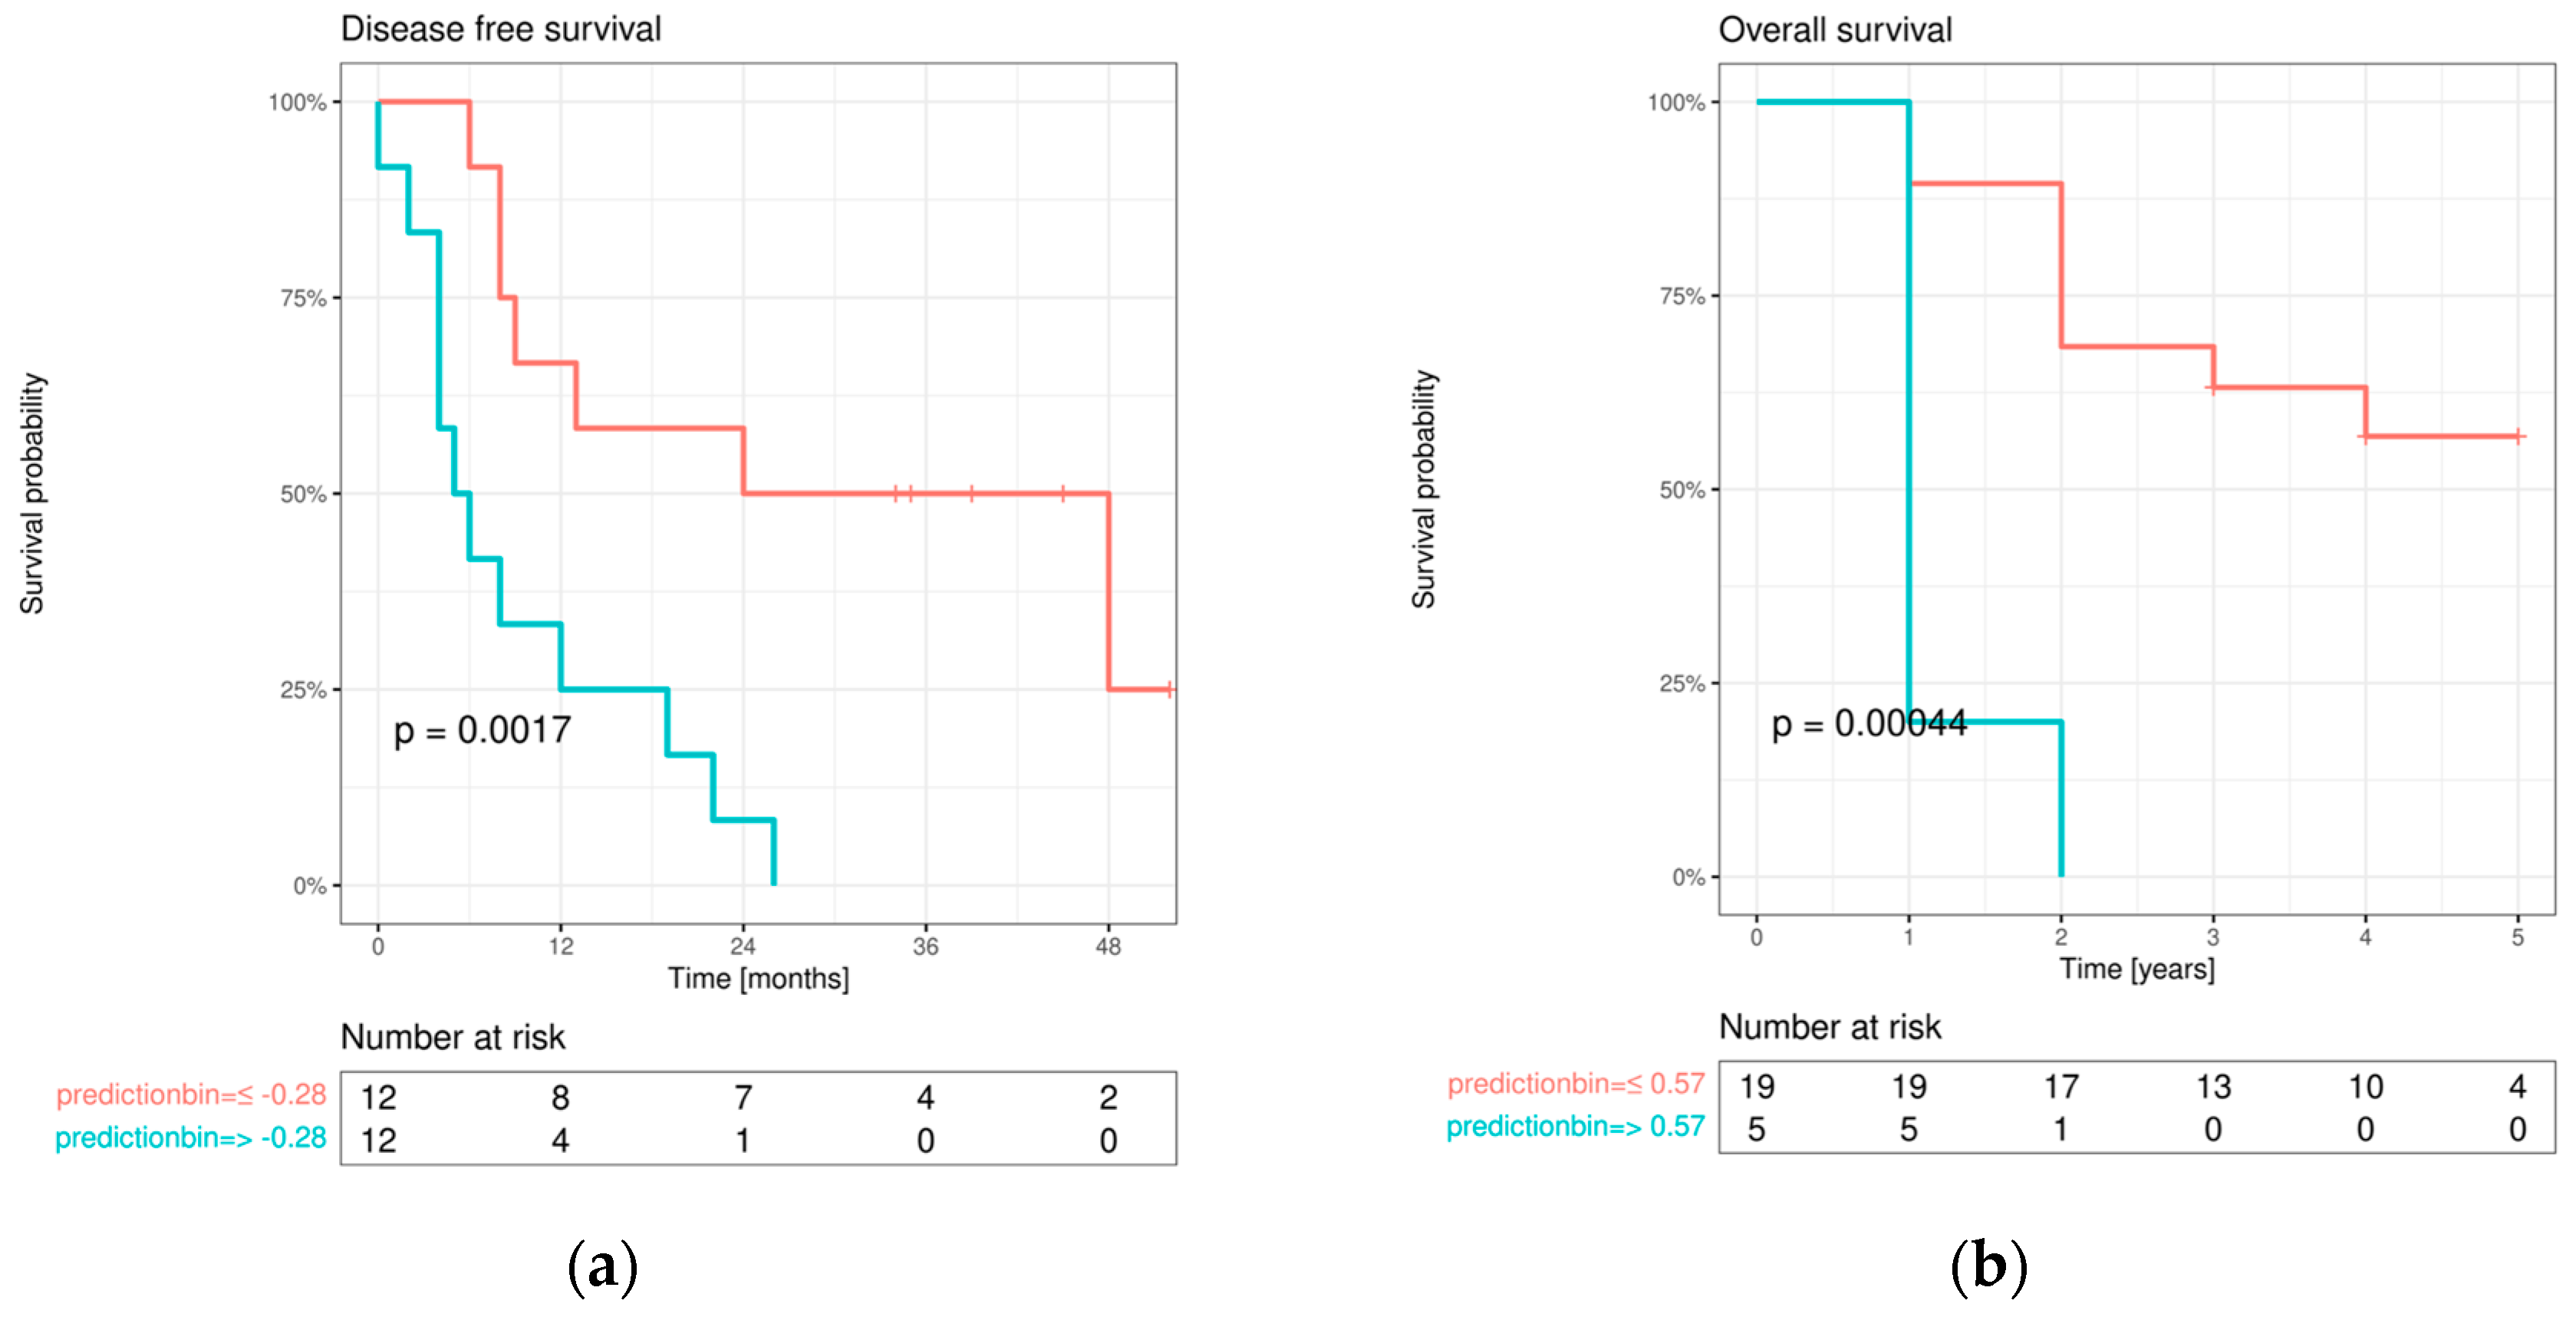
The final multivariable Cox regression model was used for combined DFS prediction and showed a significant bifurcation of the survival curves (
Figure 7a).
3.4.2. Overall survival (OS)
Univariable screening was performed for OS. Significant influences were found for high pT status (3/4) (p=0.032), positive lymph node status (p=0.008), adjuvant therapy approach performed (p=0.003), high AJCC stage (II/IV) (p=0. 014), an increase in E-cadherin expression from IF to LNM (p=0.032), a decrease in E-cadherin expression from oral mucosa to IF (p=0.016), high vimentin expression in oral mucosa (p=0.011) and in the center of primary OSCC (p=0. 028), an increase in vimentin expression from oral mucosa to the center of primary OSCC (p=0.003), an increase in vimentin expression from oral mucosa to IF (p=0.047), high Cx43 expression in IF (p=0. 016), a decrease in Cx43 expression from oral mucosa to IF (p=0.003), high EMMPRIN expression in oral mucosa (p=0.039) and IF (p=0.018), and an increase in EMMPRIN expression from the center of primary OSCC to IF (p=0.003). No significant correlations were found between protein expression profiles and baseline clinical characteristics (all p-values >0.05).
Multivariable Cox regression analysis revealed a significant effect of increasing EMMPRIN expression from the center of primary OSCC to IF on OS [p=0.023; HR (1.02); CI (1.00;1.00)]. To visualize the impact of EMMPRIN expression on patient prognosis, model predictions were binarized at both the median and maximum selected rank statistics, and Kaplan-Meier curves were plotted in the resulting subgroups and compared with log-rank tests (see
Figure 7b).
4. Discussion
Metastasis represents a milestone in OSCC progression [
33] and is associated with poor patients prognosis and decreased health-related quality of life [
2]. In the present study, we mapped the metastatic process from healthy oral mucosa towards cervical lymph node metastasis in tissue samples from 24 OSCC patients and evaluated the expression profiles of both transmembrane proteins Cx43 and EMMPRIN together with those of the known EMT markers E-cadherin and vimentin by immunohistochemistry. Furthermore, we investigated the prognostic impact of each protein and tested whether a combined biomarker system can significantly predict the clinical endpoints DFS and OS.
Cx43 expression was detected in all tissue types examined (oral mucosa, center of primary OSCC, invasive front, and lymph node metastases). Expression was lowest in oral mucosa and increased significantly towards the center of primary OSCC. Cx43 expression decreased towards the invasive front and increased again in lymph node metastases. The expression profile of Cx43 paralleled that of the established epithelial marker E-cadherin [
34]. Cx43 and E-cadherin are transmembrane proteins that are important for the formation of intercellular junctions and gap junction channels and the maintenance of intercellular communication [
15]. This may explain the increase in Cx43 toward the center of the primary OSCC, where cells proliferate and interact with each other. Towards the invasive front, the site where tumor cells undergo EMT to gain the ability to migrate and metastasize [
35], intercellular junctions must be disrupted and Cx43 and E-cadherin expression are reduced [
11]. In lymph node metastasis, where tumor cells communicate with each other again, both protein expression profiles (Cx43 and E-cadherin) are restored, linking Cx43 expression to MET features. Although we have shown in previous studies that Cx43 alone acts as an independent prognostic factor in OSCC [
11], we were unable to confirm this effect in the current cohort by multivariable Cox regression analysis, which may be due to the small number of cases.
In the present study, we demonstrated that EMMPRIN is highly expressed in both physiological oral mucosa and primary OSCCs. Similar results have been reported previously by Rajshri et al. [
36], and Min and colleagues [
37]. However, we demonstrated for the first time that EMMPRIN expression significantly increases toward the invasive front of OSCC and decreases in lymph node metastasis. The EMMPRIN expression profile corresponds to that of the well-known mesenchymal marker vimentin [
38]. These data suggest that high EMMPRIN expression in migrating OSCC tumor cells is necessary to facilitate invasion into the surrounding tissue and metastasis. This feature is not required for lymph node metastases, where the focus is on growth within the cell cluster and EMMPRIN expression is reduced, linking EMMPRIN with EMT features. Moreover, of all markers examined EMMPRIN expression had the strongest prognostic impact on clinical endpoints DFS and OS, as measured by multivariable Cox regression analysis. As we have recently shown that EMMPRIN prevents tumor cells from entering the dormant state and that knocking down EMMPRIN pushes cells toward dormancy [
39], targeting EMMPRIN expression in metastatic OSCC tumor cells may be an interesting new anti-metastatic therapy approach.
We also demonstrated that the combined biomarker system of Cx43, EMMPRIN, E-cadherin and vimentin is significantly able to predict both DFS and OS of patients with metastatic OSCC, and that it should be more thoroughly evaluated in a larger number of patients before to potentially implementing this combined system in routine clinical practice.
5. Conclusions
Metastasis of oral squamous cell carcinoma is associated with poor patient prognosis. Alterated EMMPRIN expression and localization toward the invasive front shows the highest influence on both disease-free survival and overall survival of patients and may represent an interesting new targeted anti-metastatic therapy approach. A combined biomarker system consisting of Cx43, EMMPRIN, E-cadherin and vimentin can accurately predict both disease-free survival and overall survival and may facilitate prognostic assessment in routine clinical practice.
Author Contributions
Conceptualization, P.B. and F.B.; methodology, T.K., L.F. and P.B.; software, P.B.; validation, P.B. and F.B.; formal analysis, P.B. and A.L.; investigation, T.K., M.A.R. and P.B.; resources, A.F. and H.S.; data curation, P.B.; writing—original draft preparation, T.K. and P.B.; writing—review and editing, A.F., H.S. and M.A.R.; visualization, P.B.; supervision, P.B.; project administration, P.B.; funding acquisition, H.S. All authors have read and agreed to the published version of the manuscript.
Funding
We acknowledge support by the Open Access Publication Funds of the Goettingen University.
Institutional Review Board Statement
The study was conducted in accordance with the Declaration of Helsinki, and approved by the Institutional Ethics Committee of University Medical Center Goettingen (vote no. 07/06/09, updated April 2018).
Informed Consent Statement
Informed consent was obtained from all subjects involved in the study.
Data Availability Statement
All data can be obtained from the corresponding author.
Acknowledgments
We thank Olga Dschun for her scientific and practical assistance in the conduct of trials.
Conflicts of Interest
The authors declare no conflict of interest.
References
- Sung, H.; Ferlay, J.; Siegel, R.L.; Laversanne, M.; Soerjomataram, I.; Jemal, A.; Bray, F. Global cancer statistics 2020: GLOBOCAN estimates of incidence and mortality worldwide for 36 cancers in 185 countries. CA Cancer J Clin 2021. [Google Scholar] [CrossRef]
- Hoene, G.; Gruber, R.M.; Leonhard, J.J.; Wiechens, B.; Schminke, B.; Kauffmann, P.; Schliephake, H.; Brockmeyer, P. Combined quality of life and posttraumatic growth evaluation during follow-up care of patients suffering from oral squamous cell carcinoma. Mol Clin Oncol 2021, 15, 189. [Google Scholar] [CrossRef] [PubMed]
- Stone, R.C.; Pastar, I.; Ojeh, N.; Chen, V.; Liu, S.; Garzon, K.I.; Tomic-Canic, M. Epithelial-mesenchymal transition in tissue repair and fibrosis. Cell Tissue Res 2016, 365, 495–506. [Google Scholar] [CrossRef]
- Goldmann, O.; Medina, E. The expanding world of extracellular traps: not only neutrophils but much more. Front Immunol 2012, 3, 420. [Google Scholar] [CrossRef] [PubMed]
- Zhang, Y.; Weinberg, R.A. Epithelial-to-mesenchymal transition in cancer: complexity and opportunities. Front Med 2018, 12, 361–373. [Google Scholar] [CrossRef] [PubMed]
- Peitzsch, C.; Tyutyunnykova, A.; Pantel, K.; Dubrovska, A. Cancer stem cells: The root of tumor recurrence and metastases. Semin Cancer Biol 2017, 44, 10–24. [Google Scholar] [CrossRef]
- Fiore, A.; Ribeiro, P.F.; Bruni-Cardoso, A. Sleeping Beauty and the Microenvironment Enchantment: Microenvironmental Regulation of the Proliferation-Quiescence Decision in Normal Tissues and in Cancer Development. Front Cell Dev Biol 2018, 6, 59. [Google Scholar] [CrossRef]
- Gao, X.L.; Zhang, M.; Tang, Y.L.; Liang, X.H. Cancer cell dormancy: mechanisms and implications of cancer recurrence and metastasis. Onco Targets Ther 2017, 10, 5219–5228. [Google Scholar] [CrossRef]
- Aasen, T.; Johnstone, S.; Vidal-Brime, L.; Lynn, K.S.; Koval, M. Connexins: Synthesis, Post-Translational Modifications, and Trafficking in Health and Disease. Int J Mol Sci 2018, 19. [Google Scholar] [CrossRef]
- Solan, J.L.; Lampe, P.D. Spatio-temporal regulation of connexin43 phosphorylation and gap junction dynamics. Biochim Biophys Acta Biomembr 2018, 1860, 83–90. [Google Scholar] [CrossRef]
- Brockmeyer, P.; Jung, K.; Perske, C.; Schliephake, H.; Hemmerlein, B. Membrane connexin 43 acts as an independent prognostic marker in oral squamous cell carcinoma. Int J Oncol 2014, 45, 273–281. [Google Scholar] [CrossRef] [PubMed]
- Loewenstein, W.R.; Penn, R.D. Intercellular communication and tissue growth. II. Tissue regeneration. J Cell Biol 1967, 33, 235–242. [Google Scholar] [CrossRef]
- Tittarelli, A.; Guerrero, I.; Tempio, F.; Gleisner, M.A.; Avalos, I.; Sabanegh, S.; Ortiz, C.; Michea, L.; Lopez, M.N.; Mendoza-Naranjo, A. , et al. Overexpression of connexin 43 reduces melanoma proliferative and metastatic capacity. Br J Cancer 2015, 113, 259–267. [Google Scholar] [CrossRef]
- Caillou, B.; Talbot, M.; Weyemi, U.; Pioche-Durieu, C.; Al Ghuzlan, A.; Bidart, J.M.; Chouaib, S.; Schlumberger, M.; Dupuy, C. Tumor-associated macrophages (TAMs) form an interconnected cellular supportive network in anaplastic thyroid carcinoma. PLoS One 2011, 6, e22567. [Google Scholar] [CrossRef]
- Cronier, L.; Crespin, S.; Strale, P.O.; Defamie, N.; Mesnil, M. Gap junctions and cancer: new functions for an old story. Antioxid Redox Signal 2009, 11, 323–338. [Google Scholar] [CrossRef]
- Mulkearns-Hubert, E.E.; Reizes, O.; Lathia, J.D. Connexins in Cancer: Jekyll or Hyde? Biomolecules 2020, 10. [Google Scholar] [CrossRef]
- Naus, C.C.; Laird, D.W. Implications and challenges of connexin connections to cancer. Nat Rev Cancer 2010, 10, 435–441. [Google Scholar] [CrossRef]
- Chevallier, D.; Carette, D.; Segretain, D.; Gilleron, J.; Pointis, G. Connexin 43 a check-point component of cell proliferation implicated in a wide range of human testis diseases. Cell Mol Life Sci 2013, 70, 1207–1220. [Google Scholar] [CrossRef]
- Ghosh, S.; Kumar, A.; Chandna, S. Connexin-43 downregulation in G2/M phase enriched tumour cells causes extensive low-dose hyper-radiosensitivity (HRS) associated with mitochondrial apoptotic events. Cancer Lett 2015, 363, 46–59. [Google Scholar] [CrossRef]
- Kameritsch, P.; Pogoda, K.; Pohl, U. Channel-independent influence of connexin 43 on cell migration. Biochim Biophys Acta 2012, 1818, 1993–2001. [Google Scholar] [CrossRef] [PubMed]
- Kazan, J.M.; El-Saghir, J.; Saliba, J.; Shaito, A.; Jalaleddine, N.; El-Hajjar, L.; Al-Ghadban, S.; Yehia, L.; Zibara, K.; El-Sabban, M. Cx43 Expression Correlates with Breast Cancer Metastasis in MDA-MB-231 Cells In Vitro, In a Mouse Xenograft Model and in Human Breast Cancer Tissues. Cancers (Basel) 2019, 11. [Google Scholar] [CrossRef] [PubMed]
- Ke, Q.; Li, L.; Cai, B.; Liu, C.; Yang, Y.; Gao, Y.; Huang, W.; Yuan, X.; Wang, T.; Zhang, Q.; et al. Connexin 43 is involved in the generation of human-induced pluripotent stem cells. Hum Mol Genet 2013, 22, 2221–2233. [Google Scholar] [CrossRef]
- Amit-Cohen, B.C.; Rahat, M.M.; Rahat, M.A. Tumor cell-macrophage interactions increase angiogenesis through secretion of EMMPRIN. Front Physiol 2013, 4, 178. [Google Scholar] [CrossRef] [PubMed]
- Grass, G.D.; Toole, B.P. How, with whom and when: an overview of CD147-mediated regulatory networks influencing matrix metalloproteinase activity. Biosci Rep 2015, 36, e00283. [Google Scholar] [CrossRef] [PubMed]
- Walter, M.; Simanovich, E.; Brod, V.; Lahat, N.; Bitterman, H.; Rahat, M.A. An epitope-specific novel anti-EMMPRIN polyclonal antibody inhibits tumor progression. Oncoimmunology 2016, 5, e1078056. [Google Scholar] [CrossRef]
- Cai, H.; Li, J.; Zhang, Y.; Liao, Y.; Zhu, Y.; Wang, C.; Hou, J. LDHA Promotes Oral Squamous Cell Carcinoma Progression Through Facilitating Glycolysis and Epithelial-Mesenchymal Transition. Front Oncol 2019, 9, 1446. [Google Scholar] [CrossRef]
- Grass, G.D.; Dai, L.; Qin, Z.; Parsons, C.; Toole, B.P. CD147: regulator of hyaluronan signaling in invasiveness and chemoresistance. Adv Cancer Res 2014, 123, 351–373. [Google Scholar] [CrossRef]
- Wu, X.; Qiao, B.; Liu, Q.; Zhang, W. Upregulation of extracellular matrix metalloproteinase inducer promotes hypoxia-induced epithelial-mesenchymal transition in esophageal cancer. Mol Med Rep 2015, 12, 7419–7424. [Google Scholar] [CrossRef] [PubMed]
- Bankhead, P.; Loughrey, M.B.; Fernandez, J.A.; Dombrowski, Y.; McArt, D.G.; Dunne, P.D.; McQuaid, S.; Gray, R.T.; Murray, L.J.; Coleman, H.G.; et al. QuPath: Open source software for digital pathology image analysis. Sci Rep 2017, 7, 16878. [Google Scholar] [CrossRef]
- Team, R.C. R: A language and environment for statistical computing. 2013.
- Bates, D.; Mächler, M.; Bolker, B.; Walker, S. Fitting Linear Mixed-Effects Models Usinglme4. Journal of Statistical Software 2015, 67. [Google Scholar] [CrossRef]
- Russell, L. emmeans: estimated Marginal Means, aka Least-Squares Means. R package version 1.4. 3.01. The University of Iowa Iowa City, IA: 2019.
- Miguel, A.F.; Mello, F.W.; Melo, G.; Rivero, E.R. Association between immunohistochemical expression of matrix metalloproteinases and metastasis in oral squamous cell carcinoma: systematic review and meta-analysis. Head & Neck 2020, 42, 569–584. [Google Scholar]
- Loh, C.-Y.; Chai, J.Y.; Tang, T.F.; Wong, W.F.; Sethi, G.; Shanmugam, M.K.; Chong, P.P.; Looi, C.Y. The E-cadherin and N-cadherin switch in epithelial-to-mesenchymal transition: signaling, therapeutic implications, and challenges. Cells 2019, 8, 1118. [Google Scholar] [CrossRef]
- Yamakawa, N.; Kirita, T.; Umeda, M.; Yanamoto, S.; Ota, Y.; Otsuru, M.; Okura, M.; Kurita, H.; Yamada, S.i.; Hasegawa, T. Tumor budding and adjacent tissue at the invasive front correlate with delayed neck metastasis in clinical early-stage tongue squamous cell carcinoma. Journal of surgical oncology 2019, 119, 370–378. [Google Scholar] [CrossRef] [PubMed]
- Rajshri, R. Emmprin (CD147) Expression in Oral Submucous Fibrosis and in Oral Squamous Cell Carcinoma: A Potential Predictor. Madha Dental College, Chennai, 2022.
- Min, A.; Xiong, H.; Wang, W.; Hu, X.; Wang, C.; Mao, T.; Yang, L.; Huang, D.; Xia, K.; Su, T. CD147 promotes proliferation and migration of oral cancer cells by inhibiting junctions between E-cadherin and β-catenin. Journal of Oral Pathology & Medicine 2020, 49, 1019–1029. [Google Scholar]
- Usman, S.; Waseem, N.H.; Nguyen, T.K.N.; Mohsin, S.; Jamal, A.; Teh, M.-T.; Waseem, A. Vimentin is at the heart of epithelial mesenchymal transition (EMT) mediated metastasis. Cancers 2021, 13, 4985. [Google Scholar] [CrossRef]
- Feigelman, G.; Simanovich, E.; Brockmeyer, P.; Rahat, M.A. Knocking-Down CD147/EMMPRIN Expression in CT26 Colon Carcinoma Forces the Cells into Cellular and Angiogenic Dormancy That Can Be Reversed by Interactions with Macrophages. Biomedicines 2023, 11, 768. [Google Scholar] [CrossRef]
|
Disclaimer/Publisher’s Note: The statements, opinions and data contained in all publications are solely those of the individual author(s) and contributor(s) and not of MDPI and/or the editor(s). MDPI and/or the editor(s) disclaim responsibility for any injury to people or property resulting from any ideas, methods, instructions or products referred to in the content. |
© 2023 by the authors. Licensee MDPI, Basel, Switzerland. This article is an open access article distributed under the terms and conditions of the Creative Commons Attribution (CC BY) license (https://creativecommons.org/licenses/by/4.0/).
