
Submitted:
31 August 2023
Posted:
06 September 2023
You are already at the latest version
Abstract
Many factors drive land desertification, especially in arid and semi-arid regions. However, the numerous driving factors of desertification make analyses computer expensive. Cloud computing comes along to address this problem, especially in developing countries. The objective of this work was to assess the sensitivity of the East Atlantic Basin, Brazil, to desertification using the Mediterranean Desertification and Land Use (MEDALUS) model and Google Earth Engine (GEE). The model is composed of four environmental Quality Indices (QIs) associated with soil (SQI), vegetation (VQI), climate (CQI) and management (MQI), and contains factors influencing the desertification process. Digital databases of the factors were pre-processed and uploaded to GEE for analysis. We report Environmentally Sensitive Areas (ESAs) and Environmentally Critical Factors (ECF) maps of the East Atlantic Basin, which showed that most of the basin is in either critical (49.4%) or fragile (35.7%) state of sensitivity. In contrast, only a smaller portion of the area is unaffected (5%) or potentially affected (10.1%). Sensitivity to desertification was inversely correlated with the presence of vigorous vegetation. A joint analysis of ESAs and ECF shed light on the importance of each factor in the sensitivity to desertification. The East Atlantic Basin shows a high degree of sensitivity to desertification, thereby demanding more attention and establishment of measures to mitigate the negative impacts of the desertification process.
Keywords:
Environmental Sensitivity
; Modeling
; Environmental Quality
; Cloud computing
1. Introduction
Several soil, climatic, and socioeconomic factors drive desertification, resulting in environmental degradation, especially in areas located in arid and semi-arid regions [1]. The multi-disciplinary understanding of desertification drivers is essential for the implementation of monitoring systems to assess land degradation and to develop early warning systems for timely mitigation of negative environmental impacts [2,3].
Remote sensing techniques have allowed large-scale, cost-effective monitoring in environmentally sensitive areas [4,5,6]. Of desertification monitoring methods, a relatively common approach is the use of multi-disciplinary approaches to create Environmentally Sensitive Areas (ESAs) [7]. Overall, this approach integrates qualitative and quantitative factors of soil and climatic characteristics, and human influence on a region to assess the susceptibility of areas to desertification [8]. A well-studied multi-disciplinary approach is the Mediterranean Desertification and Land Use (MEDALUS) model, which has been conceived from the parameterization of environmental factors driving the desertification process and recommended due to its simplicity [9]. The model is formed from the combination of climatic, soil, land management, and vegetation factors [10].
The MEDALUS model, initially proposed for Mediterranean Europe [11], has been used in other regions of the world to assess land desertification due to the universal characteristics of the parameters of the model [3,12]. In Brazil, the application of the MEDALUS model has shown good performance in mapping areas susceptible to desertification in the Northeast region [13]. This region is mainly characterized by a semi-arid climate and long extensions of degraded land resulting from decades of inadequate land use, such as slash-and-burn, overgrazing, and overexploitation of natural resources [14]. However, limited computer power has been a major limitation to studies analyzing the many variables involved in desertification; therefore, studies have generally focused on small areas to decrease computational requirements [15]. The high computer power necessary to analyze large amounts of data can be addressed by cloud computing platforms, such as Google Earth Engine, which allow convenient and effective data processing, analysis, and storage [16,17,18,19].
In this study, we used the MEDALUS model to assess the susceptibility to desertification of the East Atlantic Basin, Brazil, using Google Earth Engine (GEE). The East Atlantic Basin has four distinct climate regimes (arid, semi-arid, humid, and sub-humid), a strong incidence of solar radiation, altitudes ranging from sea level to as high as 1,100 m [20], and average annual precipitation rates ranging from 600 and 2,200 mm [21]. This diversity in terms of climate, relief, and vegetation makes the basin an interesting choice for land desertification assessment and testing the GEE processing capacity. The objectives were to (i) assess the sensibility of the East Atlantic Basin to desertification and (ii) the influence of each model’s component on the performance of the MEDALUS model.
2. Materials and Methods
2.1. Study site and database
The East Atlantic Basin (Figure 1) is located among the states of Bahia, Espírito Santo, Minas Gerais, and Sergipe, with a total area of approximately 386,511.95 km2.
Digital geospatial databases were used to map the areas sensitive to desertification in the East Atlantic Basin. Some of these data underwent the removal of topological errors and the addition of population data. These adjustments were made using the open-source software QGIS, version 3.14. Then, these files were uploaded to the GEE platform.
2.2. The MEDALUS model
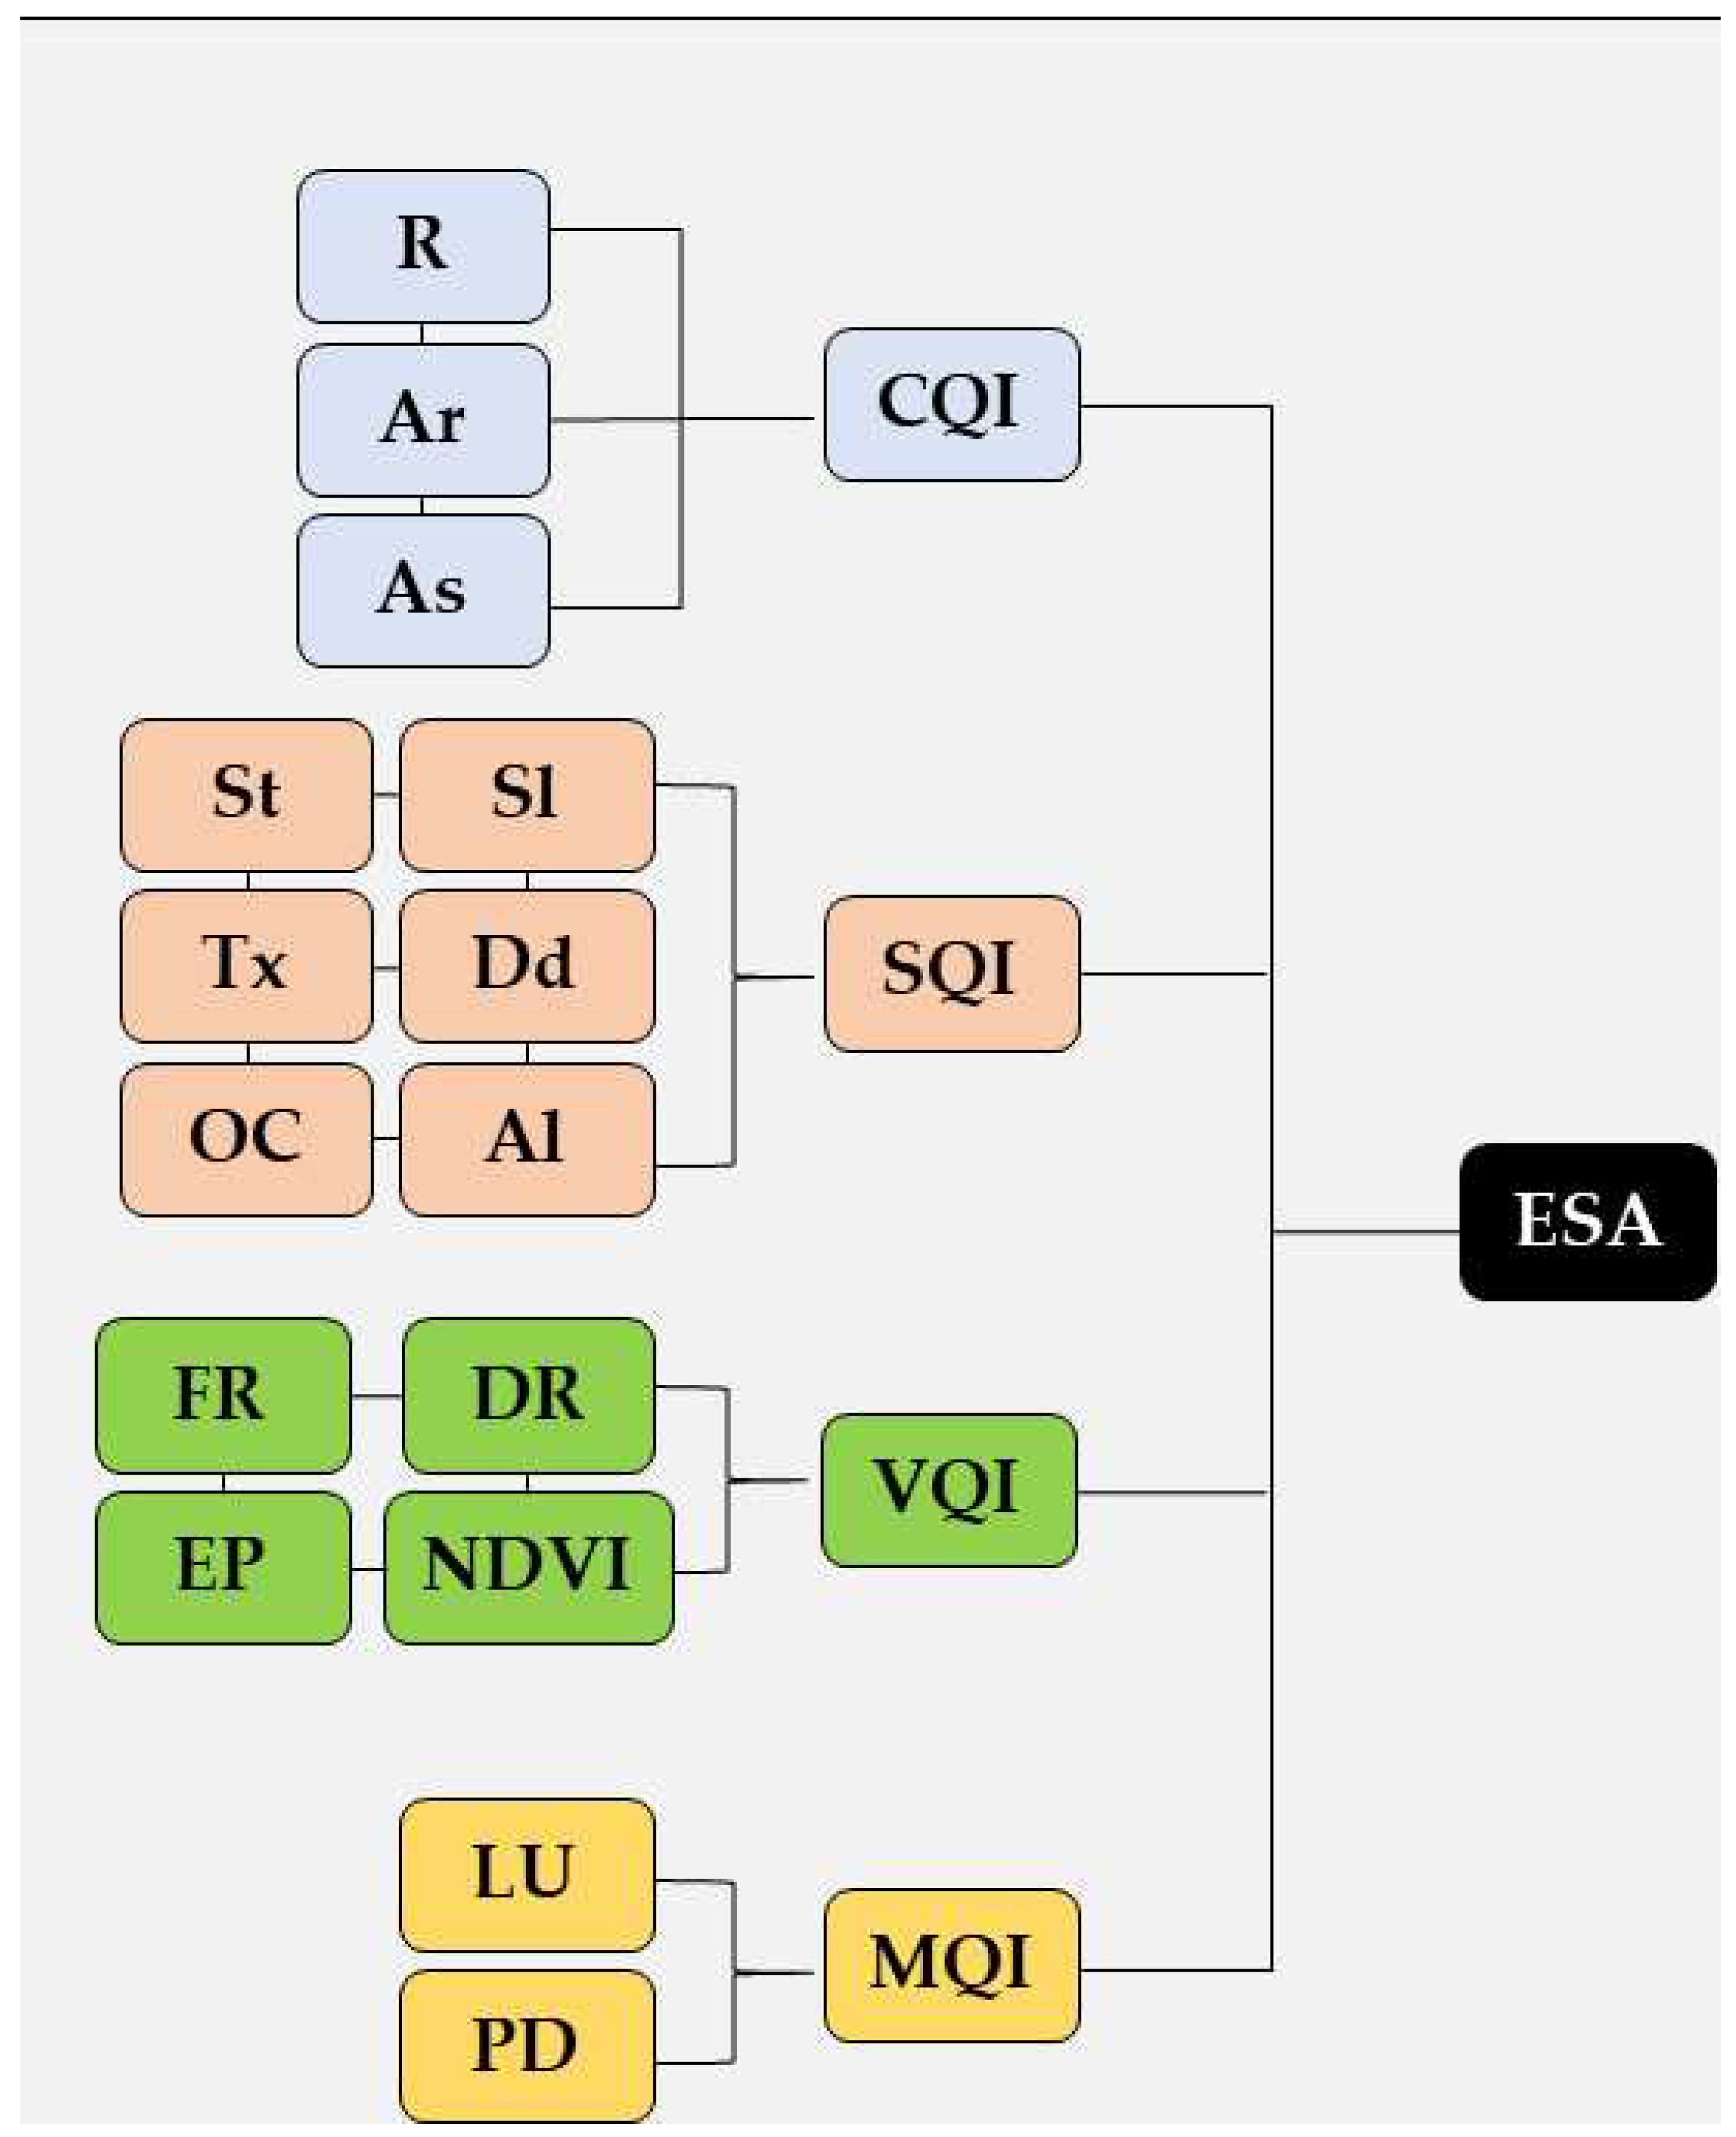
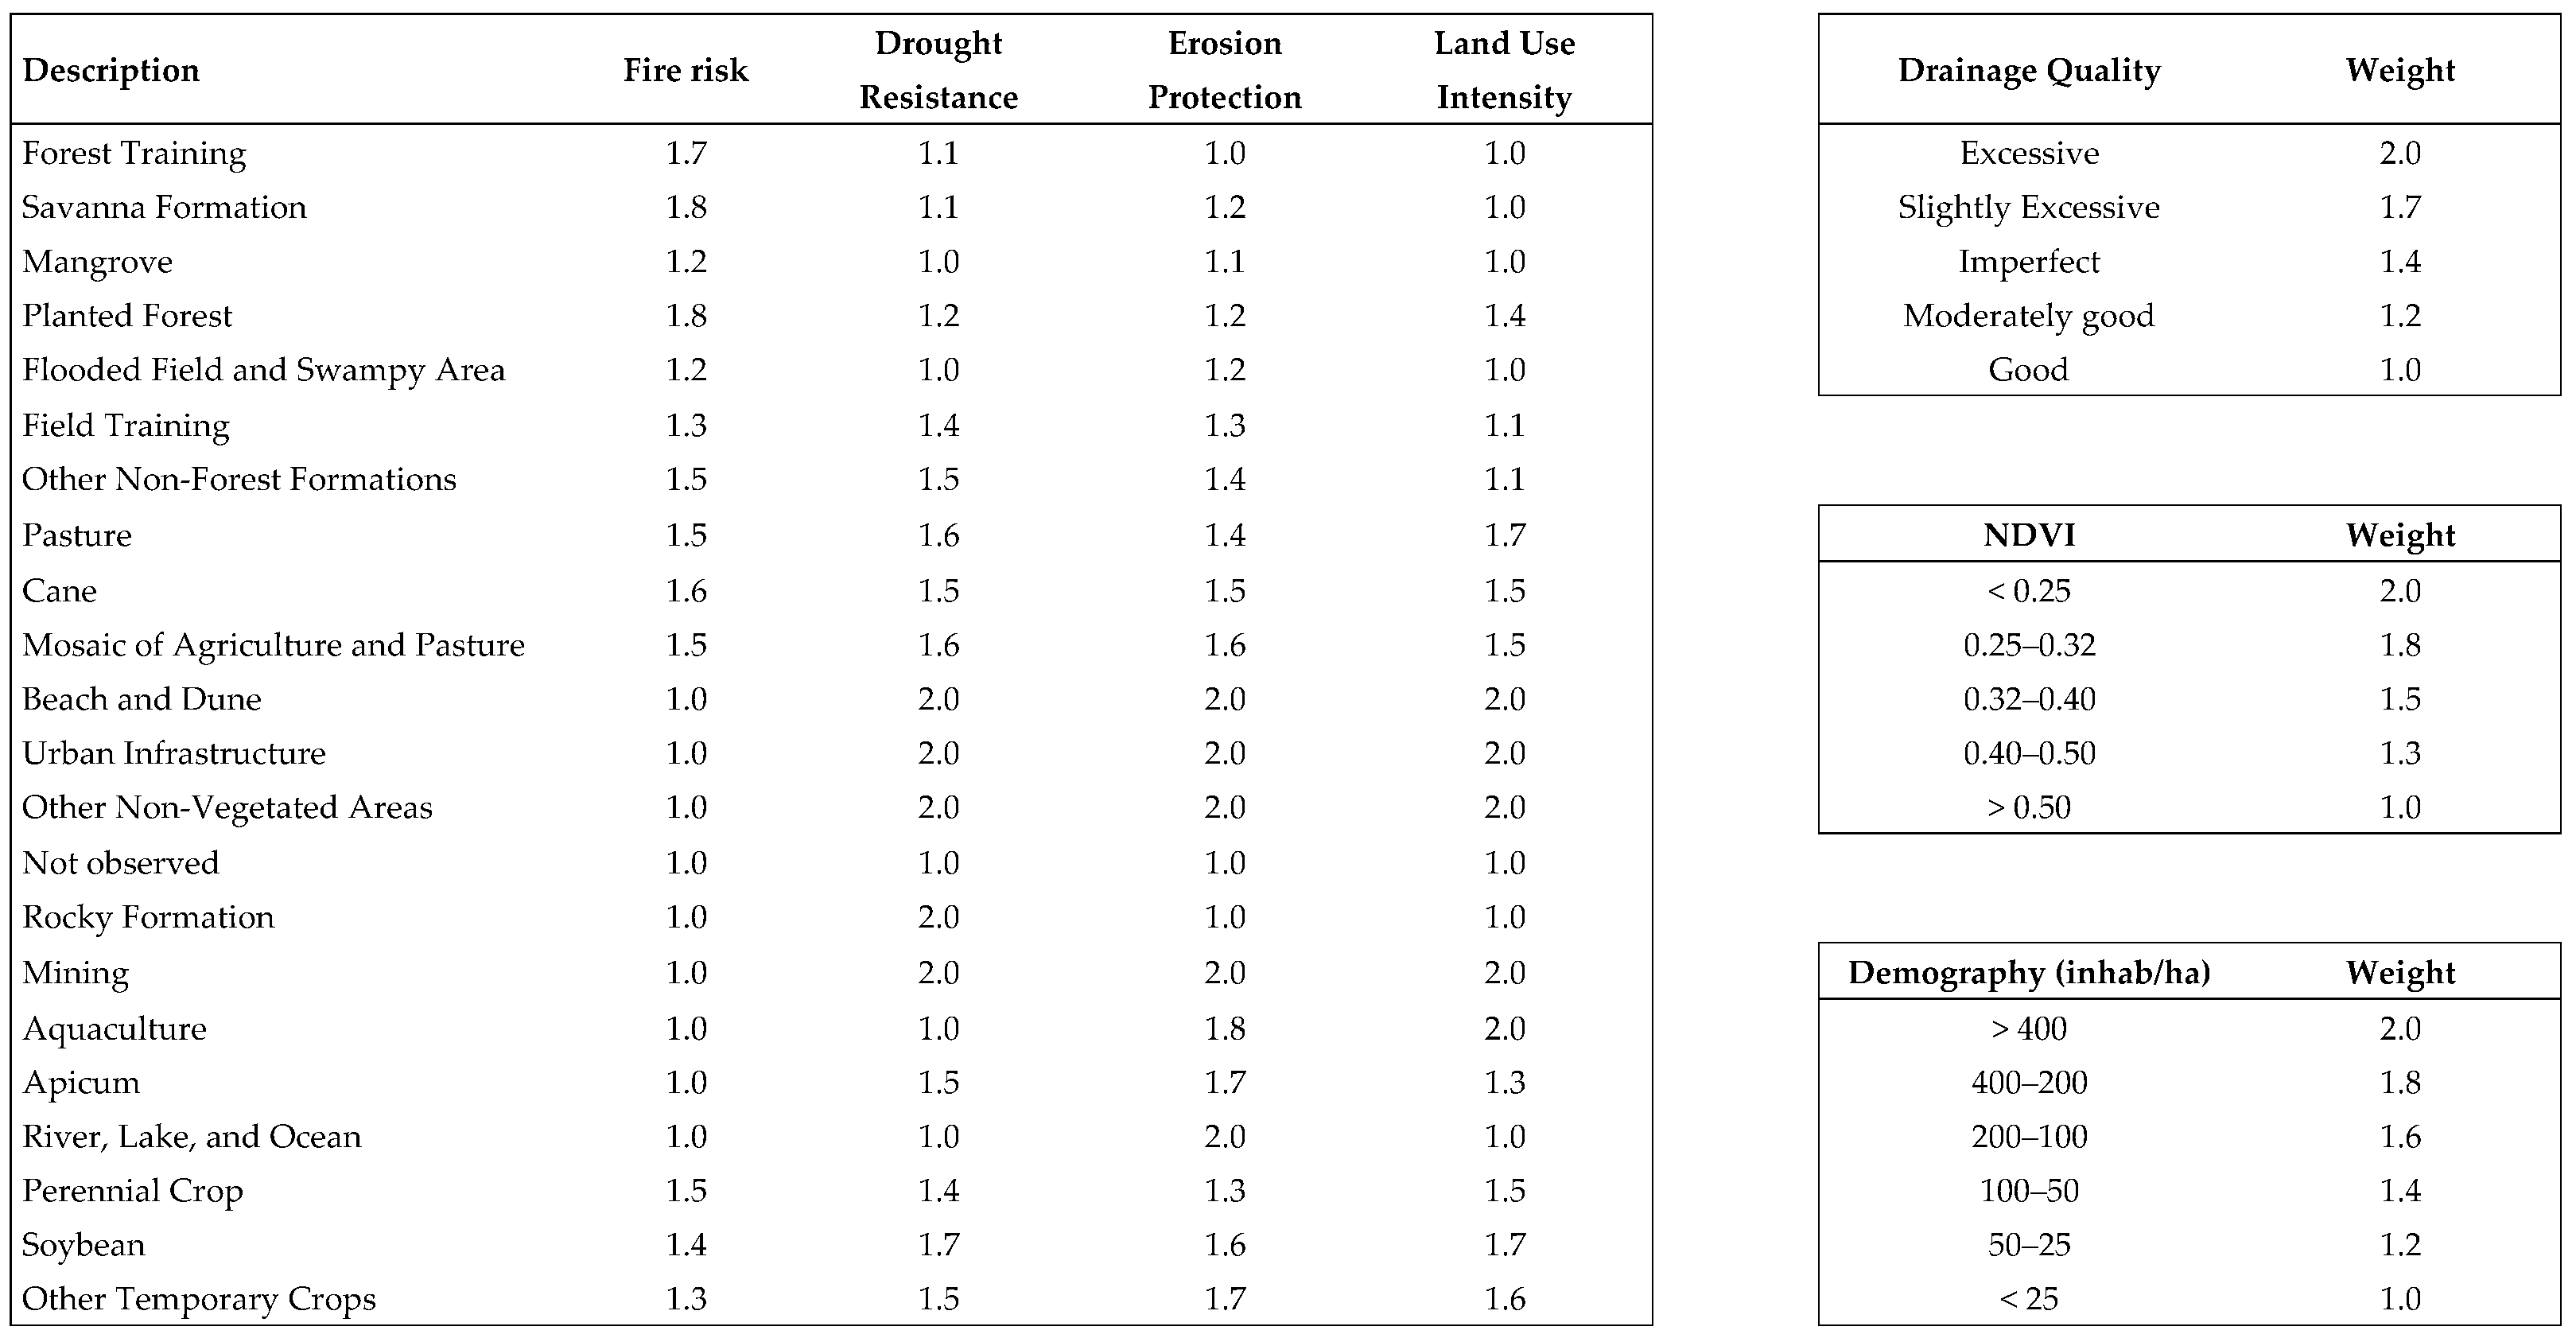
The Environmentally Sensitive Area (ESA) index was based on the modified framework of the MEDALUS model [11], which uses four quality indices (QI): climate quality index (CQI), soil quality index (SQI), vegetation quality index (VQI), and management quality index (MQI). The framework has variations from that of the original method, such as the addition of information on Soil Carbon Content and Normalized Difference Vegetation Index (NDVI) (Table 1).
Driving factors of the desertification process were classified according to scores ranging from 1 (least sensitive to desertification) to 2 (most sensitive to desertification) for the determination of quality indices (Qis); values between 1 and 2 indicate intermediate susceptibility. Thus, obtaining the Environmentally Sensitive Areas (ESAs) took place in two stages: in the first stage, the QIs were obtained using the geometric mean of the variables that compose the indices using Equations (1) and (2) [9].
where: n = number of variables; x = quality indices (CQI, SQI, VQI, and MQI); iej = row and column of a pixel of the used rasters, respectively.
QIx = (variable_1ij * variable_2ij * variable_3ij … * variable_nij)1/n
In the second stage, the previously obtained QIs were used to calculate the ESA:
where: i and j = is the row and column, respectively, of a pixel of the rasters.
ESAij = (CQIij * SQIij * VQIij * MQIij)1/4
2.3. Quality scores
The respective QIs were obtained using digital databases in raster format. Part of these bases were already available in the GEE catalog. The unavailable ones in the platform were acquired and reclassified according to the weights (Table A1) established in the methodology to finally send them to the GEE platform for the creation of the ESAs map (Figure 1).
Figure 2.
Flowchart showing the components associated with climate (CQI), soil (SQI), vegetation (VQI) and management (MQI) quality indexes to calculate the Environmental Sensitive Area (ESA). R—rainfall; Ar—aridity; As—basin orientation; St—soil type; Sl—basin slope; Tx—soil texture; Dd—drainage classes; OC—organic carbon content; Al—albedo; FR—fire risk; DR—drought resistance; EP—erosion protection; NDVI—normalized difference vegetation index; LU—land use; PD—population density.
CQI was determined using the variables rainfall (R), aridity (Ar), and basin orientation (As) based on the GEE catalog bases. The mean annual total precipitation information (mm) came from the TerraClimate global dataset [23]. Aridity was calculated using the UNESCO aridity index [24] from the ratio between precipitation (mm) and potential evapotranspiration (mm). Potential evapotranspiration (ETP), for the period 2010 to 2019, necessary to obtain Ar, came from the Terra Net Evapotranspiration Digital Base, which uses MODIS satellite images by the Land Processes Distributed Active Archive Center (LPDAAC). Basin orientation was obtained using SRTM images from Hole-filled SRTM for the globe, version 4.
SQI was obtained using the variables soil type (St), basin slope (Sl), soil texture (Tx), drainage classes (Dd), organic carbon content (OC), and albedo (Al). Basin slope was extracted from the previously cited SRTM data. Information on texture, drainage classes and organic carbon content was extracted from the Harmonized World Soil Database [25], reclassified according to the defined weights, and sent to the GEE platform. Surface albedo was obtained from an annual mosaic for the year 2019, composed of pre-processed images from the Sentinel-2 (S2) satellite. Albedo calculation in S2 images was performed using coefficients defined in an approach proposed by [26].
VQI is composed of the sub-indices fire risk (FR), drought resistance capacity (DR), erosion protection capacity (EP) and the NDVI. The FR, DR and EP variables were obtained from the reclassification (Table 1) of a land use mosaic made available by MapBiomas [14] for the year 2019. The image, available on GEE, was then cut and reclassified according to the parameters established for each variable that composes the VQI. The NDVI for the study area was obtained using the mosaic composed of S2 images using the following equation:
where IR is the infrared surface reflectance on band eight; RED is the red surface reflectance on band four of the S2 satellites.
NDVI = (IR − RED)/(IR − RED)
MQI was composed of the variables intensity of land use (LU) and population density (PD) of the municipalities present in the basin under study. Land use intensity data come from the land cover classification image provided by MapBiomas and had scores assigned to each class, as previously determined in Table 1. The PD variable was acquired from the ratio between the number of inhabitants in a municipality and its respective area in km2. As the last population census was carried out in Brazil in 2010, it was necessary to estimate the population in 2020.
Maps based on the Environmentally Critical Factors (ECF) index were created to complement the ESA map for the East Atlantic Basin. The composition of the ECF index was performed with the following equation [27]:
Pixels with values lower than the critical limit (C2) of 1.425 were not considered when processing. Thus, the composition of the ECF index was made from counting the number of variables that exceeded the critical value of 1.425 for each pixel.
2.4. Statistical analysis
Principal Component Analysis (PCA) was used on the matrix of variables to evaluate the relationship between the component variables of the produced ESAs. The four QIs and the ESA were used as supplementary parameters. The averages of the 20 variables (15 factors, Qis, and ESA) were obtained for each of the 541 municipalities located within the limits of the basin’s area, composing 10,820 observations. The PCA was performed using the R software.
3. Results
3.1. Quality scores
The maps resulting from the application of Equation (1) for the generation of QIs are shown in Figure 3. Each generated raster has pixels with values from 1 to 2, so that the greater the value of a certain index, the greater its contribution to the sensitivity to basin desertification.
3.2. Environmentally Sensitive Area (ESA)
After applying Equation 2 using previously generated QIs, an ESAs map was obtained (Figure 4). The ESAs comprise the geometric mean of the four QIs generated in the first stage of the work.
In analyzing the ESA map, the north and central-west regions of the study area has areas with greater vulnerability to desertification. Conversely, areas located closer to the coastal zone and to the southwest of the basin were less susceptible. Only 5.0% of the basin area (Table 2) can be classified in the “Not affected” category (N), with emphasis on areas located in the region further to the coast and southwest of the basin.
The areas included in the “Potentially affected” (P) class comprise about 10.1% of the total area of the basin and are located, as well as the N class, in the coastal and southern regions. The three levels corresponding to the “Fragile” (F) class have a relatively uniform spatial distribution throughout the basin, occupying around 49.3% of the entire area. In general, subclasses F1 and F2 have similar spatial distribution to classes N and P, while subclass F3 is more present in the northern and central portion of the studied area, the latter being more associated with the “Critical” class (C). Class C corresponds to a portion of 35.7% of the basin and, as previously mentioned, the areas included in this classification (C1, C2, C3) are located to the north and center of the area under study.

Table 2.
Desertification susceptibility classes and their respective areas within the East Atlantic Basin, Brazil.
Table 2.
Desertification susceptibility classes and their respective areas within the East Atlantic Basin, Brazil.
| Susceptibility | Weights | Subclasses | Area (km2) | Area (%) |
|---|---|---|---|---|
| Not affected | < 1.170 | No | 19177.49 | 5.0% |
| potentially affected | 1.170–1.225 | P | 38883.42 | 10.1% |
| Fragile | 1.225–1.275 | F1 | 56033.22 | 14.5% |
| 1.275–1.325 | F2 | 68675.25 | 17.8% | |
| 1.325–1.375 | F3 | 65941.47 | 17.1% | |
| Critical | 1.375–1.425 | C1 | 54968.20 | 14.2% |
| 1.425–1.530 | C2 | 70176.42 | 18.2% | |
| > 1.530 | C3 | 12656.84 | 3.3% |
When analyzing the areas characterized by high sensitivity to desertification, more specifically to the north of the basin, the presence of low-quality soils and high rates of aridity are predominant factors in these locations.
A joint analysis of the ECF index (Figure 5) and ESA allows a better understanding of the contribution of each model component to the desertification process. This analysis shows that certain areas with the same ESAs have variables with different sensitivity to desertification [27]. Thus, when analyzing the ECF maps, we can observe that variables related to the climate and soil of the study area are the most common factors for determining sensitivity to desertification in the East Atlantic Basin.
The PCA results (Table 3 and Figure 6) allowed a more objective assessment of the contribution of each edaphoclimatic and anthropic variable used for the composition of the ESAs maps for the East Atlantic Basin, enabling the optimization of the model in future research.
The first three PCs could explain 61.31% of the total variance, which can be considered a significant value due to the spatial extent of the study area. Principal component 1 (29.65%) was associated with variables related to VQI (Fire Risk, Resistance to Drought and Resistance to Erosion) and MQI (Land Use Intensity). PC1 was also associated with albedo, although it did not show a high correlation. Principal component 2 (18.92%) showed a significant correlation with the climatic variables that compose the CQI (Rainfall and Aridity), also correlating with the NDVI. Finally, PC3 (12.75%) was exclusively linked to the component variables of the SQI (Soil Texture, Drainage Classes, and Organic Carbon Content).
In analyzing the results in Figure 6, we can have a better understanding of the relationship between the selected variables, Qis, and ESAs, showing that NDVI, albedo, and VQI are positively correlated with ESAs.
4. Discussion
Difficult access to high computing power has been the main hindrance in analyzing satellite images. The challenge is particularly important in land desertification assessments because of the large amount of data involved in the models, such as the Medalus model. The results have shown the possibility of assessing the extensive area of the East Atlantic Basin.
The CQI exhibits a relatively well-defined spatial distribution, in which the regions to the east of the basin, characterized by having lower altitudes and proximity to the coastal region, are defined as areas of better climate quality. This characteristic can be attributed to high rainfall in the region, which can exceed 2,000 mm in total per year [17]. However, regions close to Chapada Diamantina, in the state of Bahia, are an exception to this spatial distribution, as they have high CQIs, especially the areas located close to two considerably large environmental conservation units, such as the Chapada Diamantina National Park and the Marimbus/Iraquara Environmental Protection Area. The presence of fauna and flora conservation areas works as a mechanism for maintaining and conserving environmental resources, especially water resources.
The regions located to the west and north of the basin are the most sensitive areas from a climatic point of view. These drier regions have a semi-arid climate, with the annual aridity index reaching a value of 0.2, and are distributed across the northeastern agreste and sertão [14]. These areas are still associated with low mean annual rainfall (~600 mm), and higher altitudes when compared to the rest of the East Atlantic Basin, thus receiving a higher incidence of solar energy [18].
The vegetation cover in the study area has a very diversified spatial distribution, being composed mainly of pastures, agriculture and forest occupations. Regarding the VQI, it is noticeable the occurrence of patches or areas with high environmental sensitivity in the central strip, which extends from the northernmost portion of the basin to its southernmost area. These patches are associated with areas with drier characteristics and little rainfall, such as the north of Minas Gerais, west of Sergipe, Center-South and North of Bahia, in addition to having considerable centers of agricultural activities, mainly horticulture and cattle raising, which have been expanding in recent decades [15].
With behavior similar to that observed for CQI, virtually the entire coastal region of the basin, located within the Atlantic Forest biome, shows high vegetation quality, except heavily urbanized and populated areas. Along the entire eastern face of the basin, agricultural and forestry activities stand out, the latter activity being one of the economic engines of this region, mainly due to eucalyptus plantations and pulp and paper industries. Therefore, the presence of vigorous vegetation cover, whether planted or native, tends to protect the soil against erosion and have greater resistance to lack of water, when compared to areas with less vigorous vegetation cover [28,29].
The basin’s soils, for the most part, have medium to good quality, according to the characteristics used for the construction of the SQI. The soils mostly have good drainage and texture classes, in addition to most of the area having low albedo values (< 0.20), indicating a low presence of bare surface. The albedo is indicative of the presence of the forest cover removal process in semi-arid regions, demonstrating that high reflectance values can point to the presence of environmental degradation and increased sensitivity to desertification in regions characterized by drier climate regimes [30]. The areas in the basin with the lowest SQI are located in regions that have sandy soils (S), which are, by nature, highly vulnerable to the erosion process and low water retention capacity [12]. These lower-quality areas are found in the northeast, northwest and south-central portions of the East Atlantic Basin. Compared to the other quality indices, SQI has a low temporal variability, especially the variables St, Sl, Tx and Dd, which take a considerable period to change their characteristics. Thus, when establishing a continuous desertification monitoring program using cloud processing applications, supported by edaphoclimatic variables, the soil parameters require only punctual updates in their configurations.
The MQI of the East Atlantic Basin shows, in the western portion, the areas with lower environmental susceptibilities. These areas are located further inland on the continent and are characterized by having low population density rates (< 100 inhabitants/km. The areas of the western portion of the basin still have a characteristic of low intensity of land use, mainly about the grazing index, showing a tendency to maintain the natural vegetation cover, especially the savanna forest formation [15], and low soil disturbance, although this trend has been changing in recent years, mainly for the development of pastures [31].
Municipalities located closer to the coastal zone of the basin have historically shown higher population densities (> 100 inhab/km2). The high rainfall that occurs in most of these regions made them suitable for the development of these rural activities, as in the extreme south of Bahia [15].
4.2. Environmentally Sensitive Areas (ESAs)
Overall, the spatial distribution of sensitivity to desertification in the East Atlantic Basin was linked to the presence of vigorous vegetation also related to the distribution of rainfall. A considerable portion of the west face of the basin, close to the protection areas in Chapada Diamantina, are little susceptible to desertification, indicating the existence of such areas as a contributing factor to the reduction of impacts and expansion of desertification on ecosystems. When analyzing the areas characterized by high sensitivity to desertification, more specifically to the north of the basin, we can observe that the presence of low-quality soils and high rates of aridity are predominant factors in these locations. Regions with high potential ET rates and low P rates tend to be more susceptible to degradation due to desertification [32,33].
Overall, VQI and MQI jointly contributed to the definition of levels of sensitivity to desertification. This can be attributed to the fact that the Land Use variable was obtained as a function of the vegetation classification present in the basin. SQI and CQI influenced the definition of the basin’s environmental sensitivity independently, not showing a synergistic effect with the other quality indices. These results differ from those obtained elsewhere, in which the CQI and VQI had a correlated influence on the definition of desertification classes and the MQI acted independently [34]. However, in both studies, the SQI had an autonomous contribution, compared to the other indices.
The use of the modified framework of the MEDALUS model proved to be a useful tool for identifying areas susceptible to desertification in the East Atlantic Basin. The model holds the potential to direct public policies and measures aimed at mitigating the impacts resulting from this process that causes environmental degradation. The creation of online and universally accessible tools for monitoring desertification is necessary to help mitigate the impacts of this phenomenon in regions with few economic resources. Thus, access to geoprocessing technologies with high computational capacity to public institutions, free of charge, helps managers in decision-making. From the point of view of methodological improvements, assessing the contribution of more socio-ecological factors to the occurrence of environmental degradation processes resulting from desertification is an important step that may be inserted into the framework of the MEDALUS model in future situations [27] conditioned to the creation and publication of current databases about these parameters.
Spectral indices, such as the NDVI, are viable tools for monitoring and understanding the occurrence of the process of environmental degradation resulting from desertification in arid regions. Conversely, it is possible to observe the existence of a negative correlation between slope and sensitivity to desertification. The slope is an important factor to be observed when analyzing the existence of degradation and desertification processes in an area, as it is a crucial component for the development of erosion processes [8,12], and, similarly to the NDVI, it is possible to use it to monitor areas under environmental pressures and the degradation process [31]. The observation of the existence of a correlation between ESA, slope and NDVI variables is important because of the possibility of using these factors as responses to the process of environmental degradation resulting from desertification [35].
When assessing susceptibility to desertification in Mongolia in different years, a similar trend has been reported between ESA and NDVI over time, indicating that areas with low NDVI values may indicate areas in critical situations of desertification [36]. Under conditions of low information availability, knowing the most important variables allows for building models of environmental sensitivity using these factors as independent variables [37,38,39]. However, it is important to mention that the monitoring of the desertification process using the NDVI does not allow obtaining information about the causes and factors acting on this phenomenon, thereby limiting the planning and management of a certain area.
The use of cloud GEE revealed benefits when compared with GIS software, especially in terms of speed and processing capacity [18,19,40]. Further, GEE also stands out for the high-quality digital databases already available in its public catalog, streamlining. The creation of an environmental monitoring model related to desertification, in a cloud processing system, allows the creation and analysis of historical series from smaller time intervals because of reduced limitations to processing and storage capacity.
A considerable portion of the East Atlantic Basin showed susceptibility to desertification, requiring greater attention from public entities and civil society to reduce the possible impacts of this phenomenon on the local population. The regions further north and midwest of the basin, in the states of Bahia and Sergipe, are in a more critical state. Thus, it is important to prioritize the establishment of public policies in municipalities in these areas. Due to the importance of the parameters related to vegetation for the ESA, the establishment of measures for the promotion, recovery, and conservation of forested areas, and the establishment of sustainable soil management, can help to mitigate the susceptibility of the area to degradation.
5. Conclusions
Approximately 36% of the total area of the East Atlantic Basin is in a critical state of sensitivity to desertification, with areas located in the north and midwest portions having the highest levels of sensitivity to desertification. Conversely, coastal regions had the lowest levels of environmental vulnerability across the basin.
NDVI, slope, and VQI were the edaphoclimatic variables most correlated with the Environmentally Sensitive Area Index of the East Atlantic Basin.
The analysis of the Environmentally Critical Factors Index, in parallel with the Environmentally Sensitive Index, is a relevant mechanism for understanding the importance of each variable for the composition of the MEDALUS model.
Author Contributions
T.H.J.M., software, writing —original draft; B.L.S., writing—review and editing; C.T., supervision, writing—review; A.P., methodology; A.P., formal analysis; O.L.L., data curation; F.A.R., formal analysis, validation; A.C.L.L. writing—review; R.G.S.P., visualization. All authors have read and agreed to the published version of the manuscript.
Funding
This research received no external funding.
Data Availability Statement
Data will be available upon request.
Conflicts of Interest
The authors declare no conflict of interest.
References
- Liu, Z.; Si, J.; Deng, Y.; Jia, B.; Li, X.; He, X.; Zhou, D.; Wang, C.; Zhu, X.; Qin, J.; Ndayambaza, B.; Wang, B. Assessment of land desertification and its drivers in semi-arid alpine mountains: a case study of Qilian Mountains Region, northwest China. Remote Sens. 2023, 15, 3836. [CrossRef]
- Wijitkosum, S. Reducing Vulnerability to Desertification by Using the Spatial Measures in a Degraded Area in Thailand. Land 2020, 9, 49. [CrossRef]
- Ren, Y.; Liu, X.; Zhang, B.; Chen, X. Sensitivity assessment of land desertification in China based on multi-source remote sensing. Remote Sens. 2023, 15, 2674. [CrossRef]
- Bakr, N.; Weindorf, D. C.; Bahnassy, M. H.; El-Badawi, M. M. Multi-temporal assessment of land sensitivity to desertification in a fragile agro-ecosystem: Environmental indicators. Ecol. Indic. 2012, 15, 271-280. [CrossRef]
- Djeddaoui, F.; Chadli, M.; Gloaguen, R. Desertification susceptibility mapping using logistic regression analysis in the Djelfa area, Algeria. Remote Sens. 2017, 9, 1031. [CrossRef]
- Wang, W.; Jiang, Y.; Wang, G.; Guo, F.; Li, Z.; Liu, B. Multi-Scale LBP texture feature learning network for remote sensing interpretation of land desertification. Remote Sens. 2022, 14, 348. [CrossRef]
- Xu, D.; You, X.; Xia, C. Assessing the spatial-temporal pattern and evolution of areas sensitive to land desertification in North China. Ecol. Indic. 2019, 97, 150–158. [CrossRef]
- Meza Mori, G.; Torres Guzmán, C.; Oliva-Cruz, M.; Salas López, R.; Marlo, G.; Barboza, E. Spatial Analysis of Environmentally Sensitive Areas to Soil Degradation Using MEDALUS Model and GIS in Amazonas (Peru): An Alternative for Ecological Restoration. Sustainability 2022, 14, 14866. [CrossRef]
- Abuzaid, A. S.; Abdelatif, A. D. Assessment of desertification using modified MEDALUS model in north Nile Delta, Egypt. Geoderma 2022, 405, 115400. [CrossRef]
- Lahlaoi, H.; Rhinane, Hilali, A.; Lahssini, S.; Moukrim, S. Desertification assessment using MEDALUS model in watershed Oued El Maleh, Morocco. Geosciences 2017, 7, 50. [CrossRef]
- Kosmas, C.; Ferrara, A.; Briassouli, H.; Imeson, A. Methodology for Mapping Environmentally Sensitive Areas (ESAs) to Desertification; European Commission: Luxembourg, 1999.
- Wijitkosum, S. The impact of land use and spatial changes on desertification risk in degraded areas in Thailand. Sustainable Environment Research 2016, 26, 84-92. [CrossRef]
- Vieira, R. M. S. P.; Tomasella, J.; Alvalá, R. C. S.; Sestini, M. F.; Affonso, A. G.; Rodriguez, D. A.; Barbosa, A. A.; Cunha, A. P. M. A.; Valles, G. F.; Crepani, E.; de Oliveira, S. B. P.; de Souza, M. S. B.; Calil, P. M.; de Carvalho, M. A.; Valeriano, D. M.; Campello, F. C. B.; Santana, M. O. Identifying areas susceptible to desertification in the Brazilian northeast. Solid Earth 2015, 6, 347–360. [CrossRef]
- Tomasella, J.; Vieira, R. M. S. P.; Barbosa, A. A.; Rodriguez, D. A.; Santana, M. O.; Sestini, M. S. Desertification trends in the Northeast of Brazil over the period 2000-2016. Int J Appl Earth Obs Geoinformation 2018, 73, 197-206. [CrossRef]
- Chen, R.; Yang, H.; Yang, G.; Liu, Y.; Zhang, C.; Long, H.; Xu, H.; Meng, Y.; Feng, H. Land-Use Mapping with Multi-Temporal Sentinel Images Based on Google Earth Engine in Southern Xinjiang Uygur Autonomous Region, China. Remote Sens. 2023, 15, 3958. [CrossRef]
- Souza, C.M., Jr.; Z. Shimbo, J.; Rosa, M.R.; Parente, L.L.; A. Alencar, A.; Rudorff, B.F.T.; Hasenack, H.; Matsumoto, M.; G. Ferreira, L.; Souza-Filho, P.W.M.; et al. Reconstructing Three Decades of Land Use and Land Cover Changes in Brazilian Biomes with Landsat Archive and Earth Engine. Remote Sens. 2020, 12, 2735. [CrossRef]
- Kadri, N.; Jebari, S.; Augusseau, X.; Mahdhi, N.; Lestrelin, G.; Berndtsson, R. Analysis of Four Decades of Land Use and Land Cover Change in Semiarid Tunisia Using Google Earth Engine. Remote Sens. 2023, 15, 3257. [CrossRef]
- Velastegui-Montoya, A.; Montalván-Burbano, N.; Carrión-Mero, P.; Rivera-Torres, H.; Sadeck, L.; Adami, M. Google Earth Engine: A Global Analysis and Future Trends. Remote Sens. 2023, 15, 3675. [CrossRef]
- Gorelick, N.; Hancher, M.; Dixon, M.; Ilyushchenko, S.; Thau, D.; Moore, R. Google Earth Engine: Planetary-scale geospatial analysis for everyone. Remote sensing of Environment 2017, 202, 18-27. [CrossRef]
- Santos, L.S.; Mendes, L.A. Influence of the Equatorial Pacific Ocean Temperature Oscillation on the Precipitation Regime of the East Atlantic Hydrographic Region. Brazilian Journal of Physical Geography 2020, 13, 1502-1518. [CrossRef]
- Brasil. Ministry of the Environment. East Atlantic Hydrographic Region Notebook. Brasília: Ministry of Health, 2006.
- Karamesouti, M., Panagos, P., Kosmas, C. Model-based spatio-temporal analysis of land desertification risk in Greece. Catena 2018, 167, 266-275. [CrossRef]
- Abatzoglou, J.T.; Dobrowski, S. Z.; Parks, S. A.; Hegewisch, K. C. TerraClimate, a high-resolution global dataset of monthly climate and climatic water balance from 1958–2015. Scientific data 2018, 5, 170191. [CrossRef]
- United Nations Organization for Education, Science and Culture. Map of the world distribution of arid regions: Explanatory note. Paris: Unesco, 1979.
- FAO/IIASA/ISRIC/ISSCAS/JRC. Harmonized world soil database (version 1.2). Rome, Italy and IIASA, Laxenburg, Austria: FAO, 2012.
- Bonafoni, S.; Sekertekin, A. Albedo Retrieval from Sentinel-2 by New Narrow-to-Broadband Conversion Coefficients. IEEE Geoscience and Remote Sensing Letters, 2020, 17, 618-1622. [CrossRef]
- Ferrara, A.; Kosmas, C.; Salvati, L.; Padula, A.; Mancino, G.; Nolè, A. Updating the MEDALUS-ESA Framework for Worldwide Land Degradation and Desertification Assessment. Land Degradation & Development 2020, 31, 1593-1607. [CrossRef]
- Lamqadem, A. A.; Pradhan, B.; Saber, H.; Rahimi, A. Desertification sensitivity analysis using Medalus model and GIS: a case study of the oases of middle draa valley, Marocco. Sensors 2018, 18, 2230. [CrossRef]
- Lahlaoi, H.; Rhinane, Hilali, A.; Lahssini, S.; Moukrim, S. Desertification assessment using MEDALUS model in watershed Oued El Maleh, Morocco. Geosciences 2017, 7, 50. [CrossRef]
- Cunha, J.; Nóbrega, R. L. B.; Rufino, I.; Erasmi, S.; Galvão, C.; Valente, F. Surface albedo as a proxy for land-cover clearing in seasonally dry forests: evidence from the Brazilian Caatinga. Remote Sensing of Environment 2020, 238, 111250. [CrossRef]
- Nabiollahi, K.; Golmohamadi, F.; Taghizadeh-Mehrjardi, R.; Kerry, R.; Davari, M. Assessing the effects of slope gradient and land use change on soil quality degradation through digital mapping of soil quality indices and soil loss rate. Geoderma 2018, 318, 16-28. [CrossRef]
- Vieira, R.M.S.P.; Cunha, A. P. M. A.; Alvalá, R. C. S.; Carvalho, V. C.; Ferraz Neto, S.. Sestini, M. S. Land use and land cover map of a semiarid region of Brazil for meteorological and climatic models. Brazilian Journal of Meteorology 2013, 28, 129-138. [CrossRef]
- Mallick, J.; AlMesfer, M.K.; Singh, V.P.; Falqi, I.I.; Singh, C.K.; Alsubih, M.; Kahla, N.B. Evaluating the NDVI–Rainfall Relationship in Bisha Watershed, Saudi Arabia Using Non-Stationary Modeling Technique. Atmosphere 2021, 12, 593. [CrossRef]
- Silva, R.M.; Santos, C. A. G.; Maranhão, K. U. A.; Lima, R. F. P. Geospatial assessment of eco-environmental changes in desertification area of the Brazilian semi-arid region. Earth Sciences Research Journal 2018, 22, 175-186. [CrossRef]
- Fokeng, R. M.; Fogwe, Z. N. Landsat NDVI-based vegetation degradation dynamics and its response to rainfall variability and anthropogenic stressors in Southern Bui Plateau, Cameron. Geosystem and Geoenvironment 2020, 1, 100075. [CrossRef]
- Lee, E.; Piao, D.; Song, C.; Kim, J.; Lim, C. H.; Kim, E. Assessing environmentally sensitive land to desertification using MEDALUS method in Mongolia. Forest Science and Technology 2019, 15, 210-220. [CrossRef]
- Budak, M.; Günal, H.; Çelik, I.; Yildiz, H.; Acir, N.; Acar, M. Environmental sensitivity to desertification in northern Mesopotamia; application of modified MEDALUS by using analytical hierarchy process. Arabian Journal of Geosciences 2018, 11, 481. [CrossRef]
- Dutra, J. D.; Elmiro, M. A. T.; Garcia, R. A. Comparative analysis of methods applied in vegetation cover delimitation using Landsat 8 images. Soc. Nat. 2020, 32, 699-710. [CrossRef]
- Liu, S.; Wang, T.; Kang, W.; David, M. Several challenges in monitoring and assessing desertification. Environmental Earth Sciences 2015, 73, 7561-7570. [CrossRef]
- Chen, R.; Yang, H.; Yang, G.; Liu, Y.; Zhang, C.; Long, H.; Xu, H.; Meng, Y.; Feng, H. Land-Use Mapping with Multi-Temporal Sentinel Images Based on Google Earth Engine in Southern Xinjiang Uygur Autonomous Region, China. Remote Sens. 2023, 15, 3958. [CrossRef]
Figure 1.
Location map of the East Atlantic Basin.
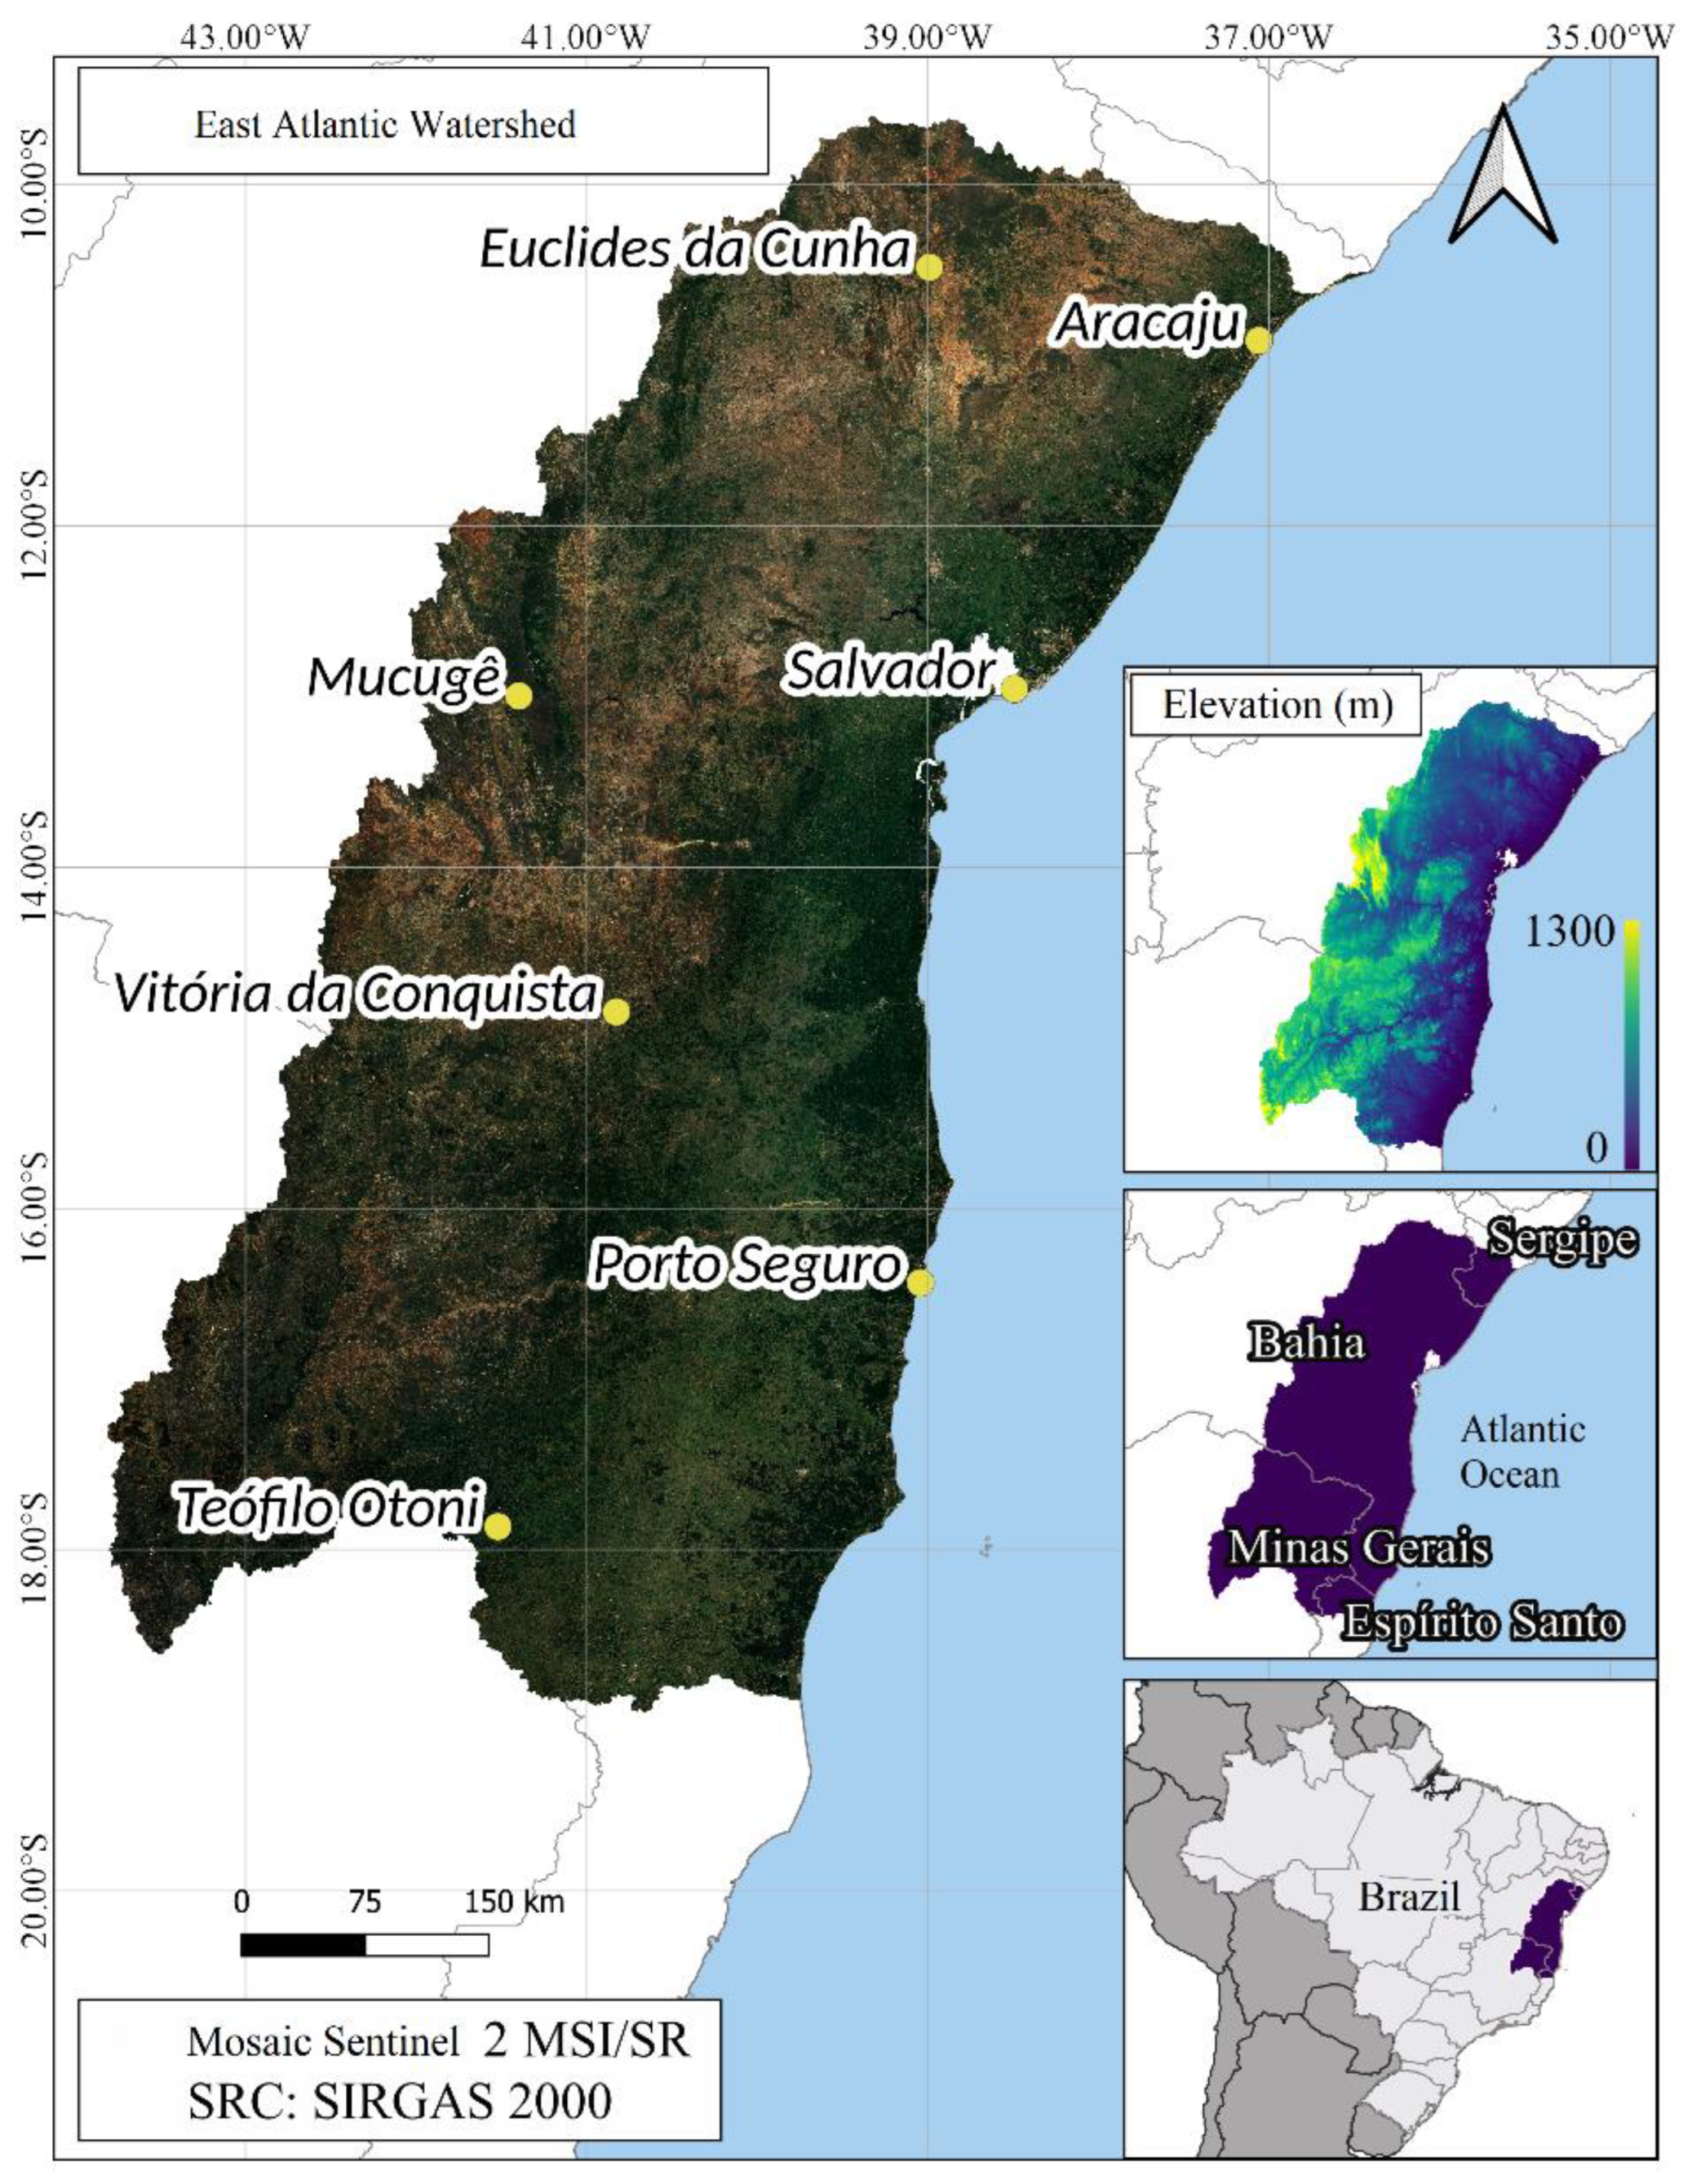
Figure 3.
Spatial distribution of quality indices in the East Atlantic Basin. CQI—climate quality index; VQI—vegetation quality index; SQI—soil quality index; MQI—management quality index.
Figure 3.
Spatial distribution of quality indices in the East Atlantic Basin. CQI—climate quality index; VQI—vegetation quality index; SQI—soil quality index; MQI—management quality index.
Figure 4.
Desertification sensitivity map of the East Atlantic Basin in 2019.
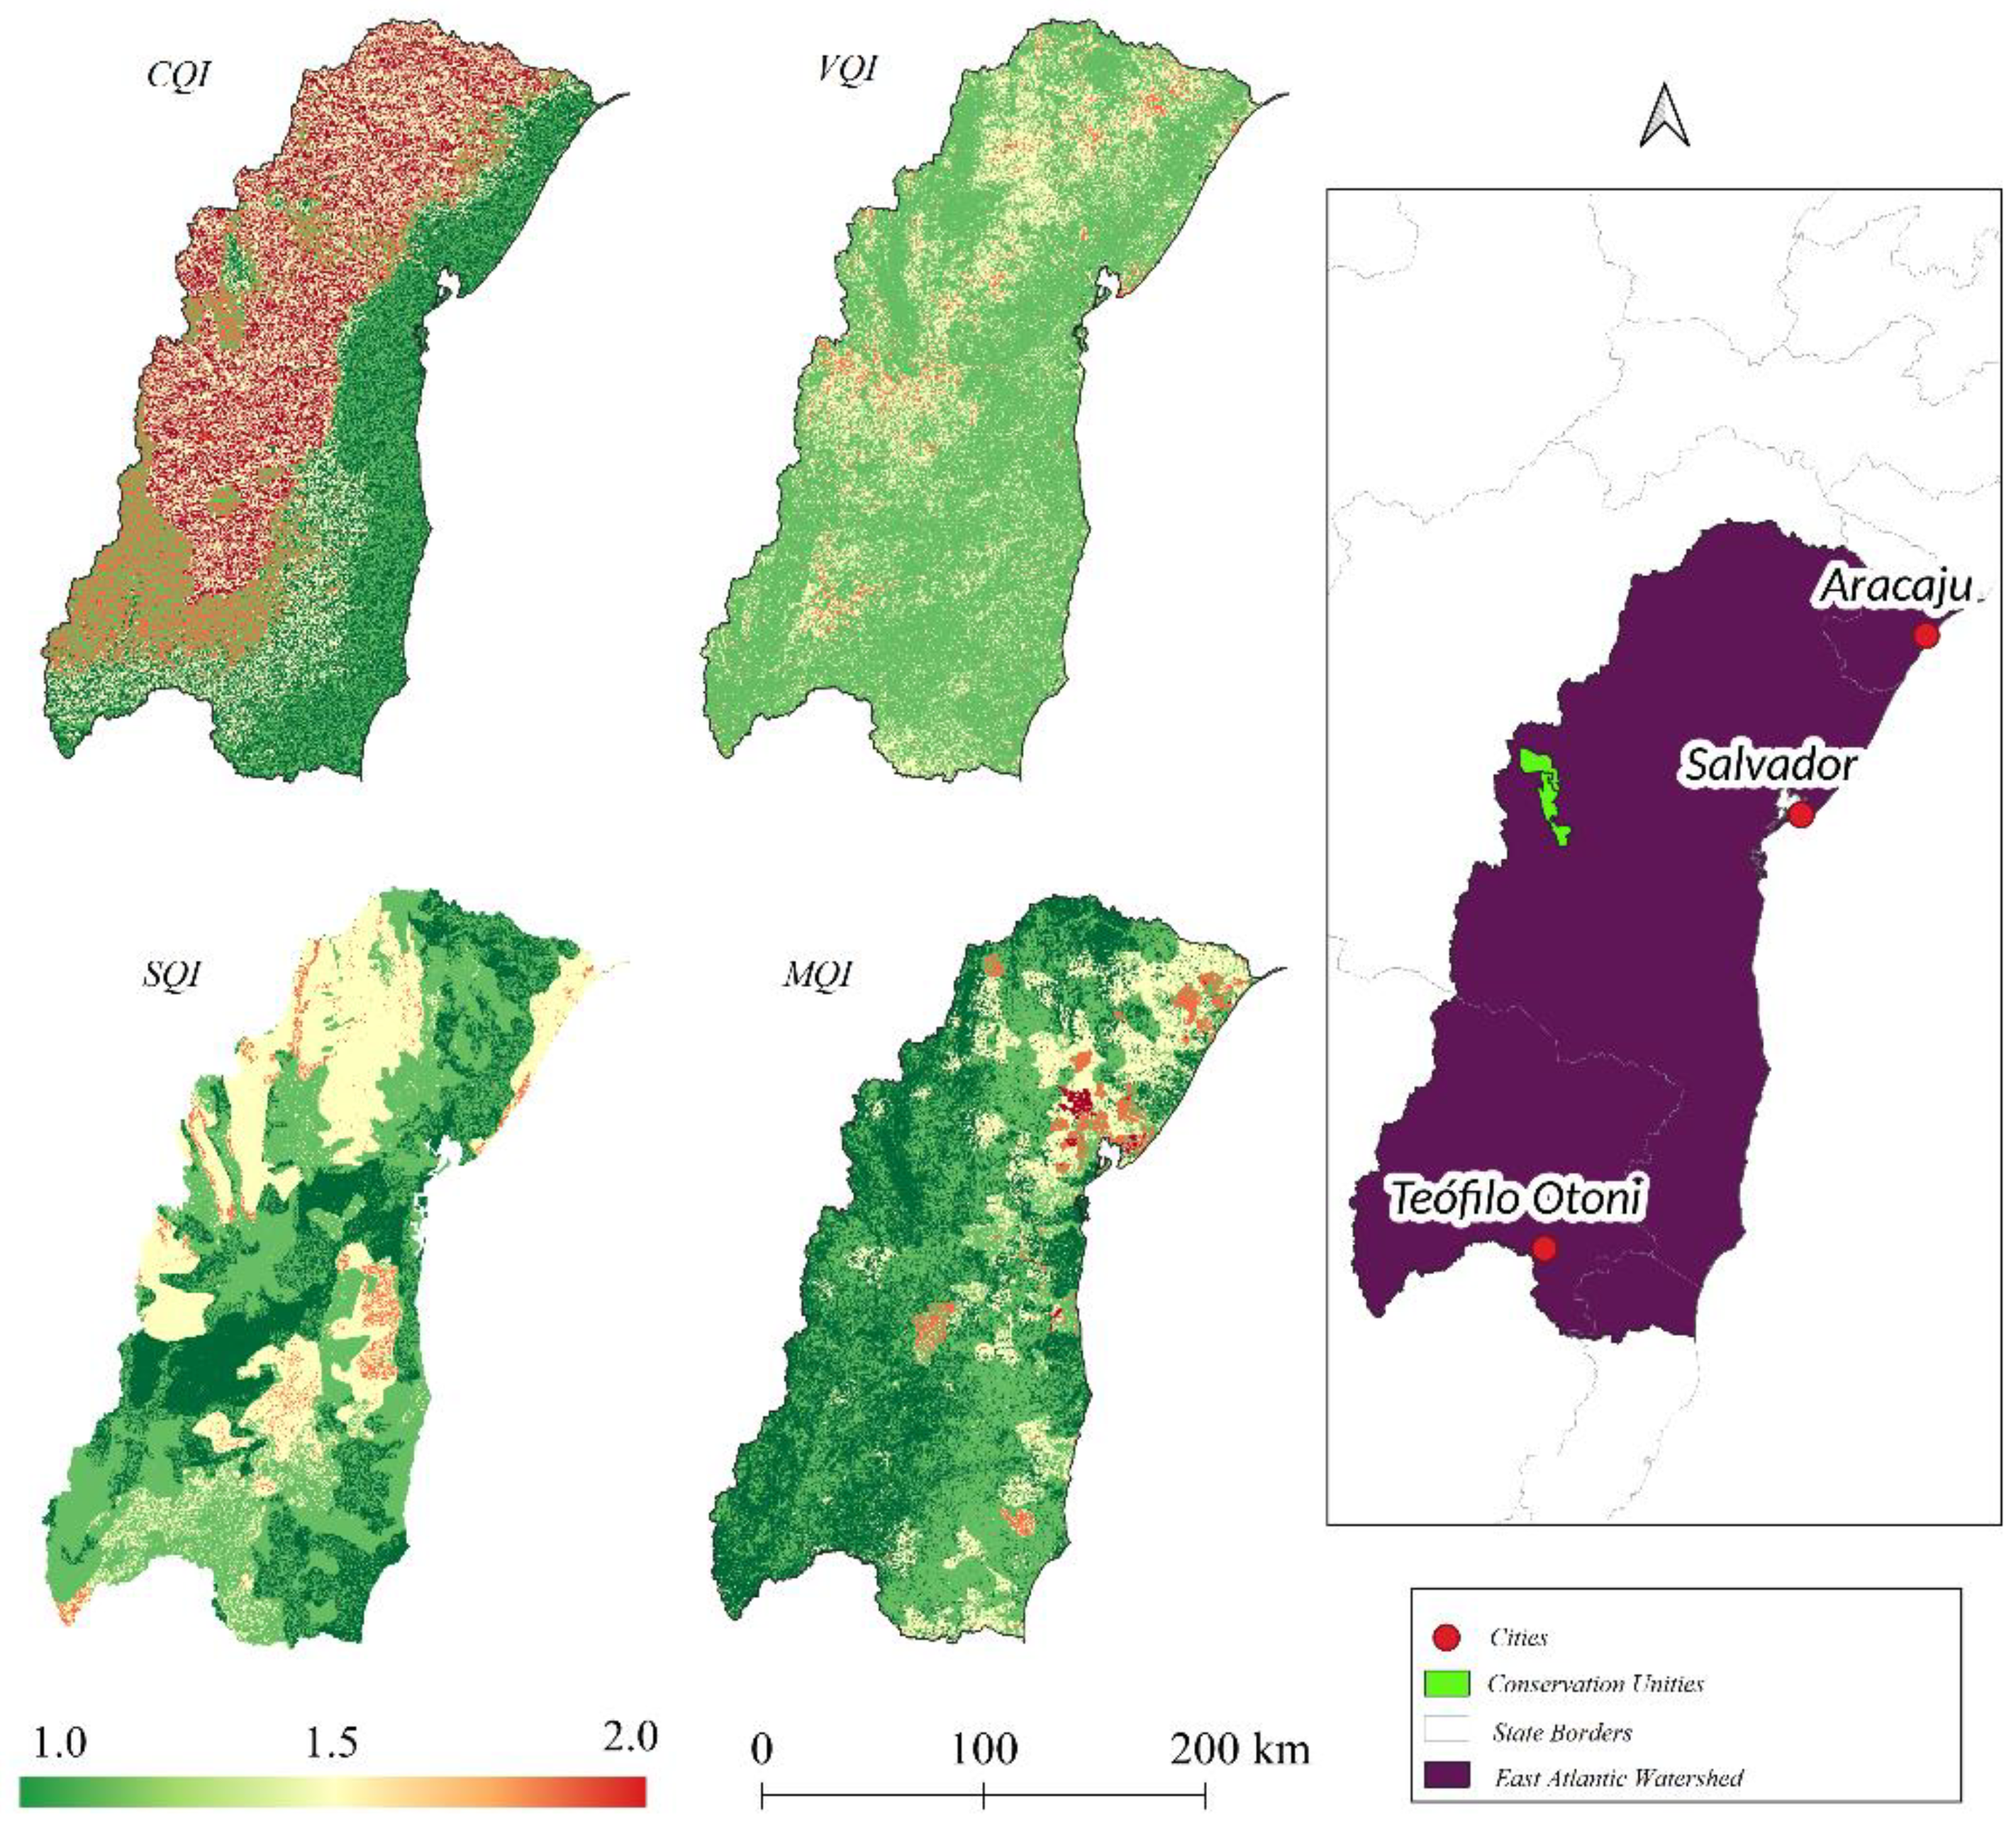
Figure 5.
The number of environmentally critical factors (ECF) in the East Atlantic Basin in 2019—ESA (A), climate (B), vegetation (C), soil (D), and management (E).
Figure 5.
The number of environmentally critical factors (ECF) in the East Atlantic Basin in 2019—ESA (A), climate (B), vegetation (C), soil (D), and management (E).
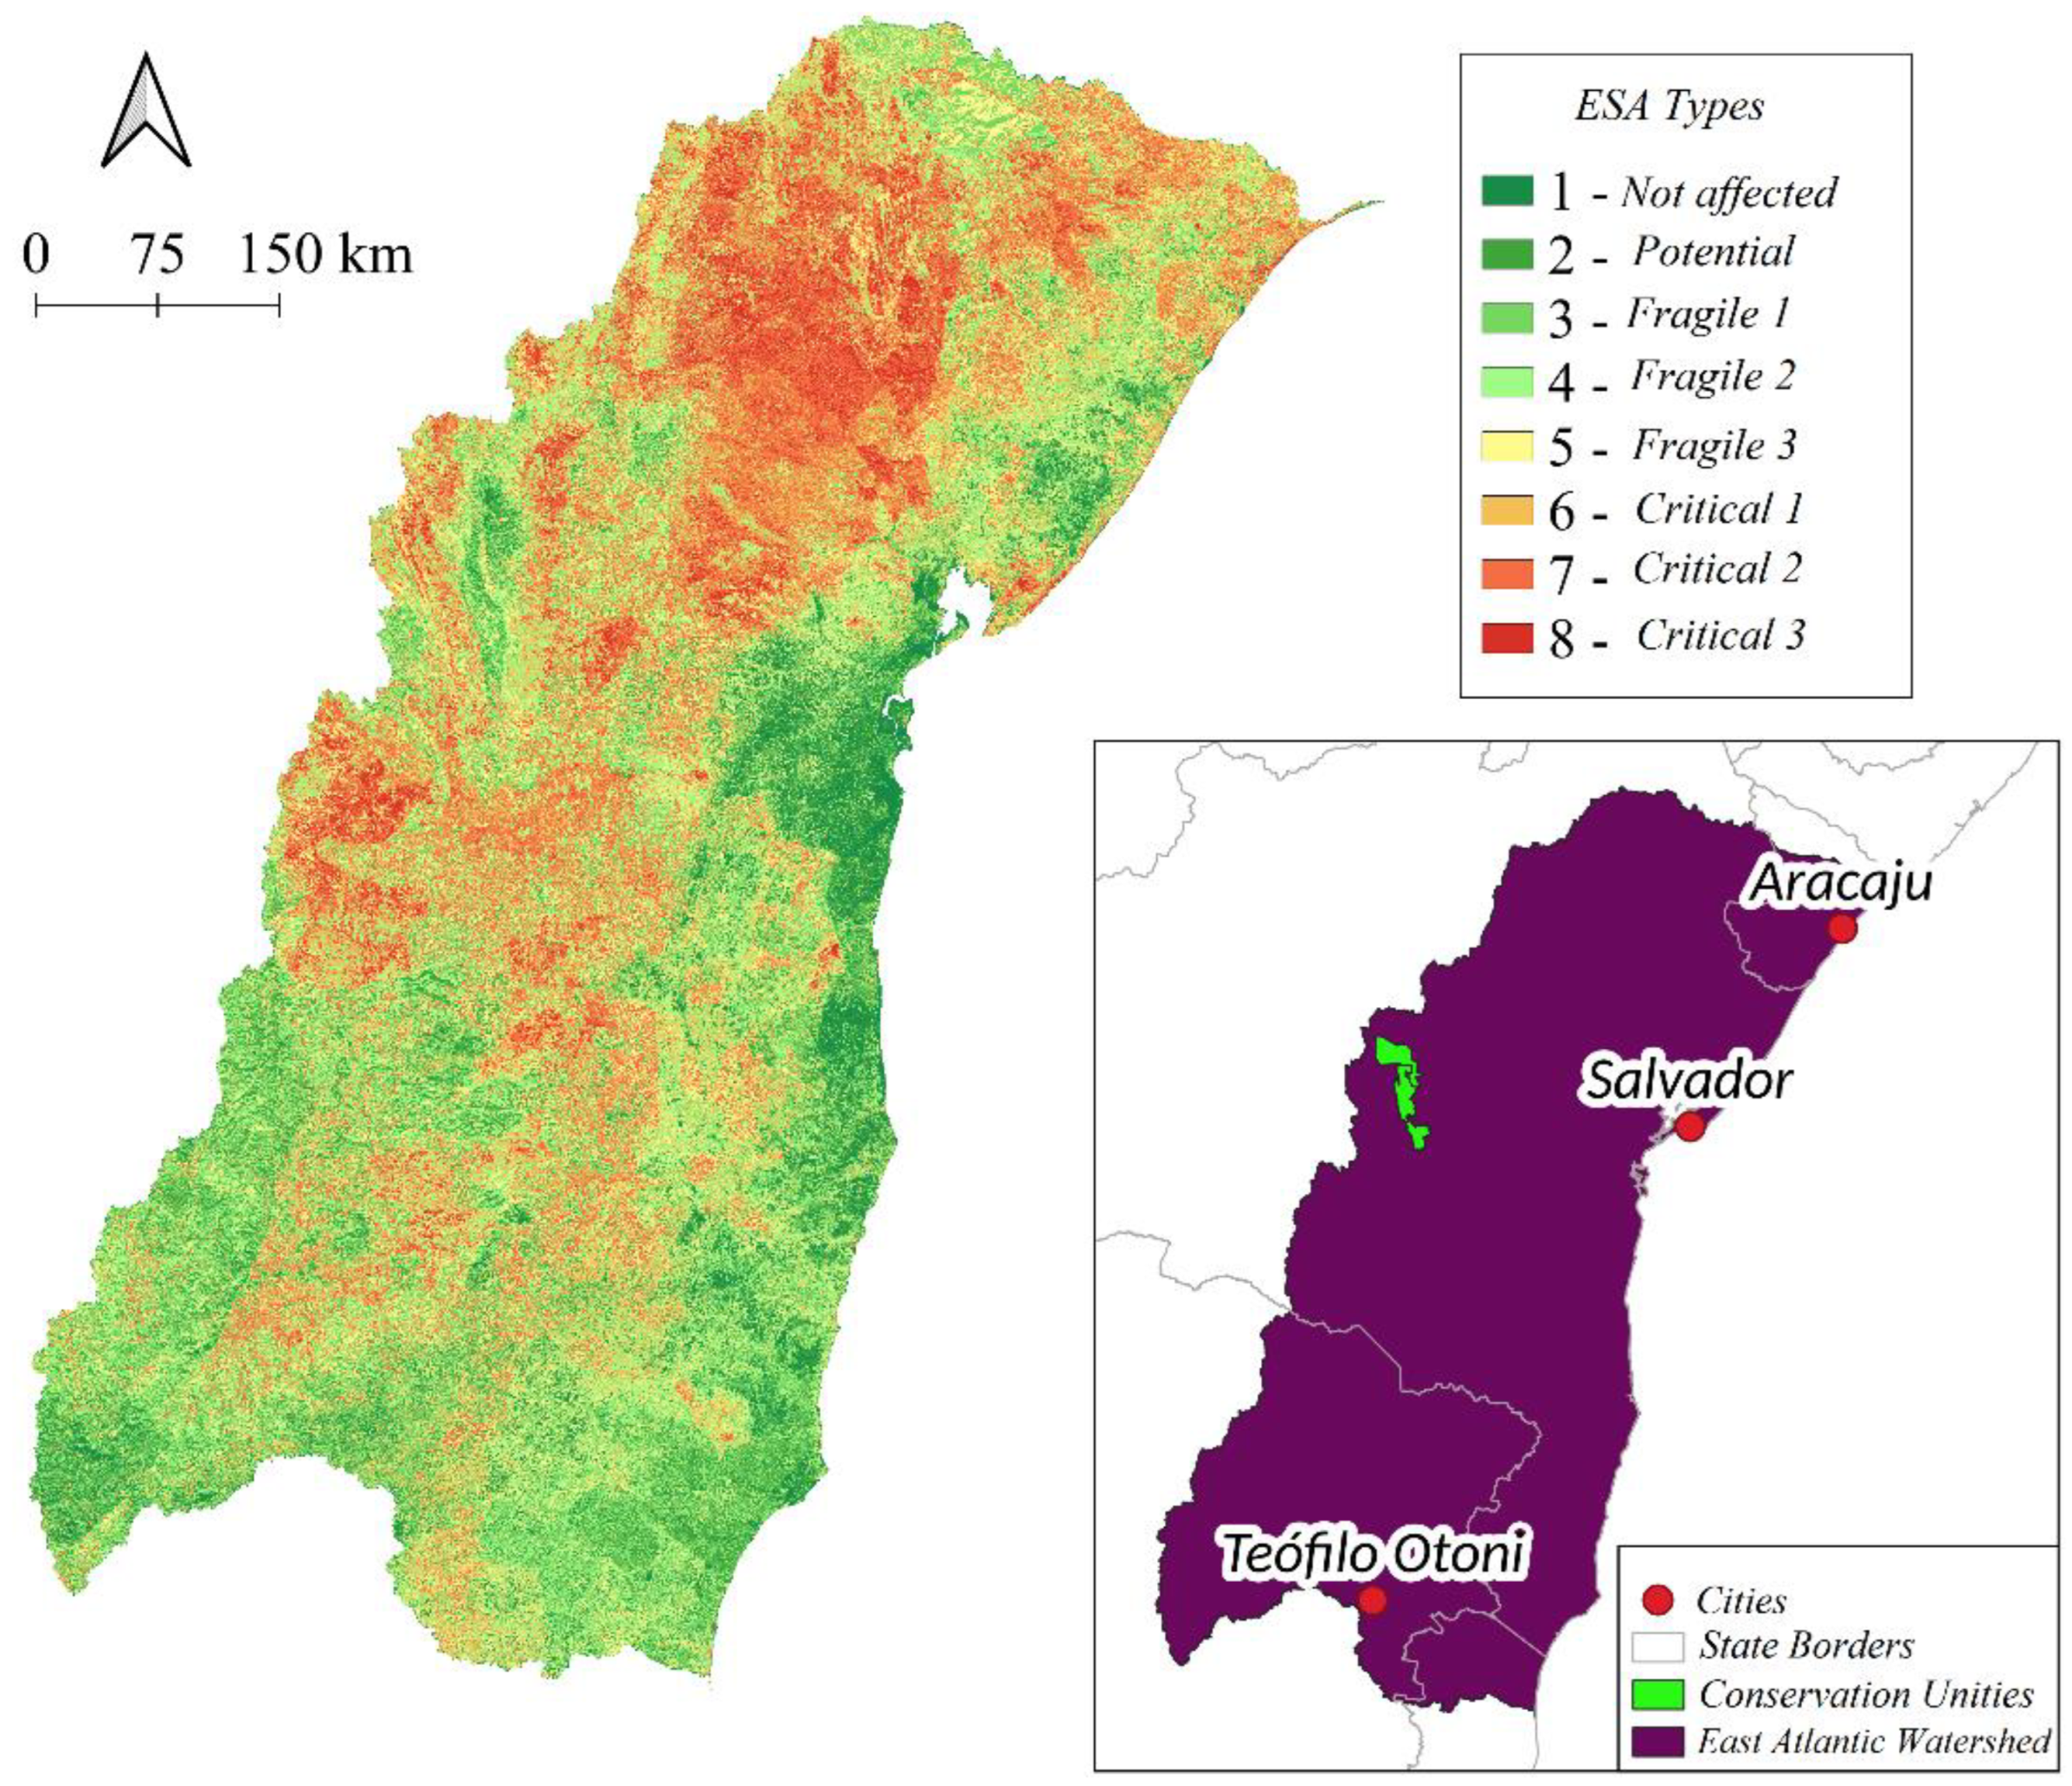
Figure 6.
Principal Component Analysis (PCA) for the component variables of the Environmentally Sensitive Area (ESA) of the East Atlantic Basin.
Figure 6.
Principal Component Analysis (PCA) for the component variables of the Environmentally Sensitive Area (ESA) of the East Atlantic Basin.
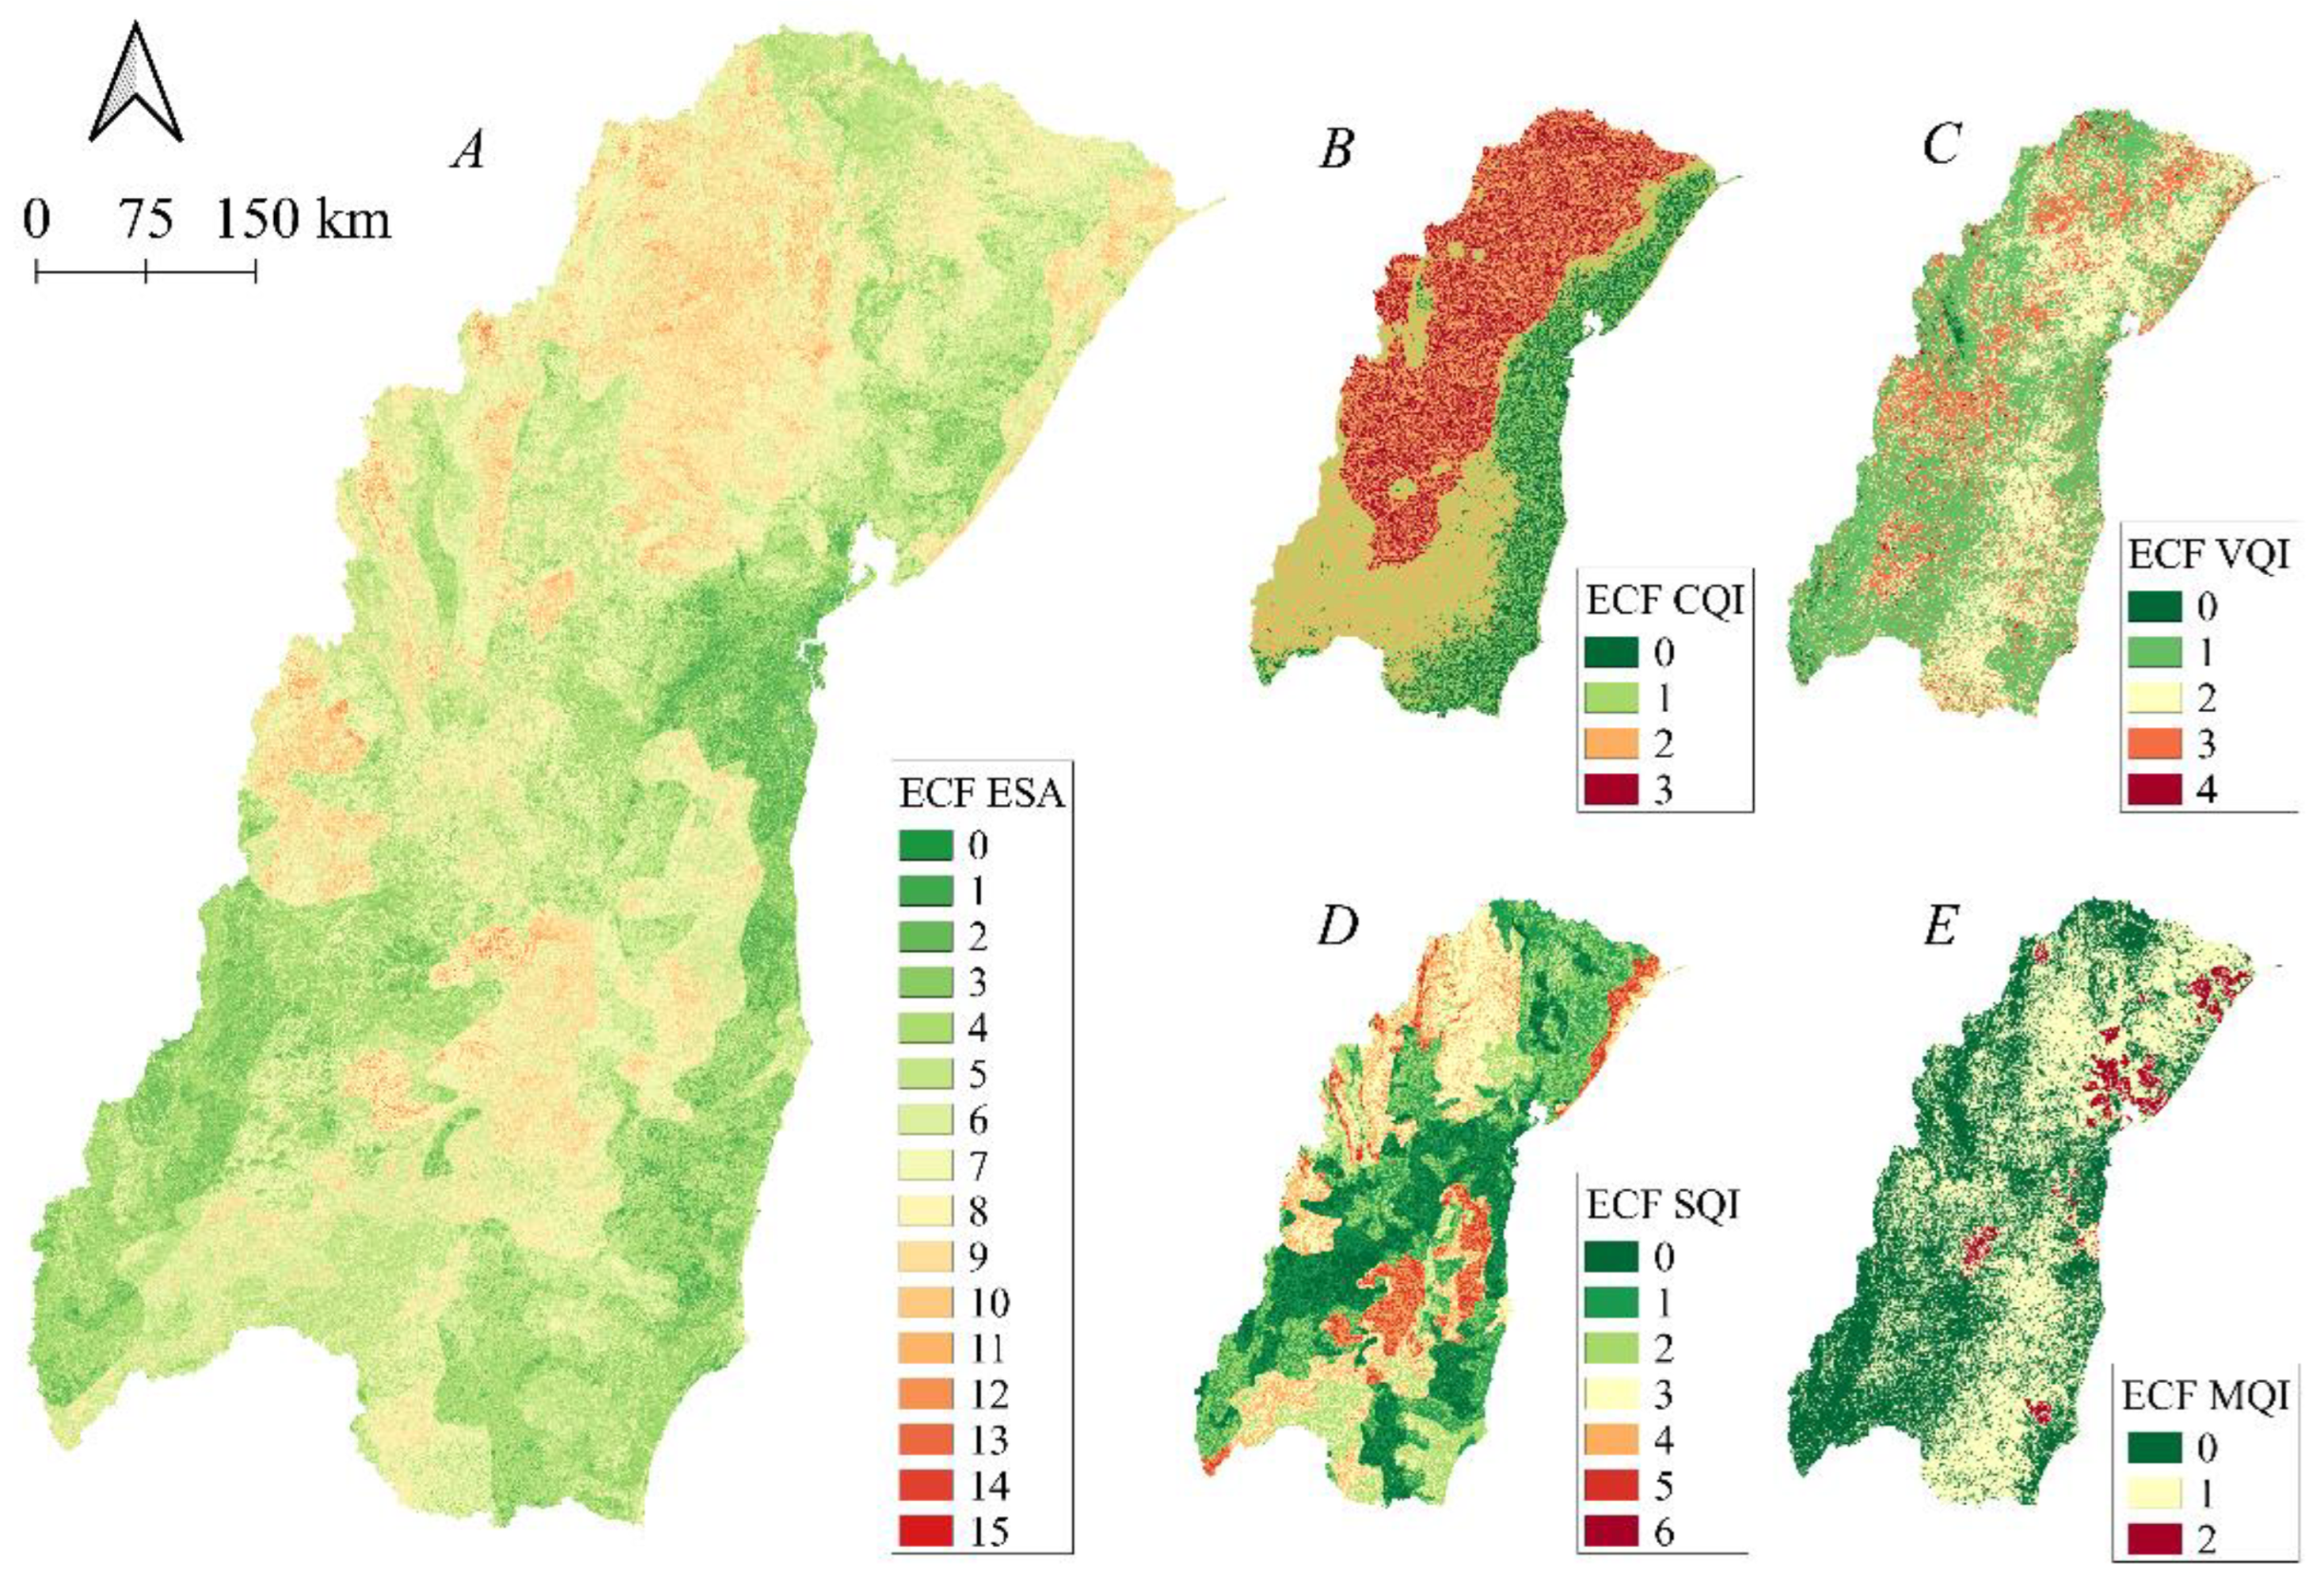
Table 1.
Variables with respective weights used to compose the Quality Indices.
 |
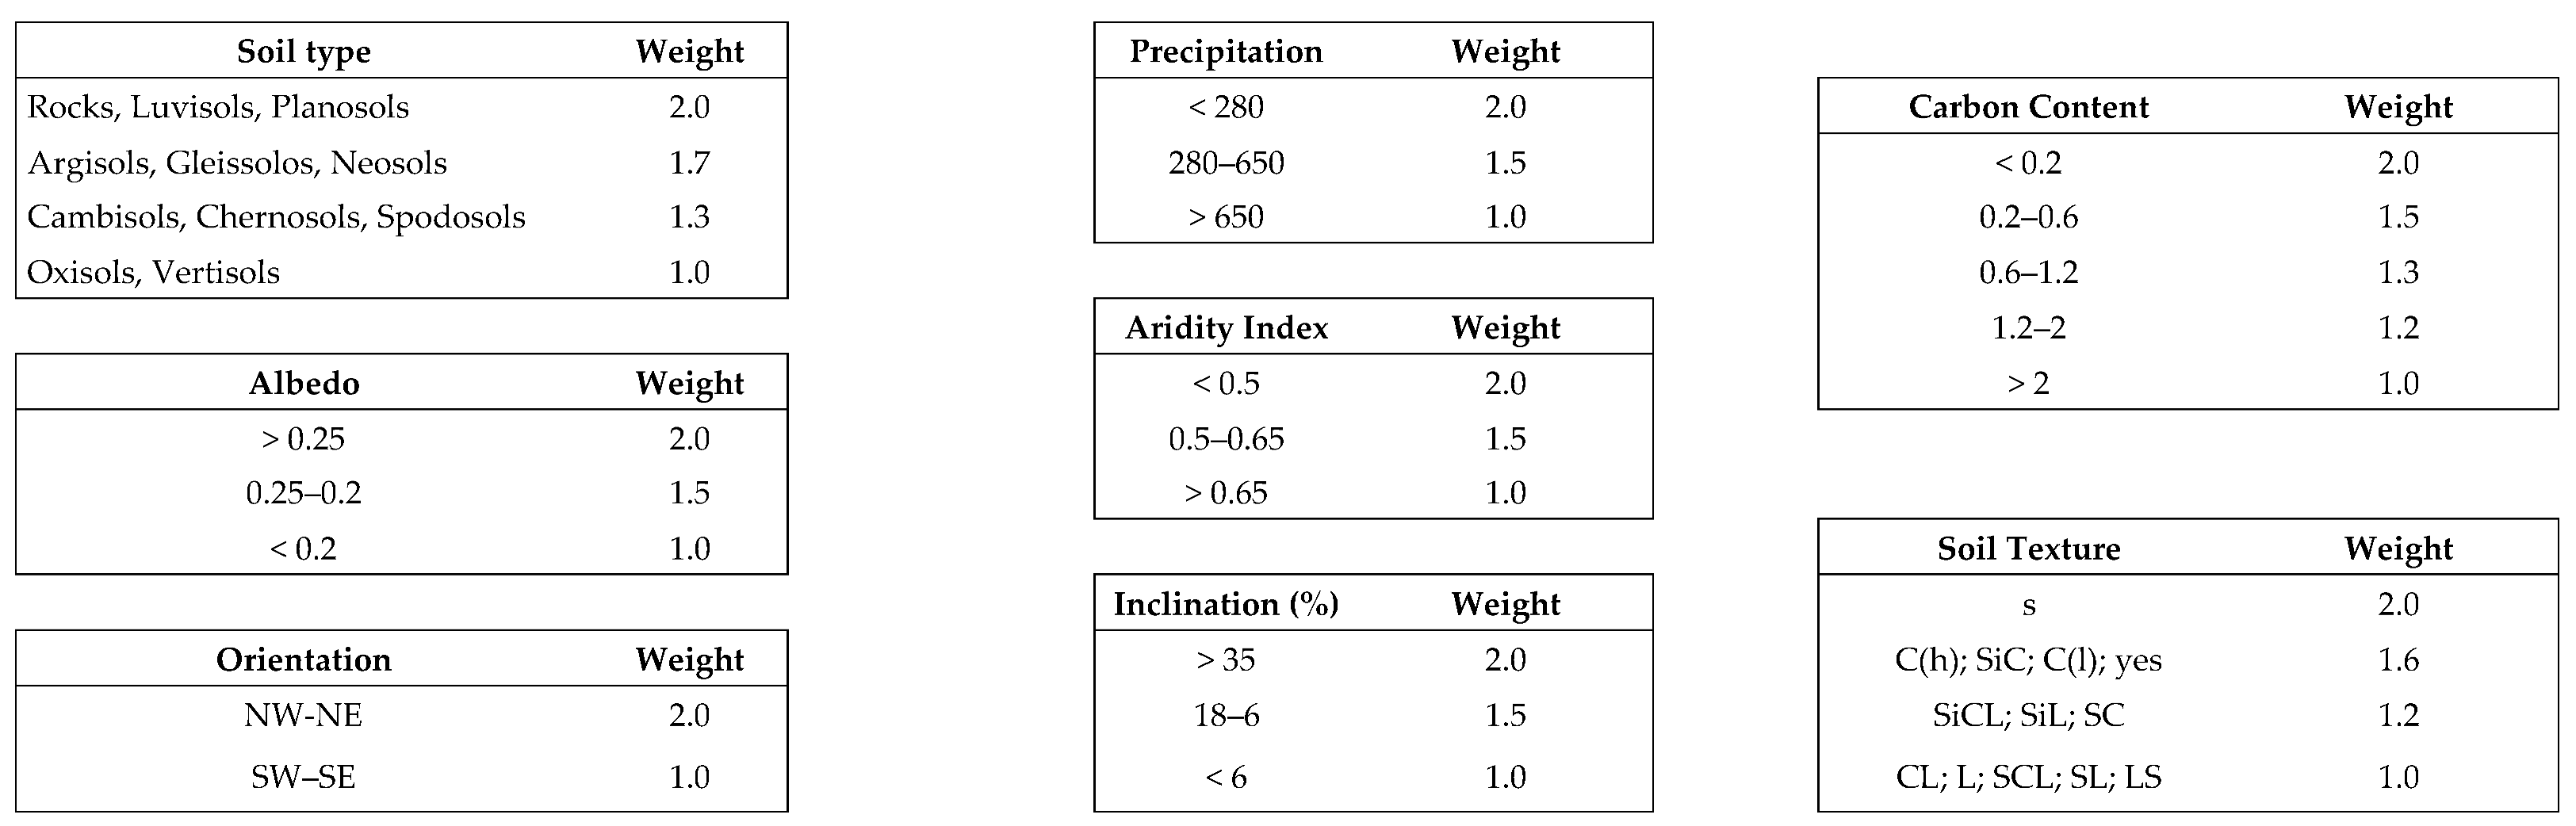 |
Table 2.
Types of Desertification Sensitivity Indices.
| Susceptibility | Weights | Subclasses |
|---|---|---|
| Not affected | < 1.170 | No |
| potentially affected | 1.170–1.225 | P |
| Fragile | 1.225–1.275 | F1 |
| 1.275–1.325 | F2 | |
| 1.325–1.375 | F3 | |
| Critical | 1.375–1.425 | C1 |
| 1.425–1.530 | C2 | |
| > 1.530 | C3 |
Table 3.
Principal Components Analysis (PCA) of the variables composing the Environmentally Sensitive Areas (ESA) index for the East Atlantic Basin.
Table 3.
Principal Components Analysis (PCA) of the variables composing the Environmentally Sensitive Areas (ESA) index for the East Atlantic Basin.
| Variables | PC1 | PC2 | PC3 |
|---|---|---|---|
| Precipitation | 0.12 | 0.86* | 0.04 |
| Aridity | -0.15 | 0.89* | 0.00 |
| Guidance | -0.37 | -0.17 | 0.14 |
| Fire risk | -0.82* | 0.34 | -0.16 |
| drought resistance | 0.91* | -0.17 | 0.14 |
| NDVI | 0.33 | 0.70 | 0.04 |
| Erosion resistance | 0.90* | 0.00 | 0.18 |
| Soil texture | -0.19 | 0.06 | 0.84* |
| Drainage class | -0.13 | 0.12 | 0.76* |
| Albedo | 0.61* | 0.35 | -0.17 |
| Soil type | 0.40 | 0.01 | -0.02 |
| Slope | -0.52 | -0.51 | -0.04 |
| OC content | -0.15 | -0.11 | 0.69* |
| LU intensity | 0.89* | -0.13 | 0.11 |
| Population density | 0.41 | -0.46 | -0.08 |
| CQI | -0.10 | 0.92* | 0.03 |
| VQI | 0.75* | 0.46 | 0.11 |
| SQI | -0.06 | 0.02 | 0.88* |
| MQI | 0.76* | -0.39 | 0.00 |
| ESA | 0.51 | 0.55 | 0.43 |
| Eigenvalues | 4.45 | 2.84 | 1.91 |
| Variance (%) | 29.65 | 18.92 | 12.75 |
| Accumulated variance (%) | 29.65 | 48.56 | 61.31 |
* indicates factor loadings > 0.6.
Disclaimer/Publisher’s Note: The statements, opinions and data contained in all publications are solely those of the individual author(s) and contributor(s) and not of MDPI and/or the editor(s). MDPI and/or the editor(s) disclaim responsibility for any injury to people or property resulting from any ideas, methods, instructions or products referred to in the content. |
© 2023 by the authors. Licensee MDPI, Basel, Switzerland. This article is an open access article distributed under the terms and conditions of the Creative Commons Attribution (CC BY) license (http://creativecommons.org/licenses/by/4.0/).
Copyright: This open access article is published under a Creative Commons CC BY 4.0 license, which permit the free download, distribution, and reuse, provided that the author and preprint are cited in any reuse.


