Preprint
Article

Distributional Response of the Rare and Critically Endangered Ilex nanchuanensis to Climate Change in East Asia

Altmetrics

Downloads

107

Views

40

Comments

0

A peer-reviewed article of this preprint also exists.

Submitted:

04 September 2023

Posted:

06 September 2023

You are already at the latest version

Alerts
Abstract
Global climate change, dominated by climate warming, is seriously affecting the balance of global ecosystems, but the risk of species extinction is particularly high in low-altitude mountain areas. To clarify the response of the endemic and critically endangered species Ilex nanchuanensis to climate change, this study used the MaxEnt model to simulate and predict the potential habitat of I. nanchuanensis during the Last Interglacial, Last Glacial Maximum, the current period, and two future periods (the 2050s and 2070s). The results showed that the hottest monthly minimum temperature is the most important climatic factor affecting the geographical distribution of I. nanchuanensis. Furthermore, I. nanchuanensis will be at risk of population shrinkage and extinction in the future, with the center of mass moving further northwest as concentrations of greenhouse gases increase, especially in the 2070s, when its geographical distribution shrinks the most under the RCP6 scenario. Global warming is causing habitat degradation for many species and will continue to migrate to higher altitudes and latitudes in the future, seriously affecting the global ecosystem balance. Therefore, to actively respond to the impacts of climate change, protected areas should be established around the geographical distribution centers of species, and core, buffer, and experimental areas should be scientifically and rationally delineated for the conservation and cultivation of germplasm resources.
Keywords: 
Subject: Biology and Life Sciences  -   Forestry

1. Introduction

Global climate change alters the temperature and precipitation patterns on the Earth’s surface [1,2,3,4,5,6], which in turn affects plant growth and development patterns, morphological structures, and geographic distribution patterns[7,8,9,10,11,12] , ultimately endangering the diversity and stability of global ecosystems[13,14,15] . Global climate change, dominated by climate warming[16,17] , is one of the greatest threats to, and challenges for, ecosystem balance[18,19,20,21]. The Sixth Assessment Report on Climate Change published by the Intergovernmental Panel on Climate Change (IPCC) in 2021 states that the global surface temperature increased by 0.99°C from 2001 to 2020 compared to the previous century [22,23], and global warming is expected to continue to 1.5°C by 2030—2052[24]. Thomas et al. (2004) found that approximately 37% of species globally will be at risk of extinction and habitat loss by 2050 as a result of climate warming[25], while Urban (2015) found that the risk of species extinction accelerates with increasing temperatures[26], especially for some rare and endangered species with small population sizes, high habitat specificity, and severe habitat fragmentation[27,28]. Daskalova et al. (2020) found that rare and endangered species with small population sizes and limited geographic distributions will be the first to go extinct[29]. In addition, mountain ranges are crucial for global sustainable development because of their specific geographic features and diverse climates[30,31]. Global climate change has caused serious harm to species living in mountainous regions[32,33,34,35,36], and such species are more sensitive to climate change and at greater risk of species extinction[37,38,39,40]. This is especially true for the native plants of low-altitude mountain areas, which will be limited in terms of their vertical dispersal, leading to a greater risk of extinction[41]. Therefore, analyzing the response of rare and critically endangered species in low-altitude mountain areas to climate change can not only clarify the dominant climatic factors affecting the geographical distributions of species, but also be crucial for vegetation restoration and ecological conservation efforts.
Species distribution models (SDMs) are widely used in the fields of endangered species conservation and species invasion[42,43,44,45], and can efficiently and accurately analyze the effects of global changes on species distributions and diversity patterns[46]. SDMs are effective tools for predicting the effects of climate change on the distributions of endangered species in the context of ecological conservation and management[47]. Several widely used SDMs emerged in the late 20th century, among which the MaxEnt (Maximum Entropy) model not only has stable predictive performance, but also has higher accuracy[48,49]. By studying the distribution data of 226 species, Elith and Graham et al. (2006) concluded that the MaxEnt model simulated the best results[50]. Meanwhile, Prevéy, J. S. et al. (2020) used the MaxEnt model to predict the potential fitness zone and phenology of Vaccinium membranaceum (American lingonberry) and found that the simulated results were in good agreement with observations[51]. The MaxEnt model is an ecological niche model based on the theory of maximum entropy[52], and is the preferred model for predicting the potential distributions of critically endangered species because of its simplicity, high degree of accuracy, low sample size requirement, and high stability compared to other modeling methods [53,54,55].
Ilex nanchuanensis is a species of holly tree endemic to China and is classified as critically endangered in the IUCN’s Red List of Threatened Species , standard conservation level. It is mainly found on Jinfo Mountain (the highest peak of the Dalou Mountains in Nanchuan District, Chongqing, China) at altitudes of 600–800 m. It has high economic and ecological value and plays an important role in the ecological balance and water conservation of the region; plus, it is an important indicator species for the state of the ecological environment[56,57]. To date, little research has been reported on I. nanchuanensis, and in particular, its response to climate change remains unclear. Therefore, using the MaxEnt model to simulate the response of the geographic distribution of I. nanchuanensis to climate change will not only help to clarify the causes of habitat loss and potential species extinction, but also the effects of strengthened climate change on its potential geographic distribution, thus providing a theoretical and practical basis for conservation management of this species as well as other rare and endangered species.
In this study, based on current distribution data for I. nanchuanensis and climatic factors in different periods, the MaxEnt model, combined with ArcGIS software, was used to simulate the potential habitat of the I. nanchuanensis during the Last Interglacial (LIG), the Last Glacial Maximum (LGM), the current period, and two future periods (2050s and 2070s), to clarify the response of this cherished and critically endangered species to climate change, as well as provide a theoretical and practical basis for conservation management of not only this species but also other rare and endangered species throughout the world living in fragile habitats.

2. Materials and methods

2.1. Species distribution data

Specimen record points were obtained by searching the literature, resource survey reports, and herbaria (e.g., the China Virtual Herbarium, Global Biodiversity Information Facility database, China Biological Species List 2022, Flora of China, Plant Science Data Center)[45,58], removing duplicate records and sample record points lacking geographic information, and using Google Maps software to 5 km. The spatially overlapping data points within the range were removed and the coordinate system was converted to latitude and longitude information, and 34 samples of I. nanchuanensis were obtained with clear geographic information centered on Nanchuan District, Chongqing, China [46,59].

2.2. Bioclimatic data acquisition and screening

The bioclimatic data were obtained from the WorldClim database (http://www.worldclim.com (accessed on Oct. 25, 2022)) at a resolution of 2.5 arc-min[60,61]. The data contain four sections: the LIG period (120,000–14,000 years ago), the LGM period (22,000 years ago), the current period (1970–2000), and two future periods (the 2050s and 2070s). They include 19 climatic factors, such as monthly precipitation, monthly mean temperature, monthly maximum temperature, and monthly minimum temperature (Figure 1). To avoid the influence of correlation between climatic factors on the simulation results, according to the climatic factor screening method of Yang and Kushwaha et al. (2013), multicollinearity analysis was used in SPSS19.0 to detect the correlation between variables[62]. Environmental variables with correlation values <0.8 were retained, and their contribution rates were analyzed. Six climatic factors were finally screened to construct the model (Table 1): seasonal temperature variation (Bio4); hottest monthly minimum temperature (Bio6); annual mean temperature range (Bio7); wettest monthly precipitation (Bio13); seasonal precipitation (Bio15); and driest quarterly precipitation (Bio17).
With reference to the IPCC’s assessment reports, four greenhouse gas emission scenarios (Representative Concentration Pathways, RCPs) were employed: the low emission (RCP2.6) scenario; two moderate emission scenarios (RCP4.5 and RCP6), and the high emission (RCP8.5) scenario [63,64]. Among the various state-of-the-art climate models, it was found that BCC-CSM1.1 (Beijing Climate Center, Climate System Model, version 1.1) was more consistent with the characteristics of climate change in China, while MIROC-ESM (Model for Interdisciplinary Research on Climate, Earth System Model) and CCSM4 (Community Climate System Model, version 4) were used for the LGM period [42].

2.3. MaxEnt model operation and evaluation

Geographical distribution data (in CSV format) and bioclimatic data (in ASC format) were imported into the MaxEnt model for calculation, while the bioclimatic data needed to be modeled separately with the geographical distribution data of the species according to the different periods. Following the method of Moreno et al. (2011), the bioclimatic factors in the model were set as continuous variables, and then bioclimatic data for the LGM, LIG, and future periods (2050s and 2070s) were input in turn to analyze the geographic distribution of I. nanchuanensis for each of these periods[65]. Response curves were constructed by selecting the ‘Create response curves’ option. To ensure the accuracy and objectivity of the data, the MaxEnt model should be constructed by randomly selecting 75% of the species’ geographic distribution as training values, while the remaining 25% of the data should be tested by 100 replications to test the model and create ROC (receiver operating characteristic) curves. The remaining model parameters were operated according to the default values of the software[66].
The results of any model simulation need to be evaluated comprehensively. After the MaxEnt model was established, the area under the ROC curve was selected for evaluation in order to verify the accuracy of the evaluation results, and the AUC (area under curve) value was used as an important indicator to measure the predictive ability of the evaluation model. Note that, because the AUC value is the MaxEnt model’s own procedure, the simulation process does not require additional thresholds, is involved in the assessment of simulation predictions of the potential geographic distribution of numerous species, and has a high degree of accuracy[67,68]. The AUC takes values in the range [0, 1], and values closer to 1 prove that the model’s results are more accurate [69]. In general, when the AUC value is >0.7, it proves that the model’s simulation results are good, as well as indicating potentially suitable geographic distribution areas for the species[70].

2.4. Classification of habitat suitability

The results of the MaxEnt model simulations were collated and analyzed based on ArcGIS software and converted to Raster format, and the spatial analysis tool was used to classify and visualize the species’ suitability zones and to obtain a map of the potentially suitable geographic distribution zones of I. nanchuanensis in different historical periods. The results of the MaxEnt model were interpreted in the form of the fitness probability P of the species occurring in the area to be tested, with P taking values in the range [0, 1]. In addition, based on the actual distribution of I. nanchuanensis and the methodology reported by the IPCC, the suitable areas for the species were classified into four types: non-suitable (P < 0.049), low suitability (0.049 ≤ P < 0.196), medium suitability (0.196 ≤ P < 0.441), and high suitability (0.441 ≤ P < 0.833). Finally, the areas of different fitness classes of I. nanchuanensis in the different historical periods were calculated using the area statistics function in the spatial analysis tool[71].

2.5. Analysis of centroid migration in suitable distribution areas

The center of mass is the equilibrium point of moment for species in a region during a historical period, and can effectively represent the spatial aggregation and migration of species over a relative period of time. The Toolbox software in the SDM can capture the location of the species’ center of mass and analyze the changes in the migration of the species’ center of mass in different historical periods by combining geographical information data such as latitude and longitude[72,73]. The methods were as follows: (1) The results of the MaxEnt model simulating the potential geographic distribution of I. nanchuanensis were transformed into a vector binary, and the suitability of the suitability zone was defined according to the suitability probability P, with P ≥ 0.5 being the total suitability zone and P < 0.5 being the non-suitable zone. (2) Using the Zonal Geometry statistical tool in the Spatial Analysis Tool, the plasmodesmata were selected in the Geometry Type option to capture the specific coordinates of the placenames in the species-suitable zone that were captured. (3) The placenames of I. nanchuanensis were analyzed at different times and under different climatic conditions, and the migration direction and distance of I. nanchuanensis were finally assessed[46].

3. Results

3.1. Accuracy of model analysis

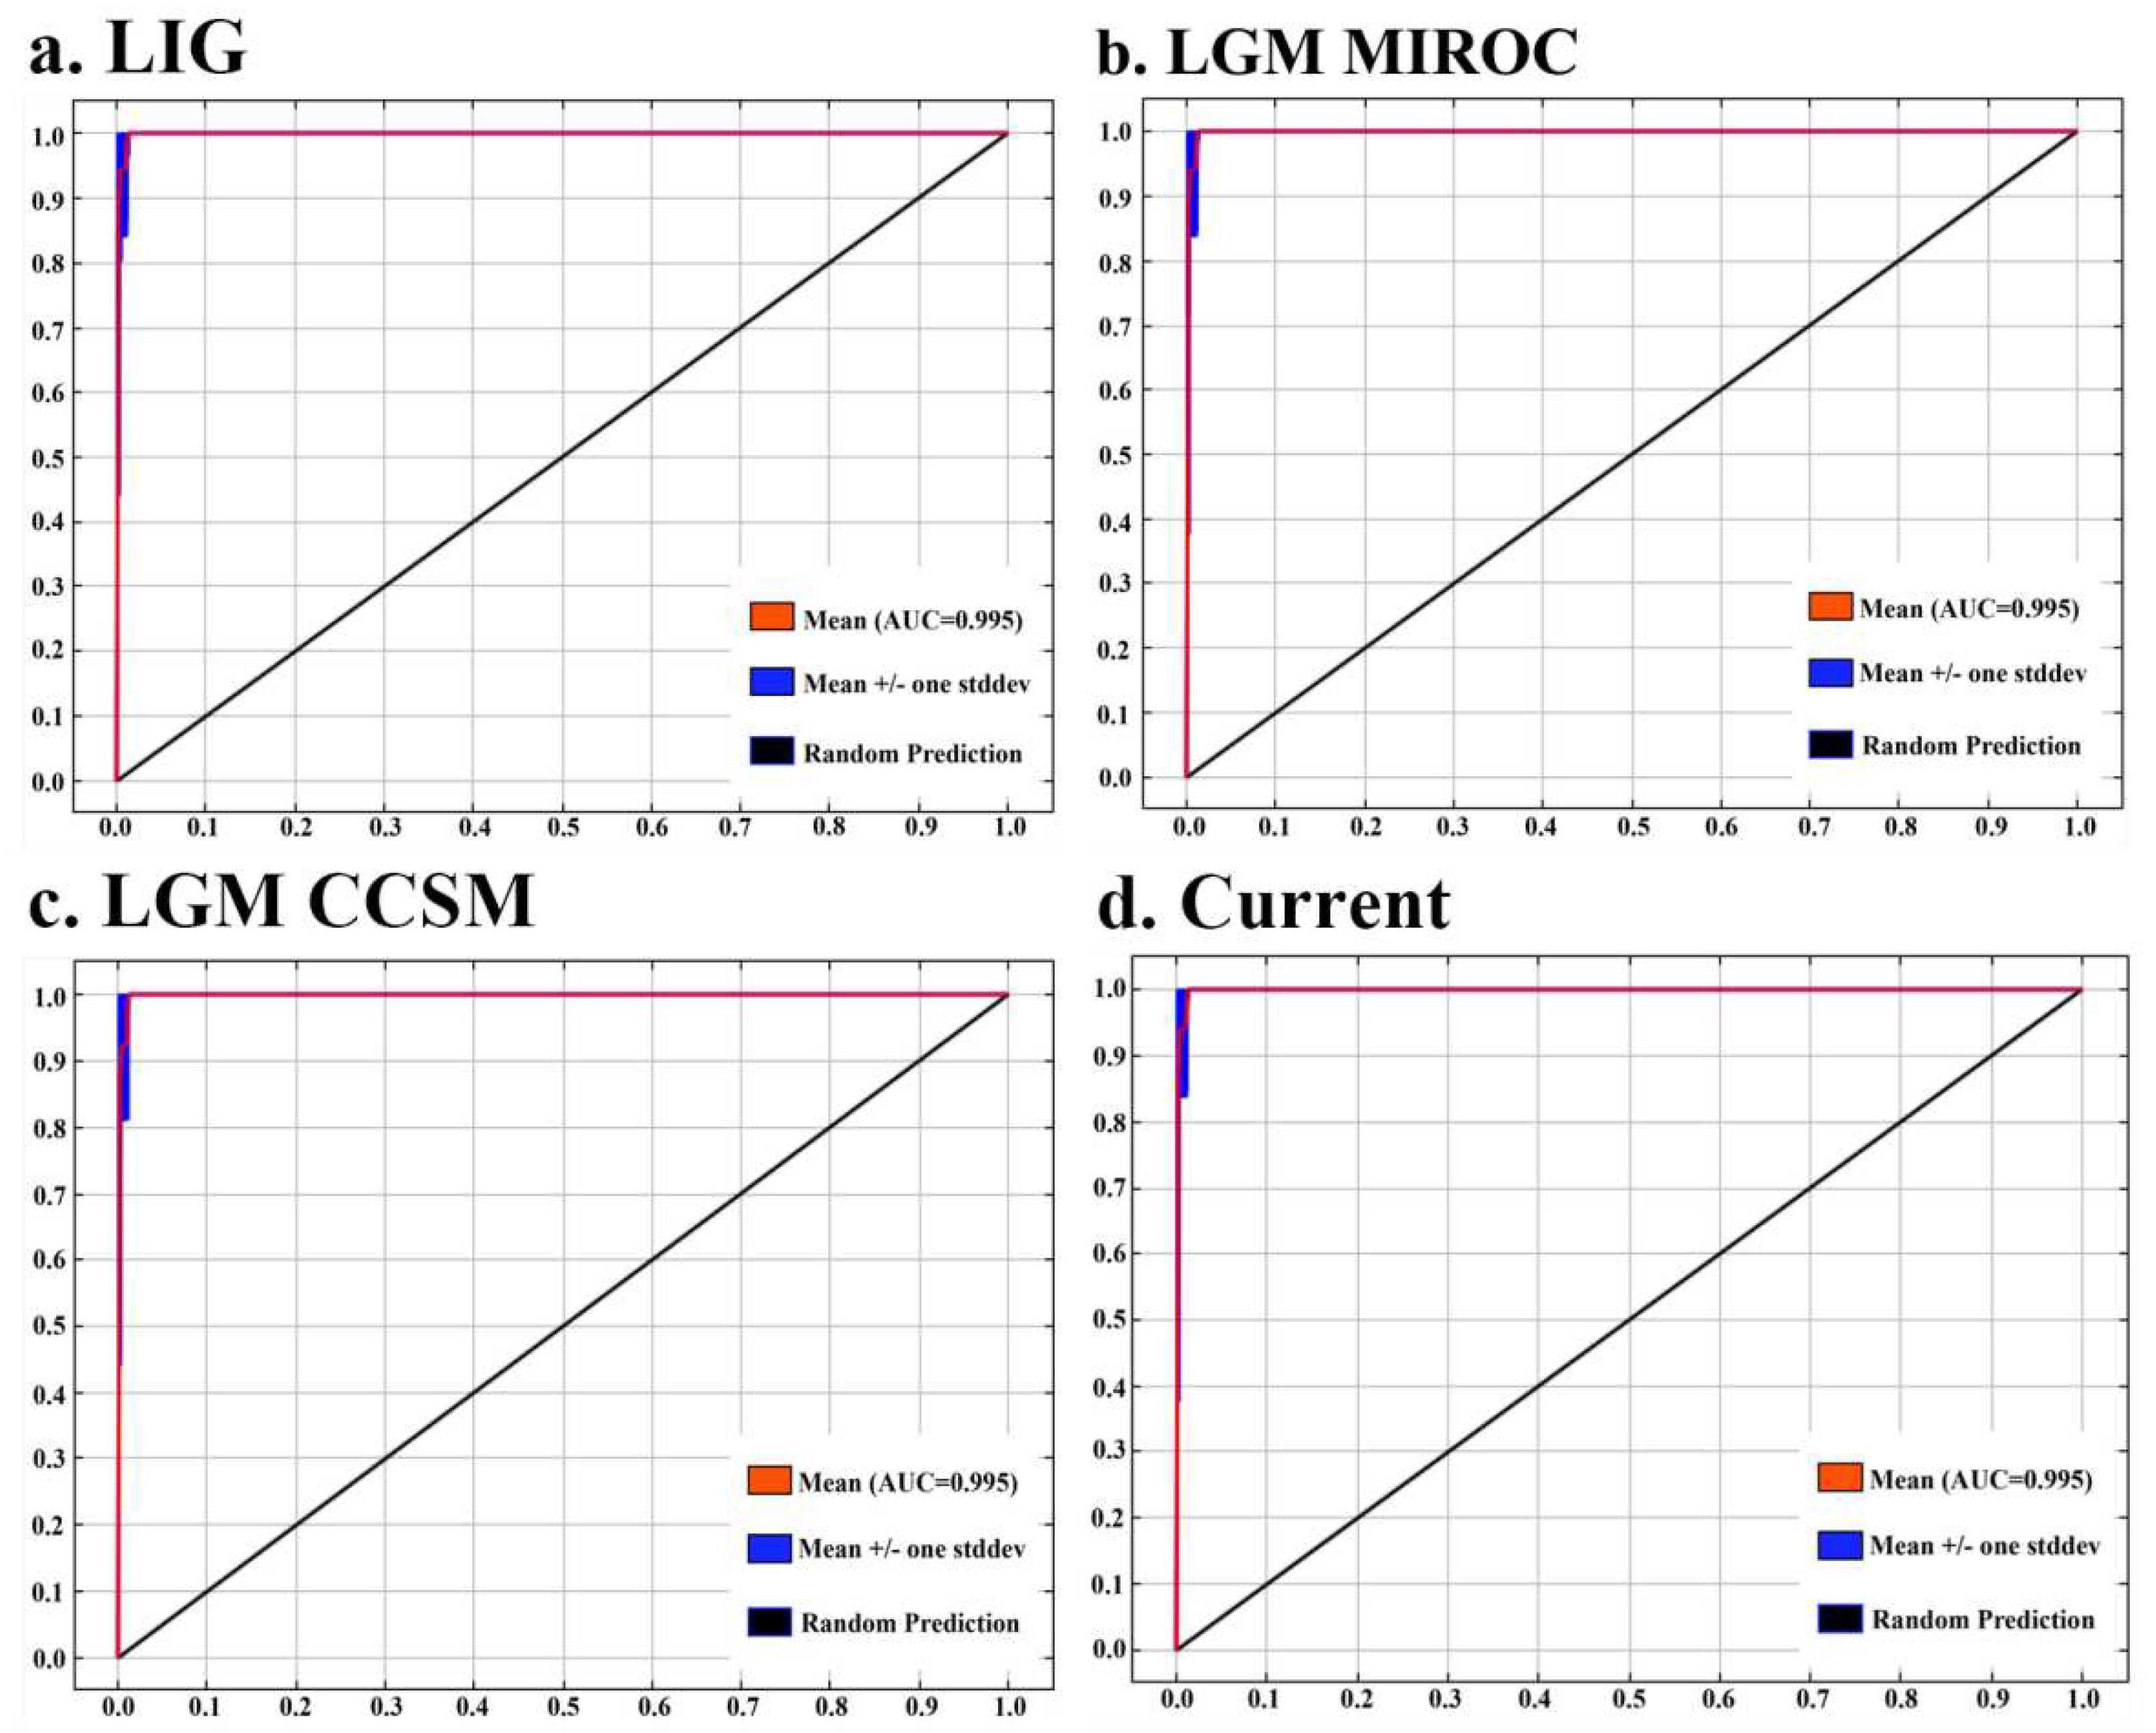
In order to assess the accuracy of the MaxEnt model, the area under the ROC curve, i.e., the AUC value, was selected as an indicator to measure and assess the predictive ability of the model, wherein the closer the AUC value is to 1, the better the simulation results are[53]. In this study, among the simulation results for the LIG period, the LGM period, and the current period, the AUC value was 0.995 (Figure 2), indicating that the accuracy of the MaxEnt model simulation in this study was extremely high and the confidence level was excellent. It also shows that both CCSM4 and MIROC-ESM are optimal in the LGM period.

3.2. Dominant environmental factors

Environmental variables influence the potential distribution of the species at different times. As can be seen from Table 2, there are six environmental variables that are most important in influencing the potential distribution of I. nanchuanensis in different historical periods: Bio4 (standard deviation of seasonal variation in temperature), Bio6 (minimum temperature in the hottest month), Bio7 (annual mean temperature range), Bio13 (precipitation in the wettest month), Bio15 (seasonal coefficient of variation in precipitation), and Bio17 (precipitation in the driest season).
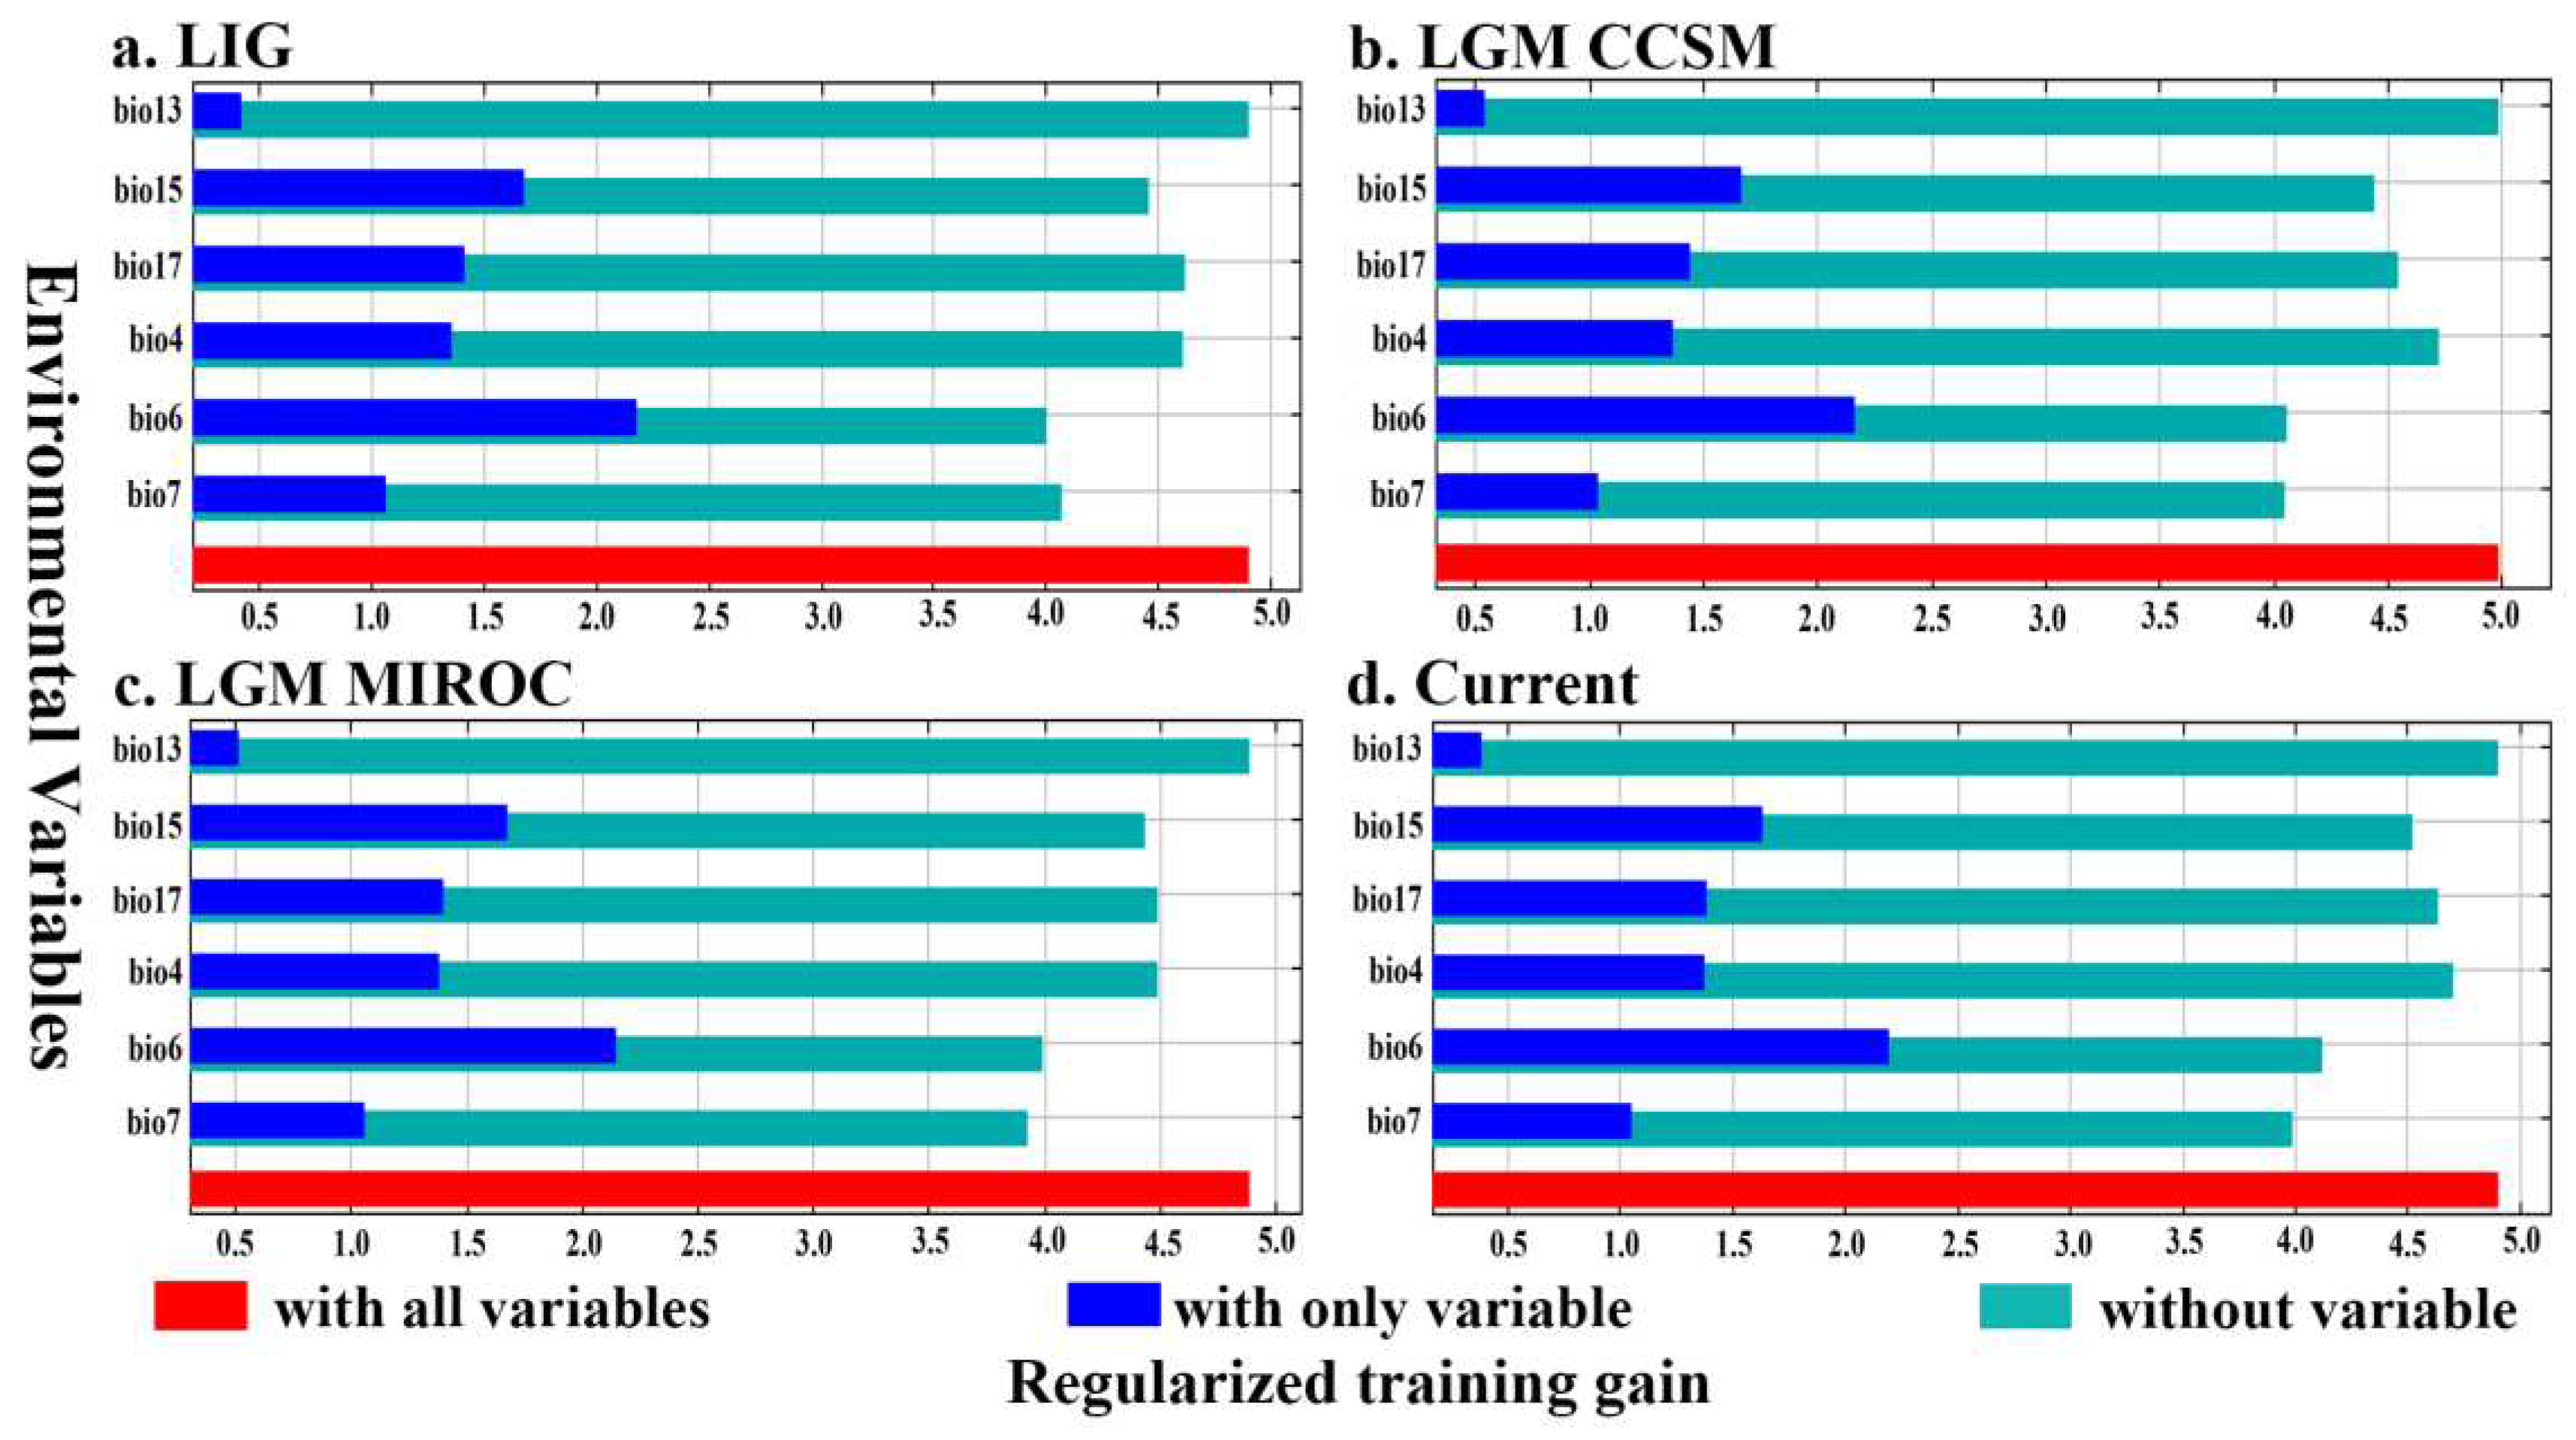
Using Jackknife to test the percentage of regularized training gain of environmental variables on the potential distribution of I. nanchuanensis, we found (Figure 3) that the environmental factors in the LIG period, LGM period (CCSM4 and MIROC-ESM), and current period had the same weighting, from highest to lowest: Bio6, Bio15, Bio17, Bio4, Bio7, Bio13.
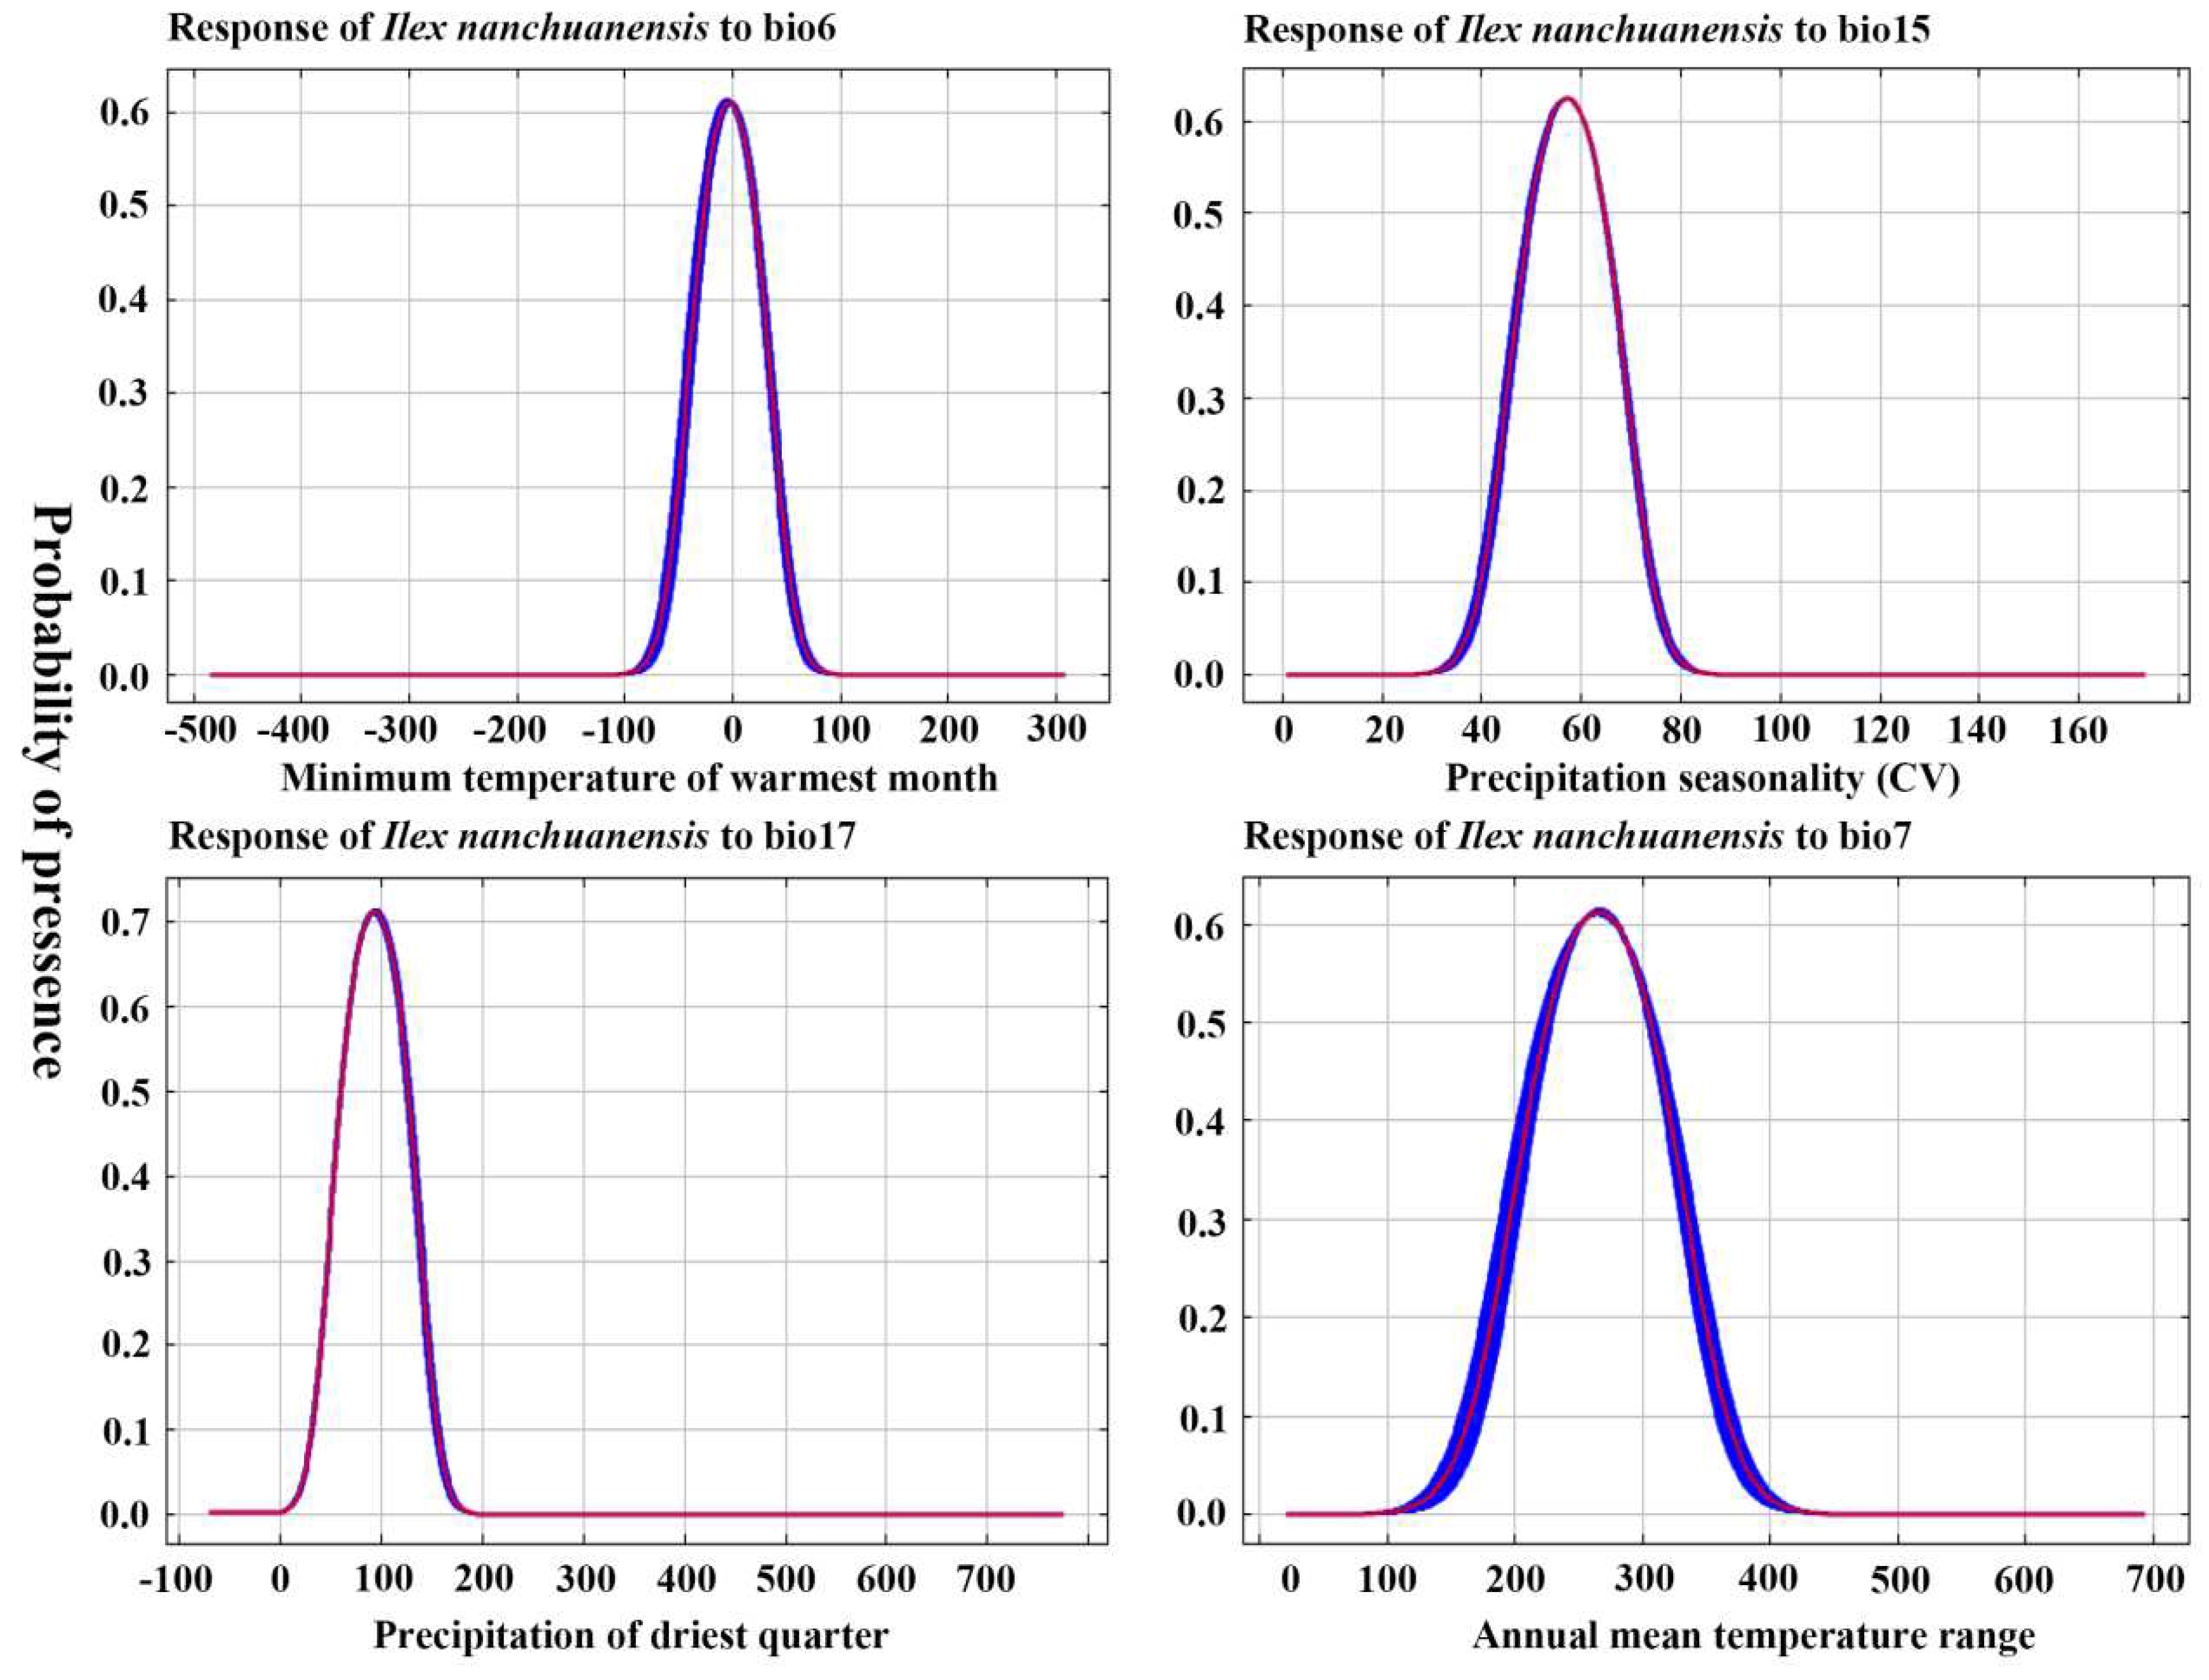
Analysis of the probability response curves of environmental variables and species distributions revealed that Bio6, Bio15, Bio17, and Bio7, all four environmental factors, had single-peaked, one-way response curves with probabilities of the presence of major environmental factors >0.5, which remained largely consistent with the range of environmental factor parameters for highly suitable habitats. The analysis showed (Figure 4) that the optimum range for Bio6 was −30°C to 25°C, for Bio15 it was 50–65 mm, for Bio17 it was 70–130 mm, and for Bio7 it was 230°C–310°C. According to the Jackknife test environmental variable method of simulation detection, the environmental variable that achieves the highest formalized training gain when only one variable is present during the simulation is Bio6. Therefore, Bio6 has the most effective simulation information.

3.3. Suitable species distribution areas

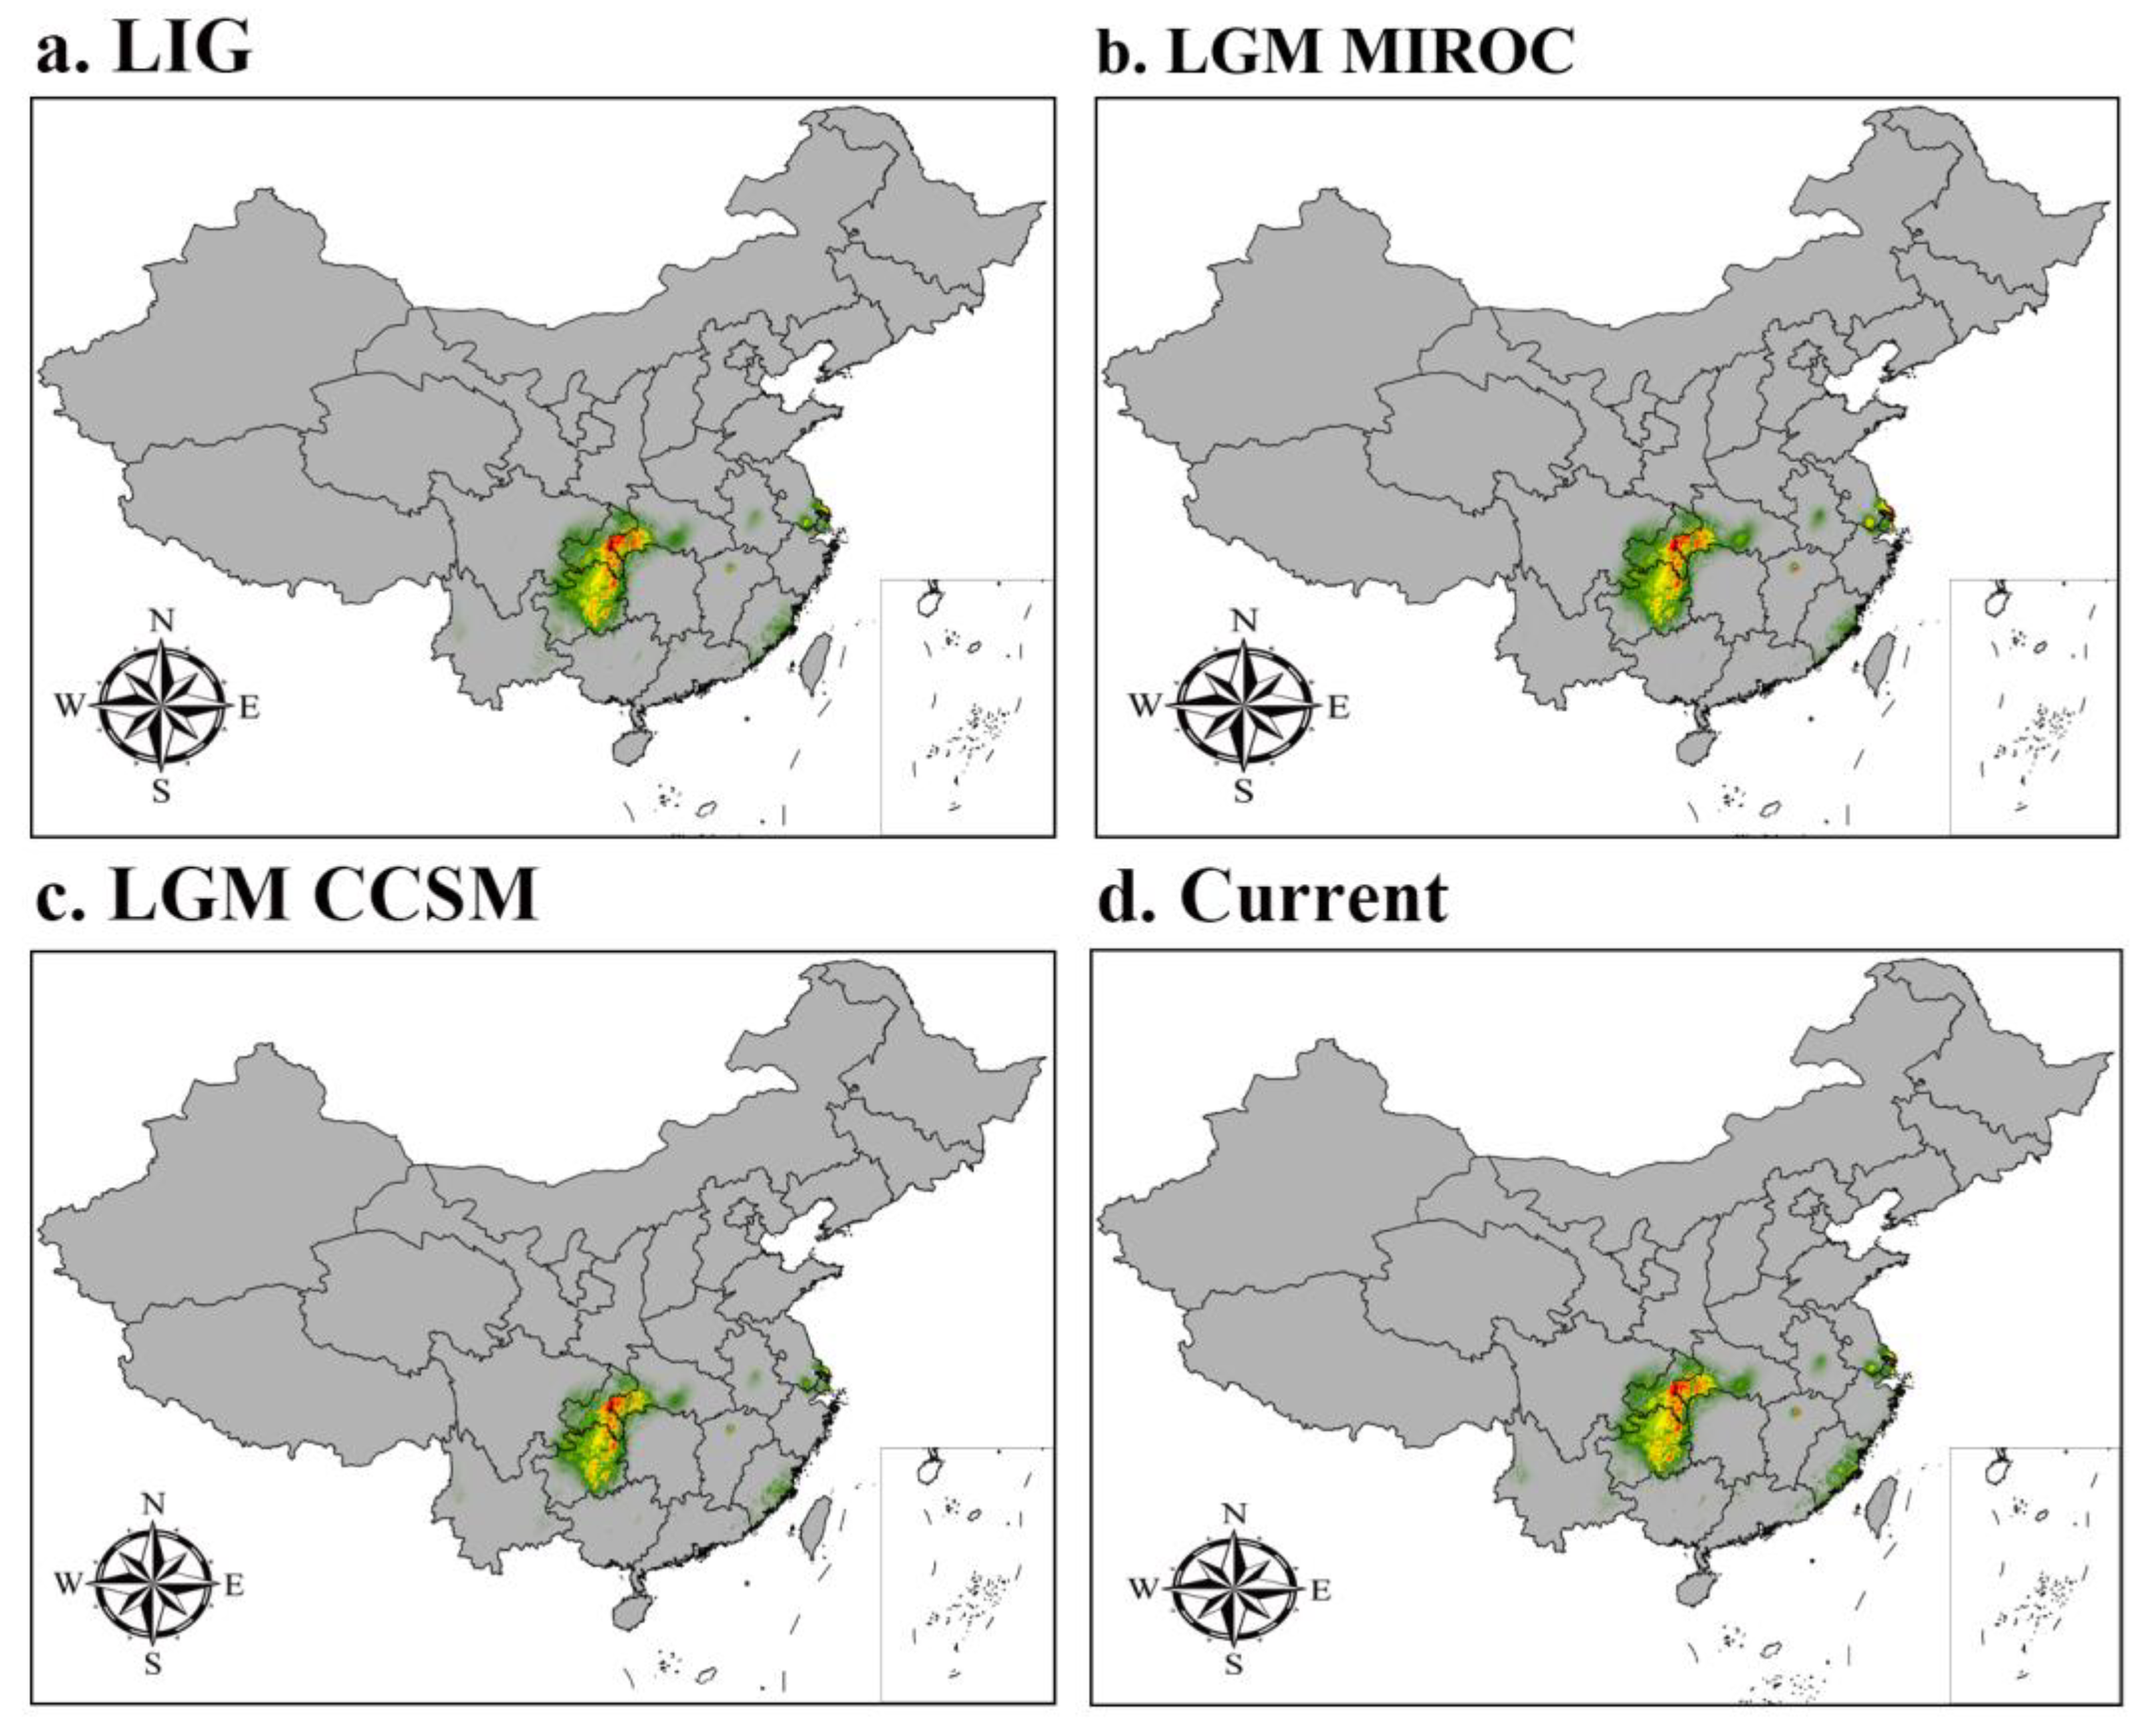
The MaxEnt model was used to simulate the distribution of I. nanchuanensis during the LIG period, LGM period (CCSM4 and MIROC-ESM), and current period, and it was found that its distribution range varied significantly during different periods (Figure 5). The potential distribution of I. nanchuanensis was classified into four classes using the natural break method (grey for unsuitable, green for marginally suitable, yellow for moderately suitable, and red for highly suitable distribution areas). This species of holly is endemic to China, but the large map presented an incomplete map of China, so a small map was used to refine the U-shaped line. As shown in Figure 5D, I. nanchuanensis is currently distributed in China mainly in Nanchuan District, Wulong District, Chongqing Municipality, Wuping Town, Fengdu County, Chongqing Municipality, Nanchuan City, Yichang City, and Wufeng City, Hubei Province, mainly between 29.00728°N and 30.17125°N, with the highly suitable area being mainly in Nanchuan District, Chongqing Municipality.
The MaxEnt model simulation revealed that the distribution range of I. nanchuanensis can be better captured at present. The total suitable distribution area was 37.722223×10⁴ km2 ; the highly suitable distribution area was 5.708333×10⁴ km2; the moderately suitable distribution area was 11.98785×10⁴ km2; and the marginally suitable distribution area was 20.02604×10⁴ km2. As shown in Table 3, comparison with the current distribution area of the species reveals that the highly suitable area decreased by 14.317707×10⁴ km2 and 6.279517×10⁴ km2 compared to the marginally suitable area and moderately suitable area, respectively, while the total suitable area of the species increased compared to the LIG period, CCSM4 LGM period, and MIROC-ESM LGM period, with an increase of 2.348959×10⁴ km2. The total area suitable for this species has increased by 2.348959×10⁴ km2, 5.373267×10⁴ km2 and 3.309025×10⁴ km2, respectively, and it can be seen from Figure 5 that the area suitable for each distribution class of I. nanchuanensis has shown an increasing trend compared to the LIG, the CCSM4 LGM, and MIROC-ESM LGM periods.
The geographical distribution of I. nanchuanensis in two future period (the 2050s and 2070s) was also studied using the MaxEnt model, combined with four climate scenarios (RCP2.6, RCP4.5, RCP6, and RCP8.5) under global climate change to simulate the potential geographical distribution range of I. nanchuanensis and its suitable distribution area for different classes (Table 3, Figure 6). It was found that the potential distribution of I. nanchuanensis will continue to shrink in the future, especially in the 2070s, when the total suitable area, highly suitable area, and moderately suitable area will be reduced to varying degrees compared to the current one, especially under RCP6, with a maximum reduction of 9.04688×10⁴ km2, and under RCP2.6, with a minimum reduction of 4.354159×10⁴ km2. The maximum reduction in distribution area under RCP6 was 17.779519×10⁴ km2, and the minimum reduction under RCP4.5 was 3.937494×10⁴ km2. In the highly suitable distribution area, a maximum reduction of 8.055556×10⁴ km2 was found under RCP6, a minimum reduction of 1.286459×10⁴ km2 under RCP2.6, and a small increase under RCP4.5. In the moderately suitable distribution area, a maximum reduction of 7.390623×10⁴ km2 was found under RCP6, and a minimum reduction of 1.286459×10⁴ km2 under RCP8.5. In the marginally suitable distribution area, a maximum reduction of 7.390623×10⁴ km2 was found under RCP6, and a minimum reduction of 0.9375×10⁴ km2 under RCP8.5.

3.4. Suitable distribution under future climate scenarios

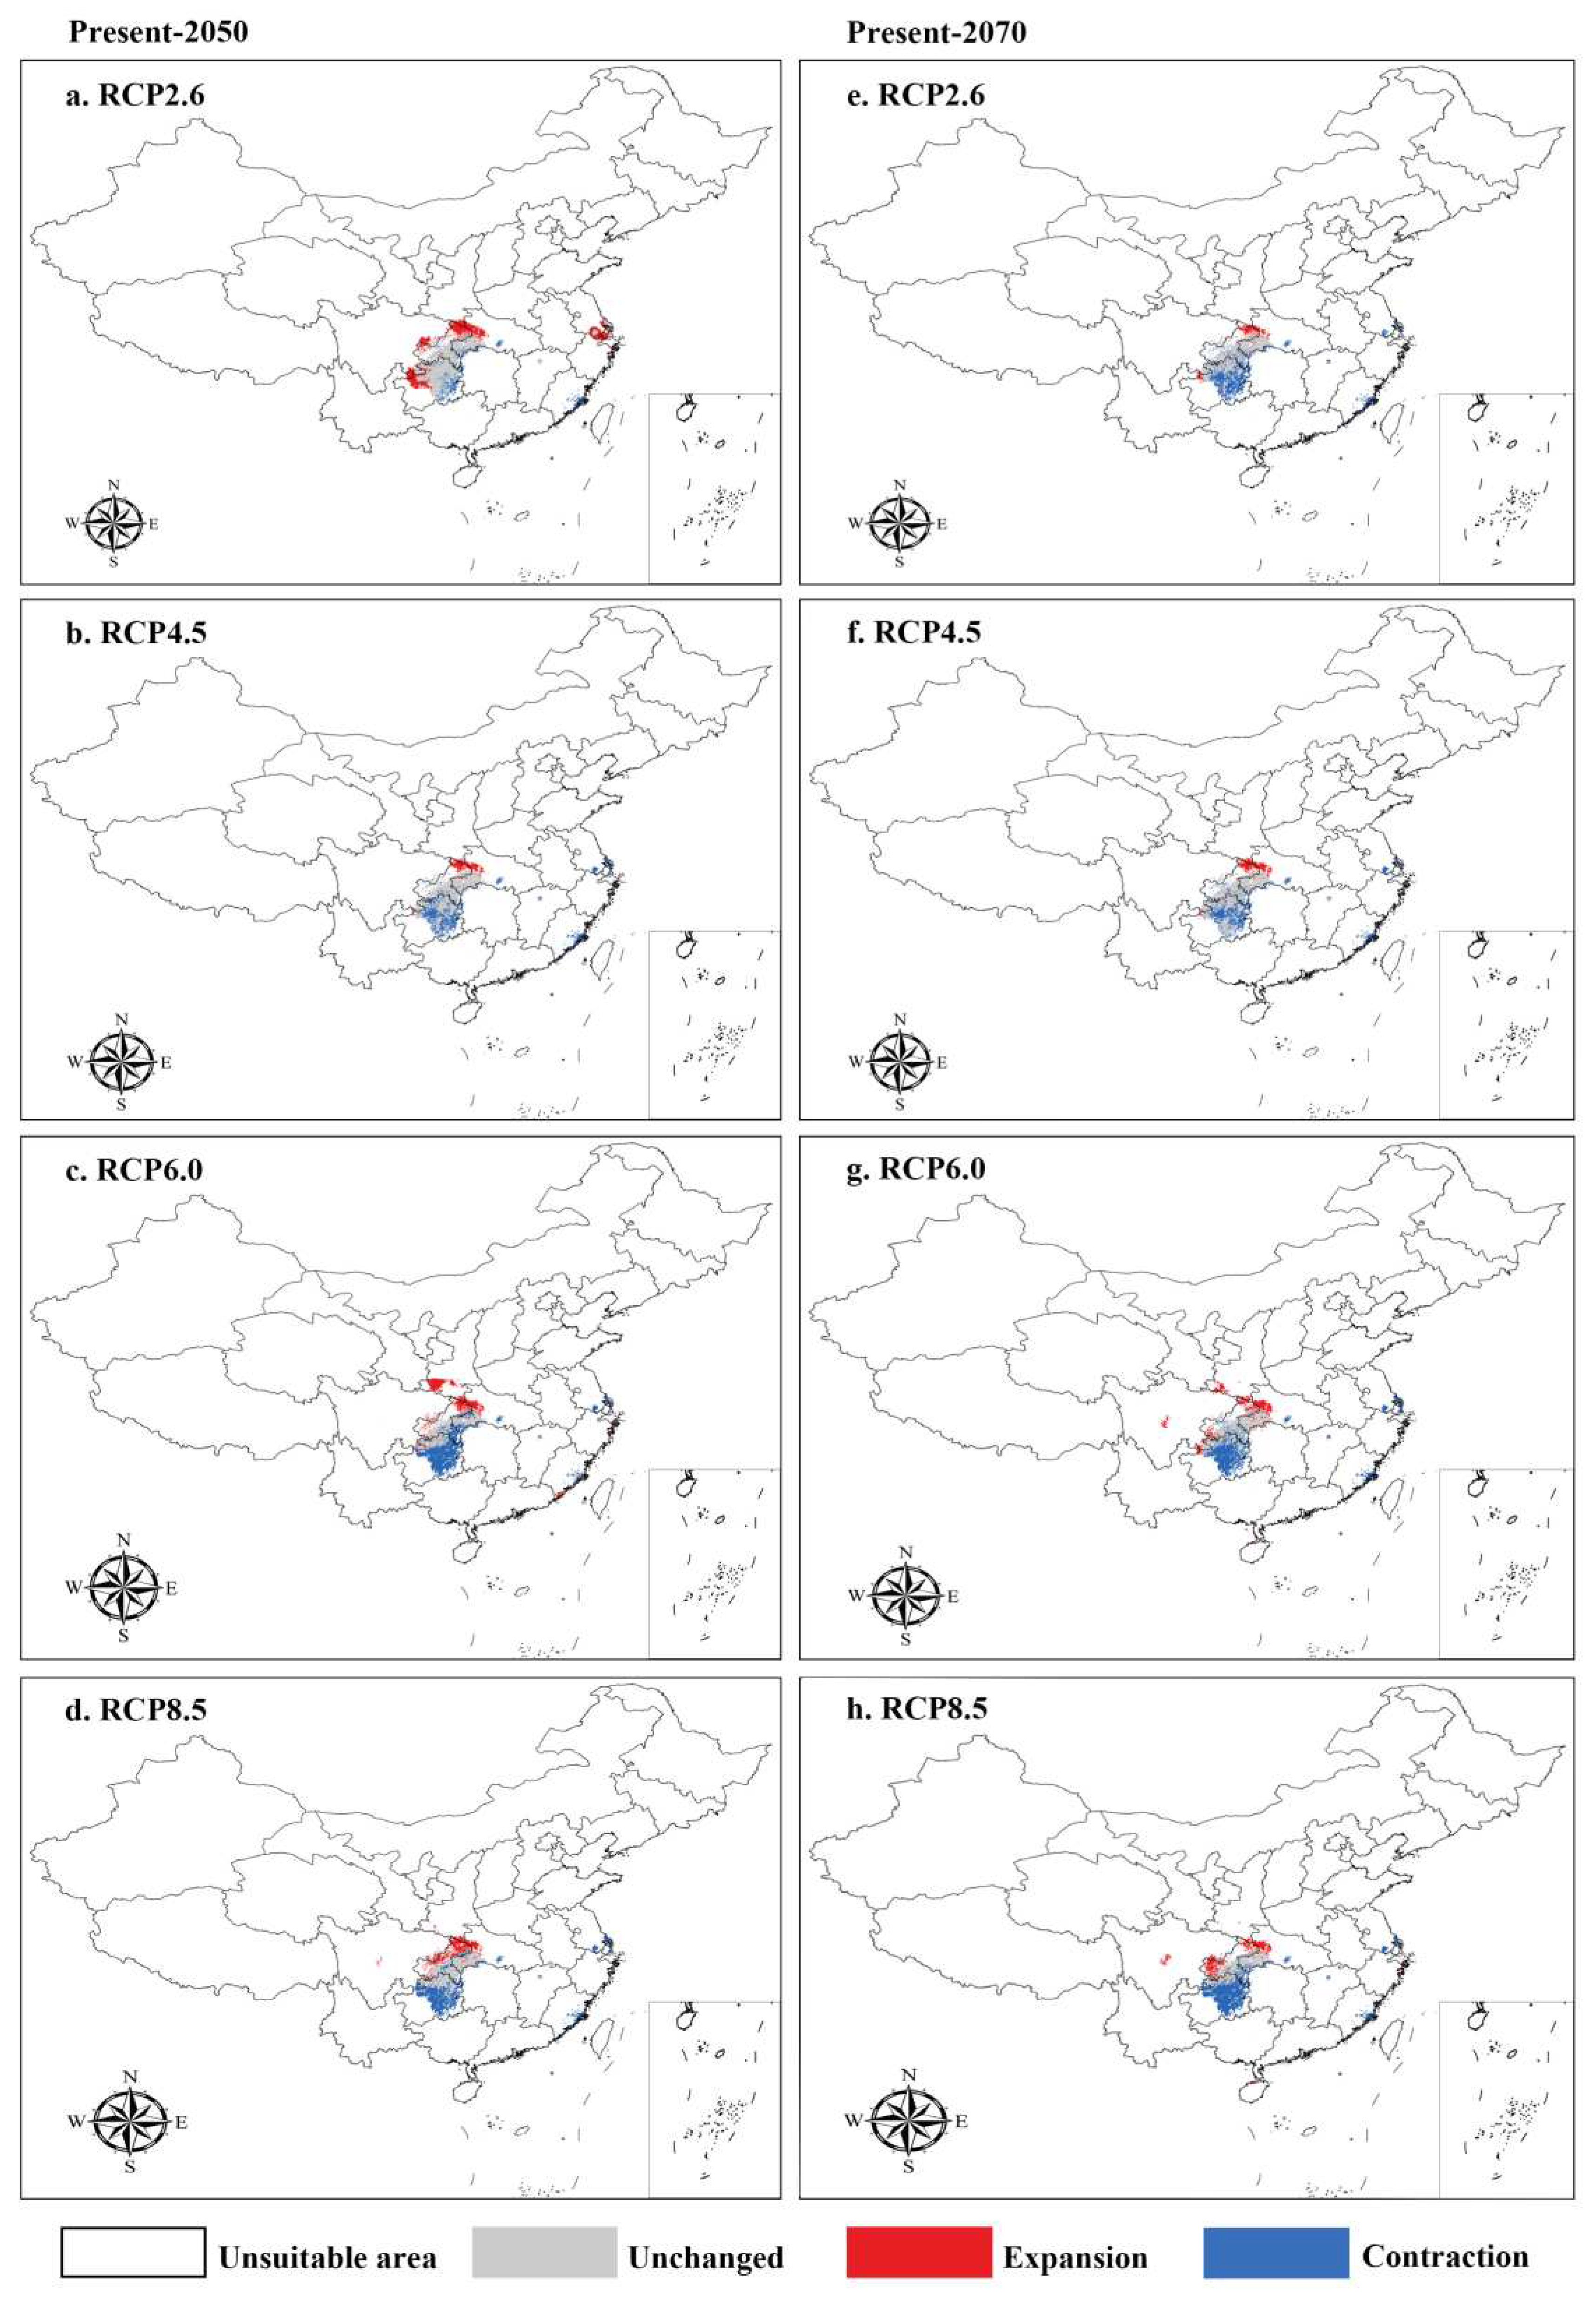
The MaxEnt model was used to predict the distribution of I. nanchuanensis under different climate scenarios for the future periods, and the area and distribution of I. nanchuanensis in unsuitable, unchanged, expanded, and contracted areas can be seen in Table 4 and Figure 6. The area in unchanged areas will not change much compared to the current period, while the area in expanded areas will increase. Compared to the potential distribution area of I. nanchuanensis in the current period, its distribution range in Sichuan, Chongqing, Hubei, Guizhou, southern Shaanxi, Jiangsu, and Fujian in China will increase in the 2050s (Figure 6A–D), while it will decrease significantly in the 2070s (Figure 6E, F).

3.5. Migration trends of the geometric center of suitable habitat

The SDM-Toolbox in ArcGIS 10.6 software was used to analyze the distribution area of I. nanchuanensis in the current period and under different climate scenarios in the future periods to obtain the mass migration trajectory and direction (Figure 7). The distribution area of I. nanchuanensis in the current period is located in Nanchuan District, Chongqing, China (29.12382309°N, 107.2505951°E), while in the LIG and LGM periods it is still in Nanchuan District but at (29.02701706°N, 107.146697°E) and (29.02930604°N, 107.164464°E), respectively (Figure 6a). Although the distribution of I. nanchuanensis in the above three periods was in Nanchuan District, Chongqing, in the current period it showed a trend of migration to the northeast compared with that in the LIG and LGM periods (59229 m and 54900 m, respectively) (Figure 6b). It was found that the distribution of I. nanchuanensis in China in the future (2050s and 2070s) will migrate to the northwest compared to the current period. By simulating the migration trajectory of I. nanchuanensis placenames under different climate scenarios in the future periods, it was found that it migrated 86072 m, 122,762 m, 125,080 m and 166,544 m under RCP 2.6, RCP 4.5, RCP 6 and RCP8.5, respectively, in the 2050s compared to the current period, and in the 2070s by 94,894 m, 101,163 m, 153,836 m and 150,276 m (Figure 6B).

4. Discussion

4.1. Response of species distribution to climate change

Climate change is a major driver of species distributions[74,75], and species distributions can also reflect climate change characteristics[76,77,78]. Species change seasonal activity patterns, abundance, and migration in response to challenges such as extreme events, heat stress, and water scarcity brought about by climate change[79]. Studies have found that global climate change is already causing species to migrate to higher altitudes and latitudes[80,81]. Ilex nanchuanensis is a critically endangered species endemic to China, with only one distribution area of <100 km2, and has experienced habitat degradation or even loss due to climate warming[16,17]. In the present study, I. nanchuanensis was found to be migrating northwards in both the current and future periods, demonstrating the stress of climate warming imposed on this species, with the main climatic factors affecting its geographical distribution found to be temperature and precipitation. Similarly, Ning et al. (2021) found that temperature and precipitation were the most important environmental factors affecting the geographical distribution of Pinus armandii[75], while You et al. (2018)found that temperature-related variables affected the geographical distribution of Rhodiola more profoundly than precipitation[82].
The use of the MaxEnt model to simulate the distribution ranges of species in different historical periods based on current species distribution data and climatic factors can help maintain ecosystem balance and protect rare and critically endangered species[47,83]. It was found that current global temperatures have increased by 5°C–12°C compared to the LGM period and that the current glacial area in China has decreased by 8.4 times compared to the LGM period, and these changes have affected the geographical distribution patterns of species[84]. In the present study, we found that the distribution range of I. nanchuanensis in the current period was larger than that of both the LGM period and LIG period, which was related to the species’ biological characteristics such as its preference for warmth and tolerance of shade. Willis et al. (2004) found that mid-latitude and high-latitude regions were affected by glacial cover during the Quaternary period, while China was located at a relatively low latitude and the complex topography and mountains were able to effectively block the glacial cover[85,86], confirming the findings of this study that I. nanchuanensis migrated to the northeast during the current period[87]. Cornejo-Romero et al. (2017) found that the range of drought-tolerant plants was less during the current period than during the LIG, which is contrary to the results of this study owing to the fact that the biology of drought-tolerant plants is very different from that of subtropical plants[88].

4.2. Potential distribution area changes and conservation of Ilex nanchuanensis under future climate scenarios

Climate change is not only forcing species to migrate but also accelerating the risk of extinction[89]. In this study, we found that the distribution range of I. nanchuanensis in the future periods (2050s and 2070s) is likely to be reduced compared to the current period, and it keeps moving towards the northwest owing to extreme phenomena such as local increases in temperature and water shortages[80,81]. In addition, the distribution range of I. nanchuanensis is projected to shrink in the future periods, especially the 2070s, with the total suitable area being reduced the most under RCP6 and the least under RCP4.5, which is similar to the findings of other studies on rare and endangered species in China, such as ginkgo (Ginkgo biloba) and Taiwan fir [90,91]. This is closely related to the phenomenon of climate warming in the future, with studies finding a global temperature increase of 1.3°C by 2050 and a minimum global temperature increase of 2.2°C by 2070[5,92]. This study found that the optimum range for the hottest monthly minimum temperature (Bio6), the most important climatic factor affecting I. nanchuanensis, is −30°C to 25°C, and that extreme weather and global warming have made it difficult for the species to survive better locally, which is one of the main reasons for the migration of I. nanchuanensis to the northwest in the coming period. Also, I. nanchuanensis migrated the furthest under RCP6 in the 2070s, confirming the threat of rising temperatures and increased greenhouse gas emissions to the distribution status of the species, as well as the global ecosystem[93]. Therefore, there is a need to reduce greenhouse gas emissions to protect global species diversity and ecosystem balance. This study also found that the best ranges of climatic factors affecting the geographical distribution of I. nanchuanensis were 70–130 mm for the driest seasonal precipitation (Bio17) and 230°C–310°C for the mean annual temperature range (Bio7). Meanwhile, I. nanchuanensis not only prefers a warm climate but also has a certain degree of cold tolerance, which is another reason for its migration to the northwest in the coming period. To better protect the species, research on drought stress and salt stress should be a focus. Therefore, we recommend the construction of a core reserve in an area centered on Nanchuan District of Chongqing, China, to improve habitat conditions and the conservation of germplasm resources using techniques such as hybrid seeding and genetics to increase the genetic diversity of wild populations.

5. Conclusions

This study simulated the geographical distribution of I. nanchuanensis using the MaxEnt model, and the following conclusions were obtained: (1) The climatic factors affecting the geographical distribution of I. nanchuanensis are Bio4, Bio6, Bio7, Bio13, Bio15, and Bio17 (see Table 1 for definitions). (2) Ilex nanchuanensis migrated to the northeast in historical periods but is projected to migrate northwest in the future. (3) The total suitable area for I. nanchuanensis was projected to reduce the most under RCP6 in the 2070s (17.779519×10⁴ km2), and the least (3.937494×10⁴ km2) under RCP4.5. To address the threat of global climate change to I. nanchuanensis, a protected area centered on Nanchuan District in Chongqing, China, should be established, and germplasm resources protected and cultivated, with core, buffer, and experimental areas scientifically and rationally delineated. In addition, greenhouse gas emissions need to be reduced, and future greenhouse gas emissions need to be controlled within the scenario of RCP4.5.

Author Contributions

LZZ, LG screened the species information and conceived the framework of the paper, HRY, LLL identified the plant specimens and analyzed the data, WSQ, JHY searched the data and plotted the paper, and CZM wrote the paper. All authors have read and agreed to the published version of the manuscript.

Funding

This study was supported by the Gansu Provincial Key R&D Program (22YF7FA116) and the Key Talent Project of Gansu Province, China (LRYCZ-2020-1) project.

Data Availability Statement

The data presented in the study are deposited in the National Center for Biotechnology Information repository, accession number OK235337, MW192444.

Acknowledgments

I sincerely thank my supervisors, Prof. Zhuzhu Luo and Guang Li, for their guidance of my thesis, and my classmates, Renyuan He, Liangliang Li, Shuqin Wang, and Haiyang Jiang, for their help with my thesis.

Conflicts of Interest

The authors declare that the research was conducted in the absence of any commercial or financial relationships that could be construed as a potential conflict of interest.

References

  1. Quantifying the benefit of early climate change mitigation in avoiding biodiversity loss. Nature Climate Change 2013.
  2. Balfagón, D.; Terán, F.; de Oliveira, T.D.R.; Santa-Catarina, C.; Gómez-Cadenas, A. Citrus rootstocks modify scion antioxidant system under drought and heat stress combination. Plant Cell Rep. 2022, 41, 593–602. [Google Scholar] [CrossRef] [PubMed]
  3. Li, X.; Tian, H.; Wang, Y.; et al. Vulnerability of 208 endemic or endangered species in China to the effects of climate change. Regional Environmental Change 2013, 13, 843–852. [Google Scholar] [CrossRef]
  4. Garza, G.; Rivera, A.; Venegas Barrera, C.S.; Martinez-Ávalos, J.G.; Dale, J.; Feria Arroyo, T.P. Potential Effects of Climate Change on the Geographic Distribution of the Endangered Plant Species Manihot walkerae. Forests 2020, 11, 689. [Google Scholar] [CrossRef]
  5. Varela, D.; Romeiras, M.M.; Silva, L. Implications of climate change on the distribution and conservation of Cabo Verde endemic trees. Global Ecology and Conservation 2022, 34. [Google Scholar] [CrossRef]
  6. Gray, S.B.; Brady, S.M. Plant developmental responses to climate change. Dev Biol 2016. [CrossRef]
  7. Lambert, A.M.; Abraham, J. Miller-Rushing, Inouye D W. Changes in snowmelt date and summer precipitation affect the flowering phenology of Erythronium grandiflorum (glacier lily; Liliaceae). American Journal of Botany 2010, 97. [Google Scholar] [CrossRef]
  8. McMahon, S.M.; et al. Improving assessment and modelling of climate change impacts on global terrestrial biodiversity. Trends in Ecology & Evolution 2011, 26, 249–259. [Google Scholar]
  9. Vitasse Yann and Signarbieux Constant and Fu Yongshuo H. Global warming leads to more uniform spring phenology across elevations. Proceedings of the National Academy of Sciences of the United States of America 2018, 115, 1004–1008. [Google Scholar]
  10. Alessandro Ferrarini; et al. Redefining the climate niche of plant species: A novel approach for realistic predictions of species distribution under climate change. Science of the Total Environment 2019, 671, 1086–1093. [Google Scholar] [CrossRef]
  11. Dyderski Marcin, K.; et al. How much does climate change threaten European forest tree species distributions? Global change biology 2018, 24, 1150–1163. [Google Scholar] [CrossRef] [PubMed]
  12. et al. Minimal climate change impacts on the geographic distribution of Nepeta glomerulosa, medicinal species endemic to southwestern and central Asia. Scientific Reports 2022, 12, 19893. [Google Scholar] [CrossRef] [PubMed]
  13. Wang, Shaokun et al. Increasing precipitation weakened the negative effects of simulated warming on soil microbial community composition in a semi-arid sandy grassland. Frontiers in Microbiology 2023, 13. [Google Scholar]
  14. Asymmetric sensitivity of first flowering date to warming and cooling in alpine plants. Ecology 2014.
  15. Dorji, T.; Totland, O.; Moe, S.; et al. Plant functional traits mediate reproductive phenology and success in response to experimental warming and snow addition in Tibet. Glob Chang Biol. 2013, 19, 459–472. [Google Scholar] [CrossRef] [PubMed]
  16. Mahmoodi Shirin et al. The current and future potential geographical distribution of Nepeta crispa Willd., an endemic, rare and threatened aromatic plant of Iran: Implications for ecological conservation and restoration. Ecological Indicators 2022, 137. [Google Scholar]
  17. Panetta, A.M.; Stanton, M.L.; Harte, J. Climate warming drives local extinction: Evidence from observation and experimentation. Science Advances 2018, 4, eaaq1819. [Google Scholar] [CrossRef]
  18. Liu, J.; Rhland, K.; Chen, J.; et al. Aerosol-weakened summer monsoons decrease lake fertilization on the Chinese Loess Plateau. Nature Climate Change 2017, 7. [Google Scholar] [CrossRef]
  19. Barnosky Anthony, D.; et al. Has the Earth's sixth mass extinction already arrived? Nature 2011, 471, 51–57. [Google Scholar] [CrossRef]
  20. et al. Changes in daily climate extremes in China and their connection to the large scale atmospheric circulation during 1961–2003. Climate Dynamics 2011, 36, 2399–2417. [Google Scholar] [CrossRef]
  21. Bellard, C.; Bertelsmeier, C.; Leadley, P.; et al. Impacts of climate change on the future of biodiversity. Ecology letters 2012, 15. [Google Scholar] [CrossRef] [PubMed]
  22. IPCC. Summary for Policymakers. In: Climate Change 2021: The Physical Science Basis. [R]. 2021.
  23. Hansen, J.; Ruedy, R.; Sato, M.; et al. GLOBAL SURFACE TEMPERATURE CHANGE. Reviews of Geophysics 2010, 48. [Google Scholar] [CrossRef]
  24. Varela Danilson and Romeiras Maria M. and Silva Luís. Implications of climate change on the distribution and conservation of Cabo Verde endemic trees. Global Ecology and Conservation 2022, 34. [Google Scholar]
  25. Thomas, C.D.; Cameron, A.; Green, R.E.; et al. Extinction risk from climate change. Nature 2004, 427, 145. [Google Scholar] [CrossRef] [PubMed]
  26. Urban, M.C. Climate change. Accelerating extinction risk from climate change. Science 2015, 348, 571. [Google Scholar] [CrossRef]
  27. Gergana N. Daskalova and Isla H. Myers-Smith and John L. Godlee. Rare and common vertebrates span a wide spectrum of population trends. Nature communications 2020, 11, 4394. [Google Scholar] [CrossRef]
  28. et al. Niche divergence at the intraspecific level in an endemic rare peony (Paeonia rockii): A phylogenetic, climatic and environmental survey. Frontiers in Plant Science 2022, 13, 978011. [Google Scholar] [CrossRef]
  29. Daskalova, G.N.; Myers-Smith, I.H.; Godlee, J.L. Rare and common vertebrates span a wide spectrum of population trends. Nat. Commun. 2020, 11, 4394. [Google Scholar] [CrossRef]
  30. Krner, C. Mountain Biodiversity, Its Causes and Function. Ambio 2004, 33, 11–17. [Google Scholar] [CrossRef]
  31. Perrigo, A.; Hoorn, C.; Antonelli, A. Why mountains matter for biodiversity. Journal of Biogeography 2020, 47. [Google Scholar] [CrossRef]
  32. D. Nogués-Bravo a b, M.B. Araújo c b, D M P E; et al. Exposure of global mountain systems to climate warming during the 21st Century. Global Environmental Change 2007, 17, 420–428. [Google Scholar] [CrossRef]
  33. A J P D, A L F, B G R; et al. Shifting mountain snow patterns in a changing climate from remote sensing retrieval. Science of The Total Environment 2014, 493, 1267–1279.
  34. Mccullough, I.M.; Davis, F.W.; Dingman, J.R.; et al. High and dry: High elevations disproportionately exposed to regional climate change in Mediterranean-climate landscapes. Landscape Ecology 2016, 31, 1063–1075. [Google Scholar] [CrossRef]
  35. Dyurgerov, M. Mountain and subpolar glaciers show an increase in sensitivity to climate warming and intensification of the water cycle. Journal of Hydrology 2003. [Google Scholar] [CrossRef]
  36. Stoffel, M.; Tiranti, D.; Huggel, C. Climate change impacts on mass movements - Case studies from the European Alps. Science of the Total Environment 2014, 493, 1255–1266. [Google Scholar] [CrossRef]
  37. Carroll, C.; Roberts, D.R.; Michalak, J.L.; et al. Scale-dependent complementarity of climatic velocity and environmental diversity for identifying priority areas for conservation under climate change. Journal of Fish Diseases 2017, 40. [Google Scholar] [CrossRef]
  38. Lenoir, J.; Svenning, J.C. Climate-related range shifts - a global multidimensional synthesis and new research directions. Ecography 2015, 38, 15–28. [Google Scholar] [CrossRef]
  39. Alexander, J.M.; Chalmandrier, L.; Lenoir, J.; et al. Lags in the response of mountain plant communities to climate change. Global Change Biology 2018, 24. [Google Scholar] [CrossRef]
  40. Memmott, J.; Craze, P.G.; Waser, N.M.; et al. Global warming and the disruption of plant-pollinator interactions. Ecology Letters 2007, 10. [Google Scholar] [CrossRef]
  41. Jan, Sauer, Sami; et al. Low mountain ranges: Summit traps for montane freshwater species under climate change. Biodiversity&Conservation 2011. [Google Scholar]
  42. Liu, H.; Jacquemyn, H.; He, X.; Chen, W.; Huang, Y.; Yu, S.; Lu, Y.; Zhang, Y. The Impact of Human Pressure and Climate Change on the Habitat Availability and Protection of Cypripedium (Orchidaceae) in Northeast China. Plants 2021, 10, 84. [Google Scholar] [CrossRef] [PubMed]
  43. Renwick, K.M.; Curtis, C.; Kleinhesselink, A.R.; et al. Multi-model comparison highlights consistency in predicted effect of warming on a semi-arid shrub. Global Change Biology 2017. [CrossRef]
  44. Zhao, R.; Chu, X.; He, Q.; Tang, Y.; Song, M.; Zhu, Z. Modeling Current and Future Potential Geographical Distribution of Carpinus tientaiensis, a Critically Endangered Species from China. Forests 2020, 11, 774. [Google Scholar] [CrossRef]
  45. Qin, A.; Liu, B.; Guo, Q.; et al. Maxent modeling for predicting impacts of climate change on the potential distribution of Thuja sutchuenensis Franch. an extremely endangered conifer from southwestern China. Global Ecology and Conservation 2017. [CrossRef]
  46. Dong, P.-B.; Wang, L.-Y.; Wang, L.-J.; Jia, Y.; Li, Z.-H.; Bai, G.; Zhao, R.-M.; Liang, W.; Wang, H.-Y.; Guo, F.-X.; Chen, Y. Distributional Response of the Rare and Endangered Tree Species Abies chensiensis to Climate Change in East Asia. Biology 2022, 11, 1659. [Google Scholar] [CrossRef] [PubMed]
  47. Elith, J.; Leathwick, J.R. Species Distribution Models: Ecological Explanation and Prediction Across Space and Time. Annual Review of Ecology Evolution & Systematics 2009, 40, 677–697. [Google Scholar]
  48. Garza, G.; Rivera, A.; Venegas Barrera, C.S.; Martinez-Ávalos, J.G.; Dale, J.; Feria Arroyo, T.P. Potential Effects of Climate Change on the Geographic Distribution of the Endangered Plant Species Manihot walkerae. Forests 2020, 11, 689. [Google Scholar] [CrossRef]
  49. Hameed, S.; Din, J.U.; Ali, H.; et al. Identifying priority landscapes for conservation of snow leopards in Pakistan. PLoS ONE 2020, 15, 1–20. [Google Scholar] [CrossRef]
  50. Elith, J.; Graham, C.H.; Anderson, R.P.; et al. Novel methods improve prediction of species' distributions from occurrence data. Ecography 2006, 29. [Google Scholar] [CrossRef]
  51. Jsp, A.; Lep, B.; Cah, A.; et al. Climate change shifts in habitat suitability and phenology of huckleberry (Vaccinium membranaceum) - ScienceDirect. Agricultural and Forest Meteorology 2020, 280, 107803. [Google Scholar]
  52. Phillips, S.J.; Anderson, R.P.; Schapire, R.E. Maximum entropy modeling of species geographic distributions. Ecological Modelling 2006, 190, 231–259. [Google Scholar] [CrossRef]
  53. Marcer A, Lloren Sáez, Molowny-Horas R; et al. Using species distribution modelling to disentangle realised versus potential distributions for rare species conservation. Biological Conservation 2013, 166, 221–230. [Google Scholar] [CrossRef]
  54. Li, G.; Du, S.; Wen, Z. Mapping the climatic suitable habitat of oriental arborvitae (Platycladus orientalis) for introduction and cultivation at a global scale. Scientific Reports 2016, 6, 30009. [Google Scholar] [CrossRef] [PubMed]
  55. Shrestha, B.; Tsiftsis, S.; Chapagain, D.J.; Khadka, C.; Bhattarai, P.; Kayastha Shrestha, N.; Alicja Kolanowska, M.; Kindlmann, P. Suitability of Habitats in Nepal for Dactylorhiza hatagirea Now and under Predicted Future Changes in Climate. Plants 2021, 10, 467. [Google Scholar] [CrossRef] [PubMed]
  56. Liu Xu, Chen Yuhan, Yang Yi. New greening product-Nanchuan Holly. Gardening 2008, 69. [Google Scholar]
  57. Li, Q.M.; Xie, Z.Q.; Sun, Y.L. Study on Seedling Adaptability of Abies chensiensis. Forest Research 2008, 21, 481–485. [Google Scholar]
  58. Feeley, K.J.; Silman, M.R. Modelling the responses of Andean and Amazonian plant species to climate change: The effects of georeferencing errors and the importance of data filtering. Journal of Biogeography 2010, 37, 733–740. [Google Scholar] [CrossRef]
  59. Zhang, K.; Sun, L.; Tao, J. Impact of Climate Change on the Distribution of Euscaphis japonica (Staphyleaceae) Trees. Forests 2020, 11, 525. [Google Scholar] [CrossRef]
  60. Marcer A, Lloren Sáez, Molowny-Horas R; et al. Using species distribution modelling to disentangle realised versus potential distributions for rare species conservation. Biological Conservation 2013, 166, 221–230. [Google Scholar] [CrossRef]
  61. Hijmans, R.J.; Cameron, S.E.; Parra, J.L.; et al. Very high resolution interpolated climate surfaces for global land areas. International Journal of Climatology 2005, 25. [Google Scholar] [CrossRef]
  62. Yang, X.Q.; Kushwaha, S.; Saran, S.; et al. Maxent modeling for predicting the potential distribution of medicinal plant, Justicia adhatoda L. in Lesser Himalayan foothills. Ecological Engineering 2013, 51, 83–87. [Google Scholar] [CrossRef]
  63. Fick, S.E.; Hijmans, R.J. WorldClim 2: New 1 km spatial resolution climate surfaces for global land areas. International Journal of Climatology 2017, 37. [Google Scholar] [CrossRef]
  64. Taylor, K.E.; Stouffer, R.J.; Meehl, G.A. An Overview of CMIP5 and the Experiment Design. Bulletin of the American Meteorological Society 2012, 93, 485–498. [Google Scholar] [CrossRef]
  65. Roberto Moreno and Ricardo Zamora and Juan Ramón Molina and Angélica Vasquez and Miguel Ángel Herrera. Predictive modeling of microhabitats for endemic birds in South Chilean temperate forests using Maximum entropy (Maxent). Ecological Informatics 2011. [Google Scholar]
  66. Moreno, R.; Zamora, R.; Molina, J.R.; Vasquez, A.; Herrera, M.T. Predictive modeling of microhabitats for endemic birds in South Chilean temperate forests using Maximum entropy (Maxent). Ecological informatics: An international journal on ecoinformatics and computational ecology 2011, 6. [Google Scholar] [CrossRef]
  67. Mcpherson, J.M.; Rogers, D.J. The Effects of Species Range Sizes on the Accuracy of Distribution Models: Ecological Phenomenon or Statistical Artefact? Journal of Applied Ecology 2004, 41, 811–823. [Google Scholar] [CrossRef]
  68. C A M M A B, B B D B, A P L M G. Ecological relevance of performance criteria for species distribution models. Ecological Modelling 2010, 221, 1995–2002. [Google Scholar] [CrossRef]
  69. Elith, J.; Graham, C.H.; Anderson, R.P.; et al. Novel methods improve prediction of species' distributions from occurrence data. Ecography 2006, 29. [Google Scholar] [CrossRef]
  70. Fielding, A. A review of methods for the assessment of prediction errors in conservation presence/absence models. Environ Conser 1997, 24, 38–49. [Google Scholar] [CrossRef]
  71. Hu, L.-L.; Zhang, H.-Y.; Qin, L.; et al. Current distribution of Schisandra chinensis in China and its predicted responses to climate change. Chinese Journal of Applied Ecology 2012, 23, 2445–2450. [Google Scholar]
  72. Brown, J.L.; Bennett, J.R.; French, C.M. SDMtoolbox 2. 0: The next generation Python-based GIS toolkit for landscape genetic, biogeographic and species distribution model analyses. PeerJ 2017, 5, e4095. [Google Scholar]
  73. Laurent, P.; Mouillot, F.; Yue, C.; et al. Data descriptor: FRY, a global database of fire patch functional traits derived from space-borne burned area products [data paper]. 2018.
  74. Auffret, A.G.; Svenning, J.C. Climate warming has compounded plant responses to habitat conversion in northern Europe. Nature Communications. [CrossRef] [PubMed]
  75. Ning, H.; Ling, L.; Sun, X.; et al. Predicting the future redistribution of Chinese white pine Pinus armandii Franch. Under climate change scenarios in China using species distribution models. Global Ecology and Conservation 2021, 25, e01420. [Google Scholar]
  76. Pandey, B.; Kathiwada, J.R.; Zhang, L.; et al. Energy–water and seasonal variations in climate underlie the spatial distribution patterns of gymnosperm species richness in China. Ecology and Evolution 2020. [CrossRef]
  77. Noce, S.; Caporaso, L.; Santini, M. Climate Change and Geographic Ranges: The Implications for Russian Forests. Frontiers in Ecology and Evolution 2019, 7, 57. [Google Scholar] [CrossRef]
  78. Hewitt, G. The genetic legacy of the Quaternary ice ages. Nature. [CrossRef]
  79. IPCC. IPCC Fifth Assessment Report (AR5); Cambridge University Press: Cambridge, 2014. [Google Scholar]
  80. Lehikoinen, P.; Santangeli, A.; Jaatinen, K.; et al. Protected areas act as a buffer against detrimental effects of climate change-Evidence from large-scale, long-term abundance data. Global Change Biology 2018, 25. [Google Scholar] [CrossRef]
  81. Bates, O.K.; Ollier, S.; Bertelsmeier, C. Smaller climatic niche shifts in invasive than non-invasive alien ant species. Nature Communications. [CrossRef]
  82. You, J.; Qin, X.; Ranjitkar, S.; et al. Response to climate change of montane herbaceous plants in the genus Rhodiola predicted by ecological niche modelling. Scientific Reports 2018, 8, 5879. [Google Scholar] [CrossRef]
  83. Chen, X.; Dimitrov, N.B.; Meyers, L.A. Uncertainty analysis of species distribution models. PLoS ONE 2019, 14, e0214190. [Google Scholar] [CrossRef]
  84. Li, J.J.; Shu, Q.; Zhou, S.Z.; et al. Review and prospects of Quaternary glaciation research in China. Journal of Glaciol Geocryol 2004, 26, 235–243. [Google Scholar]
  85. Katherine, J, Willis; et al. The role of Quaternary environmental change in plant macroevolution: The exception or the rule? Philosophical Transactions of the Royal Society B Biological Sciences 2004. [Google Scholar]
  86. Wang, Q.; Abbott, R.J.; Yu, Q.S.; et al. Pleistocene climate change and the origin of two desert plant species, Pugionium cornutum and Pugioniumdolabratum (Brassicaceae), in northwest China. New Phytologist 2013.
  87. Qiu, Y.X.; Fu, C.X.; Comes, H.P. Plant molecular phylogeography in China and adjacent regions: Tracing the genetic imprints of Quaternary climate and environmental change in the world's most diverse temperate flora. Molecular phylogenetics and evolution 2011, 59. [Google Scholar] [CrossRef] [PubMed]
  88. Amelia, C.R.; Fabián, V.M.; Aguilar-Martínez, G.F.; et al. Alternative glacial-interglacial refugia demographic hypotheses tested on Cephalocereus columna-trajani (Cactaceae) in the intertropical Mexican drylands. PLoS ONE 2017, 12, e0175905. [Google Scholar]
  89. Phillips, S.J.; Dudík, M. Modeling of species distributions with Maxent: New extensions and a comprehensive evaluation. Ecography 2008, 31. [Google Scholar] [CrossRef]
  90. Zeng, M. Study on the distribution and potential suitable area of rare and endangered plant Cercidiphyllum japonicum. Master’s Thesis, China West Normal University, Nanchong, China, 2021. [Google Scholar]
  91. Hao, H.X. Response of Potential Geographical Distribution of Eight China’s First-Class Rare and Endangered Plants to Climate Change and Analysis of GAP. Master’s Thesis, Northwest Normal University, Lanzhou, China, 2021. [Google Scholar]
  92. Nzei, J.M.; Mwanzia, V.M.; Ngarega, B.K.; Musili, P.M.; Wang, Q.F.; Chen, J.M.; Li, Z.Z. Ecological Niche Modeling of Water Lily (Nymphaea L.) Species in Australia under Climate Change to Ascertain Habitat Suitability for Conservation Measures. Plants (Basel) 2022, 11, 1874. [Google Scholar] [CrossRef]
  93. Crowley, T.J. Causes of climate change over the last 1000 years. Science 2000, 289. [Google Scholar]
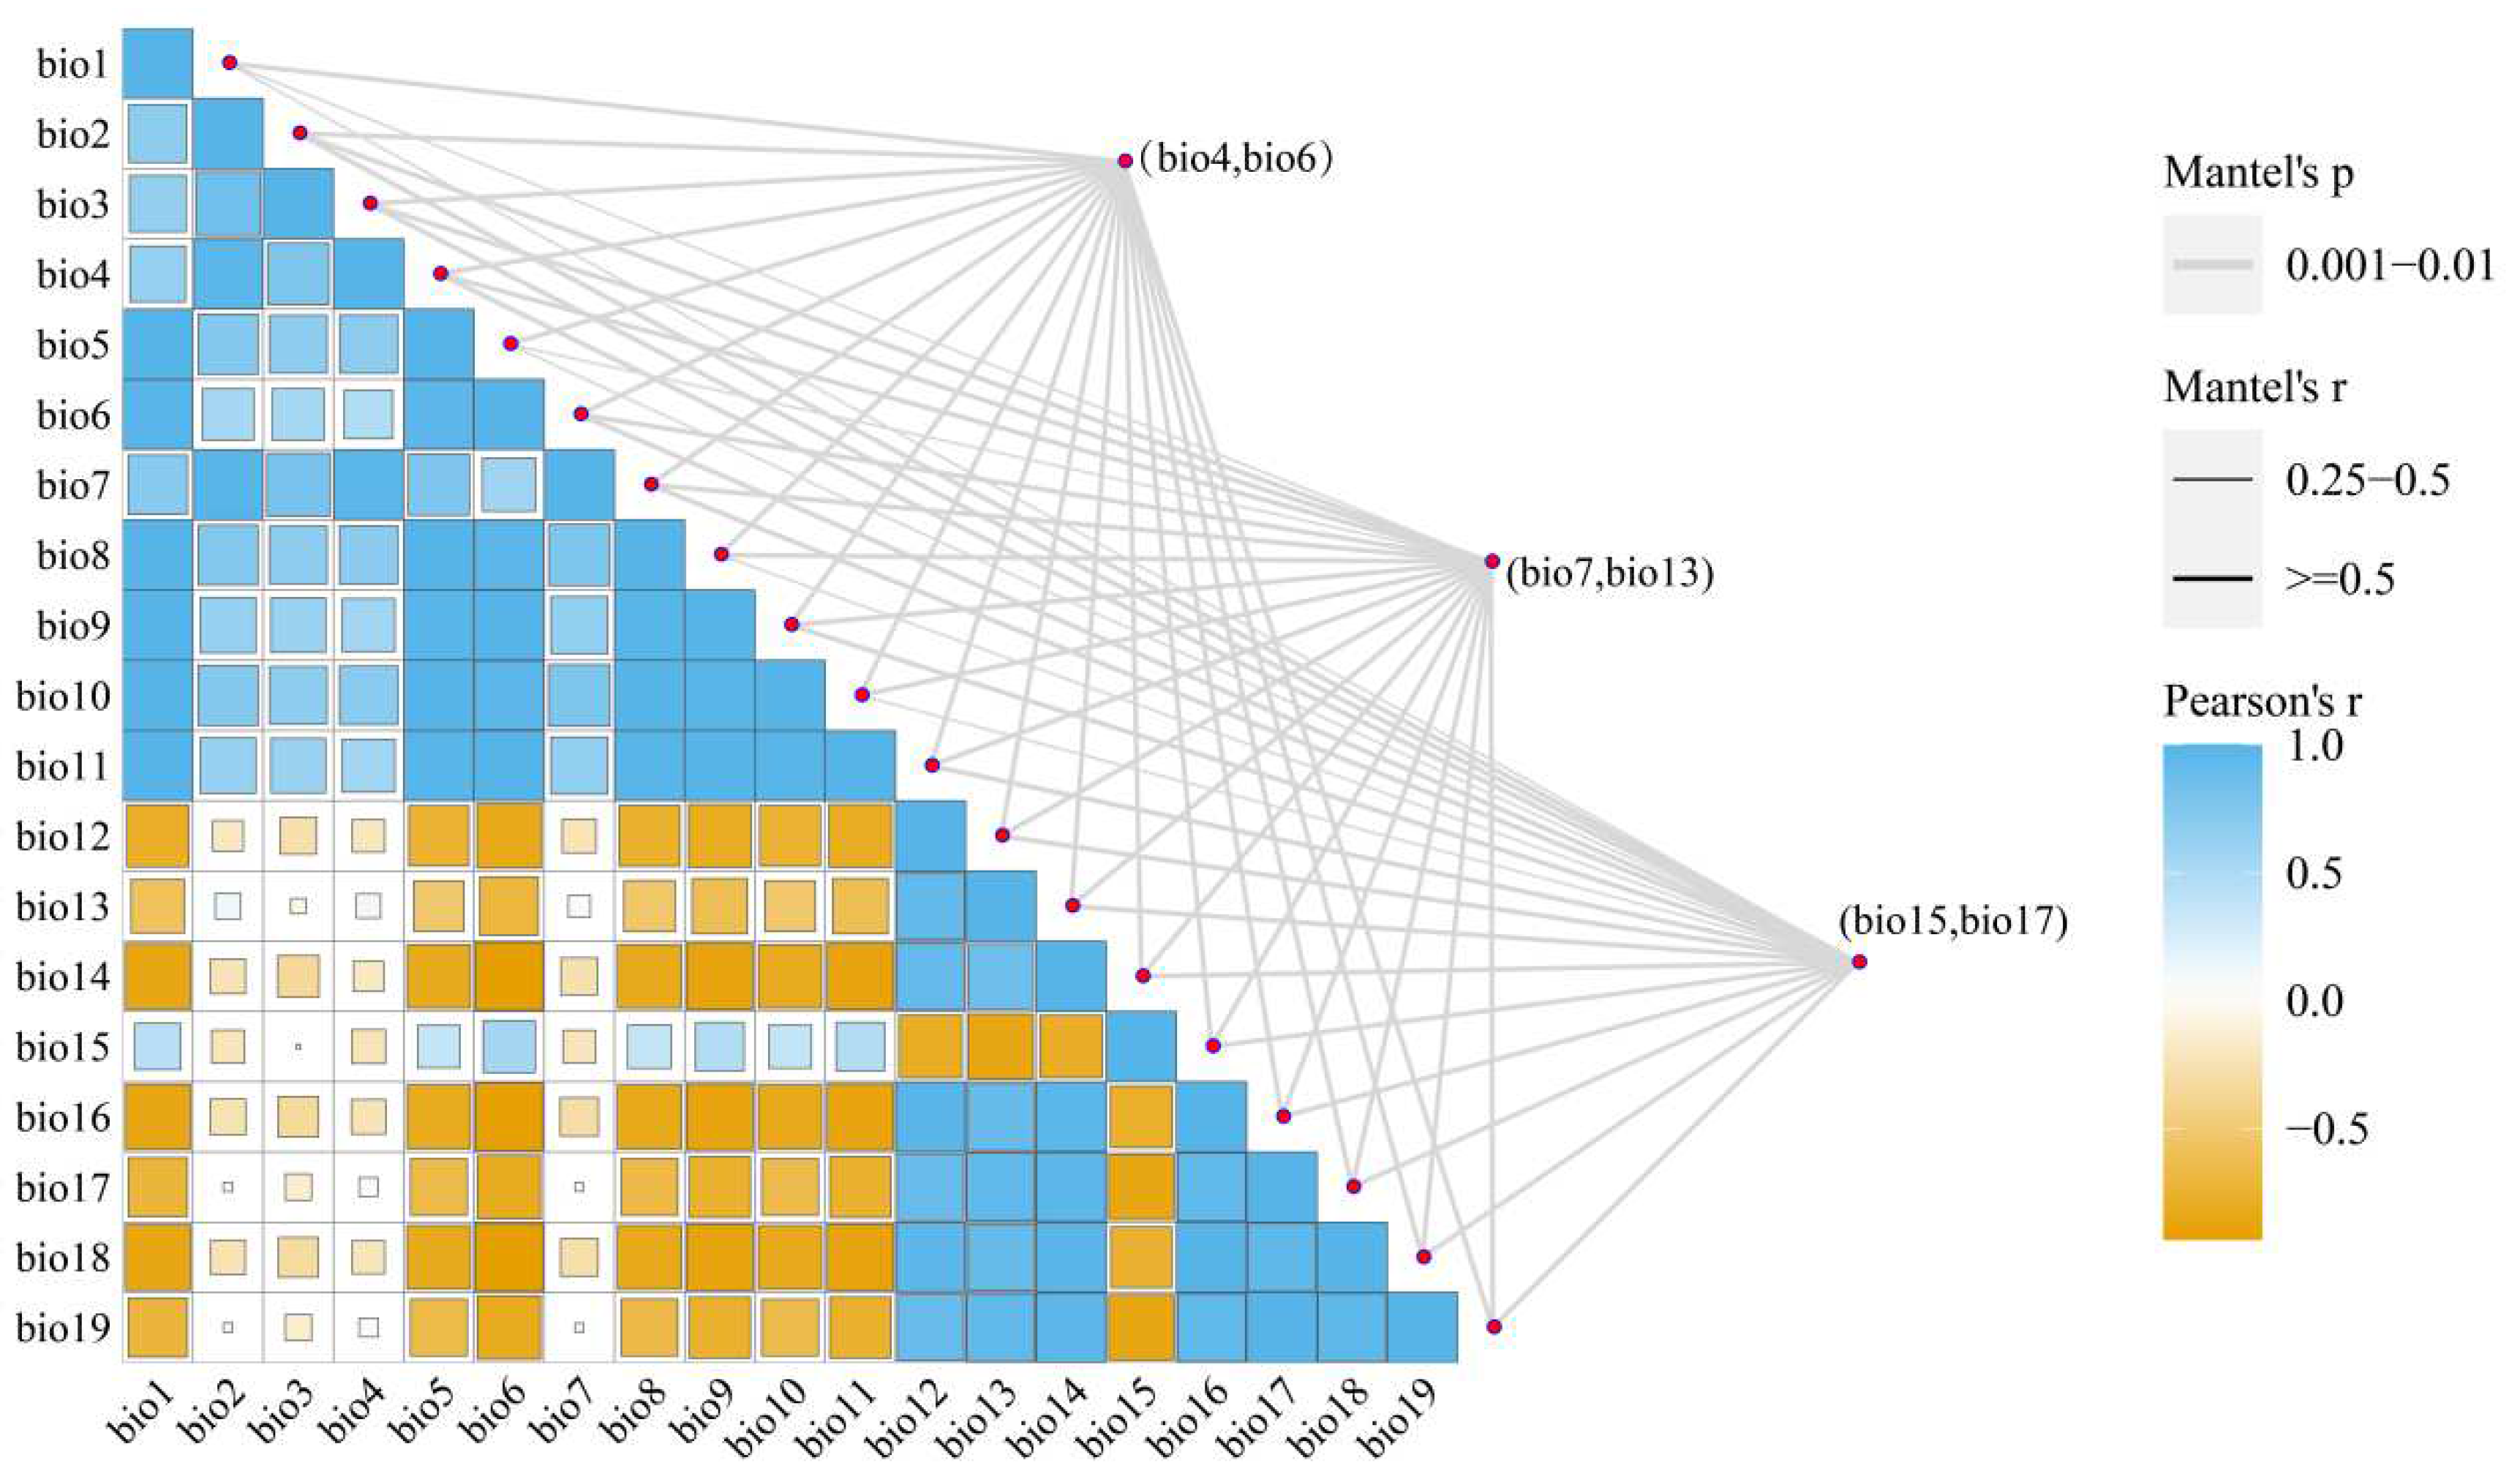
Figure 1. Correlation analysis of environmental variables. Blue represents positive correlations and yellow represents negative correlations.
Preprints 84118 g001
Figure 2. AUC of four species of Ilex nanchuanensis using ROC methods to test the results of MaxEnt.
Preprints 84118 g002
Figure 3. Percentage of environmental variables. on regulararied training gain of distribution using Jackknife test of Ilex nanchuanensis
Preprints 84118 g003
Figure 4. Variables are independently associated with the probability response curve of species distribution.
Preprints 84118 g004
Figure 5. Potential distribution for A. nanchuanensis during different periods predicted by the MaxEnt. model based on optimized parameters. The potential distribution of A. nanchuanensis was divided into four grades by the natural breaks method. Grey, green, yellow, and red areas represent not suitable, marginally suitable, moderately suitable, and highly suitable areas, respectively. Since the large map does not present a complete map of China, a small map is used to supplement the complete U-shaped line. China map downloaded from the service website of the National Bureau of Surveying, Mapping and Geographic Information, review number GS (2016) 1549
Preprints 84118 g005
Figure 6. Predicted potential distribution of Ilex nanchuanensis by MaxEnt.
Preprints 84118 g006
Figure 7. Migration route of the center of the suitable range of Ilex nanchuanensis since the last interglacial.
Preprints 84118 g007
Table 1. Description of the climate environmental variables used in MaxEnt.
Variable Code Unit
Temperature seasonality (standard deviation) Bio4
Minimum temperature of warmest month Bio6
Annual mean temperature range Bio7
Precipitation of wettest month Bio13 mm
Precipitation seasonality (coefficient of variation) Bio15 mm
Precipitation of driest quarter Bio17 mm
Table 2. Percentage contribution and permutation importance of each environmental variable.
Period Bio4 Bio6 Bio7 Bio13 Bio15 Bio17
Percent contribution LIG 4.7 41.5 15.4 2.0 23.3 13
LGM (CCSM) 3.7 41.3 16.1 1.5 24.1 13.3
LGM (MIROC) 6.3 43.2 16.1 0.5 21.7 12.2
Current 2.8 44.1 15.3 3.5 24.3 10.0
Permutation importance LIG 10.2 33.3 42.0 1.5 11.5 1.5
LGM (CCSM) 11.5 27.8 41.0 1.9 15.6 2.2
LGM (MIROC) 16.6 30.6 43.2 0 8.2 1.3
Current 13.9 29.2 40.0 2.5 12.6 1.9
Table 3. Characteristics of potential distribution in different periods for I. nanchuanensis.
Period Area of each suitable region (×104 km2)
Marginally suitable region Moderately suitable region Highly suitable region Total suitable region
LIG 19.46181 10.72569 5.185764 35.373264
LGM (CCSM) 17.64583 9.892362 4.810764 32.348956
LGM (MIROC) 17.97049 11.09375 5.348958 34.413198
Current 20.02604 11.98785 5.708333 37.722223
2050RCP2.6 20.61979 16.17708 4.168403 40.965273
2050RCP4.5 21.50868 12.00868 2.602431 36.119791
2050RCP6.0 24.05035 14.31597 8.088542 46.454862
2050RCP8.5 18.48958 11.60417 5.079861 35.173611
2070RCP2.6 19.43924 11.04688 2.881944 33.368064
2070RCP4.5 19.10417 10.43403 2.644097 32.182297
2070RCP6.0 21.71701 6.925347 0.032986 28.675343
2070RCP8.5 18.81424 10.66667 0.03125 29.51216
Table 4. Potential distribution area of I. nanchuanensis in the 2050s and 2070s.
Species Period Area of each suitable region (×104 Km2)
Unsuitable region Unchanged region Expansion region Contraction region
Abies chensiensis Current vs RCP2.6-2050s 889.29 42.34 3.25 14.00
Current vs RCP4.5-2050s 894.40 37.14 8.45 8.90
Current vs RCP6.0-2050s 893.47 40.52 5.07 9.82
Current vs RCP8.5-2050s 897.51 36.61 3.81 8.86
Current vs RCP2.6-2070s 894.11 39.40 6.18 9.19
Current vs RCP4.5-2070s 887.94 41.85 3.74 15.36
Current vs RCP6.0-2070s 892.25 42.52 3.66 11.04
Current vs RCP8.5-2070s 891.08 39.23 7.24 9.24
Disclaimer/Publisher’s Note: The statements, opinions and data contained in all publications are solely those of the individual author(s) and contributor(s) and not of MDPI and/or the editor(s). MDPI and/or the editor(s) disclaim responsibility for any injury to people or property resulting from any ideas, methods, instructions or products referred to in the content.
Copyright: This open access article is published under a Creative Commons CC BY 4.0 license, which permit the free download, distribution, and reuse, provided that the author and preprint are cited in any reuse.
Prerpints.org logo

Preprints.org is a free preprint server supported by MDPI in Basel, Switzerland.

Subscribe

© 2024 MDPI (Basel, Switzerland) unless otherwise stated