Introduction
Colombia’s fruits and vegetables production systems are very important for the country to improve economic development and national food security, then a description of the yield trends during the time for these crops is crucial. Recently, this is becoming predominant to understand how food and crops are produced and to determine the impact of environmental, social and economic factors on the cultivation system (Kamble et al., 2020). Furthermore, considering the challenges imposed by climate change, which have affected agricultural activity worldwide and are threatening global food security (Dumortier et al., 2020; Gurgel et al., 2021). It has been estimated that by 2050, crops yield should increase up to 60-110% to fulfill food needs, while negative impacts of agriculture on the environment and climate changes have to be reduced (Chen et al., 2011; Cui et al., 2018, Tester and Langridge, 2010).
The improvement of national agricultural activities may start analyzing historical data of crop yields (Majumdar et al., 2017; Meuwissen et al., 2019), leading to identifying the adaptability of agricultural systems (Reidsma et al., 2007). Yield stability can be evaluated using several methods, which are mainly focused on the analysis of plant-environment interaction and its effect on productivity. For instance, yield means and variance of maize, soybean and wheat in Canada were calculated to examine the effect of agricultural practices on the cultivation system. The analysis showed that input amounts and technification level have impacts on crop yields (Cabas et al., 2010). However, most of the research in this field is focused on understanding the effect of climate variables on crop yield, especially in cereal species (Elavarasan et al., 2018; Khaki y Wang, 2019; van Klompenburg et al., 2020).
Agricultural databases are widely distributed and implemented to uncover trends and design national crop management strategies based on data analytics. Farmers may use this information to improve agricultural practices and investment decisions (Khaki and Wang, 2019). The information of the national crop productivity is crucial in other industries such as seed, fertilizer and agricultural machine production (Konduri et al., 2020; Majumdar et al., 2017). Linear regression models and multivariate analysis are an approach to examine crop production data (Calderini and Slafer, 1998; Juhos et al., 2015; Piepho, 1998; Renard and Tilman, 2019).
The objectives of the present research are: i) characterize fruits and vegetables productivity in Colombia from 2006 to 2020, ii) identify fruits and vegetables crops with high yield stability and iii) determine differences among national regions and the effect of non-climate variables on crop productivity.
Materials and methods
Description of agricultural productivity for fruits and vegetables in Colombia
Data variability of fruits and vegetables cropping systems were analyzed for the variables cultivated area (CAR), harvested area (HAR), total production (PRO) and yield (YIE). Then, trends of the agricultural productivity by type of crop were compared using annual means to display the current Colombia situation for fruits and vegetables. Comparisons among regions were conducted using the variable YIE to identify national regions with strengthened fruits and vegetables systems. The analysis was targeted on YIE because the result of this variable reflects the impact of climatic and non-climatic factors associated with the agricultural system (Piepho, 1998). Crops species contrasting was used to describe the local situation for fruits and vegetables in Colombia. Crops with the highest YIE were analyzed thoroughly. Similar analyses were conducted for the variables: commodity price (CPR), fertilizers price (FRP), fungicides price (FUP), herbicides price (HEP) and insecticides prices (INP). These variables were regarded as associated with the system production and used to explain the variation among crops productivity.
Evaluation of the crop yields to analyze agricultural systems stability
Yield data from 2006 until 2020 was used to determine the highest productive agricultural system in Colombia among regions. First, fruits and vegetables crops with the largest means for YIE variable over the time were identified, then, those that were cultivated at least in 15 different regions, were selected. Mixed linear models (MLM) were applied to those crops previously selected to assess the stability of the cropping systems in the country. The variation caused by time (year) and location (department) in the agricultural systems was determined (Equation 1). This methodology is described by Piepho (1998). The stability of the yield variable accounts for a random effect that is not considered by the model, high values imply low stability of the crop (Piepho, 1998). The MLM for each selected crop was applied using the R lme4 package (Bates et al., 2015):
where
is the mean of the yield of a crop by certain year and region,
is the fixed effect caused by the region where the crop was cultivated,
is the random effect due to the year when crop was cultivated and
is the residual effect of the model.
Then, selected fruits and vegetables crops were analyzed comparing YIE means among Colombia regions. Analysis of variance (ANOVA) was applied to determine significance difference of crops productivity.
Analysis of non-climatic factors on agricultural productivity among Colombian regions
Principal component analysis (PCA) was used to determine the impact of non-climatic variables, CPR, FRP, FUP, HEP and INP on crop variables CAR, HAR, PRO and YIE. Before the analysis, a database combining agricultural productivity and non-climatic variable prices was constructed. This was conducted assuming that CPR, FRP, FUP, HEP and INP are related to CAR, HAR, PRO and YIE by the crop cultivation region and year. Then, this database was used to conduct PCA on standardized data. Data standardization was done using the z-score. The PCA was run in R software using the package Factominer (Lê et al., 2008). This analysis was done to complete the fruits and vegetables data set and also to the previous selected crops.
The results obtained with the dataset for agricultural production from 2006 until 2020, were compared to a data set of agricultural practices in Colombia for the year 2018. This data contains information of agricultural activity in Colombian farms, showing holders practices about agri-inputs application. Data of the amount of fertilizers, herbicides, fungicides and insecticides were correlated to yield.
Results
Decreases of fruits and vegetables yield in Colombia
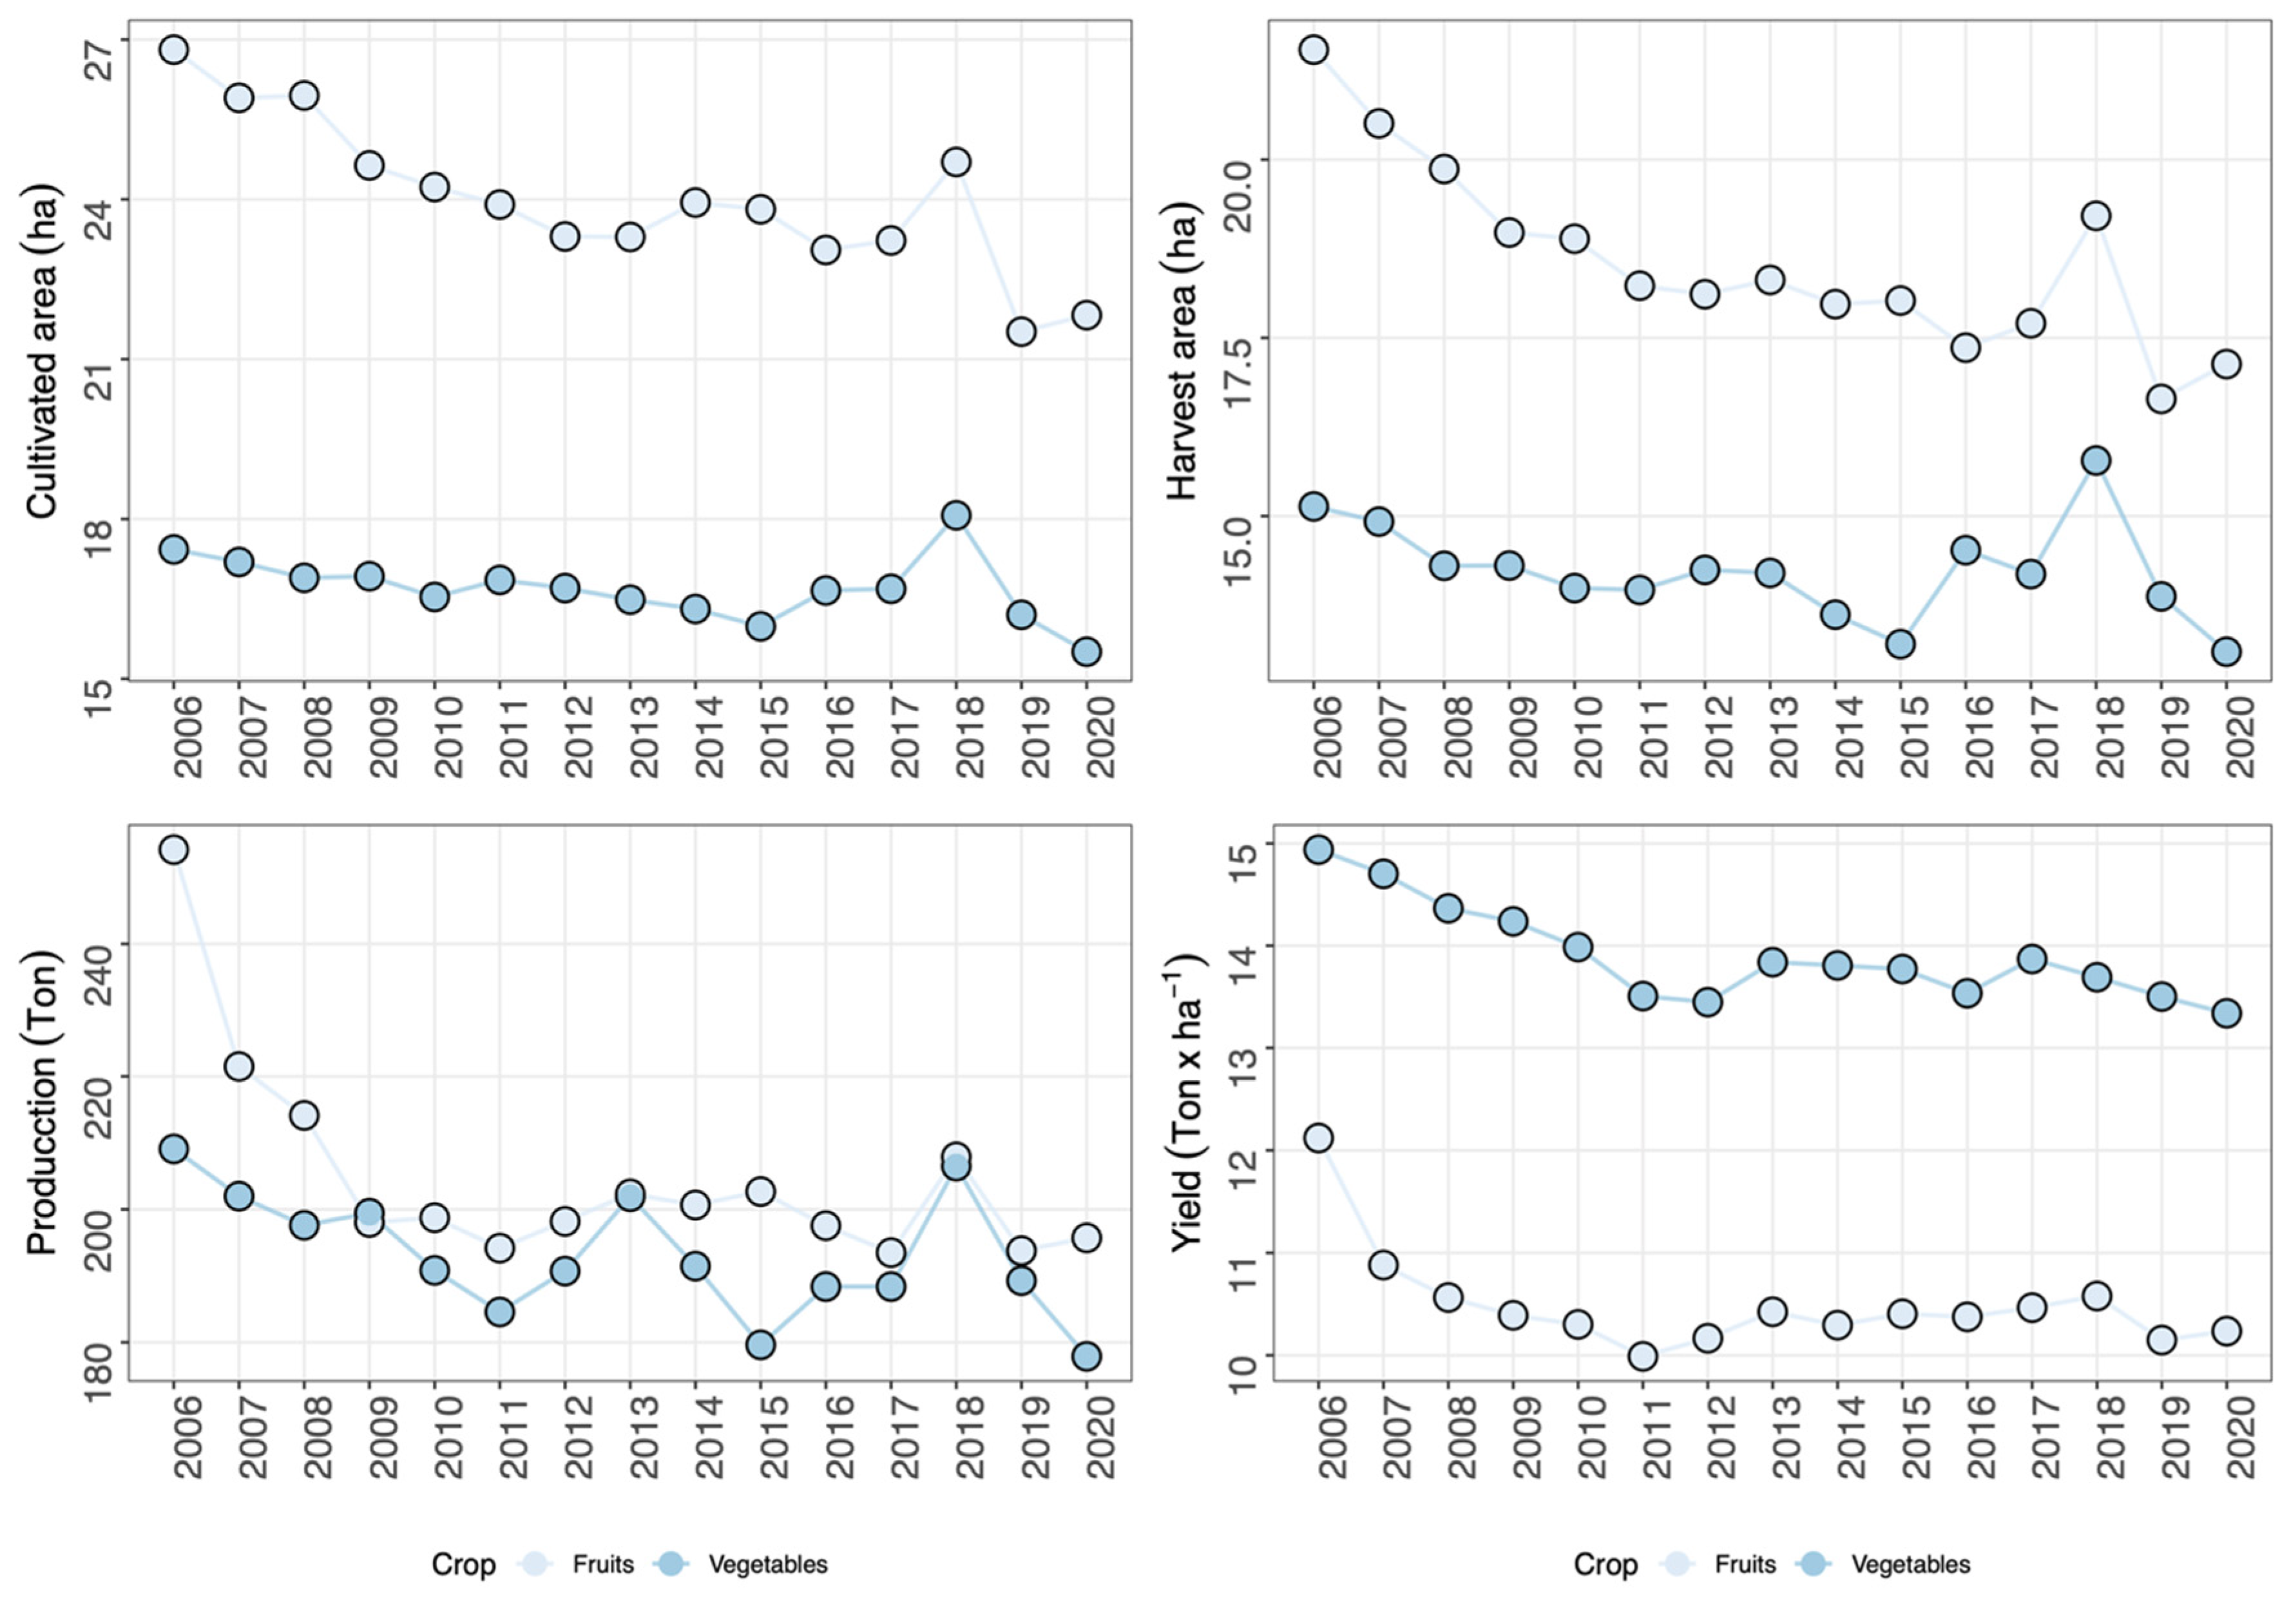
Data trends for vegetables and fruits systems were analyzed, initially, grouping the information by type of crop, then variables were arranged by year and regions, to understand agricultural tendencies in Colombia by time and location. Data distribution of the variables CAR, HAR, PRO and YIE show wide variability for fruits and vegetables in Colombia from 2006 until 2020. In the last 15 years, it was observed that CAR in Colombian farms may diverge from one to more than 100 hectares for both fruits and vegetables cropping systems. Means for CAR, HAR and PRO have been higher for fruits than vegetables, however, YIE has been higher for the second at the same time. Furthermore, data shows that vegetables systems used less area than fruits for sowing. On the other hand, the means of analyzed variables decreased from 2006 until 2020, with a minor increase in 2018. Nonetheless, it is clear that YIE of fruits and vegetables has widely decreased in Colombia, reaching values of 10.23 and 13.33 ton x ha
-1, respectively in 2020 (
Figure 1). In 2018 the amount of fruit and vegetable production increased in Colombia, however YIE remains similar to previous years, indicating such increases relied on larger cultivated areas by farms (
Figure 1).
Local production of fruits and vegetables in Colombia
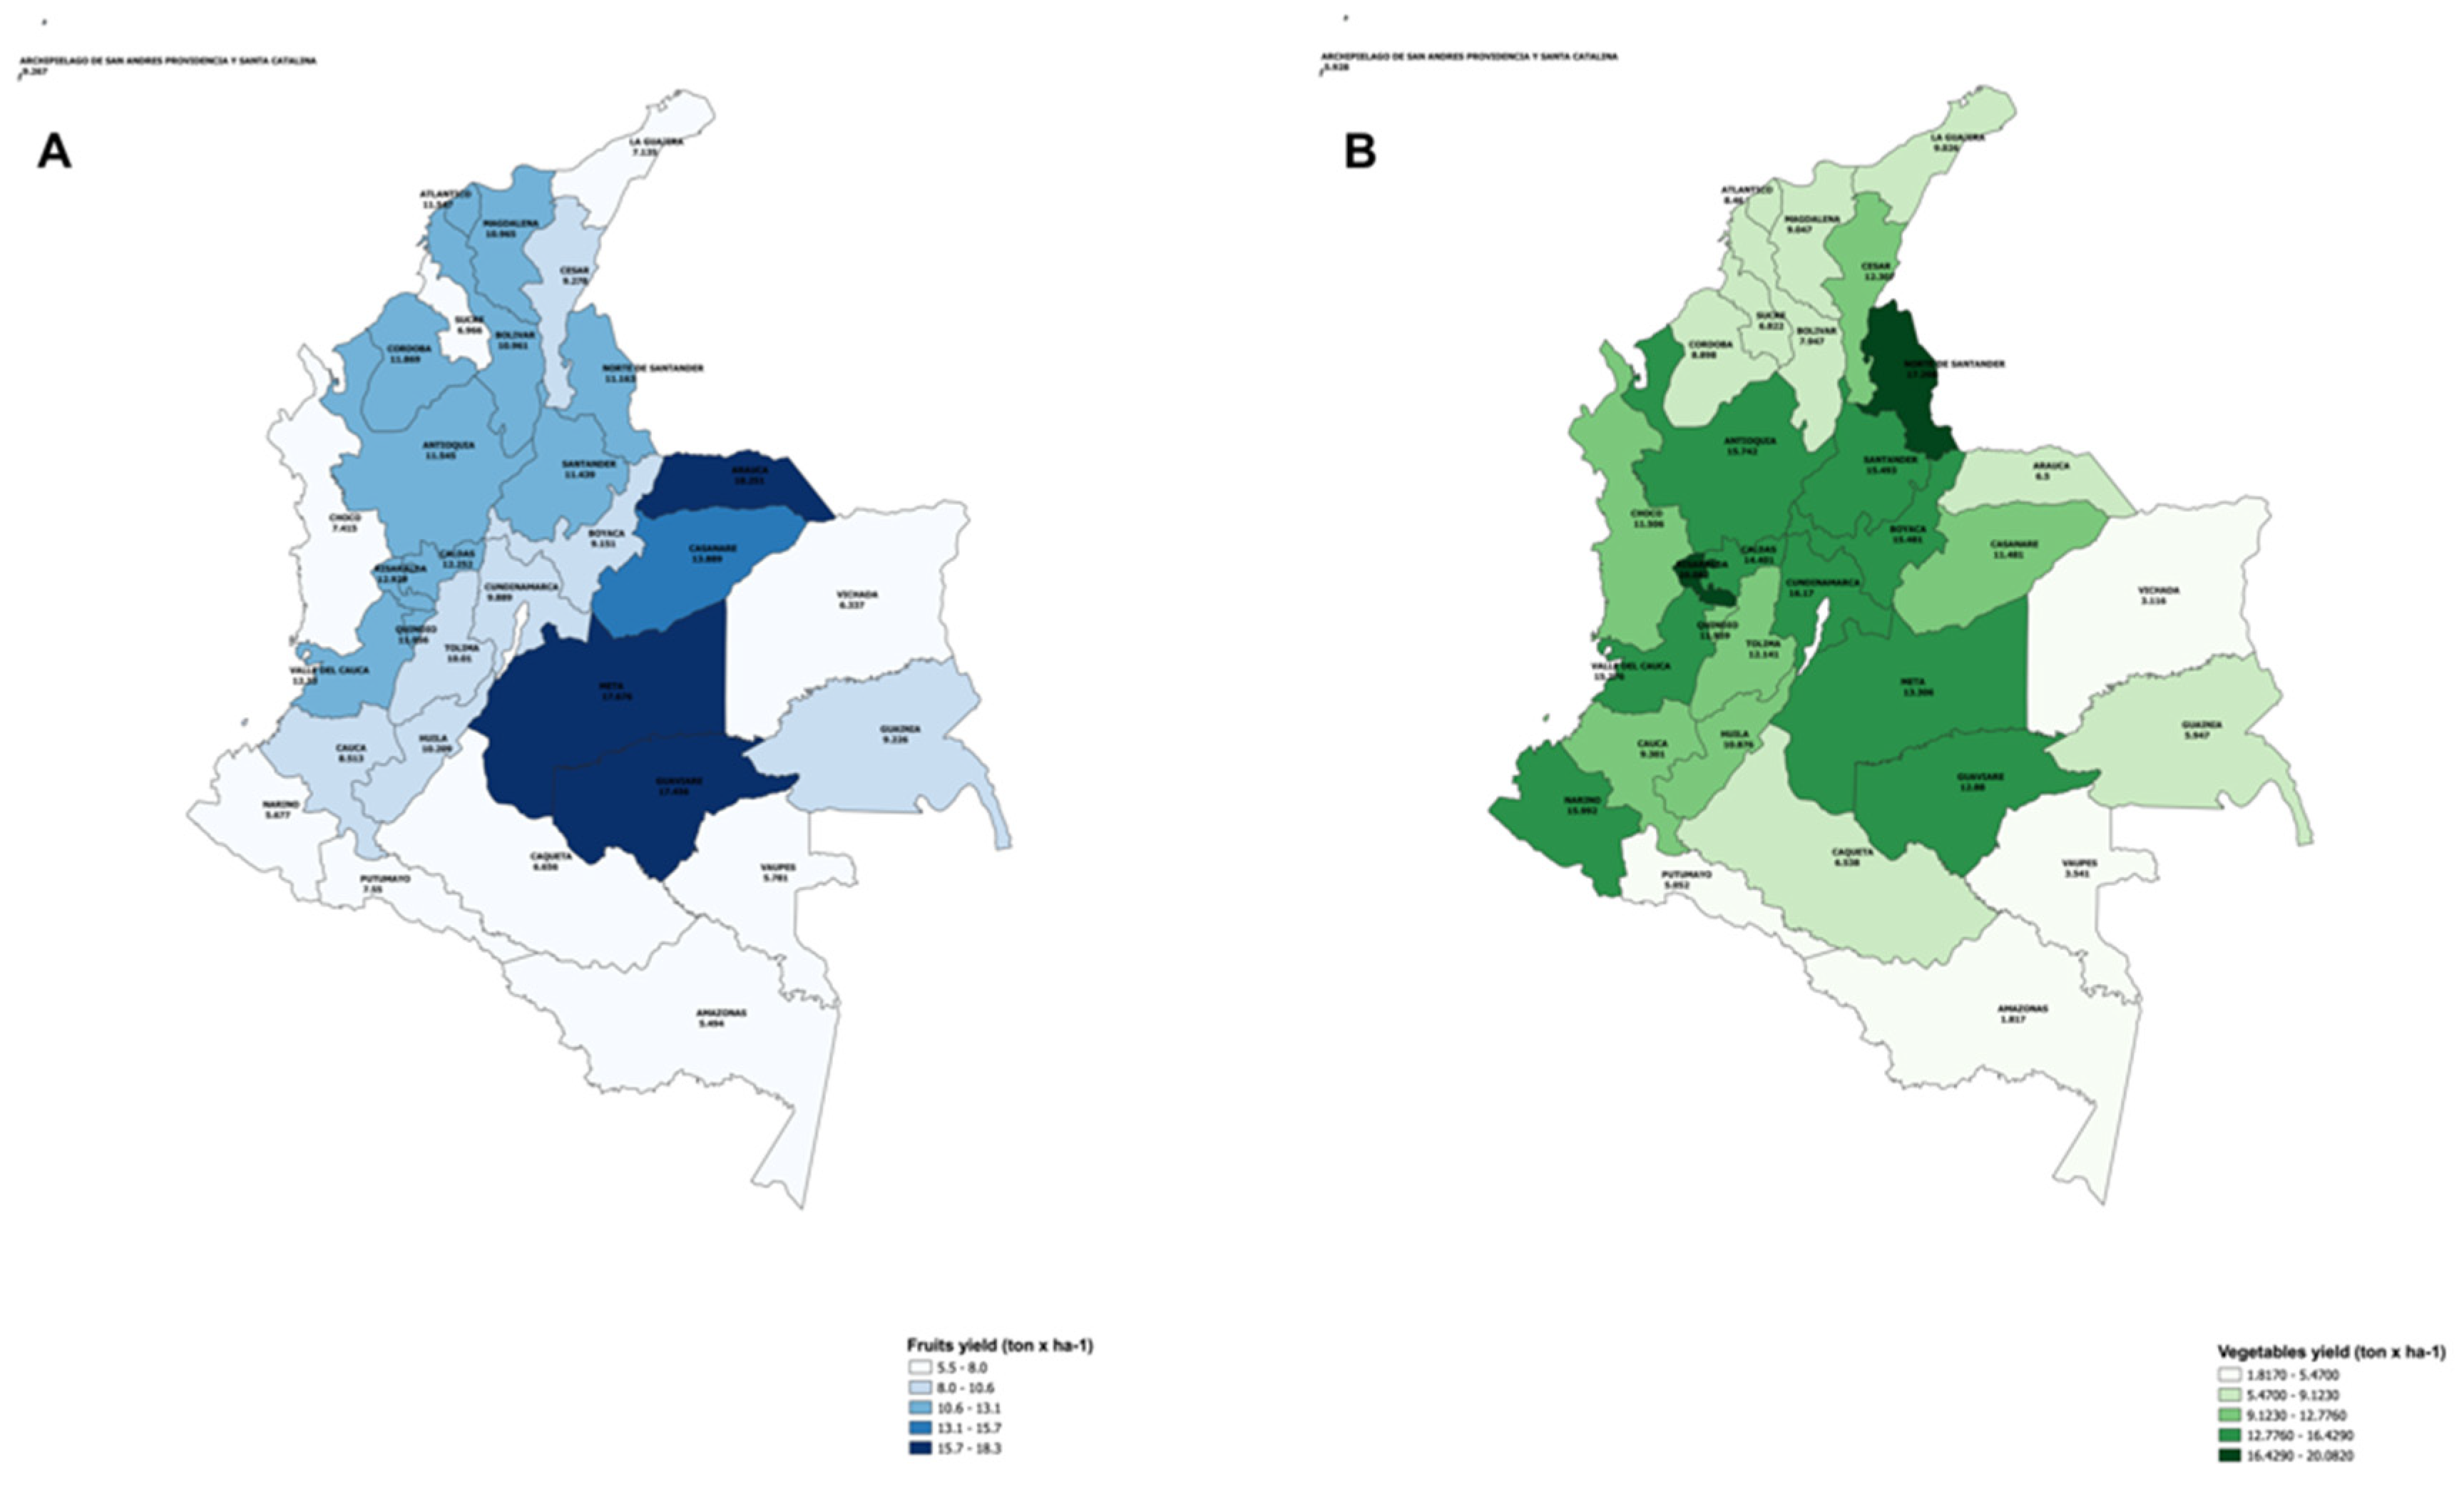
Yield analysis for fruits and vegetables systems in the last 15 years shows that farms in Arauca and Risaralda locations have the largest values, with means of 18.25 y 20.08 ton x ha
-1 for fruits and vegetables, respectively. Furthermore, farms at locations such as Valle del Cauca, Antioquia, and Santander, among others, had higher YIE for both fruits and vegetables crop systems. Amazonas, Vaupes, Vichada and other regions located in southeastern Colombia showed the lowest values for YIE. For fruits production, western locations showed higher YIE values, while for vegetables this was observed at central regions (
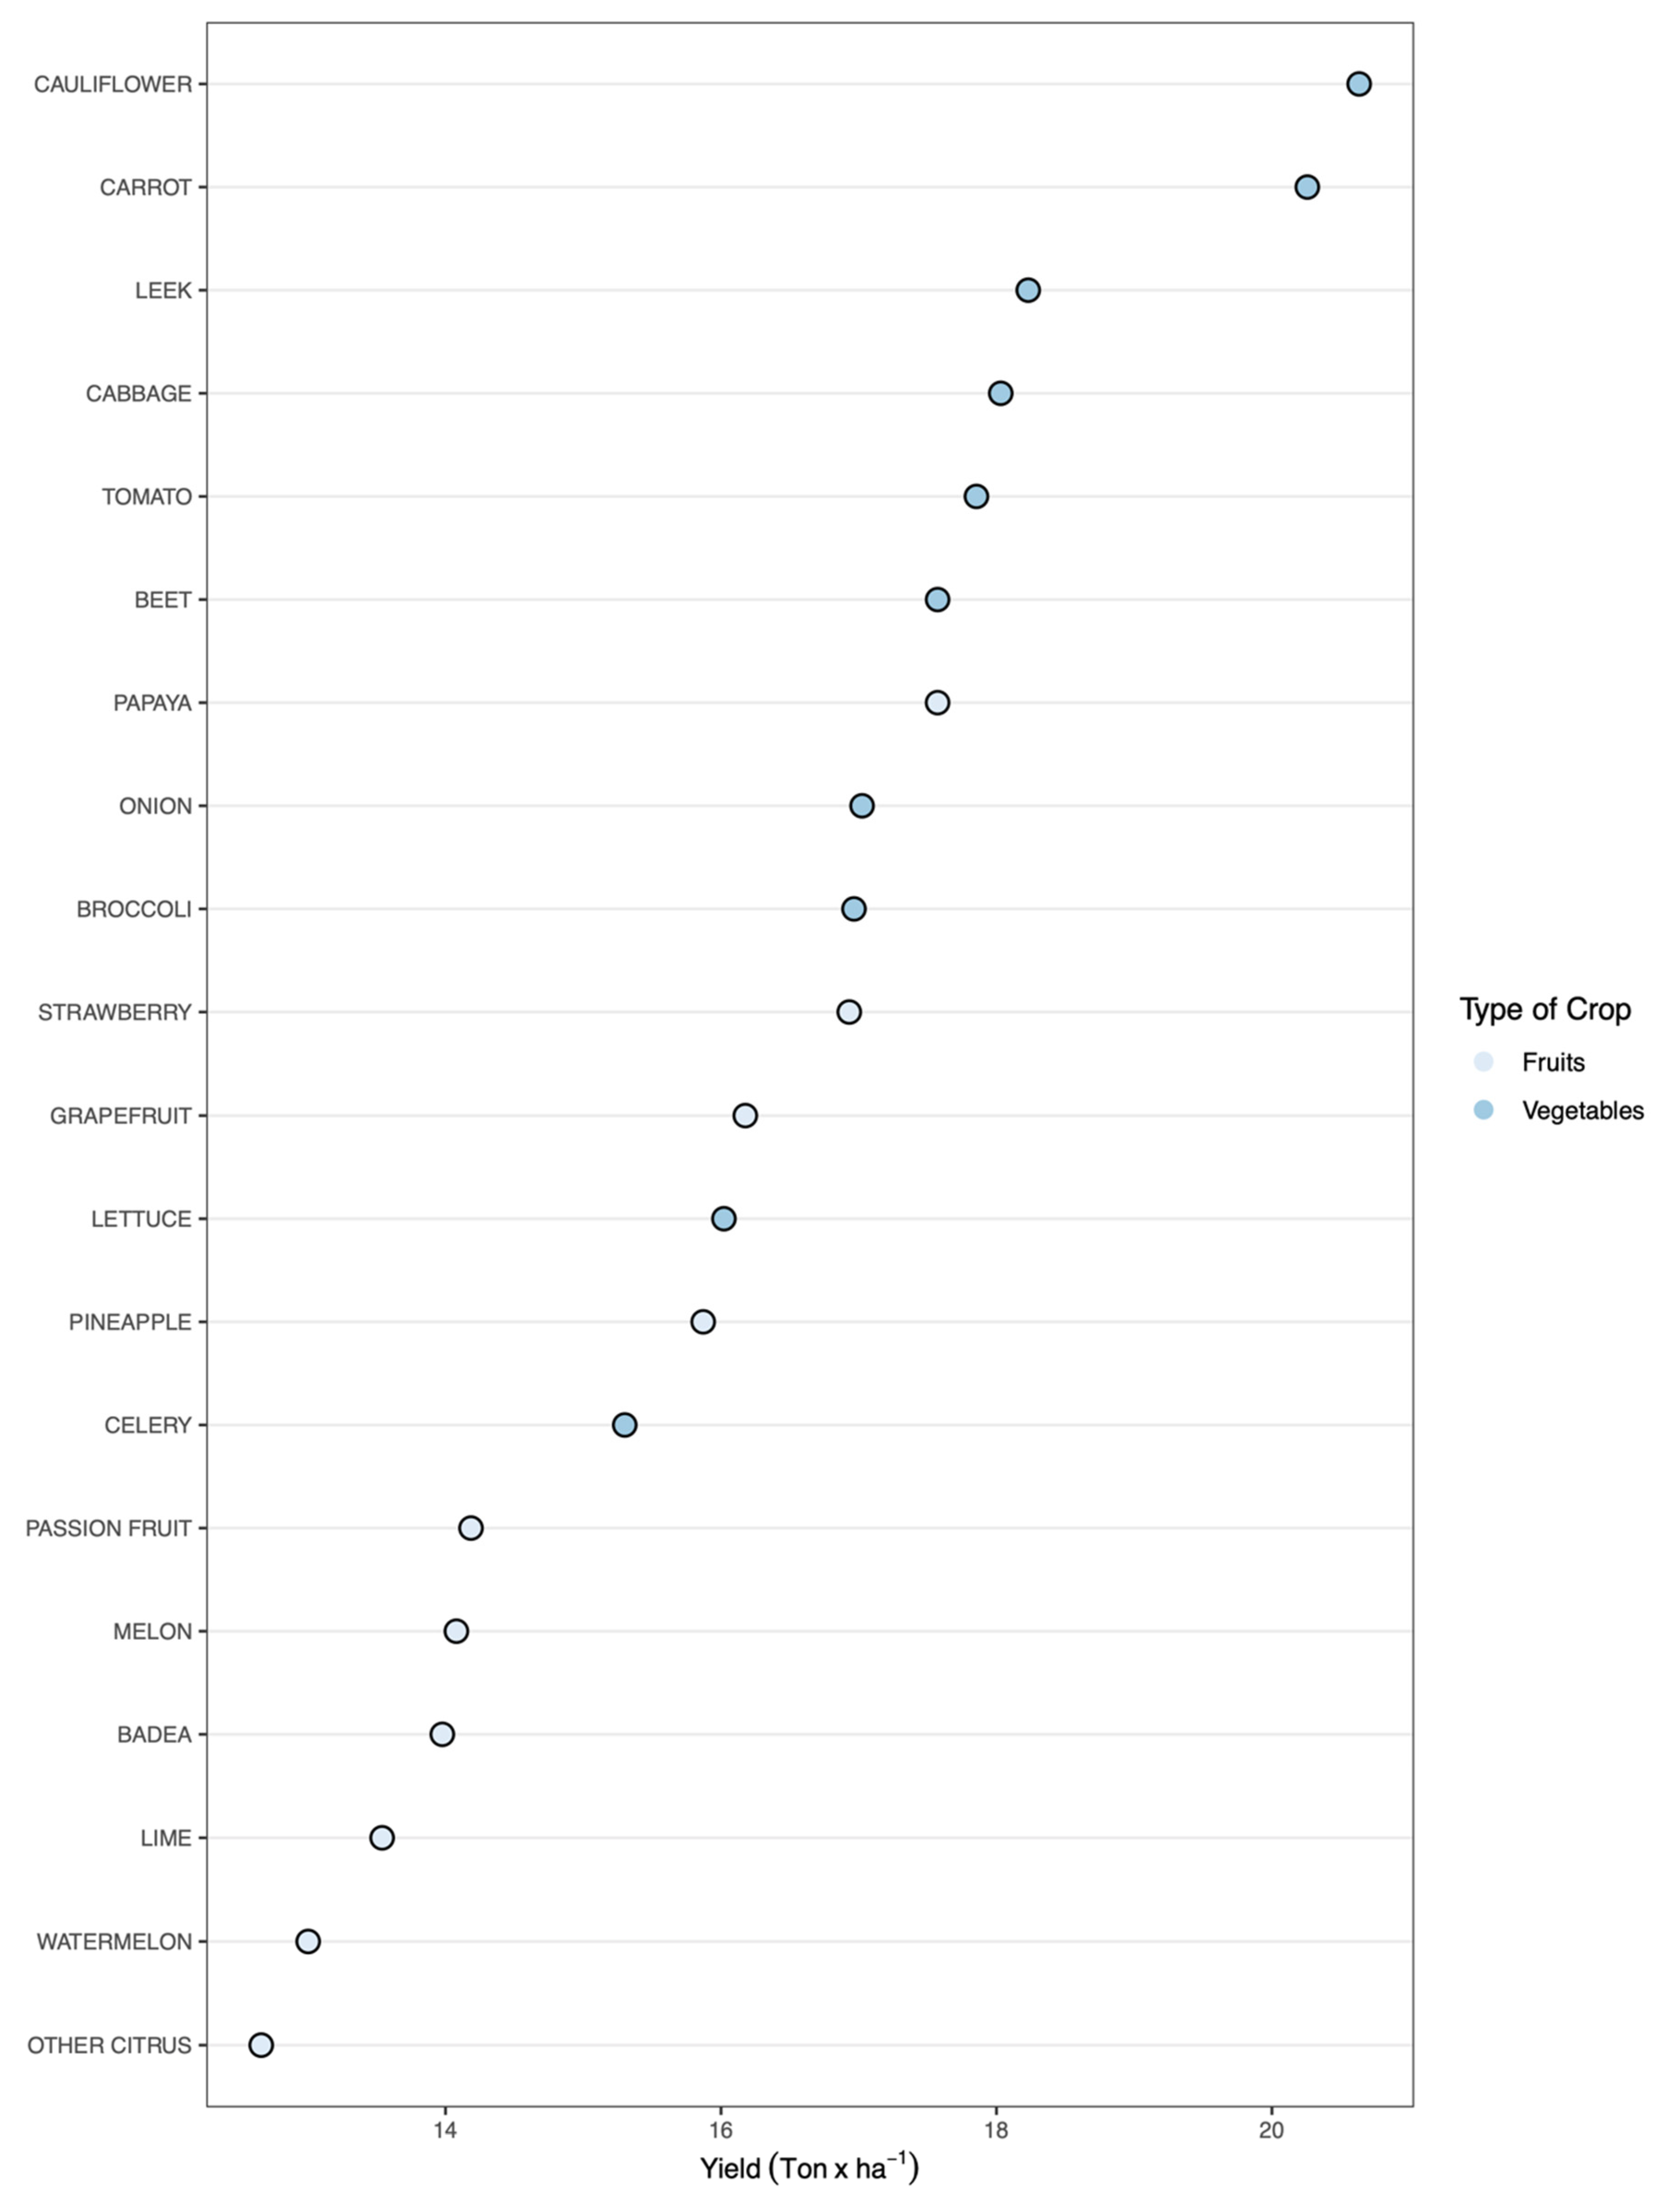
Figure 2). In Colombia, the fruit crop with highest yield is papaya with mean values of 17.57 ton x ha
-1, while cauliflower, with 20.63 ton x ha
-1, is the vegetable showing the largest values. Farms cultivating Strawberry, grapefruit, pineapple, carrot, cabbage and tomato showed high yield values as well (
Figure 3).
Yield comparison between fruits and vegetables exhibits a wide difference for these two kinds of crops. This result shows vegetable systems are more productive than fruit systems in Colombia, using the sowing area more efficiently. On the other hand, fruit species with the highest yield were those typically cultivated in farms of flat zones such as papaya, grapefruit and pineapple. The stability analysis, conducting a MLM for the productivity of Colombian farms, displays that time (random factor) had a small variance across the farms at different locations on yield of fruit and vegetables systems. However, fixed factors showed large variance, indicating that locations of the agricultural system impacted considerably the yield augmentation. Model residual values were high and indicate that other factors should be used to understand the yield variability in the evaluated crops (
Table 1).
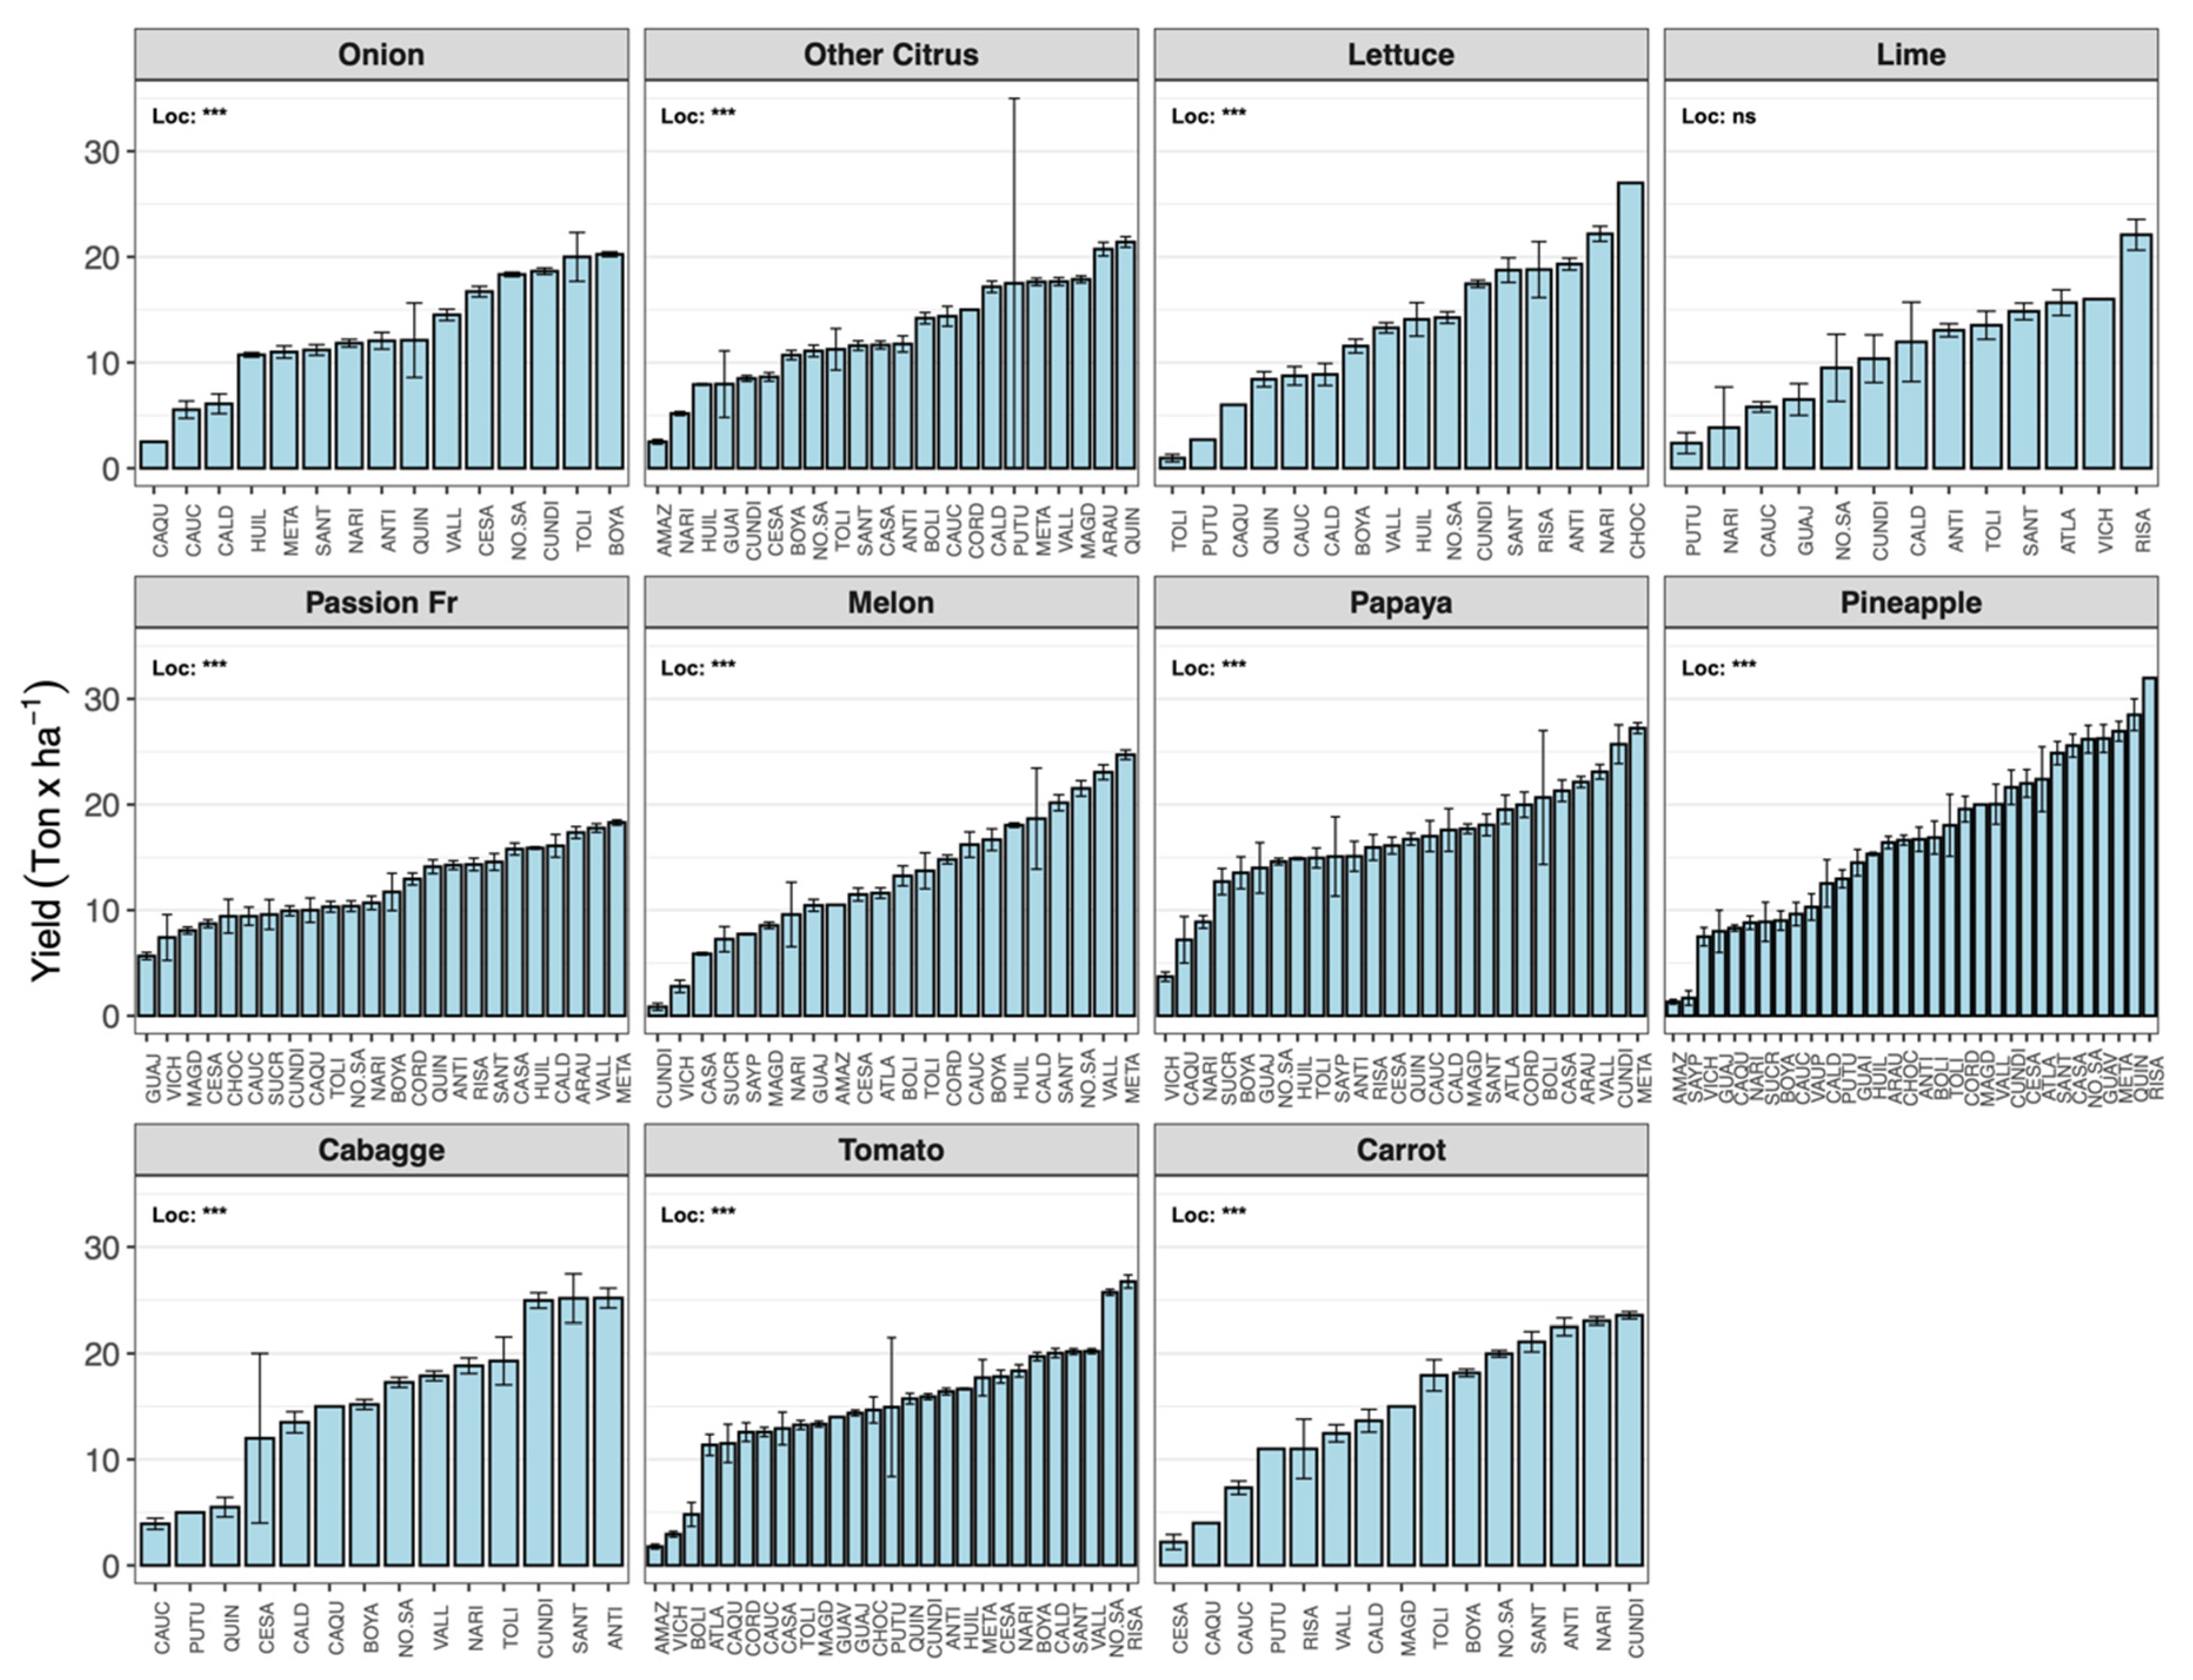
When the selected crops were compared, the location of the farms had effect on all the cropping system, except for lime (
Figure 4). Meta showed highest YIE for papaya, melon, and passion fruit cropping systems, while Risaralda for tomato and pineapple. Arauca show high values of production for passion fruit, papaya and other citrus. Large variability on YIE was observed in the cropping systems of onion, lime, melon, papaya and tomato located at Quindio, Narino, Caldas, Bolivar and Putumayo, respectively. For fruits, highest YIE was obtained in pineapple, with values over 30 tons x ha
-1, while for vegetables, tomato reached yields over 25 tons x ha
-1 (
Figure 4).
Yield evaluation and the impact of non-climate factors on the agricultural systems
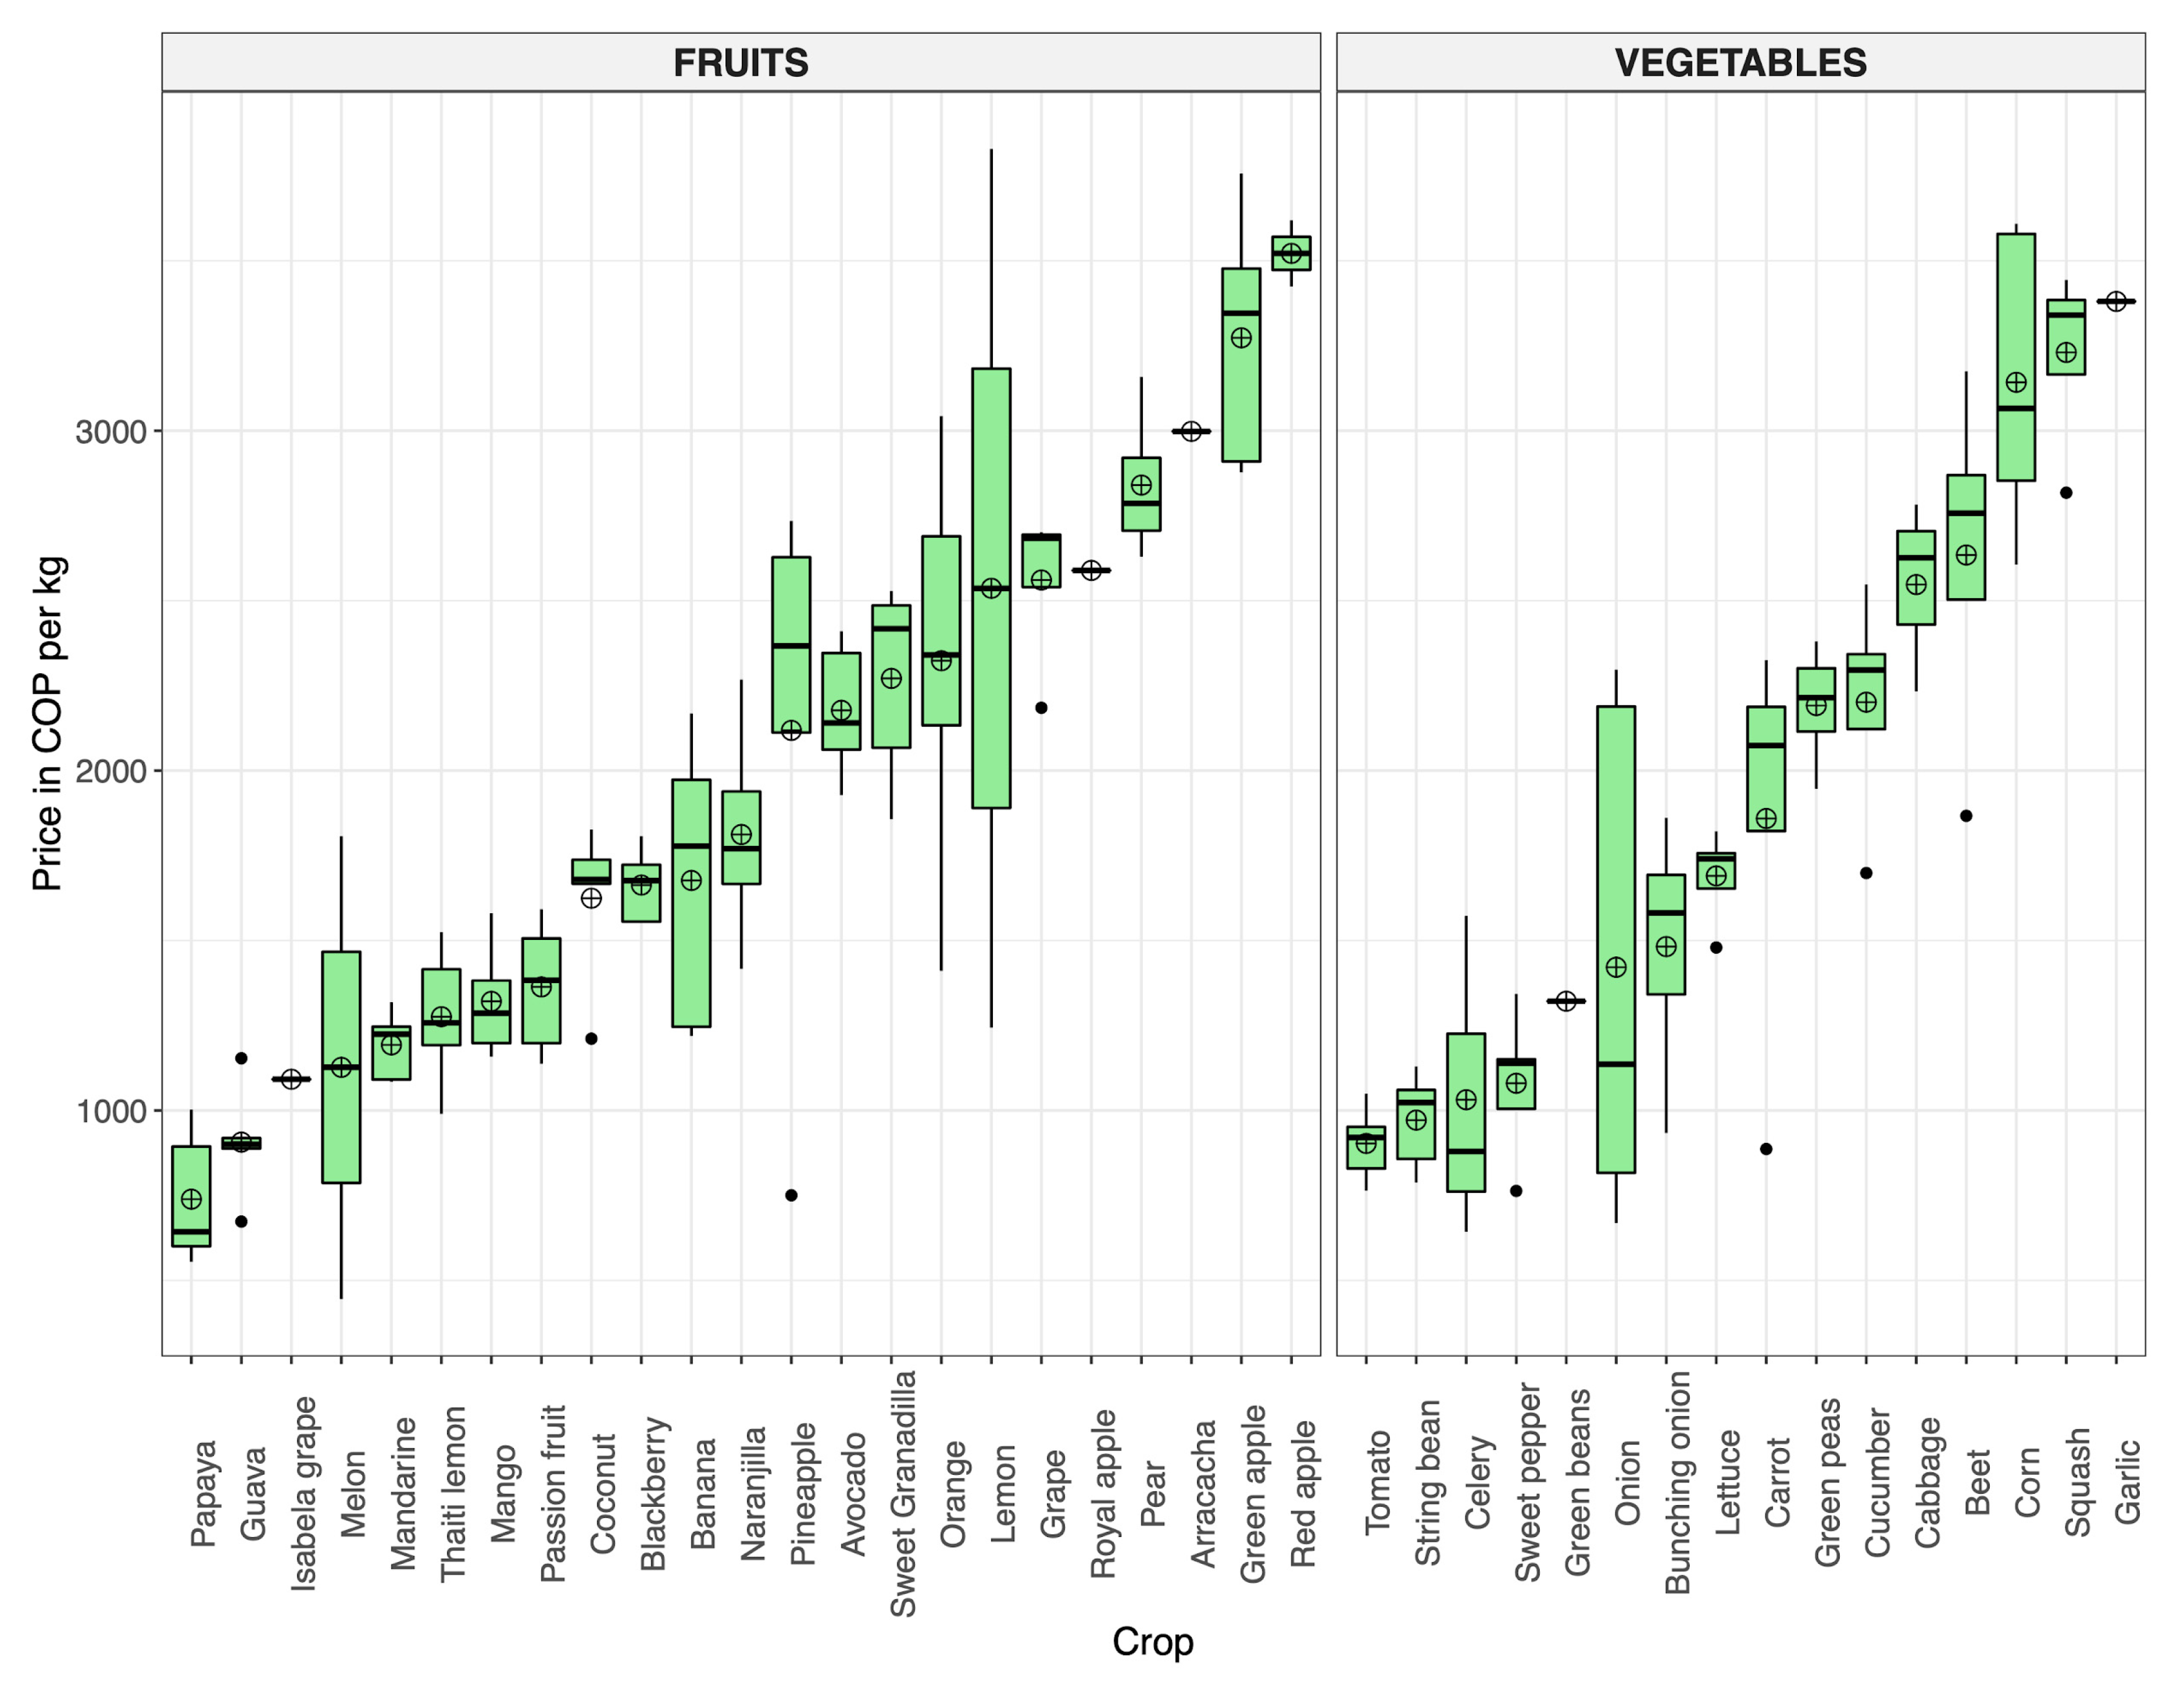
A large variability was observed for the crop prices and the agri-inputs values in Colombia from 2015 to 2019. Crops such as lemon, onion and cantaloupe showed the largest variability for commodity prices during this time, due to the unsteadiness at markets (
Figure 5). Otherwise, crops like pineapple and carrots had stability in commodity prices, even when they were low. The lowest prices were observed for papaya, green beans and tomato for the evaluated time in Colombia (
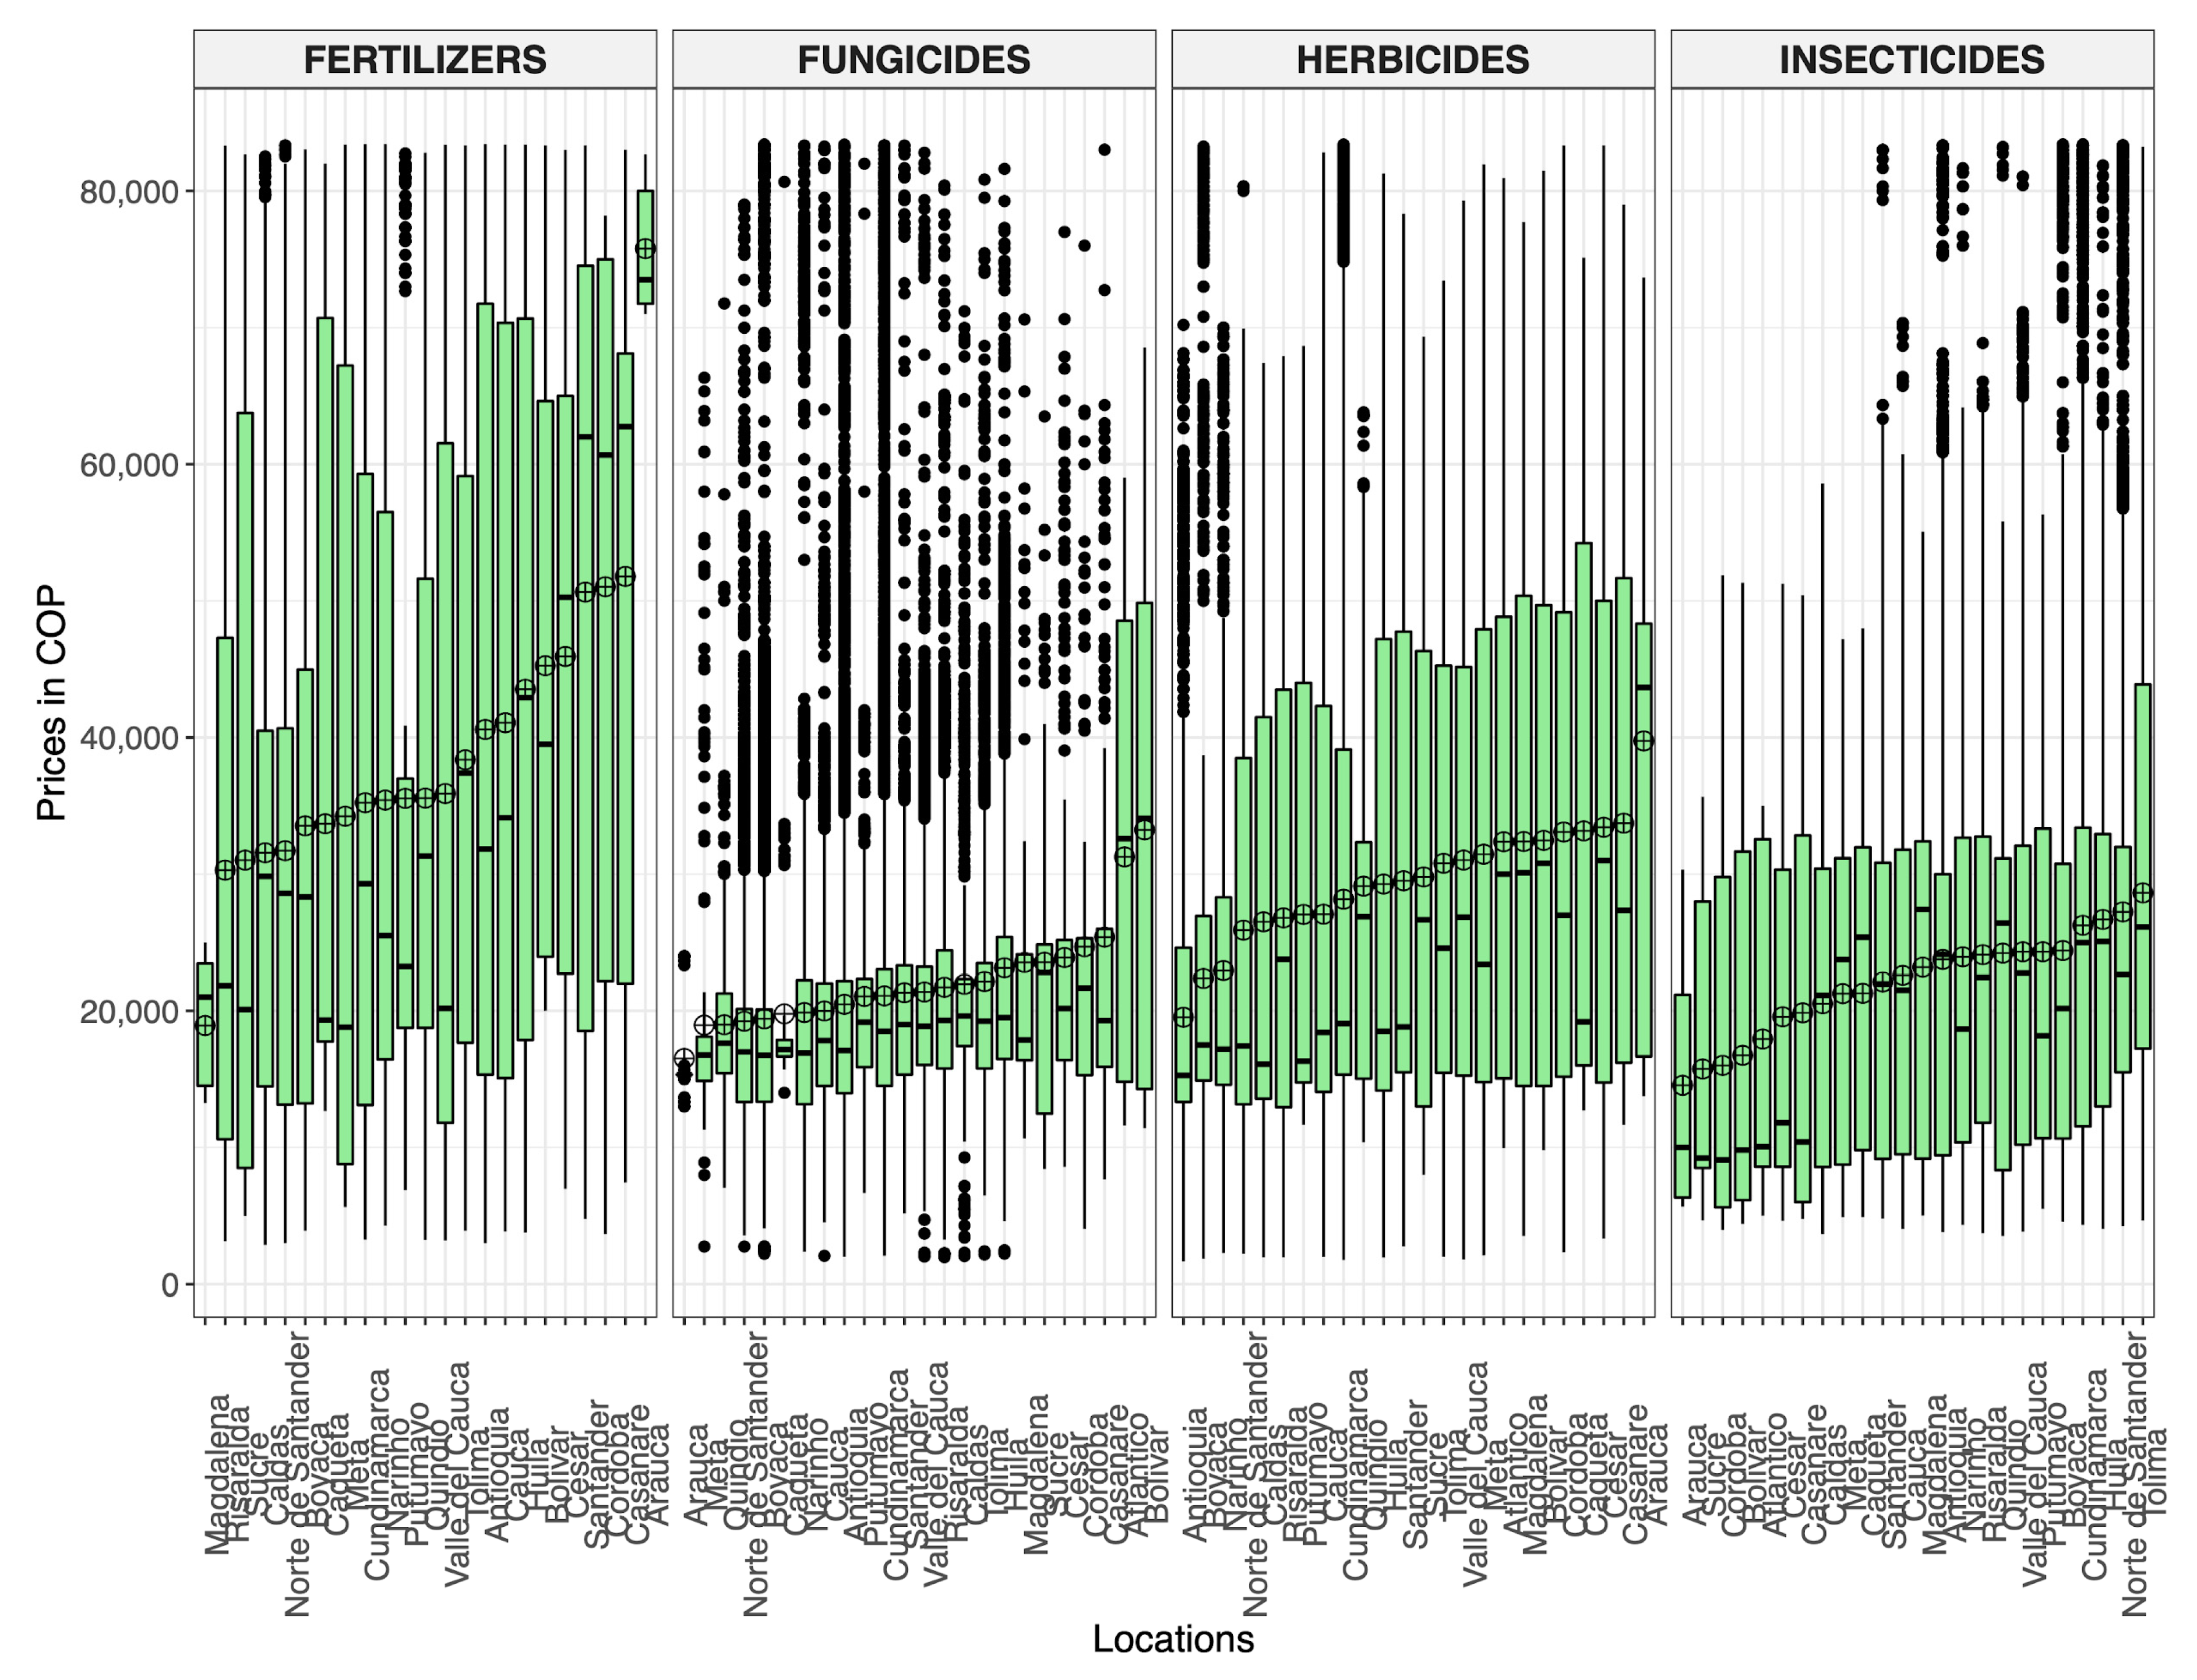
Figure 5). Agri-inputs prices in Colombia have large variability and several outliers in the evaluated locations. The highest prices were especially observed for biocide products. Arauca is the location with the largest mean for fertilizers and herbicides, while for fungicides and insecticides were low. Locations such as Antioquia, Valle del Cauca and Cundinamarca showed middle values for prices of all the agri-inputs (
Figure 6).
The analysis of the effect of these variables, described above, on the agricultural systems variables CAR, HAR, PRO and YIE was conducted using PCA. First, mean prices for all the agri-inputs and commodities were matched with the means for agricultural data based on the locations and years. The final data set comprised information for Antioquia, Cundinamarca, Norte de Santander, Risaralda, Santander y Valle del Cauca. After data standardization the evaluated variables were merged into independent composite variables (principal components). The analysis shows that two principal components (PC1 and PC2) accounted for 46% of total variation in agricultural data. Crop production, sowing area and harvest area (PRO, CAR and HAR) showed a higher vector loading to PC1 (0.82, 0,93, and 0,95 respectively). Variables YIE, CPR, INP, HEP and FRP showed high vector loading to PC2 (0,12, 0,37, 0,38, 0,49, and 0.90, respectively) and were more related to each other. On the other hand, the results show that most of the locations change especially along the second dimension, while Antioquia, Cundinamarca and Valle del Cauca to the first (
Figure 7). When crops were used to group along the dimension one and two, a particular trend was not observed.
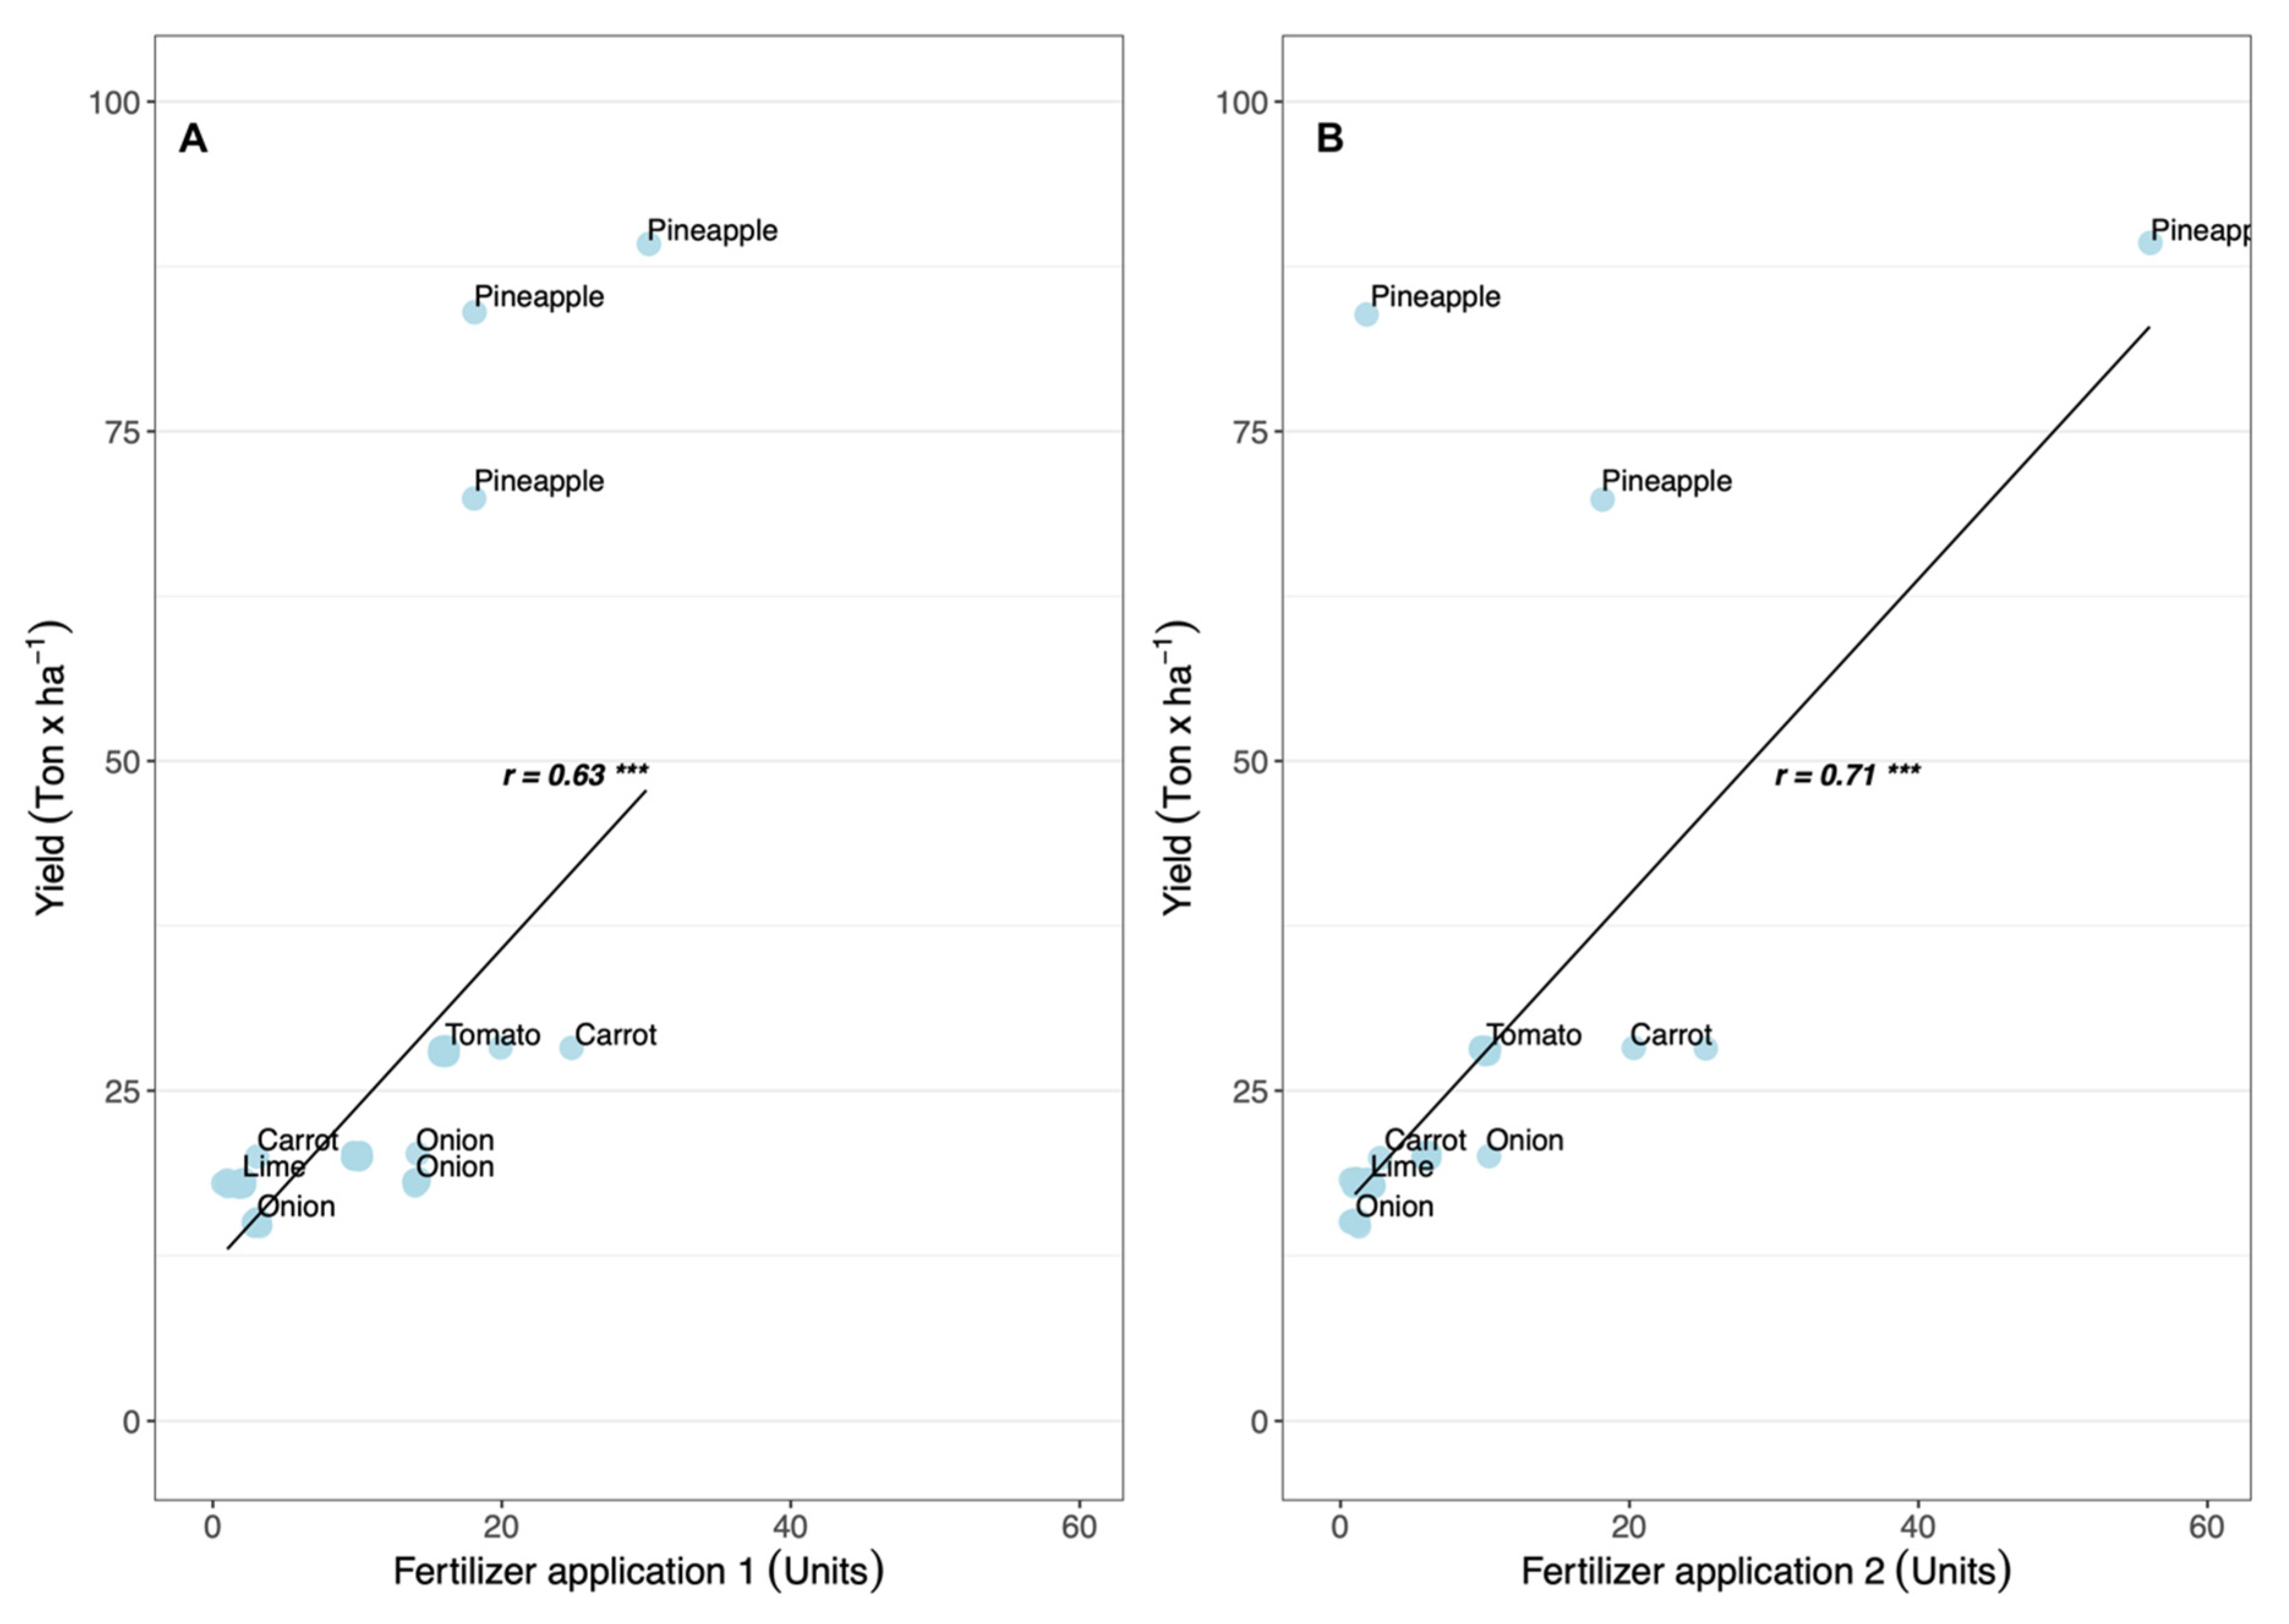
These results, the direct influence of agri-inputs application on yield increasing among locations in Colombia, were validated using a database with agricultural data for 2018. The selected crops were used for such validation, finding significant correlations of the yield with the amount of fertilizer applied before crop sowing and during cultivation (
Figure 8A,B). Highest yields were observed for pineapple during 2018 as well as the amount of fertilizer used for the cropping system. Lowest amounts of fertilizer were used on lime and onion systems before sowing and during cultivation (
Figure 8A,B).
Discussion
Usually, the selection of a species for the establishment of an agricultural system is based on its economic importance. However, the identification of national strong crops systems may be developed analyzing productivity trends and the influences of non-climatic variables. The analysis of the fruits and vegetables crops from 2006 to 2020 shows a large variation for agricultural data as a decreasing trend in the variables SAR, HAR, PRO and YIE as well (
Figure 1). The described situation is opposite to the food security approach, and it could be an issue for the country in mid and long-term. Considering that the population is growing, the changes in the diet habits and the agricultural area is limited, crop systems should be more efficient and productive (Alexander et al., 2015; Spiertz, 2013). For instance, in Colombia, the population has increased 4.2% while the agricultural land 1.6% (Roser et al., 2013) in recent years, escalating the pressure on the national food system. On the other hand, crop productivity and yield may be reduced by changes in the rural population in the country. It was observed that agricultural activity in Colombia is mainly done by adults between 41 and 64 years old, due to the migration of youths and young adults to urban areas who look for better academic and working options (DANE, 2018). This situation is decreasing the agricultural activity in Colombia, especially fruit and vegetables crops. When yield for crops like tomato and orange is compared to the yield in other countries such as Brazil and Chile, it is observed that Colombia had lower values in 2018, however for lettuce and banana the same variable is higher (Roser et al., 2013). Then, a specific analysis for each crop system was conducted, which allowed a comprehensive understanding of the national stability of fruits and vegetables production. The data analysis shows that vegetables systems are more efficient than fruit systems, reaching higher harvest in less sowing area.
The fruit crops cultivated in the locations Arauca, Meta, Casanare, Guaviare and Risaralda had the highest yields, while for vegetables this situation was observed in Risaralda, Norte de Santander, Cundinamarca, Narino and Antioquia (
Figure 2). On the other hand, the strongest crop systems, based on the mean of the yield observed for 15 years, were carrots, cauliflower, cabbage, papaya, strawberry and grapefruit (
Figure 3). This calculation, developed using yield data, may reflect the impact of non-climatic data and agricultural practices. For instance, in Risaralda, where high yield was observed for fruits and vegetables, also the prices of fertilizers were low. A similar situation occurred in Arauca as well, where yield for vegetables was high and the prices of fungicides and insecticides were low (
Figure 6). Agricultural systems such as papaya and tomato had high yield but the commercialization prices were low in the last years (
Figure 5). The described situation displays the issues for analyzing the impact of non-climatic variables on crop productivity, which interferes in the identification of stable crop systems for the country’s development. Then, a comprehensive description of fruit and vegetable crops was achieved with further analysis, where agricultural data and non-climatic variables were combined.
The mixed regression model and the PCA results indicate that cultivated regions determine productivity regardless of crop species and year (
Table 1) for fruit and vegetable systems. The low variance displayed by time indicates stability on crops productivity, even the yields were low. Differences in agricultural practices among Colombia regions may explain such variability in yield, affecting national productivity. Cabas et al. (2010), found that non-climatic factors like the amount of applied agri-inputs increases the mean of the yield for maize, soybean and wheat. Otherwise, crops with the largest sowing area showed low productivity due to the use of marginal land that reduces crop yield (Cabas et al. 2010; Kuang et al., 2022). A similar situation was observed in the present study with fruit and vegetable crops in Colombia in the year 2018, when the amount of fertilizer used increased yield on more stable cropping systems (
Figure 6). With the PCA, it was found that SAR, HAR and PRO are related to each other positively and when one increases the others as well. However, YIE is more related with non-climatic variables, indicating that at higher prices of fertilizers and insecticides, yield is largest at the different locations. This situation is observed for the commodity prices and the efficiency of the agricultural system as well (
Figure 5). Although PRO improves by increasing SAR and HAR, YIE is reduced, which may indicate agricultural management issues. This result has been previously observed in other investigations, especially when cereal crops are analyzed (Omara et al., 2019). Usually, small-farmers agricultural management rely on increasing fertilizers use, however researches have shown that despite the increased use of inputs, low productivity is observed due to poor soil quality and erratic rainfalls (Jagustovic et al., 2021). In the present study crops like carrot, cabbage, tomato papaya, pineapple and passion fruit had the highest yields and low variability caused by the sowing year, this value increases especially by the regions where they are cultivated instead (
Figure 4,
Table 1). Therefore, a comprehensive understanding of such cropping systems may lead to developing a reliable strategy to increase national agricultural and food production.
Previous studies have determined that non-climatic factors such as poverty are related with environmental factors like soil erosion, decreasing yield of coffee, forages and sugarcane in Colombia rural areas (Agudelo et al., 2003). On the other hand, in blackberry agricultural systems, it has been observed that the productivity increases when appropriate management practices are applied, even at similar climatic conditions (Jiménez et al., 2009). Also, agricultural management variables like planting and harvesting dates and cultivar choice may reduce yield losses (Deryng et al., 2011). Based on the results of the present research, Colombia national authorities may develop management strategies that strengthen the fruits and vegetables agricultural systems, following the practices applied on regions with highest yields. For instance, since there is a relationship between the price of the fertilizers and the crop yield (
Figure 5), it is crucial to apply a plant nutrition handling addressed by crop requirements, optimizing the money investment and reducing soil erosion (Chen et al., 2011). Furthermore, it is possible to understand the adaptation of these crops and the agricultural practices to the issues caused by climate change (Reidsma et al., 2007), improving the development of the agricultural sector. It is important for Colombia authorities and researchers to identify agricultural solutions that may address low productivity in fruits and vegetables crops. Improving fruit and vegetable yields will increase food security that depends on the sustainable use and management of resources (Grote et al., 2021). Improving fruit and vegetable cropping systems might be a good strategy to meet food needs of rising populations and diet shifts (Tilman et al., 2011). Furthermore, understanding local agricultural practices that may enhance fruit and vegetable quality might help to combat “hidden hunger” (Leisner, 2020).
In order to select those agricultural systems to be prioritized and promoted by national authorities, factors like agri-inputs prices and commodity prices should be considered. Government organizations like the Ministry of Agriculture and Rural Development, should keep monitoring and evaluating crop productivity in Colombia. However, social, economic and cultural parameters should be assessed as well, for improving predictive models, increasing food security and promoting the sustainable development goals. Future strategies, designed based on the understanding of resilient cropping systems that may lead to increase crop yields, farm income and input-use efficiency, should be transferred and adopted by small holders, which is very low in farms from developing countries (Aggarwal et al., 2018). On the other hand, national authorities should promote a greater crop diversity to reach a year-to-year stability of the national yield (Renard and Tilman, 2019). Both, worldwide and Colombian authorities should minimize the agricultural yield gap and the environmental impact, adapting and building resilient systems to climate change risks (Jagustovic et al., 2021).
Author Contributions
Conceptualization: Parra-Londono, S. Data curation: Parra-Londono, S.; Tigreros, J.A.; Montoya-Correa, C.A. Formal analysis: Parra-Londono, S.; Tigreros, J.A.; Montoya-Correa, C.A. Methodology: Parra-Londono, S.; Tigreros, J.A.; Montoya-Correa, C.A. Writing-original draft: Parra-Londono, S.; Tigreros, J.A.; Montoya-Correa, C.A. Writing-review & editing: Parra-Londono, S.; Tigreros, J.A.; Montoya-Correa, C.A.
References
- Aggarwal PK, Jarvis A, Campbell BM, Zougmore RB, Khatri-Chhetri A, Vermeulen SJ; et al. 2018. The climate-smart village approach: Framework of an integrative strategy for scaling up adaptation options in agriculture. Ecology and society. [CrossRef]
- Agudelo C, Rivera B, Tapasco J, Estrada R. 2003. Designing policies to reduce rural poverty and environmental degradation in a hillside zone of the Colombian Andes. World Development, 31(11): 1921–1931. [CrossRef]
- Alexander P, Rounsevell MDA, Dislich C, Dodson JR, Engstrom K, Moran D. 2015. Drivers for global agricultural land use change: The nexus of diet, population, yield and bioenergy. Global Environmental Change 35: 138 - 147. [CrossRef]
- Bates D, Mächler M, Bolker B, Walker S. 2015. Fitting Linear Mixed-Effects Models Using lme4. Journal of Statistical Software, 67(1), 1–48. [CrossRef]
- Cabas J, Weersink A, Olale E. 2010. Crop yield response to economic, site and climatic variables. Climate Change, 101: 599-616. [CrossRef]
- Calderini DF, Slafer GA. 1998. Changes in yield and yield stability in wheat during the 20th century. Field Crop Research, 57: 335 - 347. [CrossRef]
- Chen XP, Cui ZL, Vitousek PM, Cassman KG, Matson PA, Bai JS; et al. 2011. Integrated soil-crop system management for food security. PNAS, 108(16): 6399–6404. [CrossRef]
- Cui Z, Zhang H, Chen X, Zhang C, Ma W, Huang C; et al. 2018. Pursuing sustainable productivity with millions of smallholder farmers. Nature, 555 (7696): 363–366. [CrossRef]
- DANE – Statistic National Department - National Census of Population and Living Place = Departamento administrativo nacional de estadística. 2018. Censo nacional de población y vivienda. (In Spanish) Available at: https://www.dane.gov.co/index.php/estadisticas-por-tema/demografia-y-poblacion/censo-nacional-de-poblacion-y-vivenda-2018 [Accesed Jan 20, 2023].
- Deryng D, Sacks WJ, Barford CC, Ramankutty N. 2011. Simulating the effects of climate and agricultural management practices on global crop yield. Global Biogeochemical Cycles, 25, GB2006. [CrossRef]
- Dumortier J, Carriquiry M, Elobeid A. 2020. Impact of climate change on the global agricultural market under different shared socioeconomic pathways. Agricultural economics. [CrossRef]
- Elavarasan D, Vincent DR, Sharma V, Zomaya AY, Srinivasan K. 2018. Forecasting yield by integrating agrarian factors and machine learning models: A survey. Computers and electronics in agriculture, 155: 257-282. [CrossRef]
- Grote U, Fasse A, Nguyen TT, Erenstein O. 2021. Food security and the dynamics of wheat and maize value chains in Africa and Asia. Frontiers in sustainable food systems. [CrossRef]
- Gurgel AC, Reilly J, Blanc E. 2021. Challenges in simulating economic effects of climate change on global agricultural markets. Climate change, 166: 29. [CrossRef]
- Jagustovic R, Papachristos G, Zougmore RB. 2021. Better before worse trajectories in food systems? An investigation of synergies and trade-offs through climate-smart agriculture and system dynamics. Agricultural systems. [CrossRef]
- Jiménez D, Cock J, Satizabal HF, Barreto MA, Pérez-Uribe A, Jarvis A, van Damme P. 2009. Analysis of andean blackberry (Rubus glaucus) production models obtained by means of artificial neural networks exploiting information collected by small-scale growers in Colombia and publicly available meteorological data. Computers and electronics in agriculture, 69(2): 198-208. [CrossRef]
- Juhos K, Szabó S, Ladányi M. 2015. Influence of soil properties on crop yield: A multivariate statistical approach. International Agrophysics 29: 433-440. [CrossRef]
- Kamble SS, Gunasekaran A, Gawankar SA. 2020. Achieving sustainable performance in a data-driven agriculture supply chain: A review for research and applications. International journal of Production Economics, 219: 179-194. [CrossRef]
- Khaki S, Wang L. 2019. Crop yield prediction using deep neural networks. Frontiers in Plant Science. [CrossRef]
- Konduri VS, Vandal TJ, Ganguly S, Ganguly AR. 2020. Data science for weather impacts on crop yield. Frontiers in sustainable food systems. [CrossRef]
- Kuang W, Liu J, Tian H, Shi H, Dong J, Song C; et al. 2022. Cropland redistribution to marginal lands undermines environmental sustainability. National Science review. [CrossRef]
- Lê S, Josse J, Husson F. 2008. FactoMineR: An R Package for Multivariate Analysis. Journal of Statistical Software. 25(1). pp. 1-18. [CrossRef]
- Leisner CP. 2020. Review: Climate change impacts on food security-focus on perennial cropping systems and nutritional value. Plant science. [CrossRef]
- Majumdar J, Naraseeyappa S, Ankalaki S. 2017. Analysis of agriculture data using data mining techniques: Application of big data. Journal of Big Data. [CrossRef]
- Meuwissen MPM, Feindt PH, Spiegel A, Termeer CJAM, Mathijs E, de Mey Y; et al. 2019. A framework to assess the resilience of farming systems. Agricultural systems. [CrossRef]
- Omara P, Aula L, Oyebi F, Raun WR. 2019. World cereal nitrogen use efficiency trends: Review and current knowledge. Agrosystem, Geoscience and Environment. [CrossRef]
- Piepho HP. 1998. Methods for comparing the yield stability of cropping systems - A review. Journal of Agrnomy & Crop Science, 180: 193 - 213. [CrossRef]
- Reidsma P, Ewert F, Oude-Lansink A. 2007. Analysis of farm performance in Europe under different climatic and management conditions to improve understanding of adaptive capacity. Climate Change 84:403–422. [CrossRef]
- Renard D, Tilman D. 2019. National food production stabilized by crop diversity. Nature. [CrossRef]
- R Core Team. 2016. R: A language and environment for statistical computing. R Foundation for Statistical Computing, Vienna, Austria. URL http://www.R-project.org/.
- Roser M, Ritchie H, Ortiz-Ospina E. 2013. - “World Population Growth”. Published online at OurWorldInData.org. Available at: https://ourworldindata.org/world-population-growth [Accesed Jan 20, 2023].
- Spiertz H. 2013. Challenges for crop production research in improving land use, productivity, and sustainability. Sustainability 5: 1632-1644. [CrossRef]
- van Klompenburg T, Kassahun A, Catal C. 2020. Crop yield prediction using machine learning: A systematic literature review. Computers and electronics in agriculture. [CrossRef]
- Tester M, Langridge P. 2010. Breeding Technologies to Increase Crop Production in a Changing World. Science, 327(5967), 818–822. [CrossRef]
- Tilman D, Balzer C, Hill J, Befort BL. 2011. Global food demand and the sustainable intensification of agriculture. PNAS. [CrossRef]
|
Disclaimer/Publisher’s Note: The statements, opinions and data contained in all publications are solely those of the individual author(s) and contributor(s) and not of MDPI and/or the editor(s). MDPI and/or the editor(s) disclaim responsibility for any injury to people or property resulting from any ideas, methods, instructions or products referred to in the content. |
© 2023 by the authors. Licensee MDPI, Basel, Switzerland. This article is an open access article distributed under the terms and conditions of the Creative Commons Attribution (CC BY) license (http://creativecommons.org/licenses/by/4.0/).
