Preprint
Article

Seaweed Polysaccharides as A Potential Biostimulant in Turnip Greens Production

Altmetrics

Downloads

280

Views

154

Comments

0

A peer-reviewed article of this preprint also exists.

Submitted:

29 November 2023

Posted:

30 November 2023

You are already at the latest version

Alerts
Abstract
Seaweed polysaccharides can substitute synthetic compounds present in commercial stimulants and fertilizers, used in agriculture to improve crops yield and vigor. In this study, three different poly-saccharides (alginate, agar and carrageenan) were extracted from one brown seaweed, Saccorhiza polyschides, and two red seaweeds, Gracilaria gracilis and Chondrus crispus, respectively, and applied on potted turnip greens (Brassica napus L.), with intention to analyze their impact on plant growth, development and metabolism. Turnip plants treated with polysaccharides, specially, carrageenan of Chondrus crispus showed the best results in improving the crop’s productivity, such as plant length and weight, number of leaves, nutrient and pigment content, and soil fertility, compared with turnip plants from the negative control or treated with a commercial leaf fertilizer. λ-carrageenan extracted from the tetrasporophyte generation of Chondrus crispus had the highest bioactivity and positive effect in turnip plants among all treatments. λ-carrageenan has shown that can improve plant growth, increase plant’s biomass, and root system, enhance photosynthetic activity, increase the uptake of soil nutrients, and protect plants against abiotic and biotic stresses, stimulating the production of secondary metabolites and manage its defense pathways. Seaweed extracted polysaccharides have the potential to be used in sustainable agriculture.
Keywords: 
Subject: Biology and Life Sciences  -   Agricultural Science and Agronomy

1. Introduction

When compared to commercial fertilizers, seaweed-based extracts have drawn a lot of interest in agriculture by stimulating the quality and production of different plant crops [1,2,3,4,5,6,7,8]. Currently, there are a few seaweed-based fertilizers available in the market [9]. These extracts are considered biostimulants (seaweed extracts with biostimulant properties) containing bioactive components that regulate phytohormone imbalance, promote soil water retention, reduce nutrient deficiencies both in the soil and the plant, and increase soil microbiota [10]. Seaweed extracts can also induce responses in plants to pathogens by activating their defensive mechanisms [11]. These extracts can enhance seed germination [12], crop production [13], plant vigor [13], soil nutrient absorption [14], fruit shelf life [13], and plant resistance to a variety of abiotic and biotic challenges [10,15].
Polysaccharides, polyphenols, phytohormones, minerals, and other inorganic and organic bioactive compounds found in seaweed extracts [11], may vary based on the seaweed class, species, and extraction technique. Polysaccharides, such as alginate, agar, and carrageenan, which are compounds mainly present in the seaweed biomass, are believed to have impact on the plant development similarly as hormones do [16,17]. Thus, they can be considered as adequate substitution of the synthetic substances present in the commercial plant fertilizers used in European Union.
Alginate is a polysaccharide present in brown seaweeds, such as Saccorhiza polyschides, in the form of alginic acid. Agar and carrageenan are two polysaccharides, industrially very important for their gelling, thickening, and stabilizing properties, extracted from the red seaweeds genus Gracilaria or Gelidium and Gigartinales order, respectively, from the phylum Rhodophyta.
Turnip (Brassica napus L.) is a crop with recognized economic importance, mostly cultivated in temperate regions (Europe, Australia, Canada, and northern China) [18]. This plant is widely cultivated as an oil and vegetable crop across the world because it produces edible roots, leaves, stems, buds, flowers, and seeds [19]. It is a member of the genus Brassica and the family Brassicaceae, one of the most significant vegetable family in agriculture [20]. Oil, food, fiber, minerals, vitamins, soluble sugars, phytochemicals including carotenoids, glucosinolates, and phenolic compounds are among the natural substances present in the genus Brassica. It is considered that phenolic compounds protect humans against several diseases, including cancer and cardiovascular related [21]. Turnip is a fast-growing root vegetable that can be cultivated almost all year long, depending on its use. In the Portuguese diet two parts of this plant are commonly used, its leaves (turnip greens, common name “nabiça”) and root (popularly known as “nabo”). Additionally, this crop doesn't require a large space to grow. In this study turnip greens were used.
This study aims to understand how polysaccharide solutions based on alginate, from Saccorhiza polyschides, agar, from Gracilaria gracilis, and three types of carrageenan, from Chondrus crispus, can influence the growth, development, and metabolism of Brassica napus plants.

2. Materials and Methods

2.1. Harvesting and Preparation of Seaweed Biomass for Extraction

On the 14th of June 2022 (average air temperature around 24 °C), one brown seaweed, Saccorhiza polyschides, and two red seaweeds, Gracilaria gracilis and Chondrus crispus, were collected from tide pools in the intertidal zones of Buarcos Bay, Figueira da Foz (seawater temperature at a maximum of 27 °C and a minimum of 16 °C).
The seaweed species were selected and identified according to their morphological characteristics with taxonomic references [22].
S. polyschides (Phaeophyceae) (Figure 1a) is an annual opportunistic false kelp with a large and flat stipe and characteristic marginal undulated wings near the base. Typically, members of this species may reach lengths of 3–4 m. It lives on stony reefs in the ocean's subtidal zone and low intertidal. Although it can't compete with the main species in the area, such Laminaria ochroleuca and Saccharina latissima (Phaeophyceae), this opportunistic seaweed colonizes any open spaces in the sea forest, making it a seaweed of enormous economic significance [23]. Portugal, Spain, France, the United Kingdom, and Ireland make up the majority of its distribution. Even though it is an annual seaweed, its biomass is at its highest in the spring and summer [22,24].
The red seaweed Gracilaria gracilis (Figure 1b) is frequently used to extract agar all over the world. It may be found worldwide and lives in temperate waters between 0 and 20 m deep. The environment, such as water temperature, salinity, dissolved nutrients and other abiotic stresses, affects the variety in the life cycle, growth, and agar content of this seaweed [25]. The natural populations of this seaweed have been dwindling because to the strong demand for its biomass for agar extraction. Seaweed farms are being created to save an extinction and to safeguard this important natural resource. This seaweed reproduces readily and has a rapid rate of growth [25]. Global cultivation output for the genus Gracilaria in 2019 exceeded 3.5 million tonnes (fresh weight), primarily in Asian nations [26].
Chondrus crispus is a red seaweed commonly known as Irish moss. It grows in tufts from a discoid holdfast and has a compressed, thin stipe that progressively widens to a flat, repeatedly dichotomously branching frond [22]. These seaweeds can reach a maximum length of 15 cm, and some of them are iridescent underwater. It is mostly found in Portugal's west coast, in the Faroe Islands, in West Africa, in Spain, in Canada, and in the United States, as well as in the Bering Sea from Russia to Alaska [22]. This seaweed species alternates between two isomorphic life generations that differ in cell wall phycocolloid composition: tetrasporophyte (Figure 1c) and two gametophytes, non-fructified thalli (Figure 1d) and female gametophyte (Figure 1e) [27]. The carrageenan type extracted from C. crispus’ tetrasporophyte is λ-carrageenan and the carrageenan type extracted from C. crispus’ non-fructified thalli and female gametophyte is a hybrid κ- and ι-carrageenan [28]. Visually, the presence of reproductive structures can differentiate the three generations: tetrasporophytes (presence of tetrasporangia), female gametophytes (presence of cystocarps) and non-fructified thalli (no reproductive structures visible, usually with blue iridescence) [29].
All seaweeds were collected with minimal epiphytes or degraded marks and transported in plastic bags in a cool box to the laboratory. Afterwards, all the seaweeds were transferred to separate trays and washed with seawater to remove sand, epiphytes, and other detritus from its biomass. Then, transferred again to another separate trays and washed two times with distilled water to remove the salt content of seawater. Afterwards seaweeds were dried in an air-forced oven (Raypa DAF-135, R. Espinar S.L., Barcelona, Spain) at 60 °C for 48 h. Dried seaweeds were stored in separate silica bags to reduce moisture, in the dark and at room temperature (23 °C).

2.2. Polysaccharide Extraction

Each type of polysaccharide (alginate, agar and carrageenan) was extracted according to the methods mentioned in Sections 2.2.12.2.3, respectively, and were performed in triplicate. The polysaccharide extraction yield (Y, %) was calculated according to the formula [30]:
Y % = W 1 W 2 × 100
Where, 𝑊1 is the weight of the dried polysaccharide (g) and 𝑊2 is the initial weight of the dried seaweed used in the extraction (g).

2.2.1. Alginate

The alginic acid extraction was based on the method described by [31] with modifications. The dried seaweed (S. polyschides, 7 g) (analytical scale: Highland HCB 123, Adam Equipment, UK) was milled (particles <1 cm) with a commercial grinder (TitanMill 300 DuoClean, Cecotec, Valencia, Spain) and then added to a solution of hydrochloric acid (José Manuel Gomes dos Santos, Portugal) at 1.23% (1:30 v:v) (7 mL of hydrochloric acid: 203 mL of distilled water per 7 g of dried seaweed) and kept at room temperature (23 °C) for 24 h. The solution was filtrated, under vacuum (Laborport N820, Lisbon, Portugal), with a Gooch funnel (porosity: G2) and washed with distilled water for 2 or 3 times. The residue obtained was alkali extracted in a 2% sodium carbonate (Fisher Chemicals, Portugal) (90 mL for the initial weight of the dried biomass; 1:30 m:v) and put in the ultrasound machine (ultrasonic cleaner ULTR-3L2-001, IBX instruments, Barcelona, Spain) at 50 °C for 45 min. The extract was filtrated again, under vacuum, through a cloth filter, with a Gooch funnel (porosity: G2), to remove the residues from the alginate solution. Then a 37% hydrochloric acid (José Manuel Gomes dos Santos, Portugal) was added to the filtrate for precipitation of the alginic acid (2 mL of 37% of hydrochloric acid: 30 ml of the final solution). The alginate was washed with ethanol 96% (José Manuel Gomes dos Santos, Portugal) (1:3 v:v) and placed in the cold. The liquid solution was discarded, and the precipitate was dried in an air-force oven (Raypa DAF-135, R. Espinar S.L., Barcelona, Spain) at 60 °C for 48 h.

2.2.2. Agar

Agar extraction was based on the method described by [32] with modifications. The dried seaweed (G. gracilis, 15 g) (analytical scale: Highland HCB 123, Adam Equipment, UK) was added to distilled water (600 mL) and placed in an electric pressure cooker (300008IAU, Aigostar, Madrid, Spain) at a temperature of 115 °C with an air pressure of 80 Kpa, for 2 h. The solution obtained was hot filtrated, under vacuum (Laborport N820, Lisbon, Portugal), through a cloth filter supported in a Buchner funnel. The liquid extract obtained was filtrated again, under vacuum, with a Gooch funnel (porosity: G2). The filtrated solution was solidified at room temperature (23 °C) and frozen overnight, in a plastic cup. The next day, the agar was unsolidified, washed and purified until it became a white or translucid gel. That gel was dried in an air-forced oven (Raypa DAF-135, R. Espinar S.L., Barcelona, Spain) at 60 °C for 48 h.

2.2.3. Carrageenan

Carrageenan extraction was based on the method described by [33] with modifications. The dried seaweed (C. crispus, 1 g) (analytical scale: Highland HCB 123, Adam Equipment, UK) was milled (particles <1 cm) with a commercial grinder (TitanMill 300 DuoClean, Cecotec, Valencia, Spain) and then pre-treated with an acetone (José Manuel Gomes dos Santos, Portugal):methanol (José Manuel Gomes dos Santos, Portugal) (1:1) solution in a final concentration of 1% (m/v) (final volume: 100 mL; 50 mL acetone: 50 mL methanol) for 16 h at 4 °C, to eliminate the organic-soluble fraction. The liquid solution obtained was discarded, and the seaweed residues were dried in an air-forced oven (Raypa DAF-135, R. Espinar S.L., Barcelona, Spain) at 60 ºC for about 3-5 min. The dried seaweed was immersed in 150 mL of sodium hydroxide (Applichem Panreac, USA) (2%) (1 g of initial seaweed: 150 mL of sodium hydroxide solution) in a hot water bath system (GFL 1003, GFL, Burgwedel, Germany) at 85-90 ºC for 3 h. Afterwards, the solution was hot filtrated, under vacuum (Laborport N820, Lisbon, Portugal), through a cloth filter supported in a Buchner funnel. The liquid extract obtained was filtrated again, under vacuum, with a Gooch funnel (porosity: G2). The filtrated solution was evaporated (rotary evaporator: 2600000, Witeg, Germany), under vacuum, to 1/3 of the initial volume. The carrageenan was precipitated by adding twice (1:3) its volume of ethanol 96% and then centrifuged (Christ Universal Junior II, Martin Christ, Osterode/Harz, Germany) for 10 min at 4000 rpm. The precipitate was washed again with ethanol 96% (José Manuel Gomes dos Santos, Portugal) and placed in the cold (4 °C for 48 h). Finally, the extract was dried in an air-forced oven (Raypa DAF-135, R. Espinar S.L., Barcelona, Spain) at 60 °C for 48 h.
Due to carrageenan type variation, this method was performed for each sample corresponding to the different life cycle generations (tetrasporophyte, non-fructified thalli and female gametophyte).

2.3. Physico-Chemical Characterization of Polysaccharides’ Solutions

The dried polysaccharides were milled (particles <0.05 cm), separately, with a commercial grinder (TitanMill 300 DuoClean, Cecotec, Valencia, Spain) and then added distilled water (1 mg/mL), under constant agitation (magnetic stirrer hot plate: H20 series, IBX instruments, Barcelona, Spain) until the complete dissolution of the polysaccharides. Afterwards, each polysaccharide solution was diluted into solutions with different concentrations, 0.5 mg/mL and 0.25 mg/mL, as described in Table 1. The pH (pH meter: 3310 Jenway, Staffordshire, UK), the electric conductivity (portable conductivity meter: ProfiLine Cond 3310 WTW, Oberbayern, Germany) and the viscosity (DV-E model viscometer, Brookfield, Hadamar-Steinbach, Germany) were determined for each polysaccharide solution, at room temperature (23 °C). The viscosity measurement was carried out using a spindle S02 with a speed of 100 rpm.

2.4. Experimental Conditions

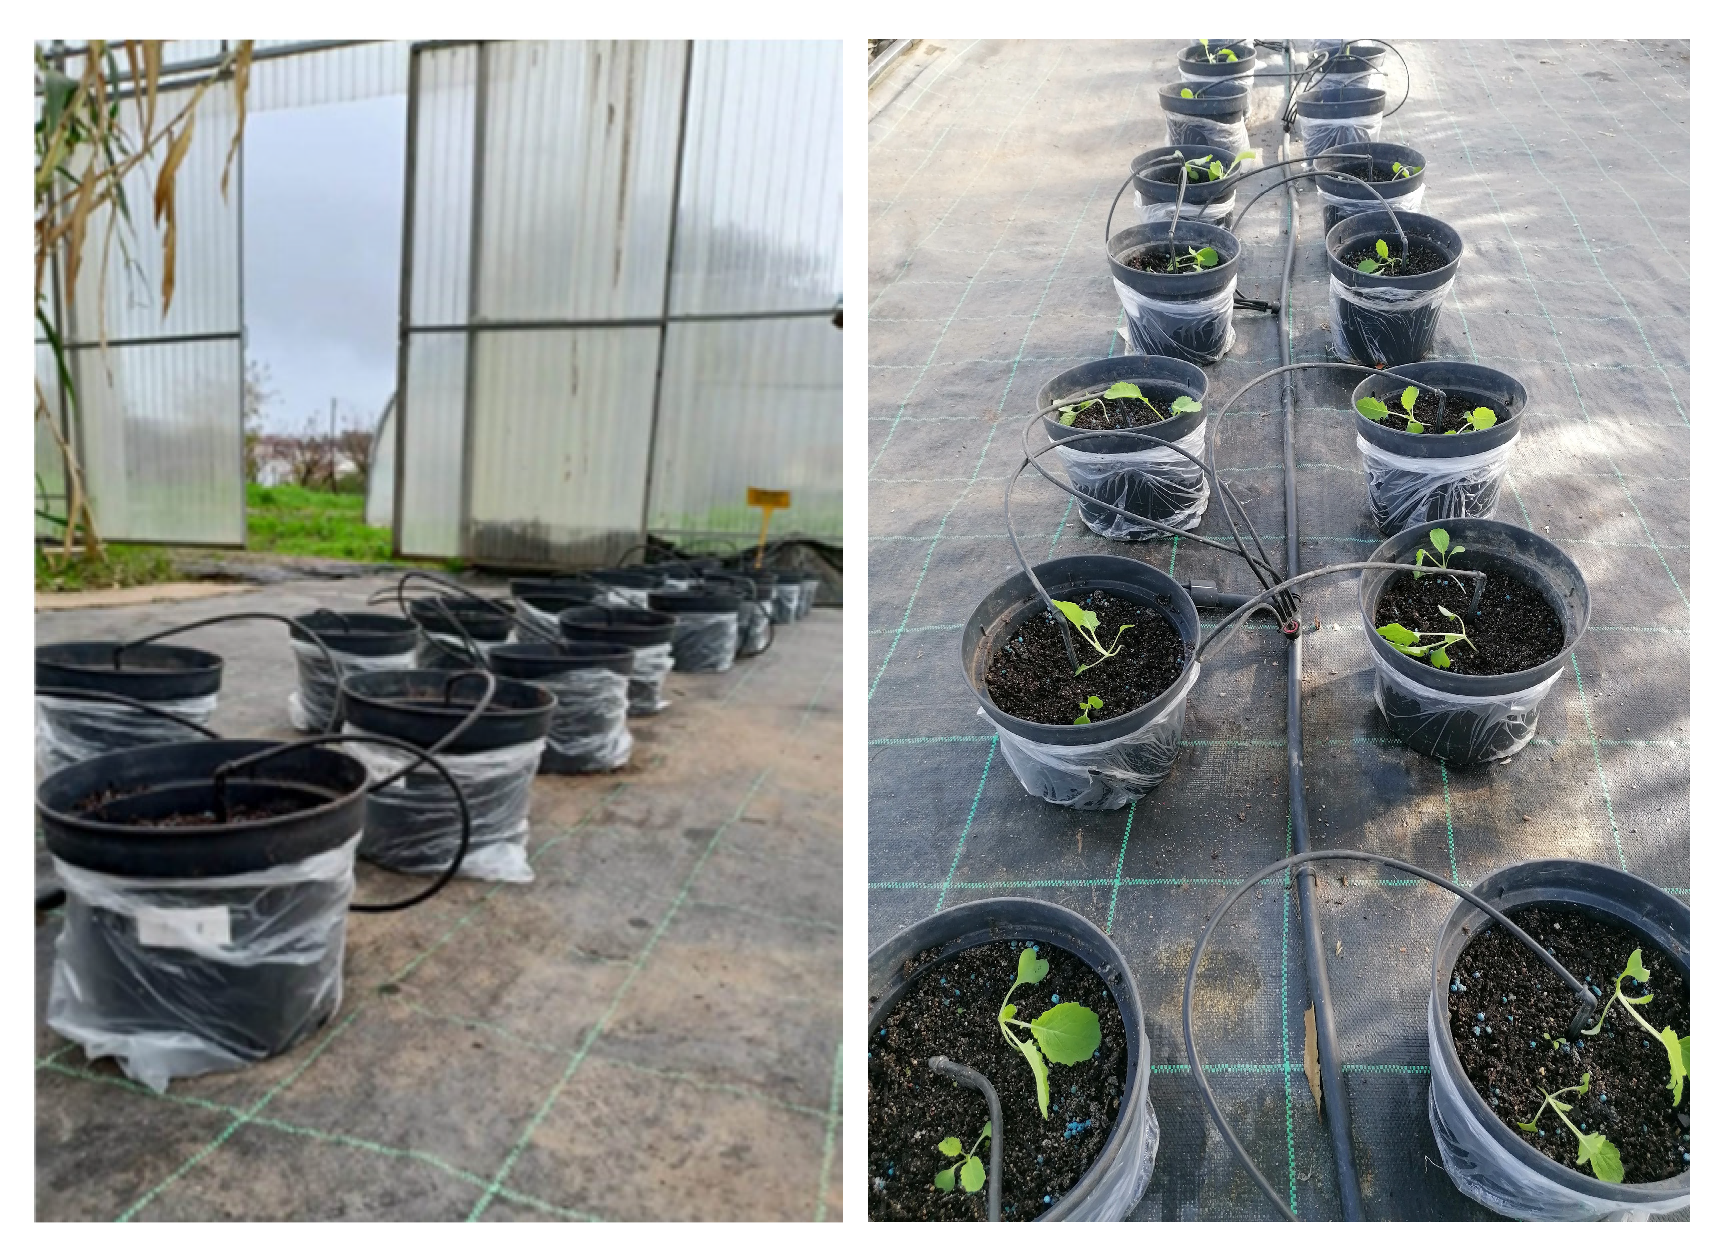
The assay was performed in 5 L black pots (with a diameter of 23 cm at the top, a diameter of 16 cm at the base and 18 cm height), in conditioned substrate (SIRO, Coimbra, Portugal) under greenhouse conditions and with natural photoperiod, at ESAC (Escola Superior Agrária de Coimbra, Portugal). 19 pots were organized in a randomized block design, with 2 turnip seeds (Flora Lusitana, Cantanhede, Portugal) sown in each pot and a plastic bag underneath to prevent water leakage (Figure 2). The substrate in all pots was fertilized with Blaukorn Classic (Blaukorn Classic 12-8-16 (+3+TE), Compo-expert, Portugal) and drip irrigation was used, during 6 min (± 250 mL per pot), 3 times per week.
The treatments, and their concentrations, applied in this experiment (Table 1) include different polysaccharides-based solutions obtained after the extraction of alginate (from S. polyschides), agar (from G. gracilis) and carrageenan (from three different life cycle generations of Chondrus crispus, tetrasporophyte, non-fructified thalli and female gametophyte), described in [34]. As a positive control, a commercially leaf biofertilizer, “Profertil” (ADP Fertilizantes, Portugal) was used, with 20% (dry matter) based on seaweed Ascophyllum nodosum, at a concentration of 1.5% (v/v), while as a negative control, tap water was used. All the polysaccharides-based solutions and the positive control were applied as spray on to the foliage (± 3 mL of extract sprayed on each plant; 18 mL per treatment in each application). Each treatment was applied to 6 plants (3 pots with 2 plants each) in 3 repetitions. This assay lasted 63 days (from sowing to plant harvesting) and the treatments were applied two times. The first treatment application was done 31 days after the sowing (DAS), when the plants had 3 to 4 real leaves. The second application was done 10 days after the first application.

2.5. Growth Parameters of the Obtained Plant Material

The evolution of the plant growth was observed throughout the experiment. Sixty-three days after the sowing, plant material was harvested, washed with tap water, and separated their roots and leaves and evaluated. The length and fresh weight (FW) of the roots and aerial parts of each sample were measured by using a ruler (Shatterless 75 S.50, Molin, Portugal) and an analytical scale (PC2000 Mettler-Toledo, Zurich, Switzerland), respectively. The number of leaves in each plant sample was counted. After, plants were cut, separating the leaves from the roots, dried in an air-forced oven (Memmert, Büchenbach, Germany) during 3 days at 65 °C, until the constant weight was reached. Afterwards, each sample was cooled for about 2 h, and the dry roots and aerial parts were separately measured defining their dry weight (DW).

2.6. Turnip’ Physiological and Biochemical Characterization

All the methods described in this chapter were performed for the plant material obtained from the respective treatment, as shown in Table 1, separately, and performed in duplicate.

2.6.1. Dry Matter and Ashes Content

The dry matter and ashes content determination were based on the method described by [35]. The dried aerial part of the plant samples obtained in Section 2.5. were milled (particles <1 mm) with a commercial grinder (electric coffee grinder: KG-39, DeLonghi, Treviso, Italy) and, approximately, 3 g of each sample (analytical scale: AB 204 Mettler-Toledo, Zurich, Switzerland) were placed in crucibles and dried in an air-forced oven (UFB 500, Memmert, Büchenbach, Germany) at 105 °C for 4 h. Then, the samples were placed in a desiccator until the constant weight was reached, being again weighted (analytical scale: AB 204 Mettler-Toledo, Zurich, Switzerland), to calculate the dry matter content.
The dry matter content (DM, g 100 g-1 (%) m/m) at 65 °C was calculated according to the formula [35]:
D M   a t   65   º C ( % ) = w 1 w 2 × 100
Where, w1 is the weight of the sample dried at 65 °C (g); w2 is the weight of the fresh sample (g).
The dry matter content (DM, g 100 g-1 (%) m/m) at 105 °C was calculated according to the formula [35]:
D M   a t   105   º C ( % ) = ( m 3 m 1 ) ( m 2 m 1 ) × 100
Where, m1 is the crucible weight dried at 105 °C (g); m2 is the crucible and sample weight dried at 65 °C (g); m3 is the crucible and sample weight dried at 105 °C (g).
To assess the ashes content, the previous samples dried at 105 °C were placed in an incineration muffle (Induzir, Leiria, Portugal) at 480-500 °C overnight and further cooled in a desiccator and weighted again (analytical scale: AB 204 Mettler-Toledo, Zurich, Switzerland). The ashes content is calculated according to the formulas [35]:
A s h e s   ( % d b ) = ( m 3 m 1 ) ( m 2 m 1 ) × 100
A s h e s   ( % f b ) = A s h e s ( % d b ) × ( 100 H ) 100
Where, % db is the percentage of dried biomass; % fb is the percentage fresh biomass; m1 is the crucible weight (g); m2 is the crucible and sample weight dried at 105 ºC (g); m3 is the crucible and sample weight incinerated (g).

2.6.2. Total Nitrogen/ Protein

The total nitrogen/ protein content was determined by the Kjeldahl method [35,36]. In a Kjeldahl tube, was added approximately 0.5 g (analytical scale: AB 204 Mettler-Toledo, Zurich, Switzerland) of the previously dried matter obtained in Section 2.6.1., and then added a Kjeldahl tablet (Fisher Chemicals, Portugal) and 10 mL of sulfuric acid (Chem-Lab NV, Zedelgem, Belgium). The tubes were then placed into the Kjeldahl digester (Bloc Digest 12 Rat 2, JP Selecta, Lisbon, Portugal) at 400 °C for 2 h, under “hotte”. The samples were allowed to cool in the “hotte”, and it was added 50 mL of distilled water in each tube and put into the Kjeldahl distiller (VELP Scientifica, Usmate Velate MB, Italy). Concurrently, it was placed 20 mL of boric acid 2% (Chem-Lab NV, Zedelgem, Belgium) in an Erlenmeyer (one for each sample), being further placed into the Kjeldahl distiller as well. During the distillation process, was added to the Kjeldahl tube, 50 mL of sodium hydroxide (NaOH) at 40% (m/v) (Chem-Lab NV, Zedelgem, Belgium). The distilled solution was collected and titrated with hydrochloric acid (HCl) 0.1 M (Chem-Lab NV, Zedelgem, Belgium). Total nitrogen (N, % m/mdry) was calculated according to the formula [35]:
N % = [ H C l ] × ( V V 0 ) × 0.014 × 100 m
Where, [HCl] is the hydrochloric acid concentration (M); V is the volume of HCl spent in sample titration (mL); V0 is the volume of HCl spent in control sample titration (mL); m is the sample weight (g); 0.014 is the value (g) of N that reacts with 1ml of HCl 1 mol dm-3.
The total protein content was determined by the multiplication of the protein conversion factor, 6.25, to the total nitrogen content, as described by [37].

2.6.3. Mineral and Trace Element Characterization

The mineral content was analyzed through dry mineralization extraction method [38] and assessed by using flame atomic absorption spectrometry, for the determination of copper (Cu), zinc (Zn), manganese (Mn), iron (Fe), calcium (Ca), magnesium (Mg), potassium (K) and sodium (Na) [38], and molecular absorption spectrometry for the determination of phosphorus (P) [39]. With the ashes obtained in Section 2.6.1., it was performed an acid digestion with hydrochloric acid 20% (v/v) (Chem-Lab NV, Zedelgem, Belgium), in a water bath (Memmert, Büchenbach, Germany) at 100 °C for 30 min. Then, the samples were filtrated with a filter paper (Whatman filter paper cellulose-based ashless types, pore size: 8 µm and diameter of 150 mm, Whatman, Portugal) to a 50 mL volumetric flask, and the volume was adjusted with distilled water (mother liquor). To a 25 mL volumetric flask was added 2.5 mL of the previous solution and 2.5 mL of lanthanum chloride (5%) (Chem-Lab NV, Zedelgem, Belgium), and the volume was adjusted with distilled water (dilution: 1:10). After the necessary dilutions needed to determinate the different elements (1:100 or 1:500) the analysis was carried out on the atomic absorption spectrophotometer (PinAAcle 900T, PerkinElmer, Massachusetts, EUA) equipped with the cathode corresponding to each element. For the phosphorus analysis, was added 2.5 mL of the mother liquor and 5 mL of ammonium molybdate-vanadate solution in nitric medium (Chem-Lab NV, Zedelgem, Belgium) to a 25 mL volumetric flask and adjusted with distilled water. This solution was left overnight at room temperature (23 °C). The next day, the phosphorus analysis was carried out on the molecular absorption spectrophotometer (PYE Unicam, SP6-350, Philips, Portugal), at a wavelength of 650 nm.

2.6.4. FTIR-ATR Analysis

The Fourier-Transform Infrared Spectroscopy – Attenuated Total Reflection (FTIR-ATR) analysis was based on the protocol described by [40]. The dried plant samples obtained from the extraction process in Section 2.6.1., were milled (particles <0.05 cm) with a commercial grinder (TitanMill 300 DuoClean, Cecotec, Valencia, Spain) and subjected to direct analysis (without humidity) (spectrometer: ALPHA II Compact FT-IR Spectrometer, Bruker, Germany) without any further preparation. All spectra obtained are the average of two independent measurements from 400 to 4000 cm-1 with 24 scans, each at a resolution of 4 cm−1.

2.6.5. Leaf Pigments Content

The detection of pigments was based in the method described by [41]. This process uses thin-layer chromatography (TLC) to separate and determinate the composition of pigments in methanolic extracts and spectrophotometry for the quantitative and qualitative analysis of those pigments.

2.6.5.1. Thin-Layer Chromatography (TLC)

The dried samples obtained in Section 2.6.1. (0.2 g of total dried leaf biomass) (analytical scale: Highland HCB 123, Adam Equipment, UK) were added to 20 mL of acetone (José Manuel Gomes dos Santos, Portugal): methanol (José Manuel Gomes dos Santos, Portugal) (1:1) solution (final volume: 20 mL; 10 mL acetone: 10 mL methanol), under constant agitation (magnetic stirrer hot plate: H20 series, IBX instruments, Barcelona, Spain) for 30 min. The liquid solution was filtrated, under vacuum, with a Gooch funnel (porosity: G2), and then, evaporated (rotary evaporator: 2600000, Witeg, Germany) until all the pigments were all adhered to the surface of the round-bottom flask. The pigments were resuspended again with 2 mL of acetone (José Manuel Gomes dos Santos, Portugal): methanol (José Manuel Gomes dos Santos, Portugal) (1:1) solution, to obtain a concentrated extract. Afterwards, silica gel TLC plate (ALUGRAM Xtra SIL G UV254, Macherey-Nagel, Germany) was activated at 120 °C for 5 min (air-forced oven: Raypa DAF-135, R. Espinar S.L., Barcelona, Spain) and then 20 μL of each concentrated extract were applied. The plate was developed in a chromatography chamber using a petroleum ether (José Manuel Gomes dos Santos, Portugal): acetone (José Manuel Gomes dos Santos, Portugal) solution (7:3 v/v) as eluent, until the front reached a height of 10 cm. The plate was then removed, and the solvent evaporated at room temperature (23 °C). The pigments were identified by calculating the retention factor (Rf): Rf=compound migration distance (cm)/distance travelled by the eluent and comparing with the literature.

2.6.5.2. Spectrophotometry

The quantitative and qualitative analyses of the leaf pigments were performed by spectrophotometry. After the TLC and the necessary dilution (1:50) of the extracts, the analysis was carried out on the spectrophotometer (UV-3100PC, VWR, UK), with scanning at 665.2 nm, 652.4 nm, 535 nm and 470 nm. The following formulas were used for the quantification of the pigments (mg/ 100 g) chlorophyll a and b (Chl a and Chl b) and carotenoids [42]:
C h l   a = 16.75 × A 665.2 9.16 × A 652.4
C h l   b = 34.09 × A 652.4 15.28 × A 665.2
C a r o t e n o i d s = ( 1000 × A 470 1.63 × C h l a 104.96 × C h l b ) 221
Where, A665.2, A652.4 and A470 is the absorbance of the sample at the wavelength 665.2 nm, 652.4 nm and 470 nm, respectively.
The total of anthocyanins (mg/ 100 g) was calculated according to the formula [43]:
A n t h o c y a n i n s = 100 × A 535 × D F × V 98.2 × x
Where, A535 is the absorbance of the sample at the wavelength 535 nm; DF is the dilution factor; V is the volume of anthocyanin extract that was made up to after extraction (ml); x is the weight of the dried sample used for extraction (g).

2.7. Substrate Characterization

2.7.1. Substrate Density

The initial substrate (before the treatments) and final substrates (after the treatments) used for turnip’ potting was initially analyzed by the apparent compact density method [44] to measure the density of the substrate samples. This step is essential to calculate the weight of substrate sample (ms, g) at 60 mL, used in Section 2.7.2. To a 1000 mL plastic graduated cylinder was added the substrate sample without pressing it down. Then, the substrate was compacted by dropping the graduated cylinder 10 times on a 5 mm thick rubber blanket, from a height of about 10 cm. The level of the substrate was marked, and the graduated cylinder was weighted (technical scale: UFB 500, Memmert, Büchenbach, Germany). The apparent compact density of the substrate (Ds, g L-1); was calculated according to the formula [44]:
D s = m A m B V
Where, mA is the weight of the substrate compacted and the graduated cylinder (g); mB is the weight of the graduated cylinder (g); V is the final volume of the substrate in the graduated cylinder (L).
The weight of substrate sample (ms, g) at 60 mL, used in Section 2.7.2 was calculated according to the formula [44]:
m s = D s × 60 1000
Where, Ds is the apparent compact density of the substrate (g L-1).

2.7.2. pH and Electrical Conductivity

The substrate samples were weighted (technical scale: UFB 500, Memmert, Büchenbach, Germany) to a 500 mL Erlenmeyer, added 300 mL of distilled water, secured the cap and shaken for 1 h at 200 rpm (shaking machine: Rotabit, JP Selecta, Lisbon, Portugal), at room temperature (23 °C). Afterwards, the pH was determined (pH meter: 3310 Jenway, Staffordshire, UK) directly from the solution obtained. The electric conductivity (portable conductivity meter: ProfiLine Cond 3310 WTW, Oberbayern, Germany) was determined from the filtrated obtained in Section 2.7.3.

2.7.3. Mineral and Trace Element Characterization

The soil extract obtained in Section 2.7.2. was filtrated with filter paper (Whatman filter paper cellulose-based ashless types, pore size: 8 µm and diameter of 150 mm, Whatman, Portugal), discarding at least the first 10 mL. The rest of the filtrated was added to a 100 mL plastic container and stored at room temperature (23 °C). The mineral content was assessed by using flame atomic absorption spectrometry, for the determination of copper (Cu), zinc (Zn), manganese (Mn), iron (Fe), calcium (Ca), magnesium (Mg), potassium (K) and sodium (Na) [38], and molecular absorption spectrometry for the determination of phosphorus (P) [39] were performed as described in Section 2.6.3.

2.7.4. Organic Matter Content

The substrate samples were placed in separate aluminum trays, weighted, and then dried in an air-forced oven (UFB 500, Memmert, Büchenbach, Germany) at 75 °C for 2 days, until it reached a constant weight. Then, the samples were weighted again and milled, separately, in a soil grinder (FRITSCH GmbH Pulverisette 8, Midland, Canada), through a sieve of 1.5 mm, separating the thin (particles < 1.5 mm) and rough (particles > 1.5 mm) material [45,46]. Approximately, 3 g of each sample (particles < 1.5 mm) (analytical scale: AB 204 Mettler-Toledo, Zurich, Switzerland) were placed in crucibles and dried in an air-forced oven (UFB 500, Memmert, Büchenbach, Germany) at 105 °C for 4 h. Then, the samples were placed in a desiccator until the constant weight was reached, being again weighted (analytical scale: AB 204 Mettler-Toledo, Zurich, Switzerland). The previous samples dried at 105 °C were placed in an incineration muffle (Induzir, Leiria, Portugal) at 480-500 °C overnight and further cooled in a desiccator and weighted again (analytical scale: AB 204 Mettler-Toledo, Zurich, Switzerland).
The organic matter content (OM, %) is calculated according to the formula [45,46]:
O M % = ( m 2 m 3 ) ( m 2 m 1 ) × 100
Where, m1 is the crucible weight (g); m2 is the crucible and sample weight dried at 105 °C (g); m3 is the crucible and sample weight incinerated (g).

2.7.5. Total Nitrogen

The total nitrogen analysis of each substrate was performed as described in Section 2.6.2, with 1 g of the dried samples (at 75 °C) obtained in Section 2.7.4.
The reagent blank test was carried out in parallel with the determinations, by the same procedure as outlined in the Sections 2.6.12.7.5, using the same quantities of all the reagents as in the determination but omitting the test portion.

2.8. Statistical Analysis

The statistical analysis was performed with the software Sigma Plot v.14. Data was checked for normality (Shapiro–Wilk test) and homogeneity (the equal variance test Brown-Forsythe). The Holm-Sidak method was used in the analysis when the normality test was rejected. One-way analysis of variance (ANOVA) was then performed to assess statistically significant differences between each growth parameters of each polysaccharide’ solution. The statistical analysis was performed comparing the different treatments, being considered statistically different when p-value was <0.05. The Tukey multiple comparison t-test was used after the rejection of the one-way ANOVA null hypothesis (Holm-Sidak method).

3. Results

3.1. Biostimulant and Biofertilizer Assay in Brassica napus L.

3.1.1. Biochemical Characterization of the Treatments Applied

The determination of the pH, electrical conductivity (EC) and viscosity of biostimulant treatments applied to crops, can help anticipate how the plant will accept it and how it will affect the crop’s yield, quality and pathogen resistance. The positive control was the treatment with the most neutral pH, with 7.30 (Table 2). The negative control, the alginate solution and the agar solution presented an acid pH of 5.86, 3.70 and 5.83, respectively. The pH of the carrageenan solutions was between 9 and 10, which is considered as alkaline. Regarding the EC, the positive control had the highest values among all treatments, with 1685 µS/cm, whereas the agar solution had the lowest, with 73 µS/cm. Between all carrageenan solutions, EC increased accompanying the pH rise. The viscosity was the highest in the tetrasporophyte solution (the lowest pH and EC). Overall, excluding the negative control, all carrageenan solutions presented the highest viscosity values (10.80 mPa.s for the tetrasporophyte solution and 9 mPa.s for the non-fructified thalli and female gametophyte solutions), and the lowest alginate solution (3.60 mPa.s).

3.1.2. Turnip’ Plant Parameters

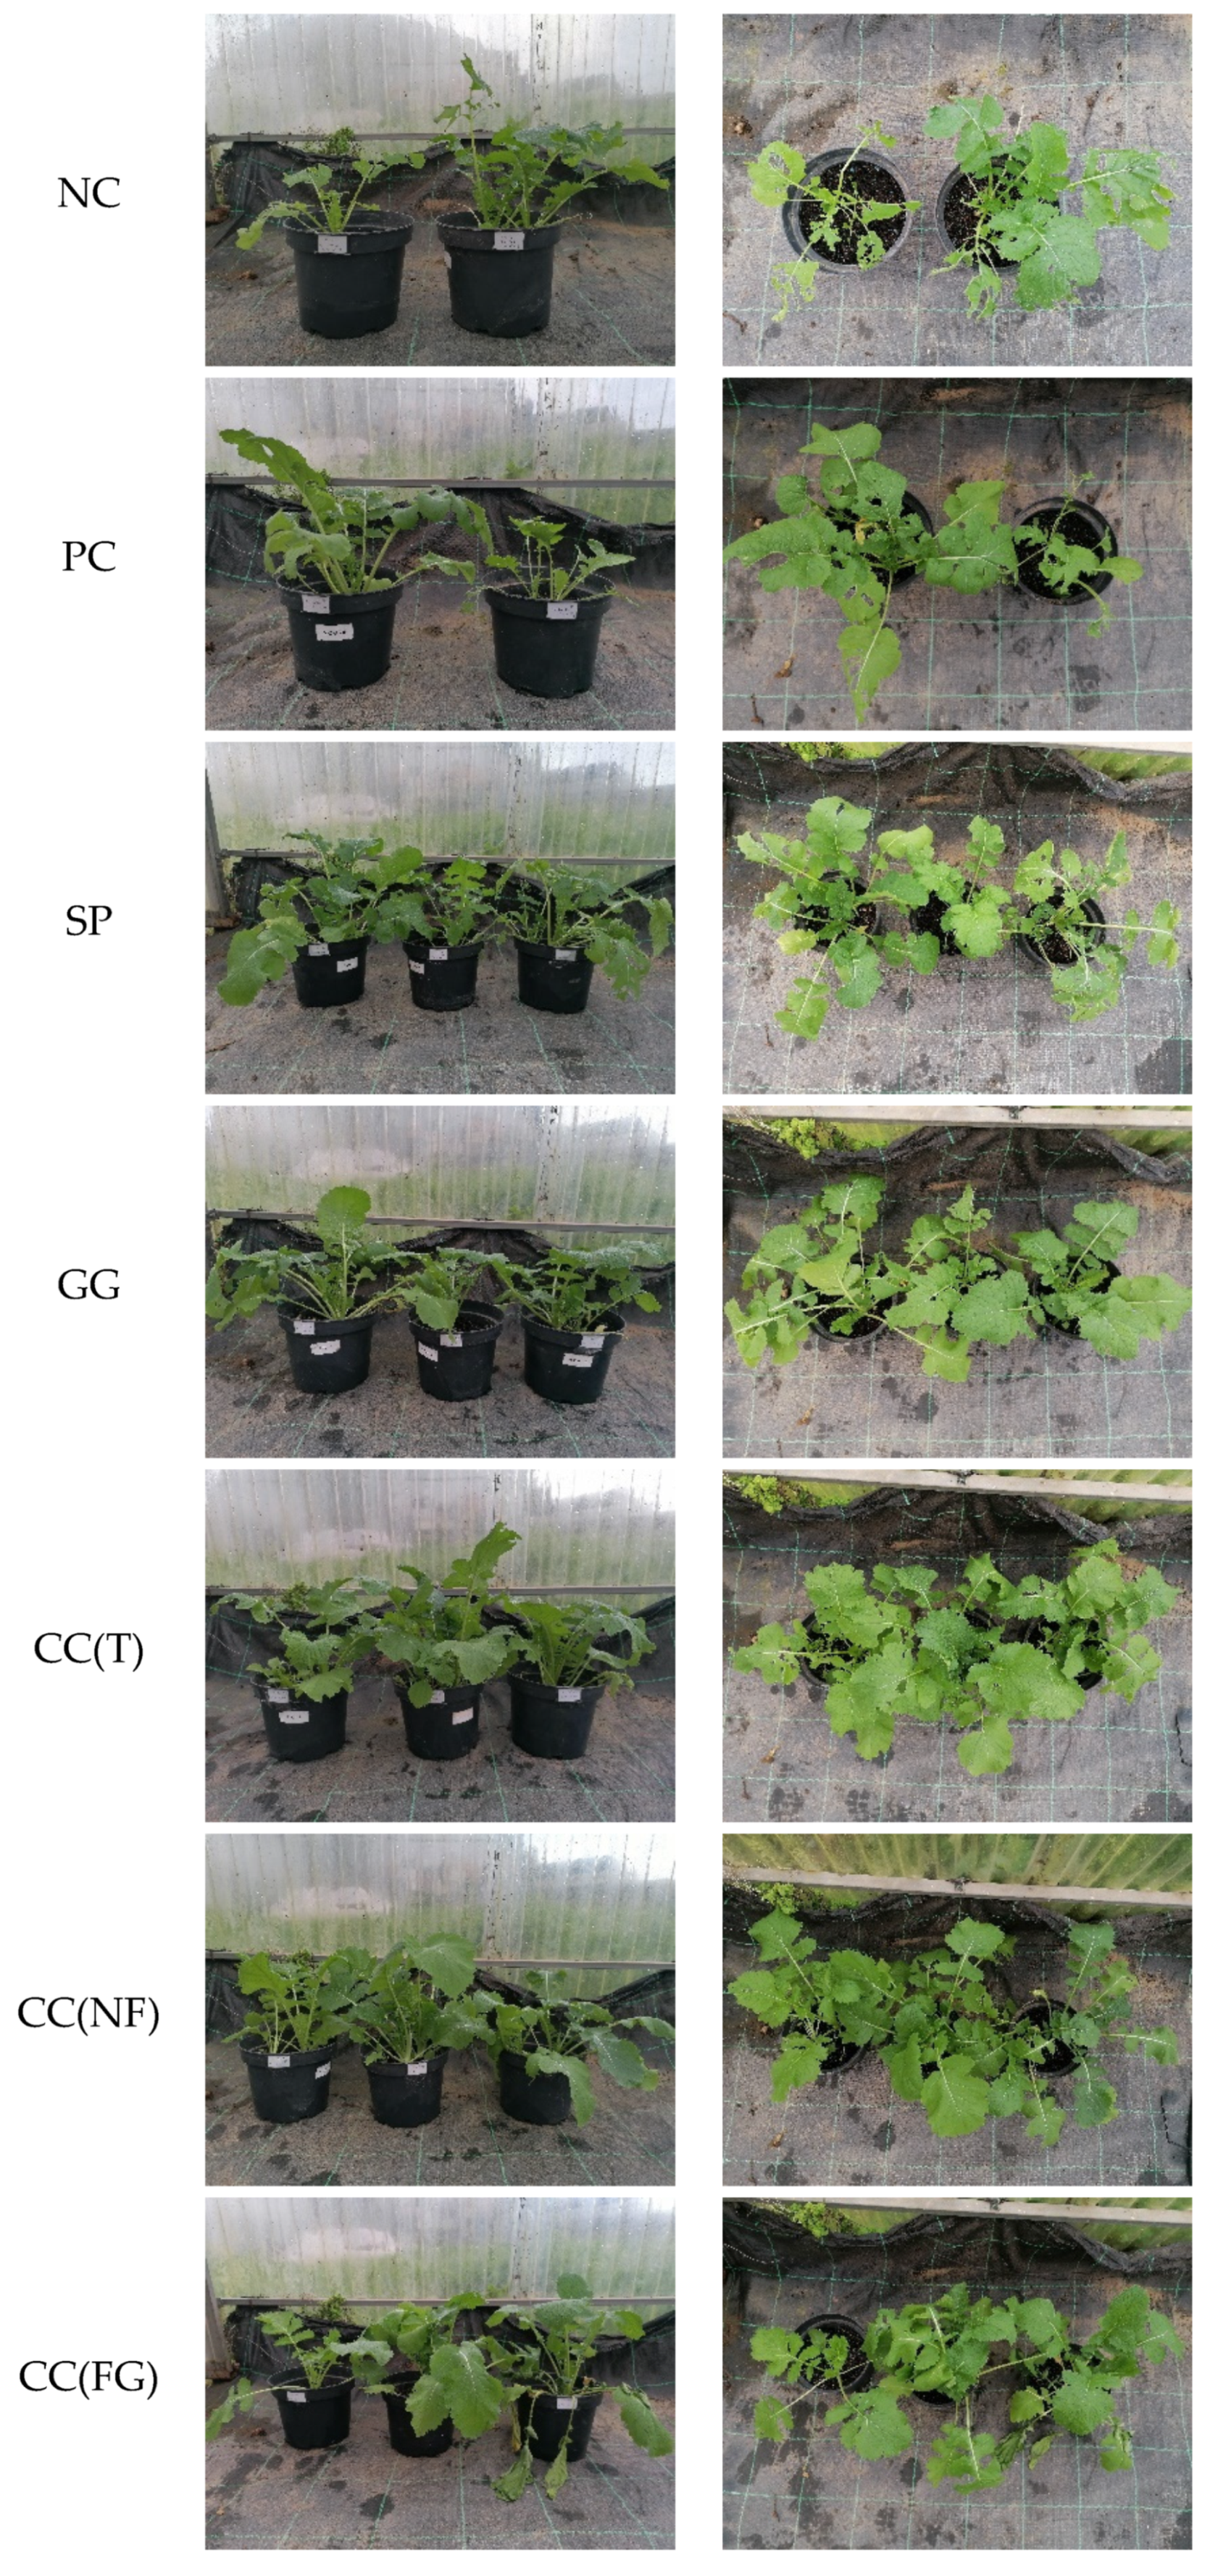
It was possible to observe differences among the potted turnip plants from each treatment (Figure 3 and Figure 5). By the end of the experiment (day 63), plants treated with the negative (NC) and positive control (PC) had very reduced size when compared to the other treatments. The samples that presented the most robust turnip leaf development were the ones treated with the carrageenan-based solutions of C. crispus (tetrasporophyte, non-fructified thalli and female gametophyte, CC(T), CC(NF) and CC(FG), respectively).
Figure 3. Photographic record of the potted turnip plants treated with each polysaccharide-based solution, after 63 days. NC – negative control; PC – positive control; SP – S. polyschides; GG – G. gracilis; CC(T) – C. crispus (tetrasporophyte); CC(NF) – C. crispus (non-fructified thalli); CC(FG) – C. crispus (female gametophyte).
Preprints 91786 g003
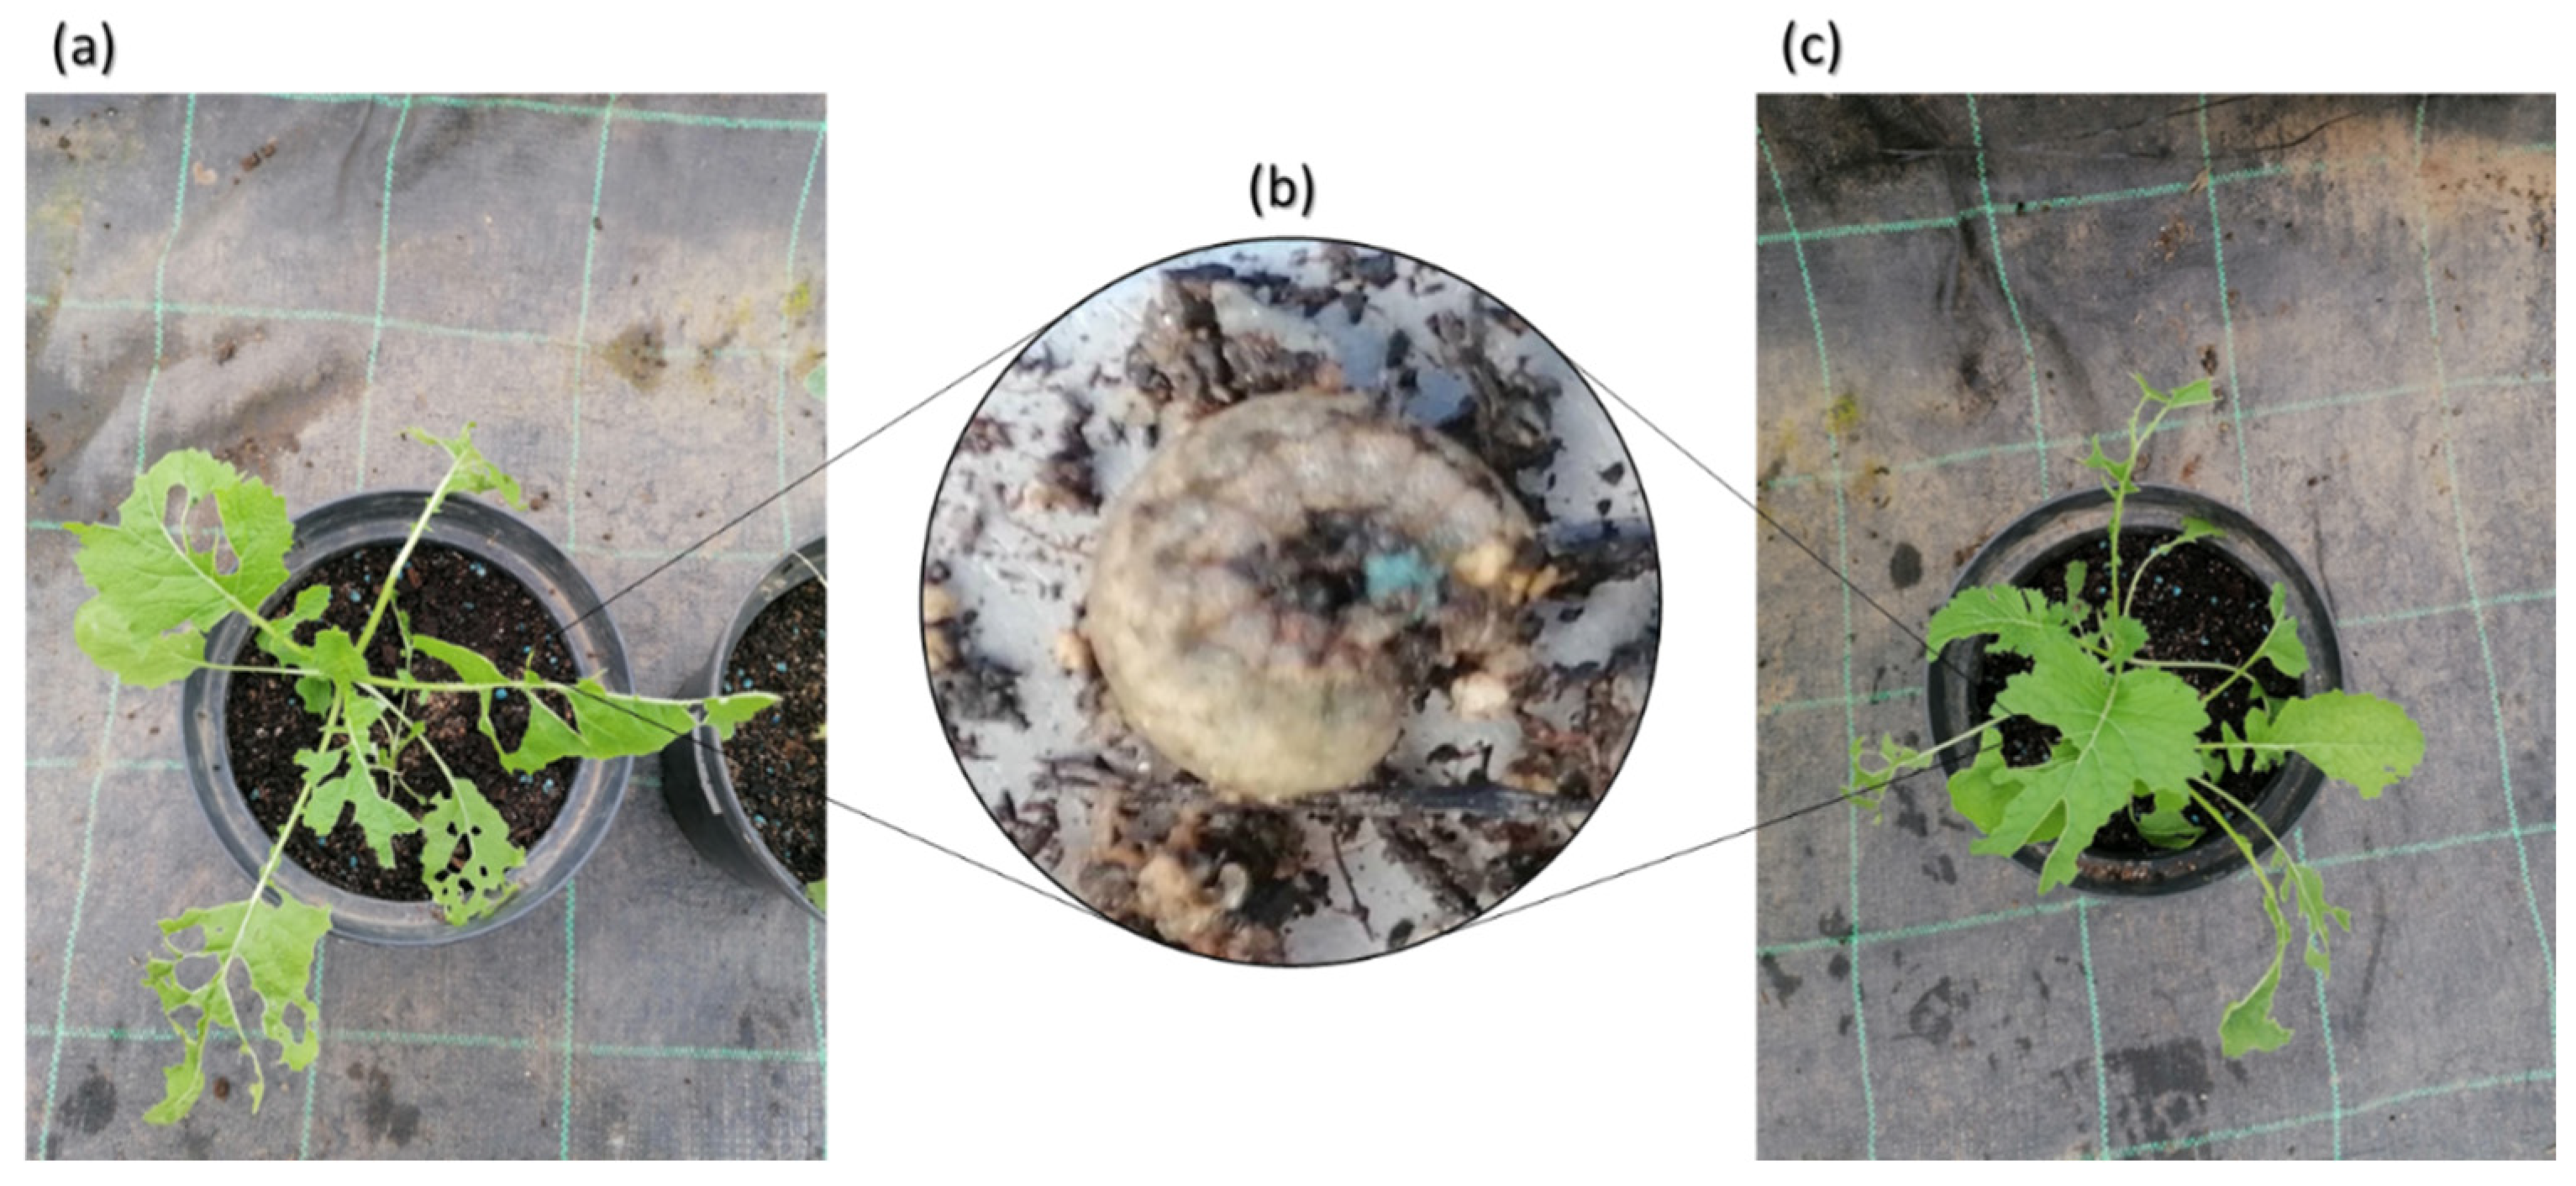
Additionally, at day 42 (when the second application was done), the samples treated with NC and PC started to exhibit various injuries (as holes) on the leaves, showing the existence of some parasite on the leaves (Figure 4a,c). The same was not observed on the treated leaves until day 63, when appeared some injuries but in very reduced number, compared to ones observed under control treatments (Figure 3). After more deep observation, it was found that these leaf injuries were caused by Agrotis spp. larvae (Figure 4b).
Figure 4. Photographic record of turnip leaf injuries (a) Negative control (tap water) and (c) Positive control (“Profertil”), caused by Agrotis larvae (b), observed in potted turnip plants, after 63 days.
Preprints 91786 g004
Figure 5. Photographic record of the turnip leaves obtained from each treatment (a) negative control, (b) positive control, (c) alginate from S. polyschides, (d) agar from G. gracilis, (e) carrageenan from C. crispus (tetrasporophyte), (f) carrageenan from C. crispus (non-fructified thalli) and (f) carrageenan from C. crispus (female gametophyte).
Preprints 91786 g005
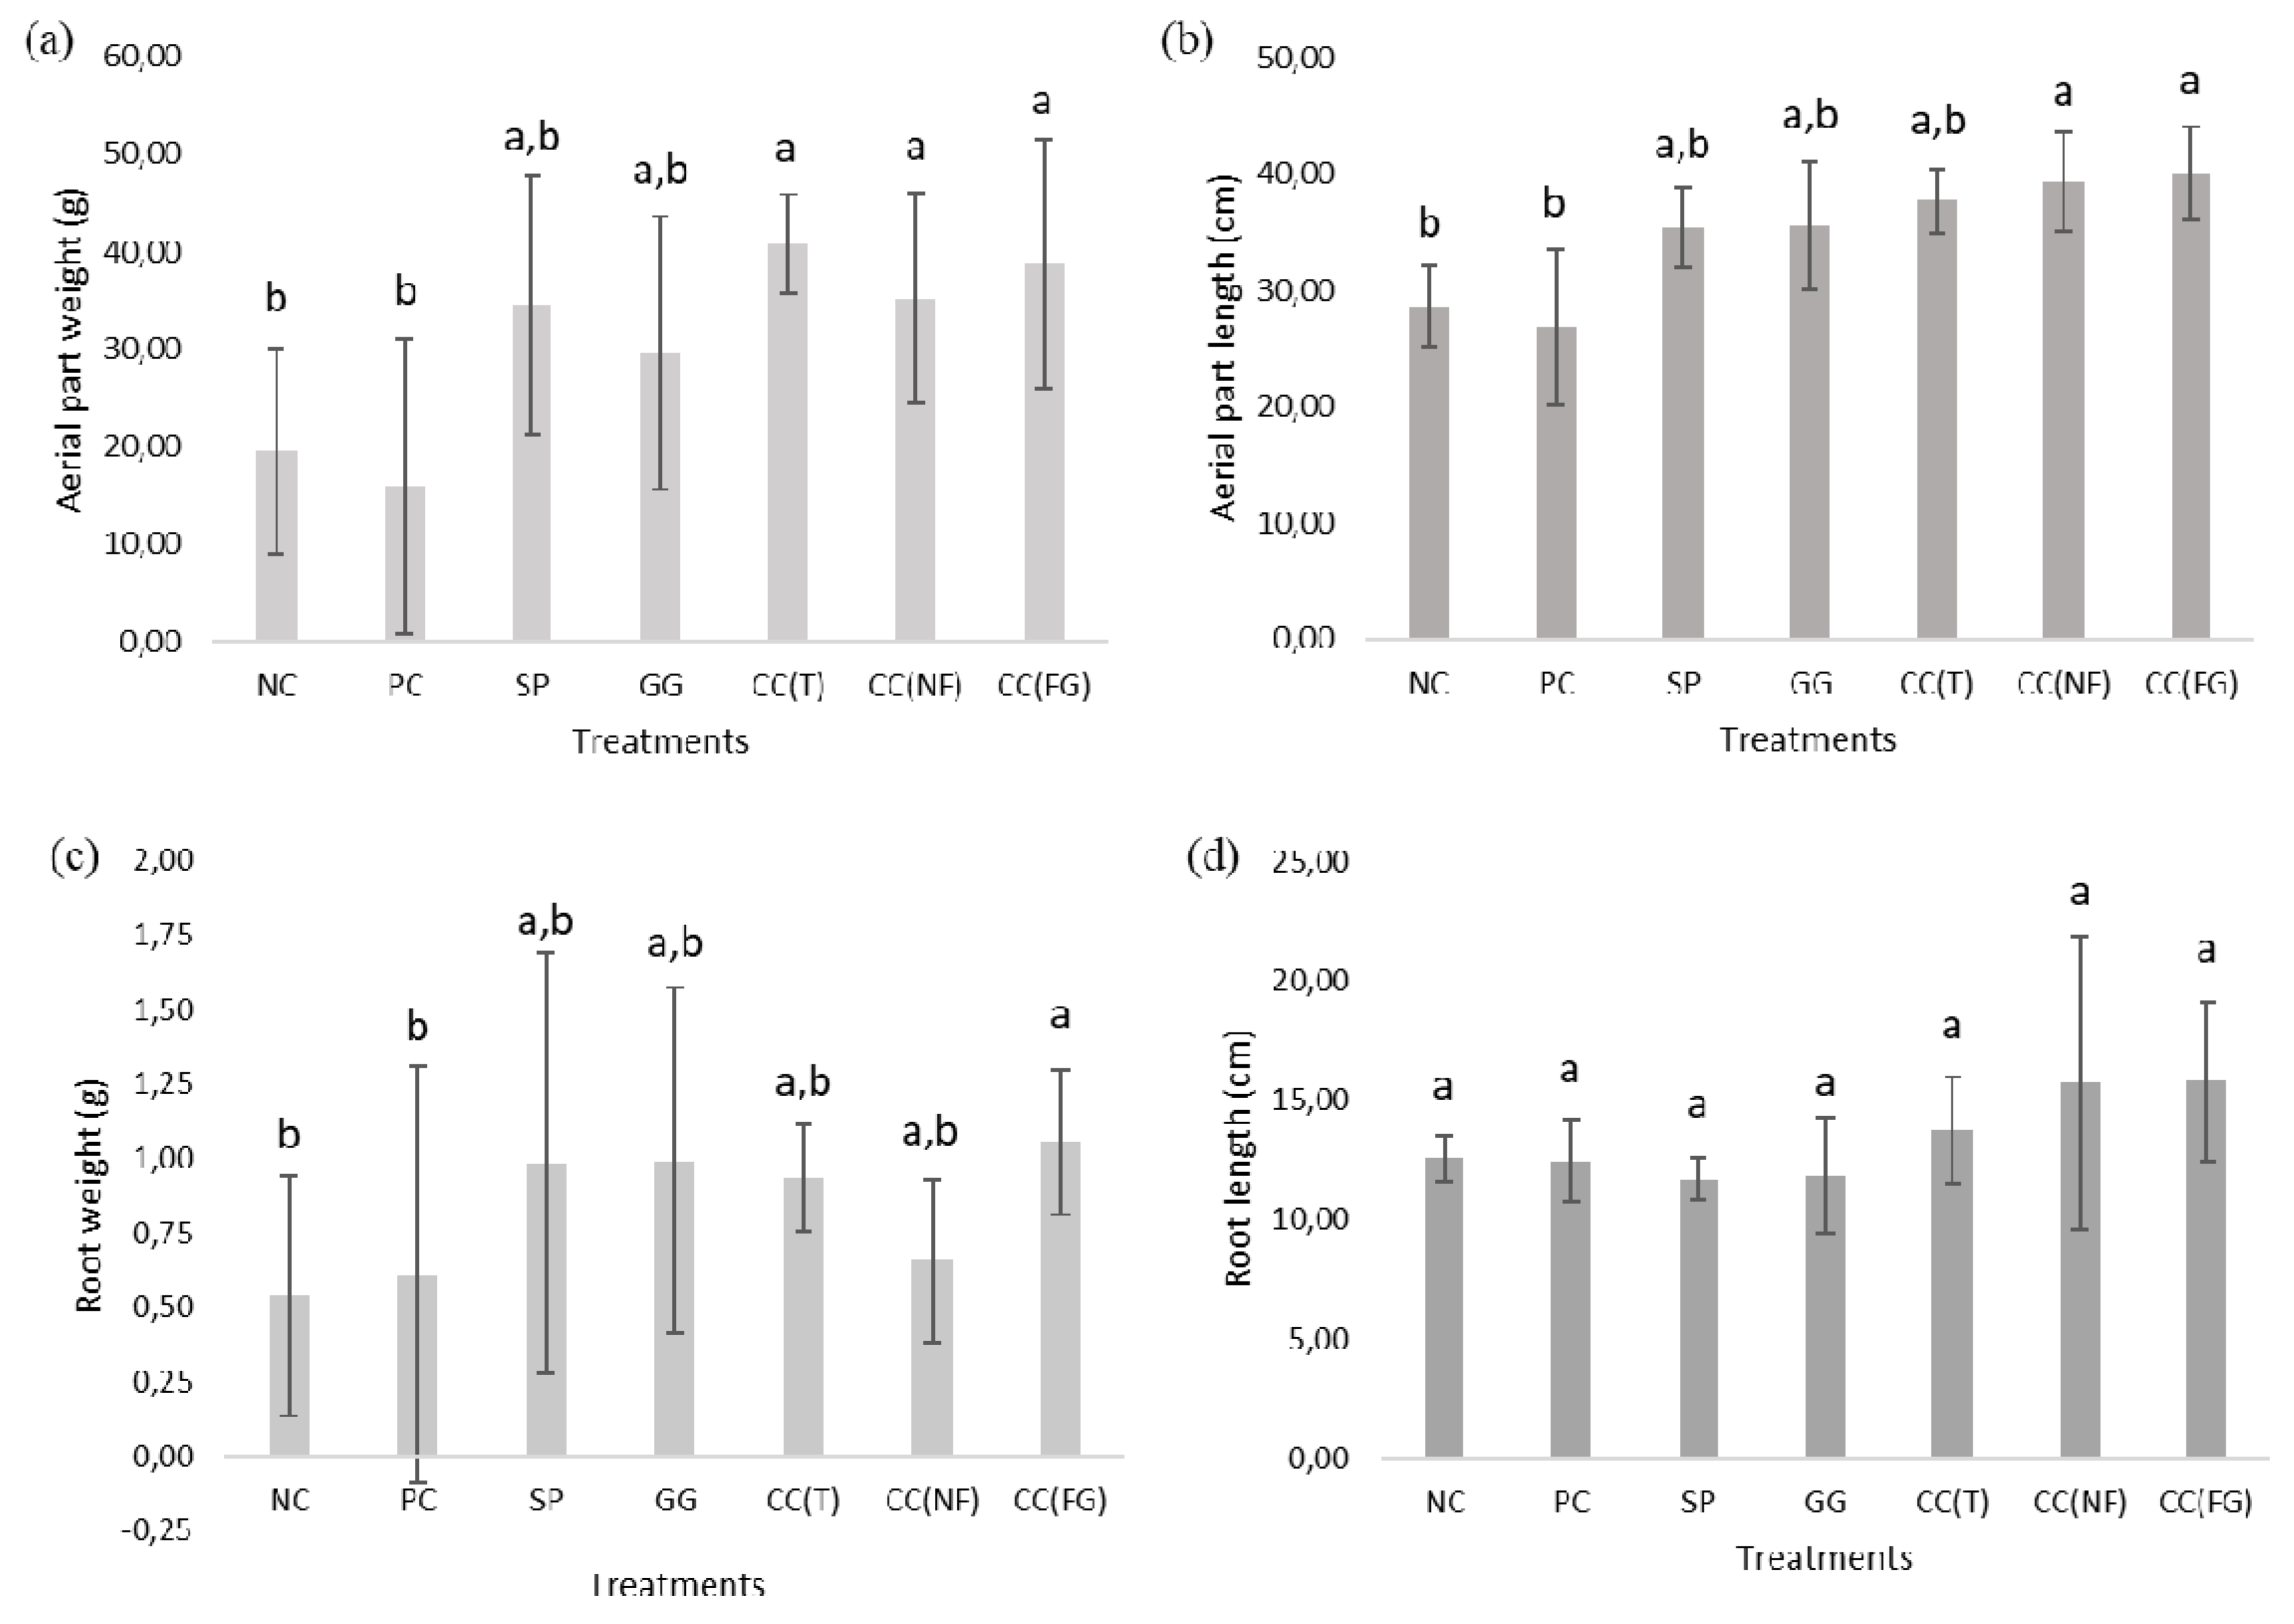
After the harvesting of all turnip samples from each treatment, the growth parameters were evaluated (leaf weight and length, root weight and length) (Figure 6) and the ratios of these parameters were analyzed (Table 3).
In Figure 6, are presented the average values of the aerial part weight (Figure 6a), leaf length (Figure 6b), root weight (Figure 6c) and root length (Figure 6d) of the fresh turnips from each treatment. After 63 days, there was a clear difference between the turnip plants obtained from both control treatments and the polysaccharide treatments. The most robust samples (with the best leaf weight and length) were observed in plants treated with the CC(T), CC(NF) and CC(FG). The samples with the lowest leaf weight (Figure 6a) and length (Figure 6b) were the control ones, particularly, the PC, with 15.91±15.15 g and 26.80±6.70 cm, respectively. When compared the turnip plants treated only with the polysaccharides-based solutions, turnips that exhibited the best leaf weights were ones treated with the CC(T) (40.80±5.11 g). The turnips treated with the GG presented the least leaf weights (29.53±13.99 g). The turnip samples that exhibited the longest leaves were ones treated with the CC(FG) (39.98±4.00 cm). The shortest leaves were observed in turnip samples treated with the SP (35.36±3.41 cm). There were not statistically significant differences among the treatment groups (p>0.05).
The heaviest roots were observed in plants treated with the CC(FG) (1.06±0.24 g), GG (0.99±0.58 g) and SP (0.98±0.70 g) (Figure 6c). The samples with the lightest roots were the controls, 0.61±0.70 g for the PC and 0.54±0.40 g for the NC. On other hand, the samples with the longest roots were ones treated with the three carrageenan CC(FG) (15.80±3.33 cm), CC(NF) (15.77±6.13 cm) and CC(T) (13.76±2.24 cm). Plants treated with SP and GG, developed he shortest roots, 11.72±0.89 and 11.84±2.42 cm, respectively. There were not found any statistically significant differences among the treatment groups (p>0.05).
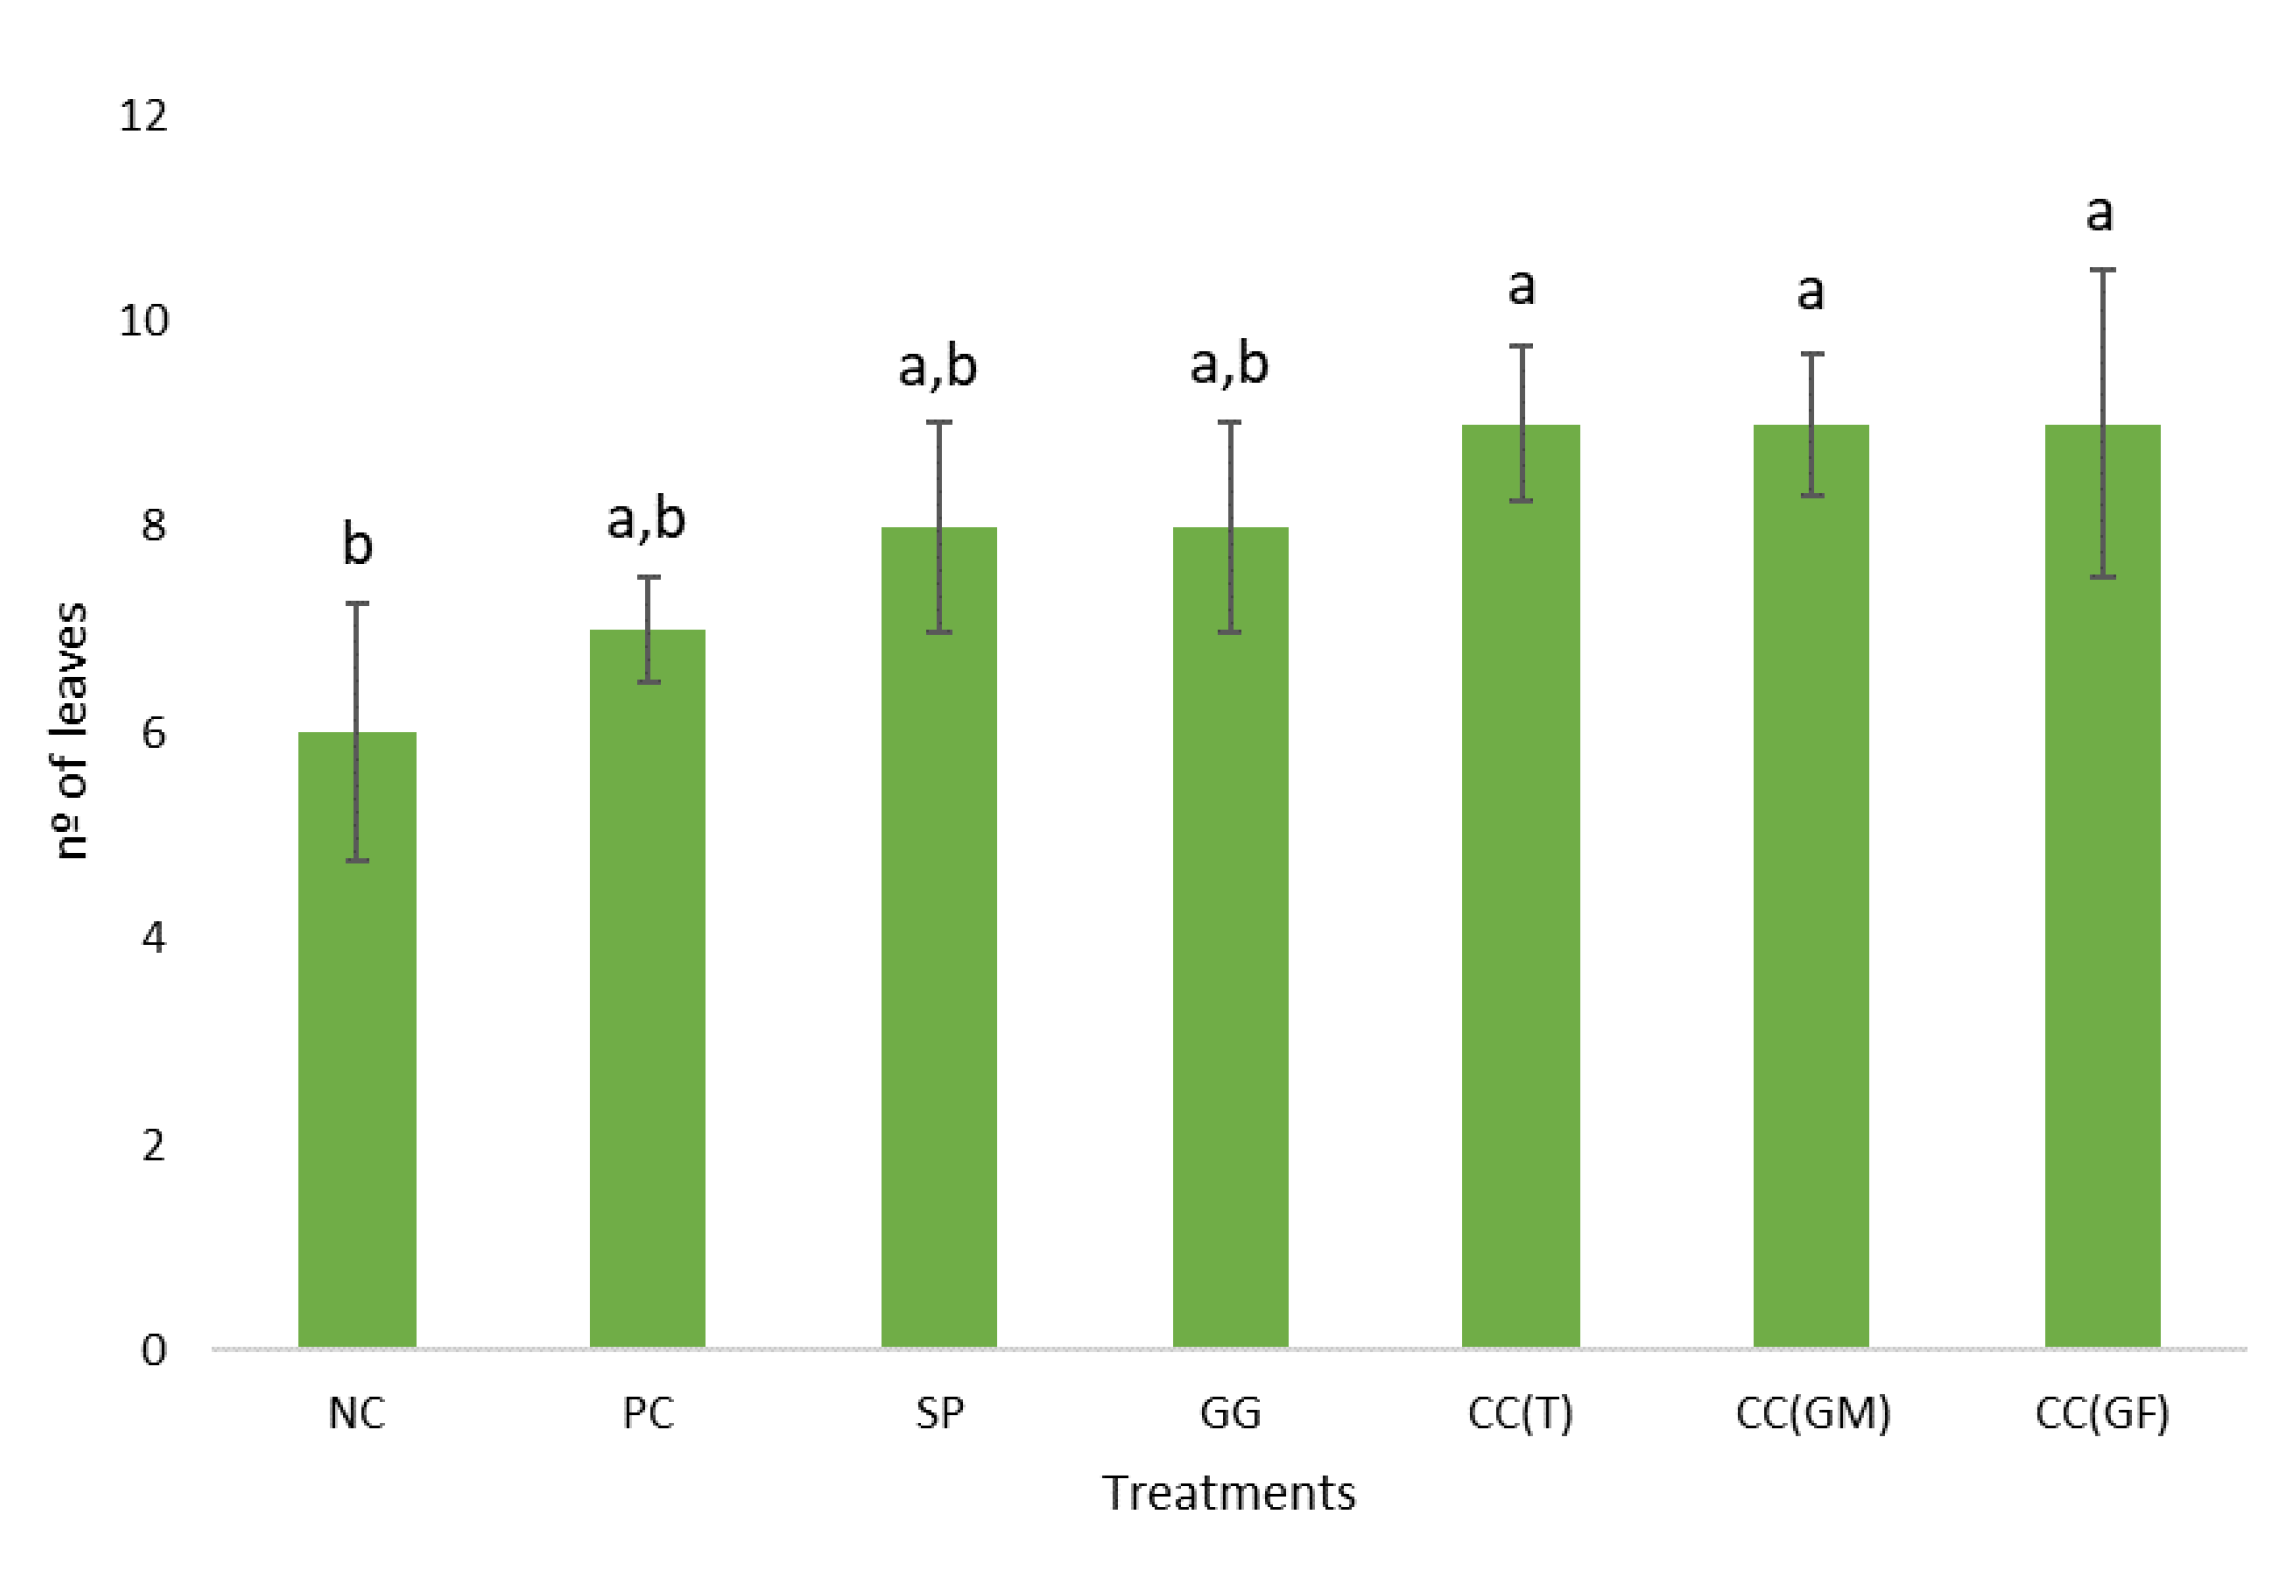
Regarding the leaf number (Figure 7), plants with the least leaf number were the controls, with ± 6 leaves for the NC and ± 7 leaves for the PC. Plants that developed the highest leaf number were that treated with CC(T), CC(NF) and CC(FG), with ± 9 leaves.
Regarding the ratios between the growth parameters (Table 3), the ratio aerial part weight vs root weight was higher in CC(NF) (53.54), CC(T) (43.69) and CC(FG) (36.62) and lower in PC (26.09) and GG (29.77). Furthermore, the NC and PC presented the least ratios of aerial part length vs root length, with 2.28 and 2.15, respectively.

3.1.3. Turnip’ Greens Physiological and Biochemical Characterization

3.1.3.1. Mineral and Trace Element Characterization

The mineral and trace element characterization of the turnip’ edible section (Table 4) is important to understand how the treatments applied to the plants affected their nutritional quality. There were not observed statistically significant differences among the treatment groups (p>0.05).
All treatments induced slightly higher production (%) of nitrogen (N) content in all plants (Table 4), when compared to the literature value (3.23%), with NC having the greatest value among all treatments (5.68%). The phosphorus (P) content was slightly higher than cited in the literature (0.75%) in all treatment groups, except in the plants treated with GG (0.73%) and CC(NF) (0.75%) solutions. The calcium (Ca) content was lower in all treatment groups when compared with one from the literature (1.67%). The sodium (Na) content was lower in all treatment groups when compared to the literature (0.67%), except in plants treated with CC(NF), where the Na percentage was higher than all the other treatments (0.90%). Magnesium (Mg) and potassium (K) contents were higher in all treatment groups than cited in the literature (0.17% and 5%, respectively).
Regarding the trace elements, zinc (Zn), iron (Fe) and manganese (Mn), excluding copper (Cu), there was a considerable difference between their content in NC plants and the other treatments. For Zn and Mn, all values were slightly lower than found in the literature (87.40% and 98.70%, respectively), except for the NC, that had 118.15% for Zn and 119.75% for Mn. Overall, the NC exhibited the highest values in all mineral and trace elements. It is to consider that there are no published values for Cu and Fe contents in any plants safe for human consumption.

3.1.3.2. Turnip Leaves Biochemical Characterization

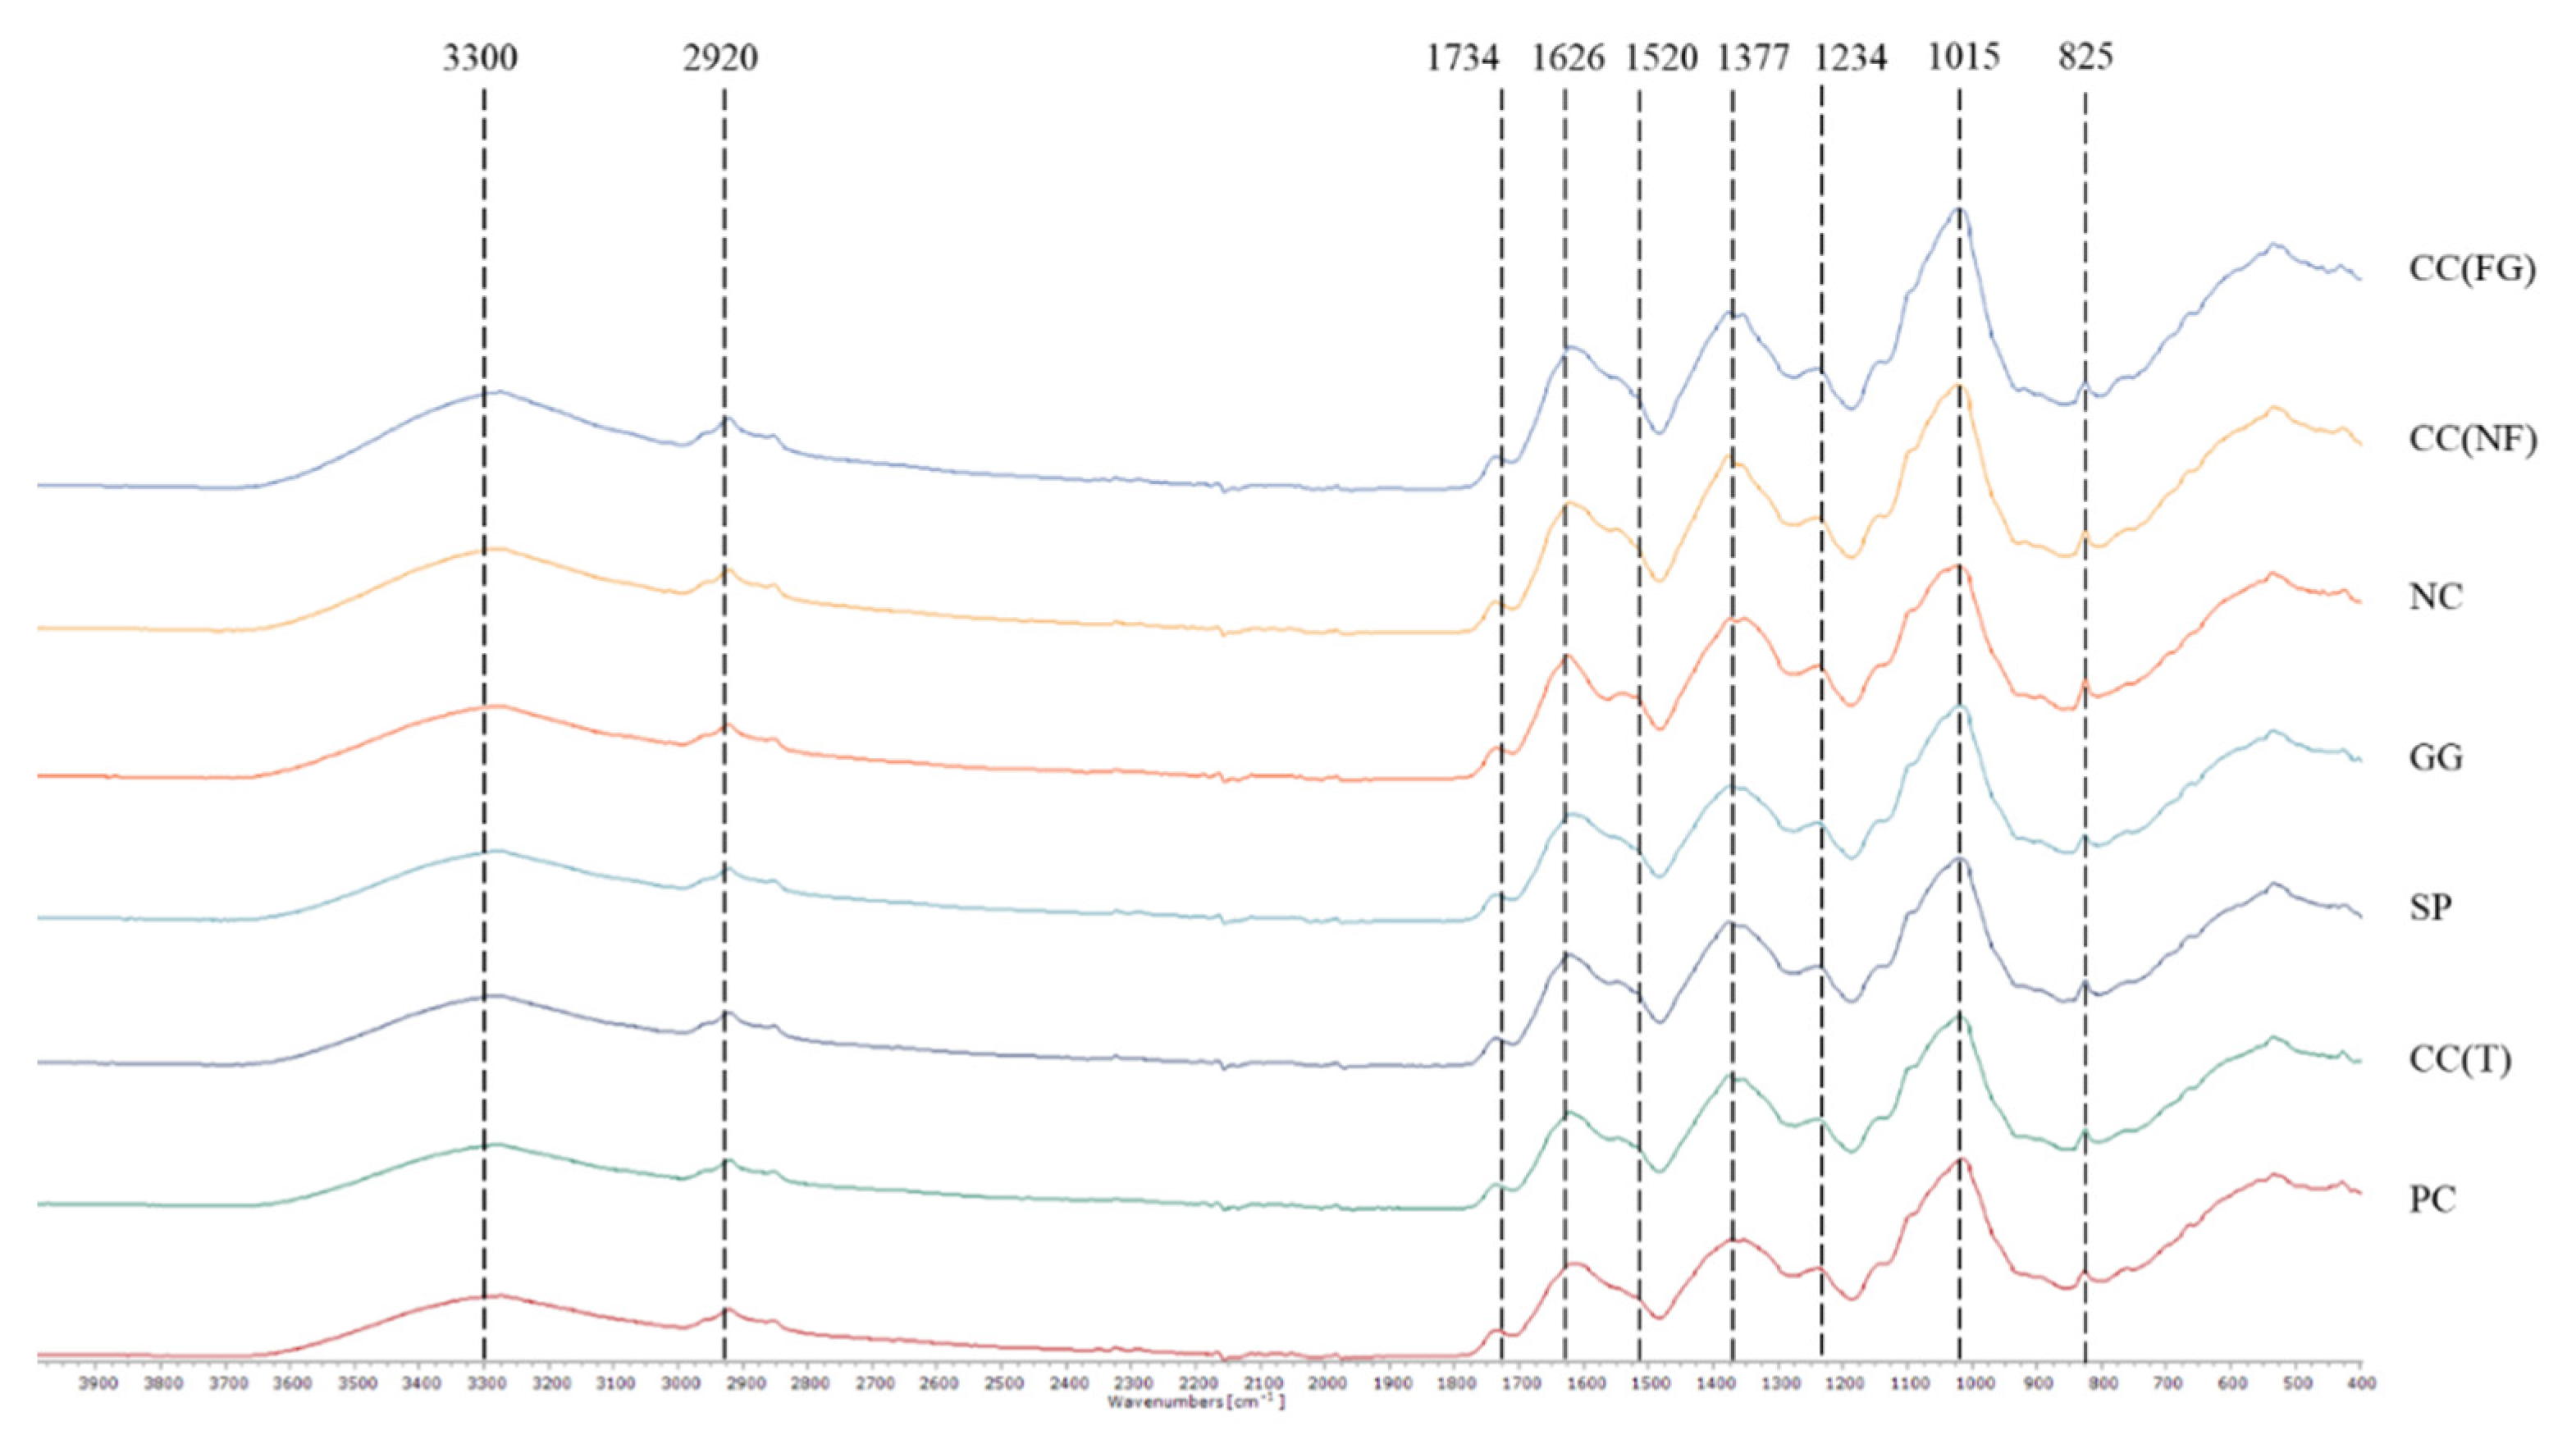
The FTIR-ATR spectra in the range 4000 to 400 cm−1 of the turnip leaves within each treatment are given in Figure 8 and Table 5. The spectra of the different treatments are aligned in order of peaks’ intensity (from highest to lowest). All the spectra (Figure 8) had similar peaks (shoulder), except the peak assigned to lignin and phenolic backbone at 1520 cm-1, only present in the negative control spectra. The characteristic peaks of cellulose were present in all spectra around 3280 cm-1 and 2921 cm-1. The bands corresponding to pectin’s with ester, free carboxyl groups, cellulose and xyloglucan, and proteins, were present in all spectra around 1736 cm-1, 1620 cm-1, 1352-1377 cm-1 and 1239 cm-1. The peak with the highest intensity in all spectra was assigned to polysaccharides, sugars and pectin’s, at 1020 cm-1. The peak around 825 cm-1 was not assigned to any specific bond but its significant intensity is notified. None of the spectra reached a significant peak at 770 cm-1 band, corresponding to phenyl groups.

3.1.3.3. Pigment Content

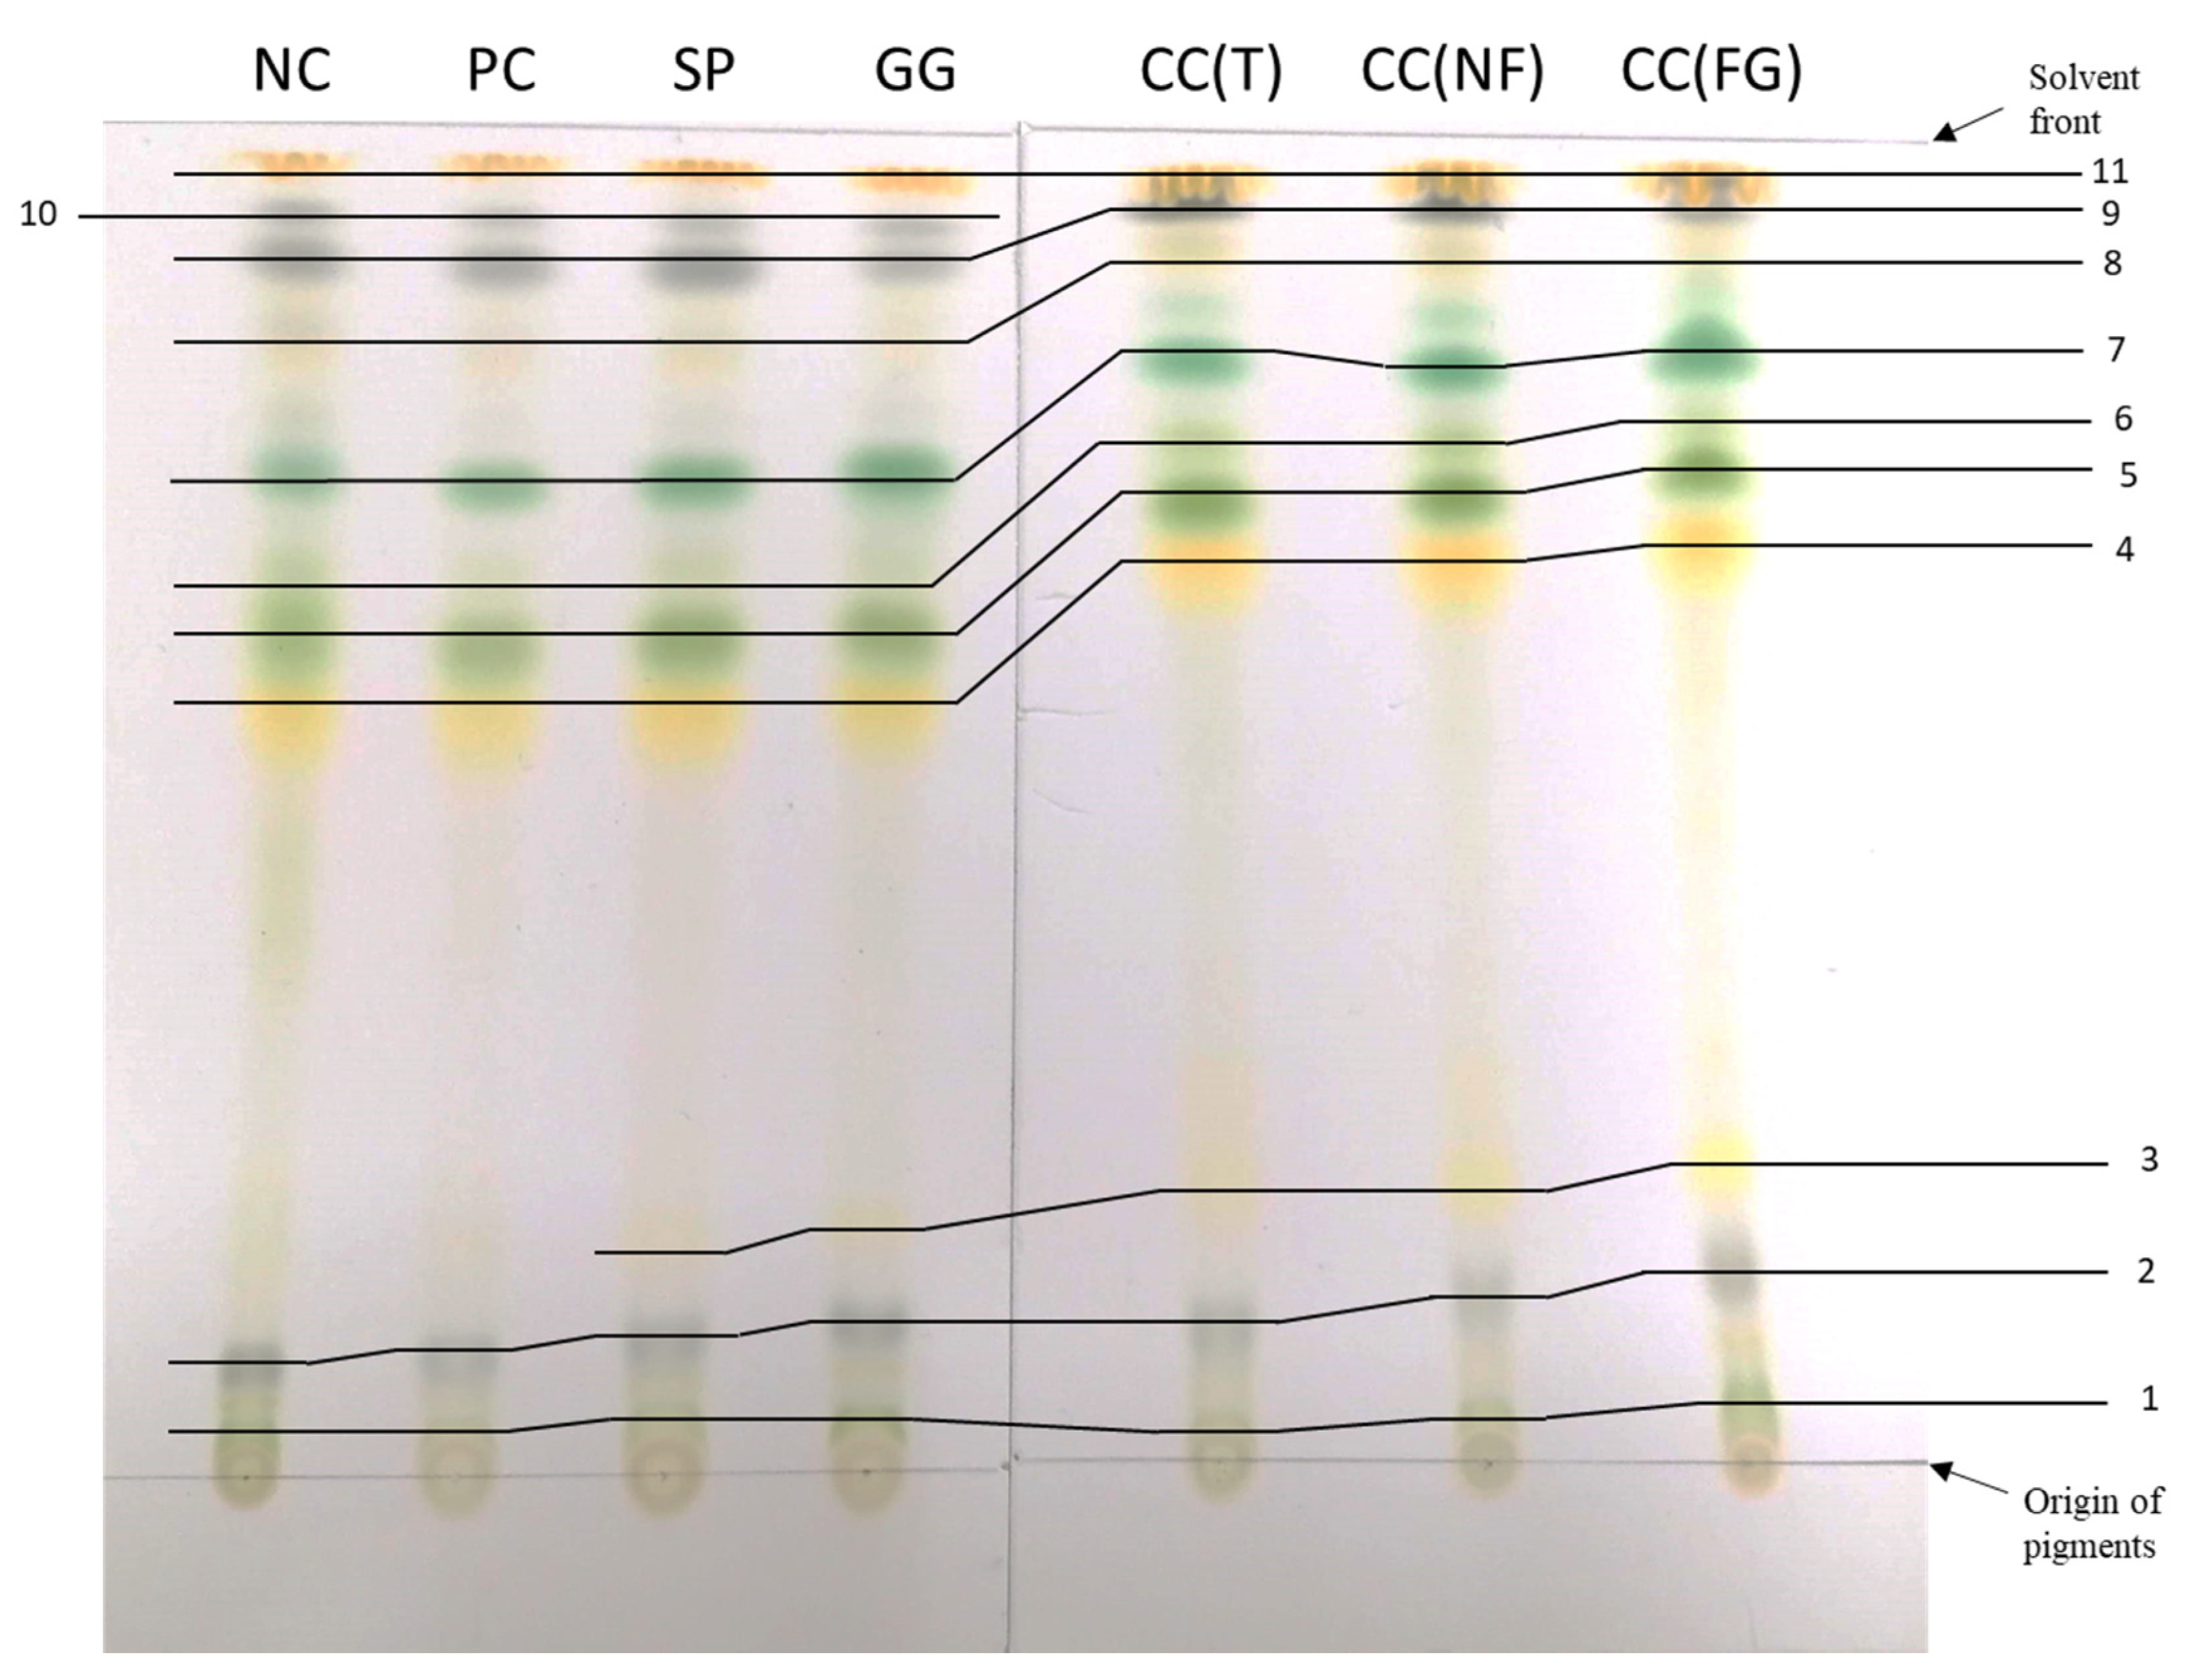
A TLC of the methanolic extracts from each treatment sample of turnip leaves is presented in Figure 9. This chromatography separates the different compounds according to their molecular weight. The solvent runs upwards, from non-polar compounds (origin of the pigments) to polar compounds (solvent front). The retention factor (Rf) is used to compare and help to identify the compounds. The Rf values observed in the different samples are demonstrated in Table 6, as well as comparing Rf values from the literature and the referred pigment. From the wavelength absorbance of each sample in the corresponding pigments (chlorophyll a, chlorophyll b, anthocyanins and carotenoids), it was possible to quantify them (Table 7). Comparing the usual order of the pigments in a TLC and their characteristic colors, pigments were assigned to each number (Table 6).
Samples from CC(T), CC(NF) and CC(FG) moved more than the other samples (Figure 9), therefore had generally higher Rf values (Table 6). Additionally, the pigment marked as “3” in Figure 9, corresponding to neoxanthin (Table 6), did not appear in the TLC of the NC and PC. On the other hand, the pigment marked as “10”, only appeared in the TLC of the NC, PC, SP and GG. The pigment marked as “8” in Figure 9, corresponding to pheophytin b (Table 6), was very difficult to identify clearly regarding its brighter color and it was almost absent in the TLC of the PC, GG and CC(FG). There isn’t any information published regarding pigments 1, 2, 6 and 10.
CC(T) presented the highest values in all pigments in turnip leaves, with 6.916 mg/ 100 g of chlorophyll a, 2.301 mg/ 100 g of chlorophyll b, 0.016 mg/ 100 g of anthocyanins and 1.448 mg/ 100 g of carotenoids (Table 7). On the contrary, GG had the lowest values of all pigments except carotenoids, with 4.303 mg/ 100 g of chlorophyll a, 1.361 mg/ 100 g of chlorophyll b, 0.009 mg/ 100 g of anthocyanins in turnip leaves. The NC had the least quantity of carotenoids with 0.936 mg/ 100 g. Overall, all the treatments from C. crispus increased the quantity of pigments in the turnip leaves.

3.2. Substrate Characterization

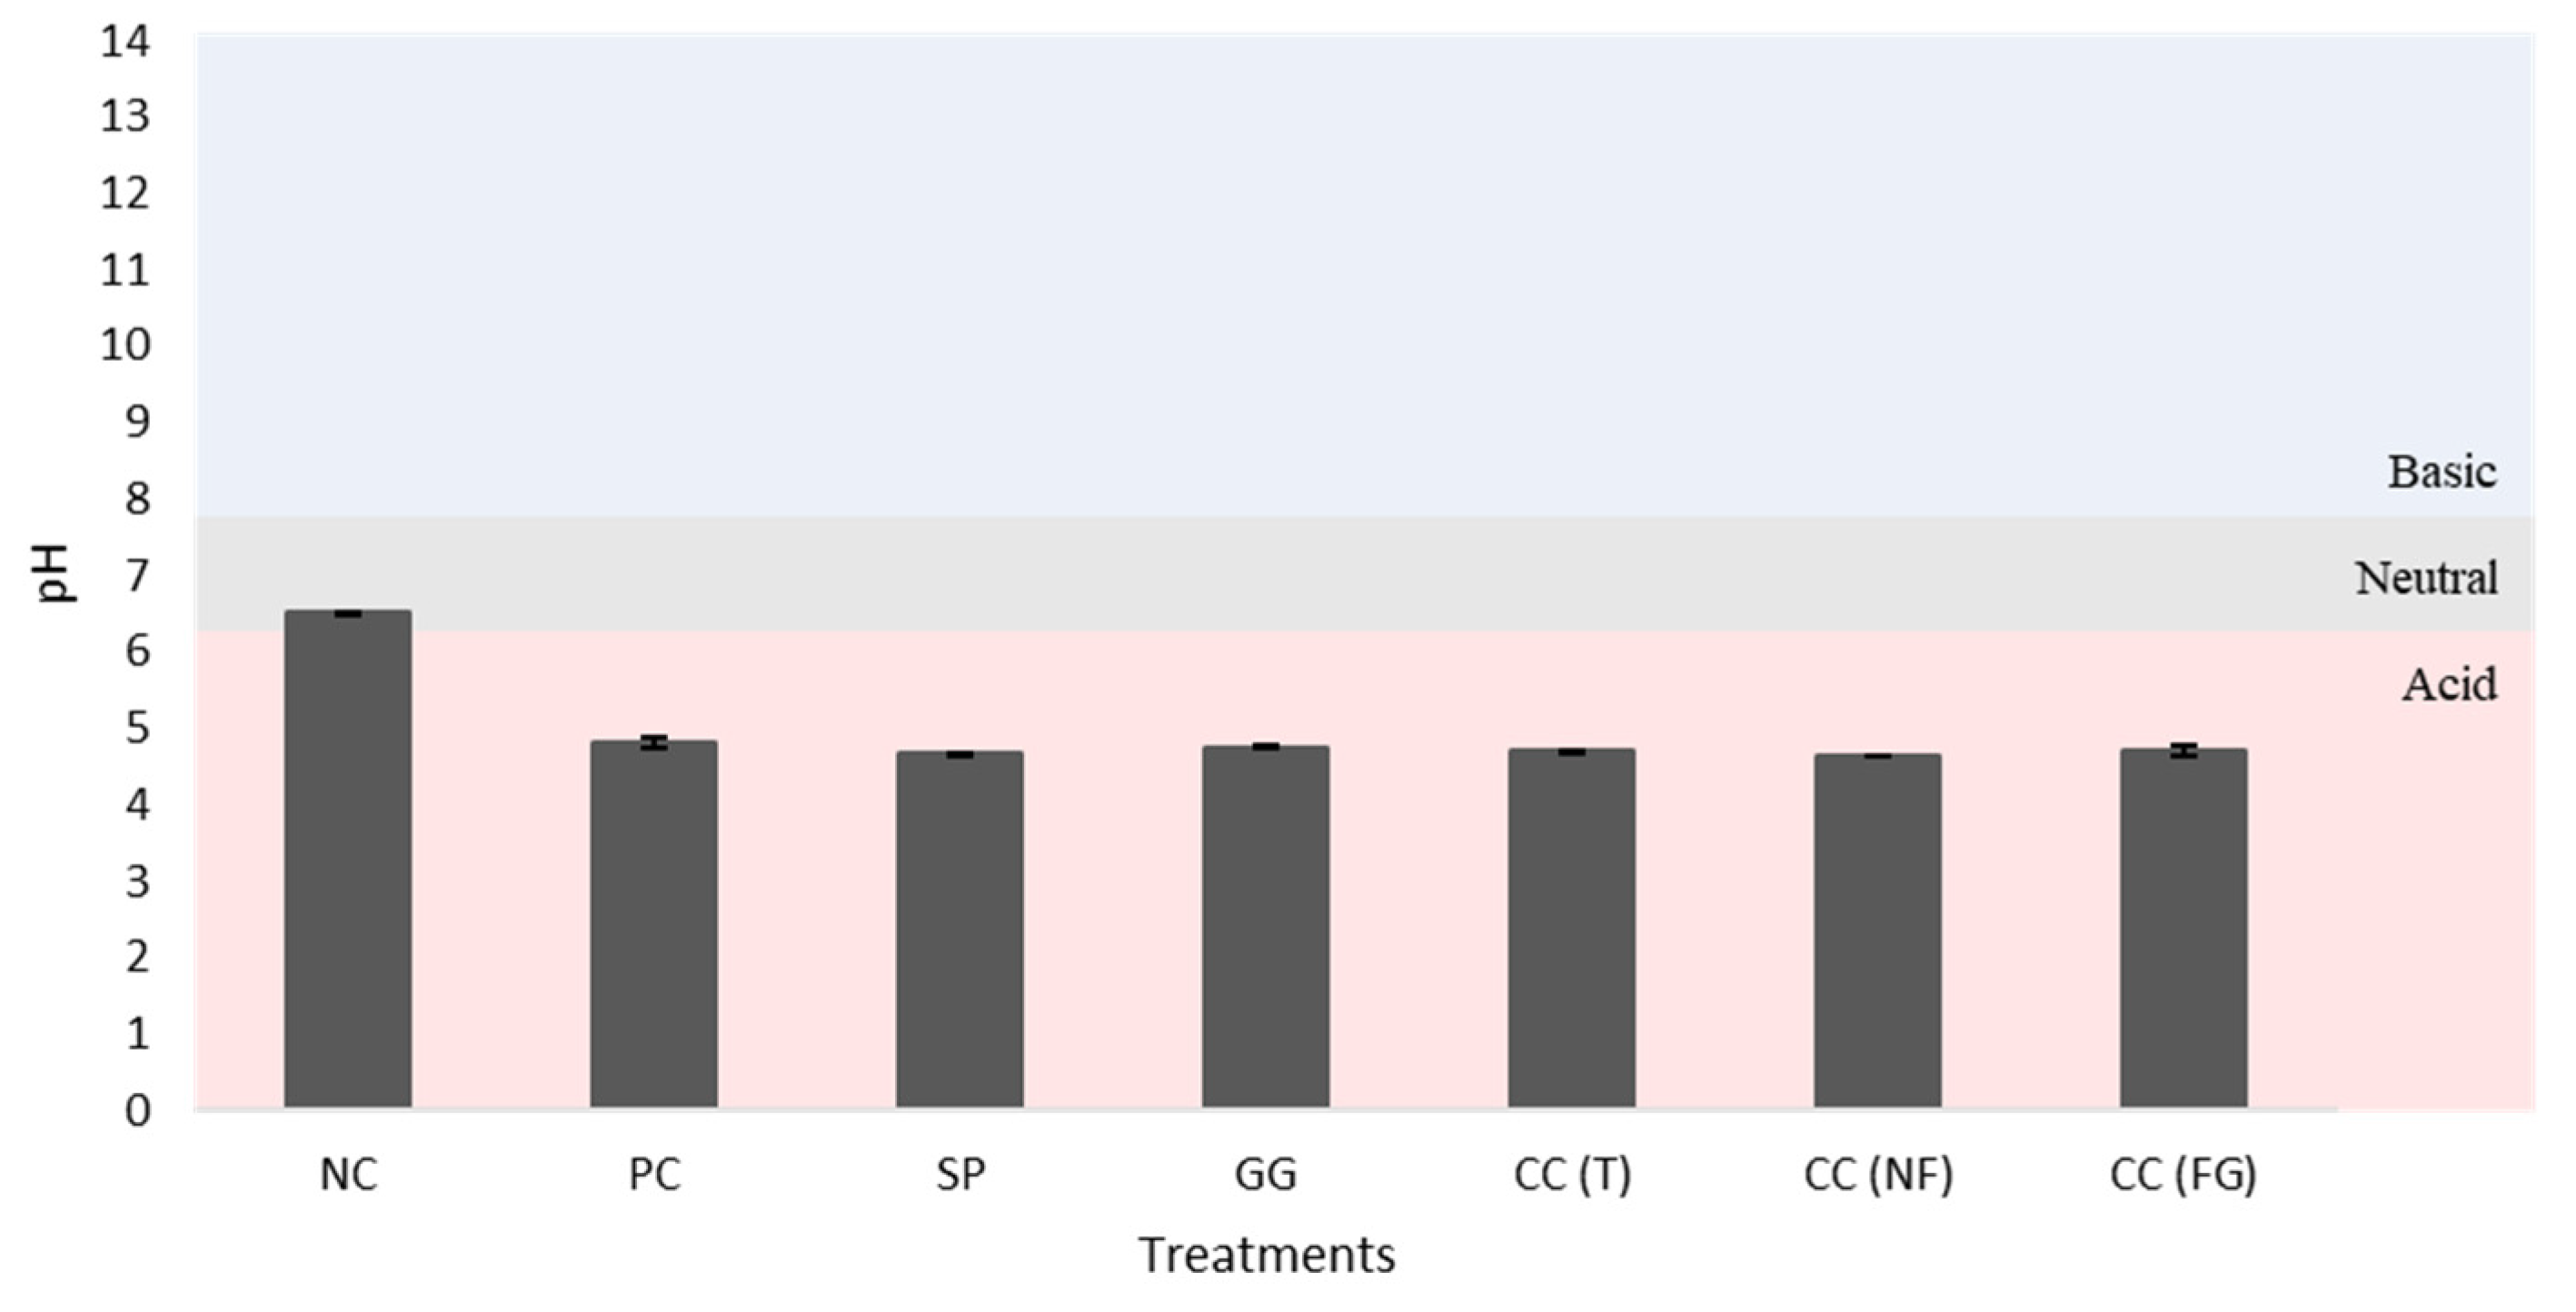
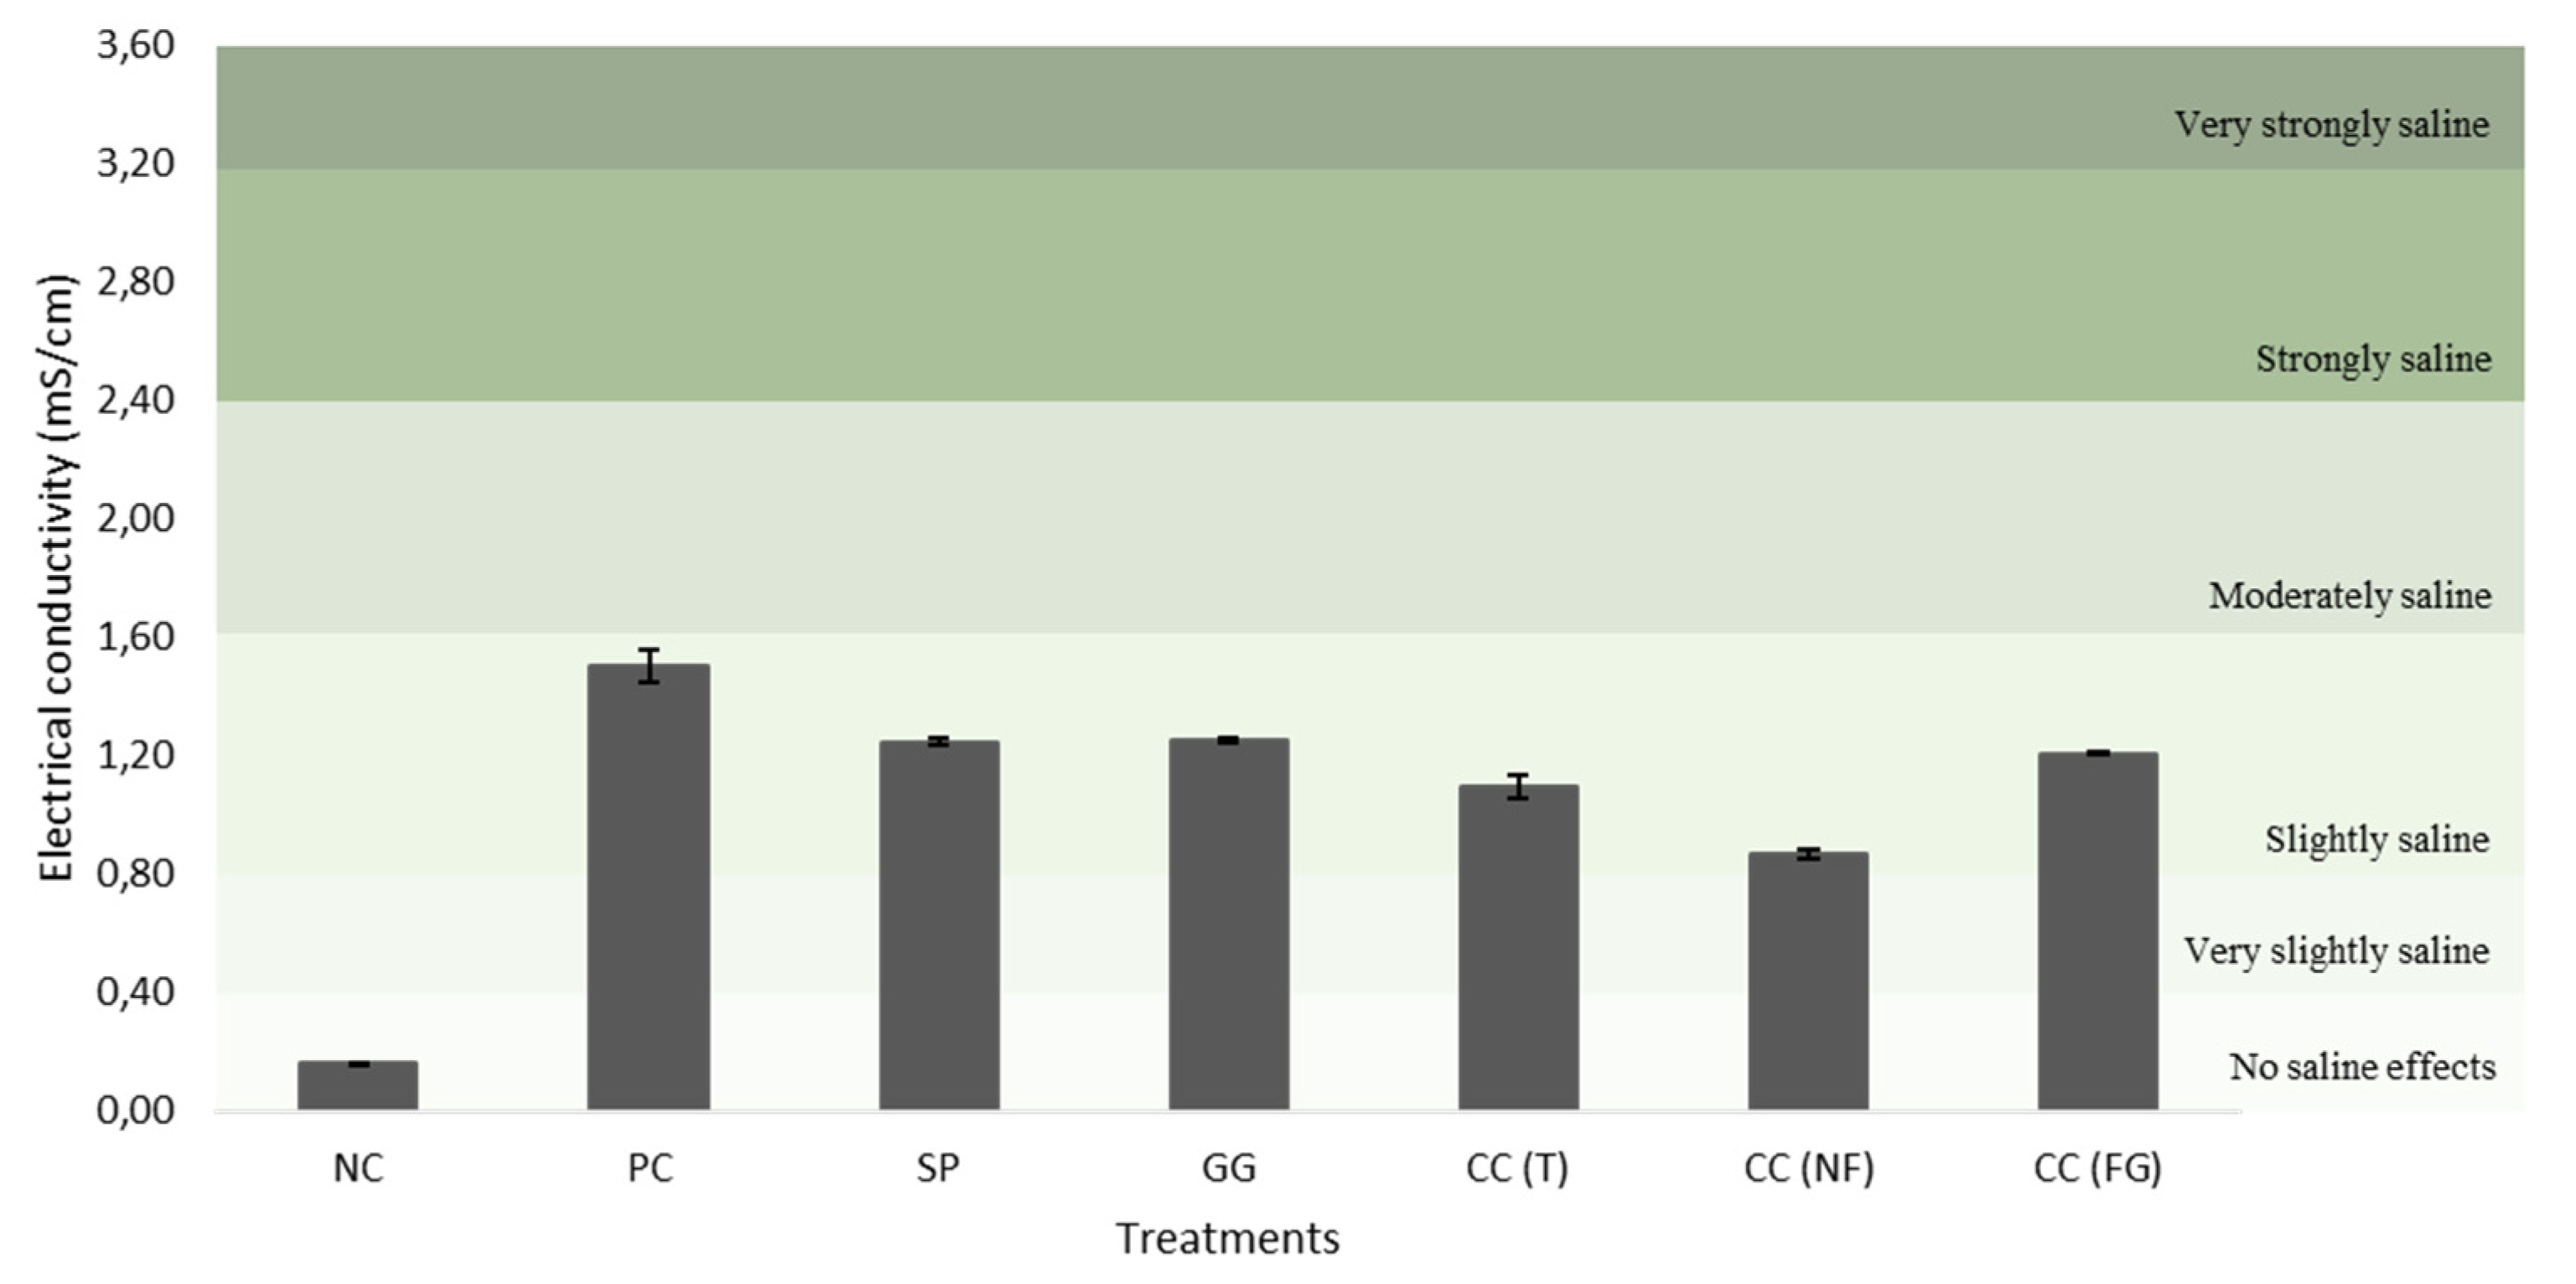
The initial substrate (negative control) and final substrates (after the treatments) used for turnip’ potting was analyzed (Table 8, Figure 10, Figure 11, Figure 12, Figure 13, Figure 14, Figure 15 and Figure 16). There were not found statistically significant differences among the treatment groups (p>0.05). Despite, there was observed a clear difference between the NC (initial substrate) and the final substrates. The NC had the highest OM content when compared with the substrates from the other treatments, with 34.97% (Table 8). Contrary, the substrate samples with the least OM content resulted from treatments with CC(FG) (23.53%) and the GG (23.52%). The substrate sample with the highest N content resulted from SP (0.44%) and the least N content was observed in CC(GF) (0.37%), CC(T) (0.35%) and CC(NF) (0.33%). When comparing the initial substrate (NC) with the final substrate of each treatment, there was a slightly decrease in the pH (Figure 10) but an increase in the EC values (Figure 11). The NC had a neutral pH (6.50) and the other substrates had more acidic pH. The EC of the NC had no saline effects, whereas the other substrates had slightly saline effects, with PC having the highest value (1.50 mS/cm).
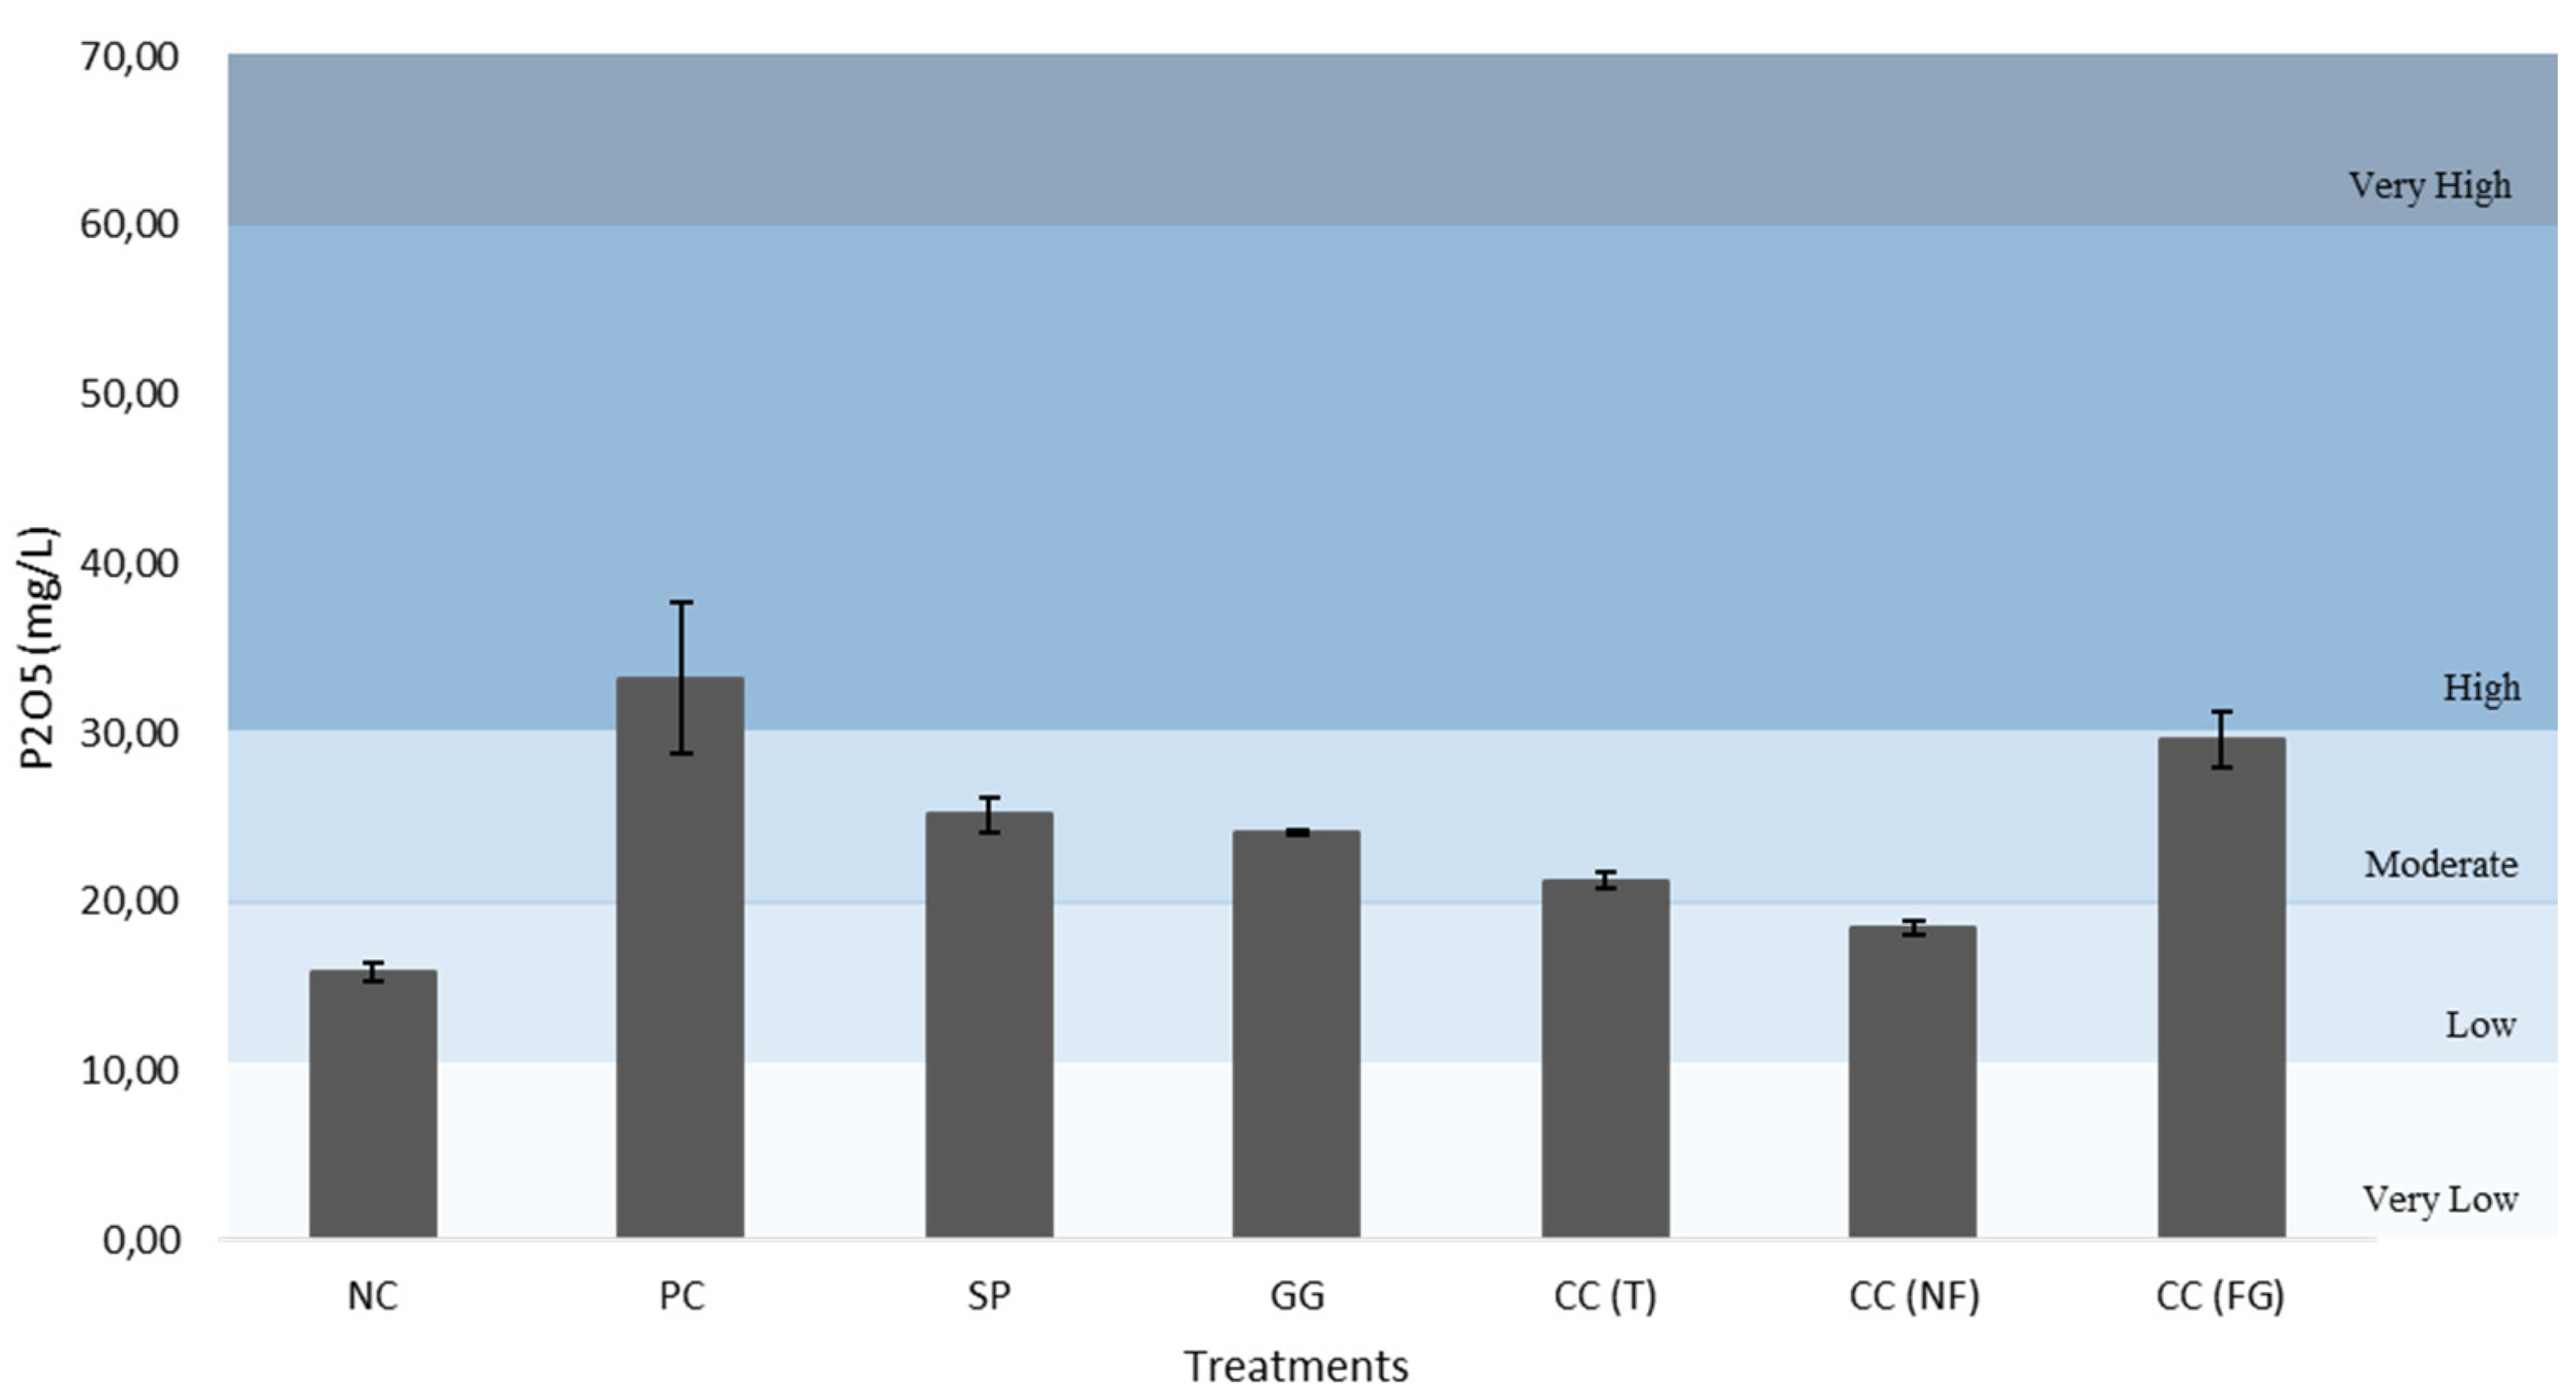
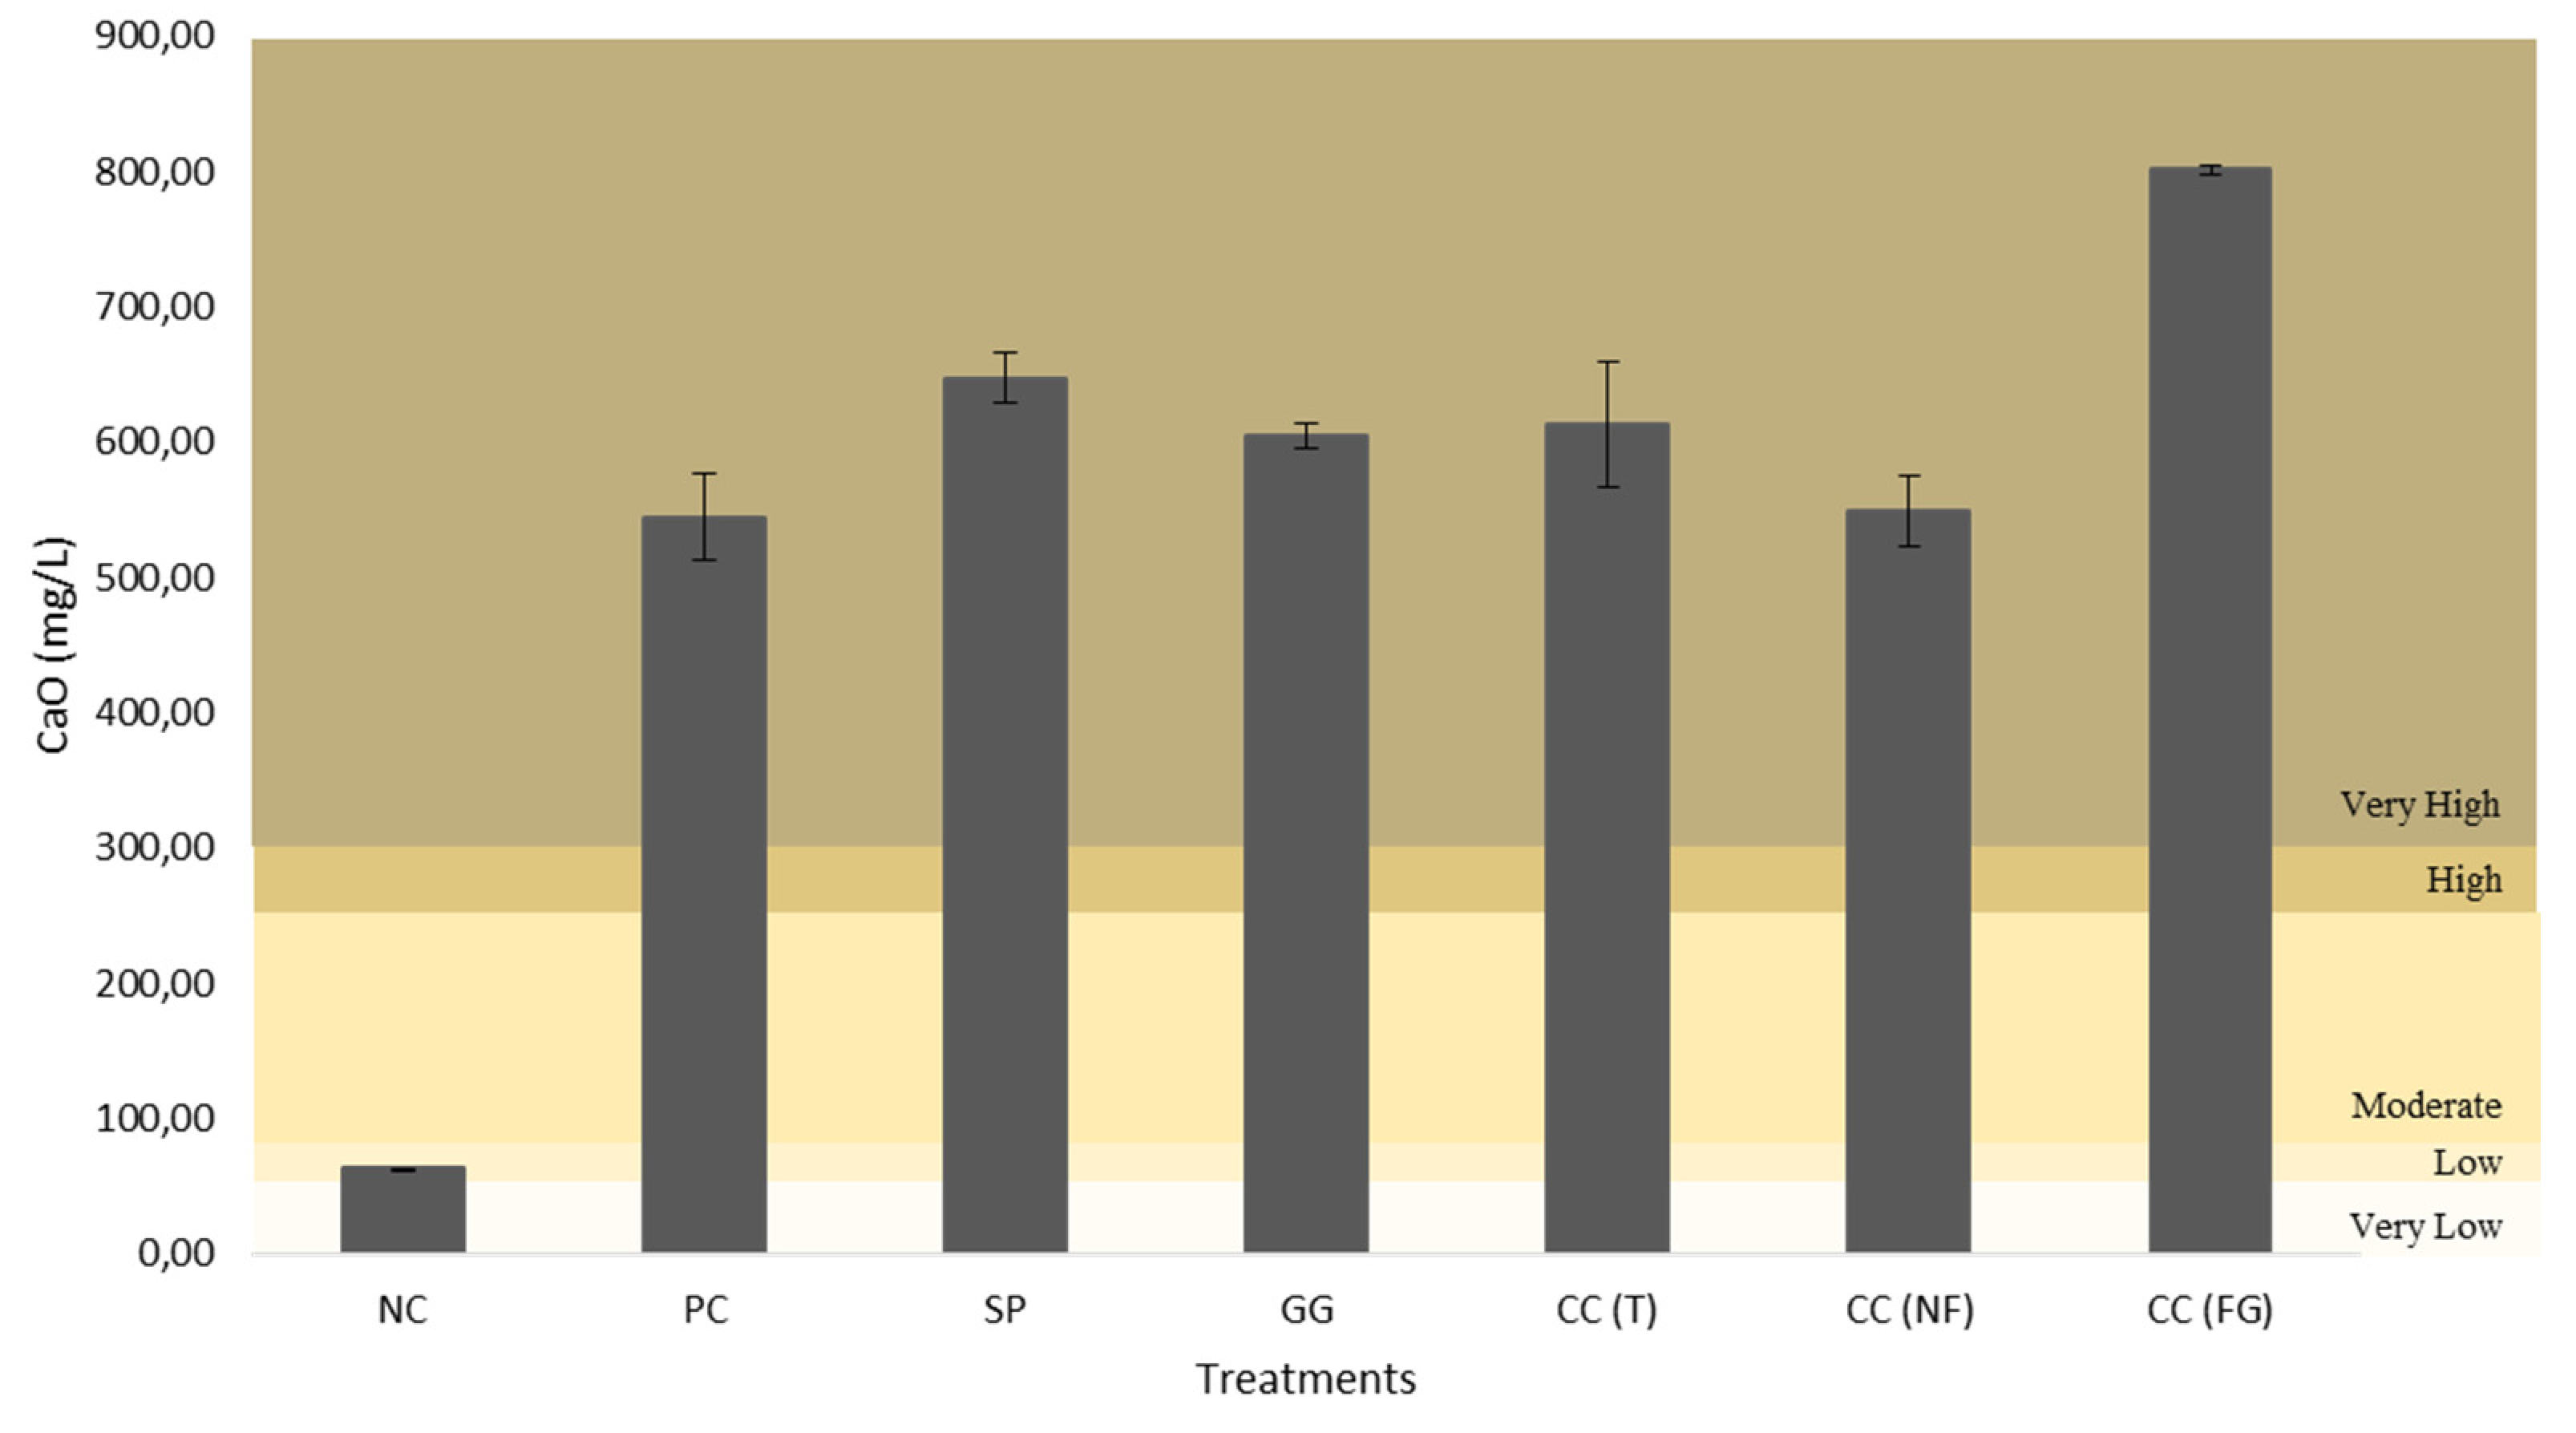
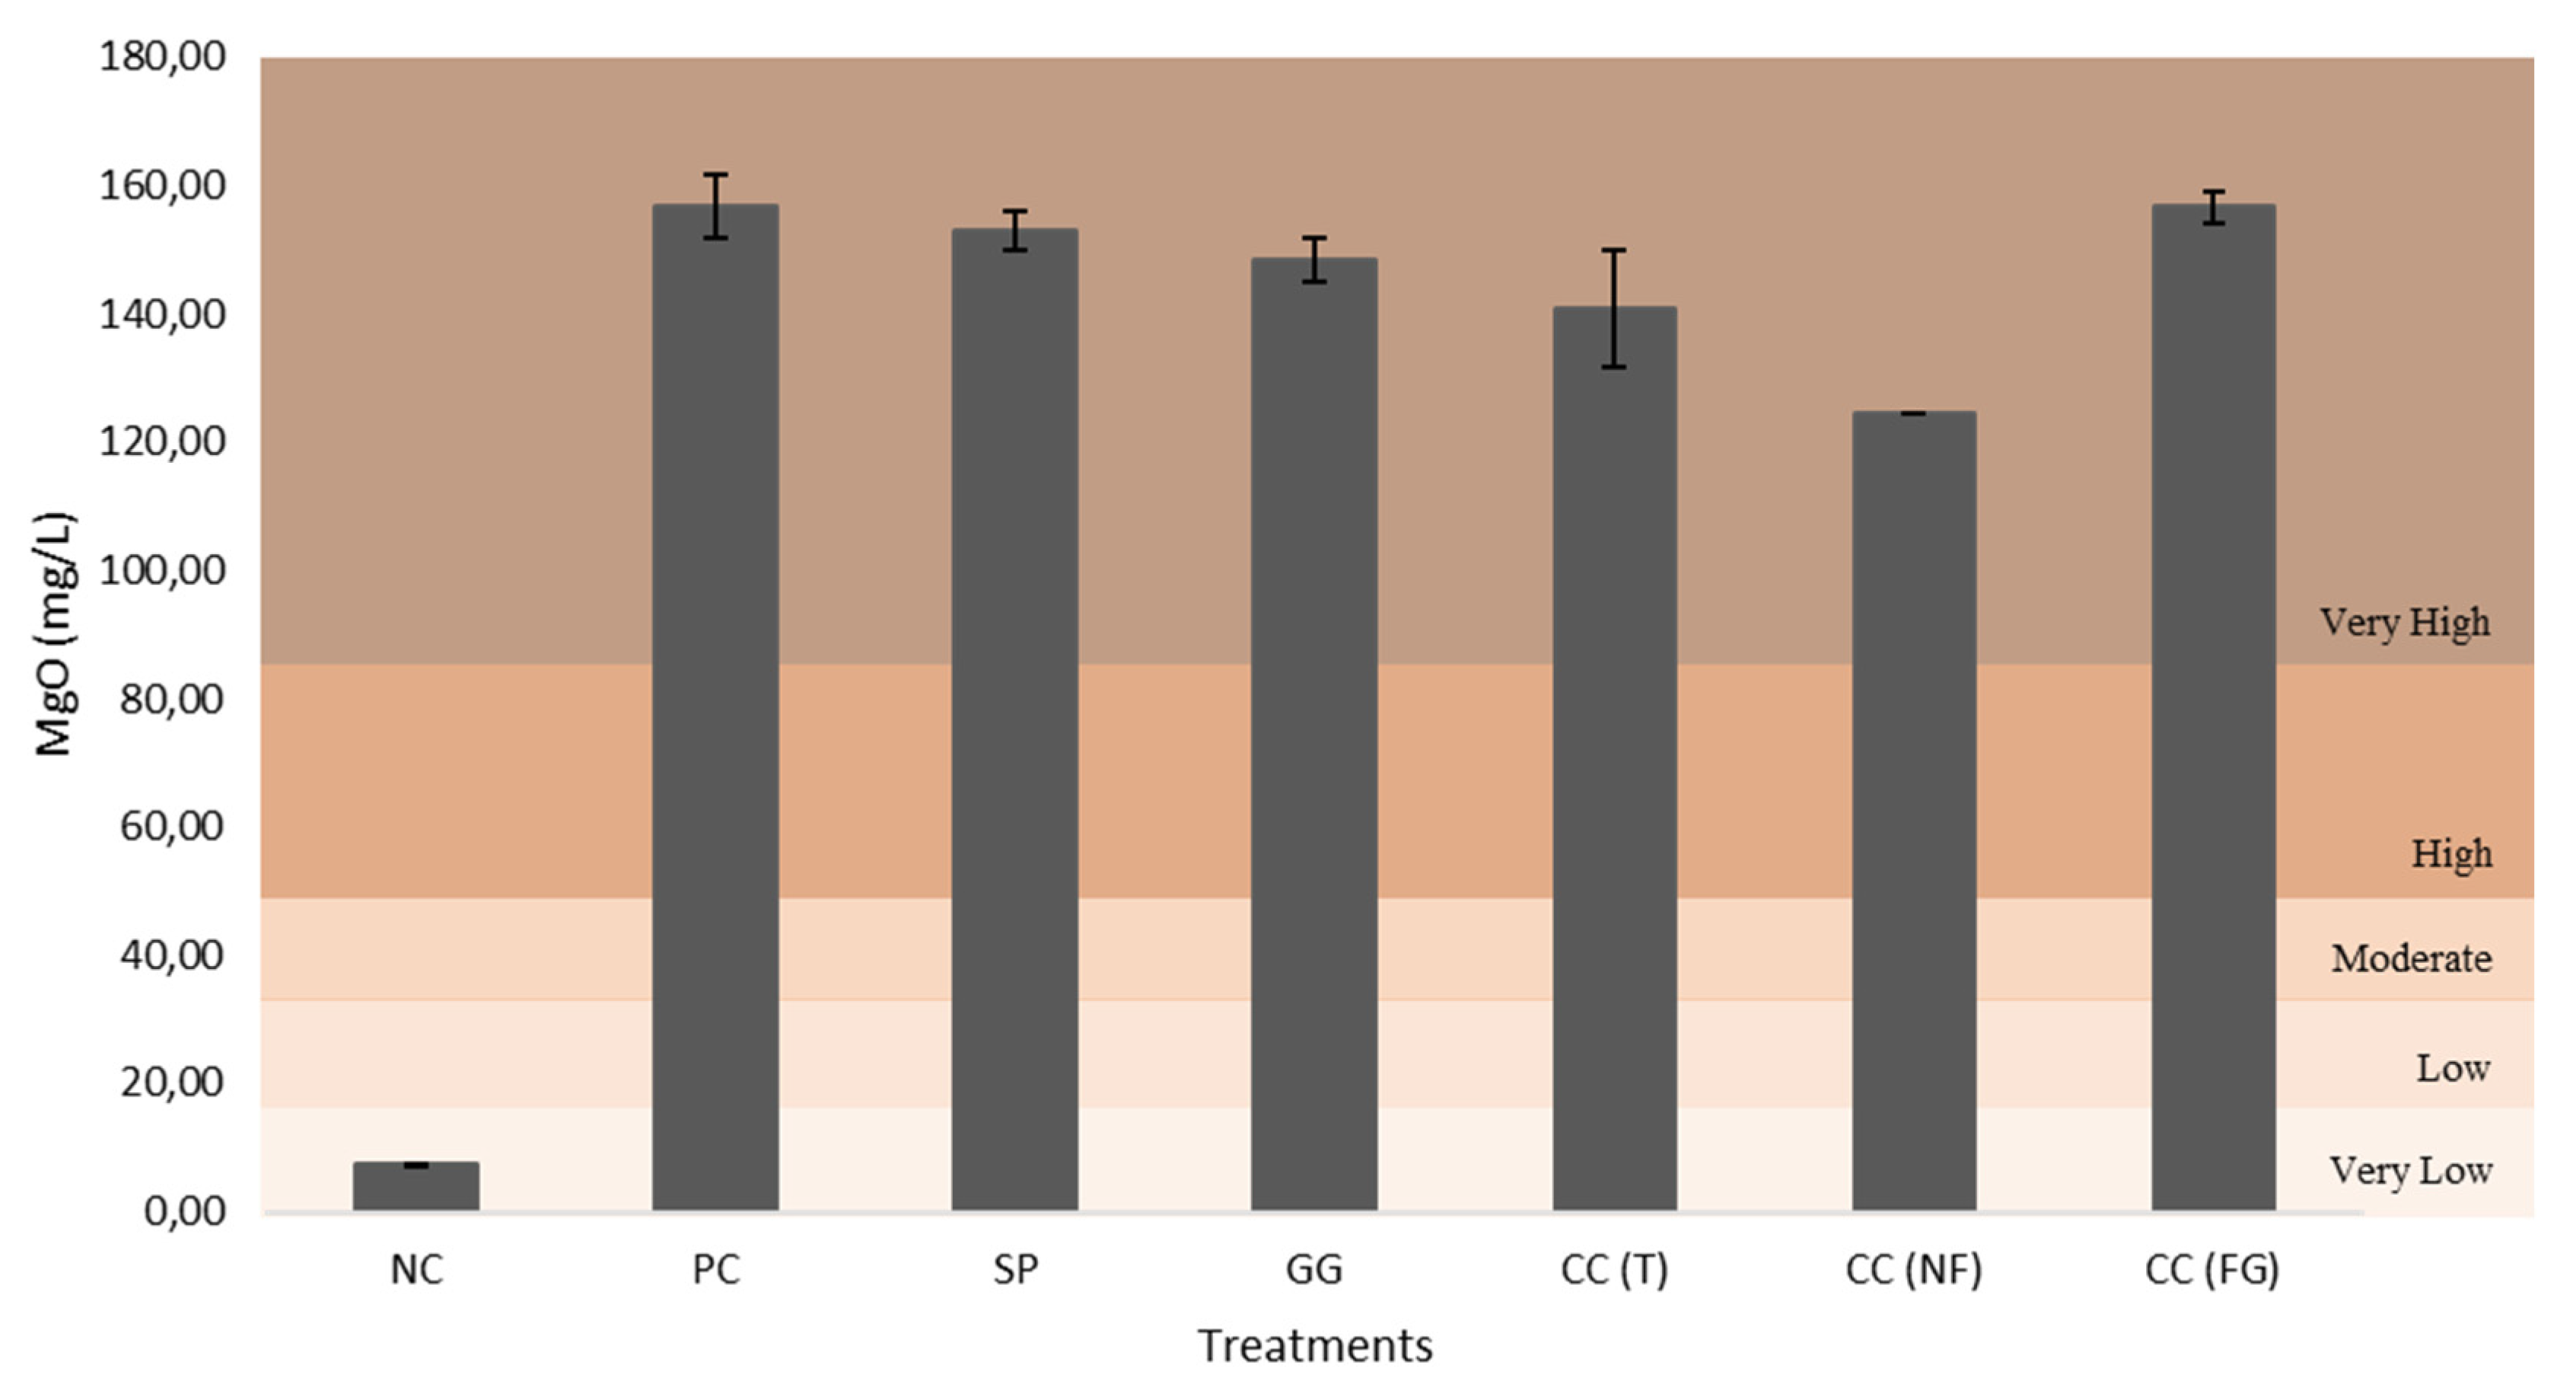
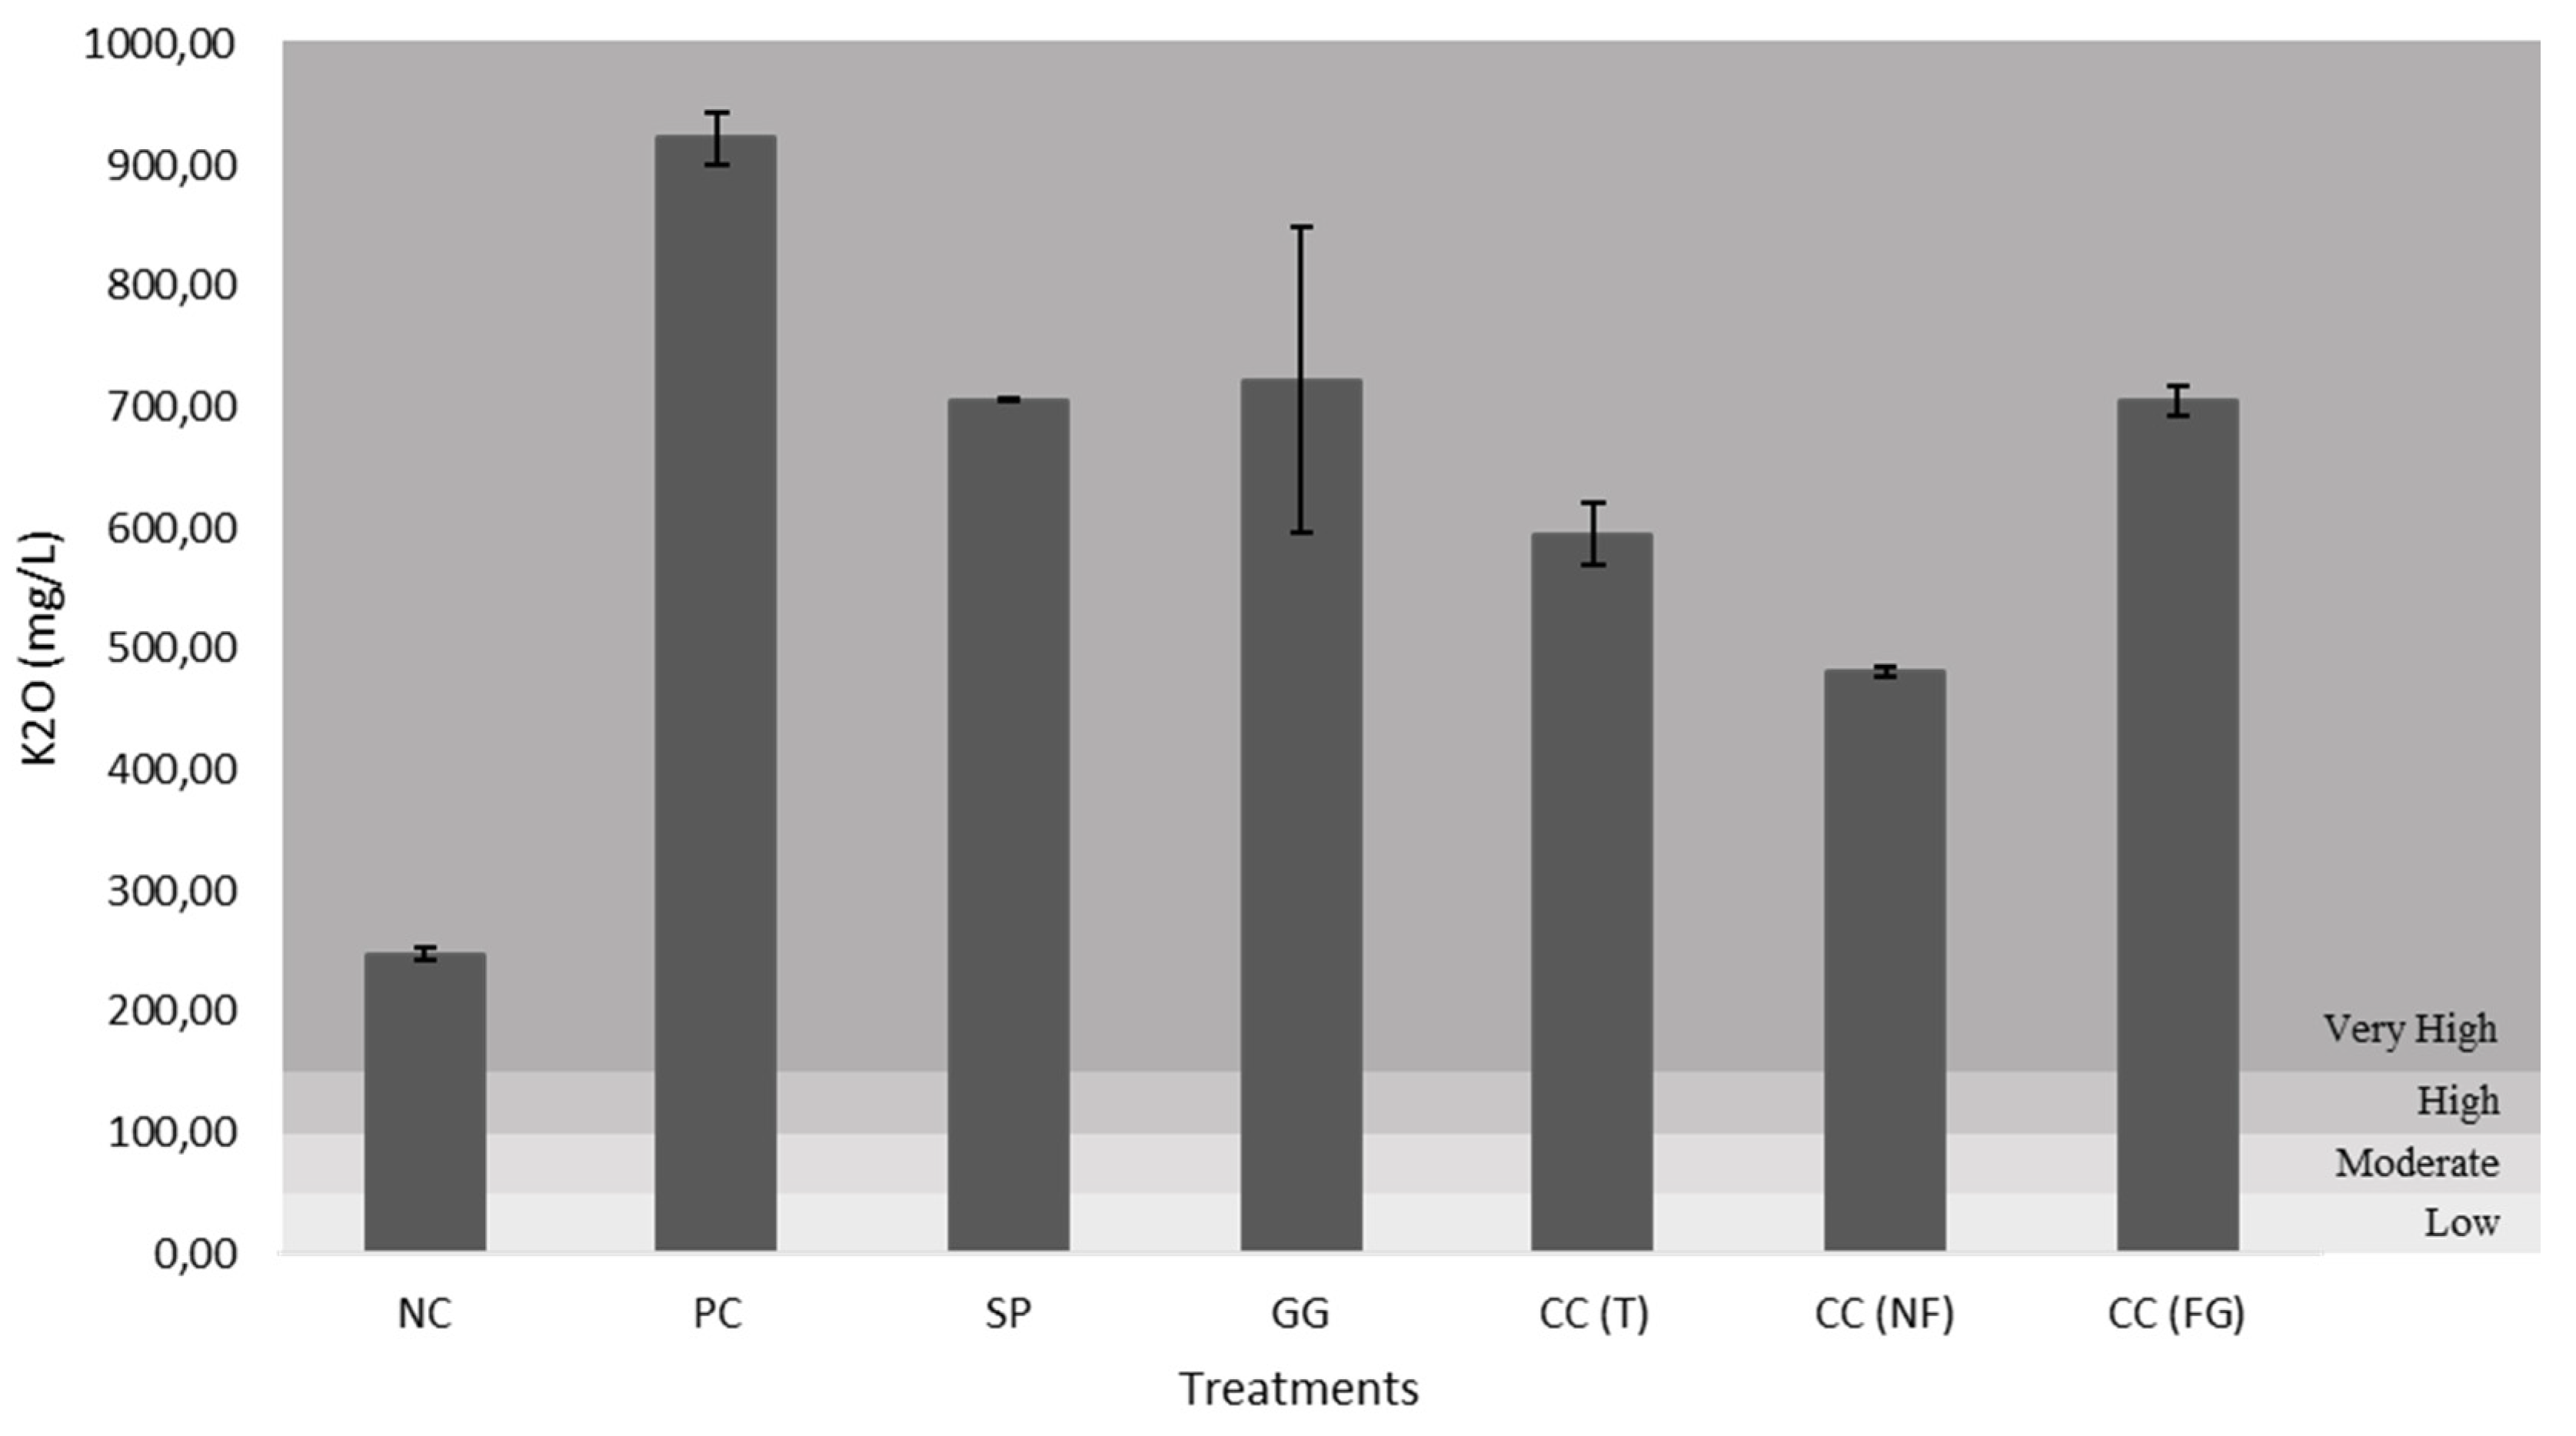
All figures (Figure 12–16) are divided in fertility classes (very low to very high) according to [46]. Regarding the P2O5 content, NC and CC(NF) demonstrated low levels, with 15.79 mg/L and 18.43 mg/L, respectively. The PC was the only one that exhibited high fertility levels, with 33.21 mg/L. Whereas, the other treatments presented moderate levels of soil fertility, with 25.13 mg/L for SP, 24.09 mg/L for GG, 21.23 mg/L for CC(T) and 29.60 mg/L for CC(FG). Considering the CaO and MgO content, all treatments exhibited very high levels, except the NC, with low and very low levels, 62.71 mg/L (CaO) and 7.25 mg/L (MgO). The CC(GF) showed the highest values for CaO (801.28 mg/L) and MgO (156.68 mg/L). Regarding K2O content, all treatments presented very high levels, from PC with 922.26 mg/L to NC, the least with 248.02 mg/L of K2O.

4. Discussion

In agriculture, the determination the right values of the pH and electrical conductivity (EC) of the biostimulants applied to a crop, can help the absorbance of the nutrients from these treatments in it, anticipating crop’s yield, quality and pathogen resistance [51]. The typical pH for an alginate in solution has values between 2.0 and 3.5 [52]. The pH of the carrageenan solutions is usually between 8 and 11 [53]. There is not any information published regarding the ideal pH for agar solutions. When compared to the other treatments, the positive control exhibited an increased EC (Table 2). This can be explained by the composition of the commercial leaf biofertilizer “Profertil” (ADP Fertilizantes, Portugal) that contains 20% (dry matter) of the seaweed A. nodosum. The most abundant elements in A. nodosum, are potassium, sodium and calcium [54]. These elements can increase the salinity of the solution, therefore, increase the EC.
Viscosity, determining the fluid's resistance to flow, is considered one of the most important physical properties used to assess the gelling capability of polysaccharides [55]. This property depends on the degree of polymerization, temperature, concentration, molecular weight and the presence of polyvalent metal cations in the polysaccharide structure [52]. According to EFSA (Panel on Food Additives and Nutrient Sources added to Food), the viscosity of alginate solutions can vary from 4 to 1000 mPa.s and the gelling capability can be affected when the solution has a pH lower than 4 [52], when viscosity increases sharply [56]. According to our results, as our alginate concentration was very low (0,5 below 4), there was a slight decrease in viscosity of the alginate solution (Table 2). Additionally, the viscosity of carrageenan solutions should range from 5 mPa.s to 800 mPa.s, but an ideal viscosity is less than 100 mPa.s, to maintain the desirable properties of the carrageenan [53,57]. There is no published data regarding the relation between pH, EC and viscosity of agar solutions. Agar viscosity is usually influenced by the temperature of the solution: at higher temperatures (>80 °C), agar-based solutions have lower viscosity and at lower temperatures (<50 °C), the viscosity increases [57]. In our case, the agar viscosity was measured at room temperature (20-22 °C), but the concentration of agar in the solution was very low to increase the viscosity as expected.
The polysaccharides’ structure, their biochemical characterization (mineral content) and their ideal solutions concentrations was analyzed prior to this study [34].
Polysaccharides, such as alginate, agar and carrageenan, act as elicitors to enhance plant’s metabolism and resistance against environmental stresses [58]. When polysaccharide-based solutions are sprayed on to the foliage, the plant’s cell wall reacts quickly to this interaction and binds with these molecules to induce local resistance. Usually, the plant’s pathogen- or pattern-recognition receptors (PRRs), recognize pathogen-associated molecular patterns (PAMPs), or in the case of non-pathogen related molecules, microbe-associated molecular patterns (MAMPs), which is more common in agricultural practices [58,59]. This recognition triggers a complex chain of defense responses called PAMP-triggered immunity, pathogen-triggered immunity, or pattern-triggered immunity (PTI) [58,59]. In plants, these defense mechanisms are the first line of local defense against biotic and abiotic stresses, restraining, for example, pathogen activity, uninfluenced by the chemical pesticide applications. This defense response can also trigger an induced systemic resistance (ISR) or systemic acquired resistance (SAR), making the plant less susceptible to a subsequent pathogen attack [58]. In this study, the activity of SAR was clearly observed when the turnip plants treated with the polysaccharide’s solutions showed signs of possible inhibitory effects against a pathogen (e.g., Agrotis ssp. larvae) more than in the controls (Figure 4). Agrotis is a genus of moths from the Noctuidae family, that usually attack turnip plants. Larvae remains hidden during the day and emerges at night to feed, becoming a major brassica pest [60]. Thus, polysaccharides’ solutions, used in this work, can have an indirect inhibitory effect against this pathogen.
As seen in other studies [61], during this resistance process, the plant can have a biochemical response related with the production of phytoalexins and pathogenesis-related (PR) enzymes, such as phenylalanine ammonia-lyase (PAL), peroxidase (POD) and ascorbate peroxidase (AP), by signaling pathways mediated by salicylic acid (SA), jasmonic acid (JA), and ethylene (ET) [62]. This reaction elicits the plant’s metabolic pathways and the synthesis of secondary metabolites, like phenolic compounds. These biochemical responses trigger other morphological responses, related with nutrient uptake and consequently, growth and development.
In this study, the turnip plants demonstrated clear differences in growth parameters among the treatments. The turnip plants treated with the polysaccharide-based solutions exhibited the best results in both leaf weight and length, when compared to the negative (tap water) and positive controls (“Profertil”). Plants that presented the best results were the ones treated with carrageenan from C. crispus, particularly the tetrasporophyte generation, with higher ratio aerial part weight vs length.
Ratios observed made an association between the development of the plant aerial part and the roots. A lower aerial part weight vs root weight indicated that the turnip plants had spent more energy on root biomass growth than aerial part, and opposite, greater ratio indicated that the plants had spent more energy on leaves biomass (Figure 5e–g). The least aerial part length: root length ratio was observed in the negative and positive controls (Figure 5a,b), and the highest in SP and GG (Figure 5c,d). As demonstrated in Figure 5, roots from plants treated with polysaccharides-based solutions (Figure 5c–g), were more robust than the ones obtained from the control treatments (Figure 5a,b). However, despite these ratios, major root biomass development (observed in NC and PC), does not developed, better root system and more efficient nutrient absorption from the soil.
A developed root system influenced the plant nutrient uptake. Plant roots absorb nutrients from the soil and transport them throughout the plant to support life activities. To maintain their growth and development, plants need substantial quantities of macro and micro-nutrients. Lack of nutrients in a soil can result in leaf chlorosis, reduced plant development, and even plant death. However, the excess of nutrients in the soil can also have harmful effects on plants, affecting the plant nutrient uptake, resulting in oxidative stress, cell damage, and growth inhibition [63]. Plants require 16 essential elements to survive, such as carbon (C), hydrogen (H), oxygen (O), nitrogen (N), phosphorus (P), potassium (K), calcium (Ca), magnesium (Mg), sulfur (S); and trace elements, such as iron (Fe), zinc (Zn), manganese (Mn), copper (Cu), boron (B), molybdenum (Mo), and chlorine (Cl). These elements can be supplied directly from the soil or by organic or inorganic fertilizers [64]. The mineral profile of the turnip from each treatment was compared with the reference values of [37] for safety and quality standard of turnip greens for human consumption in Portugal (Table 4). The differences between the treatment groups and the literature values can be also related to genetic differences and environmental factors. The mineral and trace element contents of each treatment can affect the dry matter percentage and ashes. Low ash content usually indicates that the plant is denser, therefore this should be taken into consideration when analyzing the mineral percentage [64]. For instance, N improves the quality and quantity of dry matter in leafy vegetables, such as turnip [64]. Amino acids, building blocks of proteins, are created when N is joined to C, H, O, and S. Therefore, there is a direct correlation between the protein content and the nitrogen content. N is required for all enzymatic processes in plants and for photosynthesis [64].
The NC turnip plants exhibited the highest values of ashes, protein, mineral and trace elements (Table 4). These plants presented the worst results in growth (leaf weight and length) and were easily “consumed” by the Agrotis sp. larvae. In this case, plants were prevented to absorb the mineral resources and apply in metabolic processes such as photosynthesis, enzymatic activity, cell division, root development, and a defense response. This behavior could also indicate a survival mechanism since this NC turnip plants needed to maintain their mineral content and not spend too much energy in metabolic processes and to survive abiotic and biotic stresses. On other hand, the turnips treated with the polysaccharides did not exhibit growth deficiencies and none was damaged by the Agrotis sp. Additionally, these plants presented very similar mineral content compared with the published standards for human consumption in Portugal (Table 4), which indicates that these solutions are not toxic and can even improve the nutritional quality of turnip greens.
In addition to mineral and trace element characterization, analyzing the cell wall and its components, can help us to understand and characterize the effects that treatments had on the turnip plants, as plant cell wall has a big role on plant metabolic processes. FTIR-ATR has been used for fast cell wall characterization [65], however, due to the complexity and variability of the cell wall composition, it is not always possible to assign exactly each FTIR-ATR band to its respective functional chemical group or compound. Comparing the obtained spectra with bibliographic supported data [65] and contrary to other samples, the NC was the only one to exhibit a peak in the lignin and phenolic backbone area at 1520 cm-1. Numerous studies have reported a variation in the quantity of lignin and other polyphenols when plants were under stressed environment [66]. Polyphenols are produced as result of SAR activation in plants. They play a crucial role in plant–environmental interactions and can indicate when a certain plant has been exposed to biotic stress, which was the case of the turnips from the negative control.
FTIR analysis is relevant to understand how the polysaccharide-based solutions affected the turnip plants in a metabolic and molecular level [63]. If we compare the FTIR-ATR similarity rate between the samples treated with polysaccharide solutions and the negative or positive control, it corroborates all the previous results (biochemical characterization) with numbers. For example, when comparing the different samples to the negative control, we get: CC(FG) with 118,660 % (most similar but with higher content, most nutritious); CC(NF) with 110,220 %; CC(T) with 87,218 % (less similar); GG with 94,983 %; SP: 92,348 %. When comparing the different samples to the positive control, we get: CC(FG) with 136,430 %; CC(NF) with 126,570 %; CC(T) with 100,170 %; GG with 109,210 %; SP with 105,970 %.
Apart from the mineral and cell wall characterization of the turnip plants, the detection and quantification of their pigments is a crucial step in further understanding the effects of the treatment groups in these plants during the experiment, especially in photosynthetic activity. Overall, the Rf values observed in all treatments were greater than the Rf values found in the literature (Table 6), except in the case of neoxanthin and β-carotene. This difference could be related to oxidation of the pigments, the type of silica plate used, the eluent, the plant species, and the quantity of the solution applied to the TLC [41]. The absence of pigment marked as “10” in the C. crispus’ TLC (Figure 9) could be explained by the pigment entrainment in the end of the silica plate, not allowing to differentiate the pigments clearly. Overall, the turnip plants treated with the carrageenans extracted from C. crispus exhibited the greatest pigment content among all treatments. The increase in pigments, such as chlorophyll, can indicate an increase in photosynthetic activity, and consequently, an increase in plant growth and development (Figure 6). This means that plant carbohydrate production boost could be related with the application of carrageenans from C. crispus, in early growth stages of the plants.
Soil/substrate is an extremely complex and important ecosystem that directly influences plants’ growth and development. The soil density (Ds) could be influenced by several physical and chemical properties, such as soil organic matter, texture, minerals, and porosity. This information is essential for soil management and the application of the best farming technics on it [67]. The Ds of all samples had very high standard deviation (Table 8), which could be explained by the variation of porosity in the substrate, since its property was very difficult to control in the experiment. In addition, organic matter (OM) and nitrogen (N) content had big influence on plant’s growth. Soils with high content of OM and N usually enhance the photosynthetic processes and consequently the plant development [68]. However, availability of OM and N in the substrate does not imply their absorption by the plant’s roots and their use in plant’s photosynthesis. As shown in our results the turnips from the negative control, with the highest OM and N content in the substrate, did not take any advantage from them for their growth.
The EC is directly related with salinity of the solution, so it was expected a coincidence between it (Figure 11) and the sodium quantity in the substrates (Figure 12). Increased soil salinity can have a negative effect on the plant’s development [69]. Hence, the moderate sodium content of the substrate samples in the treatments was ideal for the turnip plants’ productivity (Figure 12). For a soil/substrate to be considered fertile, it must have enough levels of various nutrients, such as N, P, K, Ca, and Mg, that may restrict plant development, as well as enough organic matter to hold onto water and nutrients. Low concentrations of one or more of these nutrients might lower plant production [70]. When comparing the initial substrate (negative control) with the final substrates (after the treatments), all soil samples with treated turnip plants, exhibited very high fertility levels, contrary to the initial substrate (Figure 13, Figure 14, Figure 15 and Figure 16). In fact, the polysaccharide-based solutions, applied to the aerial part of the turnip plants, increased the soil fertility. Some studies [70] have reported that the improvement of the plant’s metabolism and development can influence the soil quality by positive feedback (when the plant exhibits an increase in nutrient content and growth, the soil usually becomes more fertile). When the plant tissue decomposes, its biomass nutrient content is returned to the soil/substrate, increasing like that a soil fertility. The increase uptake of soil minerals, especially hydrogen and nitrogen (essential for the nitrogen cycle) by enhancing the metabolism of the turnip plants can influence the soil pH, turning it more acid, despite the neutral pH of the polysaccharide’s solutions applied to the plants (e.g., carrageenan from C. crispus) [66].
The application of polysaccharide-based solutions to turnip plants was very efficient improving plant growth, biomass and root system, enhanced photosynthetic activity, essential nutrient uptake and soil quality, when compared to the PC and NC. Turnip plants treated with the carrageenan from C. crispus presented the best results in improved crop’s productivity than in plants treated with alginate (S. polyschides) and agar (G. gracilis). This was particularly noticeable in turnip plants treated with CC(T). The type of carrageenan extracted from this generation of C. crispus is λ-carrageenan, which is usually more sulphated (32-39% of sulphate group) than κ- carrageenan (20-30% of sulphate group) and ι-carrageenan (28-35% of sulphate group), is a hybrid type of carrageenan extracted from the non-fructified thalli and female gametophyte of C. crispus [71,72]. The degree of sulphation can directly influence the bioactivity of the polysaccharides. Typically, alginophytes, such as S. polyschides, show the lowest sulphate group content, whereas carrageenophytes, the highest [23], which was supported by this study. λ-carrageenan was the polysaccharide that had the most bioactivity and positive effect in turnip plants.
There are many different sulphated compounds present in plants that play a major role in their metabolic processes, influencing the plant’s development and its stress responses [73]. For example, glucosinolates is a group of sulfated secondary metabolites limited to the order Capparales, including the Brassicaceae family, that are responsible for their protection against pathogens by inducing defense pathways [74]. The relation between the polysaccharides’ sulphation degree and the bioactivities observed in this study could be in some way related to the interaction of sulphate groups and the plant’s metabolism, by enhancing the sulfur content in turnip plants and triggering the activity of SAR [75].

5. Conclusions

In a planet with increased demand for new and greener alternatives for the agricultural practices, seaweed based-biostimulants gain an important role as non-synthetic fertilizers. Seaweed based-biostimulants can potentially substitute the synthetic compounds present in commercial stimulants and fertilizers, used in agriculture to improve crop yield and vigor. As an advantage, seaweeds do not compete for land space, which allows the exploration of polysaccharides in a sustainable and circular economy way.
In our study, application of polysaccharide-based solutions to turnip plants was very efficient in improving their growth, increase the plant’s biomass and root system, enhance photosynthetic activity, essential nutrient uptake and soil quality, and plant pathogen resistance, when compared to a commercial seaweed leaf biofertilizer (“Profertil”). Altogether, the turnip plants treated with the carrageenan from C. crispus presented the best results in improving the crop’s productivity than the alginate (S. polyschides) and agar (G. gracilis). This was particularly noticeable in turnip plants treated with the carrageenan from C. crispus (tetrasporophyte) where λ-carrageenan was the polysaccharide that had the major bioactivity and positive effect improving turnip plant growth, biomass and root system, enriching the photosynthetic pigments and nutrients, and soil nutrient uptake. Therefore, to use the polysaccharides from C. crispus seaweeds from different life cycle generations (which synthesize different types of carrageenan), and use them in plant growth and development, could be extremely beneficial for the future of sustainable agriculture.
In the future, the bioinsecticide potential of the seaweed polysaccharides explored in this study should be further analyzed. More study should be done to understand, the whole potential, that seaweed polysaccharides can have for the agriculture.

Author Contributions

Conceptualization, M.M., J.C., K.B. and L.P.; Review methodology, M.M., J.C., K.B. and L.P.; validation, K.B. and L.P.; writing-original draft preparation, M.M.; writing-review and editing, M.M., J.C., K.B. and L.P.; supervision, K.B. and L.P. All authors have read and agreed to the published version of the manuscript.

Institutional Review Board Statement

Not applicable.

Informed Consent Statement

Not applicable.

Data Availability Statement

Data available from the authors.

Conflicts of Interest

The authors declare no conflict of interest.

References

  1. Silva, L.D.; Bahcevandziev, K.; Pereira, L. Production of Bio-Fertilizer from Ascophyllum nodosum and Sargassum muticum (Phaeophyceae). J. Ocean. Limnol. 2019, 37, 918–927. [Google Scholar] [CrossRef]
  2. Sousa, T.; Cotas, J.; Bahcevandziev, K.; Pereira, L. Effects of “Sargaço” Extraction Residues on Seed Germination. Millenium 2020, 2, 27–29. [Google Scholar] [CrossRef]
  3. Vijay Anand, K.G.; Eswaran, K.; Ghosh, A. Life Cycle Impact Assessment of a Seaweed Product Obtained from Gracilaria edulis – A Potent Plant Biostimulant. J. Clean. Prod. 2018, 170, 1621–1627. [Google Scholar] [CrossRef]
  4. Hernández Carmona, G. Seaweed as Potential Plant Growth Stimulants for Agriculture in Mexico. Hidrobiológica 2018, 28, 129–140. [Google Scholar] [CrossRef]
  5. Khan, W.; Rayirath, U.P.; Subramanian, S.; Jithesh, M.N.; Rayorath, P.; Hodges, D.M.; Critchley, A.T.; Craigie, J.S.; Norrie, J.; Prithiviraj, B. Seaweed Extracts as Biostimulants of Plant Growth and Development. J. Plant Growth Regul. 2009, 28, 386–399. [Google Scholar] [CrossRef]
  6. Hernández-Herrera, R.M.; Santacruz-Ruvalcaba, F.; Zañudo-Hernández, J.; Hernández-Carmona, G. Activity of Seaweed Extracts and Polysaccharide-Enriched Extracts from Ulva lactuca and Padina gymnospora as Growth Promoters of Tomato and Mung Bean Plants. J. Appl. Phycol. 2016, 28, 2549–2560. [Google Scholar] [CrossRef]
  7. Di Filippo-Herrera, D.A.; Muñoz-Ochoa, M.; Hernández-Herrera, R.M.; Hernández-Carmona, G. Biostimulant Activity of Individual and Blended Seaweed Extracts on the Germination and Growth of the Mung Bean. J. Appl. Phycol. 2019, 31, 2025–2037. [Google Scholar] [CrossRef]
  8. Nilsun, D.; Berrin, D.; Kevser, Y. Effect of Seaweed Suspensions on Seed Germination of Tomato, Pepper and Aubergine. J. Biol. Sci. 2006, 6, 1130–1133. [Google Scholar] [CrossRef]
  9. Mishra, A.; Sahni, S.; Kumar, S.; Prasad, B.D. Seaweed - An Eco-Friendly Alternative of Agrochemicals in Sustainable Agriculture. Curr. J. Appl. Sci. Technol. 2020, 71–78. [Google Scholar] [CrossRef]
  10. Nanda, S.; Kumar, G.; Hussain, S. Utilization of Seaweed-Based Biostimulants in Improving Plant and Soil Health: Current Updates and Future Prospective. Int. J. Environ. Sci. Technol. 2022, 19, 12839–12852. [Google Scholar] [CrossRef]
  11. Ali, O.; Ramsubhag, A.; Jayaraman, J. Phytoelicitor Activity of Sargassum vulgare and Acanthophora spicifera Extracts and Their Prospects for Use in Vegetable Crops for Sustainable Crop Production. J. Appl. Phycol. 2021, 33, 639–651. [Google Scholar] [CrossRef]
  12. Rayorath, P.; Jithesh, M.N.; Farid, A.; Khan, W.; Palanisamy, R.; Hankins, S.D.; Critchley, A.T.; Prithiviraj, B. Rapid Bioassays to Evaluate the Plant Growth Promoting Activity of Ascophyllum nodosum (L.) Le Jol. Using a Model Plant, Arabidopsis thaliana (L.) Heynh. J. Appl. Phycol. 2008, 20, 423–429. [Google Scholar] [CrossRef]
  13. Craigie, J.S. Seaweed Extract Stimuli in Plant Science and Agriculture. J. Appl. Phycol. 2011, 23, 371–393. [Google Scholar] [CrossRef]
  14. Crouch, I.J.; Beckett, R.P.; Van Staden, J. Effect of Seaweed Concentrate on the Growth and Mineral Nutrition of Nutrient-Stressed Lettuce; 1990; Vol. 2. [CrossRef]
  15. Vera, J.; Castro, J.; Gonzalez, A.; Moenne, A. Seaweed Polysaccharides and Derived Oligosaccharides Stimulate Defense Responses and Protection against Pathogens in Plants. Mar. Drugs 2011, 9, 2514–2525. [Google Scholar] [CrossRef]
  16. Sharma, S.H.S.; Lyons, G.; McRoberts, C.; McCall, D.; Carmichael, E.; Andrews, F.; Swan, R.; McCormack, R.; Mellon, R. Biostimulant Activity of Brown Seaweed Species from Strangford Lough: Compositional Analyses of Polysaccharides and Bioassay of Extracts Using Mung Bean (Vigno mungo L.) and Pak Choi (Brassica rapa chinensis L.). J. Appl. Phycol. 2012, 24, 1081–1091. [Google Scholar] [CrossRef]
  17. Rolland, F.; Moore, B.; Sheen, J. Sugar Sensing and Signaling in Plants. Plant Cell 2002, 14. [Google Scholar] [CrossRef]
  18. Batool, M.; El-Badri, A.M.; Hassan, M.U.; Haiyun, Y.; Chunyun, W.; Zhenkun, Y.; Jie, K.; Wang, B.; Zhou, G. Drought Stress in Brassica napus: Effects, Tolerance Mechanisms, and Management Strategies. J. Plant Growth Regul. 2023, 42, 21–45. [Google Scholar] [CrossRef]
  19. Rakow, G. Species Origin and Economic Importance of Brassica. In; 2004; pp. 3–11. [CrossRef]
  20. Sun, R. Economic/Academic Importance of Brassica rapa. In; 2015; pp. 1–15. [CrossRef]
  21. Idrees, N.; Tabassum, B.; Sarah, R.; Hussain, M.K. Natural Compound from Genus Brassica and Their Therapeutic Activities. In Natural Bio-active Compounds; Springer Singapore: Singapore, 2019; pp. 477–491. [Google Scholar]
  22. Pereira, L. Portuguese Seaweeds Website (MACOI). Available online: http://www.flordeutopia.pt/macoi/default.php (accessed on 7 June 2020).
  23. Pacheco, D.; Cotas, J.; Rocha, C.P.; Araújo, G.S.; Figueirinha, A.; Gonçalves, A.M.M.; Bahcevandziev, K.; Pereira, L. Seaweeds’ Carbohydrate Polymers as Plant Growth Promoters. Carbohydr. Polym. Technol. Appl. 2021, 2. [Google Scholar] [CrossRef]
  24. Fernández, C. The Retreat of Large Brown Seaweeds on the North Coast of Spain: The Case of Saccorhiza polyschides. Eur. J. Phycol. 2011, 46, 352–360. [Google Scholar] [CrossRef]
  25. Gioele, C.; Marilena, S.; Valbona, A.; Nunziacarla, S.; Andrea, S.; Antonio, M. Gracilaria Gracilis, Source of Agar: A Short Review. Curr. Org. Chem. 2017, 21, 380–386. [Google Scholar] [CrossRef]
  26. Cai, J.; Lovatelli, A.; Aguilar-Manjarrez, J.; Cornish, L.; Dabbadie, L.; Desrochers, A.; Diffey, S.; Garrido Gamarro, E.; Geehan, J.; Hurtado, A.; et al. Seaweeds and Microalgae: An. Overview for Unlocking Their Potential. In Global Aquaculture Development, 1229th ed.; FAO: Rome, 2021; ISBN 978-92-5-134710-2. [Google Scholar]
  27. Carrington, E.; Grace, S.P.; Chopin, T. Life History Phases and the Biomechanical Properties of the Red Alga Chondrus crispus (Rhodophyta). J. Phycol. 2001, 37, 699–704. [Google Scholar] [CrossRef]
  28. Pereira, L.; Critchley, A.T.; Amado, A.M.; Ribeiro-Claro, P.J.A. A Comparative Analysis of Phycocolloids Produced by Underutilized versus Industrially Utilized Carrageenophytes (Gigartinales, Rhodophyta). J. Appl. Phycol. 2009, 21, 599–605. [Google Scholar] [CrossRef]
  29. Brown, M.T.; Neish, A.; Harwood, D. Comparison of Three Techniques for Identifying Isomorphic Phases of Chondrus crispus (Gigartinaceae). J. Appl. Phycol. 2004, 16, 447–450. [Google Scholar] [CrossRef]
  30. Wang, D.; Fan, B.; Wang, Y.; Zhang, L.; Wang, F. Optimum Extraction, Characterization, and Antioxidant Activities of Polysaccharides from Flowers of Dendrobium devonianum. Int. J. Anal. Chem. 2018, 2018, 1–8. [Google Scholar] [CrossRef] [PubMed]
  31. Sivagnanavelmurugan, M.; Radhakrishnan, S.; Palavesam, A.; Arul, V.; Immanuel, G. Characterization of Alginic Acid Extracted from Sargassum wightii and Determination of Its Anti-Viral Activity of Shrimp Penaeus monodon Post Larvae against White Spot Syndrome Virus. Int. J. Curr. Res. Life Sci. 2018, 07, 1863–1872. [Google Scholar]
  32. Li, H.; Yu, X.; Jin, Y.; Zhang, W.; Liu, Y. Development of an Eco-Friendly Agar Extraction Technique from the Red Seaweed Gracilaria lemaneiformis. Bioresour. Technol. 2008, 99, 3301–3305. [Google Scholar] [CrossRef]
  33. Pereira, L.; Van De Velde, F. Portuguese Carrageenophytes: Carrageenan Composition and Geographic Distribution of Eight Species (Gigartinales, Rhodophyta). Carbohydr. Polym. 2011, 84, 614–623. [Google Scholar] [CrossRef]
  34. Mamede, M.; Cotas, J.; Bahcevandziev, K.; Pereira, L. Seaweed Polysaccharides on Seed Germination of Brassica napus L. Algal Res. 2023, 103288. [Google Scholar] [CrossRef]
  35. Cunniff, P. Official Methods of Analysis of AOAC International; AOAC International: Gaithersburg, MD, USA, 1997. [Google Scholar]
  36. Bremner, J.M. Total Nitrogen. In Methods of Soil Analysis Chemical and Microbiological Properies. Part 2; Black, A., Evans, D.D., White, J.L., Ensmingert, L.E., Clark, F.E., Eds.; American Society of Agronomy, Inc: Madison, Wisconsin, USA, 1979; pp. 1149–1176. [Google Scholar]
  37. PortFIR - INSA (n.d.). Available online: http://Portfir.Insa.Pt/.
  38. Lucas, M.D.; Sequeira, E.M. Determinação Do Cu, Zn, Mn, Fe, Ca, Mg, K, e Na Totais Das Plantas Por Espectrofotometria de Absorção Atómica e Fotometria de Chama. Pedologia 1976, 11, 163–169. [Google Scholar]
  39. Ribas, M.C.; Veiga, M.E.; Curto, A.; Oliveira, E.; Barbeitos, M.M.; Ferreira, M.; Pacheco, C.; Peralta, M.F.; Duarte, M. Métodos de Análise de Material Vegetal e Terras. Pedologia 1988, 11, 163–169. [Google Scholar]
  40. Pereira, L.; Gheda, S.F.; Ribeiro-Claro, P.J.A. Analysis by Vibrational Spectroscopy of Seaweed Polysaccharides with Potential Use in Food, Pharmaceutical, and Cosmetic Industries. Int. J. Carbohydr. Chem. 2013, 2013, 1–7. [Google Scholar] [CrossRef]
  41. Cotas, J.; Figueirinha, A.; Pereira, L.; Batista, T. The Effect of Salinity on Fucus ceranoides (Ochrophyta, Phaeophyceae) in the Mondego River (Portugal). J. Ocean. Limnol. 2019, 37, 881–891. [Google Scholar] [CrossRef]
  42. Toscano, S.; Romano, D.; Patanè, C. Effect of Application of Biostimulants on the Biomass, Nitrate, Pigments, and Antioxidants Content in Radish and Turnip Microgreens. Agronomy 2023, 13, 145. [Google Scholar] [CrossRef]
  43. Lao, F.; Giusti, M.M. Quantification of Purple Corn (Zea mays L.) Anthocyanins Using Spectrophotometric and HPLC Approaches: Method Comparison and Correlation. Food Anal. Methods 2016, 9, 1367–1380. [Google Scholar] [CrossRef]
  44. Soil Improvers and Growing Media - Extraction of Water Soluble Nutrients and Elements. Eur. Comm. Stand. 2001, 1–18.
  45. Póvoas, I.; Barral, M.F. Métodos de Análise de Solos. Lisbon: Inst. De. Investig. Científica Trop. 1992.
  46. Laboratório Químico Agrícola Rebelo da Silva Sector de Fertilidade Do Solo; DGSA - Ministério da Agricultura, Lisbon, Portugal, 1977.
  47. Cornforth, I.S.; Stephen, R.C.; Barry, T.N.; Baird, G.A. Mineral Content of Swedes, Turnips, and Kale. New Zealand J. Exp. Agric. 1978, 6, 151–156. [Google Scholar] [CrossRef]
  48. Forgacs, E.; Cserhati, T. Thin-Layer Chromatography of Natural Pigments: New Advances. J. Liq. Chromatogr. Relat. Technol. 2002, 25, 1521–1541. [Google Scholar] [CrossRef]
  49. Quach, H.T.; Steeper, R.L.; Griffin, G.W. An Improved Method for the Extraction and Thin-Layer Chromatography of Chlorophyll a and b from Spinach. J. Chem. Educ. 2004, 81, 385. [Google Scholar] [CrossRef]
  50. Tarragó-Celada, J.; Novell, J.M.F. The European Jornal for Science Teachers. 2019.
  51. Khan, N.; Ray, R.L.; Sargani, G.R.; Ihtisham, M.; Khayyam, M.; Ismail, S. Current Progress and Future Prospects of Agriculture Technology: Gateway to Sustainable Agriculture. Sustainability 2021, 13, 4883. [Google Scholar] [CrossRef]
  52. Younes, M.; Aggett, P.; Aguilar, F.; Crebelli, R.; Filipič, M.; Frutos, M.J.; Galtier, P.; Gott, D.; Gundert-Remy, U.; Kuhnle, G.G.; et al. Re-evaluation of Alginic Acid and Its Sodium, Potassium, Ammonium and Calcium Salts (E 400–E 404) as Food Additives. EFSA J. 2017, 15. [Google Scholar] [CrossRef]
  53. Younes, M.; Aggett, P.; Aguilar, F.; Crebelli, R.; Filipič, M.; Frutos, M.J.; Galtier, P.; Gott, D.; Gundert-Remy, U.; Kuhnle, G.G.; et al. Re-evaluation of Carrageenan (E 407) and Processed Eucheuma Seaweed (E 407a) as Food Additives. EFSA J. 2018, 16. [Google Scholar] [CrossRef] [PubMed]
  54. Lorenzo, J.; Agregán, R.; Munekata, P.; Franco, D.; Carballo, J.; Şahin, S.; Lacomba, R.; Barba, F. Proximate Composition and Nutritional Value of Three Macroalgae: Ascophyllum nodosum, Fucus vesiculosus and Bifurcaria bifurcata. Mar. Drugs 2017, 15, 360. [Google Scholar] [CrossRef] [PubMed]
  55. Kaidi, S.; Bentiss, F.; Jama, C.; Khaya, K.; Belattmania, Z.; Reani, A.; Sabour, B. Isolation and Structural Characterization of Alginates from the Kelp Species Laminaria ochroleuca and Saccorhiza polyschides from the Atlantic Coast of Morocco. Colloids Interfaces 2022, 6, 51. [Google Scholar] [CrossRef]
  56. Devina, N.; Eriwati, Y.K.; Santosa, A.S. The Purity and Viscosity of Sodium Alginate Extracted from Sargassum Brown Seaweed Species as a Basic Ingredient in Dental Alginate Impression Material. J. Phys. Conf. Ser. 2018, 1073, 052012. [Google Scholar] [CrossRef]
  57. McHugh, D.J. Production and Utilization of Products from Commercial Seaweeds; Rome, 1987.
  58. Jamiołkowska, A. Natural Compounds as Elicitors of Plant Resistance Against Diseases and New Biocontrol Strategies. Agronomy 2020, 10, 173. [Google Scholar] [CrossRef]
  59. Bigeard, J.; Colcombet, J.; Hirt, H. Signaling Mechanisms in Pattern-Triggered Immunity (PTI). Mol. Plant 2015, 8, 521–539. [Google Scholar] [CrossRef] [PubMed]
  60. Smit, B. Insects in Southern Africa: How to Control Them; Oxford University Press: Cape Town, 1964. [Google Scholar]
  61. Mamede, M.; Cotas, J.; Bahcevandziev, K.; Pereira, L. Seaweed Polysaccharides in Agriculture: A Next Step towards Sustainability. Appl. Sci. 2023, 13, 6594. [Google Scholar] [CrossRef]
  62. Ali, S.; Ganai, B.A.; Kamili, A.N.; Bhat, A.A.; Mir, Z.A.; Bhat, J.A.; Tyagi, A.; Islam, S.T.; Mushtaq, M.; Yadav, P.; et al. Pathogenesis-Related Proteins and Peptides as Promising Tools for Engineering Plants with Multiple Stress Tolerance. Microbiol. Res. 2018, 212–213, 29–37. [Google Scholar] [CrossRef] [PubMed]
  63. Thye, K.-L.; Wan Abdullah, W.M.A.N.; Balia Yusof, Z.N.; Wee, C.-Y.; Ong-Abdullah, J.; Loh, J.-Y.; Cheng, W.-H.; Lamasudin, D.U.; Lai, K.-S. λ-Carrageenan Promotes Plant Growth in Banana via Enhancement of Cellular Metabolism, Nutrient Uptake, and Cellular Homeostasis. Sci. Rep. 2022, 12, 19639. [Google Scholar] [CrossRef] [PubMed]
  64. Uchida, R. Essential Nutrients for Plant Growth: Nutrient Functions and Deficiency Symptoms. In Plant Nutrient Management in Hawaii’s Soils, Approaches for Tropical and Subtropical Agriculture; College of Tropical Agriculture and Human Resources, University of Hawaii: Manoa, 2000; pp. 31–55. [Google Scholar]
  65. Canteri, M.H.G.; Renard, C.M.G.C.; Le Bourvellec, C.; Bureau, S. ATR-FTIR Spectroscopy to Determine Cell Wall Composition: Application on a Large Diversity of Fruits and Vegetables. Carbohydr. Polym. 2019, 212, 186–196. [Google Scholar] [CrossRef]
  66. Šamec, D.; Karalija, E.; Šola, I.; Vujčić Bok, V.; Salopek-Sondi, B. The Role of Polyphenols in Abiotic Stress Response: The Influence of Molecular Structure. Plants 2021, 10, 118. [Google Scholar] [CrossRef] [PubMed]
  67. Chaudhari, P.R.; Ahire, D. V.; Ahire, V.D.; Chkravarty, M.; Maity, S. Soil Bulk Density as Related to Soil Texture, Organic Matter Content and Available Total Nutrients of Coimbatore Soil. Int. J. Sci. Res. Publ. 2013, 3. [Google Scholar]
  68. Henneron, L.; Kardol, P.; Wardle, D.A.; Cros, C.; Fontaine, S. Rhizosphere Control of Soil Nitrogen Cycling: A Key Component of Plant Economic Strategies. New Phytol. 2020, 228, 1269–1282. [Google Scholar] [CrossRef] [PubMed]
  69. Zhao, C.; Zhang, H.; Song, C.; Zhu, J.-K.; Shabala, S. Mechanisms of Plant Responses and Adaptation to Soil Salinity. Innov. 2020, 1, 100017. [Google Scholar] [CrossRef] [PubMed]
  70. Furey, G.N.; Tilman, D. Plant Biodiversity and the Regeneration of Soil Fertility. Proc. Natl. Acad. Sci. 2021, 118. [Google Scholar] [CrossRef]
  71. Cunha, L.; Grenha, A. Sulfated Seaweed Polysaccharides as Multifunctional Materials in Drug Delivery Applications. Mar. Drugs 2016, 14. [Google Scholar] [CrossRef] [PubMed]
  72. Mercier, L.; Lafitte, C.; Borderies, G.; Briand, X.; Esquerré-Tugayé, M.; Fournier, J. The Algal Polysaccharide Carrageenans Can Act as an Elicitor of Plant Defence. New Phytol. 2001, 149, 43–51. [Google Scholar] [CrossRef] [PubMed]
  73. Kopriva, S.; Malagoli, M.; Takahashi, H. Sulfur Nutrition: Impacts on Plant Development, Metabolism, and Stress Responses. J. Exp. Bot. 2019, 70, 4069–4073. [Google Scholar] [CrossRef] [PubMed]
  74. Koprivova, A.; Kopriva, S. Sulfation Pathways in Plants. Chem. Biol. Interact. 2016, 259, 23–30. [Google Scholar] [CrossRef]
  75. Künstler, A.; Gullner, G.; Ádám, A.L.; Kolozsváriné Nagy, J.K.; Király, L. The Versatile Roles of Sulfur-Containing Biomolecules in Plant Defense—A Road to Disease Resistance. Plants 2020, 9, 1705. [Google Scholar] [CrossRef]
Figure 1. Washed seaweeds: (a) S. polyschides, (b) G. gracilis, (c) C. crispus (tetrasporophyte), (d) C. crispus (non-fructified thalli) and (e) C. crispus (female gametophyte).
Preprints 91786 g001
Figure 2. Photographic record of the experimental conditions.
Preprints 91786 g002
Figure 6. (a) Aerial part weight, (b) Aerial part length, (c) Root weight and (d) Root length of the fresh turnip leaves from each treatment of the biostimulant and biofertilizer assay, measured after 63 days. The graphs present the average values and the standard deviation (n=3). Significant differences are found among the different samples (p<0.05). Negative values in y-axis are due to standard deviation calculation. NC – negative control; PC – positive control; SP – S. polyschides; GG – G. gracilis; CC(T) – C. crispus (tetrasporophyte); CC(NF) – C. crispus (non-fructified thalli); CC(FG) – C. crispus (female gametophyte).
Preprints 91786 g006
Figure 7. Number of leaves of the fresh turnip leaves from each treatment of the biostimulant and biofertilizer assay, measured after 63 days. The graphs present the average values and the standard deviation (n=3). Significant differences are found among the different samples (p<0.05). NC – negative control; PC – positive control; SP – S. polyschides; GG – G. gracilis; CC(T) – C. crispus (tetrasporophyte); CC(NF) – C. crispus (non-fructified thalli); CC(FG) – C. crispus (female gametophyte).
Preprints 91786 g007
Figure 8. FTIR-ATR spectra of the turnip leaves within each treatment (Dry basis). NC – negative control. PC – positive control. SP – S. polyschides; GG – G. gracilis; CC(T) – C. crispus (tetrasporophyte); CC(NF) – C. crispus (non-fructified thalli); CC(FG) – C. crispus (female gametophyte).
Preprints 91786 g008
Figure 9. Thin-layer chromatography of the methanolic extracts from each treatment sample of turnip leaves (Dry basis). NC – negative control. PC – positive control. SP – S. polyschides; GG – G. gracilis; CC(T) – C. crispus (tetrasporophyte); CC(NF) – C. crispus (non-fructified thalli); CC(FG) – C. crispus (female gametophyte).
Preprints 91786 g009
Figure 10. pH of the substrate samples used for turnip leaves potting of each treatment. NC – negative control. There are not statistically significant differences found among the different samples (p>0.05). PC – positive control. SP – S. polyschides; GG – G. gracilis; CC(T) – C. crispus (tetrasporophyte); CC(NF) – C. crispus (non-fructified thalli); CC(FG) – C. crispus (female gametophyte).
Preprints 91786 g010
Figure 11. Electrical conductivity (EC) (mS/cm) of the substrate samples used for turnip leaves potting of each treatment. There are not statistically significant differences found among the different samples (p>0.05). NC – negative control. PC – positive control. SP – S. polyschides; GG – G. gracilis; CC(T) – C. crispus (tetrasporophyte); CC(NF) – C. crispus (non-fructified thalli); CC(FG) – C. crispus (female gametophyte).
Preprints 91786 g011
Figure 12. Sodium (mg/L) of the substrate samples used for turnip leaves potting of each treatment. There are not statistically significant differences found among the different samples (p>0.05). NC – negative control. PC – positive control. SP – S. polyschides; GG – G. gracilis; CC(T) – C. crispus (tetrasporophyte); CC(NF) – C. crispus (non-fructified thalli); CC(FG) – C. crispus (female gametophyte).
Preprints 91786 g012
Figure 13. Phosphorus pentoxide (mg/L) of the substrate samples used for turnip leaves potting of each treatment. There are not statistically significant differences found among the different samples (p>0.05). NC – negative control. PC – positive control. SP – S. polyschides; GG – G. gracilis; CC(T) – C. crispus (tetrasporophyte); CC(NF) – C. crispus (non-fructified thalli); CC(FG) – C. crispus (female gametophyte).
Preprints 91786 g013
Figure 14. Calcium oxide (mg/L) of the substrate samples used for turnip leaves potting of each treatment. There are not statistically significant differences found among the different samples (p>0.05). NC – negative control. PC – positive control. SP – S. polyschides; GG – G. gracilis; CC(T) – C. crispus (tetrasporophyte); CC(NF) – C. crispus (non-fructified thalli); CC(FG) – C. crispus (female gametophyte).
Preprints 91786 g014
Figure 15. Magnesium oxide (mg/L) of the substrate samples used for turnip leaves potting of each treatment. There are not statistically significant differences found among the different samples (p>0.05). NC – negative control. PC – positive control. SP – S. polyschides; GG – G. gracilis; CC(T) – C. crispus (tetrasporophyte); CC(NF) – C. crispus (non-fructified thalli); CC(FG) – C. crispus (female gametophyte).
Preprints 91786 g015
Figure 16. Potassium oxide (mg/L) of the substrate samples used for turnip leaves potting of each treatment. There are not statistically significant differences found among the different samples (p>0.05). NC – negative control. PC – positive control. SP – S. polyschides; GG – G. gracilis; CC(T) – C. crispus (tetrasporophyte); CC(NF) – C. crispus (non-fructified thalli); CC(FG) – C. crispus (female gametophyte).
Preprints 91786 g016
Table 1. Description of the treatments and their concentration, applied in the assay. (Source:[34]).
Treatment Concentration
Negative control (Tap water) -
Positive control (“Profertil”) 1,5% (v/v)
Alginate solution 0.50 mg/mL
Agar solution 0.50 mg/mL
Carrageenan (Tetrasporophyte) solution 0.25 mg/mL
Carrageenan (Non-fructified thalli) solution 0.50 mg/mL
Carrageenan (Female gametophyte) solution 0.50 mg/mL
Table 2. pH, electrical conductivity (EC) and viscosity values of the treatments used in the biostimulant and biofertilizer assay in potted turnip. Negative control – tap water. Positive control – “Profertil”.
Treatment Concentration (mg/mL) pH EC (µS/cm) Viscosity (mPa.s)
Negative control - 5.86 302 1.00
Positive control 1.5% (v/v) 7.30 1685 5.10
Alginate solution 0.50 3.70 109 3.60
Agar solution 0.50 5.83 73 8.40
Carrageenan (tetrasporophyte) solution 0.25 9.34 100 10.80
Carrageenan (non-fructified thalli) solution 0.50 9.56 184 9.00
Carrageenan (female gametophyte) solution 0.50 9.86 191 9.00
Measured at room temperature (20-22 °C).
Table 3. Ratios between the aerial part (AP) and root (R) of the fresh turnip from each treatment of the biostimulant and biofertilizer assay, measured after 63 days. NC – negative control; PC – positive control; SP – S. polyschides; GG – G. gracilis; CC(T) – C. crispus (tetrasporophyte); CC(NF) – C. crispus (non-fructified thalli); CC(FG) – C. crispus (female gametophyte).
Sample AP length/weight R length/weight AP weight/R weight AP length/R length
NC 1.46 23.27 36.20 2.28
PC 1.68 20.45 26.09 2.15
SP 1.03 11.91 35.04 3.02
GG 1.20 11.94 29.77 3.00
CC(T) 0.92 14.73 43.69 2.74
CC(NF) 1.12 24.01 53.54 2.49
CC(FG) 1.03 14.94 36.62 2.53
Table 4. Dry matter, ashes, protein, mineral and trace element characterization of the turnip within each treatment. The results are expressed in mean ± standard deviation (n=2, Dry weight basis). Significant differences are found among the different samples (p<0.05). NI – No Information found in the literature. NC – negative control. PC – positive control. SP – S. polyschides; GG – G. gracilis; CC(T) – C. crispus (tetrasporophyte); CC(NF) – C. crispus (non-fructified thalli); CC(FG) – C. crispus (female gametophyte).
Treatments NC PC SP GG CC(T) CC(NF) CC(FG) Literature values Reference
Dry matter (%) 5.30 ± 0.00ab 5.34 ± 0.01ab 3.42 ± 2.31b 7.19 ± 1.68a 5.80 ± 0.04ab 6.66 ± 0.05a 6.77 ± 0.43a 6.00 [37]
Ashes (%) 22.74 ± 0.02a 20.45 ± 0.07a 19.52 ± 0.02a 19.36 ± 0.28a 20.23 ± 0.05a 19.47 ± 0.07a 18.48 ± 0.10a 13.50 [37]
N (%) 5.68 ± 0.05a 5.27 ± 0.12ab 5.23 ± 0.06ab 4.86 ± 0.01b 5.37 ± 0.03ab 5.16 ± 0.03b 4.88 ± 0.05b 3.23 [47]
Protein (%) 35.50 ± 0.31a 32.91 ± 0.72ab 32.66 ± 0.34ab 30.34 ± 0.03b 33.56 ± 0.19ab 32.25 ± 0.19ab 30.47 ± 0.34b 33.33 [37]
P (%) 0.84 ± 0.00ab 0.87 ± 0.01a 0.81 ± 0.01ab 0.73 ± 0.02b 0.80 ± 0.00ab 0.75 ± 0.01b 0.76 ± 0.00b 0.75 [37]
Ca (%) 1.46 ± 0.01a 1.33 ± 0.01ab 1.28 ± 0.20ab 1.23 ± 0.05ab 1.29 ± 0.00ab 1.23 ± 0.03ab 1.20 ± 0.02b 1.67 [37]
Mg (%) 0.30 ± 0.01a 0.27 ± 0.00ab 0.23 ± 0.01b 0.24 ± 0.00b 0.26 ± 0.01ab 0.28 ± 0.01ab 0.27 ± 0.01ab 0.17 [37]
K (%) 8.58 ± 0.16a 7.31 ± 0.12ab 8.23 ± 0.17ab 7.43 ± 0.29ab 8.17 ± 0.07ab 6.88 ± 0.02b 7.24 ± 0.17b 5.00 [37]
Na (%) 0.39 ± 0.03a 0.41 ± 0.00a 0.44 ± 0.00a 0.34 ± 0.03a 0.39 ± 0.10a 0.90 ± 0.52a 0.36 ± 0.02a 0.67 [37]
Cu (mg/kg) 35.25 ± 0.15ab 36.80 ± 0.50ab 33.25 ± 0.45b 34.70 ± 0.20ab 35.50 ± 0.80ab 35.40 ± 1.00ab 38.00 ± 0.30a NI NI
Zn (mg/kg) 118.15 ± 1.25a 81.00 ± 1.60ab 77.05 ± 0.15b 77.75 ± 1.15b 81.10 ± 1.50ab 77.25 ± 0.15b 81.85 ± 0.65ab 87.40 [47]
Fe (mg/kg) 149.40 ± 1.30a 99.35 ± 0.25ab 93.70 ± 6.80ab 96.75 ± 0.75ab 91.50 ± 3.20b 94.95 ± 2.45ab 91.25 ± 1.35b NI NI
Mn (mg/kg) 119.75 ± 2.15a 58.80 ± 2.60b 89.50 ± 0.20ab 78.15 ± 1.25b 92.90 ± 2.30ab 93.25 ± 1.45ab 71.90± 1.40b 98.70 [47]
Table 5. FTIR-ATR bands identification and characterization of the turnip within each treatment (Dry basis). nd – not detectable. sh – shoulder. NA – Non available. NC – negative control. PC – positive control. SP – S. polyschides; GG – G. gracilis.; CC(T) – C. crispus (tetrasporophyte); CC(NF) – C. crispus (non-fructified thalli); CC(FG) – C. crispus (female gametophyte).
Reference wave number (cm-1) Bond Wave number observed (cm-1)
CC
(FG)
CC
(NF)
NC GG SP CC
(T)
PC
3334 Cellulose sh sh sh sh 3286 3278 3274
2917 Cellulose 2921 2921 2921 2921 2921 2920 2921
1734 Pectins with ester 1736 1736 1735 1736 1736 1736 1736
1626 Free carboxyl groups 1620 1621 1624 1619 1622 1622 1617
1520 Lignin and phenolic backbone sh sh 1540 sh sh sh sh
1371-1314 Cellulose and xyloglucan 1377 1377 1351 1375 1376 1376 1352
1234 Proteins 1240 1240 1238 1239 1239 1239 1238
1015 Polysaccharides, sugars and pectins 1021 1021 1023 1019 1020 1019 1016
825 NA 825.3 825 824.8 825.5 825.2 825.1 825.6
770 Phenyl groups nd nd nd nd nd nd nd
Table 6. Pigments identification from each treatment sample of turnip (Dry basis). Rf – retention factor. NI – No Information found in the literature. NC – negative control. PC – positive control. SP – S. polyschides; GG – G. gracilis; CC(T) – C. crispus (tetrasporophyte); CC(NF) – C. crispus (non-fructified thalli); CC(FG) – C. crispus (female gametophyte).
Rf observed
Nº* Visible color NC PC SP GG CC
(T)
CC
(NF)
CC
(FG)
Rf literature Pigment Reference
1 light green 0.02 0.02 0.03 0.03 0.02 0.03 0.04 NI NI NI
2 light grey 0.07 0.08 0.09 0.10 0.10 0.12 0.14 NI NI NI
3 light yellow nd nd 0.16 0.17 0.20 0.20 0.22 0.18 Neoxanthin [48]
4 bright yellow 0.57 0.57 0.57 0.57 0.68 0.68 0.69 0.15-0.35 Xanthophyll [49,50]
5 light green 0.62 0.62 0.62 0.62 0.73 0.73 0.75 0.32-0.42 Chlorophyll b [49,50]
6 faded green 0.66 nd 0.66 0.66 0.77 0.77 0.79 NI NI NI
7 dark green 0.74 0.74 0.74 0.74 0.84 0.83 0.84 0.44-0.59 Chlorophyll a [49,50]
8 light grey 0.83 nd 0.83 nd 0.91 0.91 nd 0.49 Pheophytin b [49]
9 dark grey 0.91 0.91 0.91 0.91 0.95 0.95 0.95 0.60 Pheophytin a [49]
10 light grey 0.95 0.95 0.95 0.95 nd nd nd NI NI NI
11 golden 0.99 0.99 0.99 0.99 0.98 0.98 0.98 0.95-0.98 β-carotene [48,49,50]
*Corresponding numbers in Figure 9.
Table 7. Pigments quantification (mg/ 100 g) from each treatment sample of turnip. The results are expressed in mean ± standard deviation (n=3, Dry weight basis). Significant differences are found among the different samples (p<0.05). NC– negative control. PC – positive control. SP – S. polyschides; GG – G. gracilis; CC(T) – C. crispus (tetrasporophyte); CC(NF) – C. crispus (non-fructified thalli); CC(FG) – C. crispus (female gametophyte).
Pigments
(mg/ 100 g)
NC PC SP GG CC(T) CC(NF) CC(GF)
Chlorophyll a 4.346 ± 0.01b 4.458 ± 0.01ab 5.233 ± 0.01ab 4.303 ± 0.01b 6.916 ± 0.01a 5.516 ± 0.01ab 5.914 ± 0.01ab
Chlorophyll b 1.503 ± 0.01ab 1.399 ± 0.01b 1.729 ± 0.01ab 1.361 ± 0.01b 2.301 ± 0.01a 1.841 ± 0.01ab 1.851 ± 0.01ab
Anthocyanins 0.011 ± 0.01a 0.010 ± 0.01a 0.011 ± 0.01a 0.009 ± 0.01a 0.016 ± 0.01a 0.012 ± 0.01a 0.014 ± 0.01a
Carotenoids 0.936 ± 0.01b 1.013 ± 0.01b 1.231 ± 0.01ab 1.056 ± 0.01ab 1.448 ± 0.01a 1.230 ± 0.01ab 1.426 ± 0.01ab
Table 8. Apparent compact density (Ds), weight of the sample (ms) at 60 mL, organic matter content (OM) and nitrogen content (N) of the substrates used for turnip potting of each treatment. The results are expressed in mean ± standard deviation (n=2). Significant differences are found among the different samples (p<0.05). NC – negative control. PC – positive control. SP – S. polyschides; GG – G. gracilis; CC(T) – C. crispus (tetrasporophyte); CC(NF) – C. crispus (non-fructified thalli); CC(FG) – C. crispus (female gametophyte).
Soil sample NC PC SP GG CC(T) CC(NF) CC(FG)
Ds (g/L) 945.19 ± 29.58a 804.97 ± 14.01ab 767.59 ± 10.83b 771.10 ± 4.21b 836.16 ± 68.54ab 802.81 ± 4.18ab 837.85 ± 16.07ab
ms at 60 mL (g) 56.71 ± 1.77a 48.30 ± 0.84a 46.06 ± 0.65a 46.27 ± 0.25a 50.17 ± 4.11a 48.17 ± 0.25a 50.27 ± 0.96a
OM (%) 34.97 ± 1.33a 24.17 ± 0.73b 27.22 ± 1.89ab 23.52 ± 0.50b 19.54 ± 1.16b 27.67 ± 7.40b 23.53 ± 0.84b
N (%) 0.42 ± 0.01a 0.40 ± 0.02a 0.44 ± 0.02a 0.41 ± 0.02a 0.35 ± 0.00a 0.33 ± 0.01a 0.37 ± 0.03a
Disclaimer/Publisher’s Note: The statements, opinions and data contained in all publications are solely those of the individual author(s) and contributor(s) and not of MDPI and/or the editor(s). MDPI and/or the editor(s) disclaim responsibility for any injury to people or property resulting from any ideas, methods, instructions or products referred to in the content.
Copyright: This open access article is published under a Creative Commons CC BY 4.0 license, which permit the free download, distribution, and reuse, provided that the author and preprint are cited in any reuse.
Prerpints.org logo

Preprints.org is a free preprint server supported by MDPI in Basel, Switzerland.

Subscribe

© 2024 MDPI (Basel, Switzerland) unless otherwise stated