1. Introduction
Urban climate research and urban temperature analysis are receiving significant attention. In this context, they are studied from an innovative approach such as Artificial Neural Networks (ANNs).
In response to climate threats and the consequences of the urban heat island (UHI) effect, green spaces like urban gardens (allotment gardens in this case) and forested parks are increasingly recognized for their capacity to mitigate these challenges. For this reason, ANNs were developed for temperature prediction at such urban specific locations. Although studies of this nature remain limited, several authors have explored ANNs in various contexts, thereby reinforcing the methodology employed in this study.
1.1. Considerations and importance of the urban climate
Currently, more than half of the world's population lives in cities, a number projected to reach 60% by 2030 [
1]. Consequently, the pursuit of more sustainable, habitable and resilient cities stands as one of the most significant challenges for urban policy and planning in the 21st century [
1,
2].
The term “urban” encompasses a broad range from rural towns to megacities [
3]. Nevertheless, medium-sized cities and megacities in particular, exhibit significant spatial heterogeneity [
4], along with lower albedo, higher thermal conductivity and the highest heat capacities of building materials [
5,
6]. As a result, the urban climate represents distinctive microclimate that emerge from the combined influence of buildings and human activities, significantly impacting the thermal energy dynamics of the city [
7].
The urban heat island effect can be defined as the development of higher temperatures in the center of the city compared to adjacent rural areas [
7,
8]. Many studies [
6,
9,
10,
11] confirmed that as the proportion of impervious surfaces increases and the proportion of vegetation decreases within an urban area, the UHI effect becomes more pronounced [
6].
In this context, particularity in climate change scenarios, it has been identified that urban areas are not sufficiently adapted to global warming [
12]. Consequently, the UHI effect exacerbates the already warm conditions experienced in cities [
13,
14,
15,
16] leading to increased exposure of people to higher heat [
17] and adversely affecting their quality of life [
18]. Although urban green spaces are scarce and threatened [
4,
19,
20], their vegetation cover holds the potential to mitigate temperatures and heat waves [
17,
21,
22,
23], rendering them valuable solutions for urban climate adaptation.
1.2. Artificial neural networks for urban temperatures
To determine urban temperatures, data from nearby meteorological stations (MS), located mostly in peri-urban and rural areas, are commonly considered. However, as the UHI effect intensifies, temperature data from MS becomes less representative of the actual urban climate. Alternatively, installing in situ sensors throughout the city provides another method to monitor urban temperatures. However, not all municipalities are willing to invest in this approach due to its economic cost and the risks of theft or damage.
Therefore, ANNs are a viable option for predicting and estimating urban temperatures. The practicality of ANNs lies in their ability to generate reliable results using only a limited set of urban data, eliminating the need for constant and permanent in situ sensors.
ANNs have the capability to leverage unknown and hidden information in climate data, which may not be directly extractable [
24,
25]. Previous prediction and estimation studies of meteorological variables have primarily focused on using measured data as inputs for the model [
26]. Additionally, other researchers have explored various artificial intelligence techniques, includes genetic algorithms, fuzzy logic, and hybrid techniques approaches, to estimate ambient temperature [
25,
26]. These studies considered different time scales (monthly, daily and hourly) and incorporated geographic coordinates (latitude, longitude and altitude) to enhance the accuracy of their forecasts.
With the interest of assessing the potential of urban green spaces, particularly urban allotment gardens (noteworthy for their productive nature, featuring edible and dynamic vegetation) and forested urban parks, in mitigation temperatures, this study demonstrates the feasibility of predicting urban temperatures in these areas using ANNs.
1.3. Other related models
This section shows references with their other estimation methods and main results obtained with the aim of knowing, comparing, and validating what has been done in this study. Although other related models may represent other scales, they represent the same concept of the ANNs developed here and the same purpose of obtaining data for temperature predictions. Franco et al. [
27] found that there is a lack of such studies that use ANNs models and that focus on generating data in places where such data is not available, so that they can be used as inputs for other models [
25]. However, some interesting studies are presented here.
Keskin et al. [
28] aimed to investigate the optimal spatial prediction method for mapping meteorological data (precipitation, temperature and wind speed) in Turkey, using some interpolation methods (IDW, kriging, radial basis and natural neighbour). This investigation was carried out in 2005, resulting in a three-locations average Root Mean Square Error (RMSE) for a temperature of 0.94 °C with IDW, 0.75 °C with kriging and 0.70 °C natural neighbor.
Antonić et al. [
29] used ANNs models for monthly mean values of meteorological variables (air temperature, daily minimum and maximum air temperature, relative humidity, precipitation, global solar irradiation and evapotranspiration) through data obtained from 127 meteorological stations in Croatia. The inputs used (elevation, latitude, longitude, month and time series of the respective climatic variables) were from two meteorological stations. The results showed that the goodness of fit per model was very high for all the climatic variables (R
2>0.98), except for the mean monthly relative humidity and monthly precipitation, for which it was somewhat lower (R
2=0.84 and R
2=0.80), respectively).
Snell et al. [
30] conducted a spatial prediction of daily maximum surface air temperatures using ANNs, to generate estimates at 11 locations in the central U.S. continent, using information from a network of surrounding stations for the 4- and 16-point cases and over a 63-year period (from 1931 to 1993) that were used as input and output vectors for the ANNs. For the set of test data developed, when using the ANN with 4 data points per station, the lowest RMSE value achieved was 4.905 °C. However, by increasing the data points to 16 per station, the best RMSE value improved to 4.125 °C. On average, 5.694 °C and 5.119 °C were obtained respectively.
Rigol et al. [
31] performed a spatial prediction of daily minimum air temperature using an ANN trained with input variables (date, field variables and neighbouring temperature observations) for a full year, covering an area of 100 km × 100 km in UK, analyzing the internal weights of the inputs to estimate the degree of spatial correlation between neighbouring stations, and the most influential variables contributing to the trend. The performance when testing an ANN 33-1-1 is RMSE = 3.15 °C, of an ANN 19-4-1 is RMSE = 1.26 °C, and of an ANN 45-4-1 is RMSE = 1.15 °C.
In Diez et al. [
25], the prediction of daily data of global solar irradiation, and the maximum, average, and minimum temperatures were measured. These measurements were carried out in the agrometeorological stations of Castilla y León, Spain, through the concept of Virtual Weather Station (VWS), which is implemented with ANNs. The ANN models for daily interpolation were tested over a period of 15 days, with a RMSE, MJ/m
2 of 1.23, 1.38, 1.31 and 1.04, respectively, regarding the daily global solar irradiation. The prediction of ambient temperature also performed well when applying the VWS concept, with an RMSE (°C) of 0.68 for the maximum temperature with an ANN of four hidden neurons, 0.58 for the average temperature with three hidden neurons, and 0.83 for the minimum temperature with four hidden neurons.
This article investigates the daily average ambient temperature and its hourly mean distribution, (T0h (t),…, T23h (t)), using ANN-based models. Using data collected over several days in the city of Valladolid, Castilla y León, Spain, its daily ambient temperatures and its hourly estimate were predicted in urban locations with a particular focus on urban allotment gardens and an urban park.
The goal of ANNs was to achieve accurate temperature predictions using the minimum number of inputs to ensure practical applicability. To attain this goal, various ANNs were constructed and assessed, experimenting with combinations of inputs, hidden neurons and output, until the optimal results obtained using the 6-Y-1 ANN architecture.
2. Materials and Methods
This section outlines the following steps: (2.1) The ambient temperature data considered for the ANNs; (2.2) The best ANNs model designed to estimate urban temperatures; (2.3) The statistics used to analyze the results obtained by the interpolation models based on ANNs.
2.1. The ambient temperature data considered for the ANNs
Valladolid is located in the northwestern quadrant of the Iberian Peninsula, in Spain [
32]. As of January 1, 2022, the city was home 295,639 inhabitants, as reported by the National Institute of Statistics of Spain [
33].
According to the Climate Change Adaptation Strategy of Valladolid [
32], the city predominantly lies in a flat area and its climate is categorized as Mediterranean-Continental, characterized by an annual rainfall of approximately 400 mm/year and an average temperature that barely exceeds 12 °C. However, climate models predict significant changes due to increase emissions, resulting in considerable alterations in temperature trends. The most unfavorable scenarios (RCP8.5 and RCP4.5) for Valladolid in the future indicate the following temperature changes [
32]:
Decrease of: Minimum temperature; extreme minimum temperature; number of frost days; heating degree days.
Increase of: Maximum temperature; extreme maximum temperature; thermal amplitude; number of warm days; number of days of heat waves; cooling degree days.
For the ANNs developed in this study, the urban temperature data for Valladolid were sourced from the period of 06/21/2022 to 07/18/2022 for training the models, and from 07/19/2022 to 07/31/2022 for validating the models.
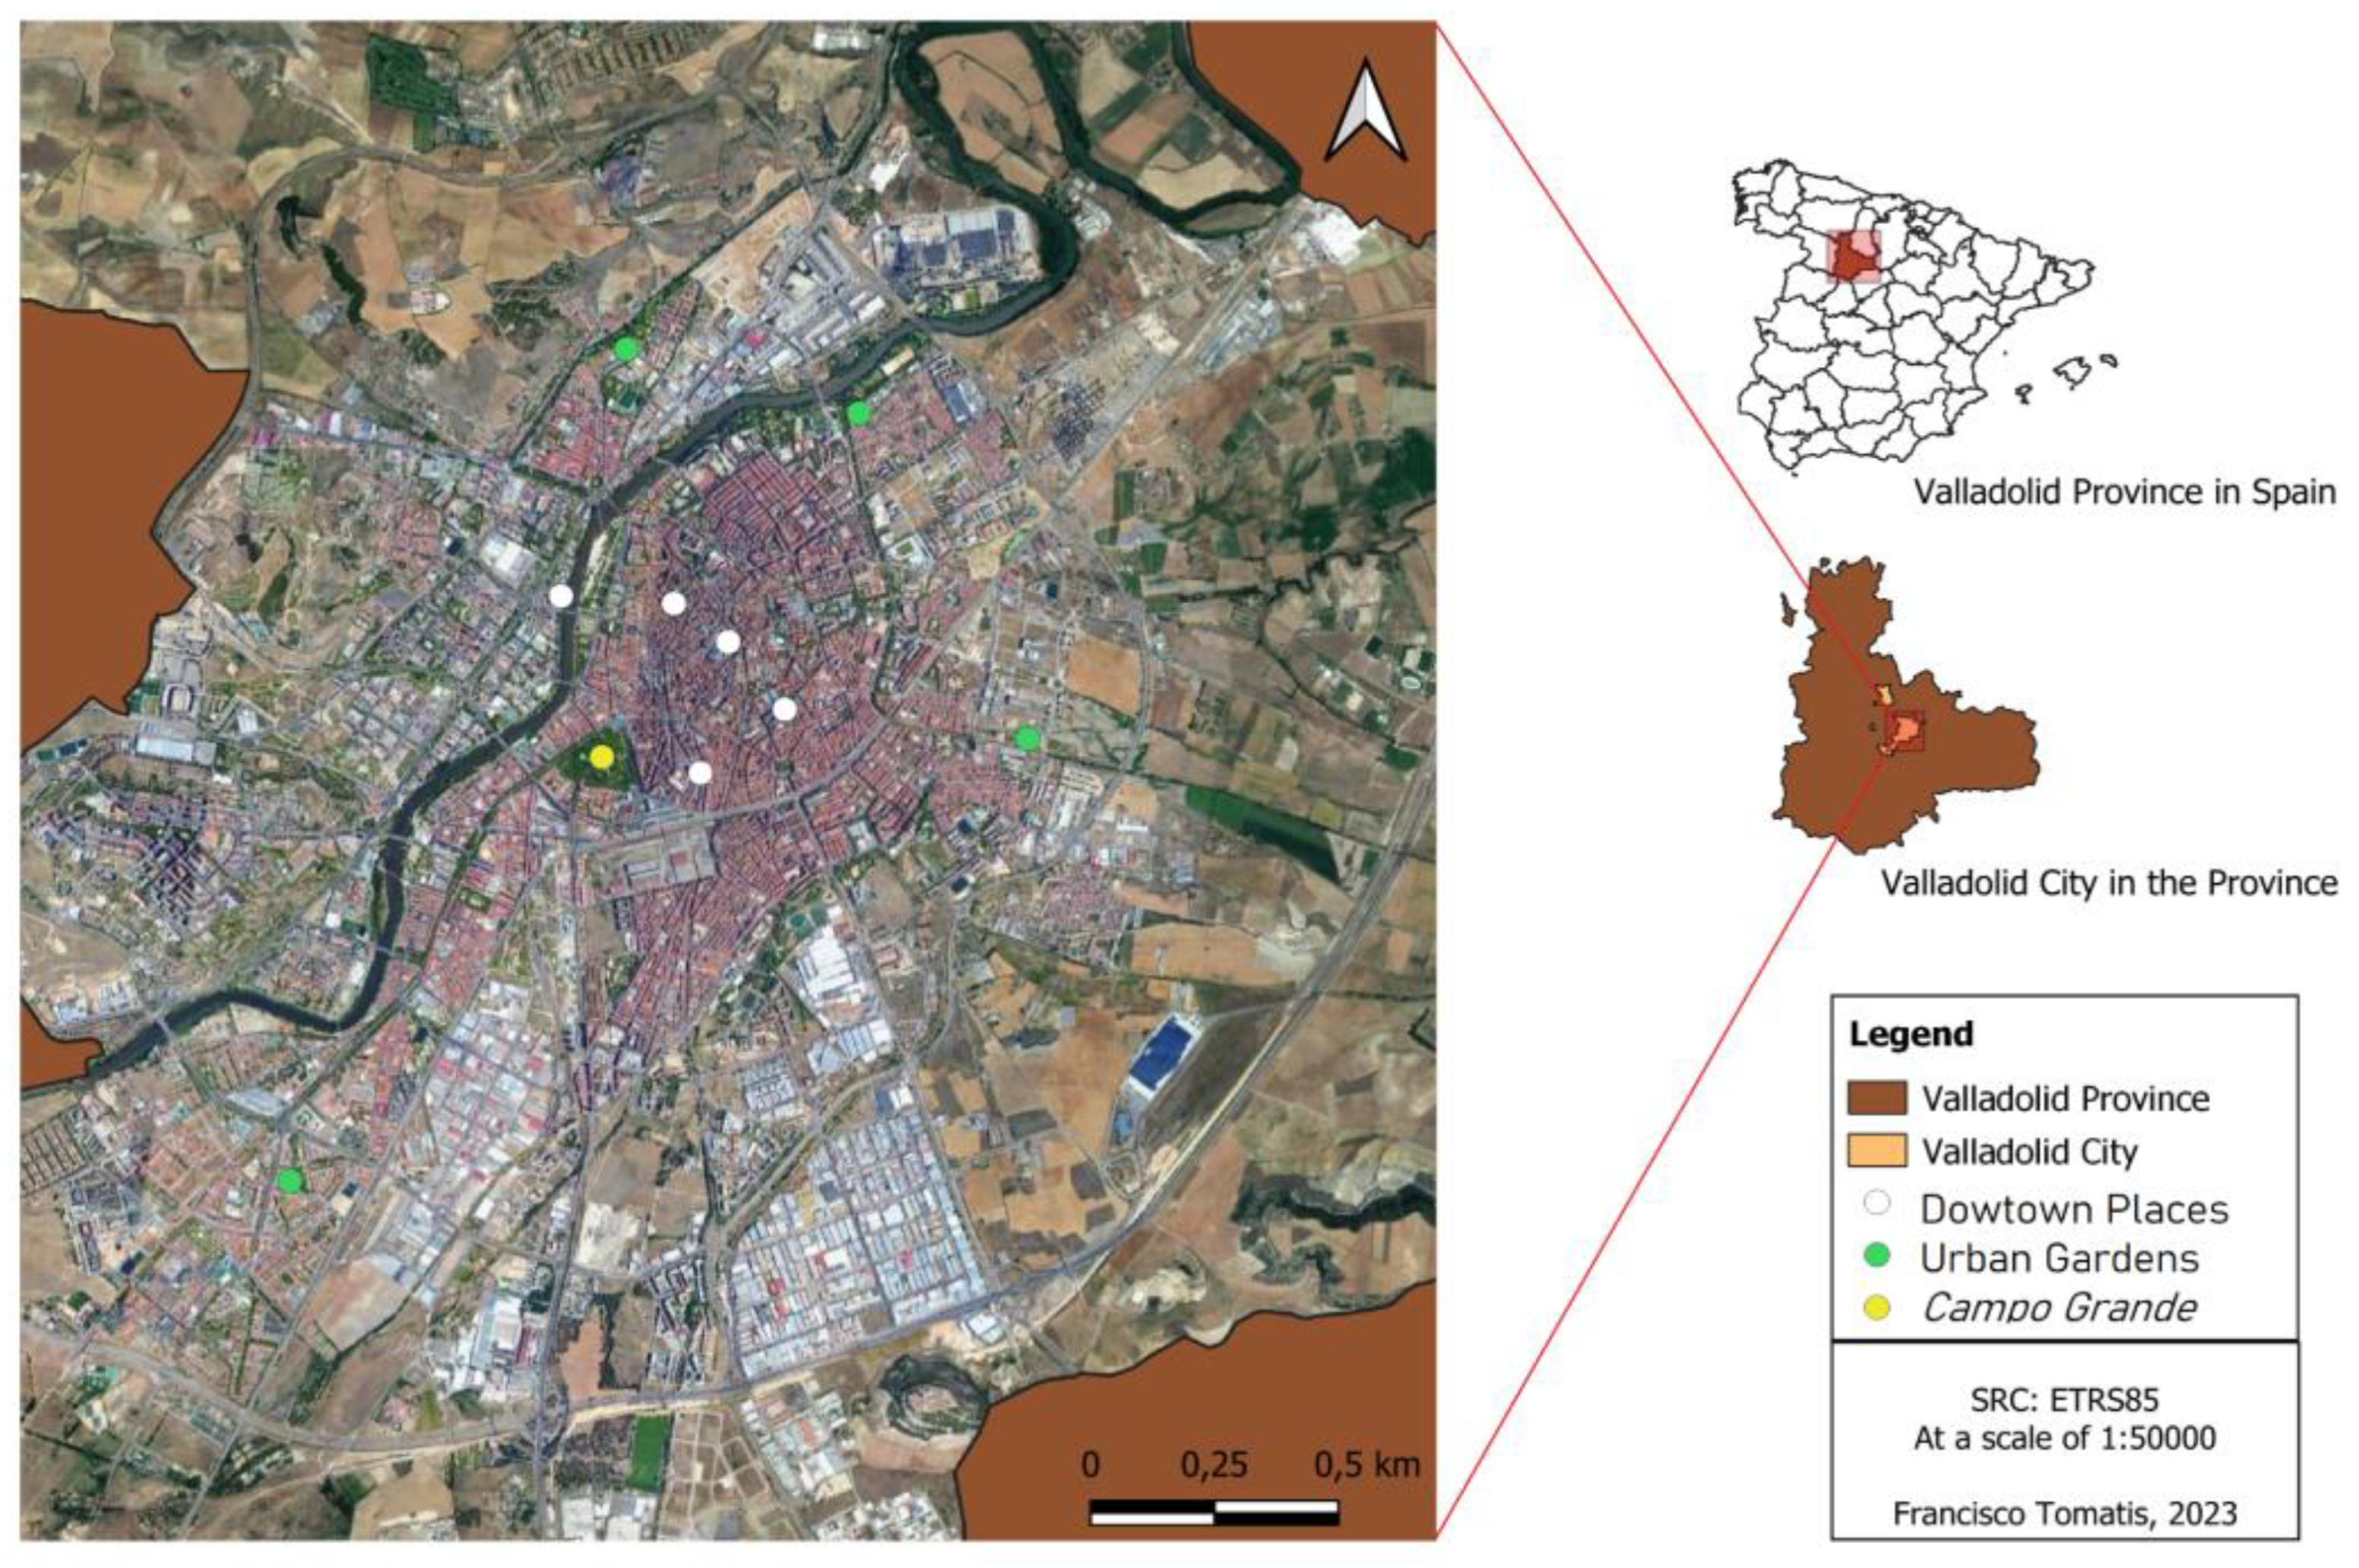
The urban temperature data in Valladolid were collected using twelve sensors from the University of Valladolid (Onset HOBO UA-002-64), strategically placed in four urban allotment gardens, namely “Jardín Botánico”, “Valle de Arán”, “Los Santos-Pilarica” and “Parque Alameda”, and two sensors placed in a forested urban called “Campo Grande”. Furthermore, data were collected from five nanosensors operated by the Valladolid City Council, situated in downtown places without vegetation namely “Puente Poniente”, “Plaza San Miguel”, “Catedral”, “Don Sancho” and “Dos de Mayo” (Figure 1).
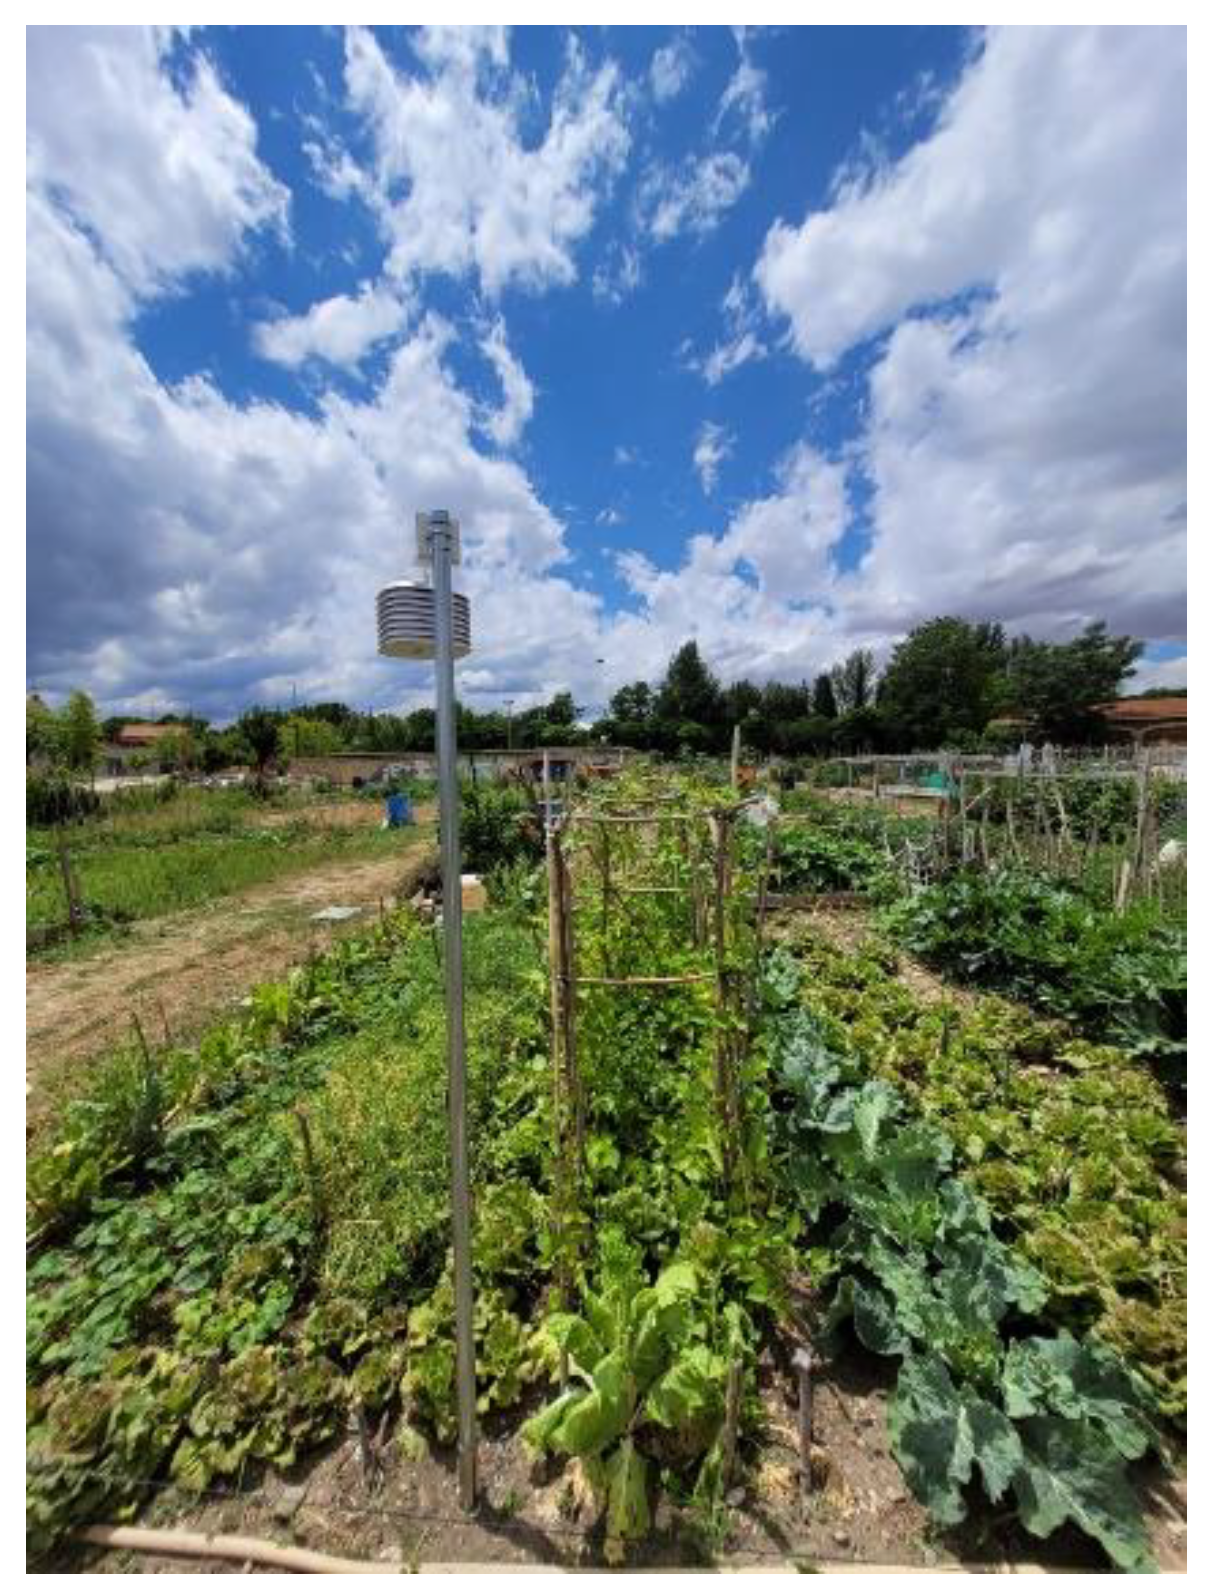
In each urban allotment garden, three sensors were strategically distributed
(Figure 2), whereas
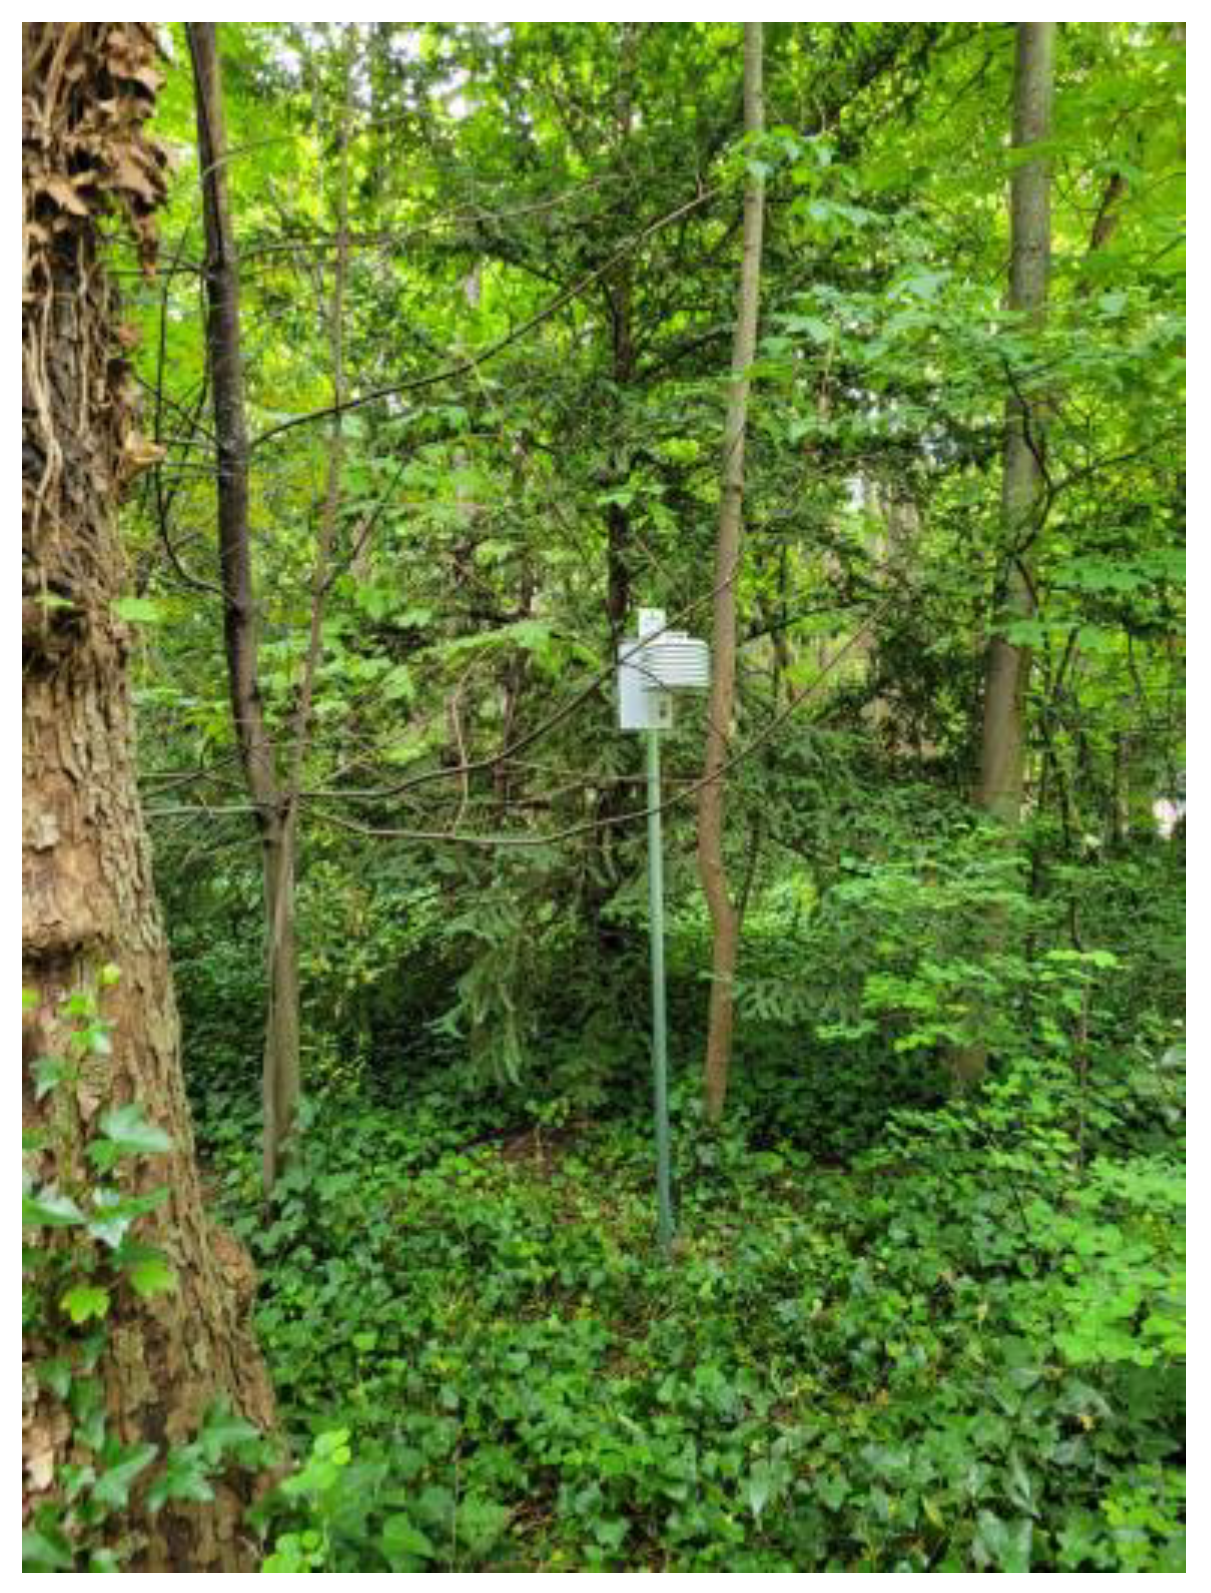
Campo Grande featured two sensors
(Figure 3). However, for the analysis of these data using for the ANNs, the average hourly values of each of the locations were taken into consideration. It is important to note that the initial data obtained from the sensors were hourly temperature readings, while the data from the Valladolid City Council sensors were recorded every 15 minutes. These readings were later converted into average hourly temperatures for further analysis with the ANNs.
Figure 1.
City of Valladolid, Spain. Location of all the sensors used in the work.
Figure 1.
City of Valladolid, Spain. Location of all the sensors used in the work.
Figure 2.
Sensor located in the urban allotment garden called Valle de Arán.
Figure 2.
Sensor located in the urban allotment garden called Valle de Arán.
Figure 3.
Sensor located in the forested urban park called Campo Grande.
Figure 3.
Sensor located in the forested urban park called Campo Grande.
For the standardization process of the different sensors, the devices from the University of Valladolid were positioned in the same locations as the sensors belonging to the Valladolid City Council, a process referred to as “calibration”. This calibration procedure spanned a total of 84 hours, commencing from 00 am on 21/06/2022 and concluding at 11 am on 24/06/2022. Subsequently, the values obtained from the sensors, which were synchronized with the official time of Spain, were adjusted to solar time (-2.5 hours), mirroring the time reference used by the sensors of the Valladolid City Council.
After the time correction, an additional step was taken to homogenize the data obtained from both sets of sensors. This homogenization was achieved using a scaling factor, defined as the ratio between the average hourly value observed by the sensors and the average hourly value observed by the Council sensors at each of the calibration sites. From this, individual scaling factors are determined for each of the five calibration sites, and an overall scaling factor calculated as the average of these five individual scaling factors (F=1.04). This overall scaling factor was then applied to each dataset obtained from the urban allotment gardens and Campo Grande. Through this approach, the data was effectively corrected based on time, resulting in a significant reduction in the disparities between the two types of sensors.
2.2. The best ANNs model designed to estimate urban temperatures
The developed architectures (X-Y-Z) changed the number of inputs (X), neurons in the hidden layers (Y) and outputs (Z). From this, various ANN models were constructed and assessed using different combinations of inputs, hidden neurons and outputs, following the practical guideline of "making networks simple, to obtain better results”. The six ANN architectures developed were: 7-Y-5; 6-Y-5; 7-Y-1; 6-Y-1; 3-Y-Z and 2-Y-1.
The initial data used for the ANNs were collected from urban sensors (from 21/06/2022 to 18/07/2022 for the training stage, and from 19/07/2022 to 31/07/2022 for the model validation stage).
The implementation of the ANNs was carried out in MATLAB, utilizing the '
feedforwardnet' function. The dimensions of the input and output data vectors determined the size of the respective layers, resulting in a multilayer feed-forward (MLP) perceptron with a single hidden layer. The activation function chosen between neurons in the hidden layer was the hyperbolic sigmoid tangent (
tansig), while the transfer function for neurons in the output layer was linear (
purelin). The Levenberg‒Marquardt back-propagation algorithm (BP-LM) was applied to achieve fast optimization (
trainlm) [
25].
The training of the ANNs was conducted using the 'train' function, utilizing matrices of input and output data vectors spanning a period of 28 days (from 21/06/2022 to 18/07/2022). Following the training phase, the ANNs were tested using the 'sim' function. This testing involved evaluating the previously trained ANNs with various numbers of neurons in the hidden layer (2, 3, 4, 5, 6, 7 and 8). The estimations were made separately for each urban garden and the forested urban park studied during a 13-day period (from 19/07/2022 to 31/07/2022). This dataset served as a reference for validation.
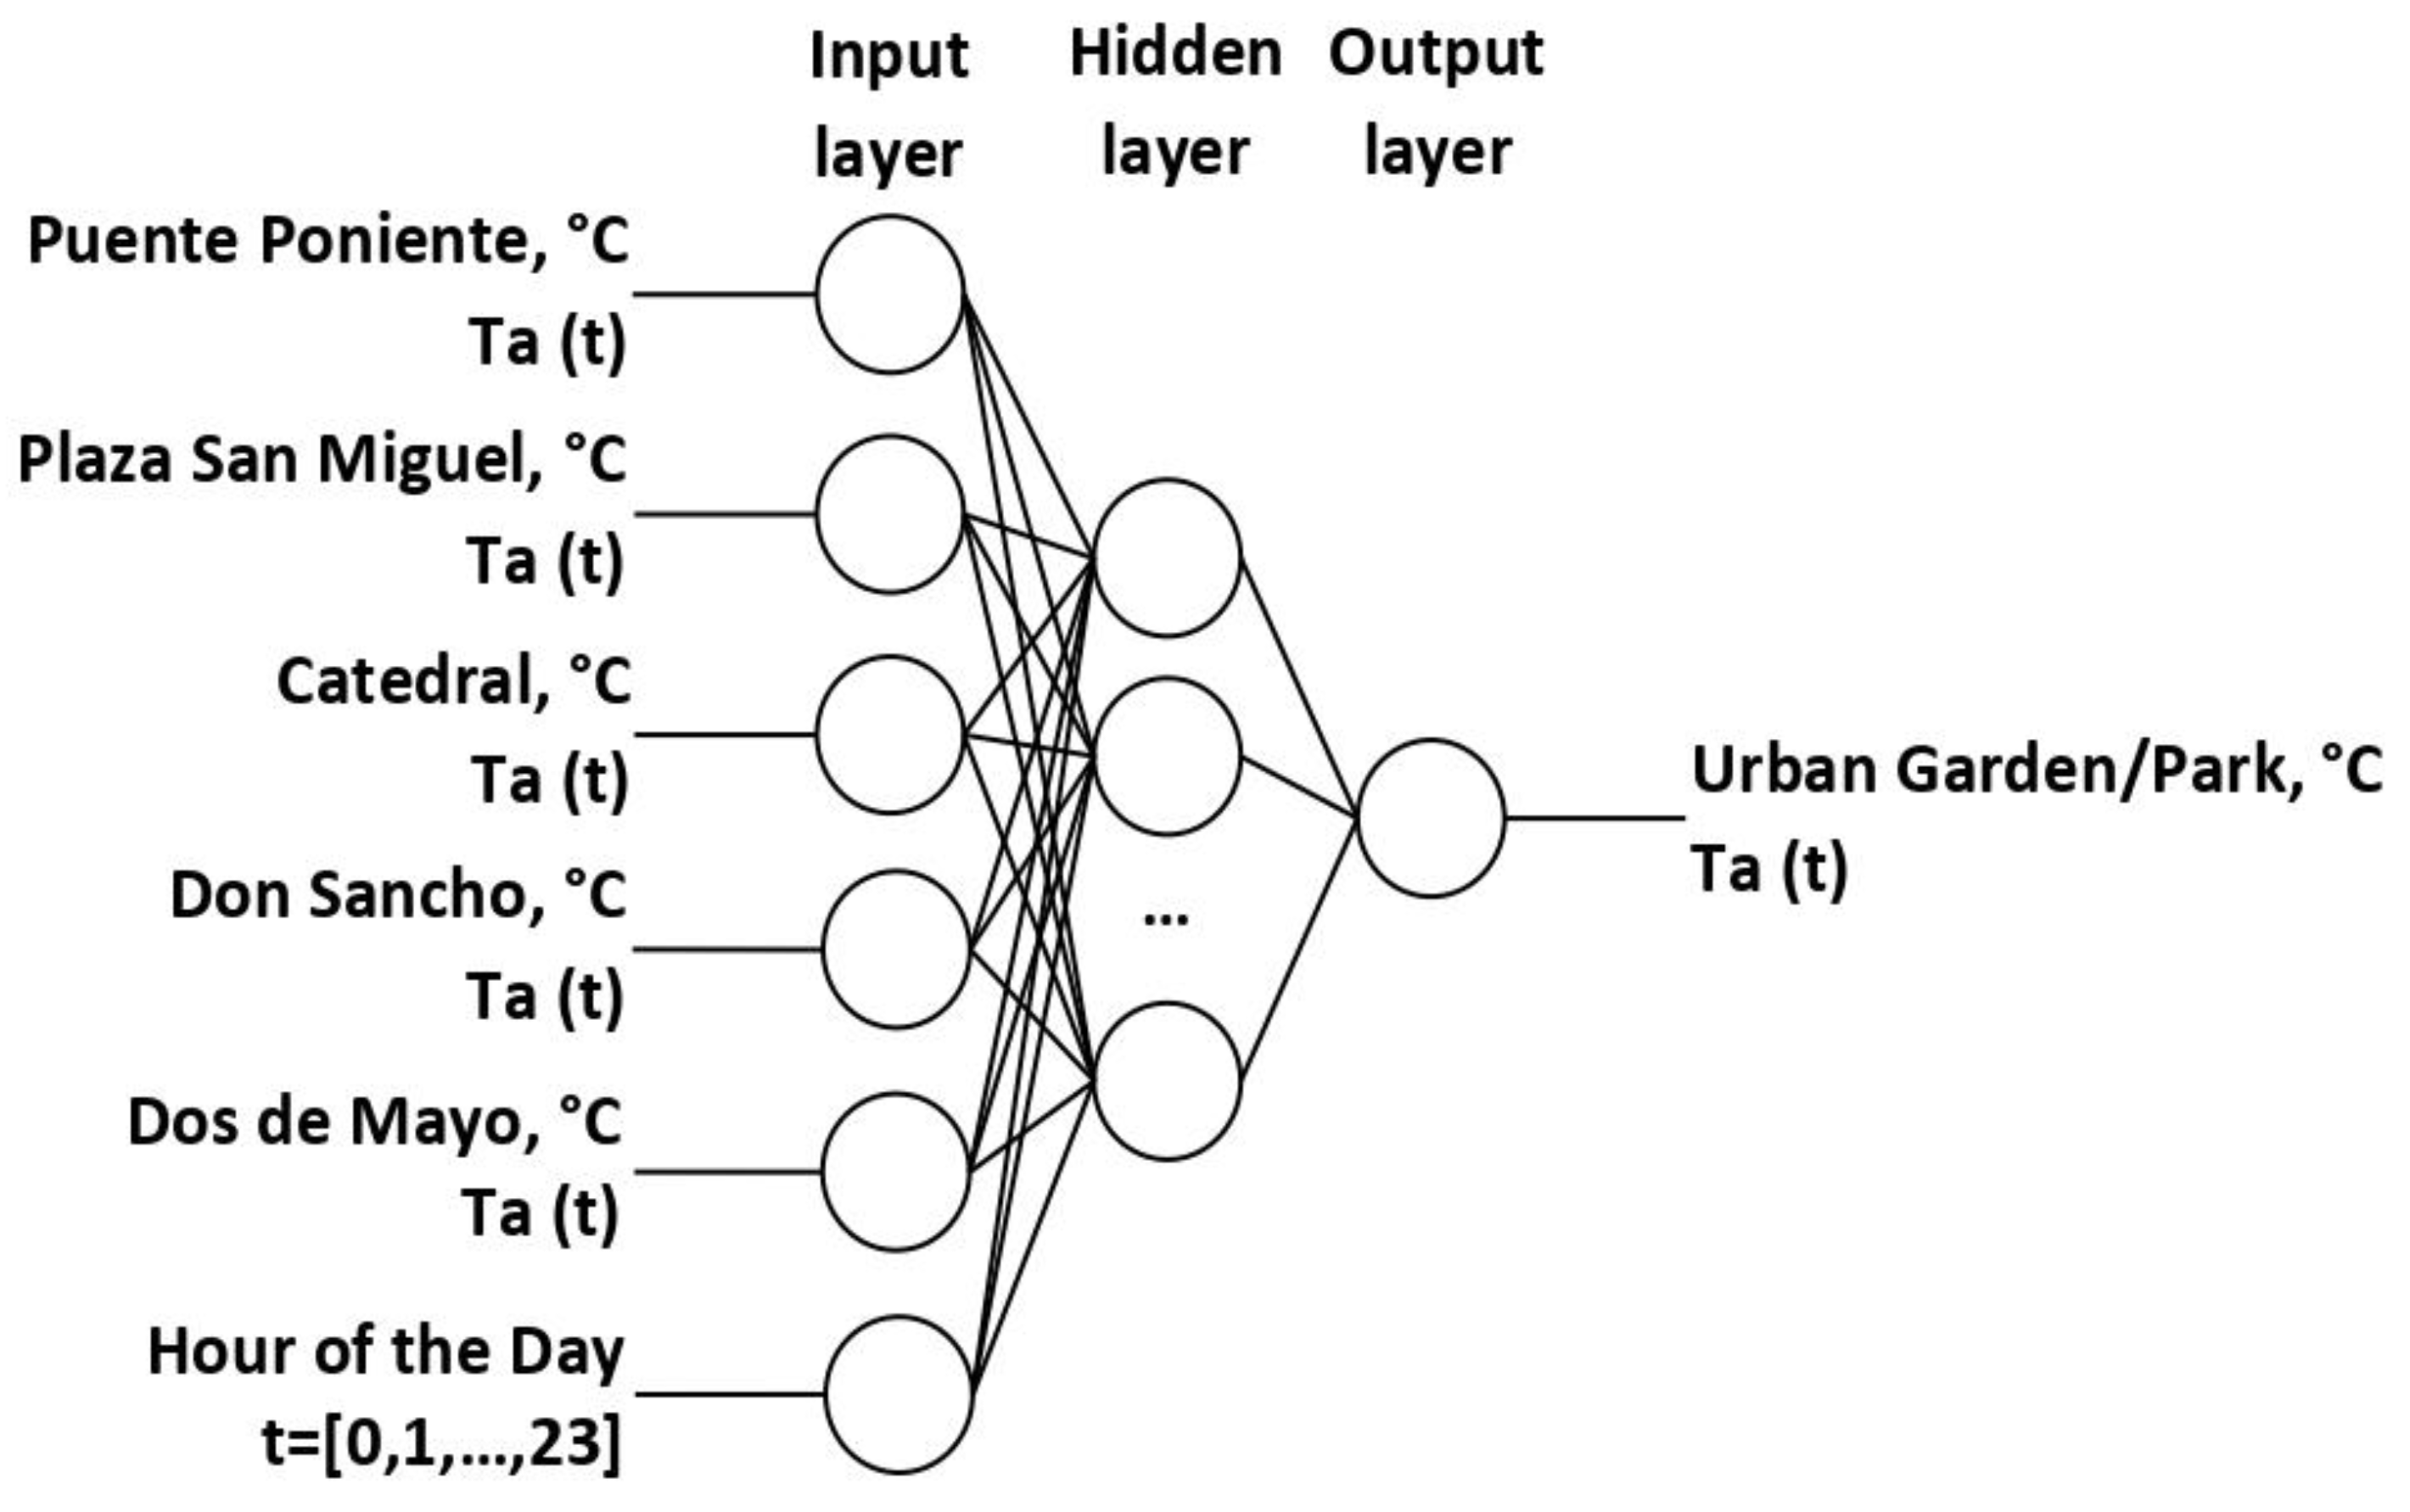
The most effective ANN for estimating urban temperatures was identified as the 6-Y-1 ANN architecture. This architecture for the evaluated models is depicted in
Figure 4, featuring six inputs: hourly ambient temperature from five downtown places without vegetation (
Puente Poniente,
Plaza San Miguel,
Catedral,
Don Sancho, and
Dos de Mayo) and one from the time of day (0, 1,…, 23). The output layer was designed with a single neuron, enabling the estimation of ambient temperatures for each urban gardens and for
Campo Grande, considering the specific time of day.
Figure 4.
6-Y-1 ANN architecture provided the best results for predictions.
Figure 4.
6-Y-1 ANN architecture provided the best results for predictions.
2.3. The statistics used to analyze the results obtained by the prediction models based on ANNs
The accuracy of the ANNs models in the validation stage was carried out by analyzing statistics values, which include: Root Mean Square Error (RMSE, temperature ºC) using Equation (1); the Coefficient of Determination (
), as an indicator of the level of model fit, using Equation (2), the Durbin–Watson Coefficient (DW), used to detect first-order self-correction between the data, using Equation (3); the Mean Percentage Error (MPE), which allows the interpretation of the bias in the prediction error, employing Equation (4); and the Forecast Accuracy (FA), which is used in short-term forecasting models, using Equation (5).
3. Results
This section presents the results achieved through the various ANNs models created for the hourly estimation of average ambient temperature in the four urban allotment gardens and in Campo Grande situated in Valladolid.
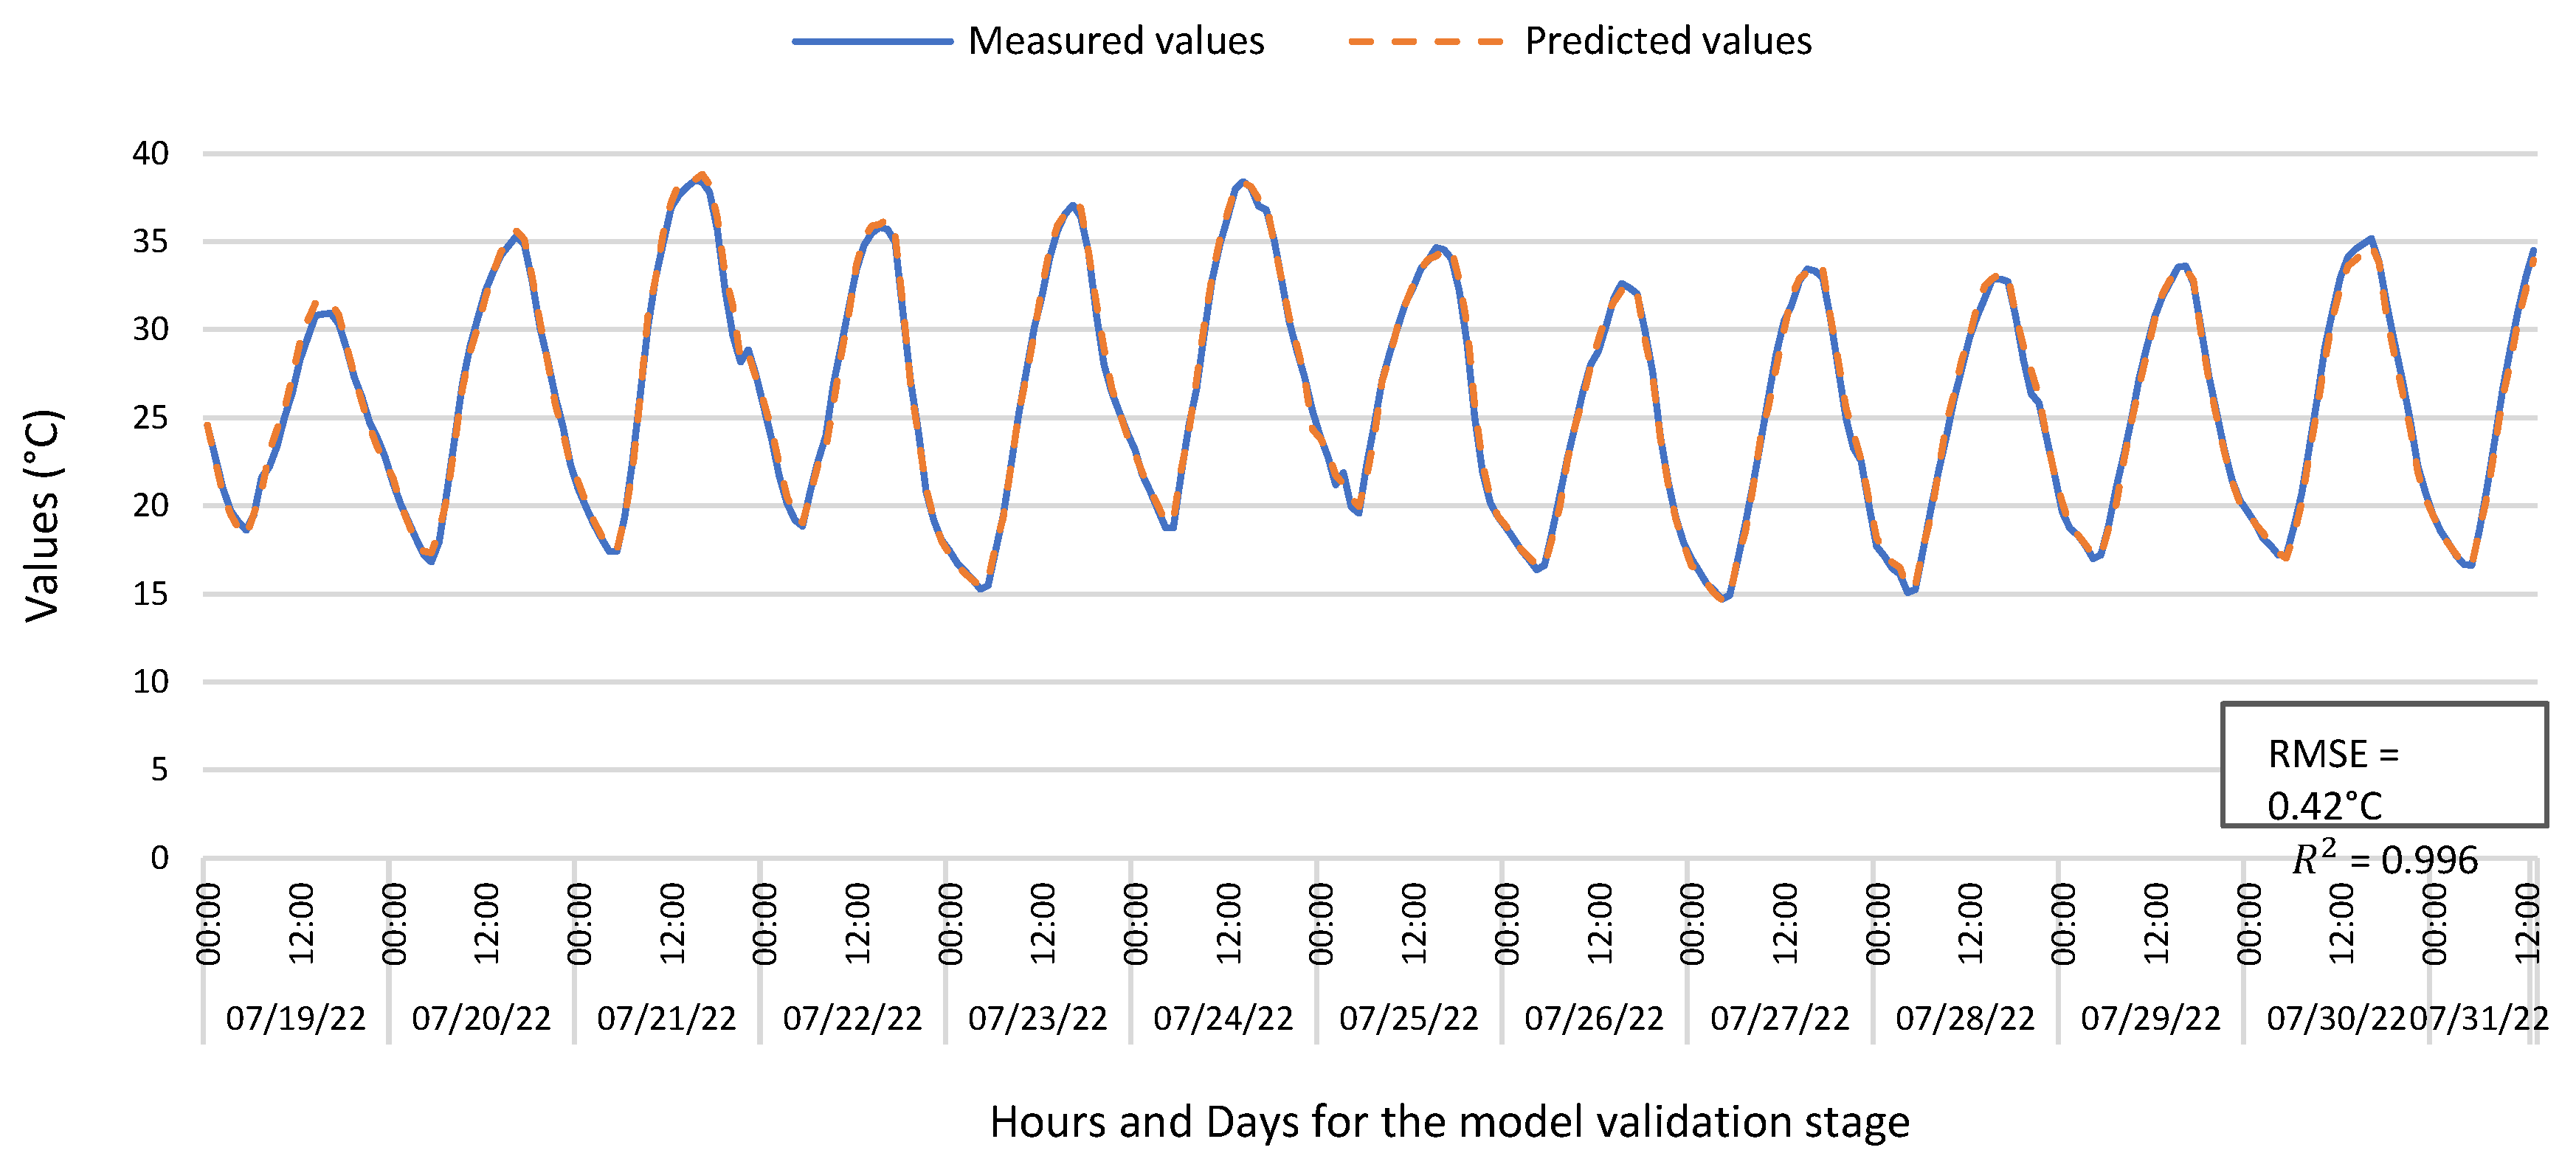
According to the results given by the statistical values, the 6-Y-1 ANN architecture have the best prediction results over the other architectures. The best values obtained in the 6-Y-1 ANN architecture are RMSE = 0.42 °C and
= 0.996 (ANN 6-7-1) for
Valle de Arán (
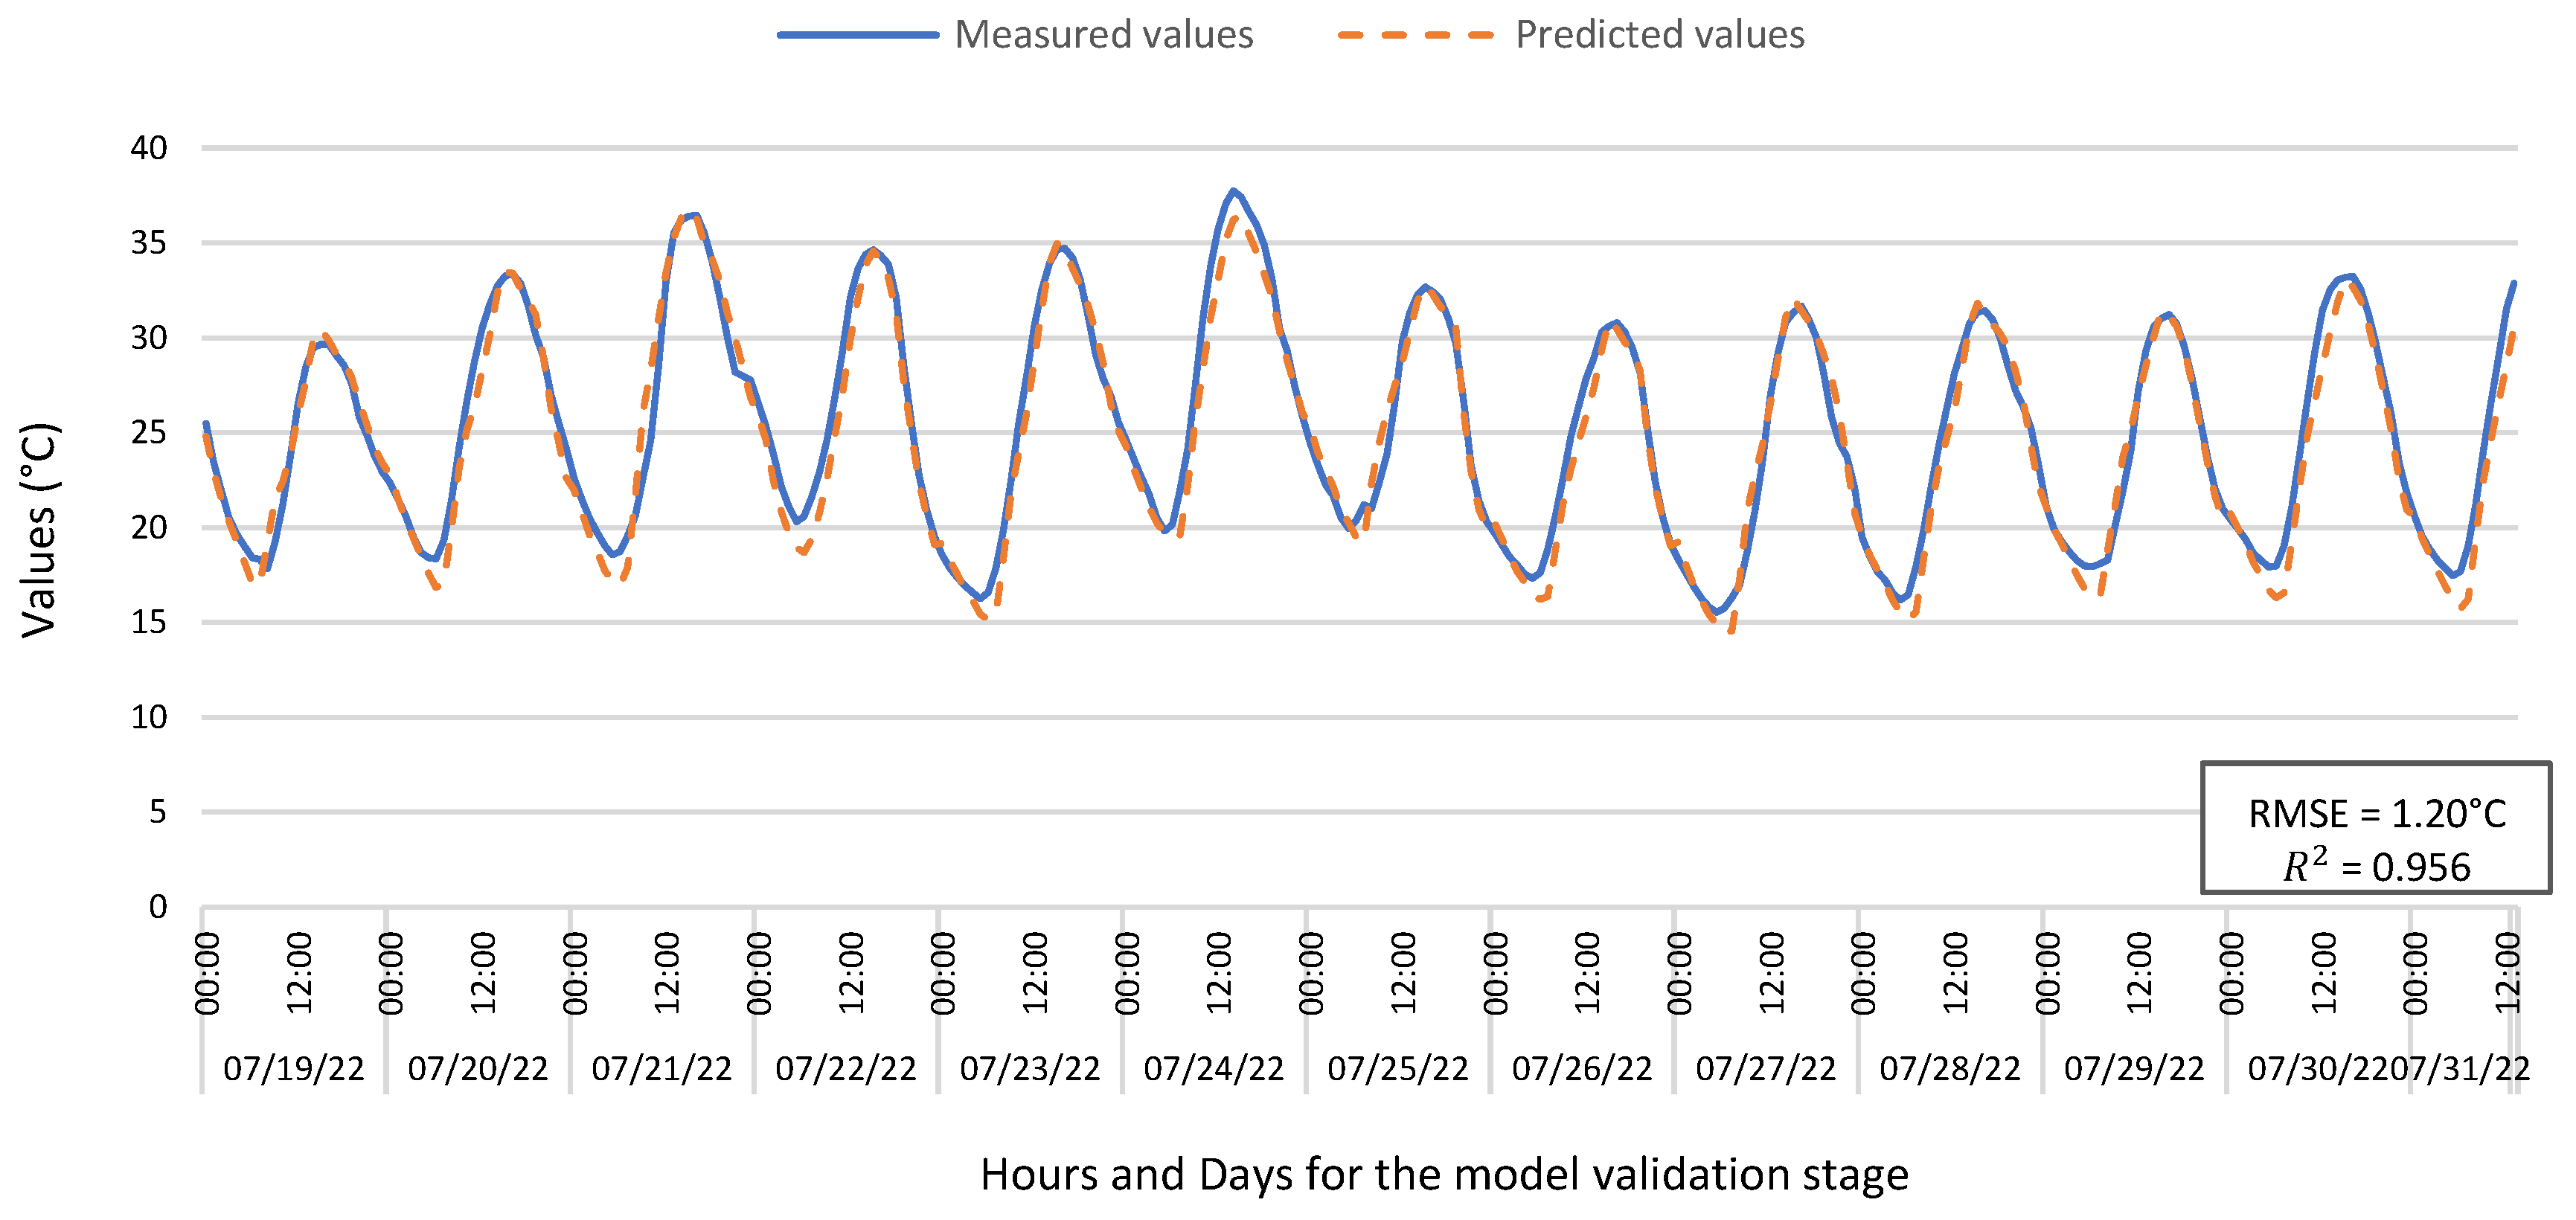
Figure 5). On the other hand, the worst forecast results for the same architecture (ANN 6-2-1 and ANN 6-3-1) are for
Campo Grande (
Figure 6) with values of RMSE =1.20°C and
= 0.956.
Figure 5.
Measured data and predictions in Valle de Arán for the validation stage, obtained with the 6-7-1 ANN with the best forecast results of the 6-Y-1 ANN architecture.
Figure 5.
Measured data and predictions in Valle de Arán for the validation stage, obtained with the 6-7-1 ANN with the best forecast results of the 6-Y-1 ANN architecture.
Figure 6.
Measured data and predictions in Campo Grande for the validation stage, obtained with the 6-2-1 ANN with the worst forecast of the 6-Y-1 ANN architecture.
Figure 6.
Measured data and predictions in Campo Grande for the validation stage, obtained with the 6-2-1 ANN with the worst forecast of the 6-Y-1 ANN architecture.
Considering the RMSE values, in the 7-Y-5 ANN arquitecture, the best value was 0,62°C (ANN 7-10-5 for Valle de Arán) and the worst value was 4,58°C (ANN 7-11-5 for Campo Grande). In the 6-Y-5 arquitecture, the best value was 0,45°C (ANN 6-8-5 for Valle de Arán) and the worst value was 1,26°C (ANN 6-9-5 for Campo Grande). Shifting to the 7-Y-1 ANN arquitecture, the most promising reading was 0,68°C (ANN 7-6-1 for Jardín Botánico), whereas the least optimal figure came in at 2,05°C (ANN 6-9-5 for Campo Grande).
In the case of 3-Y-Z ANN architecture, the highest recorded value was 1.34°C (ANN 3-7-1 for Campo Grande), while the lowest recorded value was 1.99°C (ANN 3-1-1 for Campo Grande). Conversely, within 2-Y-1, the most favorable results were achieved by ANN 2-7-1 and ANN 2-8-1 at 0.85°C, both for Jardín Botánico, whereas the least favorable result was observed in ANN 2-1-1 at 2.10°C, specifically for Campo Grande.
The 7-Y-5, 6-Y-5, 7-Y-1, and 6-Y-1 ANN architectures are deemed the most significant due to their outcomes and their applicability. On the other hand, the 3-Y-Z and 2-Y-1 ANN architectures were performed as special tests in search of better results. For the 3-Y-Z case, combinations between "Puente Poniente vs. Jardín Botánico" and "Dos de Mayo vs. Campo Grande" were tested, while in the 2-Y-1 architecture the combinations of "Puente Poniente 2 vs. Jardín Botánico" "Don Sancho + Dos de Mayo vs. Campo Grande" and "Dos de Mayo 2 vs. Campo Grande" were tested.
4. Discussion
Considering all the models developed and evaluated, a range of values was obtained, varying from RMSE = 0.42°C and = 0.996 (best values achieved) to values of RMSE = 4.58°C y = 0.281 (worst values obtained). These are demonstrated in the 6-Y-1 ANN architectures (output for Valle de Arán: ANN 6-7-1) and in the 7-Y-5 ANN architectures (output for Campo Grande: ANN 7-11-5) respectively.
In all the models developed, as in the ANN 6-Y-1 architecture, the worst results found in the predictions made for Campo Grande. This is perhaps mainly attributed to the type or amount of vegetation (permanently forested).
Results reveal that the 6-Y-1 ANN architecture outperformed the other architectures developed when the "Day" input was eliminated. This improvement was observed in all cases where the ANNs input did not include the "Day" variable, such as in ANN 7-Y-1. Initially, the "Day" variable was incorporated in these tests to situate the ANNs in the time of the year.
Surprisingly, the inclusion of the "Day" variable worsened the results for this specific test, which was conducted over a short period. These findings contradict the results reported in Diez et al. [
25], where daily predictions were made for a longer period (one year). In that study, adding the "Day" variable led to improvements in the ANNs results. This suggests that adding the "Day" variable is beneficial for predictions in longer data series, where seasonal patterns have a significant influence. However, in a series of only a few days, where the seasonal variable does not exert a significant influence, the inclusion of the "Day" variable did not improve the results.
This discrepancy underscores the importance of considering the appropriate input variables depending on the specific context and the length of the data series under examination. The findings highlight the complexity of ANNs models and the need for careful selection and customization of input variables to optimize predictive performance for different scenarios.
The study shows that the parameters used in the ANNs optimize its performance. Nevertheless, the application of certain algorithms can enhance their performance further, opening avenues for future research.
The consideration and comparison with other related models allow us to consider the results obtained in this study as valid and interesting. While there is limited research of this nature, especially in light of studies such as those conducted by Keskin et al. [
28], who reported RMSE results of 0.94°C, as well as the findings by Snell et al. [
30], who recorded RMSE values exceeding 4.00°C, and Rigol et al. [
31], who achieved the most favorable RMSE value of 1.15°C, the outcomes presented in this study provide a compelling rationale for further advancements and enhancements in this field.
5. Conclusions
In urban areas, green spaces are essential for mitigating rising temperatures and the UHI effect, which are increasingly prominent due to 21st century demographic and climatic changes. However, studying their impact is challenging due to inaccuracies in traditional meteorological data and risks associated with in situ sensors. In this study, we used ANNs to predict temperatures in Valladolid, specifically in four urban gardens (Jardín Botánico, Valle de Arán, Los Santos Pilarica and Parque Alameda) and in a forested urban park like Campo Grande.
This approach, based on urban data collected during a short and specific period (from 06/21/2022 to 07/18/2022 for training the models, and from 07/19/2022 to 07/31/2022 for validating the models), highlights ANN as an innovative solution for research in this area.
Following the practical rule of "making networks simple, to obtain better results", it was identified that the 6-Y-1 ANN architecture outperformed other architectures (7-Y-5; 6-Y-5; 7-Y-1; 3-Y-Z and 2-Y-1) developed in this study. The 6-Y-1 ANN architecture, based on RMSE values (RMSE = 0.42°C), presents the best output in Valle de Arán (6-7-1 ANN).
The methodologies and results of other estimation and prediction models present in various bibliographies [
25,
27,
28,
29,
30,
31] allow us to consider the results obtained in this study valid and useful. In this specific case, the research has enabled the estimation of urban temperatures within selected urban green spaces in Valladolid, providing insights into their potential for mitigating urban heat. This accomplishment has been realized without the necessity of deploying on-site sensors for extended periods.
ANNs dedicated to urban temperature analysis hold immense potential for urban planning and research, aiding in understanding the urban climate, forecasting future temperatures, identifying temperature mitigation strategies and even for managing urban crops. This approach contributes to creating more sustainable and resilient urban spaces, enhancing the overall urban living experience.
Moreover, the study showcases that ANNs can provide crucial environmental information without the need for long-term establishment of urban sensors, which are often costly and carry inherent risks. Thus, ANNs present a practical and effective approach to obtaining essential climate data for urban areas. In this specific case study, it is demonstrated that the implementation of specific algorithms can enhance the performance of the developed models, thereby paving the way for future research opportunities.
Author Contributions
Conceptualization: F.T., F.J.D. and L.M.N-G.; methodology: F.T. and F.J.D.; software: F.T. and F.J.D.; validation: F.J.D., M.S.W. and L.M.N-G.; formal analysis: F.J.D., M.S.W. and L,M. N.-G.; investigation: F.T. and F.J.D.; resources: L.M.N-G; data curation: F.J.D. and M.S.W.; writing—original draft preparation: F.T.; writing—review and editing: F.T., F.J.D., M.S.W. and L.M.N-G.; visualization: F.T. and F.J.D.; supervision: M.S.W. and L.M.N-G.; project administration, L.M.N-G.; funding acquisition, L.M.N-G. All authors have read and agreed to the published version of the manuscript.
Funding
This research was funded by the European Union supporting this work through the FUSILLI project (H2020-FNR-2020-1/CE-FNR-07-2020) and the CIRAWA project (HORIZON-CL6-2022-FARM2FORK-01). Francisco Tomatis has been financed under the call for University of Valladolid 2020 predoctoral contracts, co-financed by Banco Santander.
Conflicts of Interest
The authors declare no conflict of interest.
References
- Camps-Calvet, M., Langemeyer, J., Calvet-Mir, L., & Gómez-Baggethun, E. Ecosystem services provided by urban gardens in Barcelona, Spain: Insights for policy and planning. Environmental Science and Policy 2016, 62, 14–23. [CrossRef]
- UN-Habitat. Envisaging the Future of Cities. World Cities Report 2022. World Cities Report 2022.
- Colding, J., Barthel, S., Ljung, R., Eriksson, F., & Sjöberg, S. Urban Commons and Collective Action to Address Climate Change. Social Inclusion 2022, 10(1), 103–114. [CrossRef]
- Dennis, M., & James, P. Ecosystem services of collectively managed urban gardens: Exploring factors affecting synergies and trade-offs at the site level. Ecosystem Services 2017, 26, 17–26. [CrossRef]
- Oke, T. R. The energetic basis of the urban heat island. Quarterly Journal of the Royal Meteorological Society 1982, 108(455), 1–24. [CrossRef]
- Rost, A. T., Liste, V., Seidel, C., Matscheroth, L., Otto, M., Meier, F., & Fenner, D. How cool are allotment gardens? A case study of nocturnal air temperature differences in Berlin, Germany. Atmosphere 2020, 11(5). [CrossRef]
- Coronel, A. S., Feldman, S. R., Jozami, E., Kehoe, Facundo., Piacentini, R.D., Dubbeling, M., & Escobedo, F. J. Effects of urban green areas on air temperature in a medium-sized Argentinian city. AIMS Environmental Science 2015, 2(3), 803–826. [CrossRef]
- Fernández, F., Montávez, J. P., Jesús, , González-Rouco, F., & Valero, F. Relación Entre La Estructura Espacial De La Isla Térmica Y La Morfología Urbana De Madrid. El Clima, Entre El Mar y La Montaña 2004, 641–650.
- Norton, B. A., Coutts, A. M., Livesley, S. J., Harris, R. J., Hunter, A. M., & Williams, N. S. G. Planning for cooler cities: A framework to prioritise green infrastructure to mitigate high temperatures in urban landscapes. Landscape and Urban Planning 2015, 134, 127–138. [CrossRef]
- Huang, L., Li, J., Zhao, D., & Zhu, J. A fieldwork study on the diurnal changes of urban microclimate in four types of ground cover and urban heat island of Nanjing, China. Building and Environment 2008, 43(1), 7–17. [CrossRef]
- Tsilini, V., Papantoniou, S., Kolokotsa, D. D., & Maria, E. A. Urban gardens as a solution to energy poverty and urban heat island. Sustainable Cities and Society 2015, 14(1), 323–333. [CrossRef]
- Mancebo, F. Gardening the city: Addressing sustainability and adapting to global warming through urban agriculture. Environments 2018, 5(3), 1–11. [CrossRef]
- AghaKouchak, A., Cheng, L., Mazdiyasni, O., & Farahmand, A. Global warming and changes in risk of concurrent climate extremes: Insights from the 2014 California drought. Geophysical Research Letters 2014, 41(24), 8847–8852. [CrossRef]
- Mann, M. E., & Gleick, P. H. Climate change and California drought in the 21st century. Proceedings of the National Academy of Sciences of the United States of America 2015, 112(13), 3858–3859. [CrossRef]
- Patz, J. A., Campbell-Lendrum, D., Holloway, T., & Foley, J. A. Impact of regional climate change on human health. Nature 2005, 438(7066), 310–317. [CrossRef]
- Lin, B. B., & Egerer, M. H. Global social and environmental change drives the management and delivery of ecosystem services from urban gardens: A case study from Central Coast, California. Global Environmental Change 2020, 60, 102006. [CrossRef]
- Lin, B. B., Egerer, M. H., Liere, H., Jha, S., Bichier, P., & Philpott, S. M. Local- and landscape-scale land cover affects microclimate and water use in urban gardens. Science of the Total Environment 2018, 610–611, 570–575. [CrossRef]
- Small, G., Jimenez, I., Salzl, M., & Shrestha, P. Urban heat island mitigation due to enhanced evapotranspiration in an urban garden in Saint Paul, Minnesota, USA. WIT Transactions on Ecology and the Environment 2020, 243, 39–45. [CrossRef]
- Reginster, I., & Rounsevell, M. Scenarios of future urban land use in Europe. Environment and Planning B: Planning and Design 2006, 33(4), 619–636. [CrossRef]
- Schäffler, A., & Swilling, M. Valuing green infrastructure in an urban environment under pressure - The Johannesburg case. Ecological Economics 2013, 86, 246–257. [CrossRef]
- Bowler, D. E., Buyung-Ali, L., Knight, T. M., & Pullin, A. S. Urban greening to cool towns and cities: A systematic review of the empirical evidence. Landscape and Urban Planning 2010, 97(3), 147–155. [CrossRef]
- Gill, S. E., Handley, J. F., Ennos, A. R., & Pauleit, S. Adapting Cities for Climate Change: The Role of the Green Infrastructure LK. Built Environment 2007, 33(1), 115–132.
- Shashua-Bar, L., Pearlmutter, D., & Erell, E. The cooling efficiency of urban landscape strategies in a hot dry climate. Landscape and Urban Planning 2009, 92(3–4), 179–186. [CrossRef]
- Zhang, Z. Multivariate Time Series Analysis in Climate and Environmental Research. In Multivariate Time Series Analysis in Climate and Environmental Research 2017. [CrossRef]
- Diez, F. J., Boukharta, O. F., Navas-Gracia, L. M., Chico-Santamarta, L., Martínez-Rodríguez, A., & Correa-Guimaraes, A. Daily Estimation of Global Solar Irradiation and Temperatures Station Concept in Castilla and León, Spain. Sensors 2022, 22, 7772. [CrossRef]
- Diez, F. J., Correa-Guimaraes, A., Chico-Santamarta, L., Martínez-Rodríguez, A., Murcia-Velasco, D. A., Andara, R., & Navas-Gracia, L. M. Prediction of Daily Ambient Temperature and Its Hourly Estimation Using Artificial Neural Networks in an Agrometeorological Station in Castile and León, Spain. Sensors 2022, 22(13). [CrossRef]
- Franco, B. M., Hernández-Callejo, L., & Navas-Gracia, L. M. Virtual weather stations for meteorological data estimations. Neural Computing and Applications 2020, 32(16), 12801–12812. [CrossRef]
- Keskin, M., Dogru, A. O., Balcik, F. B., Goksel, C., Ulugtekin, N., & Sozen, S. Energy Systems and Management 2015, 33–42. [CrossRef]
- Antonic, O., Križan, J., Marki, A., & Bukovec, D. Spatio-temporal interpolation of climatic variables over large region of complex terrain using neural networks. Ecological Modelling 2001, 138(1–3), 255–263. [CrossRef]
- Snell, S. E., Gopal, S., & Kaufmann, R. K. Spatial interpolation of surface air temperatures using artificial neural networks: Evaluating their use for downscaling GCMs. Journal of Climate 2000, 13(5), 886–895. [CrossRef]
- Rigol, J. P., Jarvis, C. H., & Stuart, N. Artificial neural networks as a tool for spatial interpolation. International Journal of Geographical Information Science 2001, 15(4), 323–343. [CrossRef]
- GEOCyL and CARTIF. Estrategia de Adaptación al Cambio Climático del Municipio de Valladolid. Programa Operativo de Cooperación Transfonteriza España-Portugal POCTEP 2014-202. 2020.
- INE. Población por sexo, municipios y edad (grupos quinquenales). 2022. Available here: https://www.ine.es/jaxiT3/Datos.htm?t=33950 (Date of visit 03/06/2023).
|
Disclaimer/Publisher’s Note: The statements, opinions and data contained in all publications are solely those of the individual author(s) and contributor(s) and not of MDPI and/or the editor(s). MDPI and/or the editor(s) disclaim responsibility for any injury to people or property resulting from any ideas, methods, instructions or products referred to in the content. |
© 2023 by the authors. Licensee MDPI, Basel, Switzerland. This article is an open access article distributed under the terms and conditions of the Creative Commons Attribution (CC BY) license (http://creativecommons.org/licenses/by/4.0/).
