Introduction
The Fontan circulation have been established in patients with single ventricle physiology, which could extend survival into adulthood and had improved their quality of life [
1]. However, patients with functional single ventricle (FSV) circulations have poor long-term outcomes as they experience symptoms related to circulatory failure [
2]. Diastolic ventricular dysfunction is more prevalent than systolic ventricular dysfunction after performing the Fontan procedure [
3,
4]. Impaired ventricular filling and increased ventricular afterload are obvious contributors to cardiac inefficiency. Long term follow-up of repaired Fontan (rFontan) patients is mandatory, due to disturbed blood flow pattern and decreased cardiac function are presented.
Standard cardiovascular imaging technique like echocardiography has limited capability of studying intracardiac hemodynamics because of predominant reliance on 2-dimensional planar flow information[
5]. Four-dimensional flow (4D flow) cardiovascular magnetic resonance (CMR) can retrospectively measure intra and extracardiac great vessels blood flow draining in and out of the heart [
6,
7,
8].4D flow CMR provide a detailed information about the three-directional velocities which can capture intracardiac subtle intricacies of blood flow in congenital heart disease (CHD) [
9]. Moreover, intracardiac flow analysis by 4D flow CMR could assess higher-order fluid dynamic metrics such as kinetic energy (KE) [
10] and viscous energy loss (EL) in FSV patients [
11]. Previously, some authors reported ventricular diastolic dysfunction evaluation using KE in Fontan patients [
12,
13]. At present, it should be concerned that the hemodynamic disturbances were neglected in Fontan patients [
4]. Knowledge on the consequences of intracardiac flow component and KE parameters might be useful in unraveling the pathophysiological mechanisms of Fontan circulatory dysfunction. The purposes of this study were to 1) analyze rFontan-related hemodynamic disturbances in single ventricle physiology patients and compare with controls; 2) investigate LV diastolic dysfunction of 4D flow parameters in rFontan group; 3) compare intracardiac flow parameters of morphologic LV FSV and RV FSV in rFontan patient groups.
Materials and methods
Study population
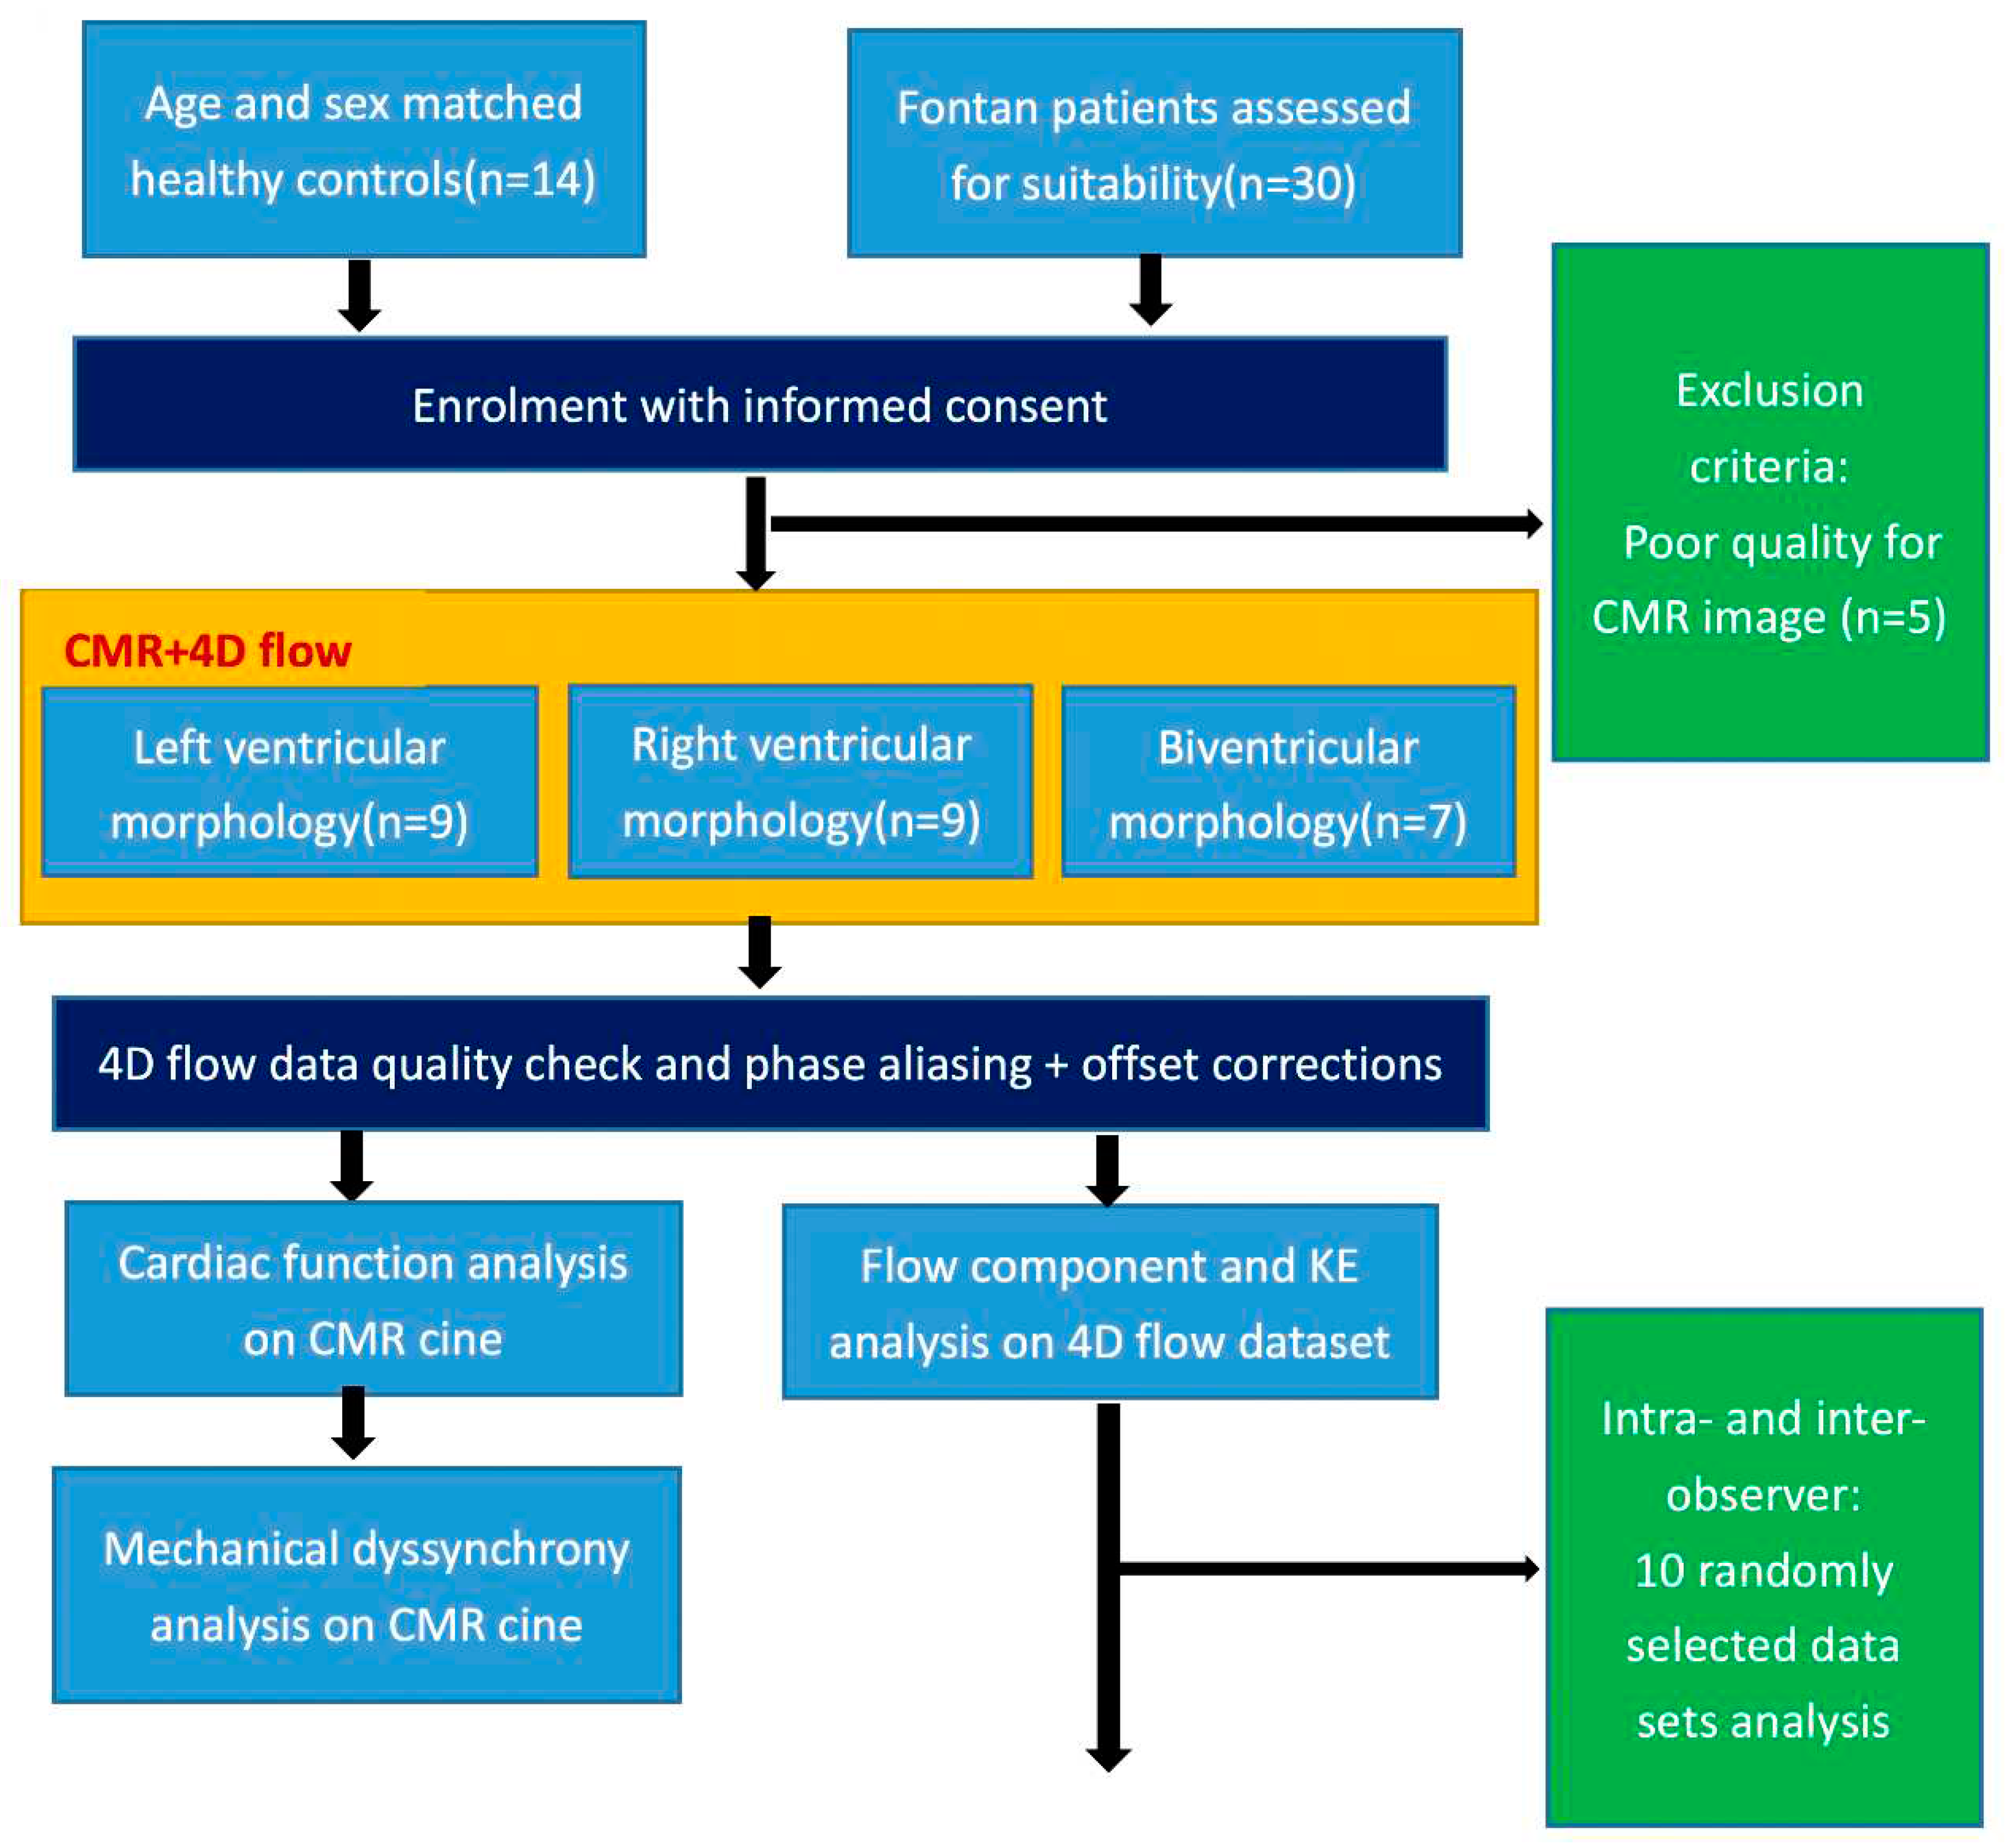
A prospective consecutive 30 rFontan patients were enrolled from April 2017 to June 2022 at Shanghai Children Medical Center, China. The inclusion criteria were: (1) no previous interventional management such as surgical or catheterization procedures at least in three years after Fontan operation; (2) elder than eight years old patients who can be cooperative and complete CMR scan. Exclusion criteria were: (1) presence of other diseases that can cause disturbed intracardiac flow in children (e.g., pulmonary hypertension, arrhythmia, valvular stenosis, and moderate or severe valvular regurgitation); (2) severe liver, kidney, or lung dysfunction; or (3) inadequate CMR image quality for analysis. The detailed study design was presented in
Figure 1. Additionally, normal control subjects who had negative echocardiographic findings over the same time period were recruited.The study was approved by local research ethics committee, and signed informed consent was obtained from each participant’s parent or legal guardian.
CMR data acquisition and ventricular function analysis
Short-axis cine images covering the ventricle from base to apex by 2D balanced steady state free precession (2D b-SSFP) cine sequences were performed on a 3.0T CMR scanner (MR750, GE Healthcare, Milwaukee, WI). Routine 2-, 3- and 4-chamber long-axis and stacks of short-axis cine images were collected with temporal resolution of 30 frames per cardiac cycle. Whole heart 4D flow was performed with free breathing and non-respiratory navigator gating following the SCMR and ISMRM recommendation [
8]
(Methods in the Data Supplement). Intravenous bolus injection of 0.2 mmol/kg gadopentetate dimeglumine for CE-MRA was administered before 4D flow imaging. Late gadolinium enhancement (LGE) was assessed by late post-contrast imaging acquired after 8-15 min(depend on heart rate)contrast administration . The commercial software (CVI 42 Version 5.12.1; Circle Cardiovascular Imaging, Calgary, Canada) was used for post-processing analysis of CMR images. End-diastolic volume (EDV), end-systolic volume (ESV), stroke volume (SV) and ventricular mass were obtained from short-axis stacks. Cardiac output (CO) and ejection fraction (EF) were calculated for all participants. Mass and ventricular volumes were indexed to body surface area (BSA). The accessorial ventricles were not included in the ventricular volumes and mass following previous studies [
14].
Echocardiography image acquisition
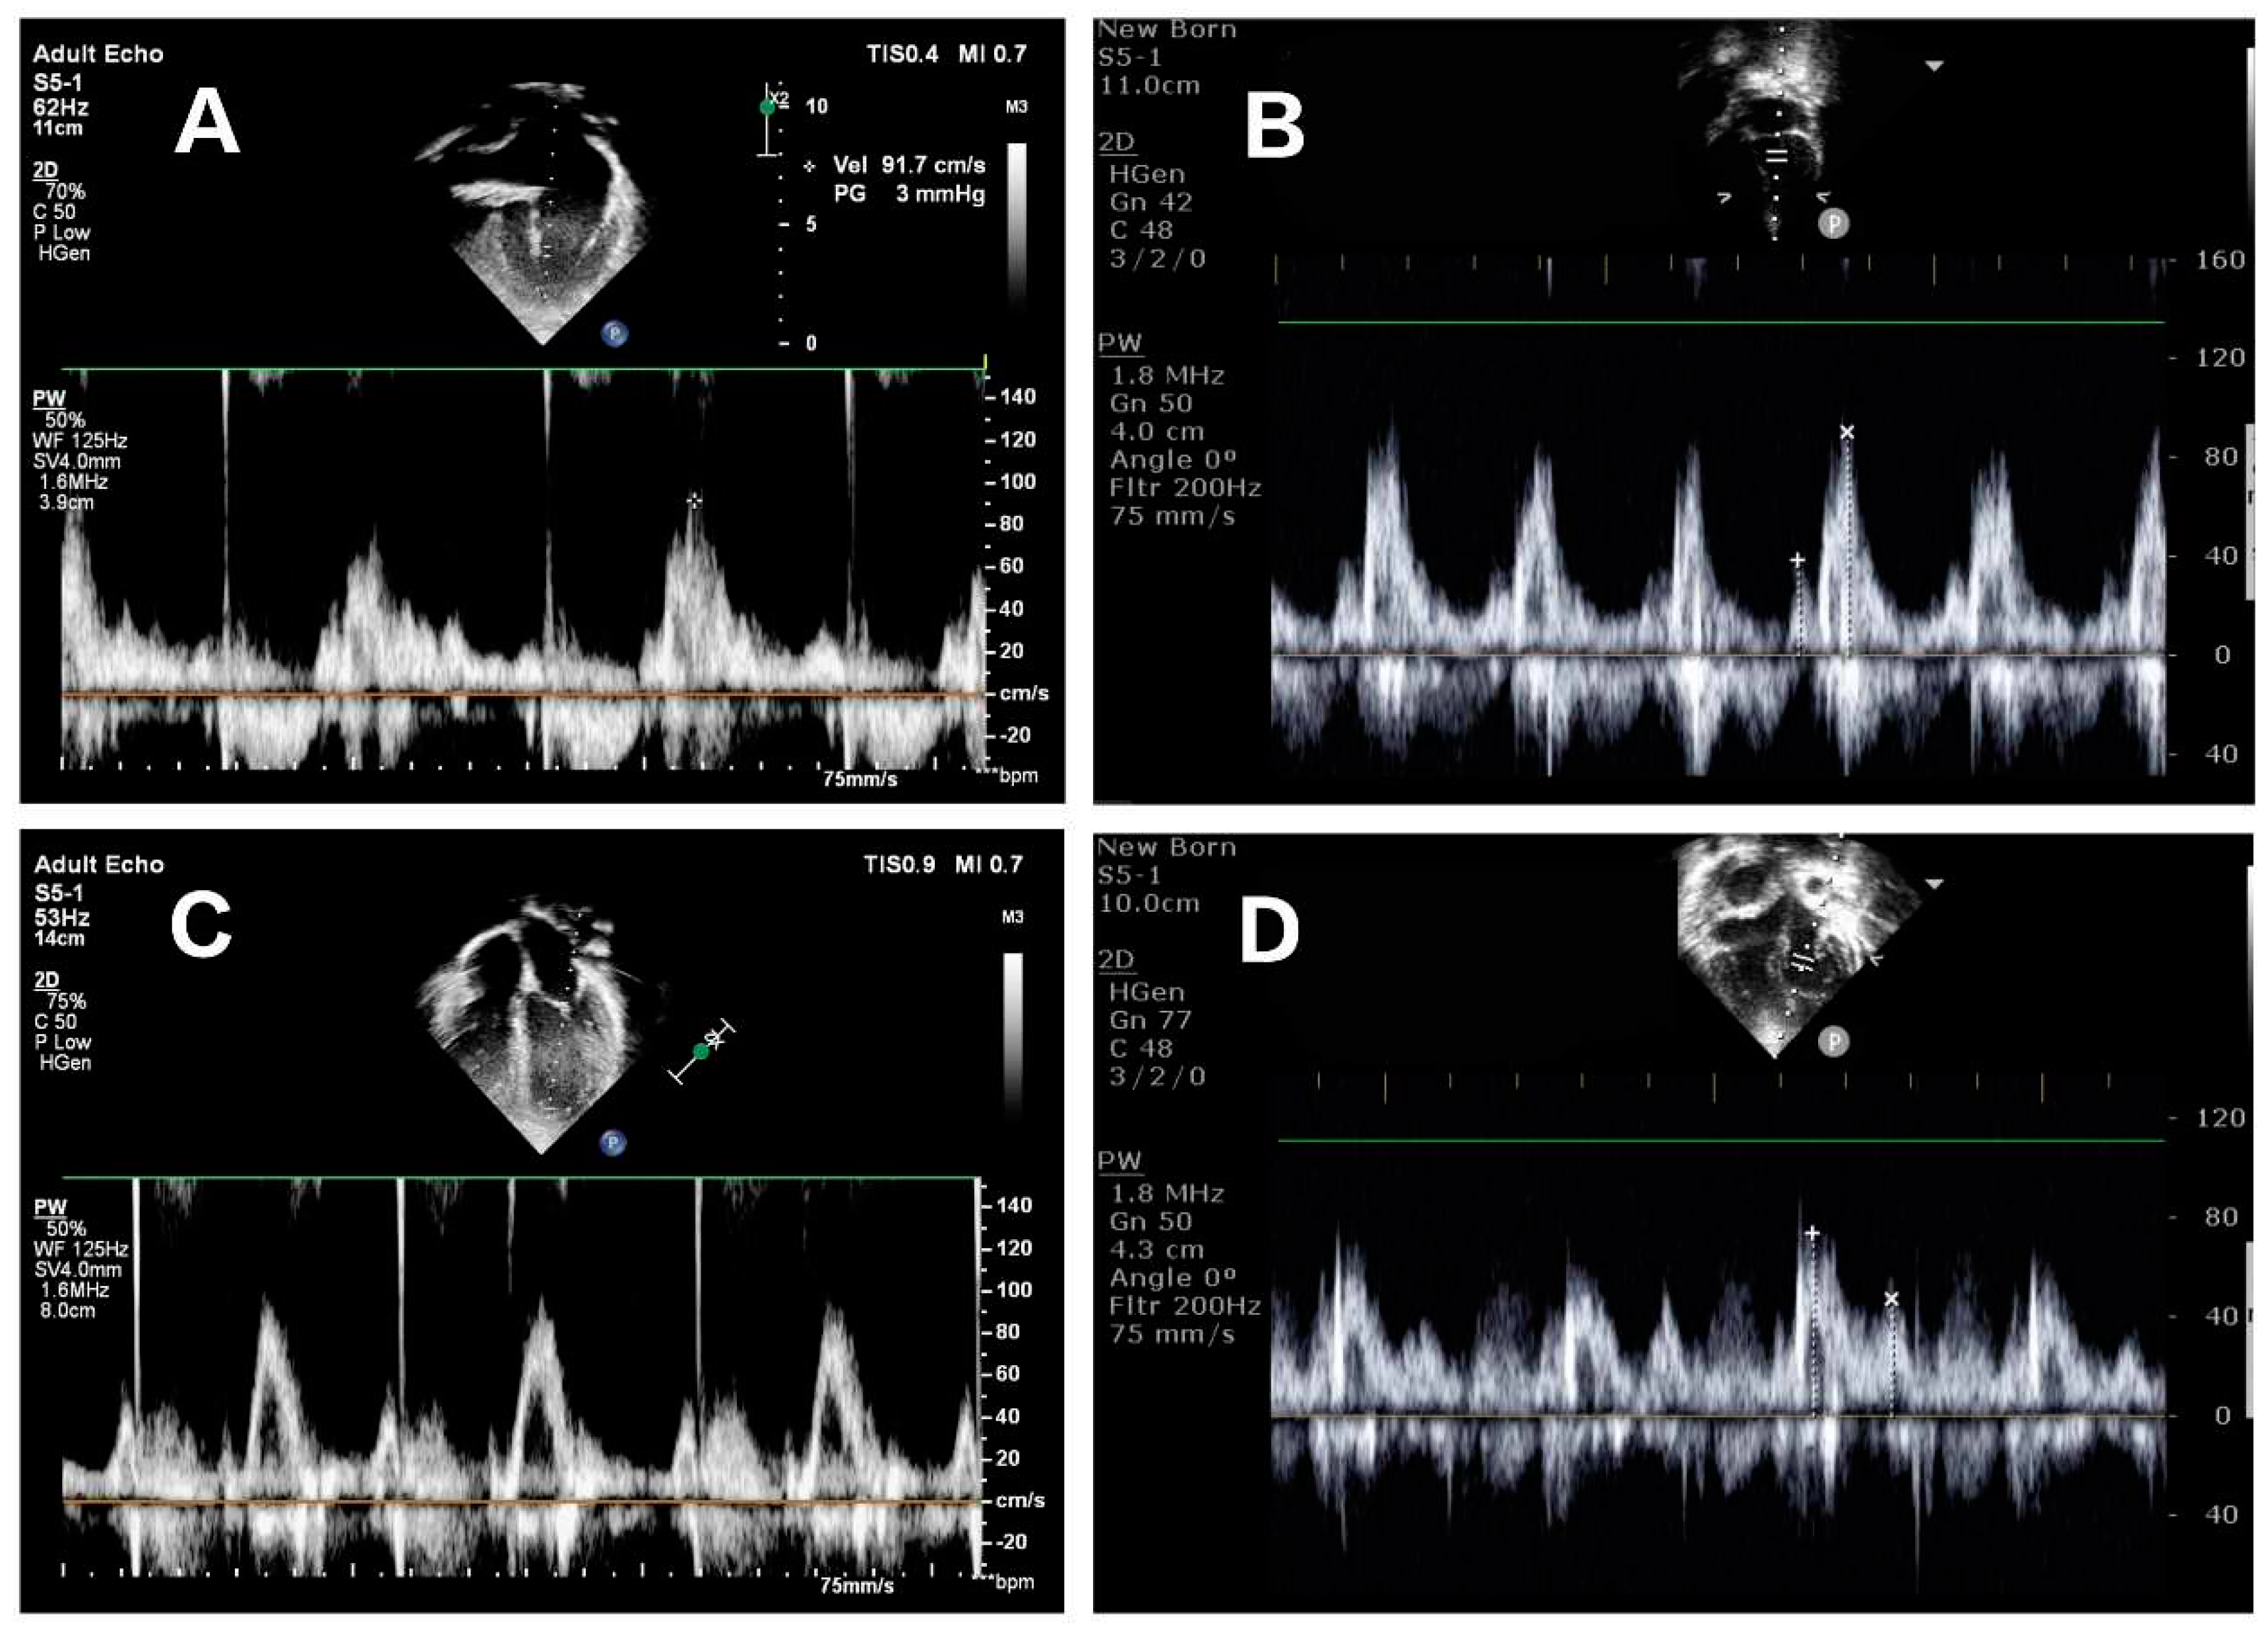
Echocardiographic examination was performed using the Philips CX50 ultrasound machine (Philips, Andover, MA, USA) with a matrix array transducer (S5-1, S8-3). rFontan patients were scanned in the left lateral decubitus position. Before acquisition, echocardiographic images were optimized for mitral inflow visualization. TTE image acquisition was performed in the apical four-chamber view. Pulsed wave Doppler was used to measure trans-mitral early (E) and late (A) diastolic filling velocities and E/A ratio in
Figure 2. Echocardiography assessed LV diastolic dysfunction according to the criteria described in the 2016 American Society of Echocardiography by a single investigator [
15].
Inter-ventricular mechanical dyssynchrony analysis
We semi-automatically tracked left ventricle (LV) lateral wall and right ventricle (RV) free wall deformation in four-chamber long-axis views using our previous published methods of matching by correlation [
16]. Time to maximal displacement (T-D
max) was determined in both lateral wall and free wall. Inter-ventricular mechanical dyssynchrony was assessed by difference in time to maximal displacement between lateral wall and free wall
(Supplementary Figure S1) (i.e. ≥33 ms by 95
th percentile from controls).
4D flow components and kinetic energy
The analysis of FSV flow data was performed using research software (MASS; Version 2020EXP, Leiden University Medical Center, Leiden, The Netherlands). Automated image-based 3D rigid registration was performed using the validated Elastix image registration toolbox [
17]. The emitted pathlines at ES were further divided into four functional blood flow components based on their behavior and position [
17]. Flow components includes: 1) direct flow; 2) retained inflow; 3) delayed ejection flow; 4) residual volume. The details of pre-processing analysis were given in the
Data Supplement.
For each volumetric element (voxel), the KE was computed using the following formula:,Wherein, is the density of blood (1.06 g/cm3), is the voxel volume and is the velocity magnitude of the corresponding voxel. For each phase, the total KE within the ventricular was obtained by summation of the KE of every voxel. All KE parameters were normalized to the ventricular end-diastolic volume (KEiEDV) and accordingly reported in μJ/ml. Time-resolved KE curves were generated to derive physiologically relevant parameters in Figure S2. 4D flow blood flow and kinetic energy parameters were analyzed with and without LV diastolic dysfunction subgroup, with inter-ventricular mechanical dyssynchrony versus without inter-ventricular dyssynchrony subgroup in rFontan patients.
Intra- and inter-observer variability
Intra-observer variability was determined by an operator experienced in CMR who conducted two blinded assessments of 10 randomly selected data sets, with each assessment separated by more than one month. Inter-observer variability was conducted independently by a second observer experienced in CMR with the same 10 datasets.
Statistical analysis
All statistical analysis was performed with GraphPad prism version 8.0 (GraphPad, San Diego, USA). All continuous variables were presented as mean ± standard deviation (SD) or median (25th percentile, 75th percentile) as appropriate. Comparisons of rFontan and control groups were conducted with independent t-test analysis for normally distributed data and Mann-Whitney test for non-normally distributed continuous variable. Demographic and clinical characteristics between three groups were compared using unpaired one-way ANOVA for normally distributed variables, Kruskal-Wallis for non-normally distributed variables, and Fisher’s exact test for categorical variables. Receiver operator characteristic (ROC) analysis was performed to determine the predictive power of 4D flow parameters for diastolic dysfunction. Intra- and inter-observer reproducibility were assessed via intraclass correlation coefficient (ICC) and coefficient of variation (COV). A P value of <0.05 was considered significant.
Results
Participant characteristics and ventricular function
Of the total 25 rFontan patients (M/F: 15/10), 9 (M/F: 6/3) had a functional single ventricle (left ventricle type) (6 tricuspid atresia, 3 pulmonary atresia with intact ventricular septum), 9 (M/F: 6/3) had functional single ventricle (right ventricle type) (2 single right ventricle, 5 double outlet of right ventricle with CAVC, 1 transpositions of the great artery, 1 others), and 7 (M/F: 5/2) had functional single ventricle (biventricular type); 23 had an extracardiac conduit, 2 had a lateral tunnel
(Supplementary Table S1). The median postoperative follow-up time of CMR was 5 years. 9 function single ventricle patients had LV diastolic dysfunction (grade 1 or grade 2) from echocardiography. LGE was presented at the inferior interventricular septum in 4 cases (16%). There were no significant differences between rFontan patients and control groups for mass index (
P=0.588), EDV index (
P=0.671), ESV index (
P=0.151), SV index (
P=0.580), EF (
P=0.142), and cardiac index (
P=0.271) (
Table 1). rFontan patients had significantly higher inter-ventricular mechanical synchrony indexes than healthy controls with time to maximal displacement consistently longer in the RV free wall than LV lateral wall (-11 [–60,32] ms vs. 11 [0,25] ms,
P<0.05)
(Supplementary Figure S2).
Changes in 4D flow components, kinetic energy and inter-ventricular mechanical dyssynchrony profiles
Median direct flow (32% vs. 40%) and delayed ejection flow (17% vs. 24%) were lower and residual volume (28% vs. 23%) was higher in rFontan patients compared to normal control (all
P<0.05,
Table 1). There was no significant differences in retained inflow between two groups (18% vs. 12%).
There were significant differences in all KE parameters in rFontan patients compared to normal controls (
Table 1). There were significant decreases in regional (basal, mid and apical) kinetic energy parameters in rFontan patients (all
P<0.01), except for basal peak A-wave KEi
EDV (
P=0.100) (
Table 2). Peak E-wave KEi
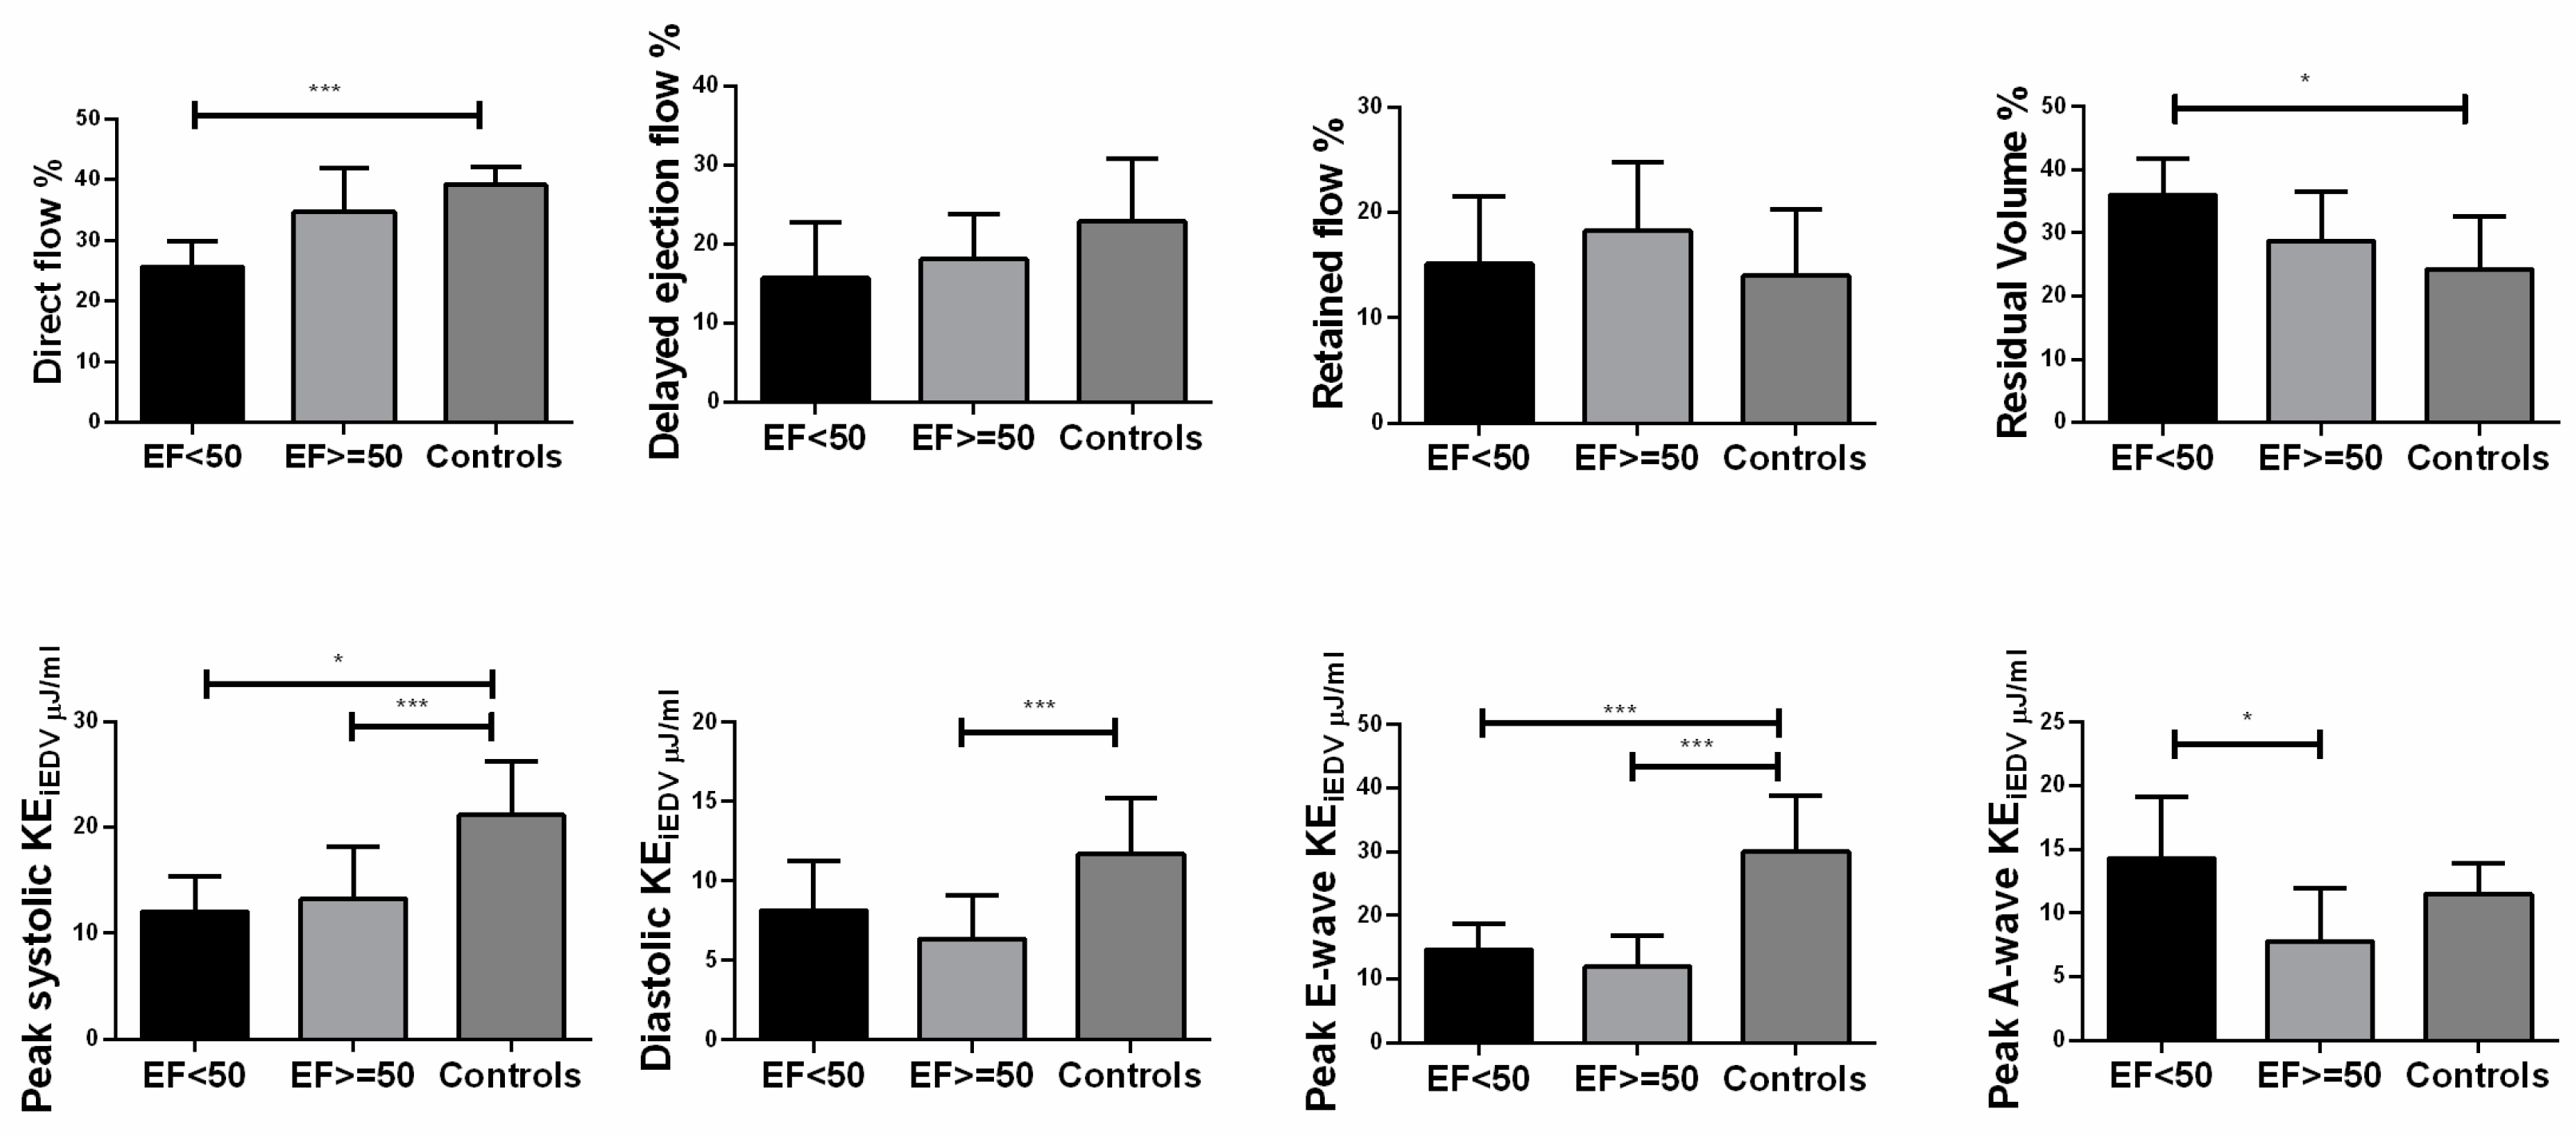
EDV with different EF were decreased compared to normal control (
P<0.001) (
Figure 4).
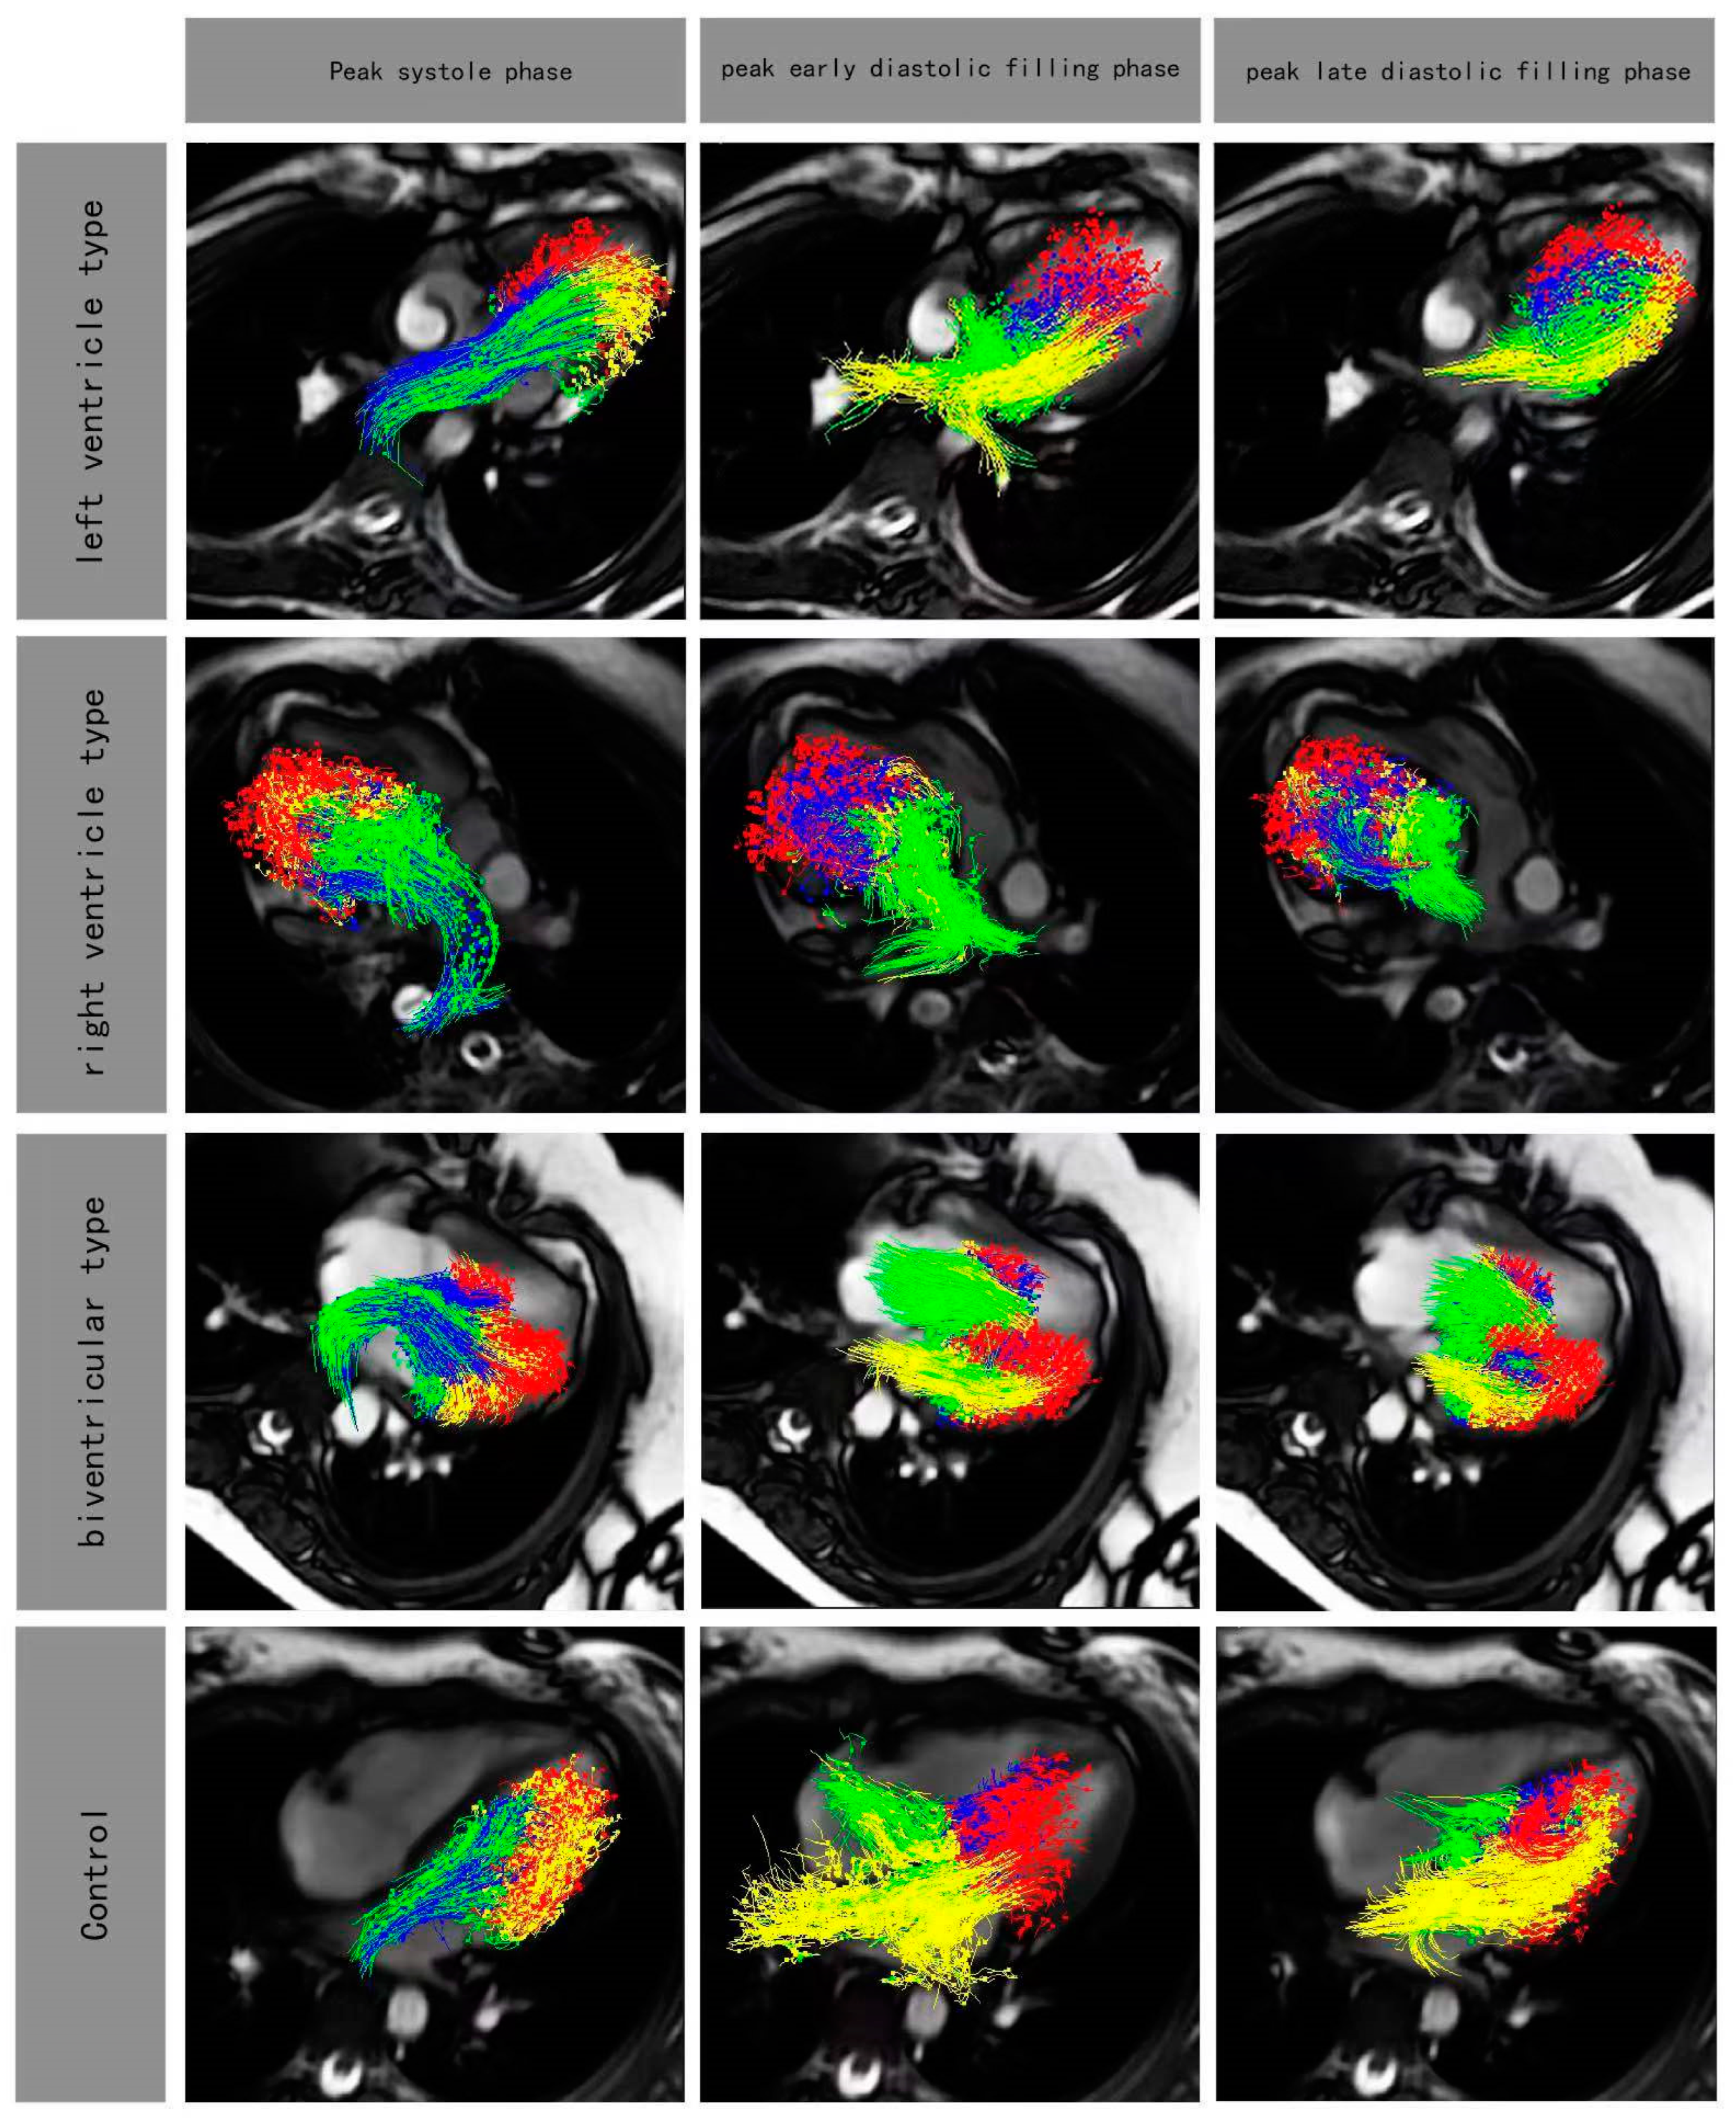
Figure 3.
Four-chamber views with particle tracing overlayed at peak systole phase and peak early diastolic filling phase and peak late diastolic filling phase in rFontan patients (LV type, RV type, biventricular type) and control. Red, blue, yellow and green color represented residual volume, delayed ejection flow, retained inflow and direct flow, respectively.
Figure 4.
Differences in ventricular flow components which included indexed peak systolic kinetic energy indexed (peak systolic KEiEDV), indexed average diastolic KEiEDV, indexed peak E-wave KEiEDV and indexed peak A-wave KEiEDV according to different ejection fraction. EF: ≥=50% (n=20); <50% (n=5); Controls≥55% (n=14). Bars showed mean value, and error bars indicated SD. *P<0.05 compared with controls.
There were no significant differences for flow components and KE parameters between rFontan patients with inter-ventricular mechanical dyssynchrony and without inter-ventricular dyssynchrony (
Table 3).
Association of 4D flow parameters with LVdiastolic dysfunction
No significant difference was observed for 4D flow parameters between rFontan patients with and without LV diastolic dysfunction group, except for median direct flow (38% vs. 30%,
P=0.031) (
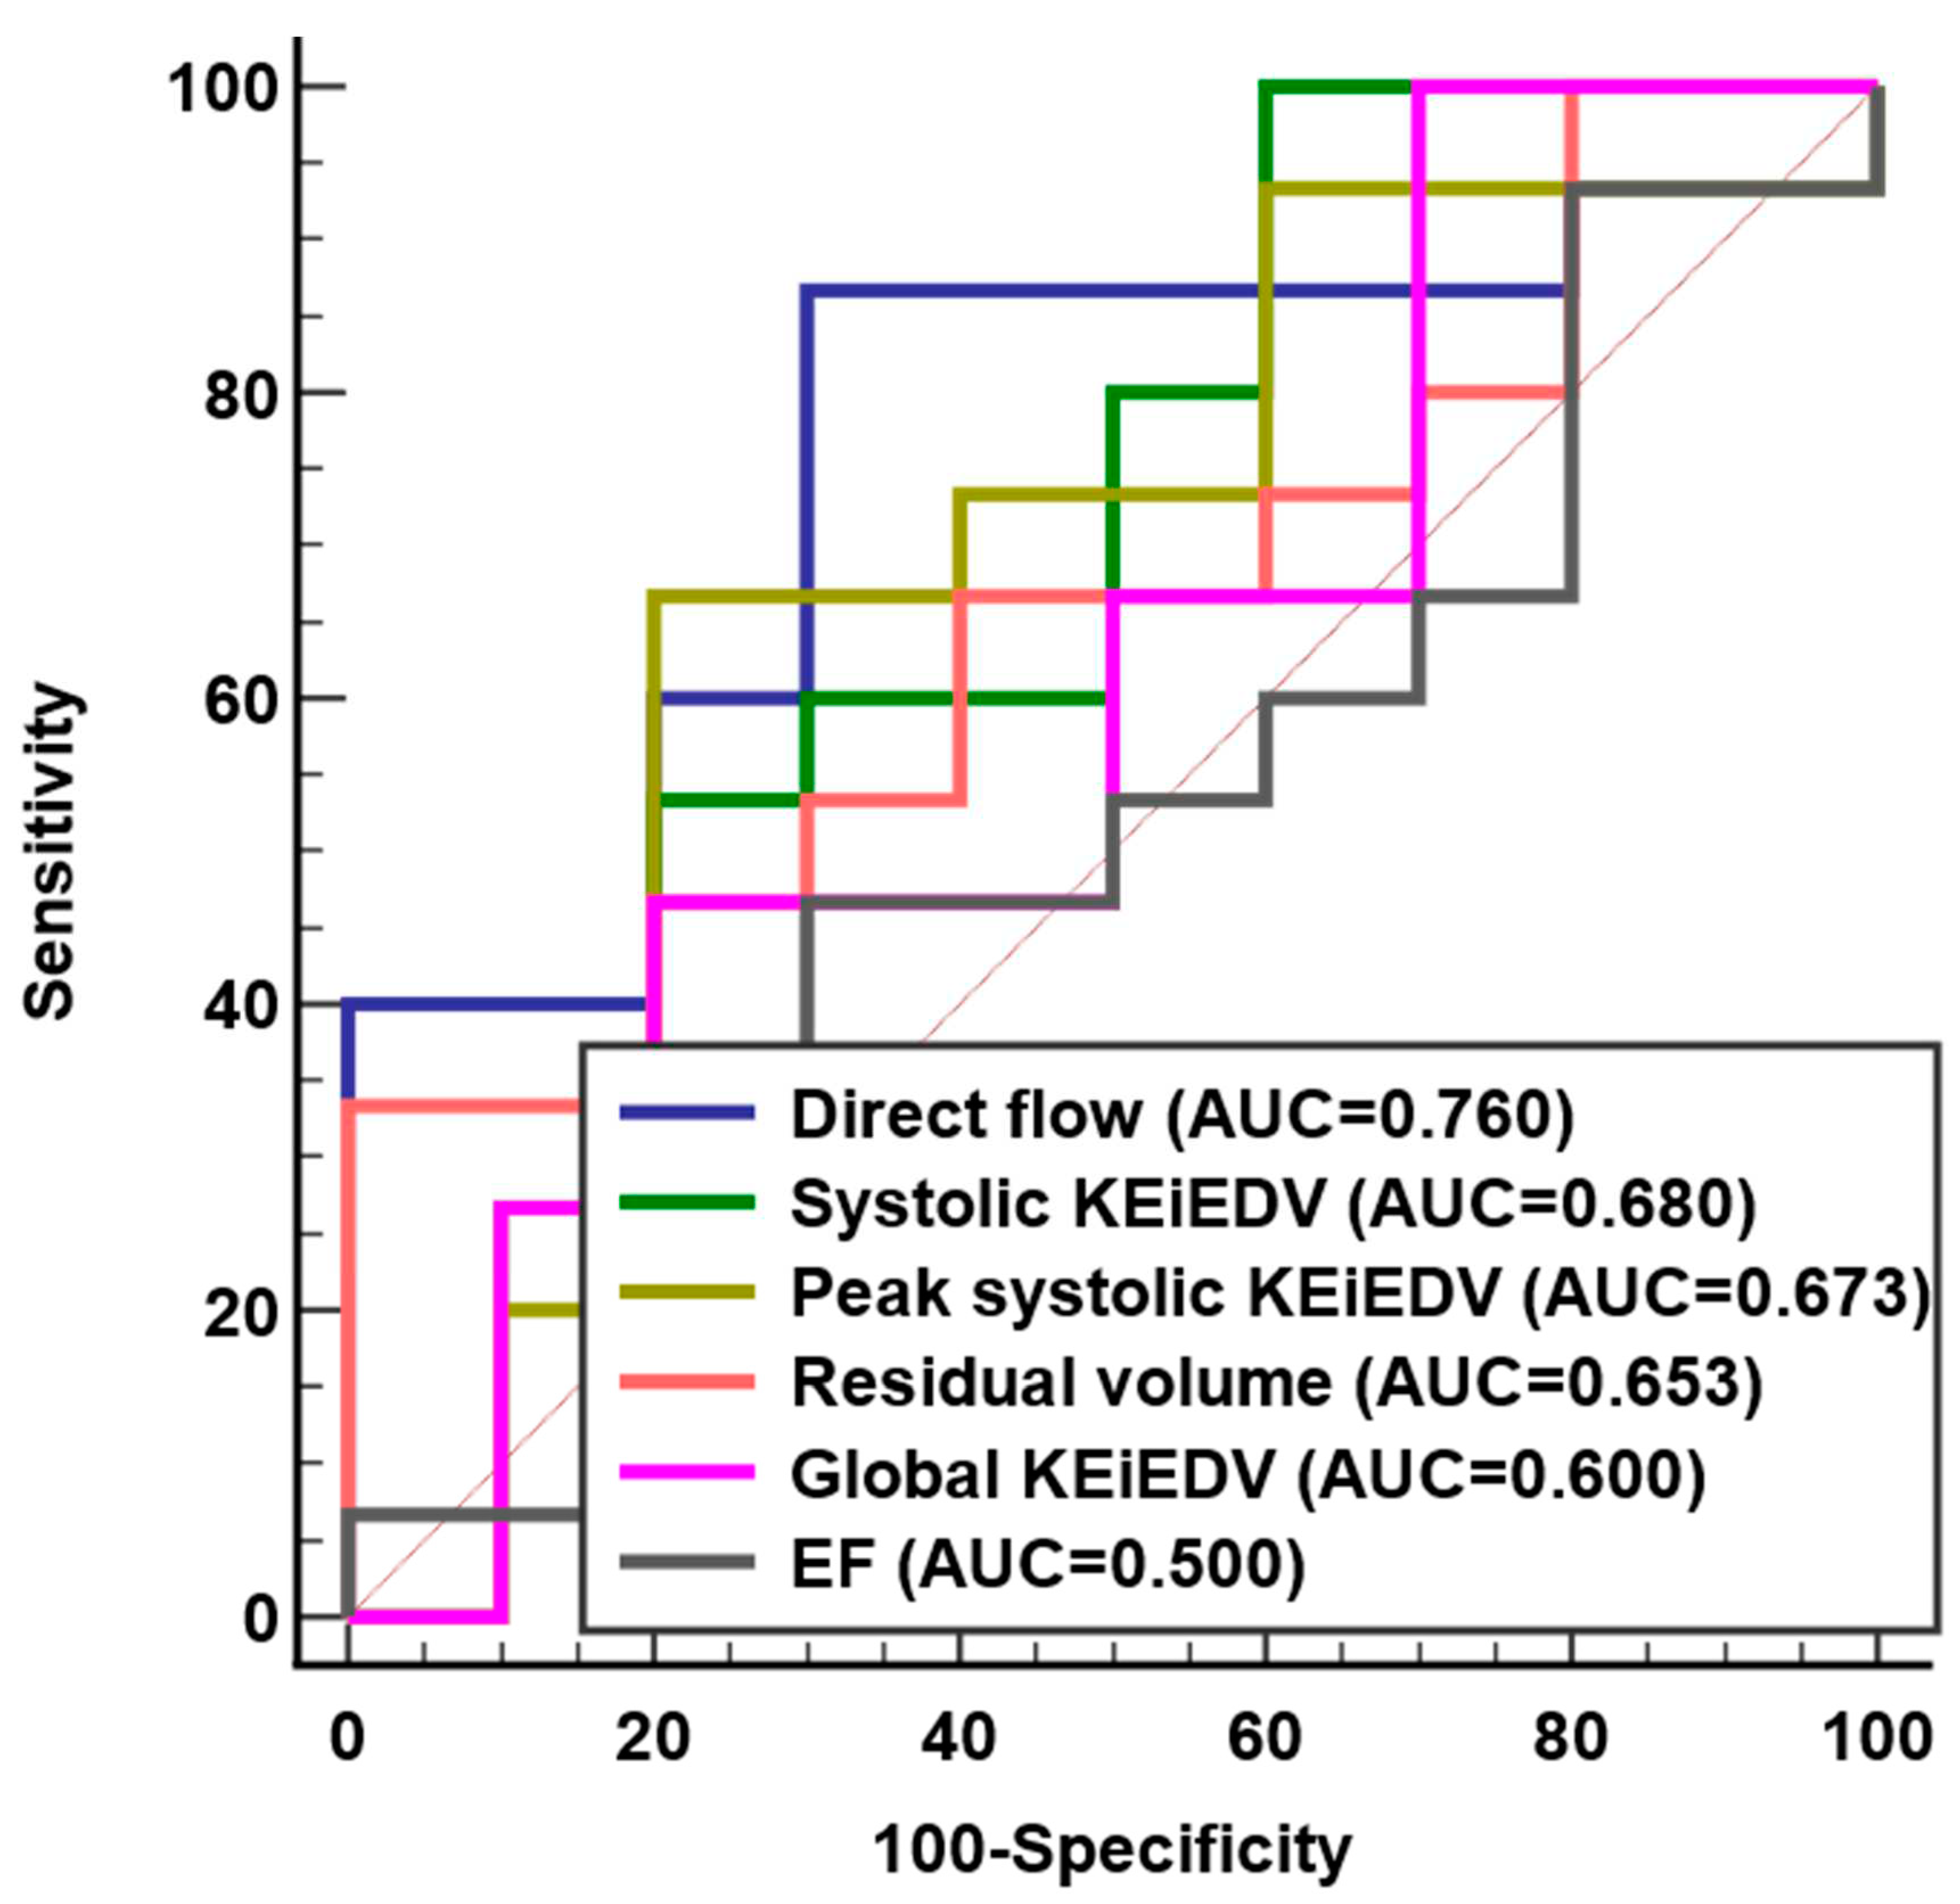
Table 4). ROC analysis demonstrated that direct flow (AUC = 0.76, Sensitivity = 86%, Specificity = 70%) had better discrimination for LV diastolic dysfunction than systolic KEi
EDV, peak systolic KEi
EDV, residual volume, global KEi
EDV and EF (
Figure 5 and Supplementary Table S3).
Disruption of intracardiac flow in rFontan groups with morphologic LV or RV
4D flow components were not significantly different between morphologic LV and morphologic RV patient group, except for median residual volume (24% vs. 33%,
P=0.020). There were no significant difference in KE parameters except morphologic RV subgroup having lower median peak E-wave KEi
EDV than morphologic LV subgroup (11.2 vs. 12.4 µJ/ml,
P = 0.002) (
Table 5).
Intra and inter-observer variability
Intra-observer agreement was relatively good for the 4D flow components and KE parameters (ICC = 85.3% - 99.6%, COV = 1.62% - 6.58%). Inter-observer agreement was good (ICC = 82.1% - 98.1%, COV = 3.29% -11.24%) (Supplementary Table S2).
Discussion
In this prospective, single-center study, we have assessed the flow components and KE parameters and investigated the disruption of intracardiac flow patterns in single ventricle physiology patients. Our main findings were as following: (1) direct flow and residual volume might be markers for assessing disruption of intracardiac flow patterns; (2) all KE parameters were decreased in rFontan patients; (3) direct flow was the best of flow component marker for predicting LV diastolic dysfunction; (4) single ventricle with dominant left ventricle had produced more efficient intracardiac flow pattern than that of dominant right.
The characteristics of intracardiac flow components
Previous studies had demonstrated altered LV flow patterns in seemingly compensated dilated cardiomyopathy (DCM) patients [
19]. It is well known that direct flow followed an efficient pathway to the ventricular outflow tract with the shortest distance. The residual volume was located at the periphery of the ventricular cavity and outlined the functional border of the chamber [
20]. In our study, decreased median direct flow (32% vs. 40%,
P=0.005) and increased median residual volume (28% vs. 23%,
P<0.05) had significant difference between rFontan and control group. Highly inefficient flow pattern was measured according to intraventricular flow partitioning by 4D Flow CMR. The reason might be that the lower cardiac efficiency was interchanged predominantly from the delayed ejection flow and the retained inflow to residual volume, we supposed that was the results of energy transferring from the inflow components. Our findings were consistent with those of Stone et al [
21].
On the other hand, Bolger et al. [
2] demonstrated that the retained inflow had to decelerate at the end of diastole and then acquired additional kinetic energy prior to ejection during a subsequent systole in normal left ventricle. In our study, there was significant difference in median delayed ejection flow between Fontan’s group and control group (17% vs. 24%,
P<0.05). This might unveil mechanism of compensation in post-Fontan patients by intracardiac flow components.
The function of KE in rFontan patients
KE represents the effective work of the heart in ejecting blood. Sjöberg Pia et al. [
12] reported peak diastolic KE in Fontan patients was lower than that in control group. Moreover, Kamphuis et al. [
23] reported EL was significantly elevated in Fontan patients compared to controls. In our study, KE parameters of rFontan patients were lower than these of controls. Peak systolic and diastolic KEi
EDV of patients were significantly lower than these of controls in regional parameters (age 10 ± 3 years). David and his colleagues [
13] reported peak systolic KE were significantly higher in Fontan patients than in healthy volunteers (age 26 ± 8 years). Our explanation was that impaired myocardial systolic function resulted in inefficient kinetic energy for pediatric Fontan patients [
25]. With the increase of age, inefficiency leads to the increased KE after ventricular compensation. We found that peak A-wave KEi
EDV was not significantly different in the ventricular base (5µJ/ml vs. 7µJ/ml,
P>0.05). We understood that compensatory mechanism of atrial booster not launched in early rFontan patients. Exploiting KE as a measure of useful cardiac work might give us a better understanding of impaired filling efficiency.
Assessment of diastolic dysfunction in rFontan group
Our study demonstrated that direct flow was a more accurate predictor of diastolic dysfunction than the others intracardiac flow component and KE parameters. Stoll et al. [
18] reported the direct flow average KE was the independent predictor of functional capacity in patients with heart failure. Zhao et al. [
24] proved that direct flow was independent predictors of right ventricle remodeling index in repaired Tetralogy of Fallot patients. Direct flow was an interesting observation that were best confirmed with longitudinal assessment.
Previous studies in children and adults with FSV had suggested a high frequency of ventricular dyssynchrony [
26,
27,
28]. Rösner et al. [
29] showed ventricular dyssynchrony in the Fontan circulation to be associated with reduced systolic and diastolic function. In our subgroup, of 24 study patients with rFontan, fifteen demonstrated ventricular dyssynchrony. This might indicate high vulnerability of the univentricular heart to myocardial dysfunction in the presence of an intraventricular conduction delay. However, our study showed that inter-ventricular dyssynchrony had no significant difference on flow components and KE parameters in rFontan patients. 4 cases of rFontan patients (16%) had focal high signals at the inferior interventricular septum. Previously, Kato, et al reported one of rFontan cases had positive LGE in pediatric cohort [
25], suggesting septal myocardial remodelling happened in a few rFontan patients.
Intracardiac flow in single ventricle physiology
The abnormal intracardiac anatomy in Fontan patients caused differences in intraventricular flow patterns
(Supplementary Figure S2), which could be assessed and studied by flow component and KE parameters. Through comparison of single ventricle of left and RV morphologies, we found increased residual flow and decreased peak E-wave KEi
EDV in RV morphology group. These differences suggested that left ventricle morphology had a more efficient intracardiac flow pattern in FSV patients. The result was consistent with previous studies [
13]. On the other hand, RV morphology with a fused inflow and highly spherical ventricle, vortex ring was formed and its propagation towards the apex was slow due to circumferential propagation, which caused lower filling velocities and dissipated kinetic energy [
22].
Limitations
There were some limitations to this study that warrant discussion. Firstly, this prospective study had a relatively small sample size, which limited its statistical power. Secondly, although previous study had also demonstrated that non-respiratory navigated acquisition of 4D flow was comparable to respiratory navigated acquisition in image quality assessment [
30], 5 cases still had poor CMR images in our study due to non-respiratory navigated. Thirdly, T1 mapping and extracellular volume were not included in our study, it might provide a better understanding of the pathogenesis of progressive functional single ventricular. Fourthly, it might be the reason that as the heart rate changes the proportions of the flow components alter to adapt to the new length of the diastolic period, whilst still maintaining an efficient systolic ejection phase. Exercise CMR might be an important method for rFontan postoperative evaluation in our further study. Future direction of these 4D flow CMR imaging parameters may redefine risk prognostication for rFontan patients and potentially be used to guide treatment decision making.
Conclusions
The decreased KE may be a result of impaired ventricular filling in rFontan patients. Reduced direct flow was independently associated with diastolic dysfunction and might be a sensitive and specific biomarker for longitudinal outcome studies. Morphologic right ventricular subgroup is worse than morphologic left ventricular group in terms of the intracardiac hemodynamics.
Supplementary Materials
The following supporting information can be downloaded at the website of this paper posted on Preprints.org.
Acknowledgements
This study was supported by grants from the National Key Clinical Specialties Construction Program, Innovative research team of high-level local universities in Shanghai, National Natural Science Foundation of China (No.82171902), the Shanghai Committee of Science and Technology (No.17411965400, No. 22TS1400800).
Abbreviations
| 4D |
Four-dimensional |
| 2D b-SSFP |
2D balanced steady state free precession |
| AUC |
Area under curve |
| BSA |
Body surface area |
| CI |
Cardiac index |
| CMR |
Cardiovascular magnetic resonance |
| CO |
Cardiac output |
| COV |
Coefficient of variation |
| DCM |
Dilated cardiomyopathy |
| ED |
End diastole |
| EDV |
End-diastolic volume |
| EF |
Ejection fraction |
| EL |
Energy loss |
| ES |
End systole |
| ESV |
End-systolic volume |
| FSV |
Functional single ventricle |
| ICC |
Intraclass correlation coefficient |
| KE |
Kinetic energy |
| KEiEDV
|
KE indexed to the ventricular end-diastolic volume |
| LV |
Left ventricle |
| LGE |
Late gadolinium enhancement |
| rFontan |
Repaired Fontan |
| ROC |
Receiver operator characteristic |
| RV |
Right ventricle |
| SD |
Standard deviation |
| SV |
Stroke volume |
| T-Dmax
|
Time to maximal displacement |
References
- Tseng SY, Siddiqui S, Di Maria MV et al (2020) Atrioventricular valve regurgitation in single ventricle heart disease: a common problem associated with progressive deterioration and mortality. J Am Heart Assoc 9:e015737. [CrossRef]
- Kato A, Riesenkampff E, Yim D, Yoo SJ, Seed M, Grosse-Wortmann L (2017) Pediatric Fontan patients are at risk for myocardial fibrotic remodeling and dysfunction. Int J Cardiol 240:172–177. [CrossRef]
- Logoteta J, Ruppel C, Hansen JH et al (2017) Ventricular function and ventriculo-arterial coupling after palliation of hypoplastic left heart syndrome: A comparative study with Fontan patients with LV morphology. Int J Cardiol 227:691-697. [CrossRef]
- Budts W, Ravekes WJ, Danford DA, Kutty S (2020) Diastolic Heart failure in patients with the Fontan circulation: A Review. JAMA Cardiol 5:590-597. [CrossRef]
- Gupta Aakash N, Markl Michael, Elbaz Mohammed S M, Intracardiac and Vascular Hemodynamics with Cardiovascular Magnetic Resonance in Heart Failure.[J] .Heart Fail Clin, 2021, 17: 135-147. [CrossRef]
- Soulat G, McCarthy P, Markl M (2020) 4D flow with MRI. Annu Rev Biomed Eng 22:103-126. [CrossRef]
- Garcia J, Barker AJ, Markl M (2019) The role of imaging of flow patterns by 4D flow MRI in aortic stenosis. JACC Cardiovasc Imaging 12:252-266.
- Crandon S, Elbaz MSM, Westenberg JJM, van der Geest RJ, Plein S, Garg P (2017) Clinical applications of intra-cardiac four-dimensional flow cardiovascular magnetic resonance: a systematic review. Int J Cardiol 249:486-493. [CrossRef]
- Zhong L, Schrauben EM, Garcia J et al (2019) Intracardiac 4D flow CMR in congenital heart disease: recommendations on behalf of the ISMRM Flow & Motion Study Group. J Magn Reson Imaging 50:677-681. [CrossRef]
- Wong J, Chabiniok R, Tibby SM et al (2018) Exploring kinetic energy as a new marker of cardiac function in the single ventricle circulation. J Appl Physiol 125:889-900. [CrossRef]
- Kamphuis VP, Elbaz MSM, van den Boogaard PJ et al (2019) Stress increases intracardiac 4D flow cardiovascular magnetic resonance -derived energetics and vorticity and relates to VO2max in Fontan patients. J Cardiovasc Magn Reson 21:43. [CrossRef]
- Sjöberg P, Heiberg E, Wingren P et al (2017) Decreased diastolic ventricular kinetic energy in young patients with Fontan circulation demonstrated by four-dimensional cardiac magnetic resonance imaging. Pediatr Cardiol 38:669-680.
- Rutkowski DR, Barton G, François CJ, Bartlett HL, Anagnostopoulos PV, Roldán-Alzate A (2019) Analysis of cavopulmonary and cardiac flow characteristics in fontan patients: comparison with healthy volunteers. J Magn Reson Imaging 49:1786-1799. [CrossRef]
- Hu Liwei,Sun Aimin,Guo Chen et al. Assessment of global and regional strain left ventricular in patients with preserved ejection fraction after Fontan operation using a tissue tracking technique.[J] .Int J Cardiovasc Imaging, 2019, 35: 153-160. [CrossRef]
- Nagueh SF, Smiseth OA, Appleton CP et al (2016) Recommendations for the evaluation of left ventricular diastolic function by echocardiography: an update from the American Society of Echocardiography and the European Association of Cardiovascular Imaging. J Am Soc Echocardiogr 29:277–314. [CrossRef]
- Leng S, Zhao XD, Huang FQ et al (2015) Automated quantitative assessment of cardiovascular magnetic resonance-derived atrioventricular junction velocities. Am J Physiol Heart Circ Physiol 309:1923-1935. [CrossRef]
- Klein S, Staring M, Murphy K, Viergever MA, Pluim JP (2010) elastix: a toolbox for intensity-based medical image registration.[J]. IEEE Trans Med Imaging 29:196–205. [CrossRef]
- Stoll VM, Hess AT, Rodgers CT et al (2019) Left ventricular flow analysis. Circ Cardiovasc Imaging 12:e008130.
- Eriksson J, Bolger AF, Ebbers T, Carlhäll CJ (2013) Four-dimensional blood flow-specific markers of LV dysfunction in dilated cardiomyopathy. Eur Heart J Cardiovasc Imaging 14:417–424. [CrossRef]
- Eriksson J, Dyverfeldt P, Engvall J, Bolger AF, Ebbers T, Carlhäll CJ (2011) Quantification of presystolic blood flow organization and energetics in the human left ventricle. Am J Physiol Heart Circ Physiol 300:H2135-41. [CrossRef]
- Stone ML, Schäfer M, DiMaria MV et al (2022) Diastolic inflow is associated with inefficient ventricular flow dynamics in Fontan patients. J Thorac Cardiovasc Surg 163:1195-1207. [CrossRef]
- Bolger AF, Heiberg E, Karlsson M et al (2007) Transit of blood flow through the human left ventricle mapped by cardiovascular magnetic resonance. J Cardiovasc Magn Reson 9:741-7. [CrossRef]
- Kamphuis VP, Elbaz MSM, van den Boogaard PJ et al (2013) Disproportionate intraventricular viscous energy loss in Fontan patients: analysis by 4D flow MRI. Eur Heart J Cardiovasc Imaging 20:323-333. [CrossRef]
- Zhao X, Hu L, Leng S et al (2022) Ventricular flow analysis and its association with exertional capacity in repaired tetralogy of Fallot: 4D flow cardiovascular magnetic resonance study. J Cardiovasc Magn Reson 24:4. [CrossRef]
- Kato Atsuko,Riesenkampff Eugénie,Yim Deane et al (2017) Pediatric Fontan patients are at risk for myocardial fibrotic remodeling and dysfunction.Int J Cardiol, 240: 172-177. [CrossRef]
- Bharucha T, Khan R, Mertens L, Friedberg MK (2013) Right ventricular mechanical dyssynchrony and asymmetric contraction in hypoplastic heart syndrome are associated with tricuspid regurgitation. J Am Soc Echocardiogr 26:1214-1220. [CrossRef]
- Zaidi SJ, Penk J, Cui VW, Roberson DA (2019) Right ventricular mechanical dyssynchrony in hypoplastic left heart syndrome: correlation with systolic function and QRS duration. Pediatr Cardiol 40:934-942. [CrossRef]
- Gokhale J, Husain N, Nicholson L, Texter KM, Zaidi AN, Cua CL (2013) QRS duration and mechanical dyssynchrony correlations with right ventricular function after fontan procedure. J Am Soc Echocardiogr 26:154-9. [CrossRef]
- Rösner A, Khalapyan T, Dalen H, McElhinney DB, Friedberg MK, Lui GK (2018) Classic-pattern dyssynchrony in adolescents and adults with a Fontan circulation. J Am Soc Echocardiogr 31:211-219. [CrossRef]
- Kanski M, Töger J, Steding-Ehrenborg K et al (2015) Whole-heart four-dimensional flow can be acquired with preserved quality without respiratory gating, facilitating clinical use: a head-to-head comparison. BMC Med Imaging 15:20. [CrossRef]
|
Disclaimer/Publisher’s Note: The statements, opinions and data contained in all publications are solely those of the individual author(s) and contributor(s) and not of MDPI and/or the editor(s). MDPI and/or the editor(s) disclaim responsibility for any injury to people or property resulting from any ideas, methods, instructions or products referred to in the content. |
© 2023 by the authors. Licensee MDPI, Basel, Switzerland. This article is an open access article distributed under the terms and conditions of the Creative Commons Attribution (CC BY) license (http://creativecommons.org/licenses/by/4.0/).
