1. Introduction
Bitter tasting plants have a long history of use as traditional, health-giving foods and medicine, with recent interest in their application as appetite suppressants. The use of bitter foods to suppress appetite and food cravings is reported in several cultures throughout history with, for example, bitter herbs such as guggul being used in Ayurvedic medicine to reduce food intake, stimulate weight loss and suppress appetite [
1,
2]. Interestingly, two examples of traditional bitter appetite suppressants have recently been rediscovered and considered for commercial development.
Lathyrus linifolius (heath pea) is reported to have been used in the highlands of Scotland during medieval times to reduce hunger during times of food scarcity and is reported to have been used in the court of Charles II, King of England, as a weight-loss treatment.
Hoodia gordonii, a bitter succulent plant native to Africa, was used by the San of the Kalahari Desert to reduce appetite during long hunting trips [
3].
The effectiveness of directed GI bitterness for appetite regulation was assessed in a recent 2021 meta-analysis [
4]. Klaassen et al. determined that pre-meal treatment with bitter tastants significantly reduced energy intake, concluding that “Bitter stimuli are most potent to influence eating behavior”, and suggested their mechanism of action was likely via the stimulation of appetite-suppressing gut peptide hormones released from enteroendocrine cells. [
4]. Although bioactive, most of the bitter compounds evaluated in this meta-analysis were either non-dietary, or pharmaceutical compounds, or unsuitable for development into a consumer product.
The search for a commonly consumed, bitter plant extract, with a history of medicinal use, that could be used for safe and effective appetite control led to
Humulus lupulus (hops). Hops have been used medicinally since medieval times, including as an essential ingredient in beer brewing for well over 1,000 years. Over this time, hops have been bred for increased bittering properties. The primary bittering components of hops are the alpha acids, with some additional bitterness being contributed by the beta acids in the hop [
5]. These bioactive hops compounds exhibit limited bioavailability [
6], persistent bitterness in epithelial sensory tissue [
7], and high viscosity when in extract form. These properties are favorable for producing a potent and persistent bitterness at the gut surface when delivered directly to the GI tract in a highly concentrated capsule-based format.
We have previously shown that capsule-based GI delivery of an extract of bitter hops can reduce food intake, suppress appetite, and stimulate the release of appetite-suppressing gut hormones in healthy males [
8,
9]. To the best of our knowledge, however, no published work exists that assess the efficacy of bitter hops on appetite in females or on the effect of bitter hops on food cravings. Determining the efficacy of bitter hops in the regulation of food cravings and appetite measures in females is important, as the effect of GI bitterness on appetite may differ between males and females [
10], and as food cravings are key determinants in diet compliance [
11].
In this study, we examined the effect of an extract of New Zealand hops (Amarasate®) on subjective measures of appetite and food craving during the 16–24 h period of a 24 h water-only fast in healthy, normal weight women.
2. Materials and Methods
2.1. Participants
Thirty healthy women (eligibility: age 18–40 y, BMI 18.5–25 kg/m2) were recruited through poster and electronic advertisement in Auckland, New Zealand. The exclusion criteria were: current participation in a weight loss program or use of weight loss medication; diagnosed diseases of the GI tract; previous GI surgery; undergoing food restriction or any condition that may alter body composition within a short period of time; recent weight loss/gain (5 kg within the last 6 months); use of nonsteroidal anti-inflammatory drugs or current glucocorticoid use; history of ischemic gut, diabetes, celiac disease; history of alcohol or drug abuse; any known medical conditions/medications that may affect the gut or appetite; known allergy, intolerance, or sensitivity, to any ingredients in the study product; or inconsistent menstrual cycle. Participants were also required to be non-smokers, ascertained healthy by self-report and able to undertake a 24 h water-only fast by self-report. All subjects provided written informed consent prior to the appetite clinical trial and were allowed to withdraw at any time for any reason. Clinical research was approved by the Northern B Health and Disability Ethics Committee (2022 EXP 10995). All studies were carried out in accordance with the Declaration of Helsinki and the trial was registered at the Australian New Zealand Clinical Trials Registry (ACTRN12622000107729). The trial was conducted at The New Zealand Institute for Plant and Food Research Limited (PFR), Auckland, New Zealand, during 2022.
2.2. Study Design, Supplements and Protocol
The study design was modified from a previous study examining the effect of the same hops extract on appetite measure in men [
8]. Briefly, this was a randomized, double-blind, cross-over treatment study, using Visual Analogue Scales (VAS) to assess the effect of a hops extract on appetite and food craving during the last 8h of a 24h water-only fast. It involved two concentrations of the Amarasate hops flower extract suspended in a canola oil excipient and a placebo control, which were protected from gastric acid digestion by encapsulation using a hydroxypropyl methylcellulose (HPMC) DRcap capsule (DRcaps
TM, Capsugel, Morristown NJ, USA). The Amarasate hops extract was prepared using a food safe supercritical CO
2 extraction process from a specific cultivar of
Humulus lupulus. The intervention arms were two formulation matched dosages of the Amarasate extract, high dose (HD, 500 mg total) and low dose (LD, 250 mg total), and a placebo treatment. All treatment groups received two capsules, one given at 16 h (t=0 min, 1000h) and the second given 20 h (t=240 min, 1400h) into the 24 h fast, each containing half the total daily treatment dose. Treatment capsules were produced in a single batch and have previously been shown to be compositionally stable [
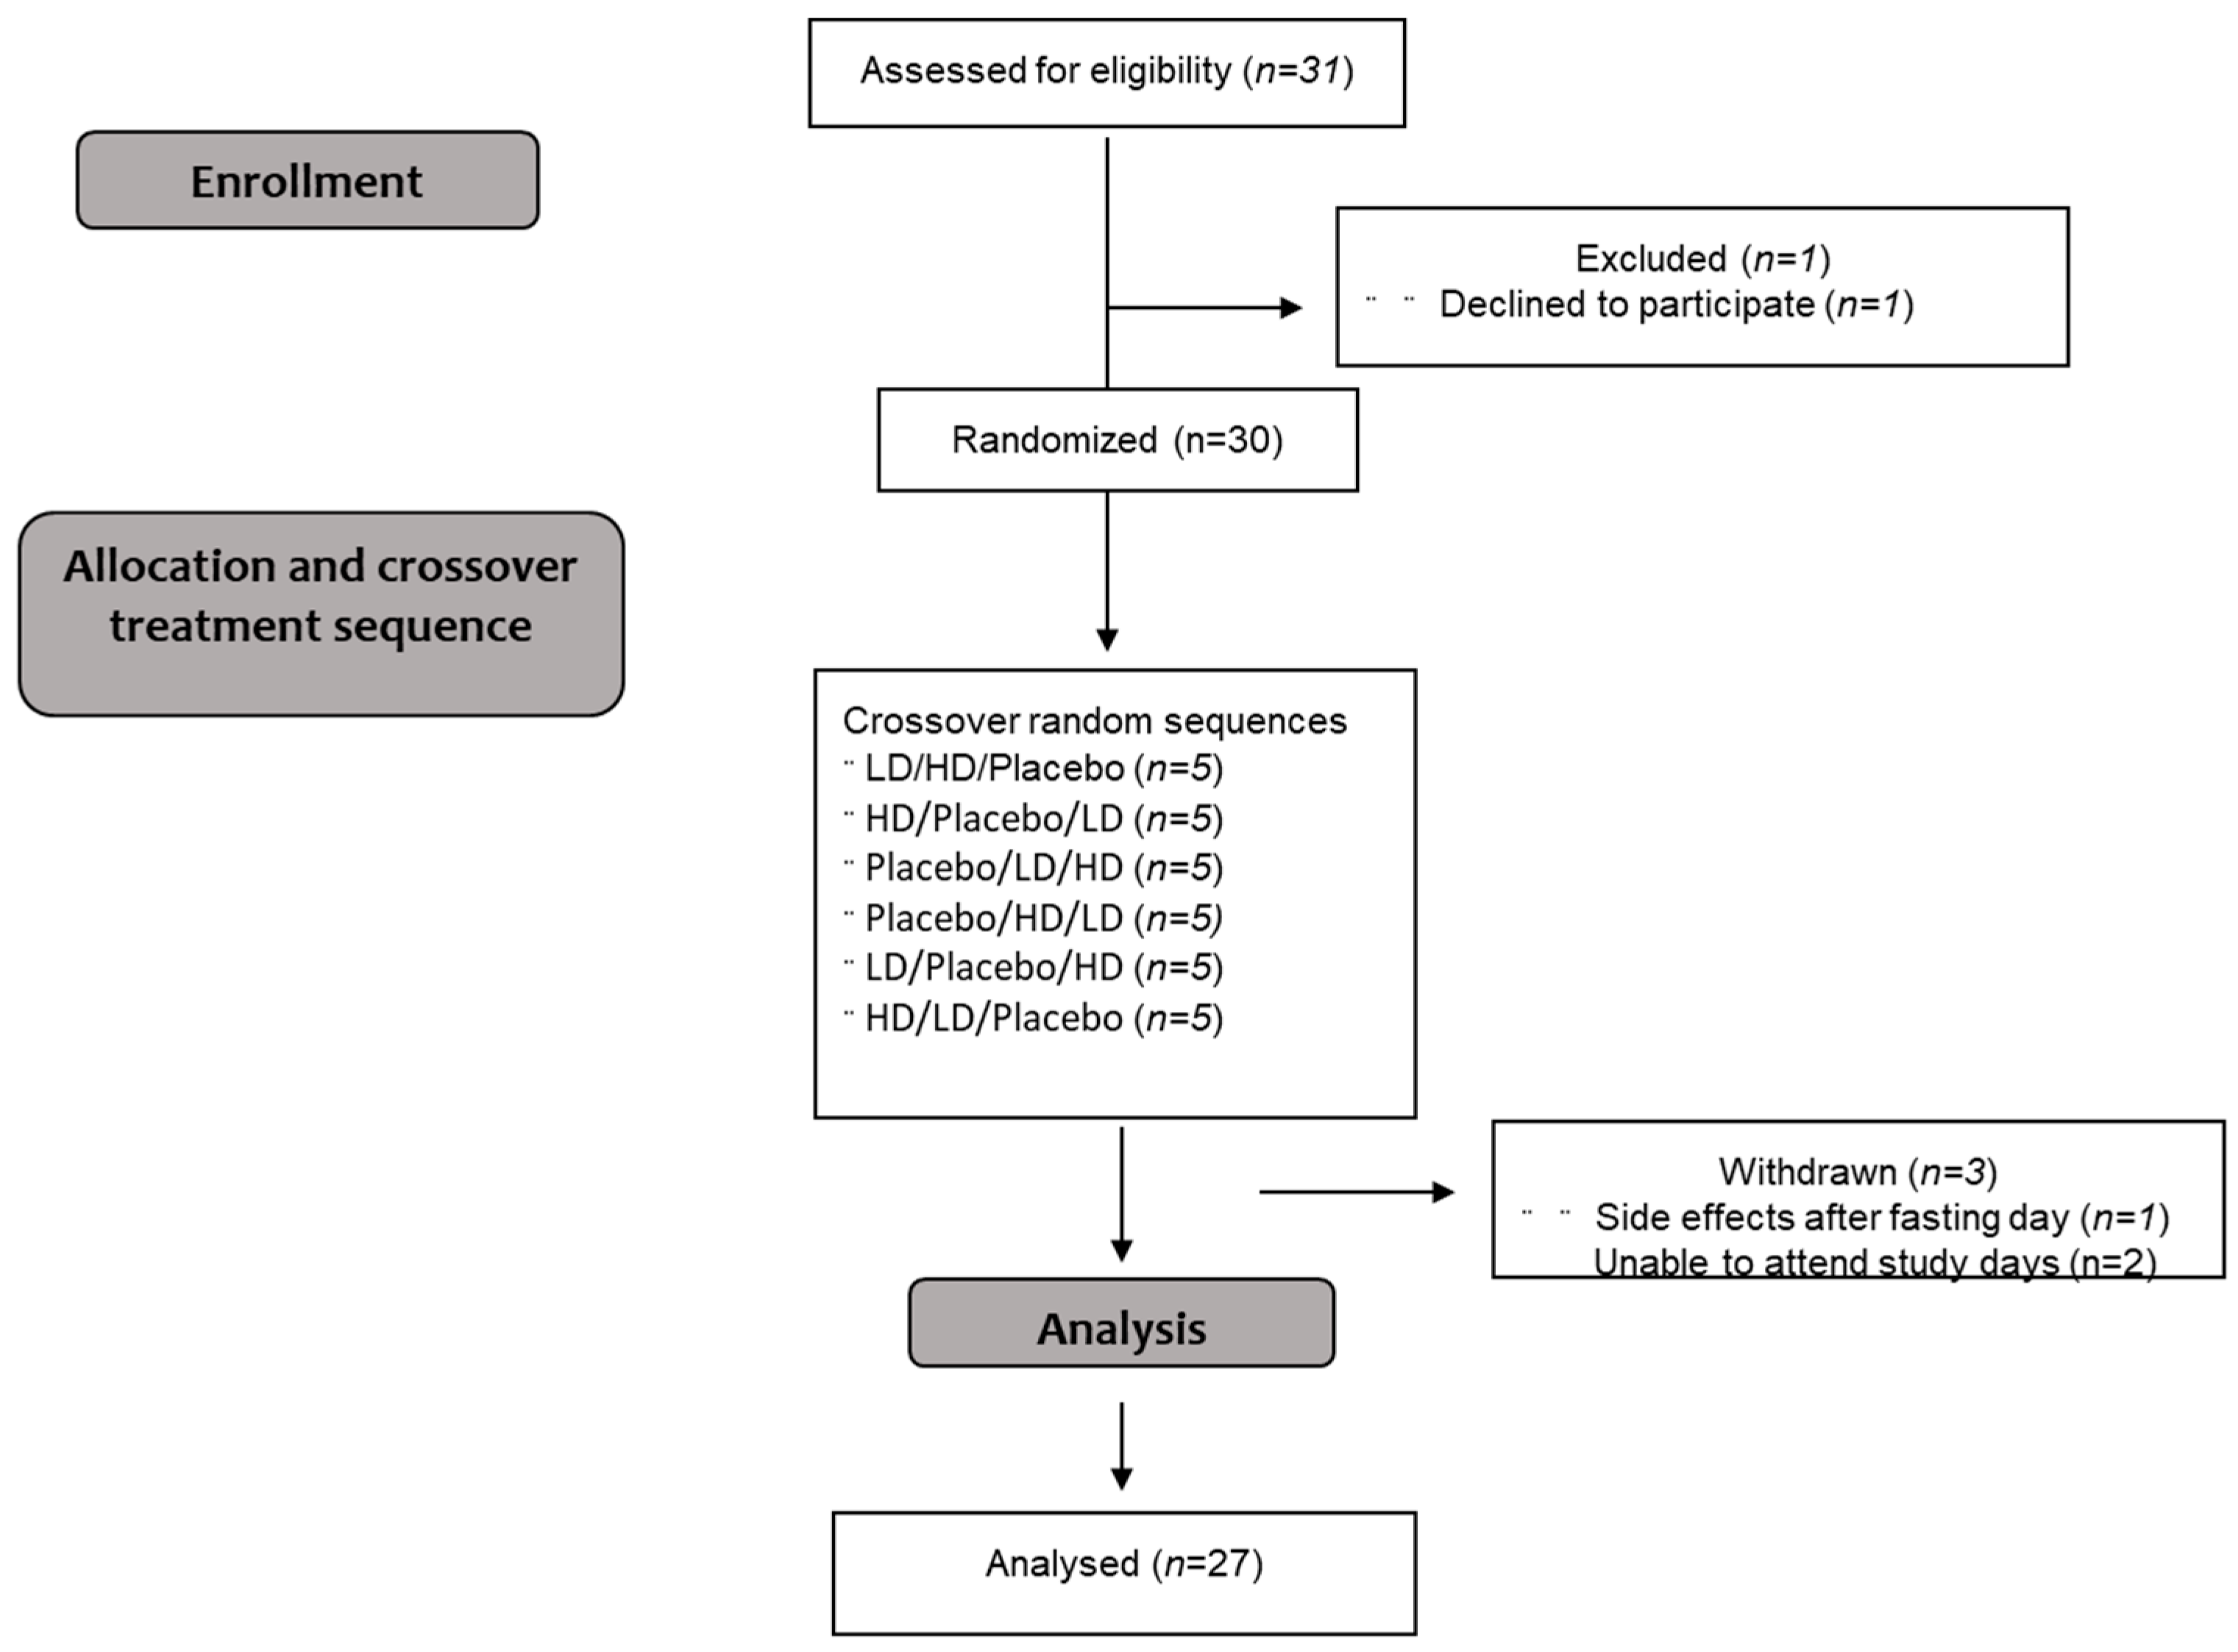
8]. Participants were required to attend three study visits and were asked to refrain from excessive exercise, physical activity and alcohol consumption for 24 h prior to the study day. Randomization was conducted using a Williams design balanced for order of presentation and carry-over effects. The Consolidated Standards of Reporting Trials (CONSORT) flow diagram is shown in
Figure 1.
This trial included an
ad libitum rice-based meal to end the 24h fast (t=480, 1800h) and Visual Analogue Scale (VAS) assessments related to food cravings, as modifications from the original study design [
8]. On the evening prior to commencement of the 24 h fast, participants were instructed to eat a typical, what they would normally eat, dinner until comfortably full immediately before 1800 h (t = -960 min) and then fast overnight with the consumption of water allowed. Participants arrived at the clinical facility at 950 h (t = -10 min, 15h50mins into the last) and were randomly assigned to one of three treatments after baseline measures were taken. Treatment capsules were given at 1000 h (t = 0 min, 16h into fast) and at 1400 h (t = 240 min, 20h into fast), presented in an opaque cup and consumed without participants’ handling the capsules. Appetite and food craving measures were taken at 30-minute intervals from 1000h (t=0 mins, 16h into fast) by VAS (
Figure 2). When capsule administration and VAS assessment occurred at the same time, VAS were conducted immediately before capsule consumption. Water intake was recorded during the 16–24 h fasting period and participants were restricted from drinking immediately prior to and during VAS assessments. A rice-based meal was provided in excess at the end of the 24 h fast with participants being asked to eat until comfortably full. Participants were required to stay at the testing facility and remain sedentary until the study day was completed, and no sleeping was allowed (
Figure 2).
2.3. Appetite Measures
Subjective measures of appetite (i.e., hunger, fullness, satisfaction, thoughts of food (TOF)), food-type cravings and physical comfort (e.g., nausea) were recorded from 16 h to 24 h of the fast and assessed by participants marking their appropriate subjective feelings on a 100 mm scale. The appetite-related VAS questions were as follows:
“How hungry do you feel?” (‘I am not hungry at all’ to ‘I am as hungry as I have ever been’)
“How full do you feel?” (‘I am not full at all’ to ‘I am totally full’)
“How satisfied do you feel?” (‘I am completely empty’ to ‘I cannot eat another bite’)
“How much do you think you can eat?” (‘nothing at all’ to ‘a large amount’).
The Food Craving-related VAS questions were as follows:
“How much are you craving for food?” (‘not at all’ to ‘a great amount’)
“How much are you craving for sugary foods?” (‘not at all’ to ‘a great amount’)
“How much are you craving for salty foods?” (‘not at all’ to ‘a great amount’)
“How much are you craving for fatty foods?” (‘not at all’ to ‘a great amount’)
“How much are you craving for savory foods?” (‘not at all’ to ‘a great amount’)
“How much are you craving for spicy foods?” (‘not at all’ to ‘a great amount’)
“How much are you craving for bitter foods?” (‘not at all’ to ‘a great amount’).
VAS were measured immediately prior to, and then at 30, 60, 90, 120, 150, 180, 210, 240, 270, 300, 330, 390, 420, 450 and 480 min after the first treatment capsule, then at 510 min after the
ad libitum meal. The primary outcomes of this trial were subjective measures of hunger, fullness, and satisfaction, and this study was powered to detect a 10 mm (10%) change in VAS relative to the placebo as significantly different, as this is considered a meaningful behavioral change [
12].
2.5. Fast breaking ad libitum Meal
A fast-breaking, rice-based ad libitum meal was presented in excess in sensory booths to participants at 1800 h. The meal consisted of rice with non-meat additives, and had a macronutrient makeup of 4 g protein, 3 g of fat, and 29 g of carbohydrate (± 1 g) per 100 g. Meals were weighed prior to and after consumption. Participants were instructed to “eat until comfortably full” and scored VAS for palatability of the meal. Energy intake was calculated based on the consumed fraction of the presented meal.
2.5. Statistical Methods
To estimate the required sample size, a power analysis was performed using VAS hunger as the dependent variable. Estimates of variance components were conducted based on data from a previous study examining the effect of a bitter anorexigenic agent on VAS-based hunger assessments [
13]. Power estimates showed 30 participants were sufficient to detect a 10% difference in the primary outcome measure of VAS hunger, based on a power level of 0.8 and a dropout rate of 20%. Participant responses collected using VAS were reported as means ± standard error of the means (SEMs). VAS ratings were analyzed with the use of repeated measures linear mixed models, and energy intake at individual meals was analyzed with the use of one-way ANOVA. As per the analysis plan, results are expressed as changes from the baseline (Δ) to reduce possible variation resulting from the prolonged 16 h pre-treatment fast. Tukey’s post hoc analysis was used for pairwise comparisons between treatments where main effect ANOVA was significant. Incremental Area Under the Curve (iAUC) for VAS ratings was calculated as the iAUC of the net change (Δ) from baseline measured over 0–510 min with the use of GraphPad Prism software (version 9; GraphPad Software). Statistical significance from placebo treatment was set at
p≤ 0.05.
3. Results
3.1. Participants
Twenty-Seven participants completed all three treatments of the appetite trial. All participants were lean healthy females with a mean age of 21 ± 4 years (range 18–39with a mean body mass index (BMI) of 21 ± 1 kg/m2.
3.2. Appetite Ratings
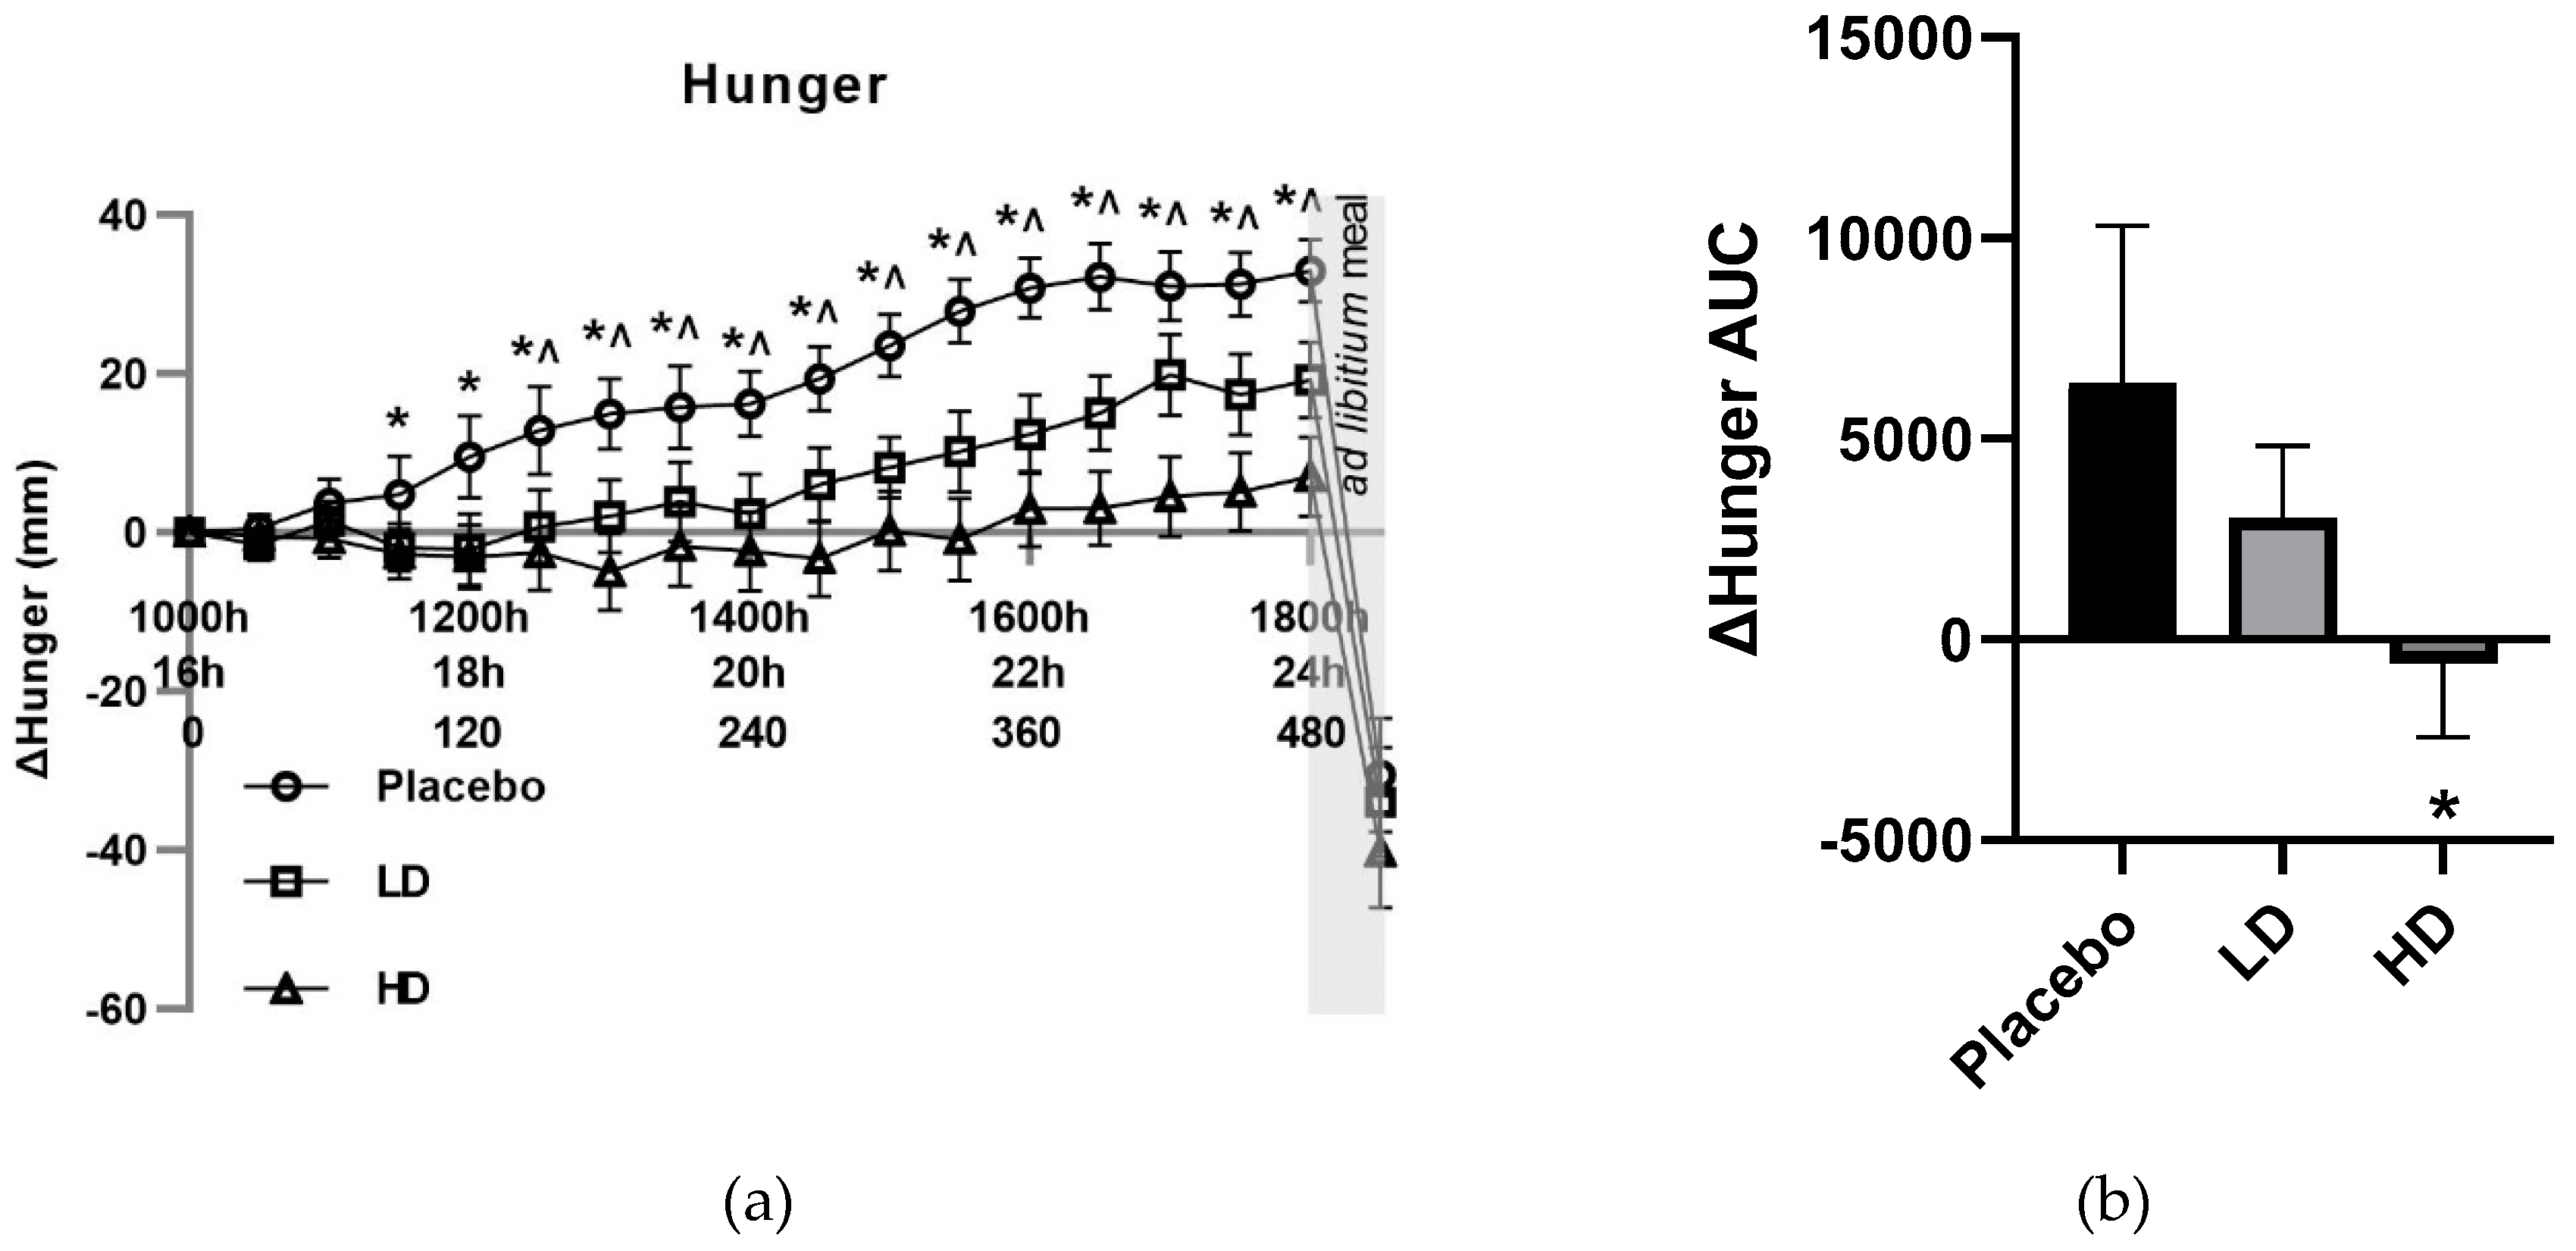
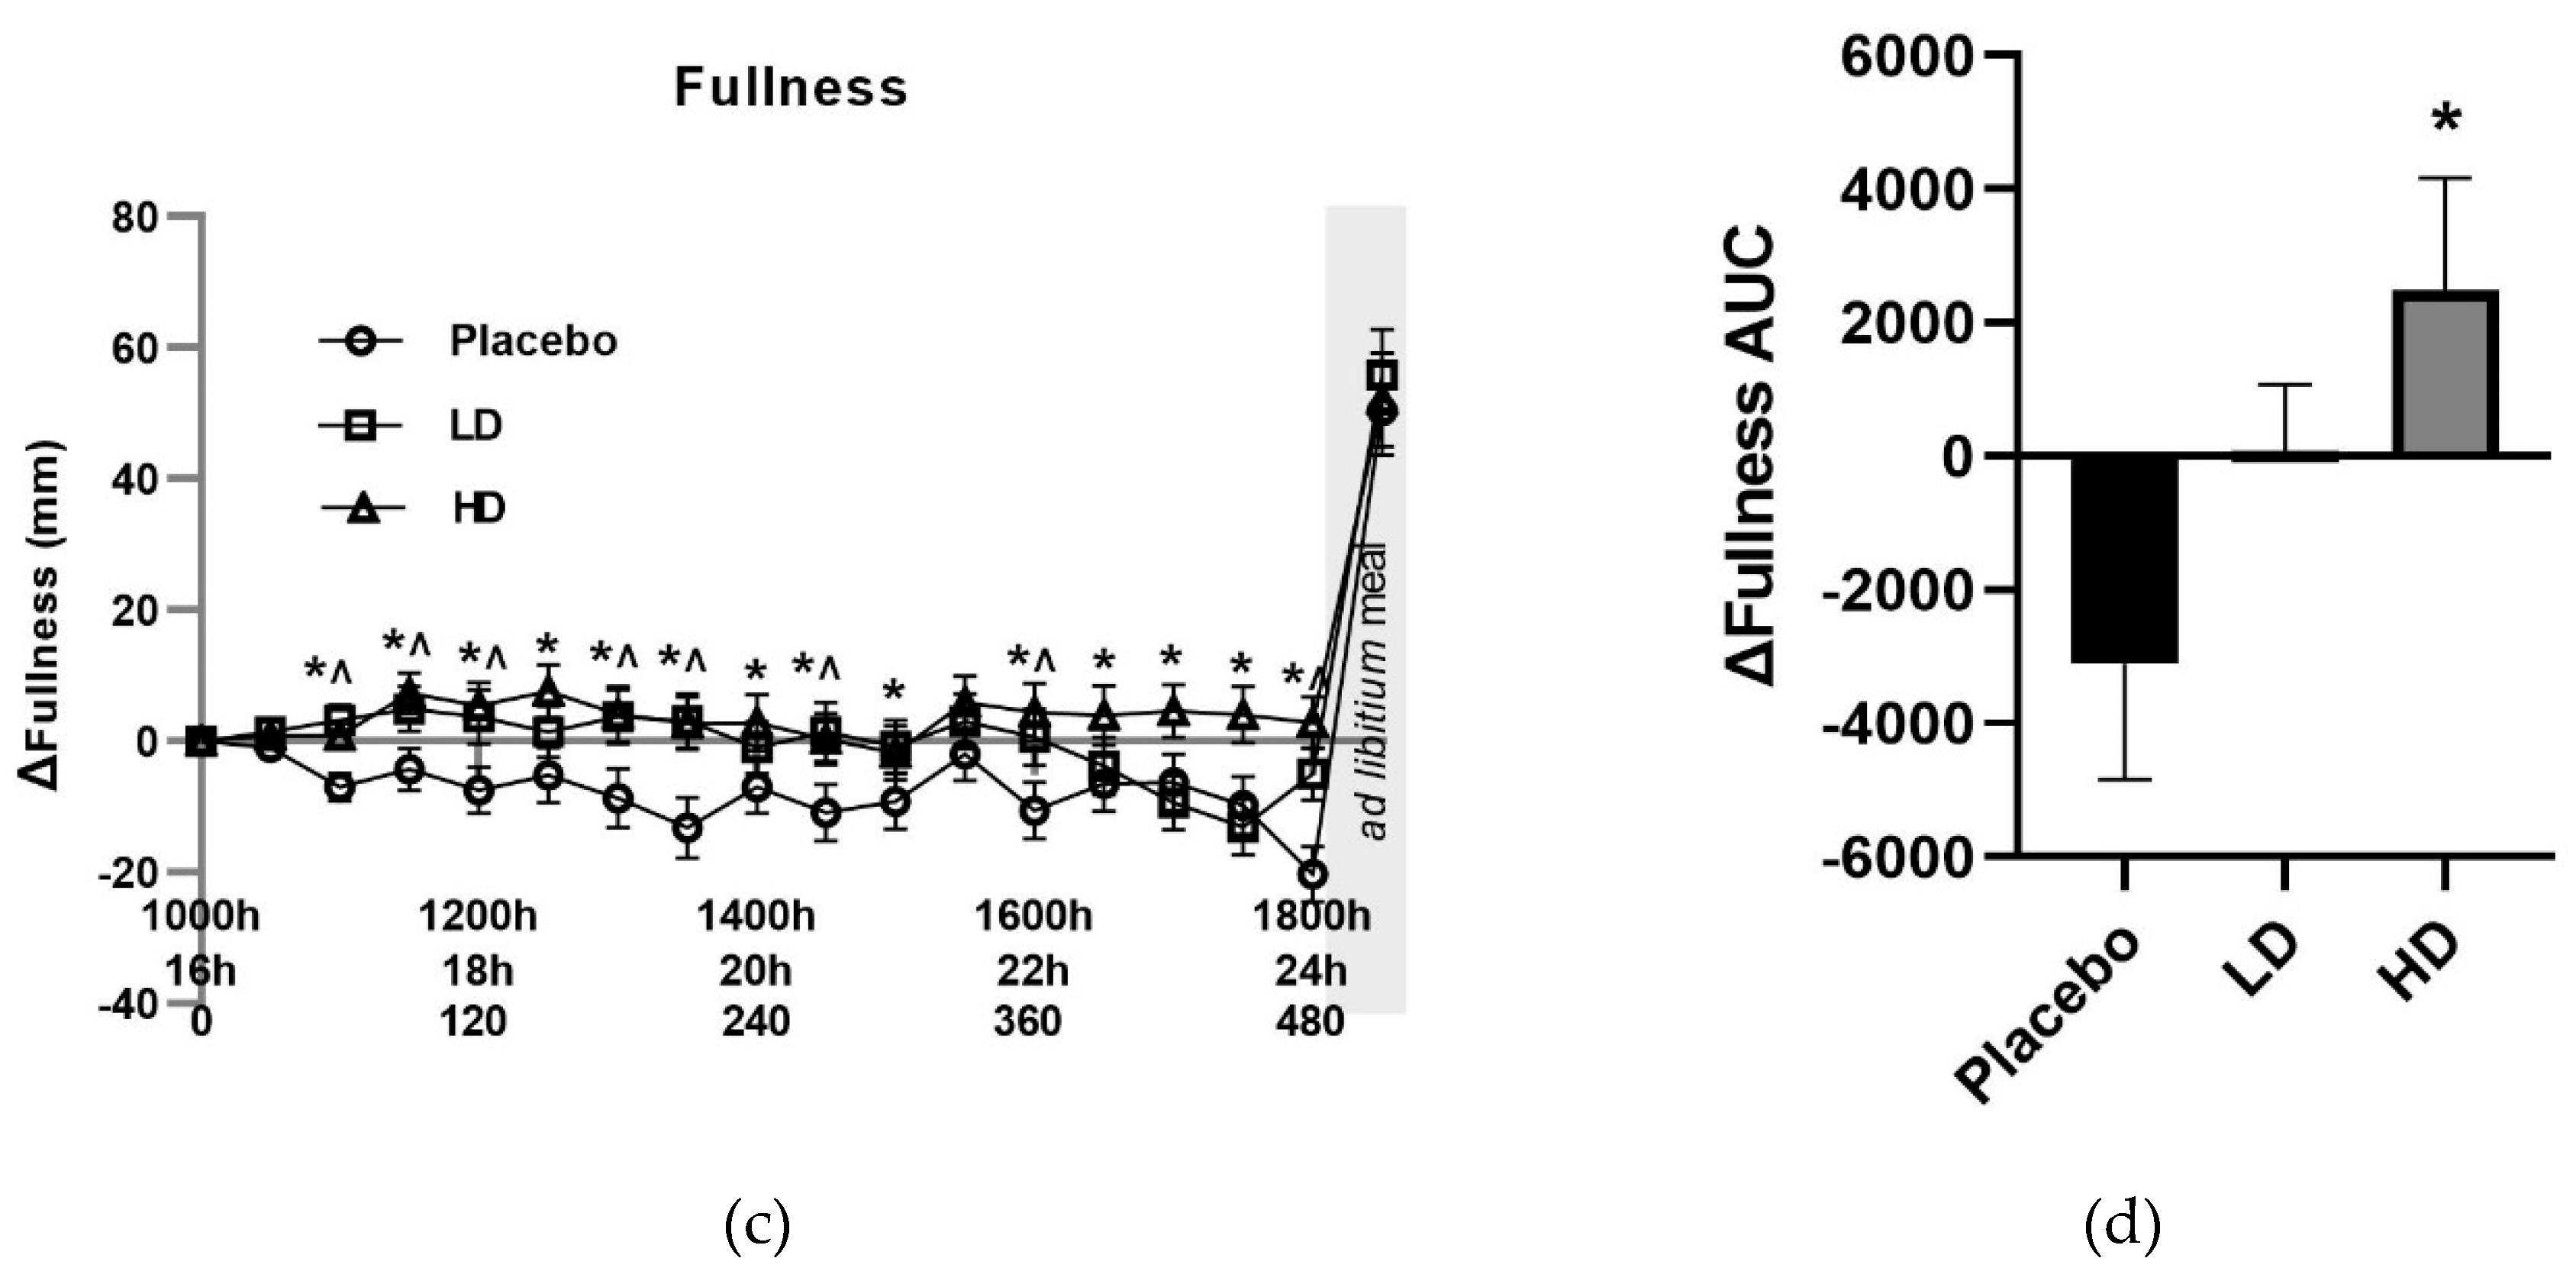
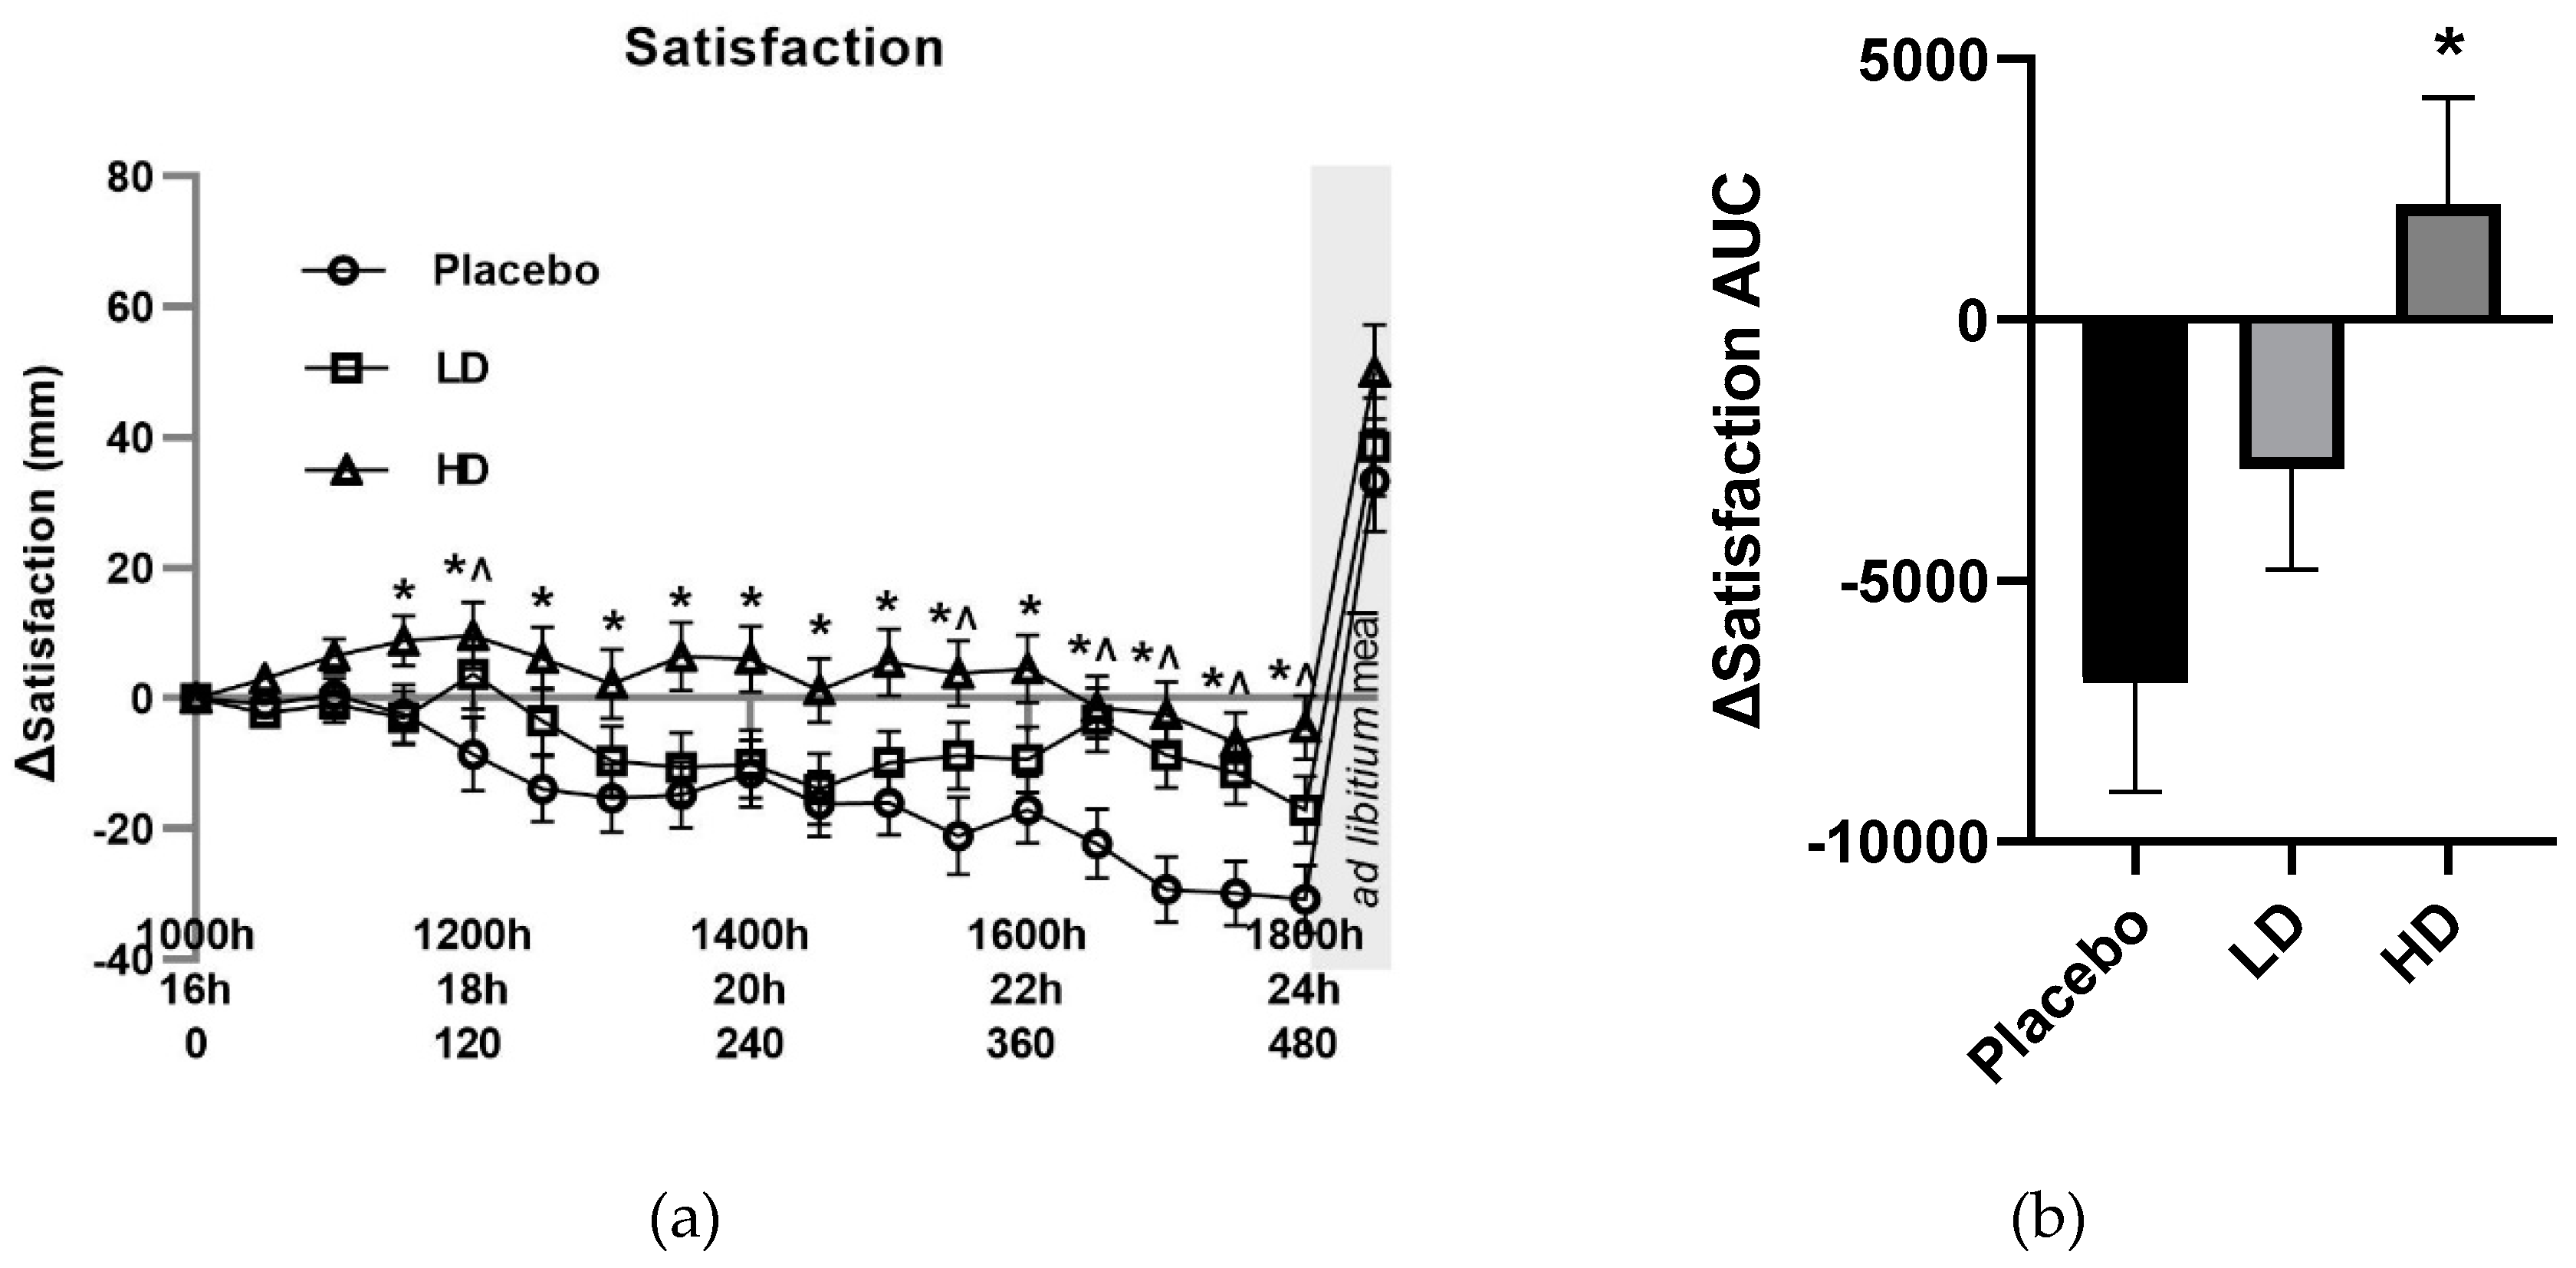
The mean change (Δ) in VAS ratings for appetite-related parameters of hunger, TOF, satisfaction and fullness for the three groups are shown in
Figure 3 and
Figure 4. The placebo group recorded a 33 mm increase in VAS hunger ratings, a 20 mm decrease in VAS fullness ratings, 12 mm increase in VAS TOF ratings, and a decrease of 31 mm in VAS satisfaction ratings over the 16–24 h fasting period. These changes in these appetite measures are as expected and are similar to previous examinations of fasting [
8,
14,
15].
Compared to placebo, both treatments reduced hunger. Mean change (Δ) in VAS hunger ratings was lower compared with the placebo control for both the HD and LD treatment groups. Differences in excess of 10 mm were recorded for Δ hunger for the HD treatment group relative to the placebo for all time points taken from t = 90 min onwards. This same magnitude difference was evident for all time points post t = 150 min for the LD treatment group. These changes in hunger were significant for main treatment effect when examining the entire treatment period (
Figure 3a
p < 0.05). Post-meal hunger values were −31 mm, −34 mm and −40 mm for the placebo, LD, and HD treatments, respectively, relative to the t = 0 time point.
Figure 3B shows area under the curve (AUC) for Δ hunger over the 510 min period between the start of monitored fasting (t = 0 min) and the final time point (t = 510 min) (ΔAUC). A significant difference was observed between the HD treatment relative to the placebo control (
Figure 4B,
p < 0.05).
Overall, there was a significant Amarasate treatment effect on fullness (
Figure 3C,
p < 0.05), as determined by VAS, which showed Δ fullness increases of ≥10 mm relative to the placebo control at time points t = 90, 150, 180, 210, 270, 360, 390, 420, 450, 480 min for the HD treatment, and time points t = 60, 120, 150, 180, 210, 270, 360, 480 for the LD treatment (
Figure 3C).
Figure 3D illustrates the AUC for Δ fullness over the 510 min period between the start of monitored fasting (t = 0 min) and the final time point (t = 510 min) (ΔAUC) and shows a significant difference between the HD and placebo group. Post-meal fullness vales were = +50 mm, +55 mm, and +52 mm for the placebo, LD and HD, respectively, compared with the t = 0 time point, and show no significant differences between the treatment groups and the placebo.
Recorded VAS-rated changes in satisfaction supported an Amarasate treatment effect (
Figure 4A,
p < 0.05), there was a 10 mm difference between the HD and placebo for all time points post t = 90 min, and for the LD relative to the placebo at t = 120, 150, 330, 390, 420, 450, 480 min. Post-meal satisfaction values were +33, +39, +50 for the placebo, LD and HD respectively compared with their t = 0 values. Histograms for Δ satisfaction (
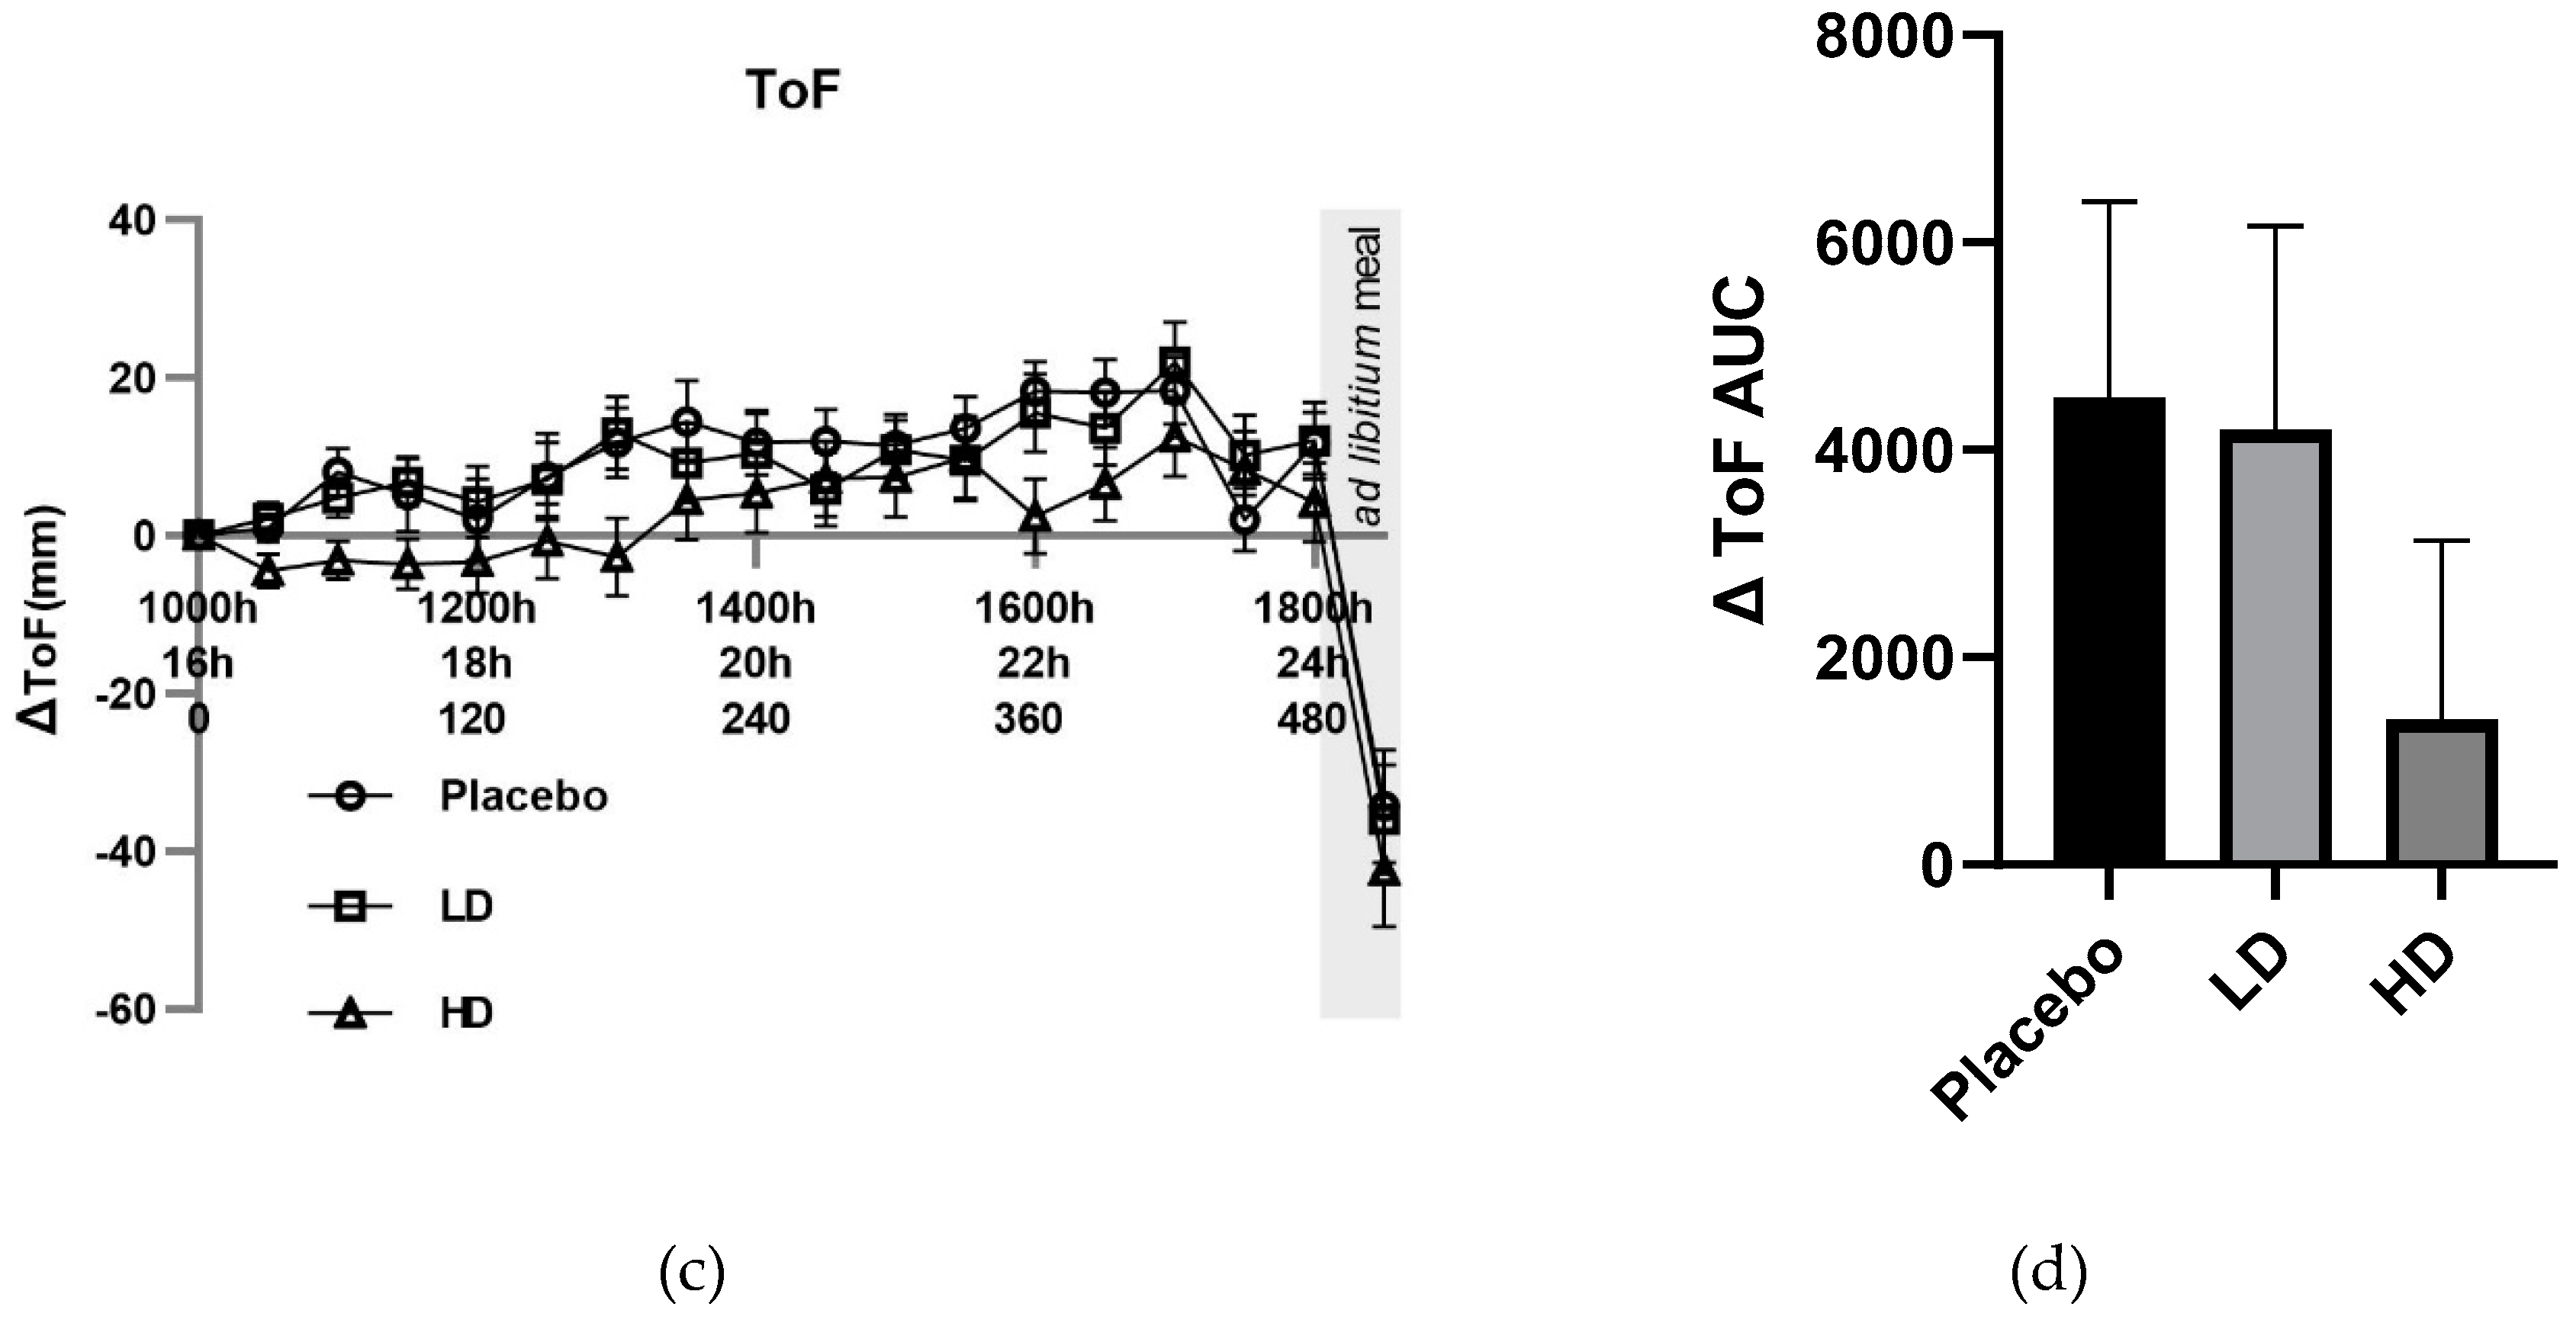
Figure 4B) and Δ TOF (
Figure 4D) over the 510 min period between the start of monitored fasting (t = 0 min) and the final time point (t = 510 min) (ΔAUC) showed a significant difference between the HD and placebo treatments for satisfaction only.
VAS ΔTOF ratings did not differ by more than 10 mm between the placebo and LD groups for any of the pre-mealtime points, and at only the 60, 180, 360, and 390 min for the HD group relative to the placebo group. Post-meal TOF ratings of −34 mm, −36 mm, and −42 mm for placebo, LD and HD treatment groups relative to the t = 0 time point, respectively (
Figure 4C).
3.3. Craving Ratings
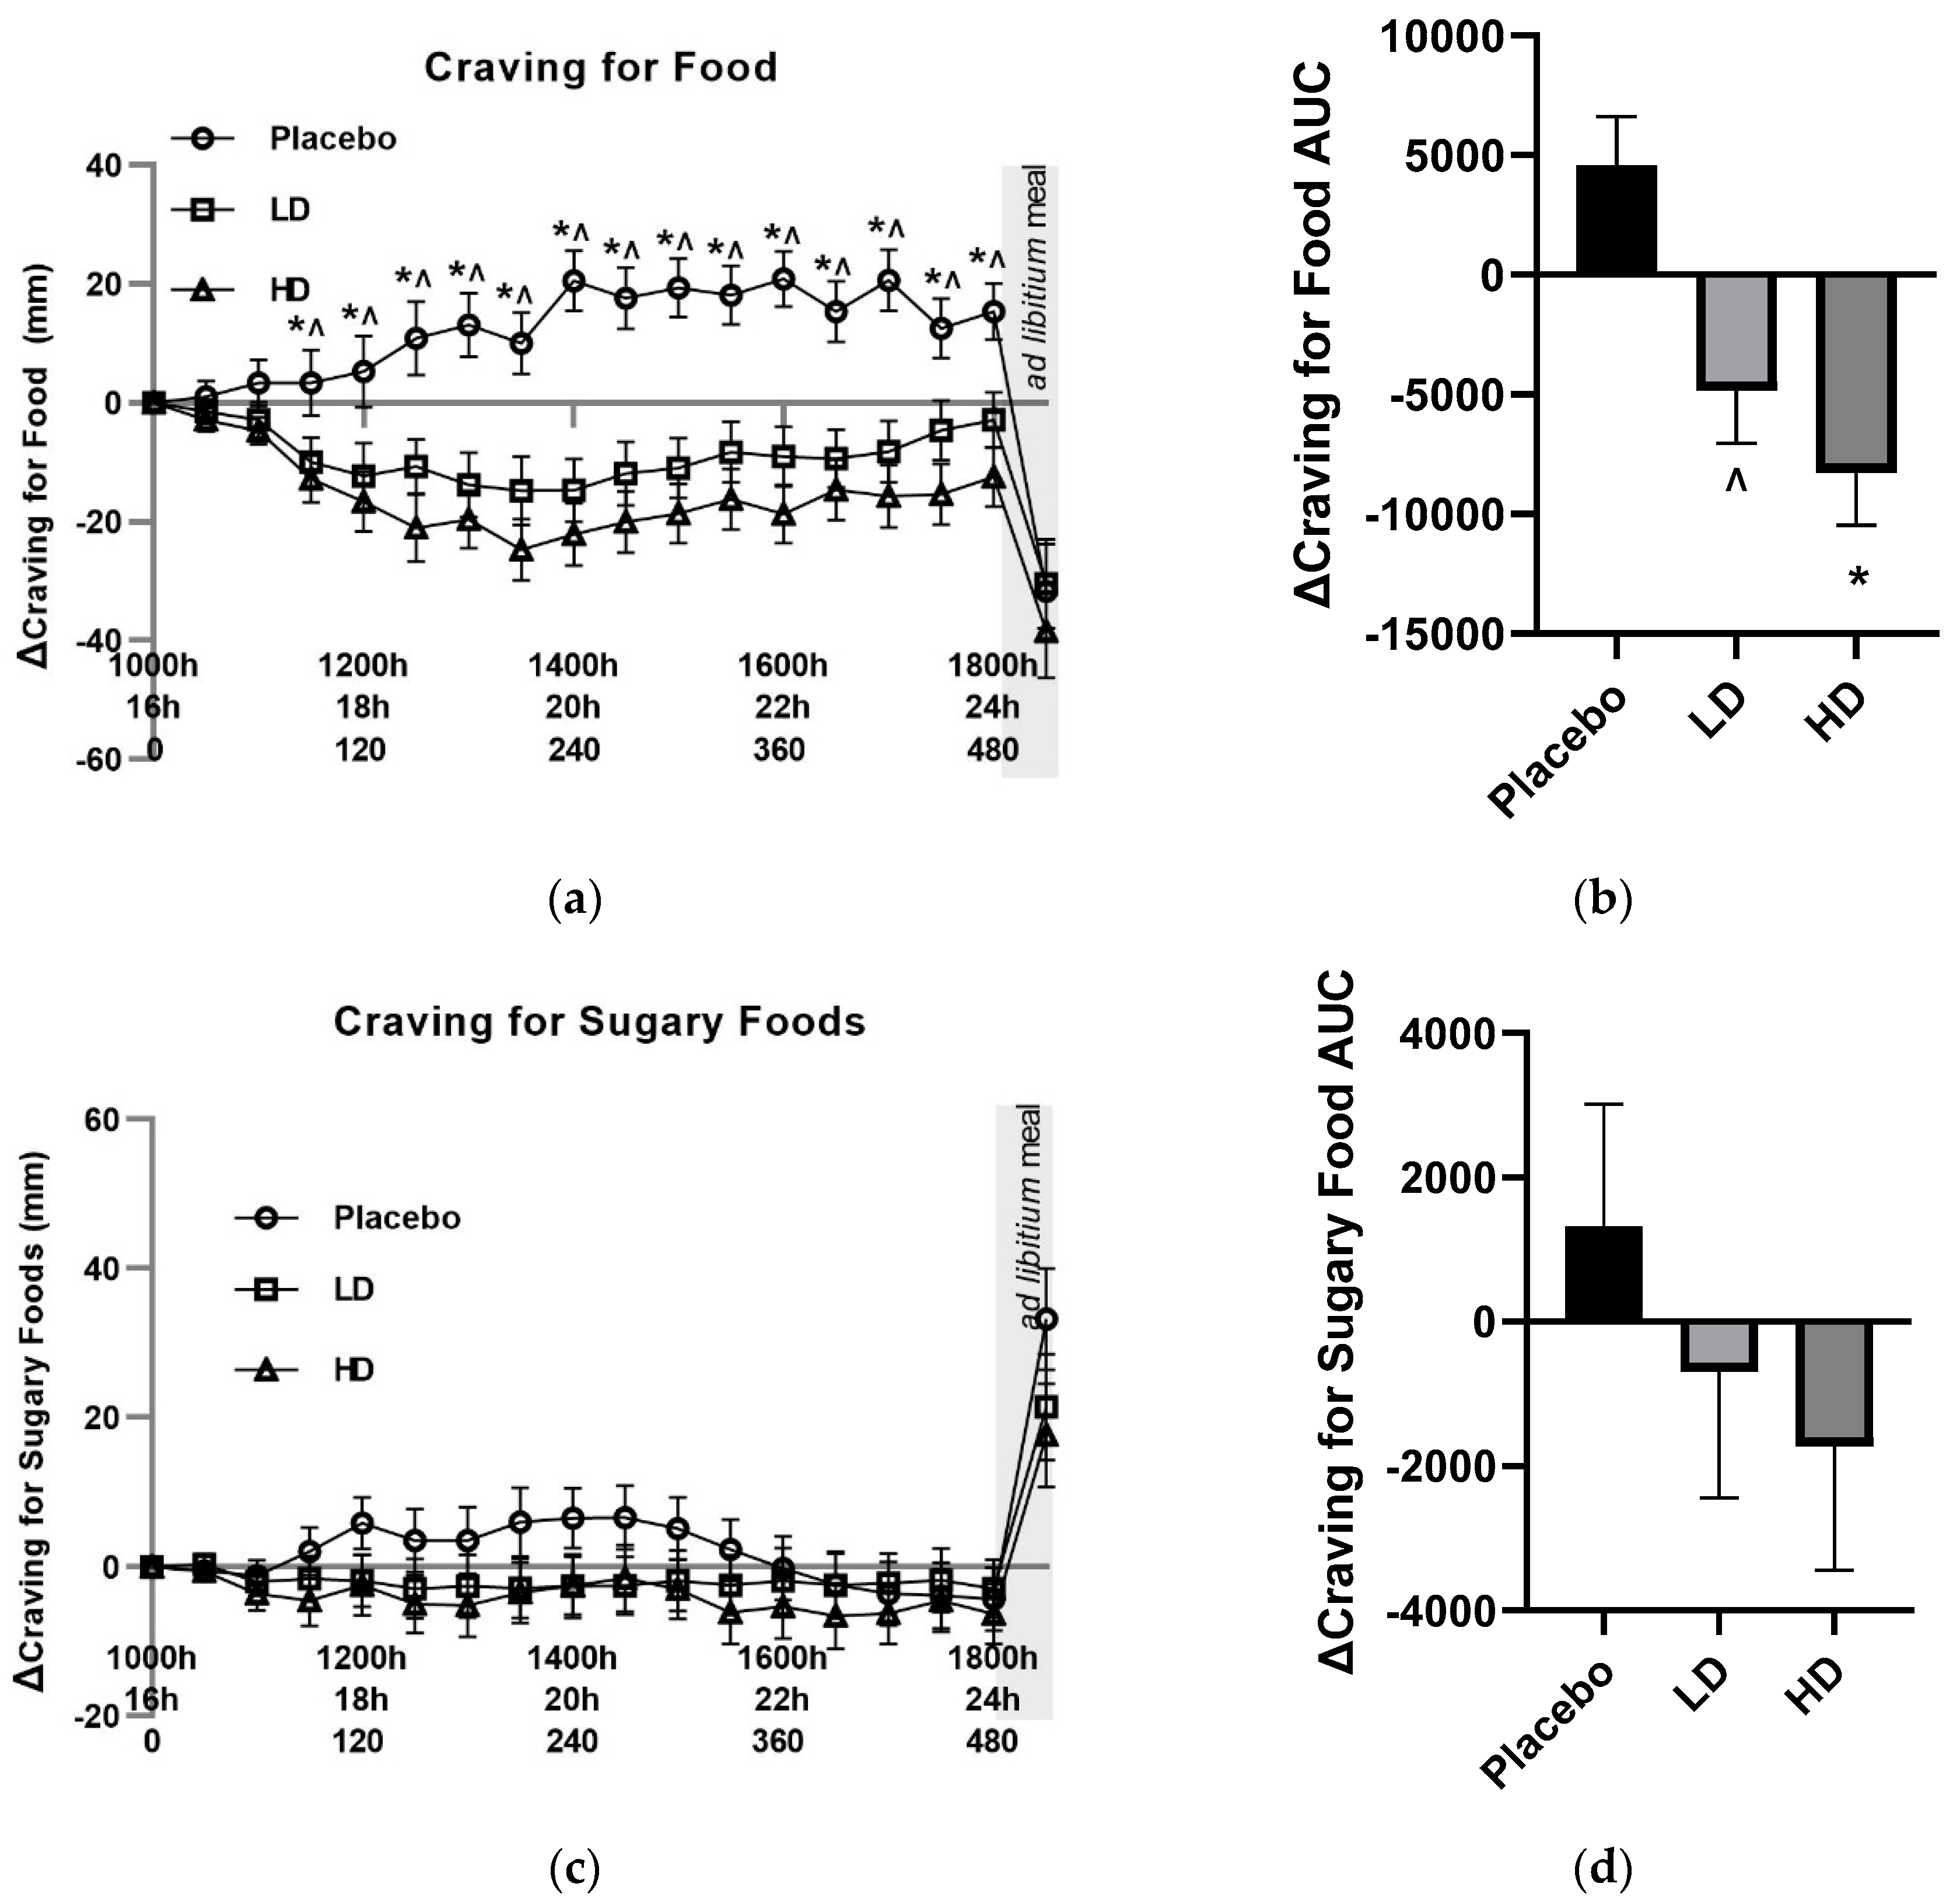
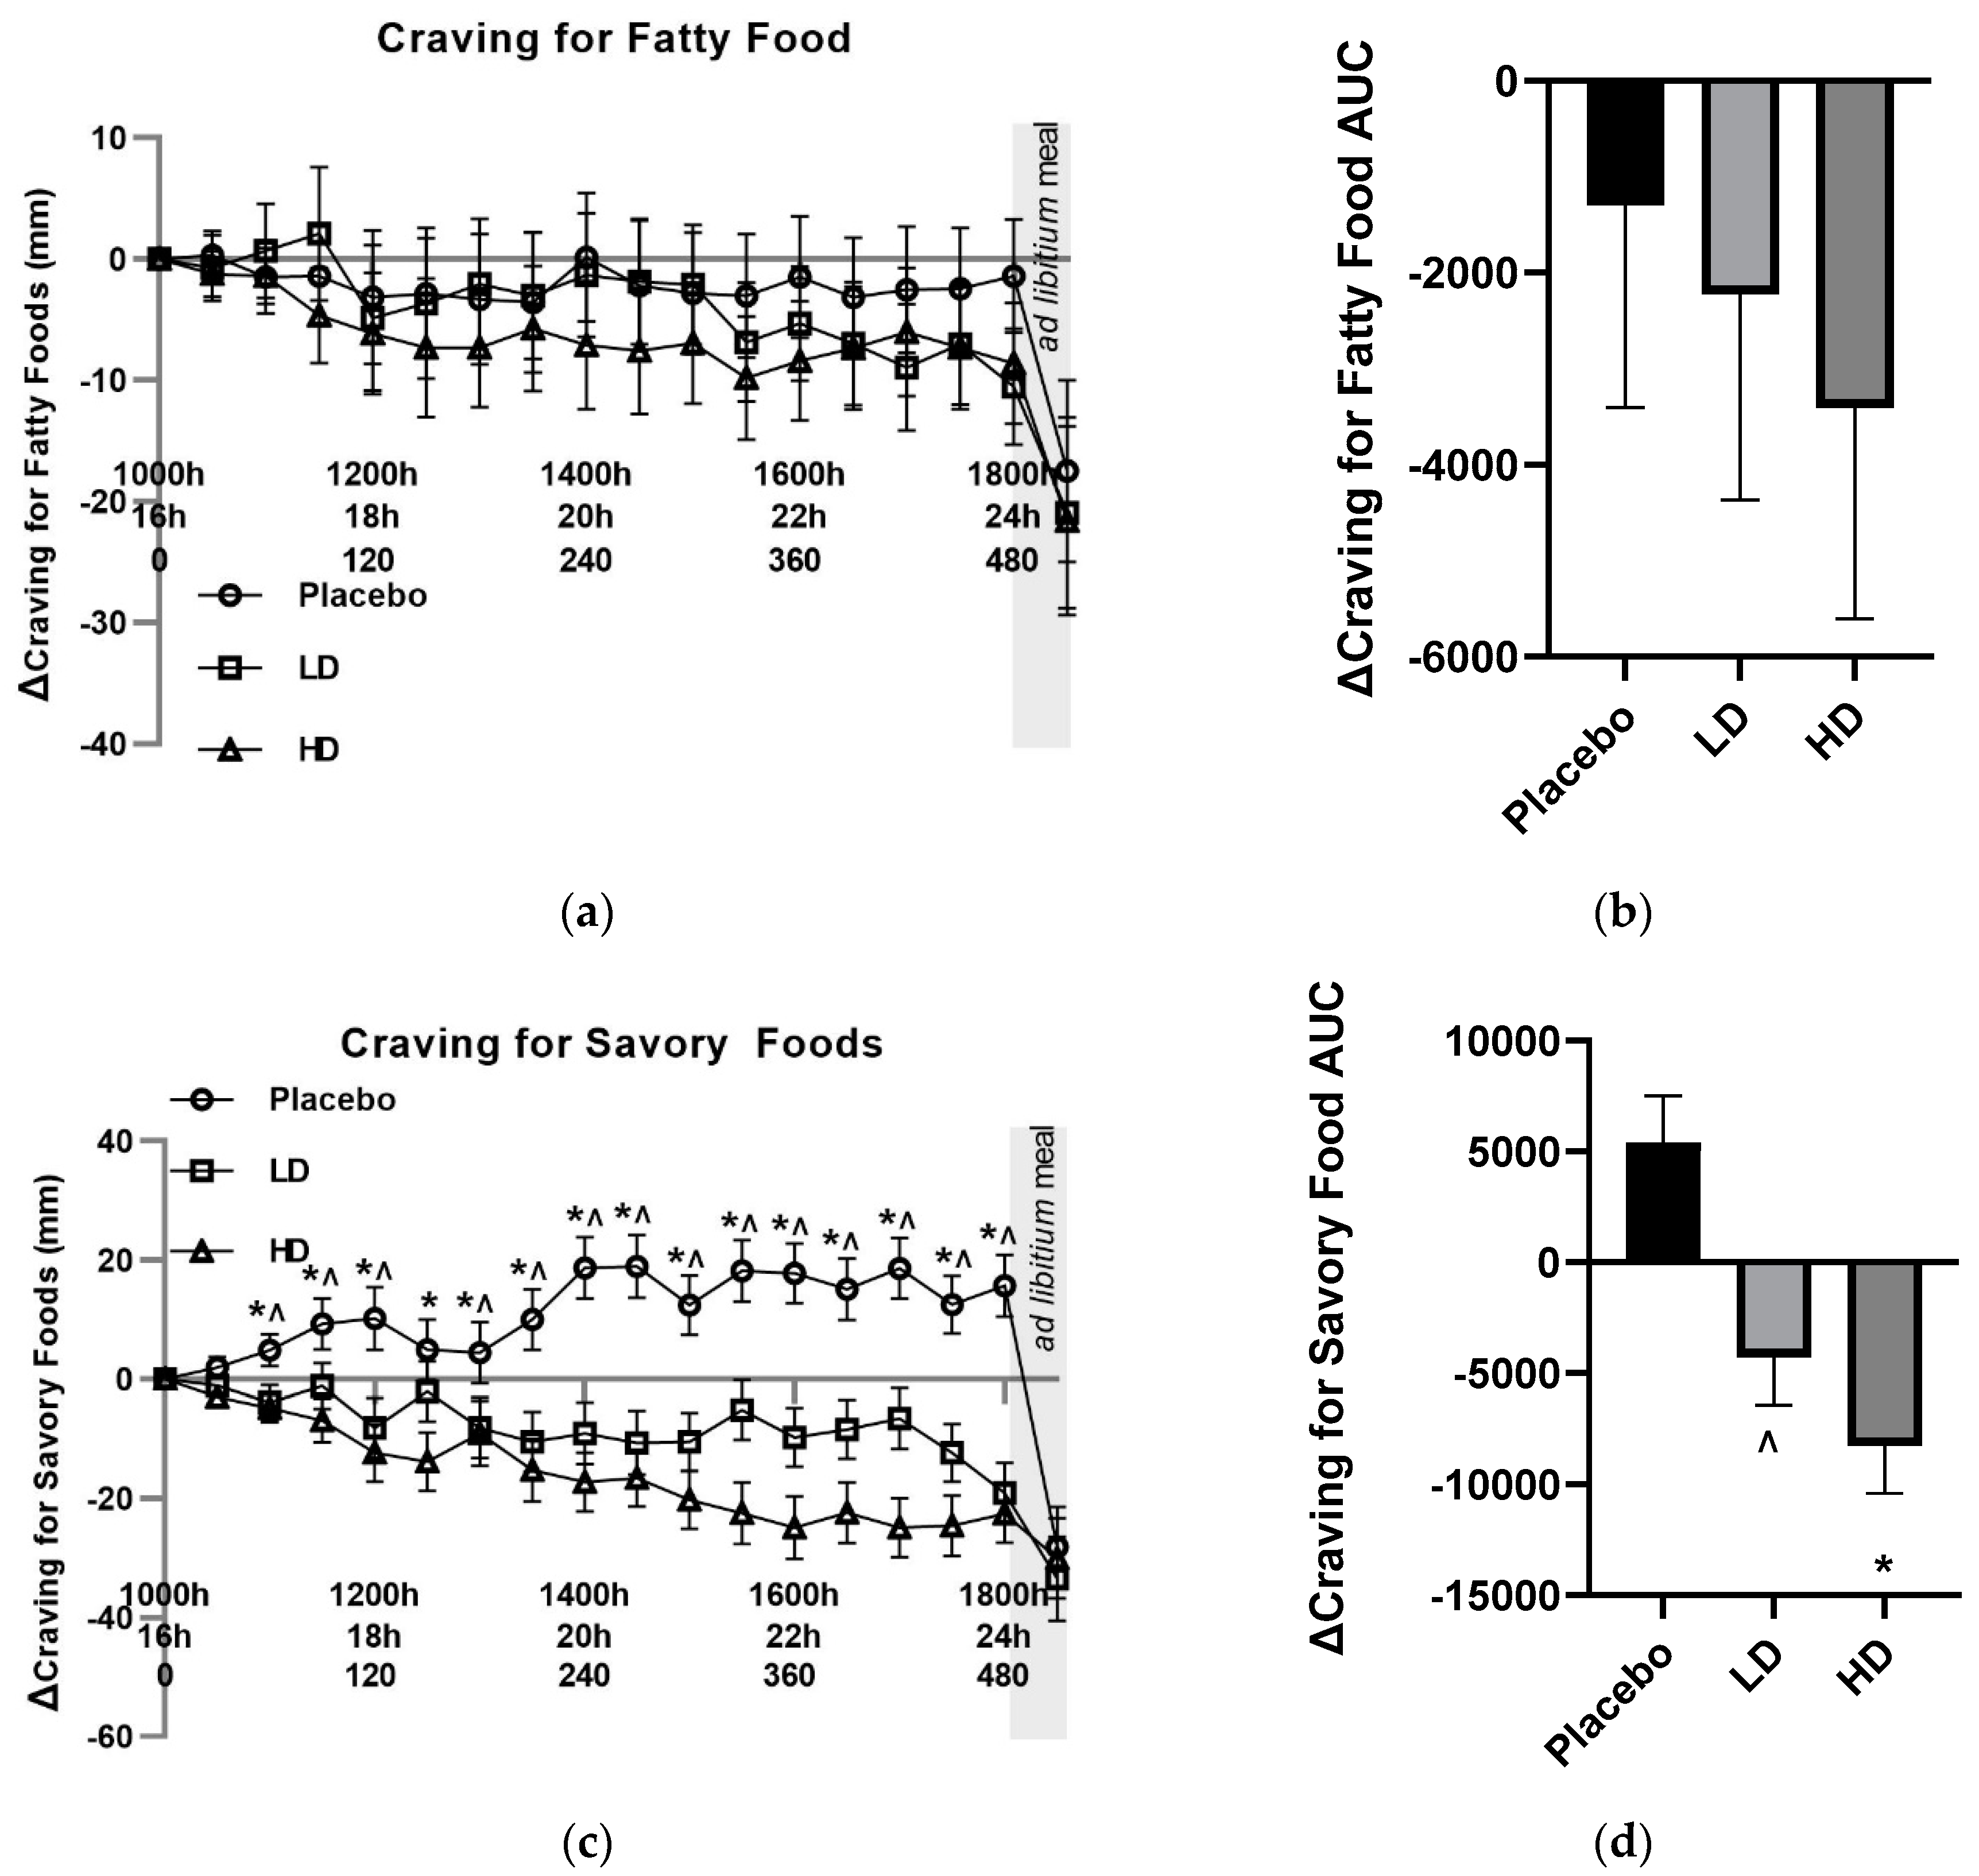
The mean changes (Δ) in VAS ratings for cravings for “food”, “sugary foods”,” fatty foods”, and “savory foods” are shown in
Figure 5 and
Figure 6.
Mean changes (Δ) in VAS food craving ratings were lower compared with the placebo control for both the HD and LD treatments. These changes in hunger were significant for main treatment effect when examining the entire 8 h treatment period (
Figure 5A,
p < 0.05). Differences in excess of 10 mm were recorded for VAS Δ cravings for food for the HD treatment group relative to the placebo for all time points taken from t = 60 min onwards. This same magnitude of difference was evident for all time points post t = 90 min for the LD treatment group. Post-meal hunger values were −32 mm, −30 mm and −38 mm for the placebo, LD, and HD treatments relative to the t = 0 time point, respectively.
Figure 5B shows the AUC for Δ cravings for food over the 510 min period between the start of monitored fasting (t = 0 min) and the final time point (t = 510 min) (ΔAUC). A significant difference was observed between both the HD treatment and the LD treatment groups relative to the placebo control (
Figure 5B,
p < 0.05).
Mean changes (Δ) in both VAS sugary food craving and fatty food craving ratings did not differ by 10 mm at any pre-mealtime points between any of the treatments, and at no time point did they differ from their t = 0 baseline by 10 mm (
Figure 5C and 6A). Post-meal sugary food cravings were lower for both the LD and HD treatments relative to the placebo, being +33 mm for the placebo, +21 mm for the LD and +17 for the HD treatments relative to their t = 0 mins timepoints. Post-meal fatty food cravings were −17 mm for the placebo treatment, 21 mm for the LD treatment and 22 mm for the HD treatment relative to their t = 0 mins timepoints.
Mean changes (Δ) in VAS Δ cravings for savory food ratings were lower in both the LD and HD treatment groups relative to the placebo treatment with evidence for a main treatment effect (
Figure 6C,
p < 0.05). Differences in excess of 10 mm were recorded for VAS Δ savory food cravings for all time points post t = 90 for the LD and t = 60 for the HD treatment relative to the placebo treatment. Post-meal VAS savory food craving ratings were −28 mm for the placebo treatment, −33 mm for the LD treatment, and −30 mm for the HD treatment relative to their t = 0 time points.
Figure 6D shows AUC for Δcravings for savory food over the 510 min period between the start of monitored fasting (t = 0 min) and the final time point (t = 510 min) (ΔAUC). A significant difference was observed between both the HD treatment and the LD treatment groups relative to the placebo control (
Figure 6D,
p < 0.05).
At no time points did craving for bitter foods, craving for spicy foods, or nausea exceed 10 mm.
3.4. Energy Intake
Energy intake at the ad libitum meal was 14.3% lower when taking the HD treatment (p < 0.05) and 8.1% lower when taking the LD treatmment (not significant) relative to the placebo control treatment.
3.5. Side Effects and Withdrawals
Three participants experienced adverse effects that were deemed likely to be treatment related. Liquid, loose bowel movements were reported by two participants after taking the HD treatment, and from one participant after taking the LD treatment (who also experienced loose stools on the HD treatment), with one participant also experiencing heartburn from the HD treatment. Two additional participants experience adverse effects likely to be study related, but not treatment related. One participant on the placebo treatment experienced nausea and vomited during the fast-breaking meal. One participant withdrew from the study post placebo treatment-day due to post-study day gastrointestinal pain. Additionally, two participants withdrew from the study due to difficulties scheduling study attendance.
4. Discussion
This current study shows for the first time that a bitter hops can suppress appetite and can reduce cravings for food in females.
Favorable changes in several appetite measures reported here are likely to be biologically important and to affect eating behavior [
12]. These changes in appetite measures occur over a greater than 6 h period, are in excess of the 10% that is typically targeted for behavioral change, and would be likely to aid fast compliance [
16]. Additionally, the reduced food cravings reported here may also be expected to aid in fast compliance. The results in this study are consistent with those we previously observed in males using a near identical fasting design, with a significant reduction in increased hunger experienced over the last 8 h of the 24 h fasting period compared with placebo. The relative decrease in absolute hunger ratings observed here was a greater magnitude than what was previously seen in males [
8]. This finding agrees with other studies showing greater sensitivity of females to the appetite-suppressing effects of GI-targeted bitterness [
13]. The greater change in hunger values relative to other appetite measures also agrees with data previously observed in males [
8]. Unlike the previous study conducted in males, there was an observed change in how satisfied the participants felt, which may be due to difference in perceived appetite measures between males and females [
17].
It is worth noting that while increases in some appetite and food craving measures were reduced, baseline values were already elevated due to the prior 16 h of fasting and participants would likely be considered to be “hungry” even in the treatment groups. The results presented here indicate a suppression of further hunger, and not a state of no hunger. As observed previously in the males [
8], the increase in hunger around expected lunchtime was blunted in the treatment groups and may be related to inhibition pro-appetite ghrelin action [
18]. Indeed, the same hops extract used in this study has previously been shown to stimulate the release of enteroendocrine cell hormones in people [
9], and a potent inhibitor of ghrelin action has recently been identified in enteroendocrine cells [
19]. This previous data suggests the inhibition of ghrelin action may have occurred in this study, and that this same inhibition may relate to reduced energy intake at the
ad libitum fast breaking meal.
Cravings for food in general, and savory food in particular, were seen to be decreased by the bitter hop treatment. Cravings for savory food was the only specific food craving that showed a treatment effect and was very similar in both magnitude and pattern to the changes observed for general food cravings. There were also notable similarities between the hunger and food craving changes observed when on the hops treatments. Interestingly, hunger has previously been correlated with food cravings and suggests that hunger may have influenced the food craving results [
20].
The greater increase in cravings for savory foods, when compared to fatty or sugary foods, is in line with a previous report of food cravings experienced fasting [
21]. This savory food craving may also have been driven by participant expectation for the fast-breaking rice-based meal, that would have been considered savory, and it is possible that if a fatty or sugary meal was presented that pre-meal craving profiles and the effect of treatment on them may have been different. It is possible that cravings for savory food was driving the overall food craving, with little apparent influence from either sugary or fatty food craving. Interestingly, post-meal sugar cravings did show a notable absolute difference between treatments. Given that sweet foods are typically consumed as either a between-meal snack or as an after-meal dessert, and that this after mealtime point was the only time point where participants experienced significant sugar cravings, it suggests that if a study was conducted that specifically focused on times of heighten sugar cravings, a significant change may be detected.
Amarasate, the bioactive hops extract present in the test capsules, has been shown to exhibit appetite-suppressing activity by increasing the blood concentrations of anorexigenic gut peptides glucagon-like peptide-1 (GLP-1), cholecystokinin (CCK) and peptide tyrosine tyrosine (PYY). These peptide hormones are released during intestinal exposure to bitterness, and in addition to inducing satiation and enhancing postprandial satiety, they may also have a role in reducing food cravings [
22,
23]. Current preclinical studies support the view that GLP-1 is a target for reward system–related disorders, such as those present during overeating [
23]. It is important to note that as hunger and food cravings may be closely related, further work would be needed to determine if any of the observed changes in food cravings reported here are independent of the effect seen on appetite.
The reduction in absolute food intake observed after taking the HD treatment is broadly in line with the 18% we previously observed in males when given the same daily dose of the same bitter hops extract and is generally in agreement with studies examining the effect of capsule-based GI delivery of bitter compounds on food intake [
9,
10].
In summary, we determined the efficacy of a bitter hop extract to regulate appetite during the 16–24 h period of a water-only fast and showed that the GI-targeted delivery of a highly bitter hops flower extract can reduce both appetite and food cravings as well as reduce post-fast-food intake. The results presented here support the effectiveness of this bitter hops extract as an appetite suppressant in females and suggests a role in the suppression of food cravings. This is a growing body of work supporting the concentrated GI bitterness on acute appetite measures, laying the scientific bases for longer-term weight loss studies to be conducted on overweight individuals.
Author Contributions
conceptualization, E.W, K.L and G.P. ; methodology, E.W, K.L, investigation, E.W, K.L.; data curation, E.W, K.L.; writing—original draft preparation, E.W.; writing—review and editing, All Authors; project administration, E.W.; funding acquisition, E.W.
Funding
This research was funded by Calocurb Limited. The APC was funded by The New Zealand Institute for Plant and Food Research Limited.
Conflicts of Interest
The authors themselves declare no competing financial interests. The New Zealand Institute for Plant and Food Research Limited, a New Zealand government-owned Crown Research Institute, has licensed a hops extract as a dietary supplement to Calocurb Ltd to commercialize and currently holds a minor shareholding in this company. Calocurb Ltd has had no involvement in the collection, analyses, or interpretation of data; the drafting of the manuscript; or in the decision to publish the results.
References
- Mithila, M.V. and F. Khanum, The appetite regulatory effect of guggulsterones in rats: a repertoire of plasma hormones and neurotransmitters. J Diet Suppl, 2014. 11(3): p. 262-71. [CrossRef]
- Sarup, P., S. Bala, and S. Kamboj, Pharmacology and Phytochemistry of Oleo-Gum Resin of Commiphora wightii (Guggulu). Scientifica (Cairo), 2015. 2015: p. 138039. [CrossRef]
- Lee, R.A. and M.J. Balick, Indigenous use of Hoodia gordonii and appetite suppression. Explore (NY), 2007. 3(4): p. 404-6. [CrossRef]
- Klaassen, T., et al., Effects of gastrointestinal delivery of non-caloric tastants on energy intake: a systematic review and meta-analysis. Eur J Nutr, 2021. 60(6): p. 2923-2947. [CrossRef]
- Meyerhof, W., et al., The molecular receptive ranges of human TAS2R bitter taste receptors. Chem Senses, 2010. 35(2): p. 157-70. [CrossRef]
- Zugravu, C.A., et al., Antioxidants in Hops: Bioavailability, Health Effects and Perspectives for New Products. Antioxidants (Basel), 2022. 11(2). [CrossRef]
- Intelmann, D., et al., Three TAS2R Bitter Taste Receptors Mediate the Psychophysical Responses to Bitter Compounds of Hops (Humulus lupulus L.) and Beer. Chemosensory Perception, 2009. 2: p. 118-132. [CrossRef]
- Walker, E., et al., New Zealand Bitter Hops Extract Reduces Hunger During a 24 h Water Only Fast. Nutrients, 2019. 11(11). [CrossRef]
- Walker, E.G., et al., An extract of hops (Humulus lupulus L.) modulates gut peptide hormone secretion and reduces energy intake in healthy-weight men: a randomized, crossover clinical trial. Am J Clin Nutr, 2022. 115(3): p. 925-940. [CrossRef]
- Andreozzi, P., et al., The Bitter Taste Receptor Agonist Quinine Reduces Calorie Intake and Increases the Postprandial Release of Cholecystokinin in Healthy Subjects. J Neurogastroenterol Motil, 2015. 21(4): p. 511-9. [CrossRef]
- Sayer, R.D., et al., Hunger, Food Cravings, and Diet Satisfaction are Related to Changes in Body Weight During a 6-Month Behavioral Weight Loss Intervention: The Beef WISE Study. Nutrients, 2018. 10(6). [CrossRef]
- Blundell, J., et al., Appetite control: methodological aspects of the evaluation of foods. Obes Rev, 2010. 11(3): p. 251-70. [CrossRef]
- Deloose, E., et al., Intragastric infusion of denatonium benzoate attenuates interdigestive gastric motility and hunger scores in healthy female volunteers. Am J Clin Nutr, 2017. 105(3): p. 580-588. [CrossRef]
- Tinsley, G.M., M.L. Moore, and A.J. Graybeal, Reliability of hunger-related assessments during 24-hour fasts and their relationship to body composition and subsequent energy compensation. Physiol Behav, 2018. 188: p. 221-226. [CrossRef]
- Thivel, D., et al., Energy depletion by 24-h fast leads to compensatory appetite responses compared with matched energy depletion by exercise in healthy young males. Br J Nutr, 2018. 120(5): p. 583-592. [CrossRef]
- Flint, A., et al., Reproducibility, power and validity of visual analogue scales in assessment of appetite sensations in single test meal studies. Int J Obes Relat Metab Disord, 2000. 24(1): p. 38-48. [CrossRef]
- Bedard, A., et al., Gender Differences in the Appetite Response to a Satiating Diet. J Obes, 2015. 2015: p. 140139. [CrossRef]
- Drazen, D.L., et al., Effects of a fixed meal pattern on ghrelin secretion: evidence for a learned response independent of nutrient status. Endocrinology, 2006. 147(1): p. 23-30. [CrossRef]
- Hagemann, C.A., et al., Identification and Metabolic Profiling of a Novel Human Gut-derived LEAP2 Fragment. J Clin Endocrinol Metab, 2021. 106(2): p. e966-e981. [CrossRef]
- Reents, J., et al., The Effect of Hunger and Satiety on Mood-Related Food Craving. Front Psychol, 2020. 11: p. 568908. [CrossRef]
- Zajac, I., et al., Modified Fasting Compared to True Fasting Improves Blood Glucose Levels and Subjective Experiences of Hunger, Food Cravings and Mental Fatigue, But Not Cognitive Function: Results of an Acute Randomised Cross-Over Trial. Nutrients, 2020. 13(1). [CrossRef]
- Li, M., et al., Gut-brain circuits for fat preference. Nature, 2022. 610(7933): p. 722-730. [CrossRef]
- Eren-Yazicioglu, C.Y., et al., Can GLP-1 Be a Target for Reward System Related Disorders? A Qualitative Synthesis and Systematic Review Analysis of Studies on Palatable Food, Drugs of Abuse, and Alcohol. Front Behav Neurosci, 2020. 14: p. 614884. [CrossRef]
|
Disclaimer/Publisher’s Note: The statements, opinions and data contained in all publications are solely those of the individual author(s) and contributor(s) and not of MDPI and/or the editor(s). MDPI and/or the editor(s) disclaim responsibility for any injury to people or property resulting from any ideas, methods, instructions or products referred to in the content. |
© 2023 by the authors. Licensee MDPI, Basel, Switzerland. This article is an open access article distributed under the terms and conditions of the Creative Commons Attribution (CC BY) license (http://creativecommons.org/licenses/by/4.0/).
