1. Introduction
50% of the zinc produced in the world is used as a coating to protect steel from corrosion by hot-dip galvanizing. This method involves immersion of steel in a molten zinc bath at a temperature of approximately 450°C [
1].
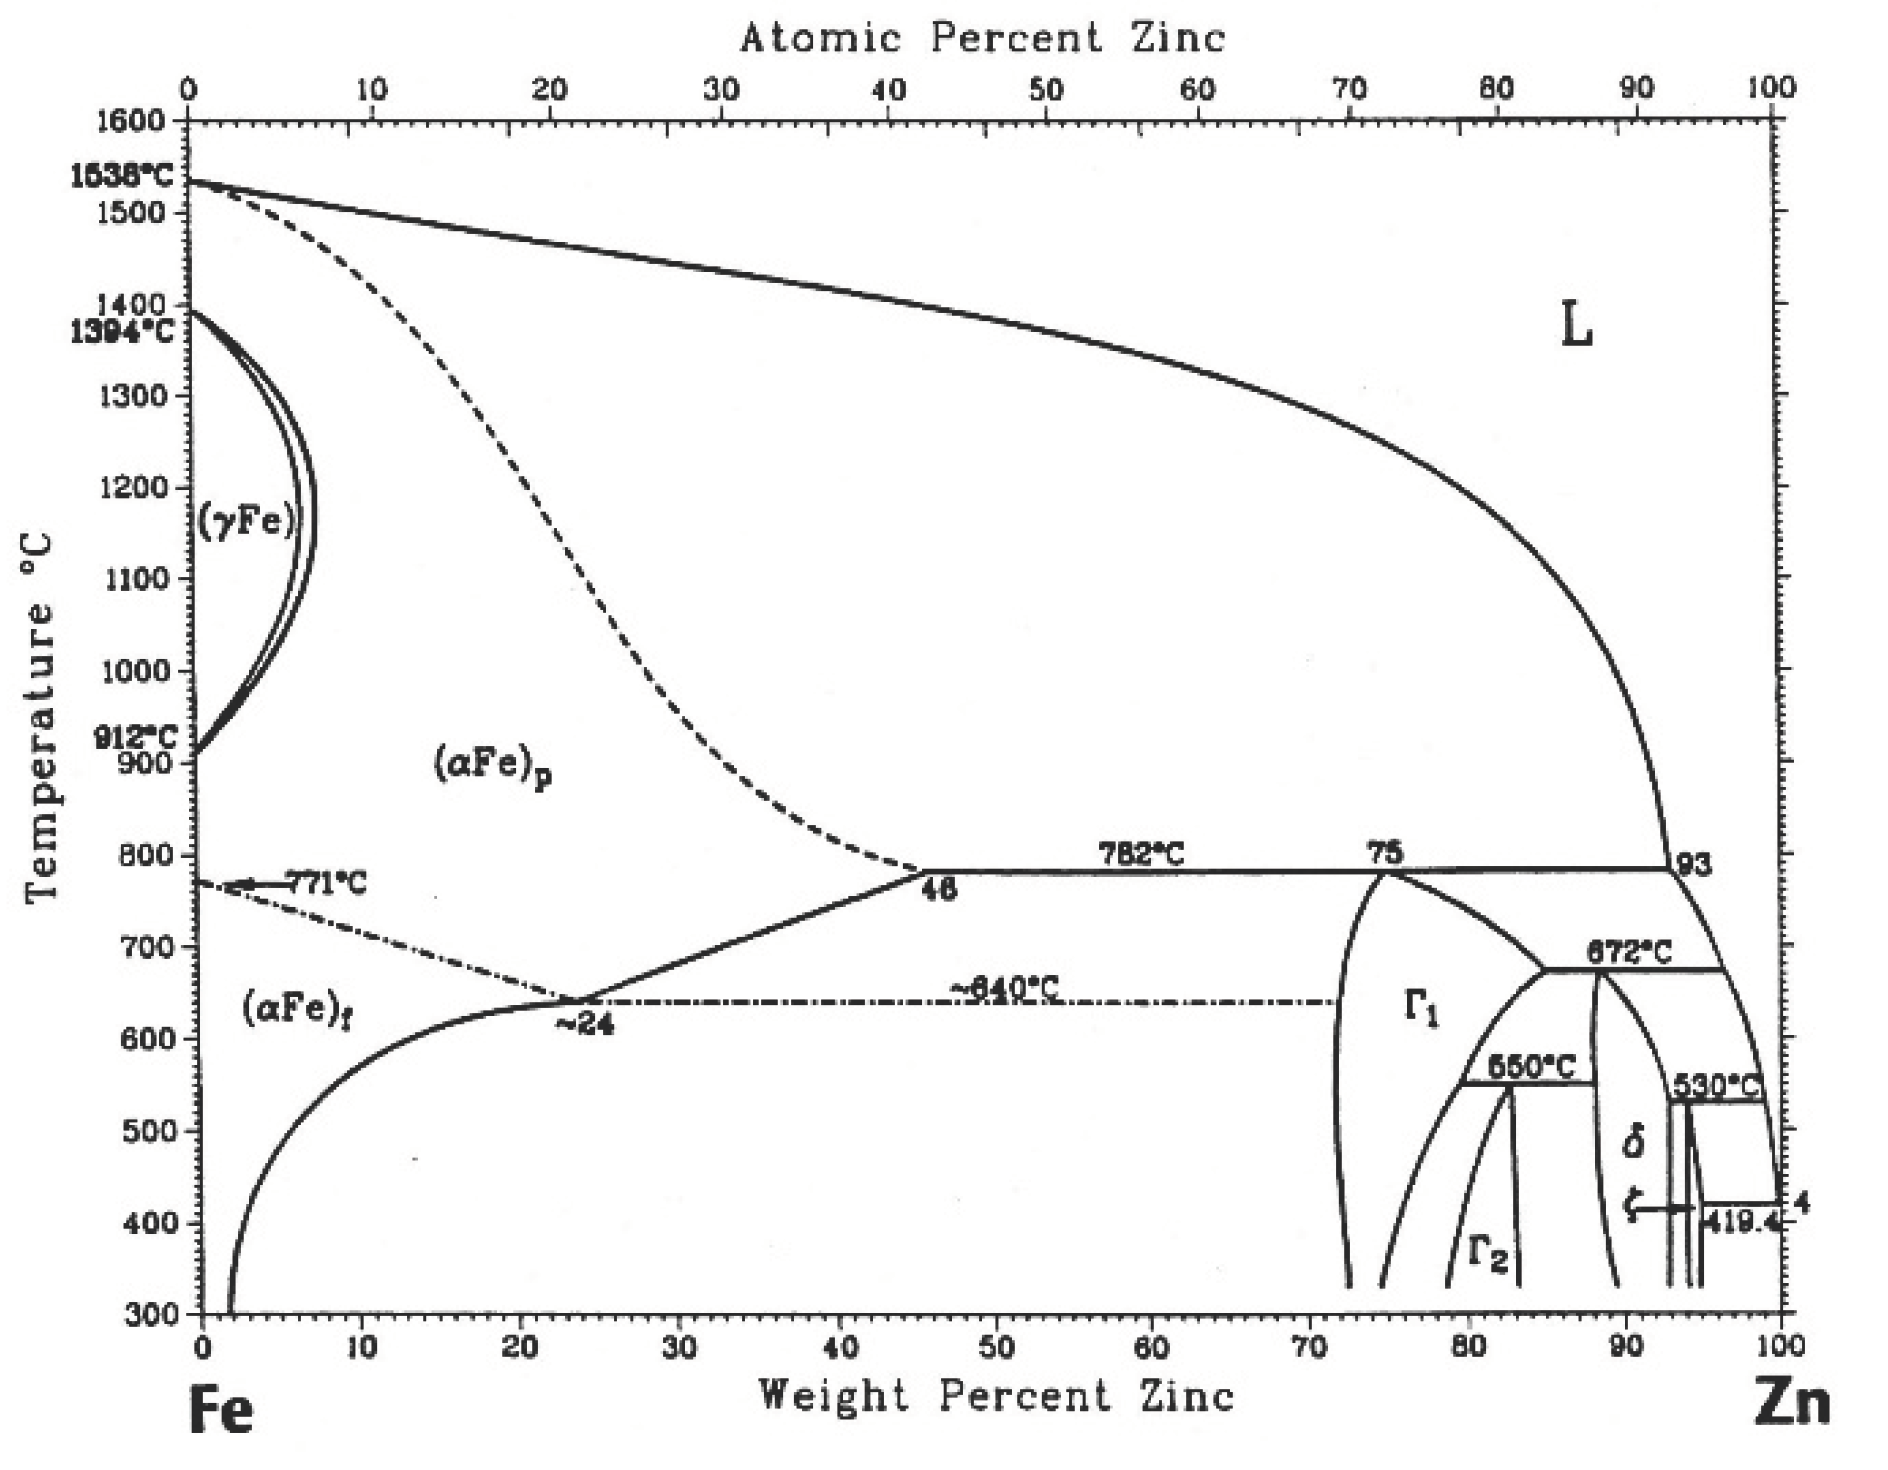
The applications of general or batch hot-dip galvanizing cover multiple industries, where electrical transmission infrastructures, highways and roads, port works, airports, street furniture, the salmon industry, and in the last decade there have been applications in large-scale mining.The study of phase transformations in the hot-dip galvanizing process is based on the iron-zinc thermodynamic equilibrium,
Figure 1, where there is a sequence of formation of intermetallic compounds that grow isothermally in the solid state, nowadays there is consensus on the equilibrium of phases that forms this system,
Figure 1 [
2,
3,
4,
5].
The temperature of the molten zinc bath in the galvanizing process is around 450°C where the steel parts are submerged. Marder[
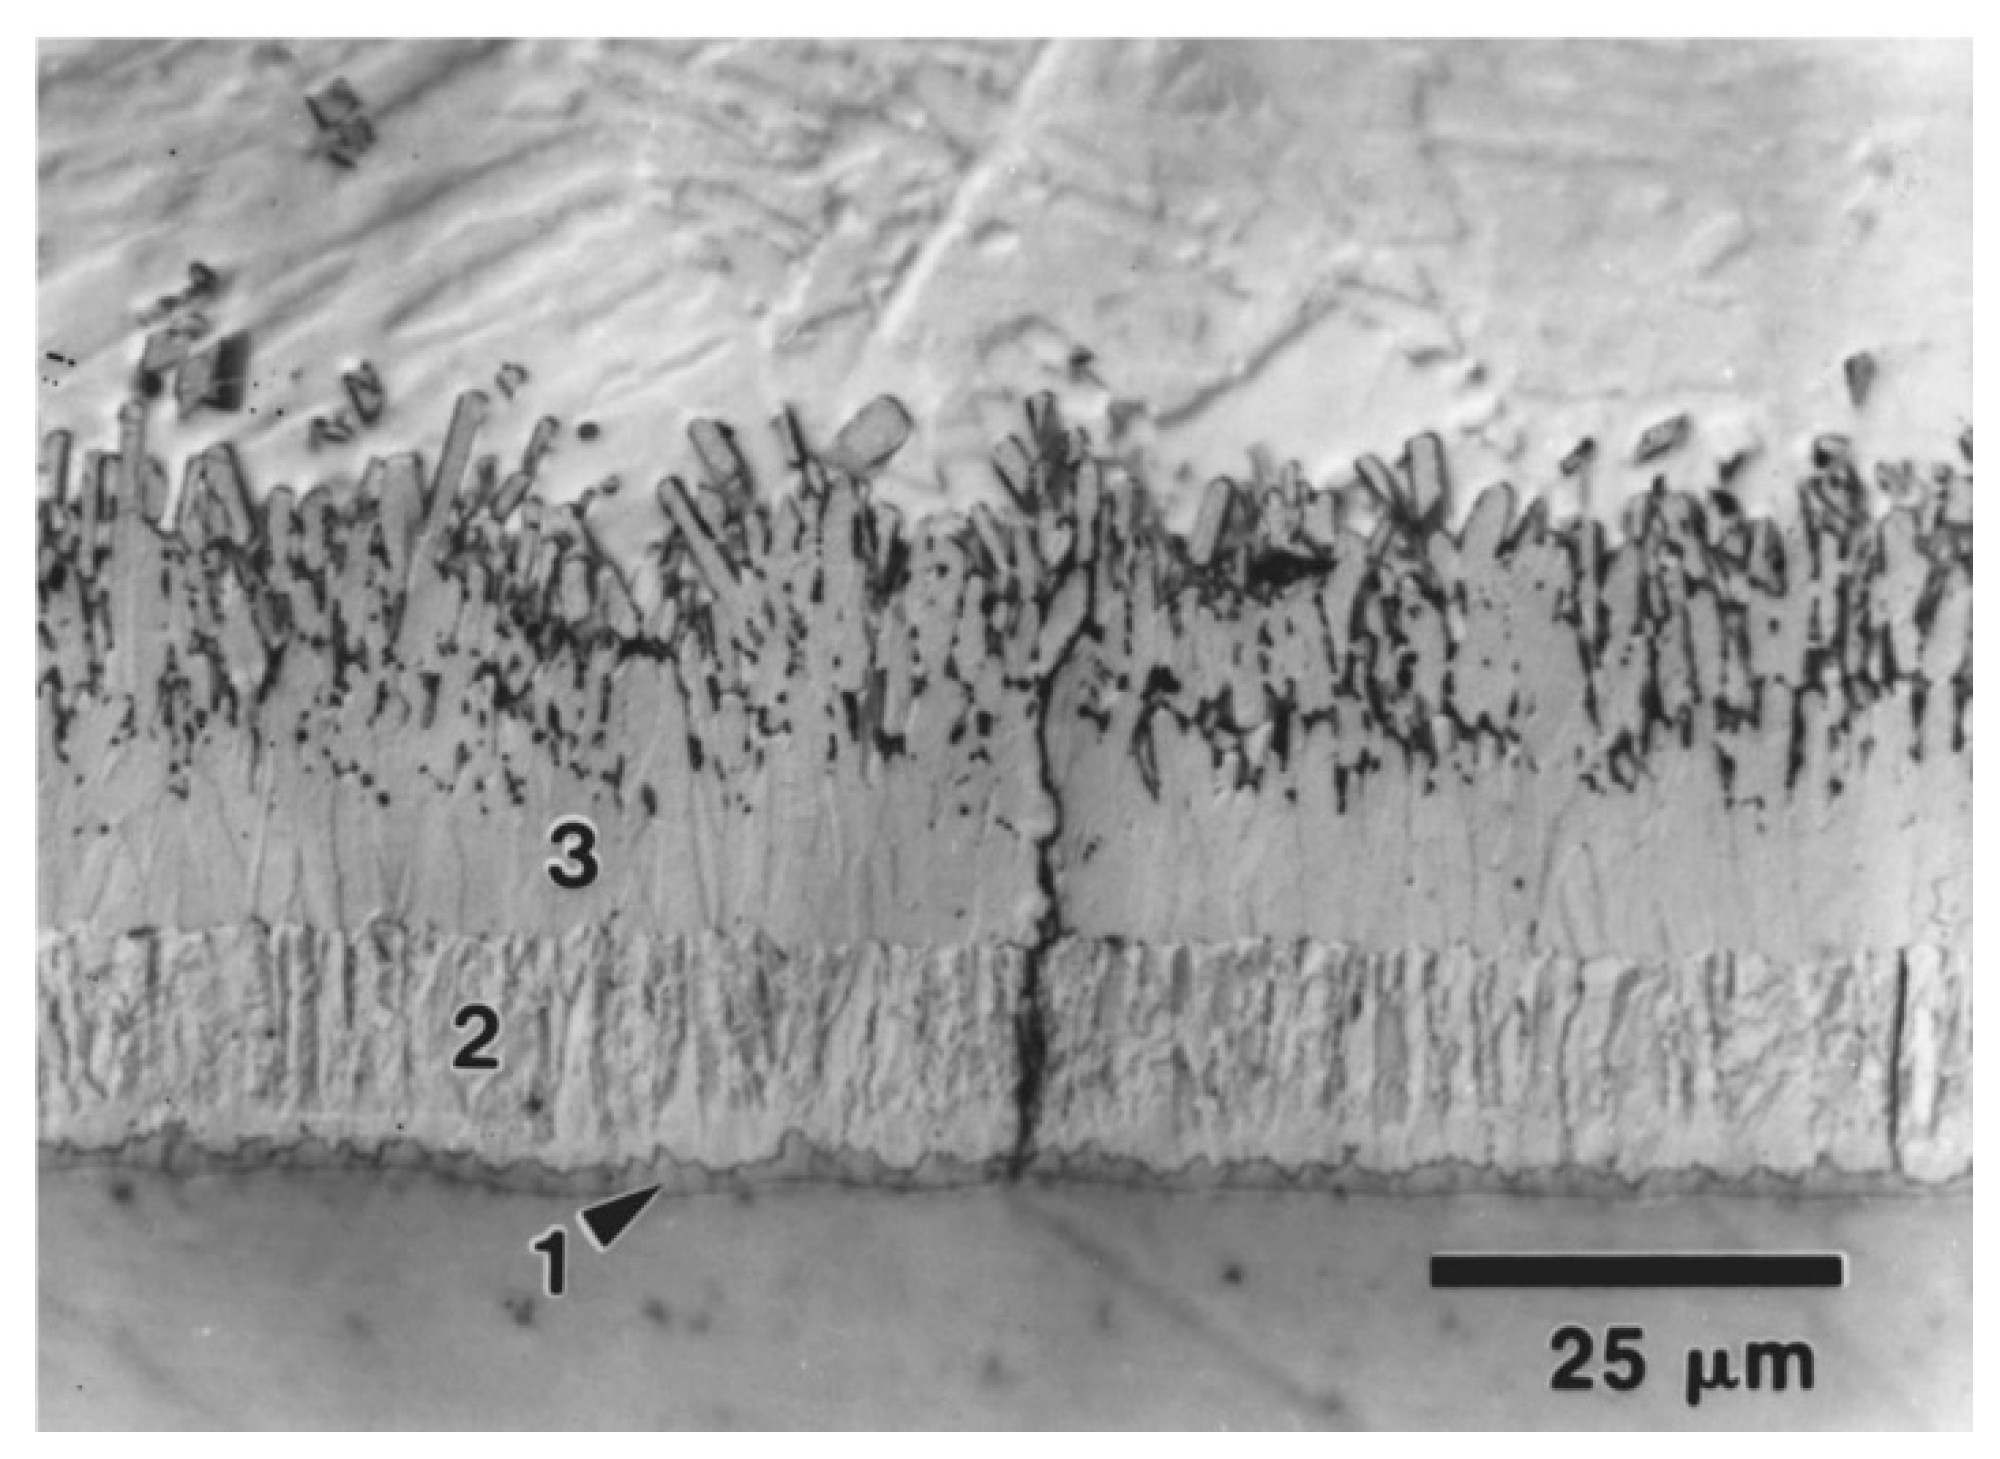
6]. describes in his review, that when molten zinc and iron come into contact, the following layers will be formed according to the equilibrium diagram: zinc-saturated alpha iron, gamma (Γ), gamma1(Γ1), delta(δ), zeta (ζ ) and eta (η). [
6,
7,
8].
Figure 2.
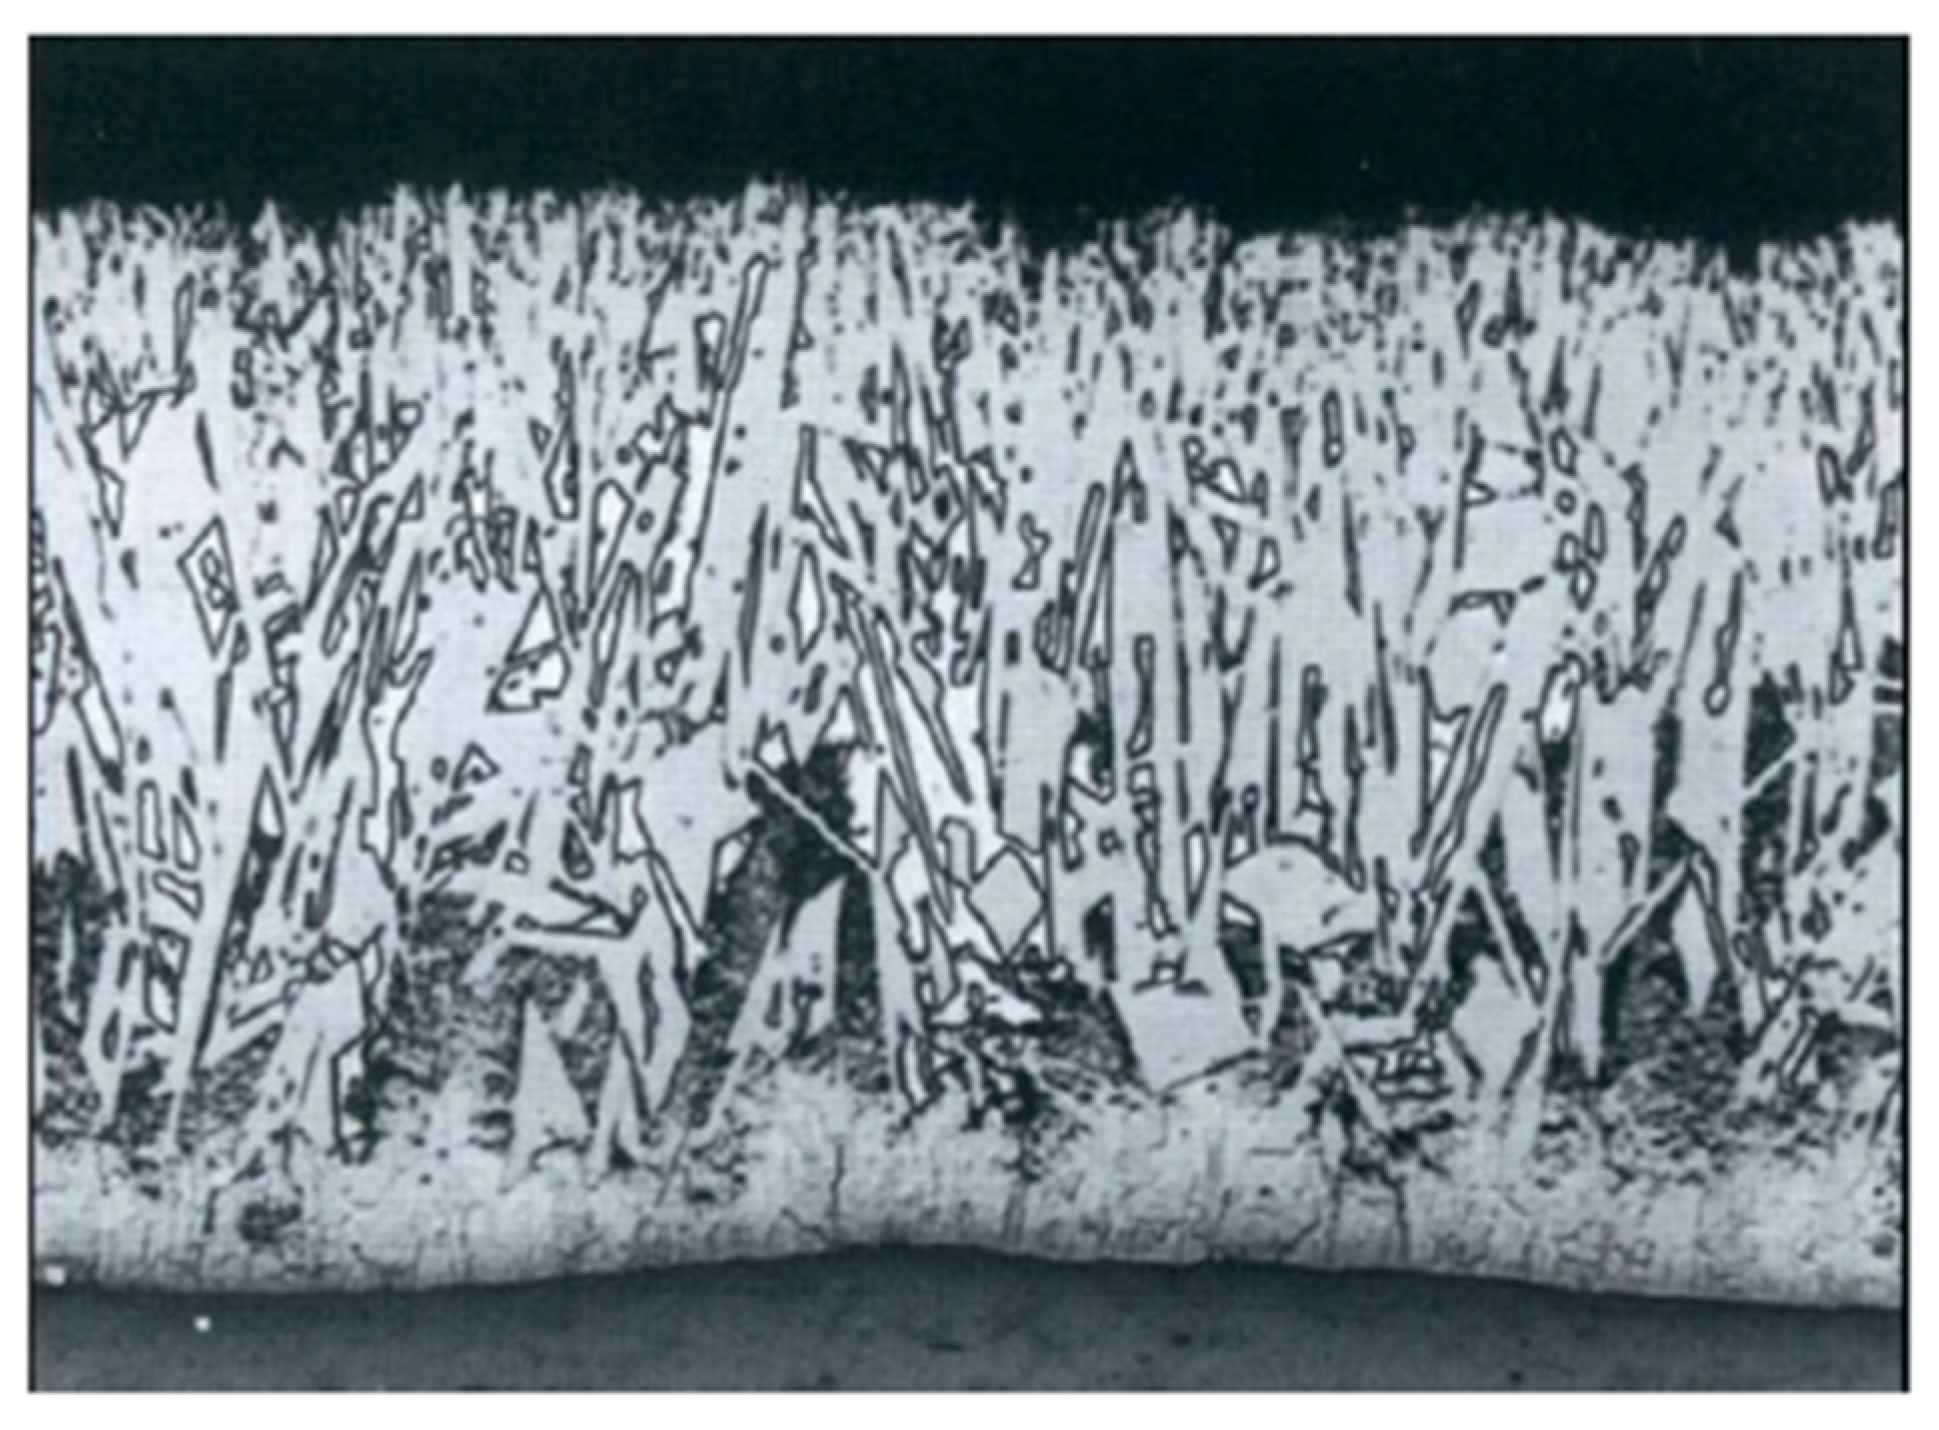
Silicon, which is necessary in the manufacture of steel, has consequences in the coating, where it can be very thin or very thick, with different visual aspects, brittleness, etc. The reactivity of steel with zinc changes drastically and presents a maximum close to 0.08% Silicon, and a minimum around 0.20%. In practice, silicon within the 0.06-0.13% range shows a marked increase in thickness (Sandelin Effect, in honour to the first to observe the phenomenon produced by silicon during galvanization in 1940’s) and over 0.3%, high-thickness coatings are again obtained,
Figure 3 [
9,
10,
11,
12,
13,
14,
15,
16,
17,
18].
Until today, various mechanisms have been proposed to explain how silicon accelerates galvanization reactions, where the following stand out:
Mackowiak and Short [
9] in their 1979 review explain the effect of silicon, describing that with galvanizing times greater than 2 minutes the type of parabolic attack gives way to a linear type. This coincides with the disintegration of the ζ layer and the formation of thick individual ζ crystals. This effect is attributed to the low solubility of Si in solid Zn, so it is assumed that it is also low in Fe-Zn compounds, and Si must be concentrated in pockets of liquid Zn that remain close to the iron surface.
Kozdras and Nissen in 1989 [
10] proposed a model based on the presence and destabilization of the Γ phase. During growth, the δ phase dissolves an order of magnitude greater amount of silicon, so this element is stored in δ, with the appearance of ζ silicon is segregated to the edges, making this structure susceptible to attack by liquid zinc, now the iron-rich layers are now exposed to attack by molten zinc, and a reactive structure is initiated.
Foct in 1993 [
11] proposes a novel mechanism that silicon accelerates galvanizing reactions and explains that in the absence of silicon, the ζ phase nucleates on the steel surface, however, the inclusion of silicon in the system implies the existence of a thin layer of silicon-saturated liquid in the vicinity of the steel, so that the ζ-phase crystals precipitate beyond the iron substrate, which favors their growth given the high mobility of iron in this thin layer of liquid phase. After the union between crystals of the ζ phase, the liquid supersaturated in silicon originates the δ phase or the δ+FeSi mixture.
Guttmann, 1994[
8], states that due to the extremely low solubility of silicon in IMCs, the formation of the first ζ crystals ejects silicon into the liquid. In the silicon-enriched liquid, which is kept between the growing ζ crystals, FeSi immediately precipitates since its solubility in the liquid is extremely low. This desaturates the liquid in Fe with respect to the precipitation of the IMCs, causing the liquid to remain between the ζ crystals, since the solidification temperature of zinc decreases as the iron content decreases. This leads to free access of the liquid to the substrate allowing direct dissolution of the substrate to continue at the bottom of the ζ interdendritic spaces.
Marder, 2000, [
6] in his review, describes the effect that the presence of small concentrations of Si (around 0.1% by weight) leads to linear growth in which the usual uniform attack in a pure zinc bath characterized by layers of Fe-Zn is replaced by a ζ phase mass. crystallites surrounded by liquid Zn.
Su in 2001 [
12]reviews the Fe-Zn-Si system and within the observations, he refutes the mechanism proposed by Foct [
11]. since it is based on the δ/liquid equilibrium, which is not effective according to his review, which is verified by Raghavan in 2003 [
13].
In 2016, Sepper [
14] proposes that during galvanizing of parts, the steel temperature in-creases over a heating curve and shows that the galvanizing reactions begin at a temperature below the melting temperature of zinc when all the phases are in the solid state. He also observes that the effect of silicon does not occur in the short-time situation, so it is the interaction with the newly formed coating and the liquid phase that causes accelerated growth.
2. Materials and Methods
Two commercial structural steels have been selected: a 4mm-thick ASTM A36 steel plate and an L-shaped profile of high strength, low-alloy steel grade Q345B from China's GB/T 1591-2008 standard, 6mm thick and 60mm wide each.
The materials, A36 and Q345B, were selected based on their reactivity, which is visibly distinct to the naked eye in the galvanizing facility. A36 has low reactivity and a shiny appearance, while Q345B has high reactivity and an opaque, mottled appearance.The industrial-sized galvanizing bath has dimensions measuring 7.00 m in length, 1.15 m in width, and 2.00 m in depth. It contains 115,000 kg of molten zinc at a temperature of 443°C.
The standard pretreatment process for the galvanizing plant consists of an alkaline degreaser, followed by chemical pickling in a 12% hydrochloric acid solution. Afterwards, an NH4Cl + ZnCl flux is applied, and the pieces are galvanized for durations of 15, 30, and 300 seconds.
The resulting phases forming the microstructure have been characterized and identified using optical microscopy, scanning electron microscopy, and X-ray diffraction.
3. Results
The following section delineates the empirical findings, shedding light on the differences in reactivity between A36 and Q345B steels during galvanization.
3.1. Chemical compositions
The chemical composition of both steels are found in
Table 1.
The chemical composition of the zinc bath for galvanizing is found in
Table 2.
3.2. Heating curves
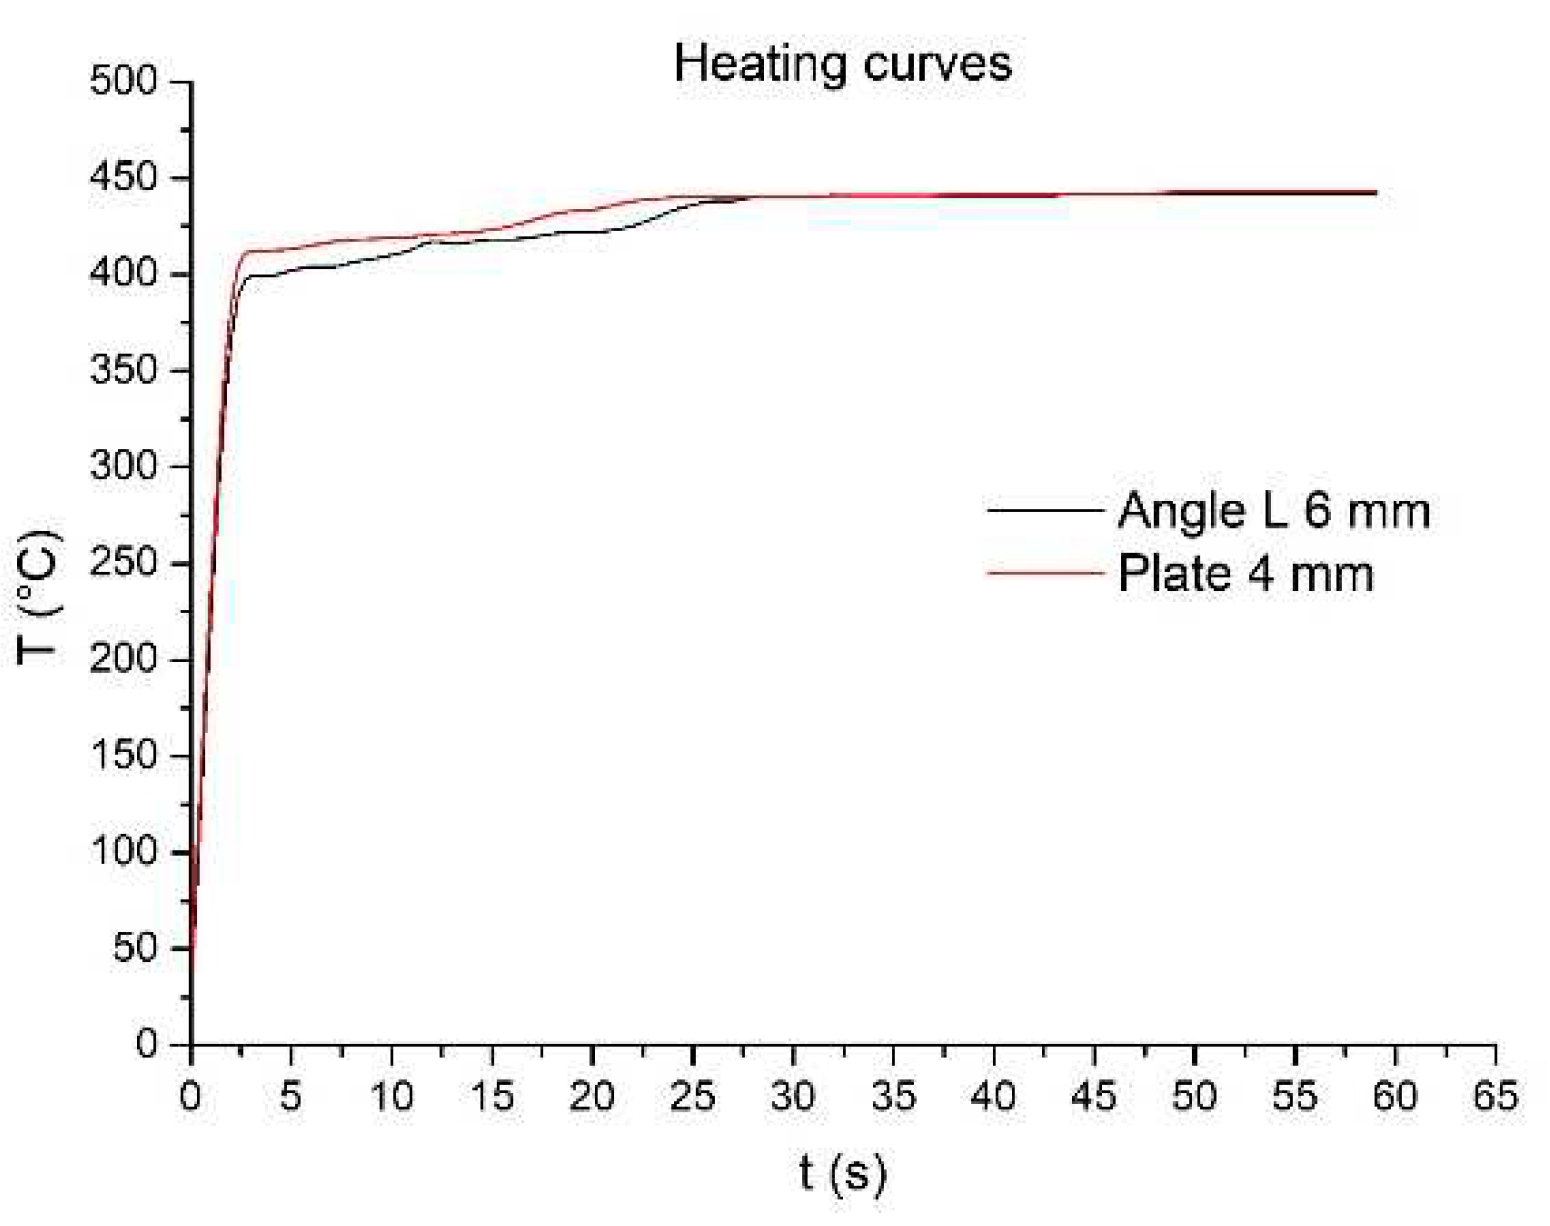
The heating curves are depicted in the graph of
Figure 4. When dealing with parts whose initial temperature is ambient, it can be determined that there is a period of time in which zinc solidification occurs in the environment of the piece, given this effect, the contact with the liquid phase delays the time necessary for the piece to reach the melting temperature of zinc, approximately 420°C, which takes 17 seconds for the 4 mm plate and 23 seconds for the 6mm profile.
The heating curves are depicted in the graph of
Figure 4. When analyzing parts starting at ambient temperature, as is the case of a steel that will be galvanized, it becomes evident that there's a period where zinc begins to solidify on the surface of the piece. Due to this effect, the contact with the liquid phase delays the time necessary for the piece to reach the melting temperature of zinc, approximately 420°C, which takes 17 seconds for the 4 mm plate and 23 seconds for the 6mm profile.
3.3. Microstructures
3.3.1. ASTM A36 Low Silicon Steel Plate
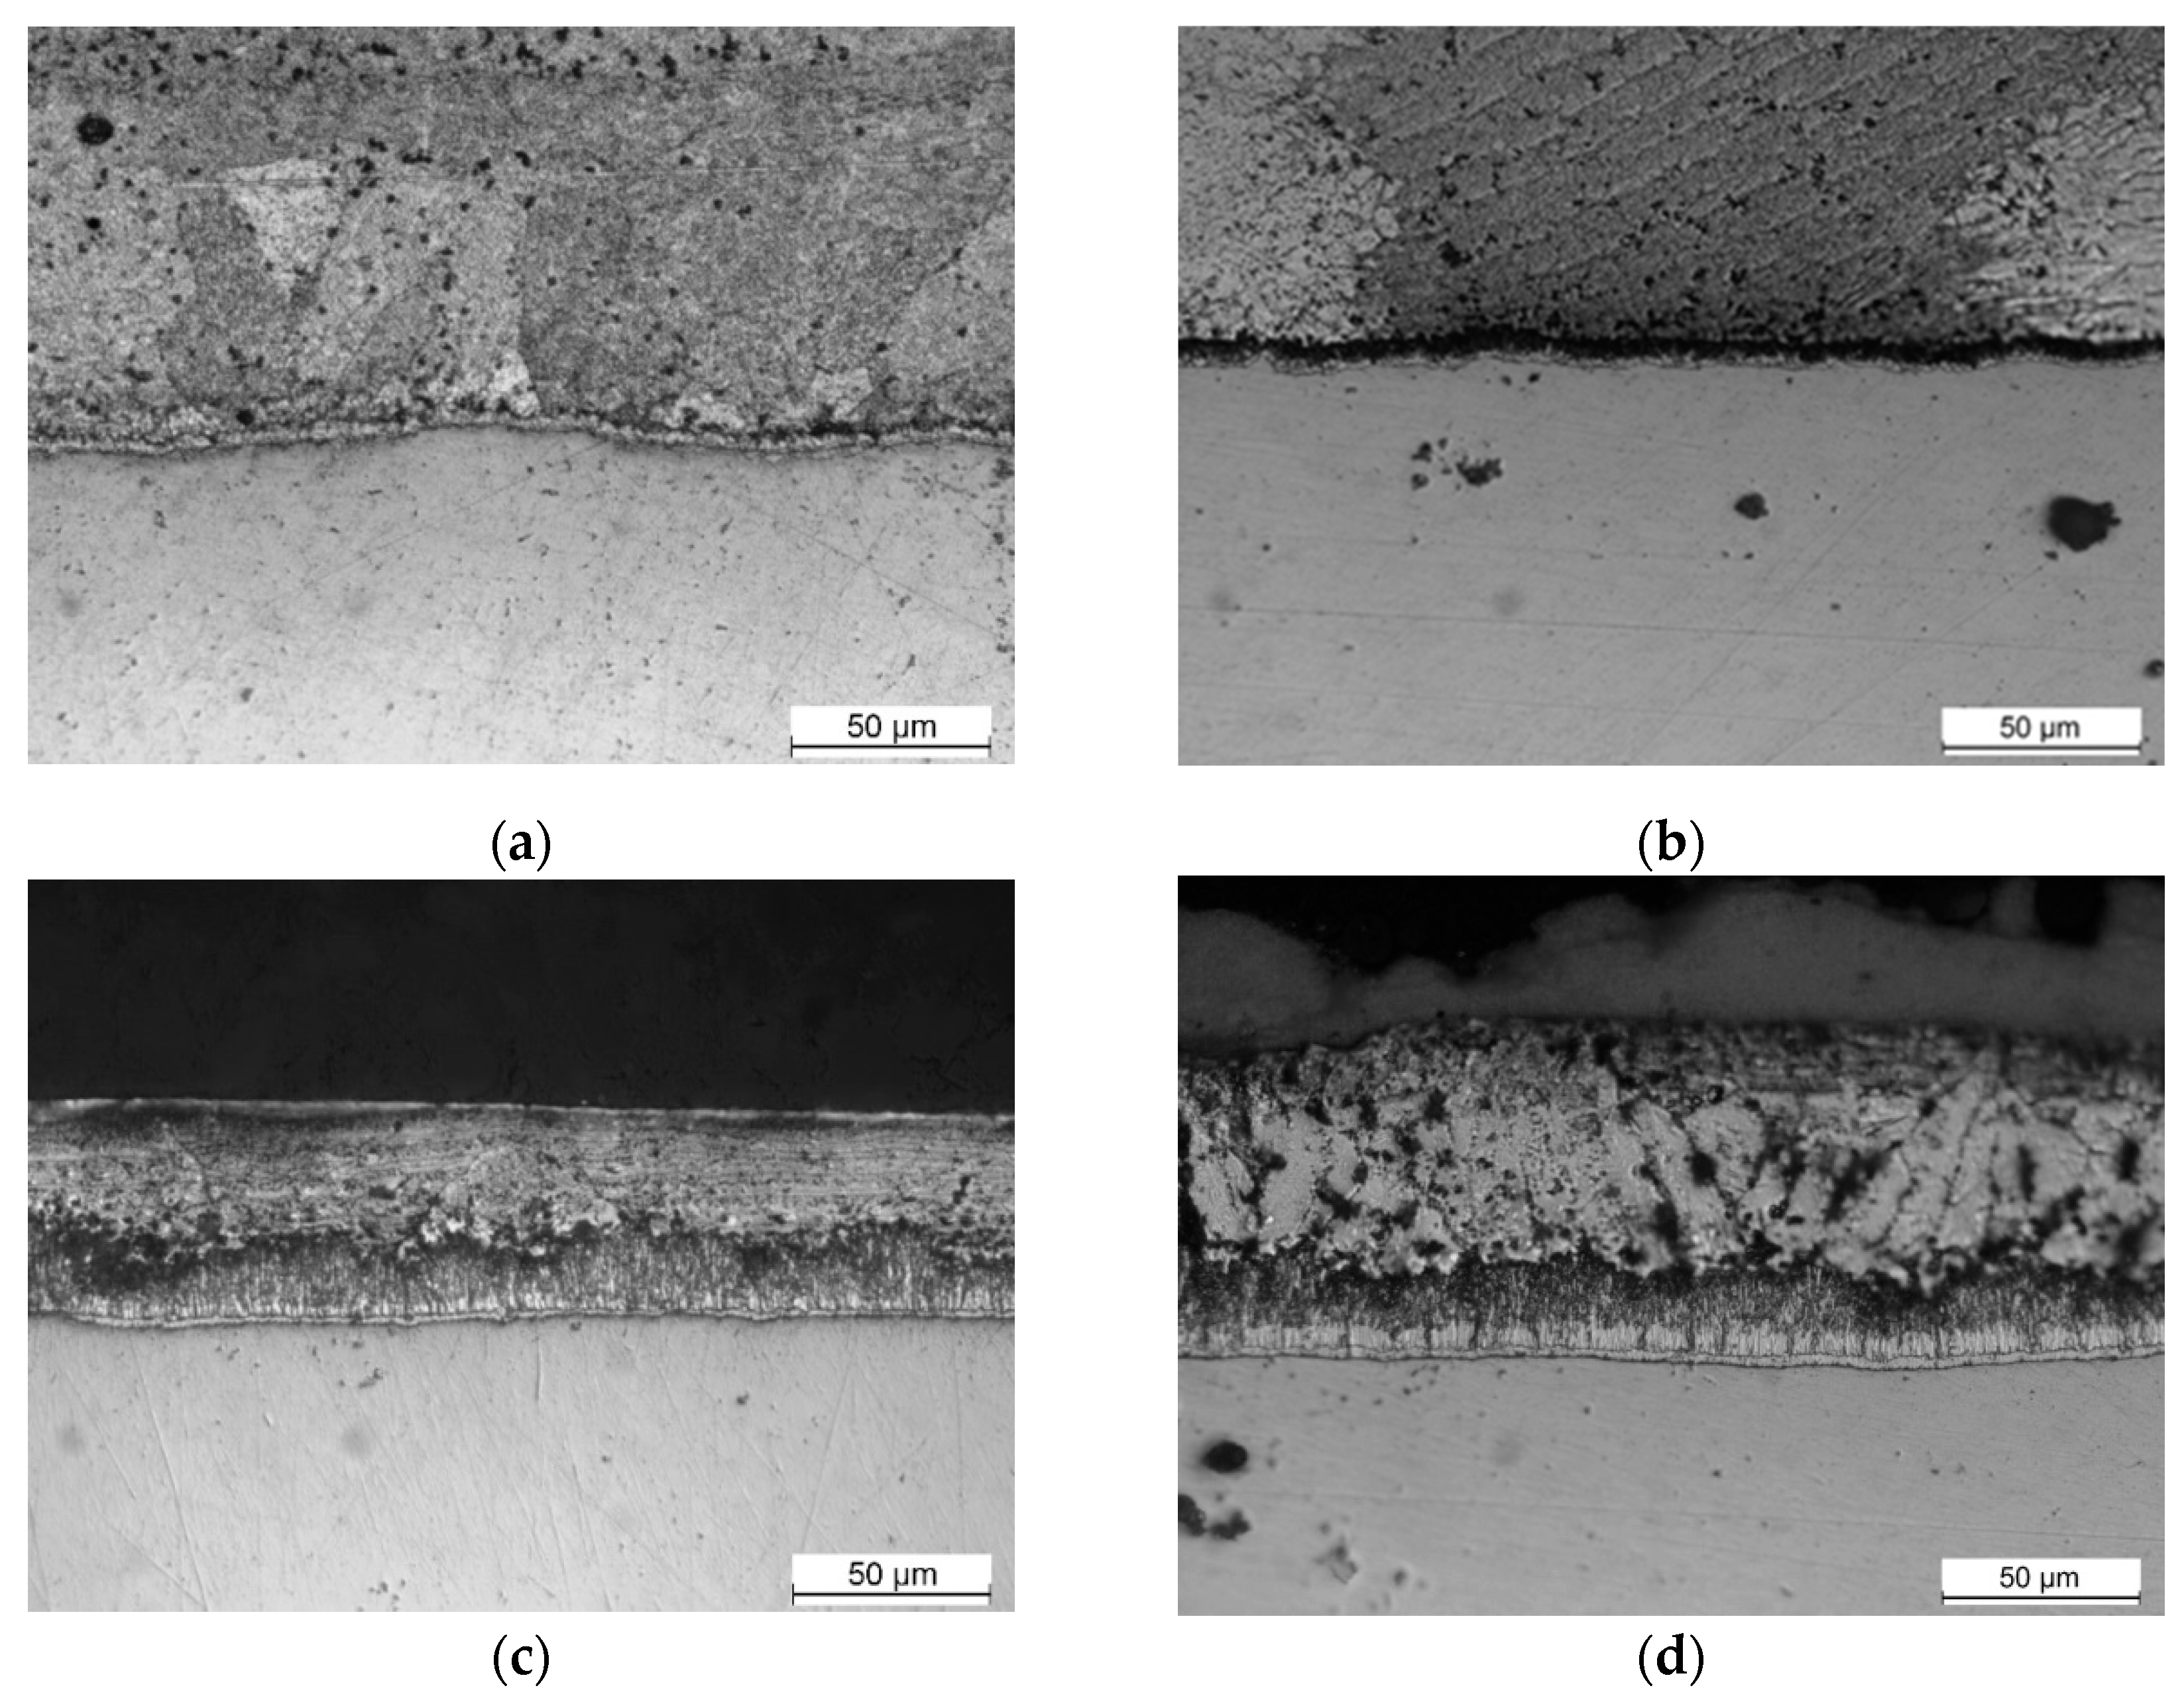
Figure 5 shows the microstructural evolution of the coating phases for low-silicon steel, where it can be seen that Fe-Zn phases are already observed at low times of 5 seconds, which means that the reactions begin with zinc in solid state, as observed by Sepper in 2016 [
14].
The presence of Γ phase was not detected and the typical microstructure of a Fe-Zn coating described for short times is obtained.
3.3.2. Q345B high Silicon Steel angle
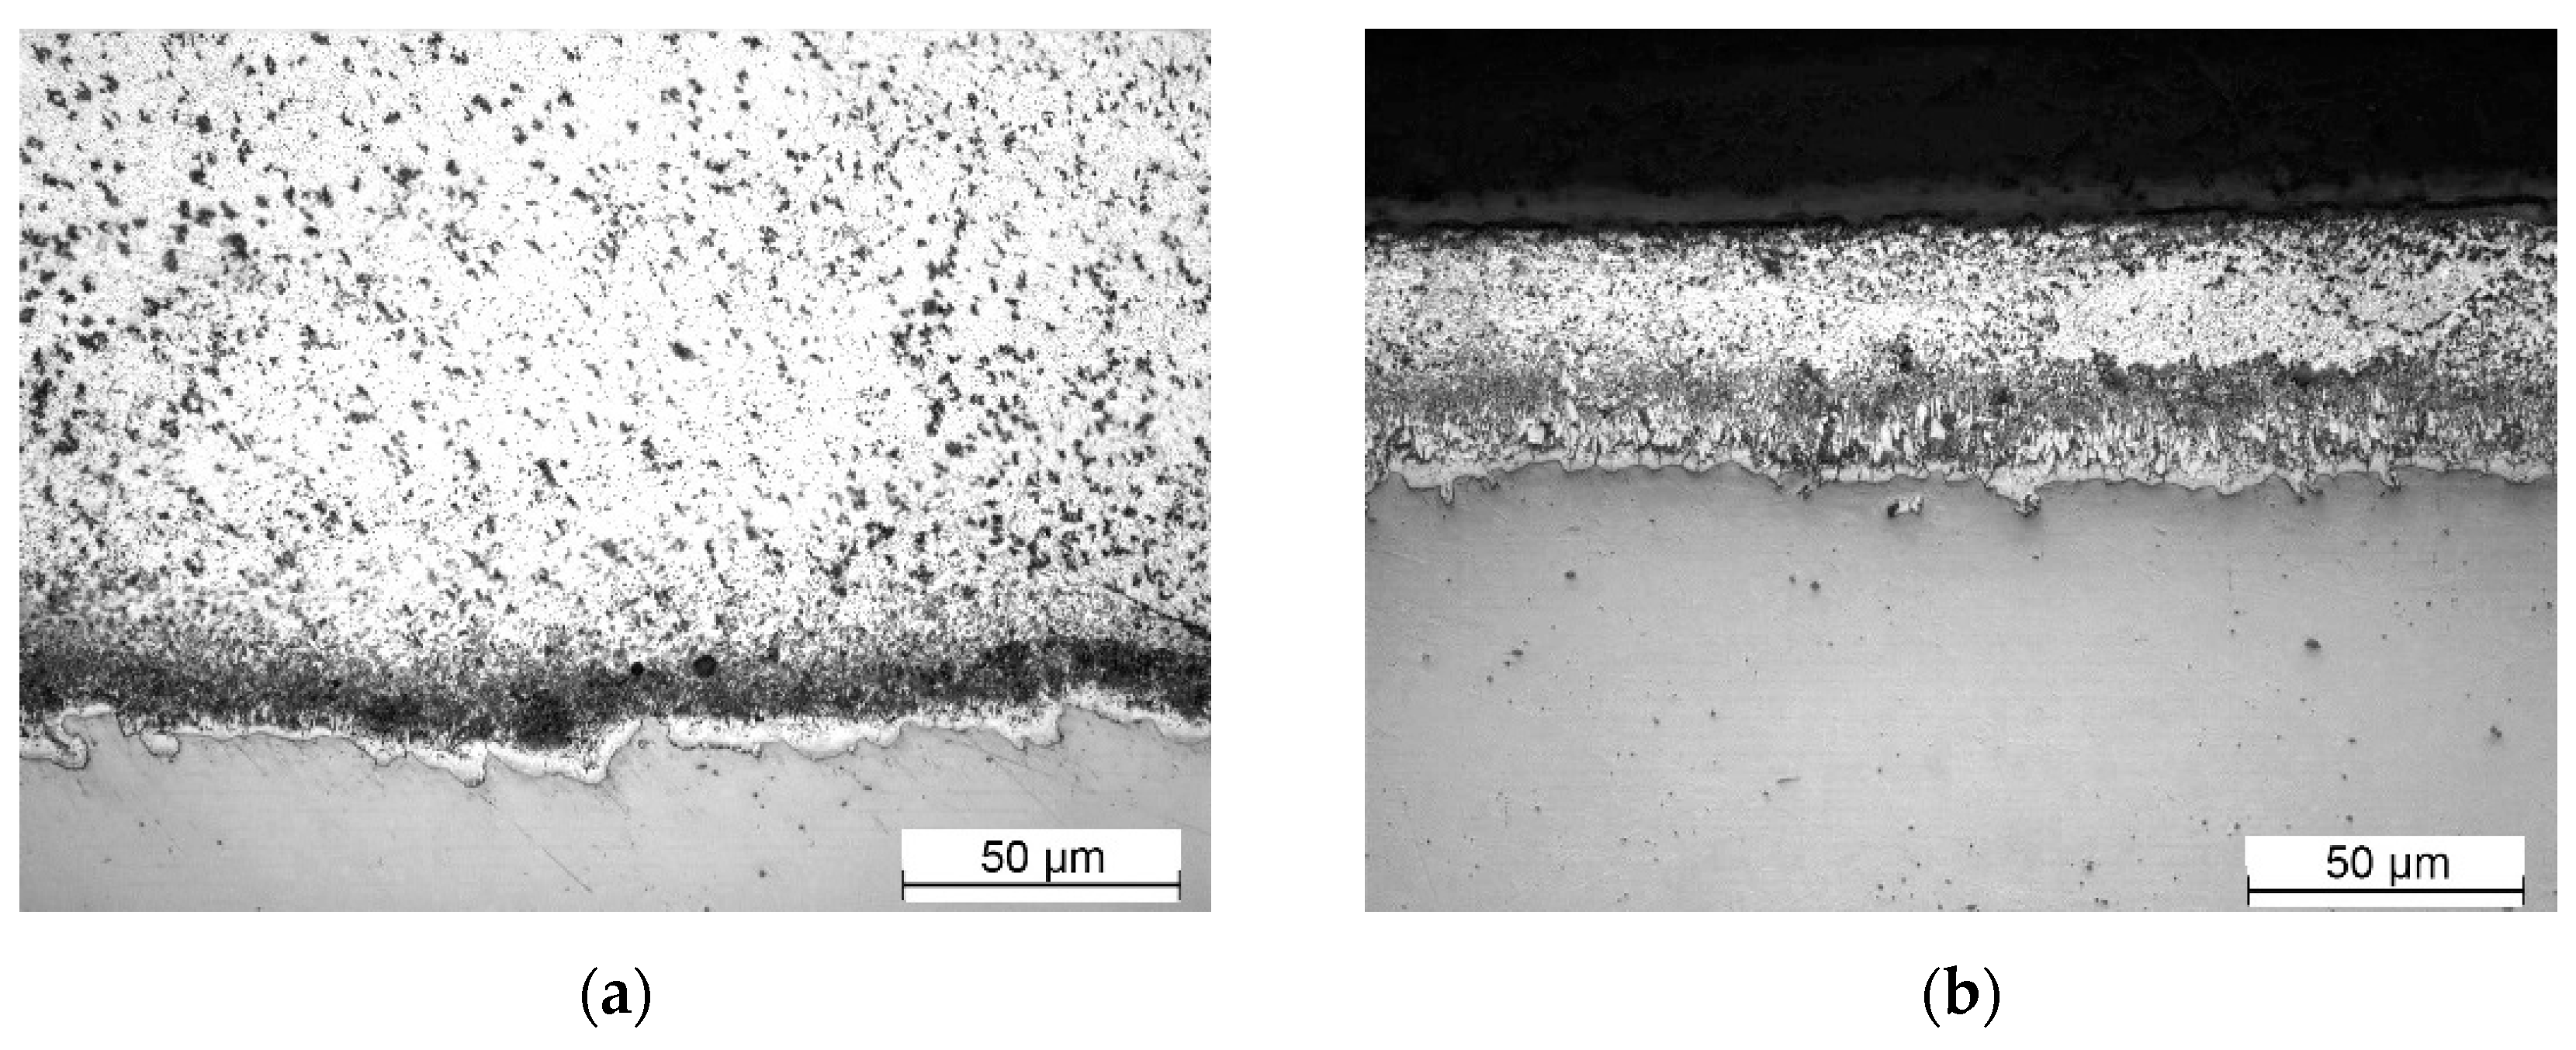
Figure 6 shows the microstructural evolution of the coating for high silicon steel where the same condition is observed at low times, 15 seconds, as in low silicon steel, Fe-Zn phases are observed in the presence of only solid phases.
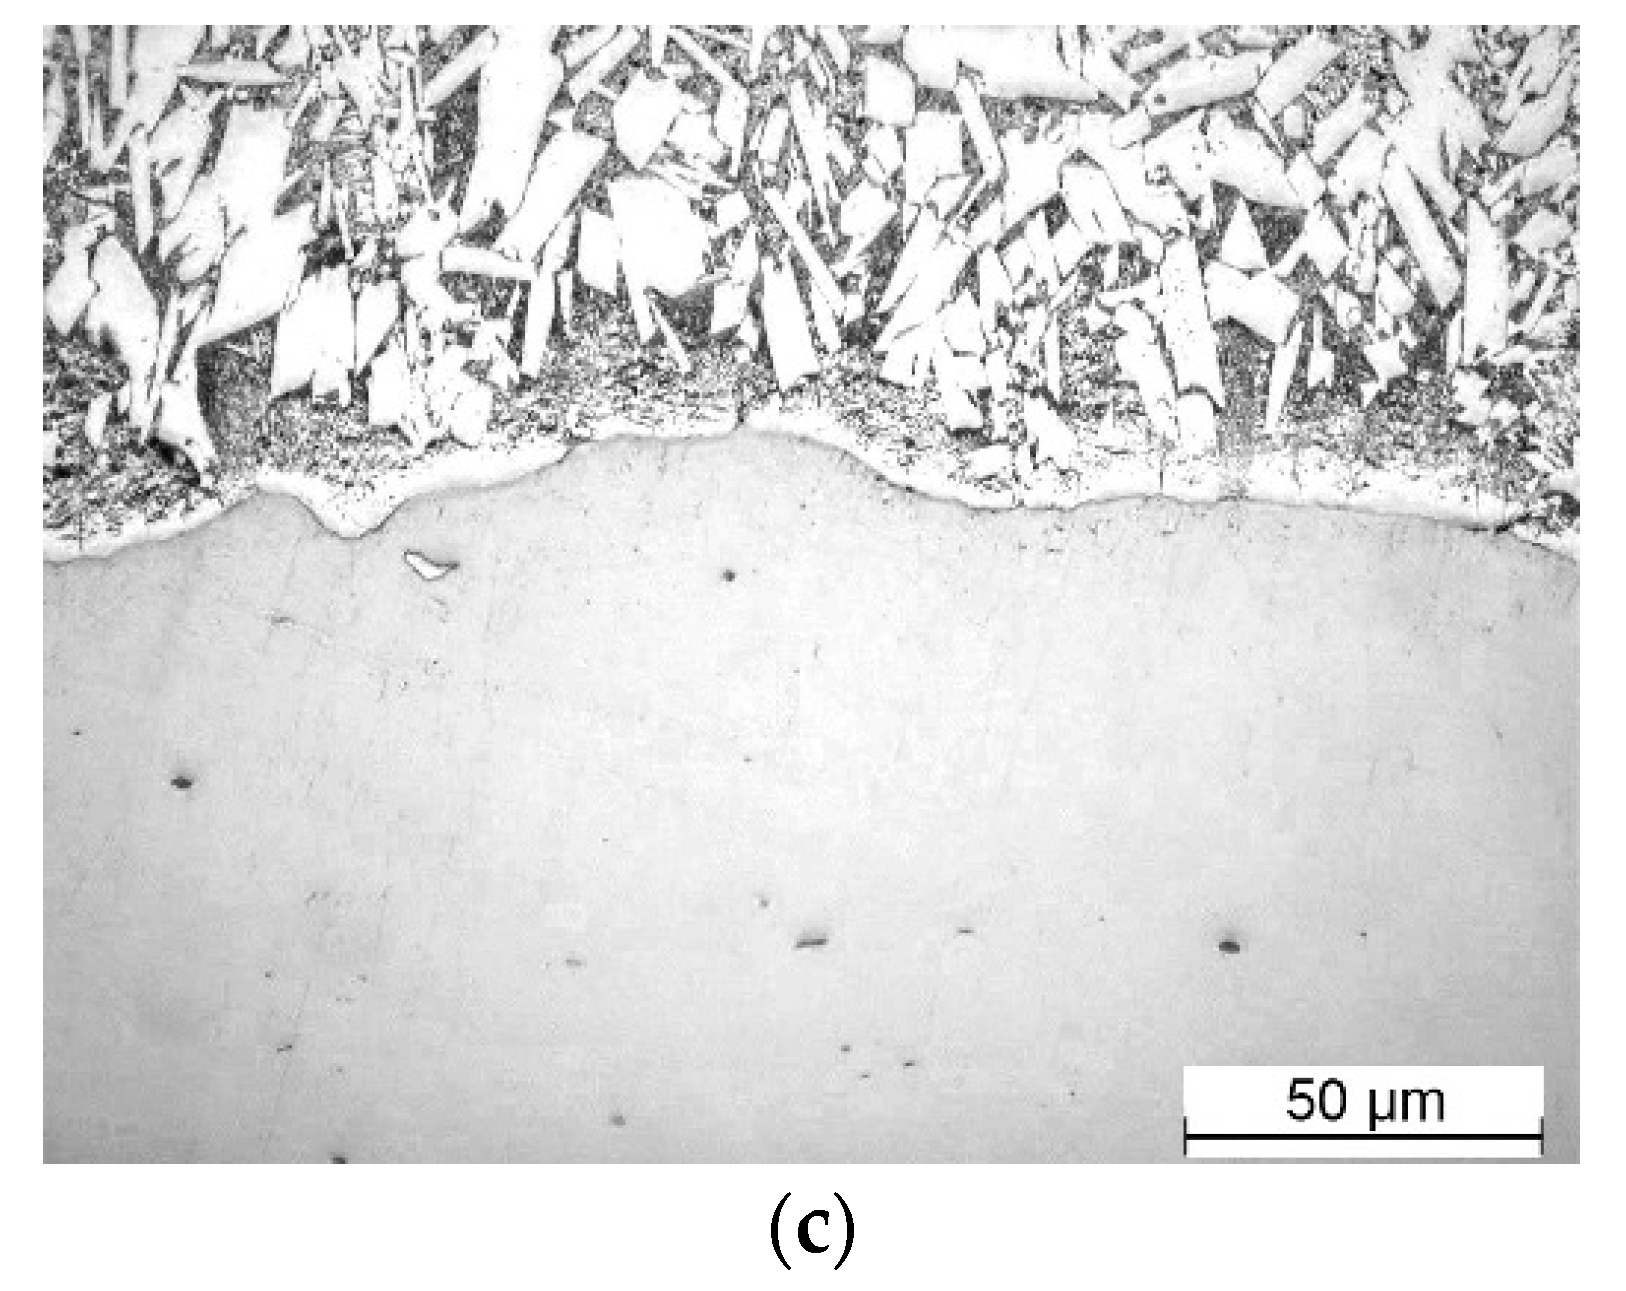
At times of 15 and 30 seconds a continuous and compact layer of ζ phase can be observed. For longer times a mixture of ζ and η phase is observed over a small layer of δ phase.
At longer times, the liquid phase penetrate the ζ phase layer through ζ-ζ boundaries initiating an increase in the rate of solute transport by liquid phase and a subsequent increase in the rate of reaction.
No Γ phase is detected in high silicon steel, as expected in the ternary Fe-Zn-Si system[
13].
3.3.3. Phase identification
SEM/EDS analysis
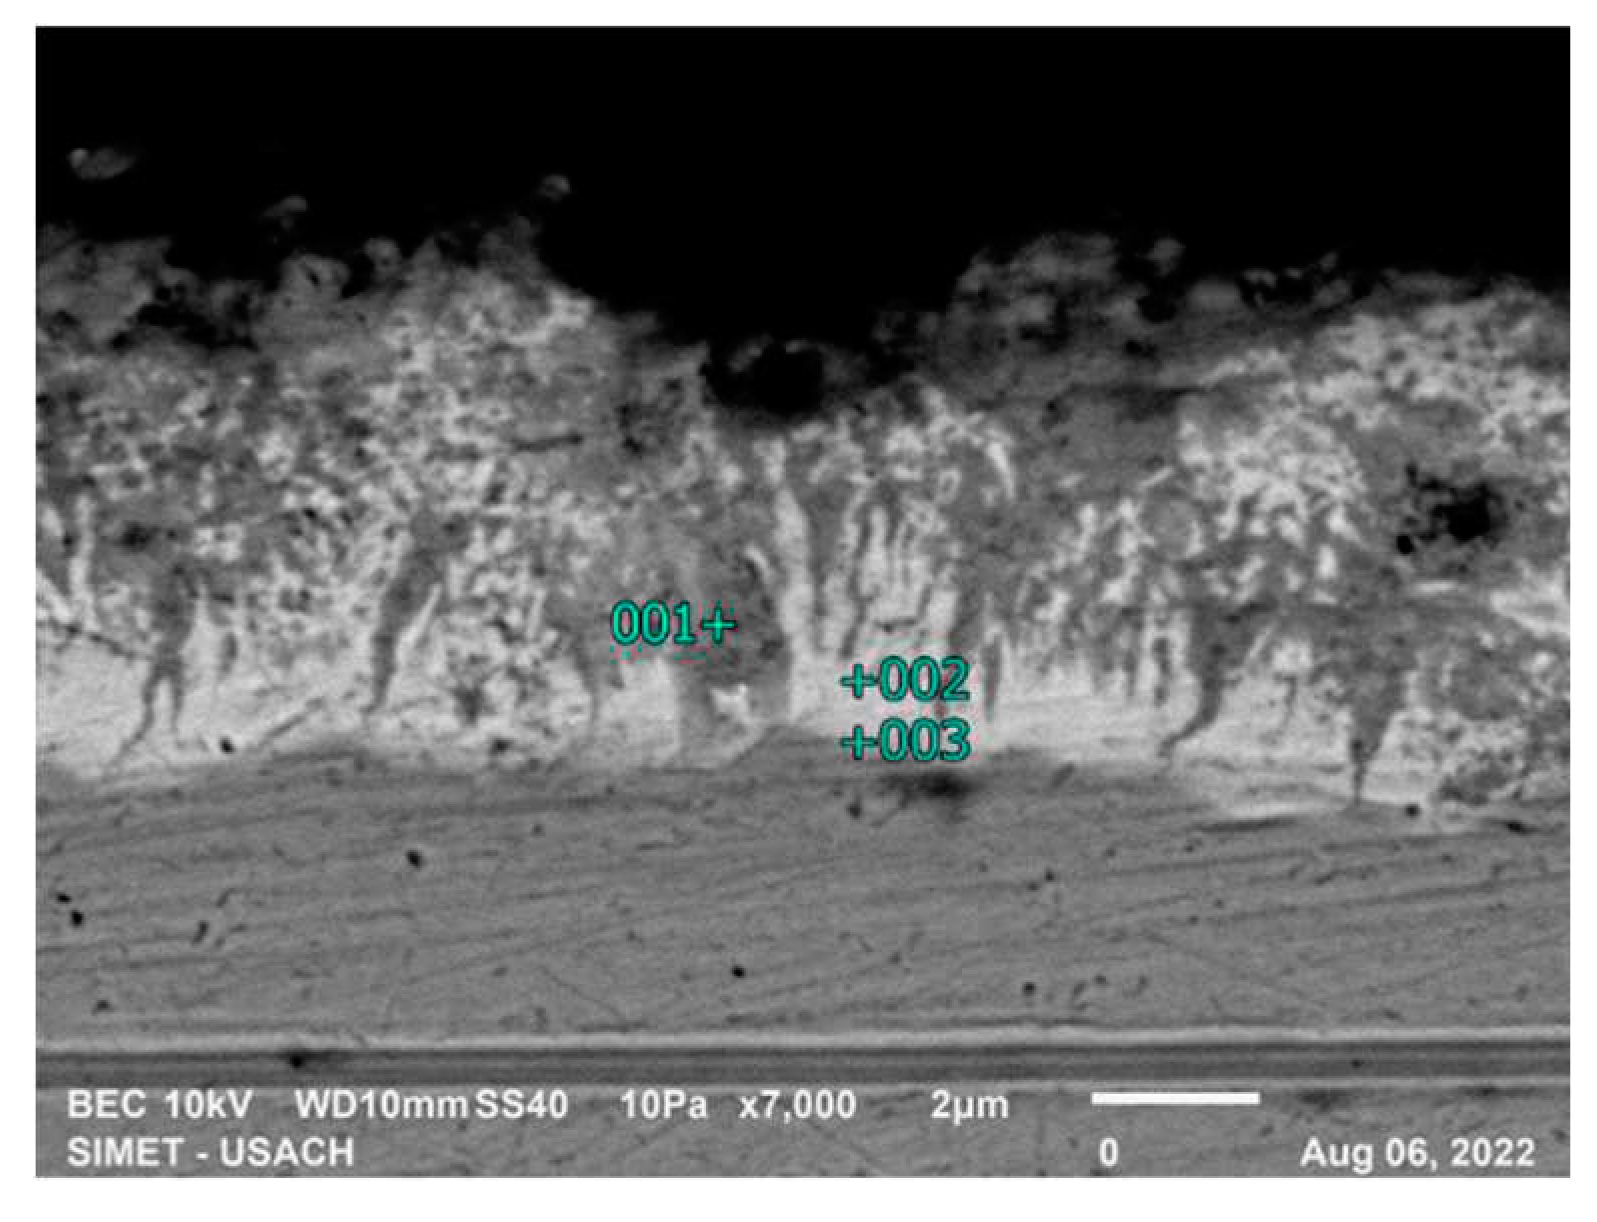
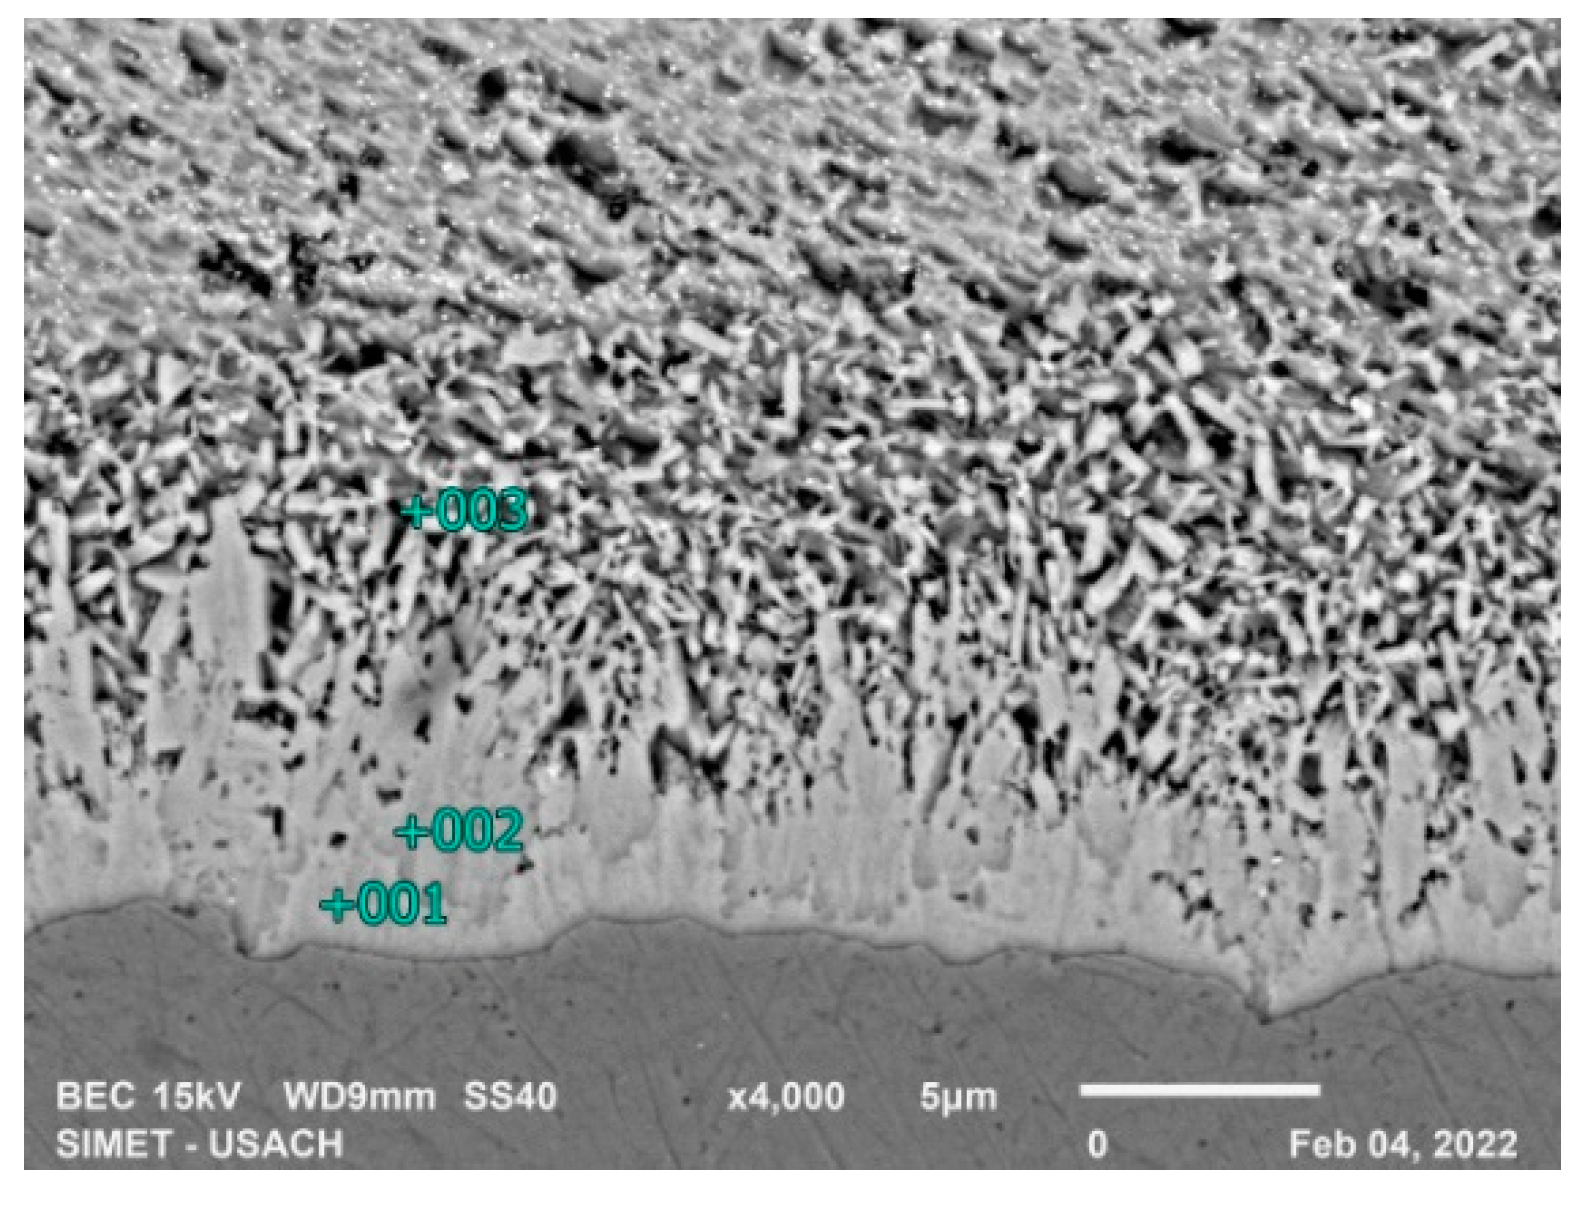
Figure 7 and
Table 3 show the EDS analysis of the 5-second sample of low silicon steel, the formation of intermetallic compounds is observed, since the diffusion coefficient of iron in zinc is greater than the diffusion coefficient of zinc in iron [
14] also the saturation of zinc in iron occurs first and the morphology indicates the presence of the ζ phase, however, the composition of the newly formed ζ phase has an iron content greater than the equilibrium composition.
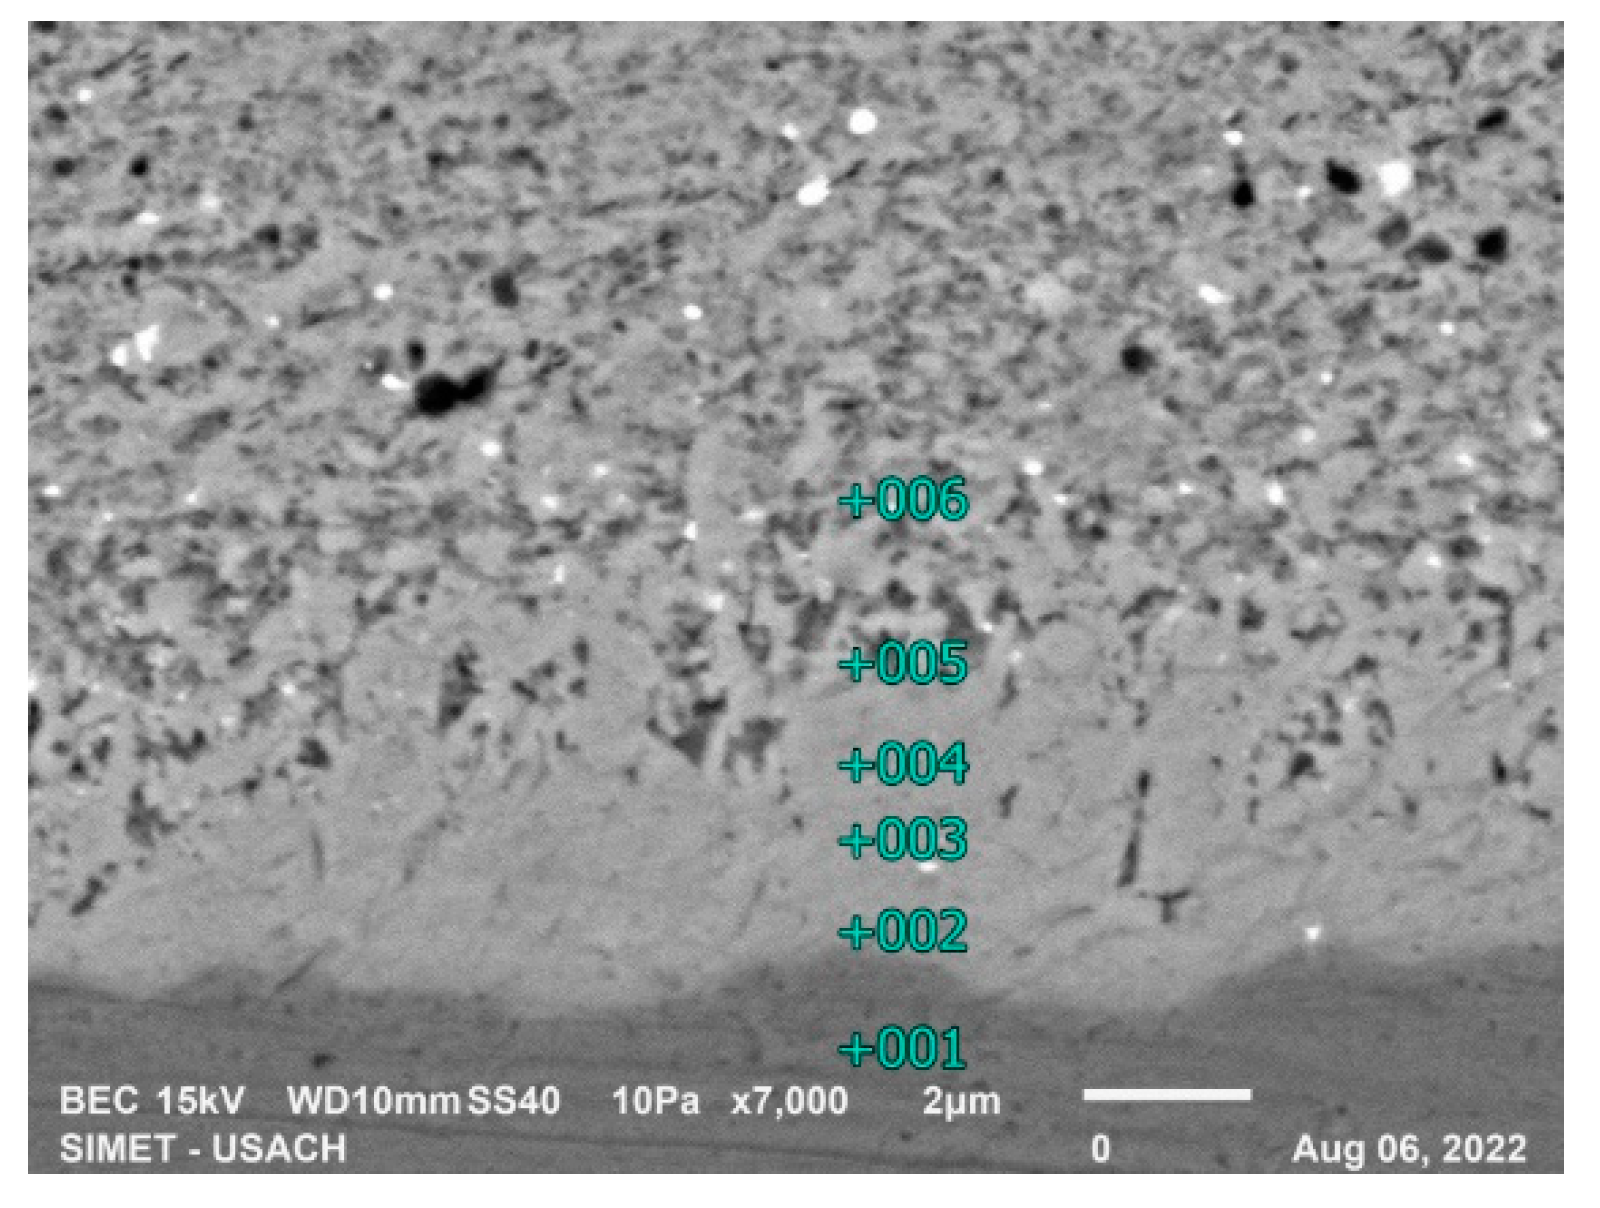
For the 15-second sample, where still the zinc is in solid state, two phases of the coating can be seen in
Figure 8. EDS analysis of table 4 shows the presence of the δ and ζ phases, as well as the α phase has dissolved some amount of zinc.
Figure 9 and
Table 5 show the EDS analysis of the 15-second sample for high silicon steel, the formation of intermetallic compounds is observed, the morphology indicates the presence of the ζ and δ phases.
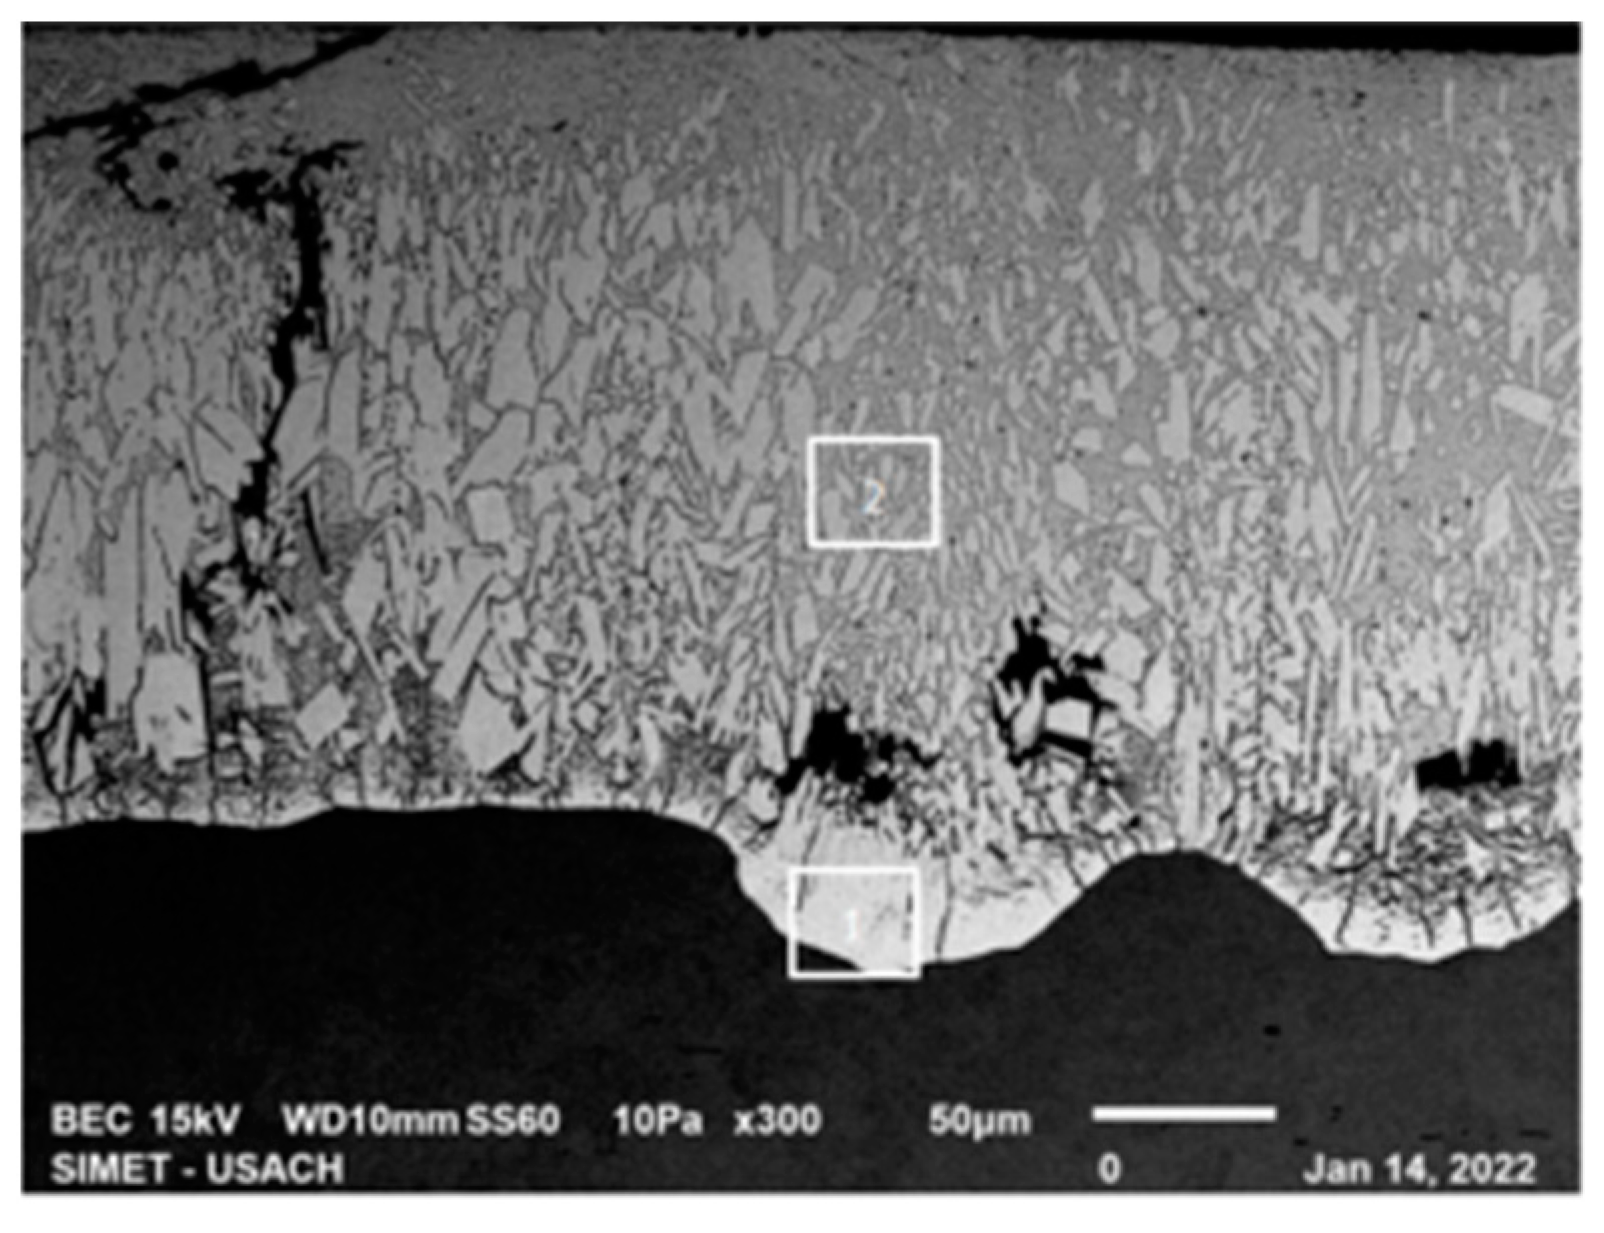
The 300 second galvanization shows the typical microstructure from hot dip galvanized high silicon steel,
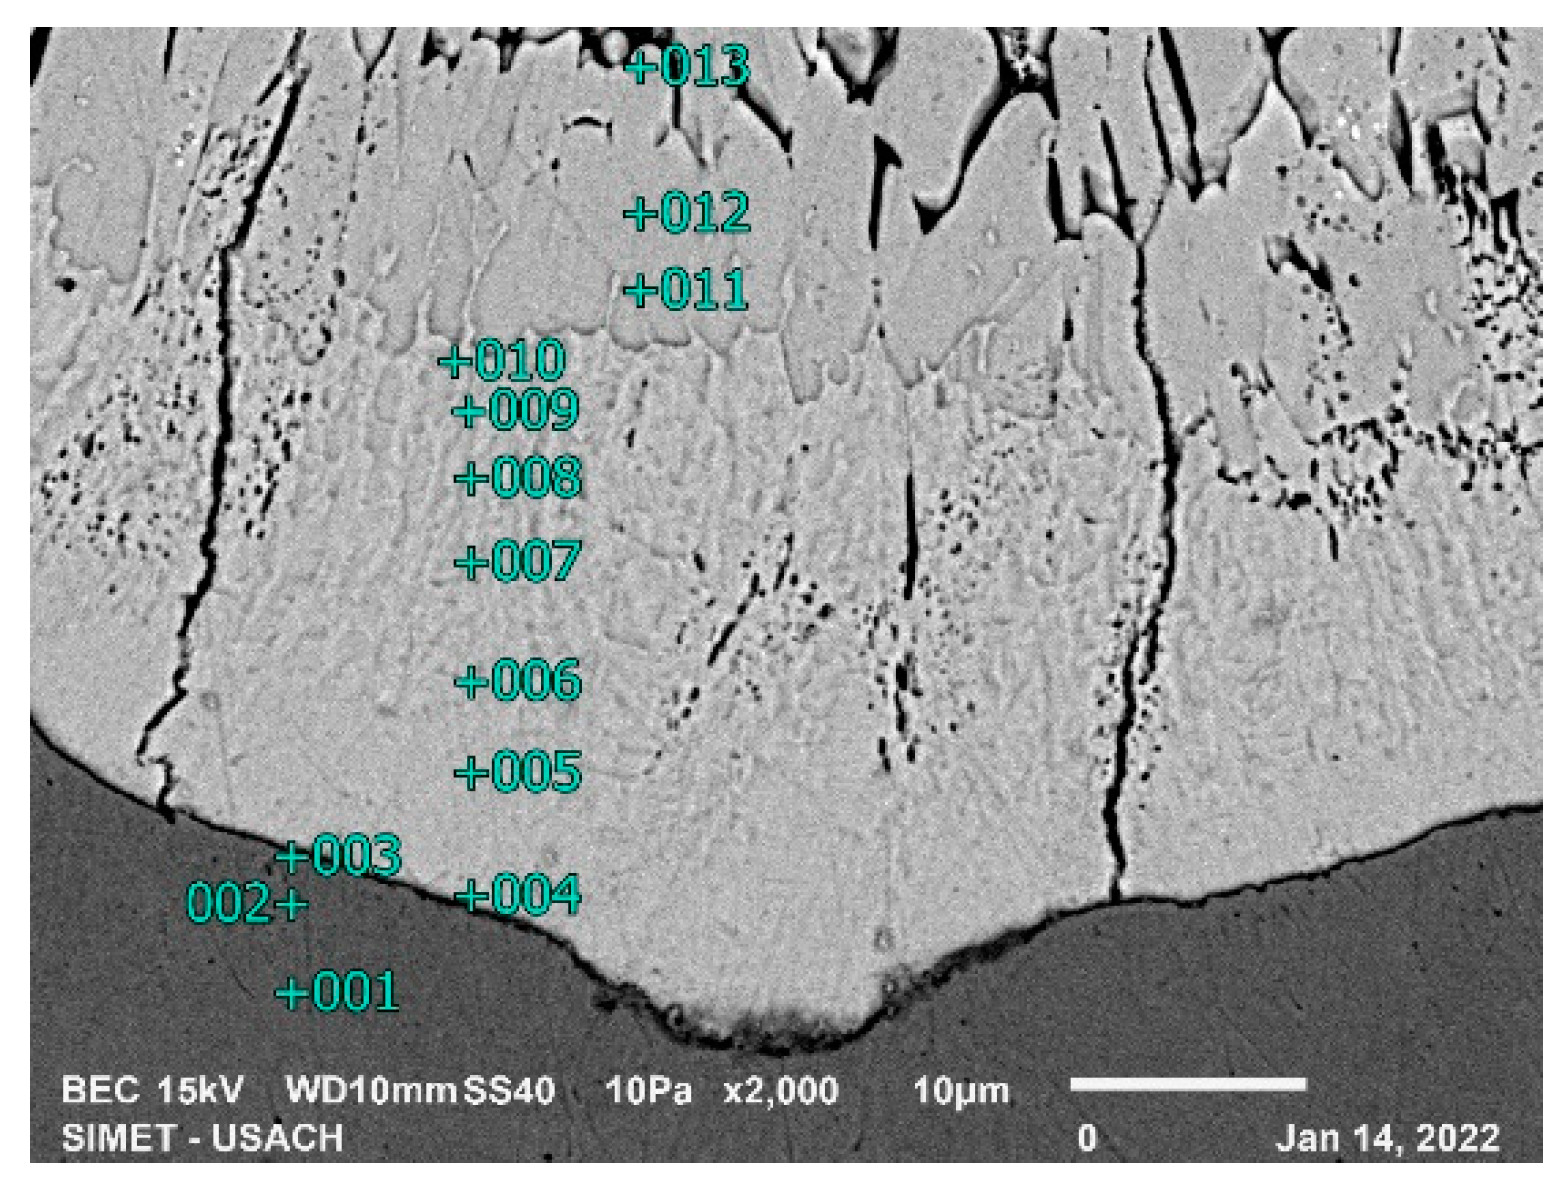
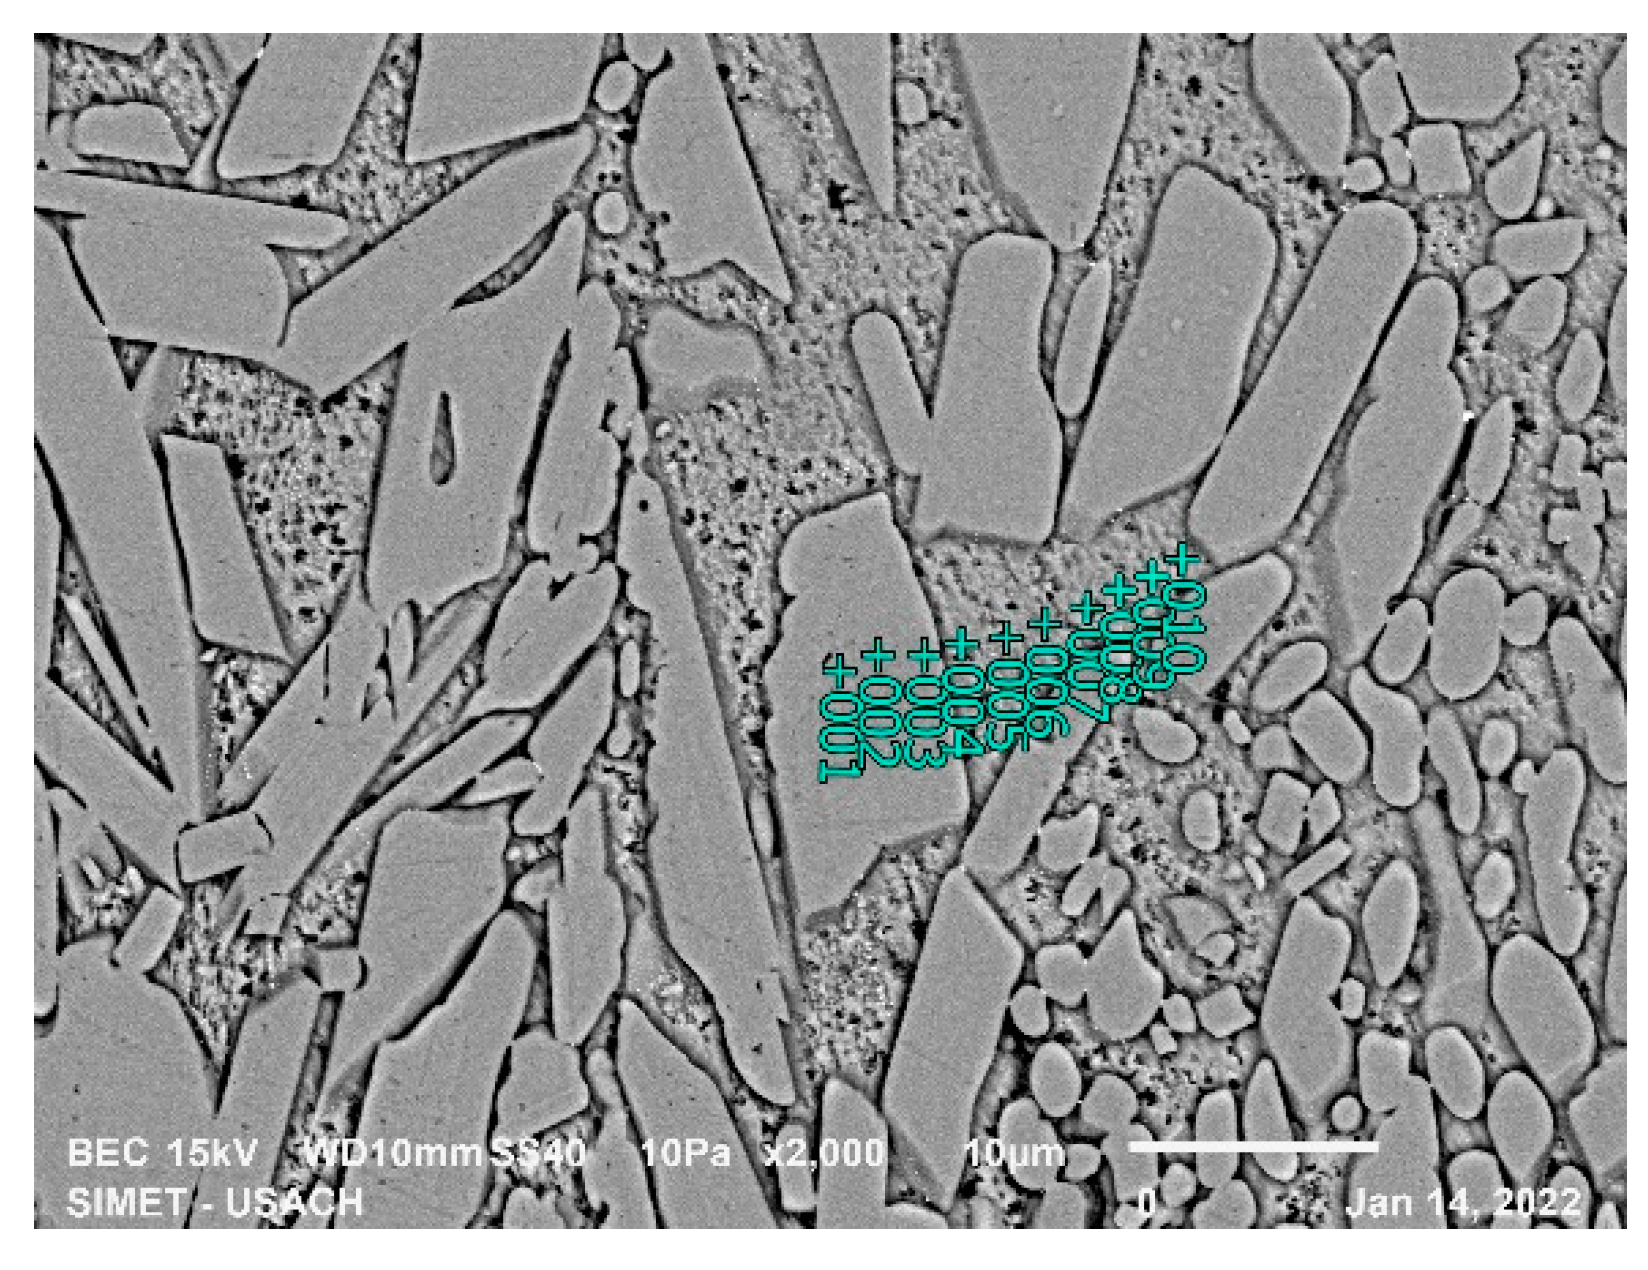
Figure 10, EDS analysis was performed in lines perpendicular to the ferrous substrate in 2 zones:
In the upper side of the coating the phases are ζ and η with almost equilibrium compositions. Table 13 shows in the interface ζ/η the silicon is accumulated at the η phase near the the ζ phase.
DRX analysis
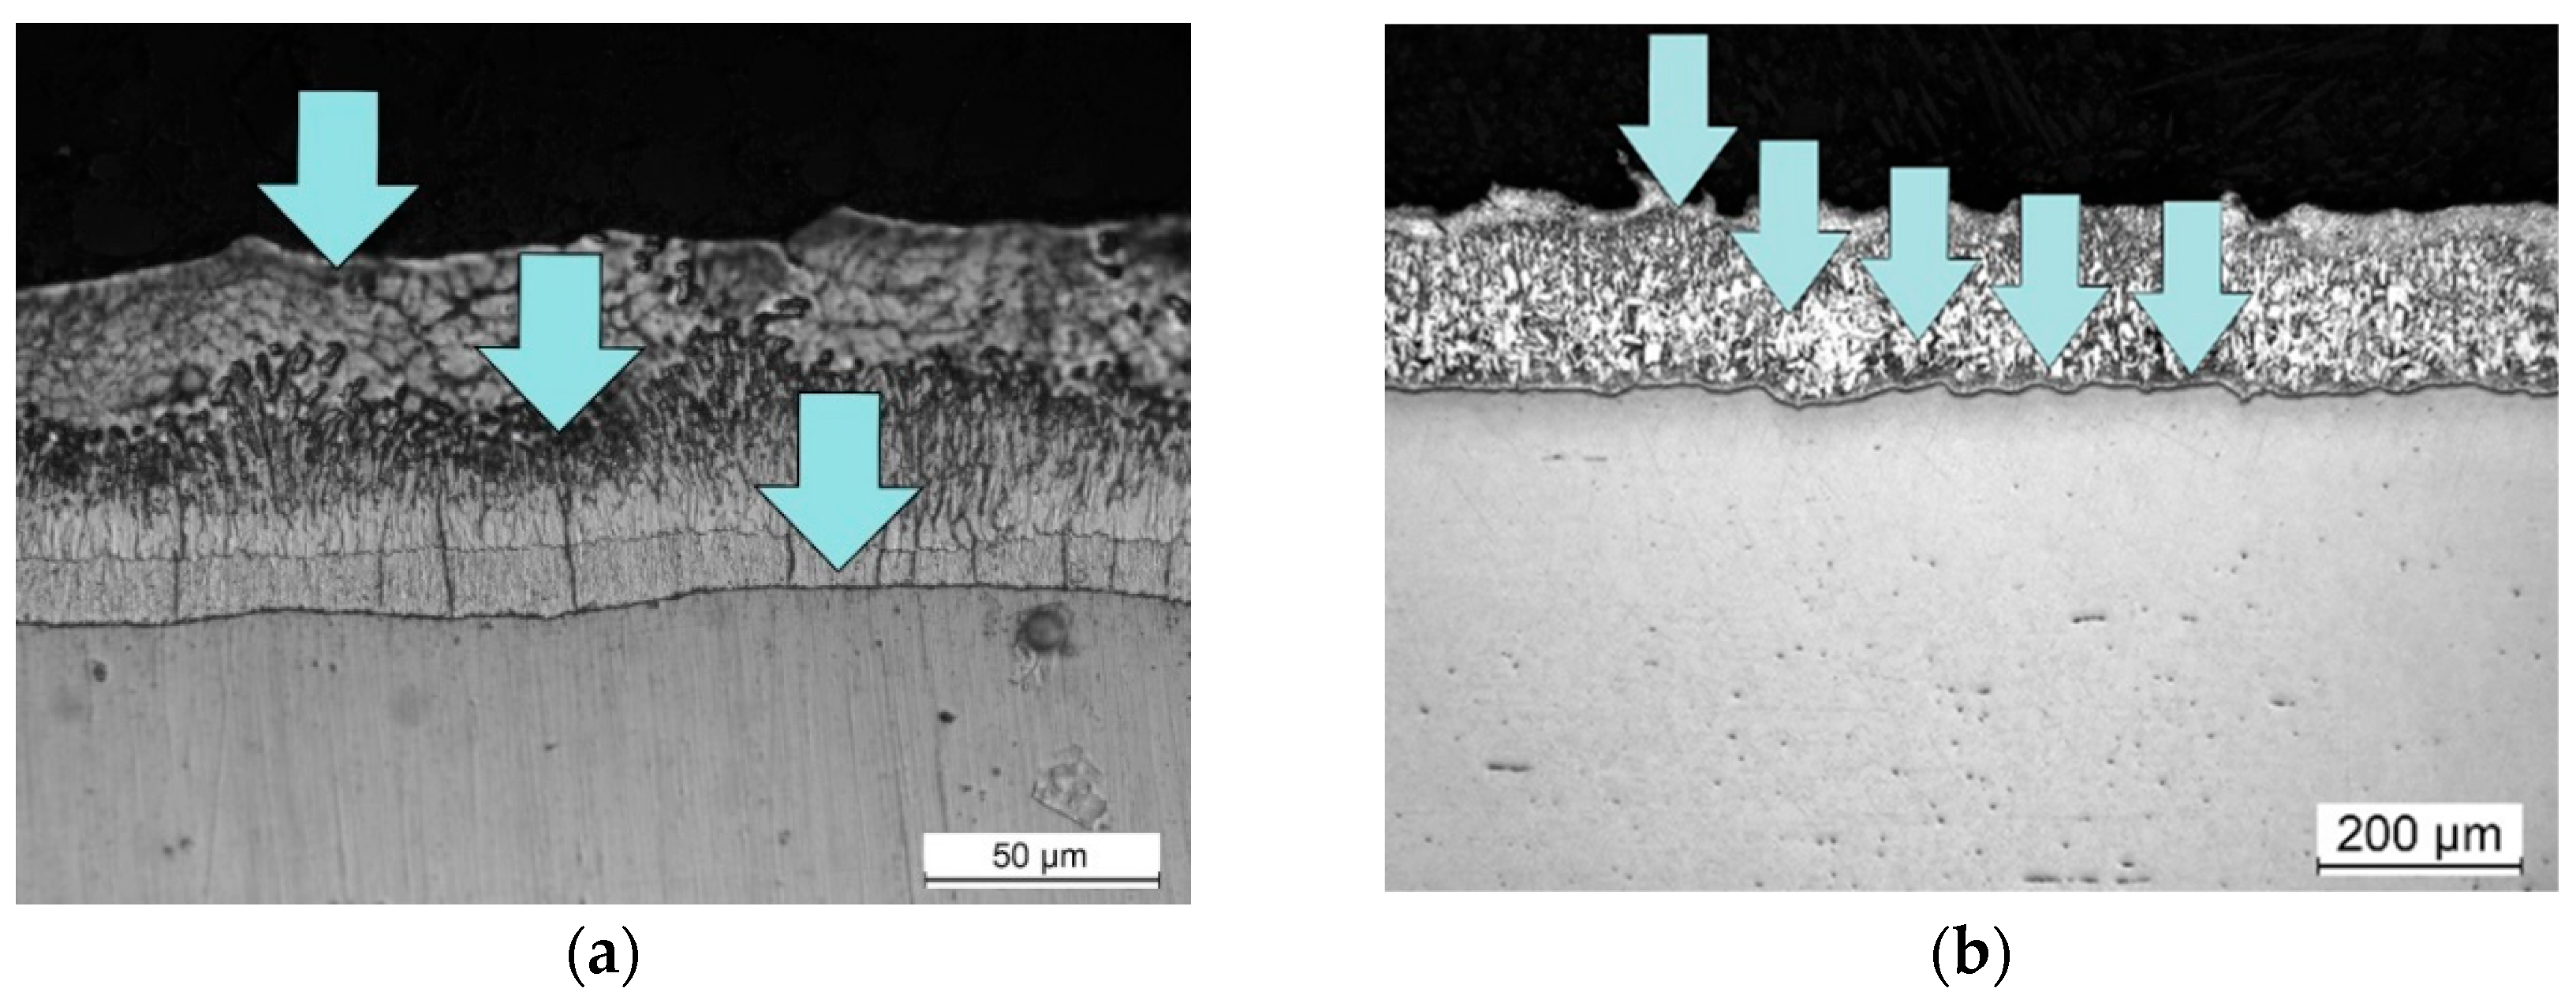
The presence of the phases has been verified in a Rigacu X-ray diffraction equipment with a chromium tube (λ=2.289750 Å) was done in multiple stages:
1. The X-ray beam is incident on the complete coating.
2. The X-ray beam hits the rough coating at 120 microns.
3. The X-ray beam hits the rough coating at 60 microns.
1. The X-ray beam is incident on the complete coating, 219 microns
2. The X-ray beam hits the rough coating at 80 microns.
3. The X-ray beam hits the rough coating at 60 microns.
4. The X-ray beam hits the rough coating at 40 microns.
5. The X-ray beam hits the rough coating at 20 microns.
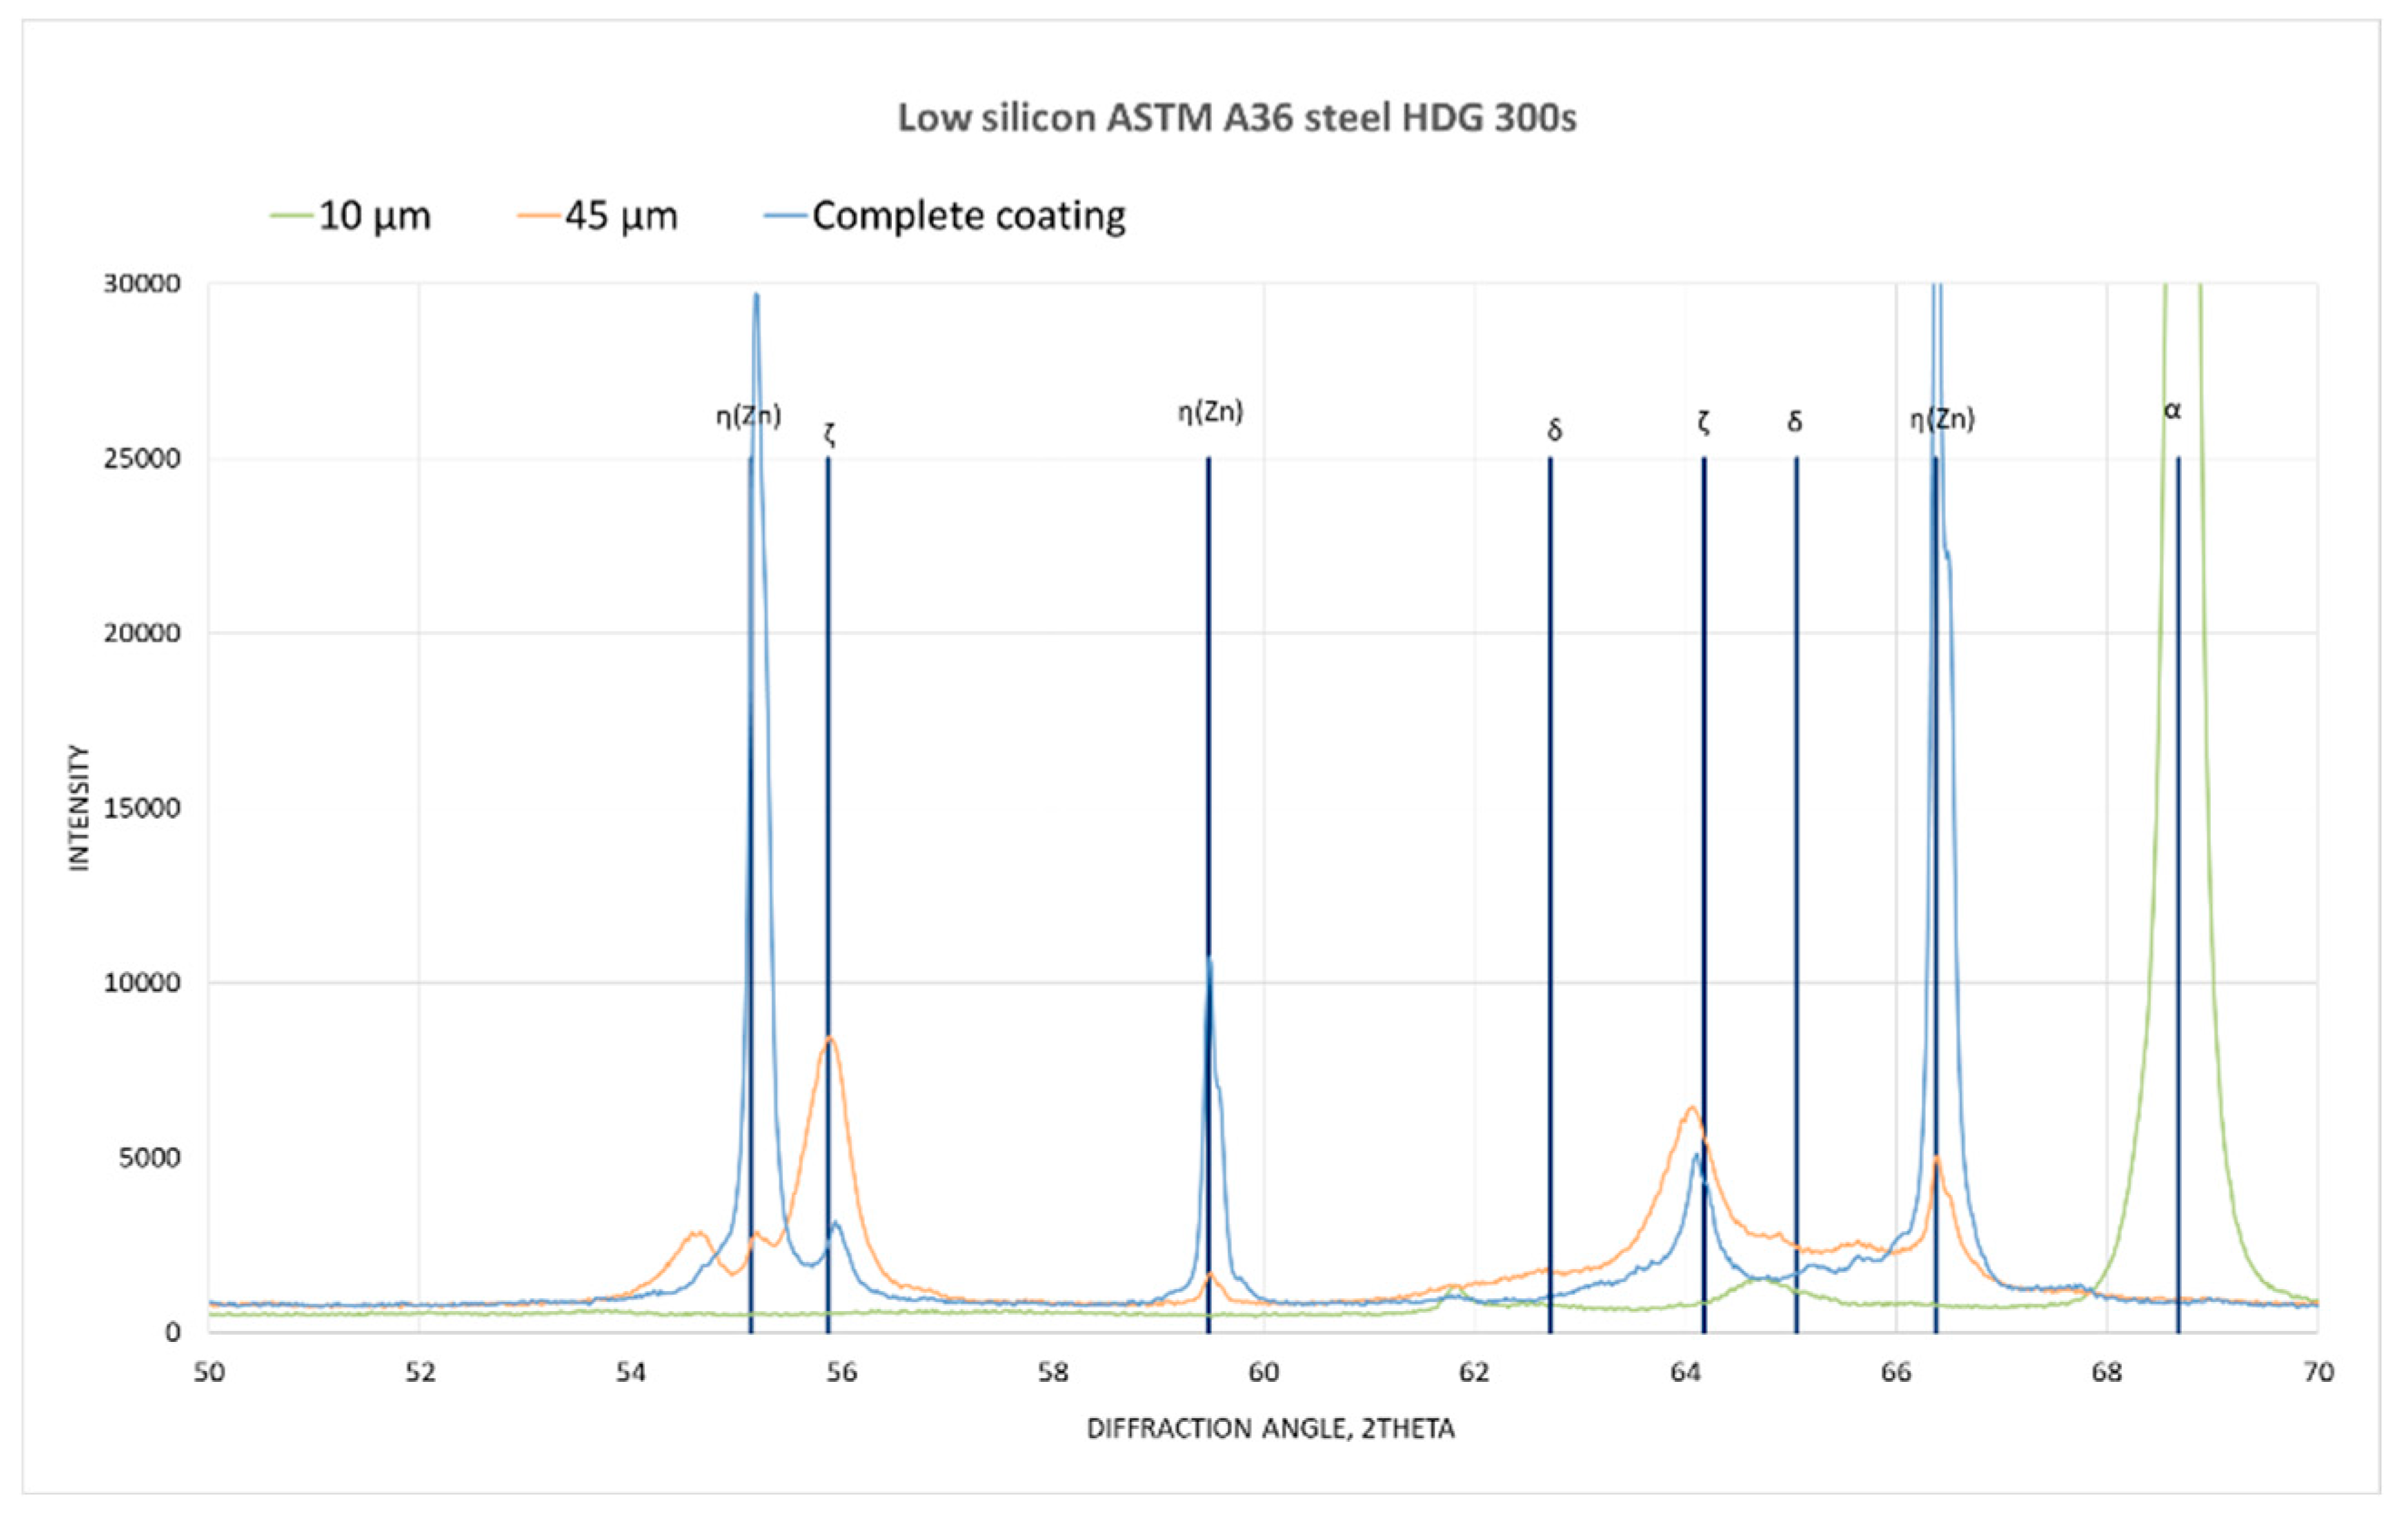
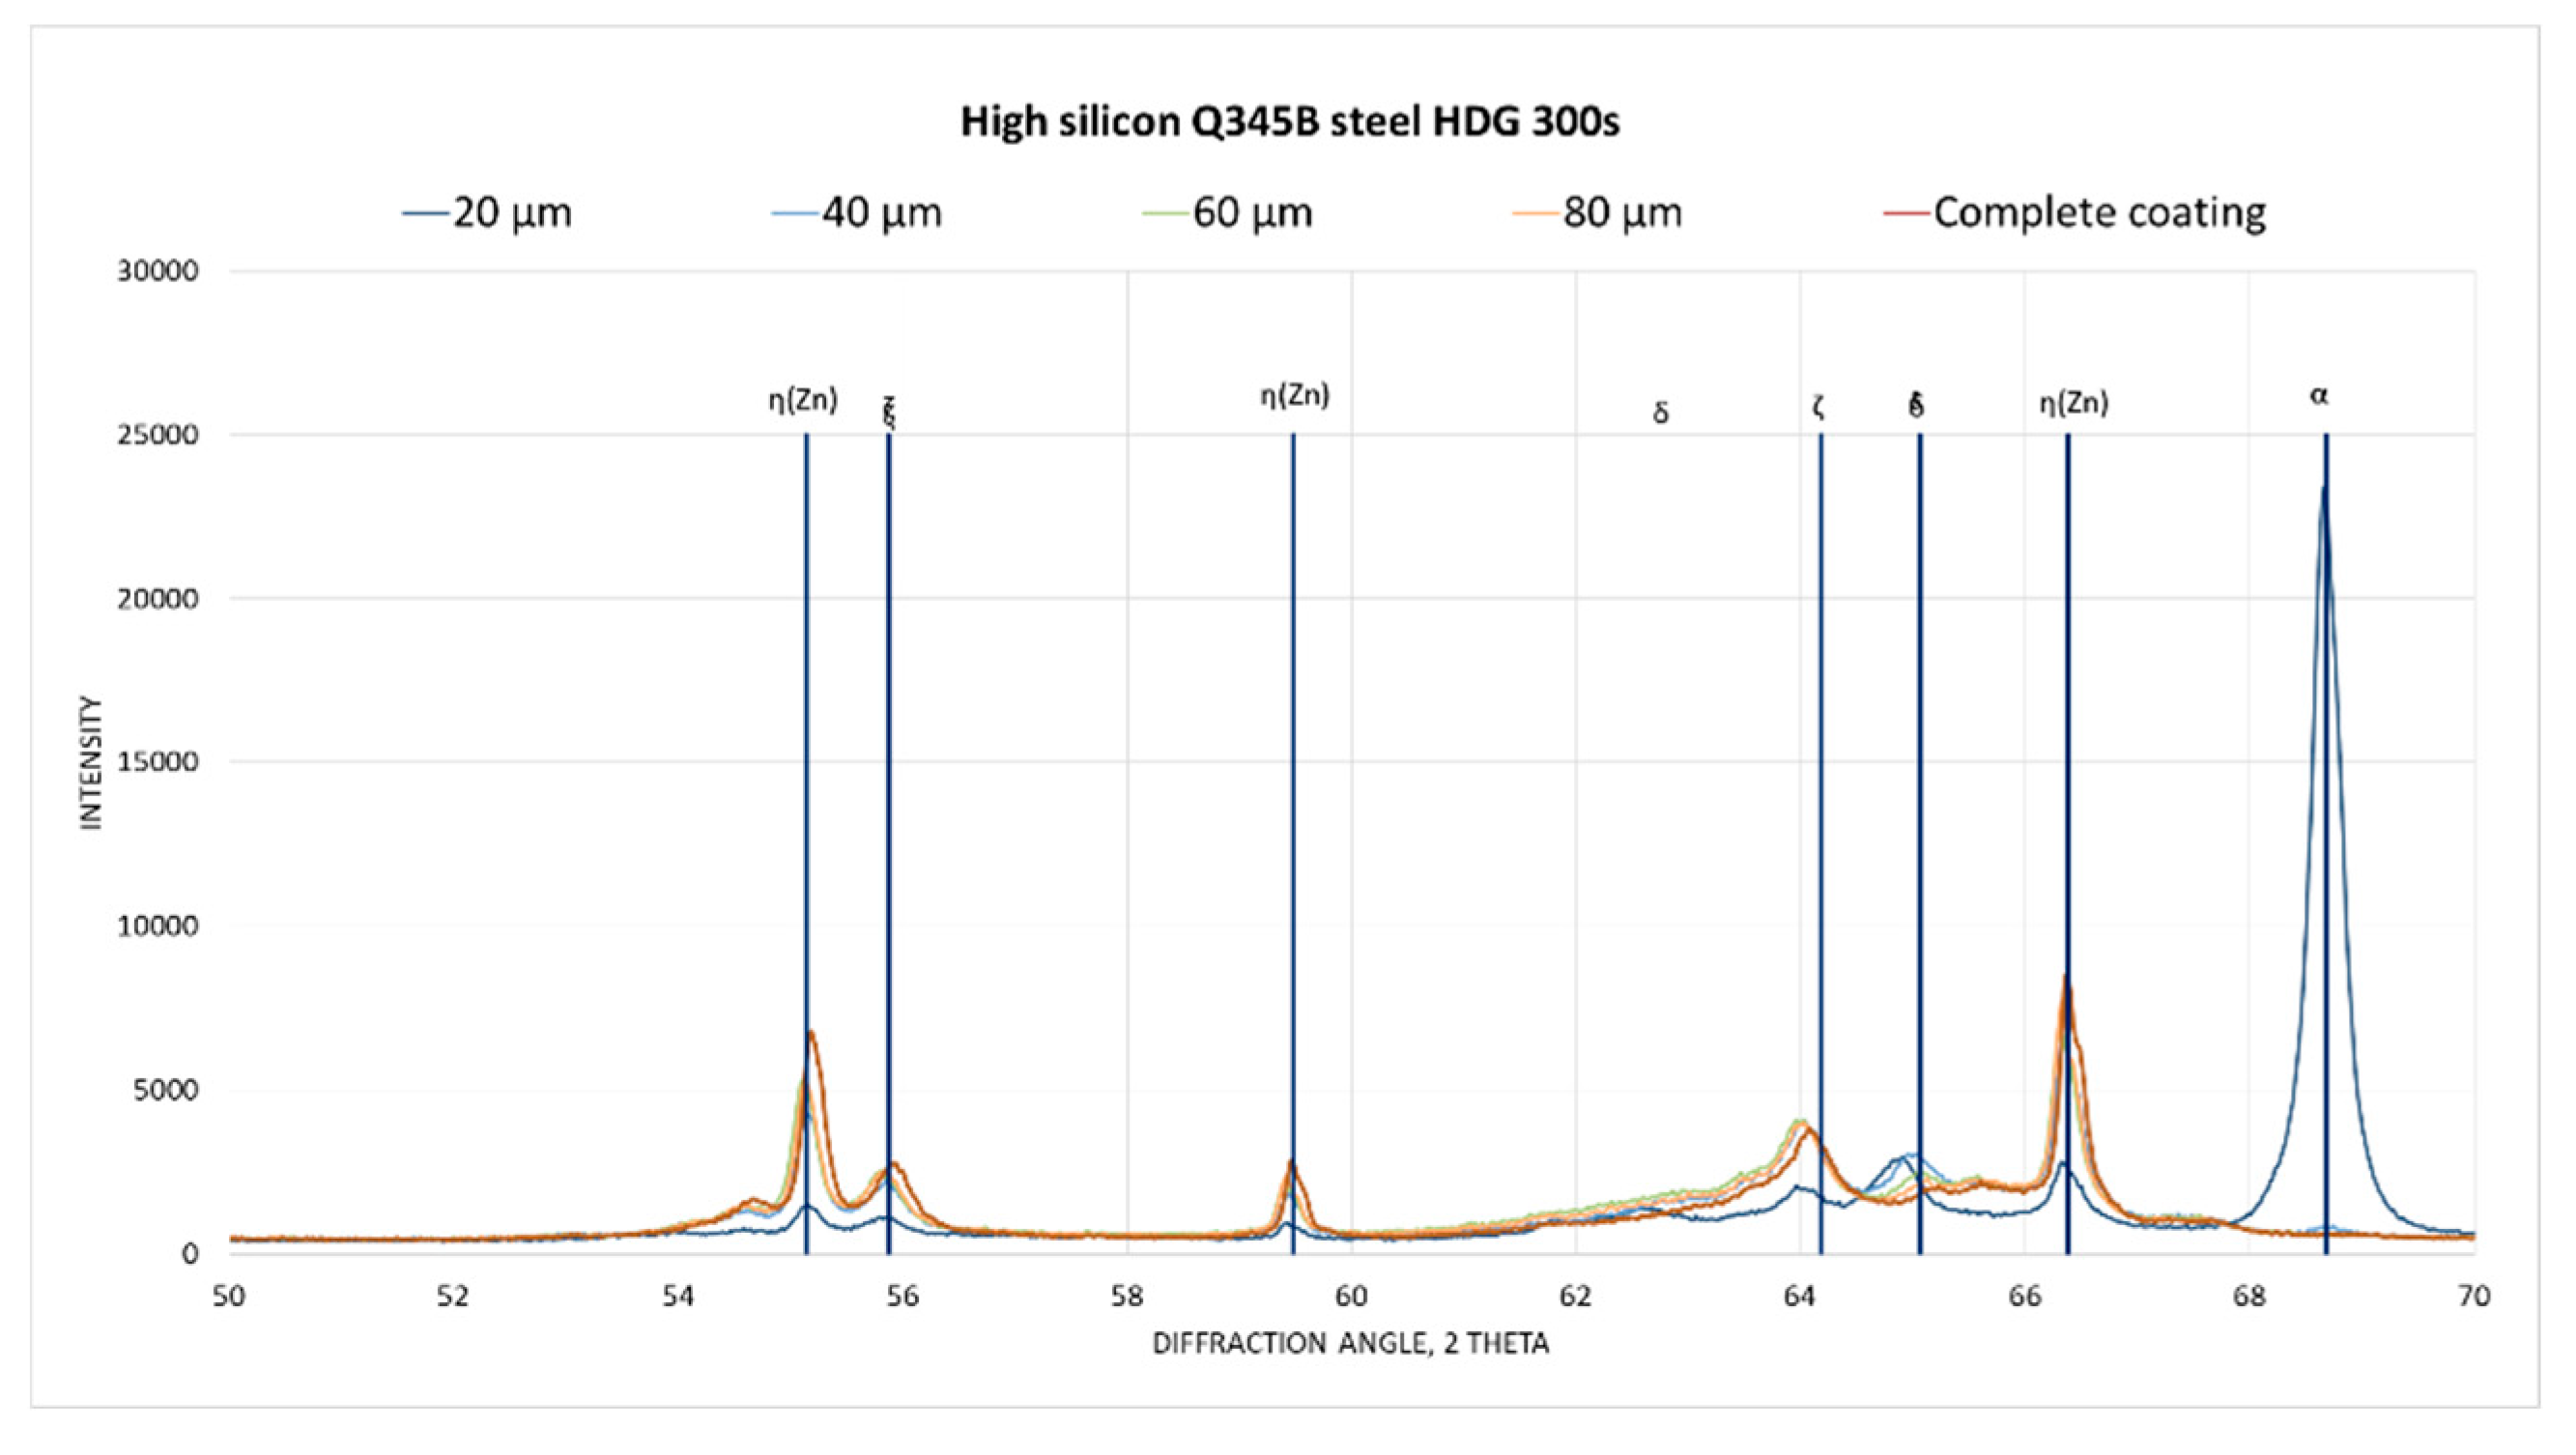
Figure 14 and
Figure 15 shows the superimposed diffractograms of the 300 s samples and the corresponding identification of the phases. It is observed that in the complete coating the presence of zinc and the ζ phase, as the depth of the coating progresses, the intensity of the maximum zinc and ζ phase decreases, while the intensity of the phase increases δ to finally meet the ferrous substrate given the appearance of the maximum corresponding to α.
4. Discussion
Figure 7,
Figure 8 and
Figure 9 show the formation of phases in early stages (5 and 15 s) of both steels. During these times, when only solid phases are present, similarities in thickness and morphology of the ζ phase are observed. This remains consistent even at 30 seconds, still with a liquid phase present. , A continuous ζ phase is observed in both cases. The previous observation agrees with what was stated by Sepper [
14]where the effect of silicon is not observed in early stages. This indicates that the mechanisms of formation of coatings in the presence of silicon, which states that the ζ phase is formed in the silicon-saturated liquid moving away from the substrate is wrong and the Kozdras [
10] hypothesis can be reconsidered, which poses a destabilization based on the wetting of the grain boundaries of the ζ phase enriched in silicon so that the ζ-ζ interface can be penetrated by the liquid phase.
In contrast, images taken at extended durations indicate that the ζ phase gets dispersed within the η phase. From a phenomenological perspective, there comes a point when the liquid can effectively wet a ζ-ζ grain boundary. This phenomenon aligns with the Gibbs-Smith condition [
19].
where the grain boundary free energy (solid-solid interface) for a given grain boundary must have a value greater than twice the free energy of the solid-liquid interface.
Therefore, as the Fe-Zn phases grow, the excess silicon in the liquid phase decreases the surface energy of the liquid-ζ interface.
5. Conclusions
The reactions for the formation of layers of Fe-Zn intermetallic compounds in galvanizing on an industrial scale begin during the steel heating stage.
The Fe-Zn phase formation sequence in this process is first ζ, then δ, no Γ phase was detected at industrial galvanizing conditions
Due to the layered nature of the coating it is possible to identify the phases present through X-ray diffraction analysis of samples that have been progressively removed from their coating.
The effect of silicon is not observable at times less than 30 seconds, at which time the liquid phase is already present and the coating consists of a δ layer followed by a continuous and compact ζ layer covered with liquid.
Observations of the ζ/η interface indicate that silicon gets driven towards the liquid, accumulating there. This results in an accelerated reaction mechanism, stemming from the alteration of the η/ζ interface energy. This shift aligns with the Gibbs-Smith condition, suggesting the infiltration of the liquid phase through the ζ/ζ boundaries.
Funding
This research was funded by FONDEF ANID, TDP 210012.
Conflicts of Interest
The authors declare no conflict of interest.
References
- Kania, H.; Saternus, M. Evaluation and Current State of Primary and Secondary Zinc Production—A Review. Appl. Sci. 2023, 13, 2003. [Google Scholar] [CrossRef]
- Xiong, W.; Kong, Y.; Du, Y.; Liu, Z.-K.; Selleby, M.; Sun, W.-H. Thermodynamic Investigation of the Galvanizing Systems, I: Refinement of the Thermodynamic Description for the Fe–Zn System. Calphad 2009, 33, 433–440. [Google Scholar] [CrossRef]
- Petersen, S.; Spencer, P.J.; Hack, K. A Thermodynamic Evaluation of the Iron-Zinc System. Thermochim. Acta 1988, 129, 77–87. [Google Scholar] [CrossRef]
- Han, K.; Ohnuma, I.; Okuda, K.; Kainuma, R. Experimental Determination of Phase Diagram in the Zn-Fe Binary System. J. Alloys Compd. 2018, 737, 490–504. [Google Scholar] [CrossRef]
- Perrot, P.; Dauphin, J.Y. Calculation of the FeZnSi Phase Diagram between 773 and 1173 K. Calphad 1988, 12, 33–40. [Google Scholar] [CrossRef]
- Marder, A.R. The Metallurgy of Zinc-Coated Steel. Prog. Mater. Sci. 2000, 45, 191–271. [Google Scholar] [CrossRef]
- Pokorny, P.; Kolísko, J.; Balík, L.; Novak, P. Reaction Kinetics of the Formation of Intermetallic Fe – Zn during Hot - Dip Galvanizing of Steel. Metalurgija 2016, 55, 111–114. [Google Scholar]
- Guttmann, M. Diffusive Phase Transformations in Hot Dip Galvanizing. Mater. Sci. Forum 1994, 155–156, 527–548. [Google Scholar] [CrossRef]
- Mackowiak, J.; Short, N.R. Metallurgy of Galvanized Coatings. Int. Met. Rev. 1979, 24, 1–19. [Google Scholar] [CrossRef]
- Kozdras, M.S.; Niessen, P. Silicon-Induced Destabilization of Galvanized Coatings in the Sandelin Peak Region. Metallography 1989, 22, 253–267. [Google Scholar] [CrossRef]
- Foct, J.; Perrot, P.; Reumont, G. Interpretation of the Role of Silicon on the Galvanizing Reaction Based on Kinetics, Morphology and Thermodynamics. Scr. Metall. Mater. 1993, 28, 1195–1200. [Google Scholar] [CrossRef]
- Su, X.; Tang, N.-Y.; Toguri, J.M. 450 °C Isothermal Section of the Fe-Zn-Si Ternary Phase Diagram. Can. Metall. Q. 2001, 40, 377–384. [Google Scholar] [CrossRef]
- Raghavan, V. Ternary and Higher Order Iron Phase Diagram Updates. J. Phase Equilibria Diffus. 2010, 31, 366–366. [Google Scholar] [CrossRef]
- Sepper, S.; Peetsalu, P.; Kulu, P.; Saarna, M.; Mikli, V. The Role of Silicon in the Hot Dip Galvanizing Process. Proc. Est. Acad. Sci. 2016, 65, 159. [Google Scholar] [CrossRef]
- Bondareva, O.; Melnikov, A. Effect of the Silicon Content in Steel on the Hot-Dip Zinc Coating Microstructure Formation. IOP Conf. Ser. Mater. Sci. Eng. 2016, 156, 012015. [Google Scholar] [CrossRef]
- Che, C.S.; Lu, J.T.; Kong, G.; Xu, Q.Y.; Chen, J.H. Influence of Silicon in Steel on Galcanized Coatings. Acta Metall. Sin. Engl. Lett. 2006, 19, 85–90. [Google Scholar] [CrossRef]
- Gellings, P.J. Mechanism of the Reaction between Liquid Zinc and Steel. Corros. Sci. 1974, 14, 507–509. [Google Scholar] [CrossRef]
- Pokorný, P.; Kolísko, J.; Balík, L.; Novák, P. Effect of Chemical Composition of Steel on the Structure of Hot – Dip Galvanized Coating. Metalurgija 2016, 55, 115–118. [Google Scholar]
- Volovitch, P.; Protsenko, P.; Skvortsova, Z.; Traskine, V. Grain Boundary Wetting in Polycrystals: 1. Probability of Wetting of Structural Elements. Colloid J. 2002, 64, 270–273. [Google Scholar] [CrossRef]
Figure 1.
Iron-zinc equilibrium phase diagram.
Figure 1.
Iron-zinc equilibrium phase diagram.
Figure 2.
Typical microstructure of iron-zinc coating, from [
6].
Figure 2.
Typical microstructure of iron-zinc coating, from [
6].
Figure 3.
Coating microstructure of the with 0.3% silicon steel.
Figure 3.
Coating microstructure of the with 0.3% silicon steel.
Figure 4.
Heating curves during galvanizing.
Figure 4.
Heating curves during galvanizing.
Figure 5.
Microstructural evolution of galvanized steel ASTM A36 low in silicon: (a) 5s; (b) 15s; (c) 30s; (d) 300s.
Figure 5.
Microstructural evolution of galvanized steel ASTM A36 low in silicon: (a) 5s; (b) 15s; (c) 30s; (d) 300s.
Figure 6.
Microstructural evolution of galvanized steel Q345B high in silicon: (a) 15s; (b) 30s; (c) 300s.
Figure 6.
Microstructural evolution of galvanized steel Q345B high in silicon: (a) 15s; (b) 30s; (c) 300s.
Figure 7.
Steel/zinc interface analysis in 5 seconds, low silicon steel.
Figure 7.
Steel/zinc interface analysis in 5 seconds, low silicon steel.
Figure 8.
Steel/zinc interface analysis in 15 seconds, low silicon steel.
Figure 8.
Steel/zinc interface analysis in 15 seconds, low silicon steel.
Figure 9.
α/δ/ζ/η interface analysis in 15 seconds, high silicon steel.
Figure 9.
α/δ/ζ/η interface analysis in 15 seconds, high silicon steel.
Figure 10.
300s microstructure, high silicon steel.
Figure 10.
300s microstructure, high silicon steel.
Figure 11.
α/δ/ζ interface analysis in 300 seconds, high silicon steel.
Figure 11.
α/δ/ζ interface analysis in 300 seconds, high silicon steel.
Figure 12.
ζ/η interface analysis in 300 seconds, high silicon steel.
Figure 12.
ζ/η interface analysis in 300 seconds, high silicon steel.
Figure 13.
XRD test position: (a) A36 Steel (b) Q345B steel.
Figure 13.
XRD test position: (a) A36 Steel (b) Q345B steel.
Figure 14.
Low silicon Steel XRD pattern.
Figure 14.
Low silicon Steel XRD pattern.
Figure 15.
High silicon steel XRD pattern.
Figure 15.
High silicon steel XRD pattern.
Table 1.
Chemical composition of steels 1.
Table 1.
Chemical composition of steels 1.
| Steel |
%C |
%Si |
%Mn |
%P |
%S |
| ASTM A36 |
0.149 |
0.027 |
0.880 |
0.0217 |
0.0085 |
| Q345B |
0.160 |
0.37 |
1.440 |
0.0270 |
0.0270 |
Table 2.
Chemical composition of galvanizing bath 1.
Table 2.
Chemical composition of galvanizing bath 1.
| Zinc Bath |
%Al |
%Pb |
%Fe |
%Ni |
Zn |
| Plant 1 |
0.0022 |
0.755 |
0.0239 |
0.0007 |
Bal. |
Table 3.
EDS analysis steel/zinc interface in 5 seconds of reaction, low silicon steel1.
Table 3.
EDS analysis steel/zinc interface in 5 seconds of reaction, low silicon steel1.
| Point |
Phase |
%Fe |
%Zn |
| 1 |
ζ |
13,24 |
86,76 |
| 2 |
ζ |
14,8 |
85,2 |
| 3 |
α-ζ |
26,29 |
73,71 |
Table 4.
EDS analysis steel/zinc interface in 15 seconds of reaction, low silicon steel1.
Table 4.
EDS analysis steel/zinc interface in 15 seconds of reaction, low silicon steel1.
| Point |
Phase |
%Fe |
%Zn |
| 1 |
α |
96,41 |
3,59 |
| 2 |
δ |
33,85 |
66,15 |
| 3 |
ζ |
12,41 |
87,59 |
| 4 |
ζ |
10,07 |
89,93 |
| 5 |
ζ |
8,3 |
91,7 |
| 6 |
η+ζ |
5,32 |
94,68 |
Table 5.
EDS analysis α/δ/ζ/η interface in 15s, high silicon steel1.
Table 5.
EDS analysis α/δ/ζ/η interface in 15s, high silicon steel1.
| Point |
Phase |
%Fe |
%Zn |
%Si |
| 1 |
δ |
12,63 |
87,1 |
0,18 |
| 2 |
ζ |
9,52 |
90,08 |
0,4 |
| 3 |
η+ζ |
3,71 |
95,82 |
0,29 |
Table 6.
EDS analysis α/δ/ζ interface in 300 seconds, high silicon steel 1.
Table 6.
EDS analysis α/δ/ζ interface in 300 seconds, high silicon steel 1.
| Point |
Phase |
%Fe |
%Zn |
%Si |
| 1 |
α |
98,23 |
1,21 |
0,56 |
| 2 |
α |
97,36 |
2,05 |
0,3 |
| 3 |
α |
89,77 |
9,78 |
0,45 |
| 4 |
δ |
21,74 |
77,92 |
0,15 |
| 5 |
δ |
16,23 |
83,48 |
0,29 |
| 6 |
δ |
12,92 |
86,85 |
0,23 |
| 7 |
δ |
11,91 |
87,82 |
0,27 |
| 8 |
δ |
10,77 |
88,94 |
0,29 |
| 9 |
δ |
10,37 |
89,3 |
0,33 |
| 10 |
δ |
10,24 |
89,45 |
0,31 |
| 11 |
ζ |
9,03 |
90,65 |
0,32 |
| 12 |
ζ |
8,91 |
90,76 |
0,14 |
| 13 |
ζ |
8,48 |
91,22 |
0,3 |
Table 7.
EDS analysis ζ/η interface in 300 seconds, high silicon steel 1.
Table 7.
EDS analysis ζ/η interface in 300 seconds, high silicon steel 1.
| Point |
Phase |
%Fe |
%Zn |
%Si |
| 1 |
ζ |
7,9 |
91,68 |
0,42 |
| 2 |
ζ |
7,82 |
91,82 |
0,36 |
| 3 |
ζ |
7,88 |
91,81 |
0,31 |
| 4 |
η |
1,48 |
97,82 |
0,38 |
| 5 |
η |
1,51 |
98,22 |
0,28 |
| 6 |
η |
1,48 |
98,29 |
0,22 |
| 7 |
η |
1,58 |
98,17 |
0,26 |
| 8 |
η |
1,65 |
97,97 |
0,38 |
| 9 |
η |
1,57 |
98,11 |
0,32 |
| 10 |
η |
1,67 |
97,35 |
0,46 |
|
Disclaimer/Publisher’s Note: The statements, opinions and data contained in all publications are solely those of the individual author(s) and contributor(s) and not of MDPI and/or the editor(s). MDPI and/or the editor(s) disclaim responsibility for any injury to people or property resulting from any ideas, methods, instructions or products referred to in the content. |
© 2023 by the authors. Licensee MDPI, Basel, Switzerland. This article is an open access article distributed under the terms and conditions of the Creative Commons Attribution (CC BY) license (https://creativecommons.org/licenses/by/4.0/).
