3.1. Physical property characterization
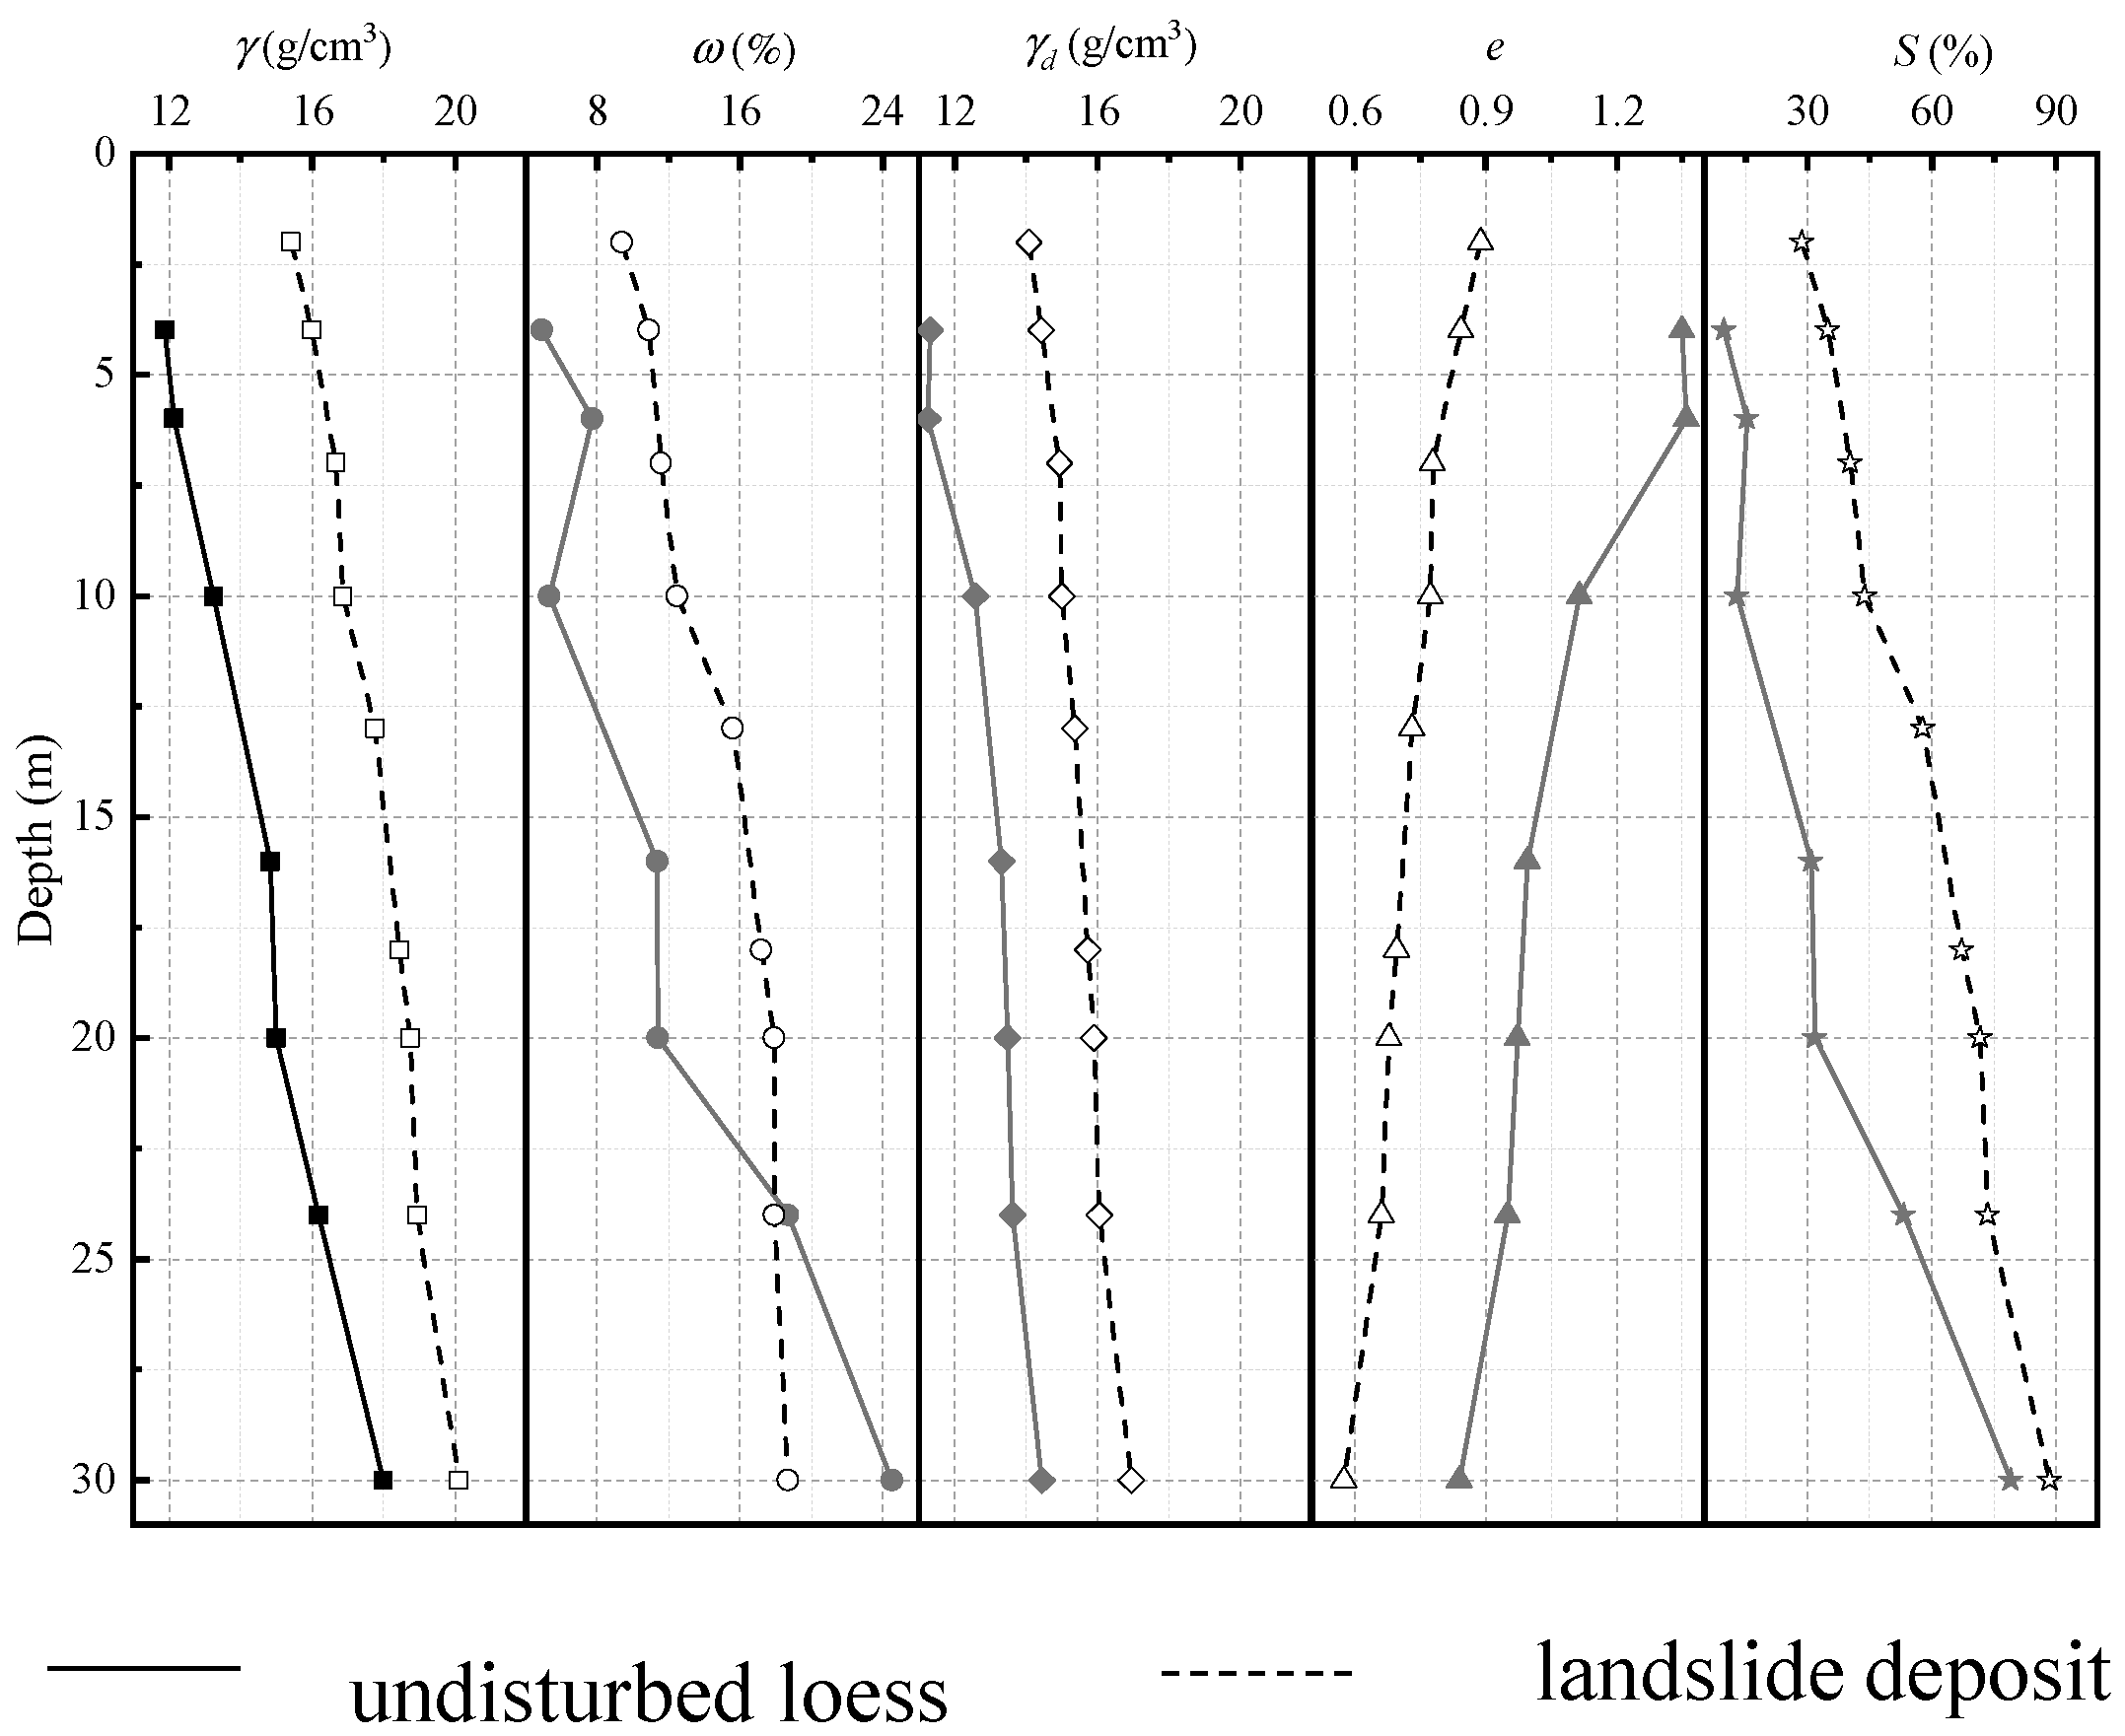
The test results provided a specific gravity (Gs) of 2.71 for the undisturbed loess and a Gs value of 2.72 for the landslide deposit. As depicted in
Figure 4, both the undisturbed loess and the deposit exhibit a gradual increase in
and
with depth. However, at the same depth, the deposit’s
and
surpass those of the undisturbed loess.
Analyzing the moisture content-depth curve, the undisturbed loess maintains a relatively stable and low moisture content at depths shallower than 10 meters. Between 10 and 20 meters, it experiences a gradual rise in moisture content, followed by a rapid surge in moisture below 20 meters. The saturation level reaches approximately 80% at a depth of 30 meters. In contrast, the deposit at the same depth showcases higher saturation than the undisturbed loess, with its moisture content uniformly increasing as depth grows. At 30 meters deep, the saturation level approaches 90%.
The alterations in the physical properties of these two materials stems from notable changes in their porosity. The undisturbed loess, known for being a wind-blown soil with large pores, loose structure, and weak cohesion, exhibits a surface porosity ratio of 1.3. With greater depth, this ratio decreases, reaching 0.86 at 30 m deep, while still maintaining its character as a porous and loosely packed soil. Conversely, at the same depth, the deposit’s porosity ratio is significantly lower than that of the undisturbed loess. It reaches a maximum of 0.89 at the surface and declines with depth, reaching only 0.58 at a depth of 30 m.
This suggests that the loose and porous structure of the undisturbed loess becomes disrupted after undergoing the seismic landslide process. After deposition, the landslide deposit experiences reduced porosity, a compacted structure, increased density, and dry density.
Figure 4.
Density, water content, dry density, initial void ratio and saturation degree of undisturbed loess and landslide deposit at different depths.
Figure 4.
Density, water content, dry density, initial void ratio and saturation degree of undisturbed loess and landslide deposit at different depths.
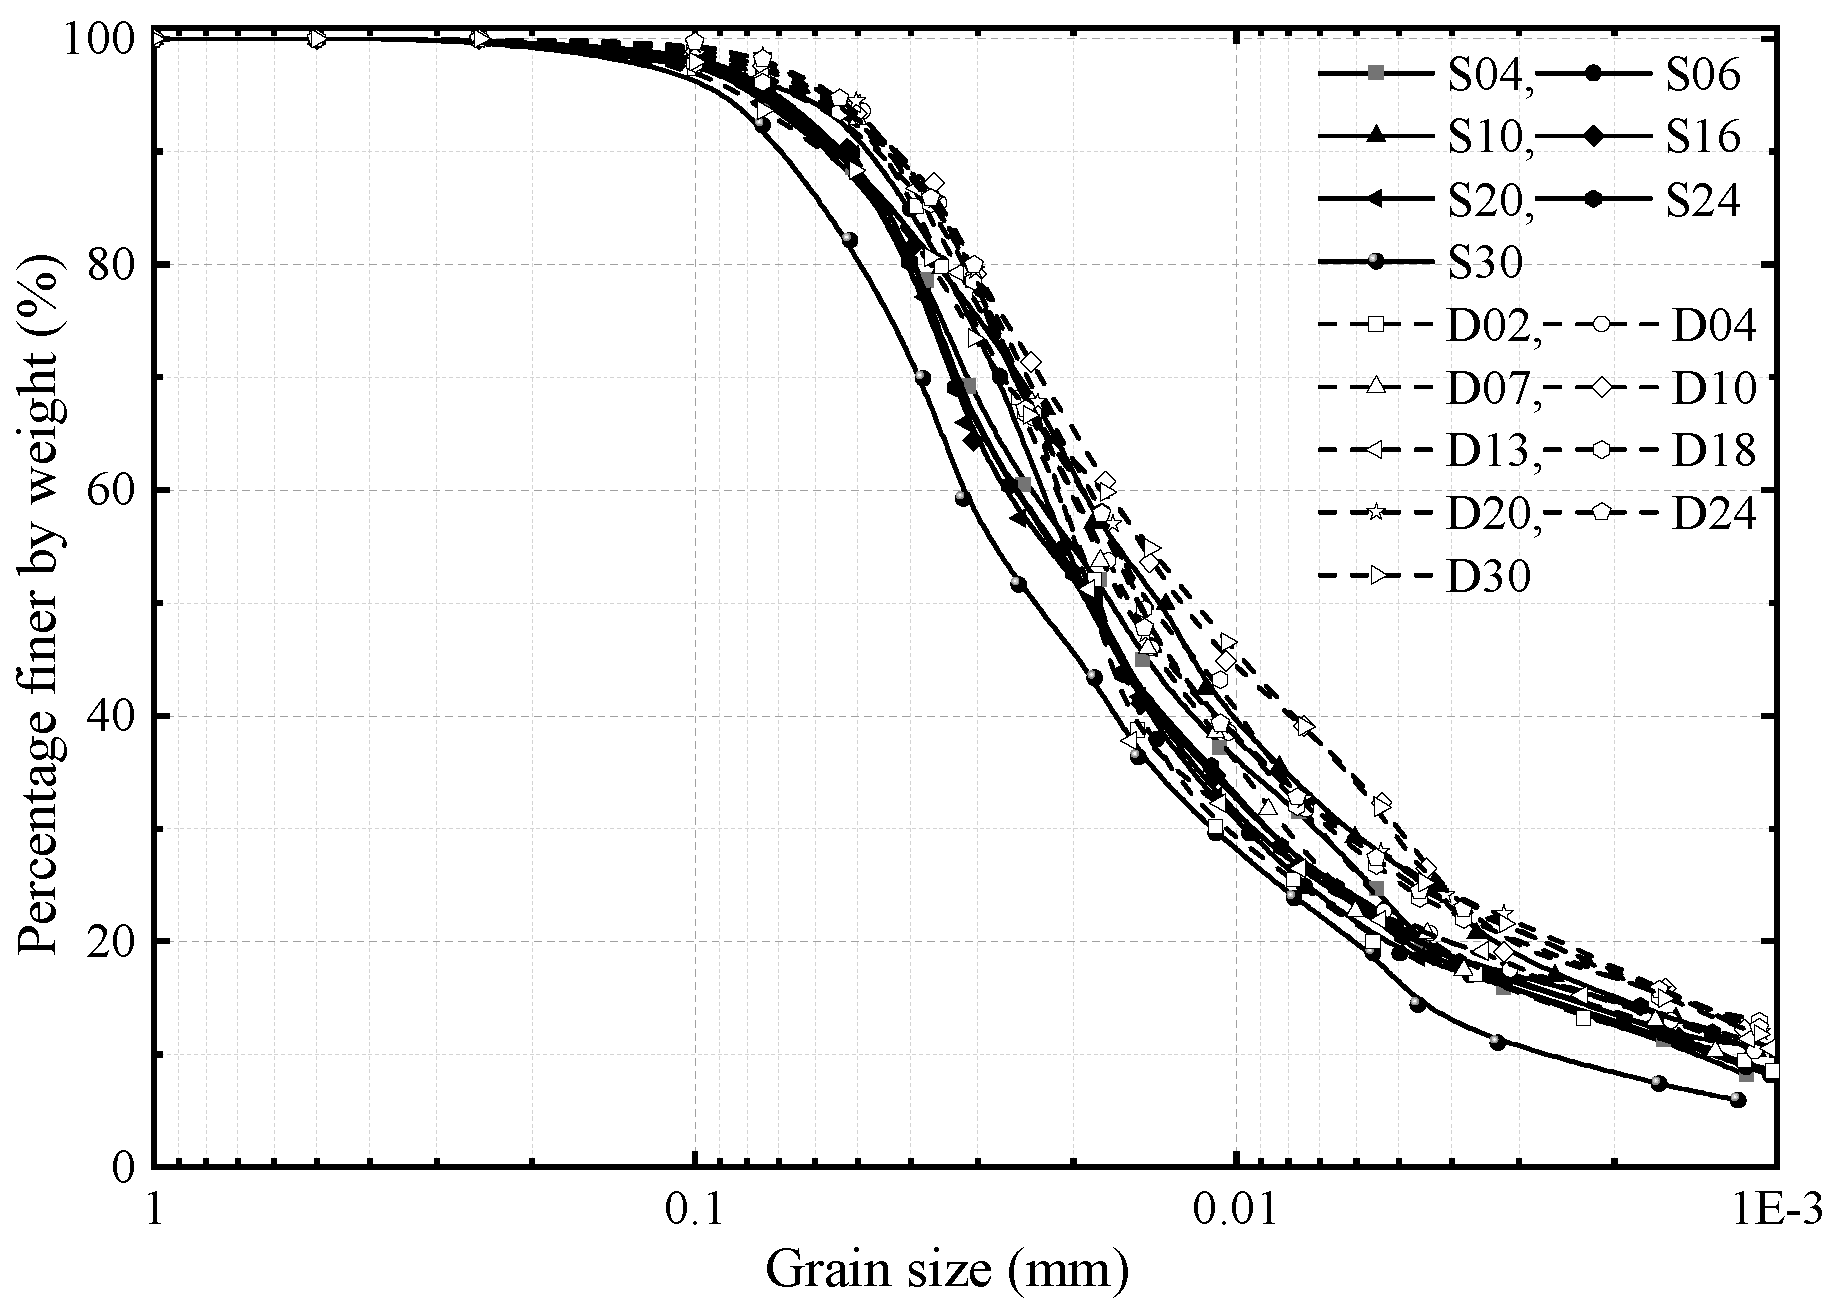
The grain size distribution was presented in
Figure 5. The results showed that the samples of undisturbed loess in slope contain 8.1%~14.8% of clay (<0.002mm), 80.0%~84.2% of silt (0.002-0.075mm), and 3.8%~7.7% of sand (0.075-0.25mm). At a depth of 30 meters, the soil sample exhibits the highest concentration of sand and the lowest concentration of clay. The samples of deposits contain 12.3%~17.3% of clay(<0.002mm), 77.1%~84.5% of silt (0.002-0.075mm), and 1.6%~6.3% of sand (0.075-0.25mm). Compared to the undisturbed loess, the landslide deposits exhibit an increase in the clay particle content and a decrease in the sand particle content.
Figure 5.
Grain size distribution curve of undisturbed loess and landslide deposit in different depths.
Figure 5.
Grain size distribution curve of undisturbed loess and landslide deposit in different depths.
The particle size distributions of the two sample types, undisturbed loess and landslide deposits, were subjected to statistical analysis by measuring their
D60, D50,
D30, and
D10 values at different depths. The results depicted in
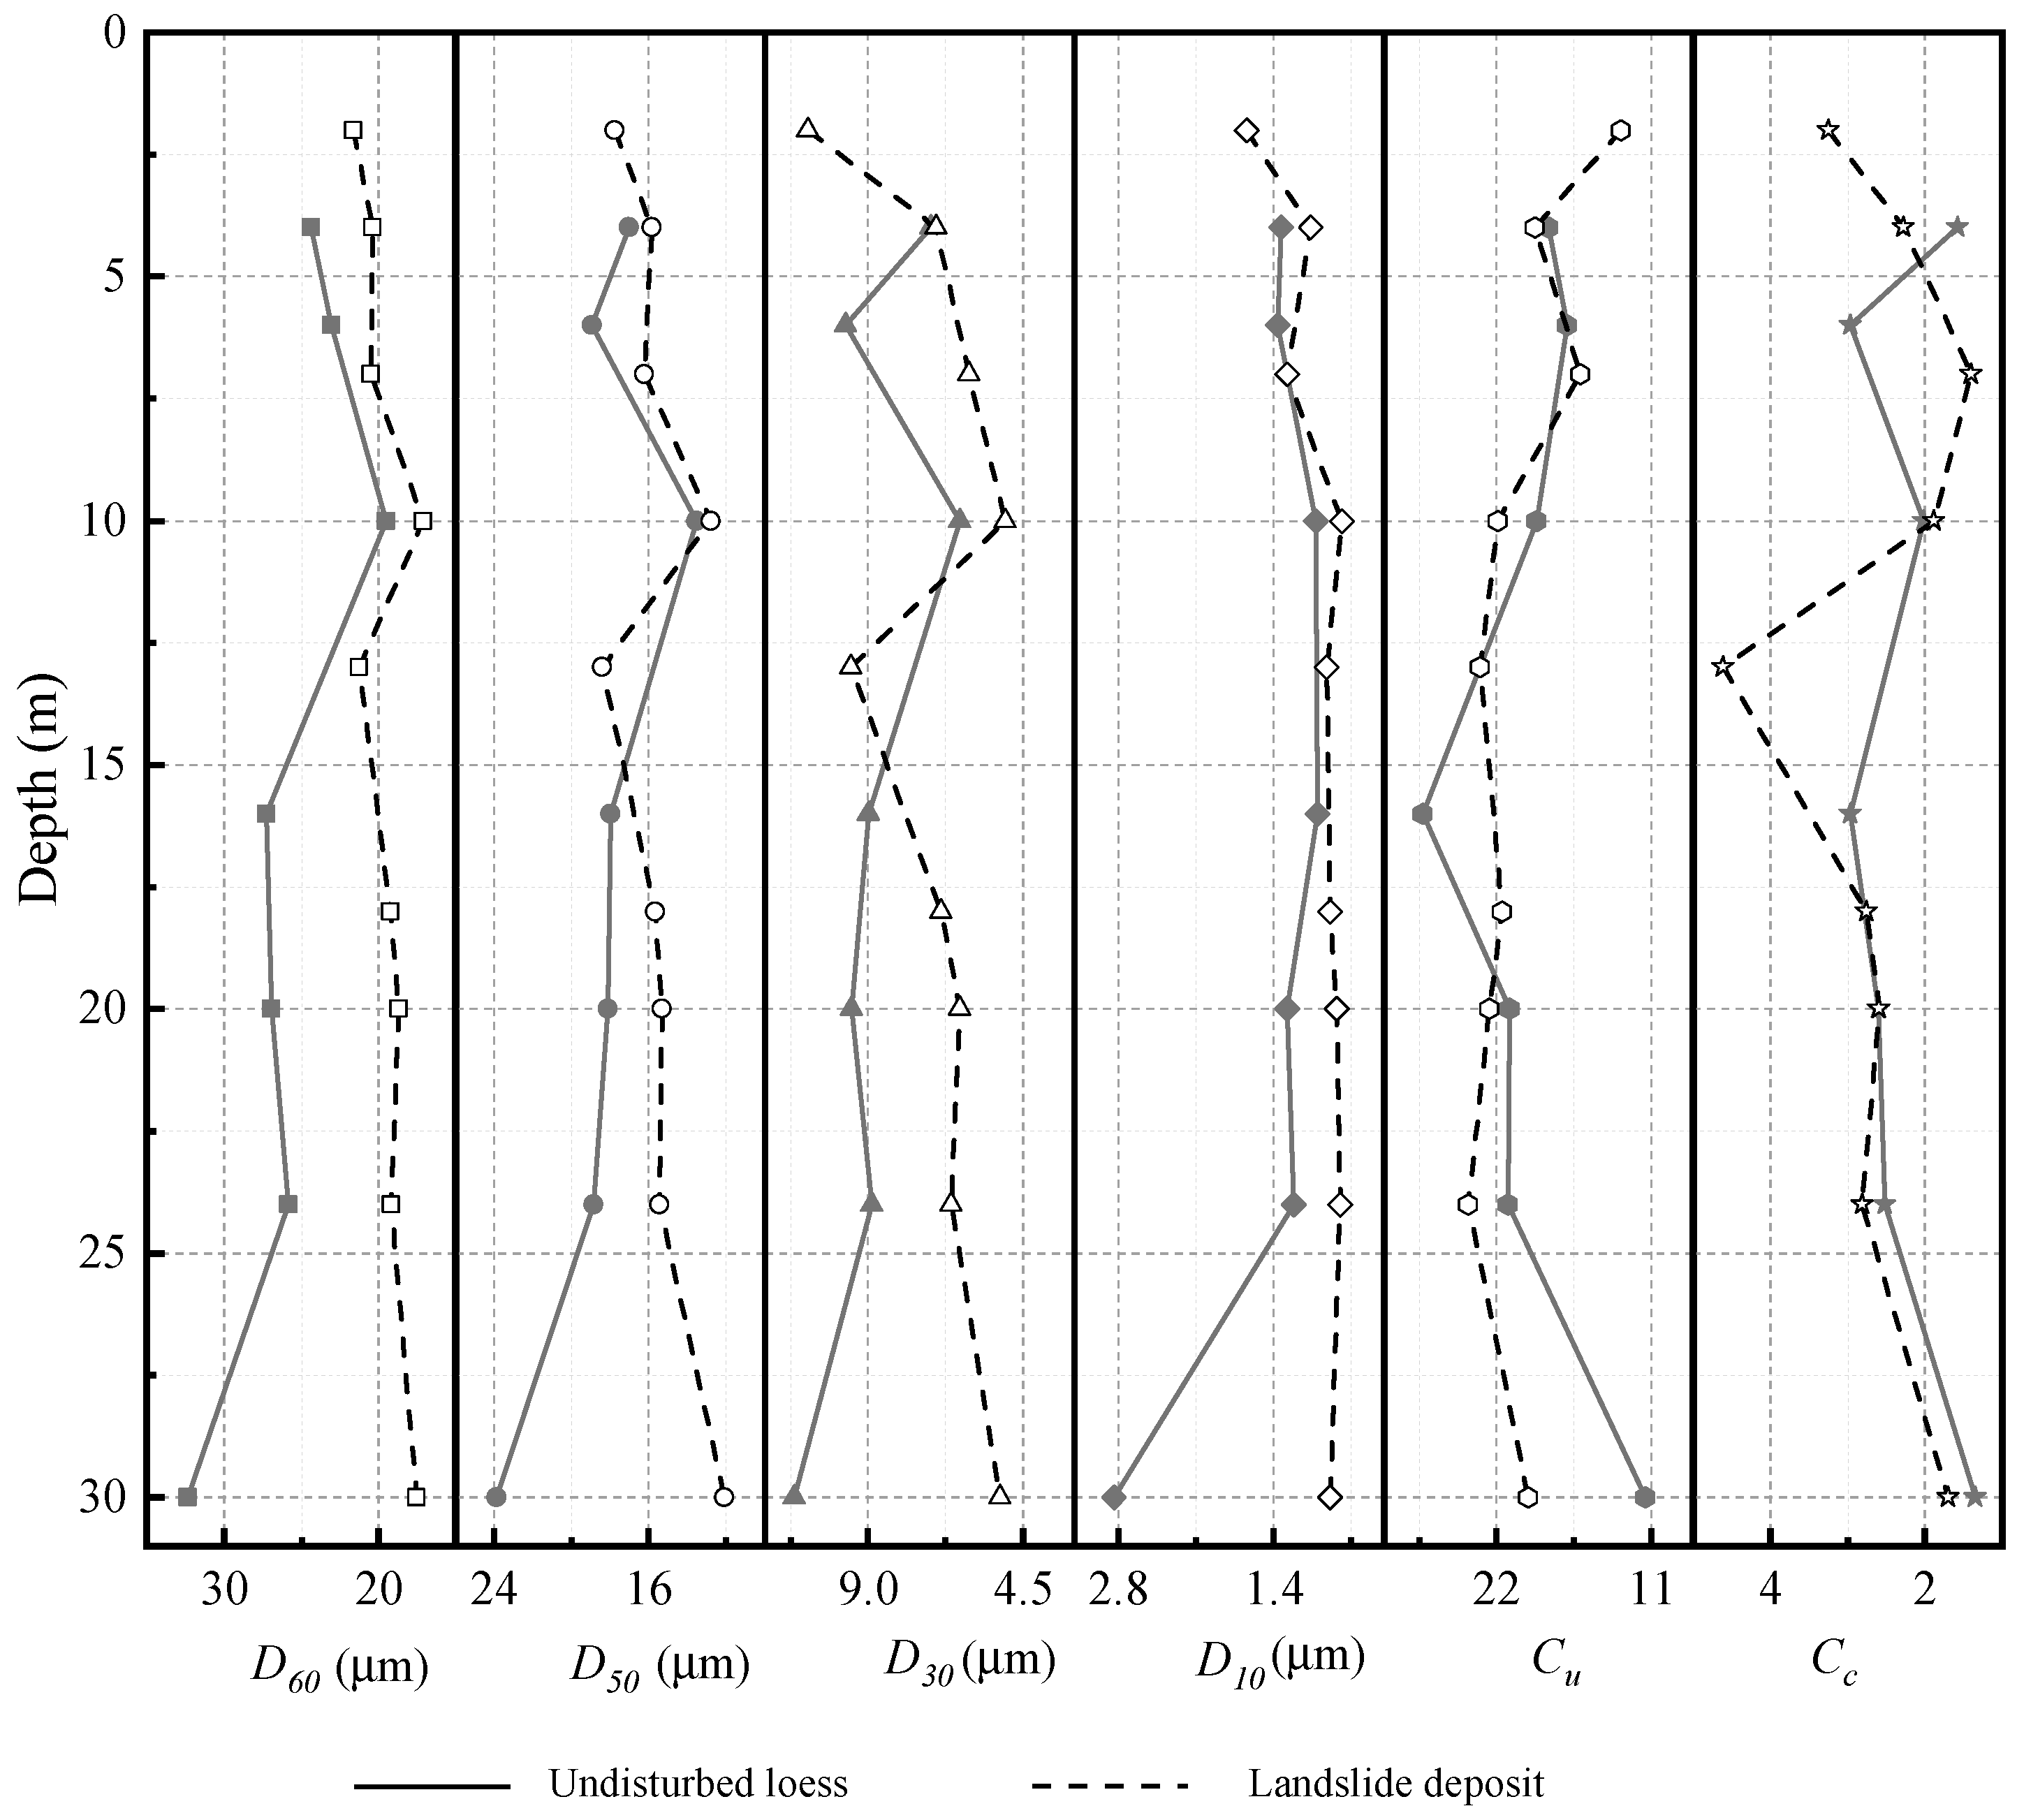
Figure 6 indicate that, for the undisturbed loess, the
D60 values display a fluctuating pattern with depth, ranging between 19.5μm and 33.2μm. The
D50,
D30, and
D10 values exhibit relatively minor variations with depth, except for a more significant shift at a depth of 30m.
In contrast, the landslide deposits exhibit consistent D60, D50, D30, and D10 values at various depths. When compared to the undisturbed loess, the landslide deposits display relatively uniform D60, D50, D30, and D10 values above a depth of 15m. However, beyond the 15m mark, the D60, D50, D30, and D10 values of the landslide deposits decrease, with the reductions being particularly pronounced for D60, D50, and D30.
Simultaneously, both the undisturbed loess and the landslide deposits have relatively high uniformity coefficients (Cu>4), and their coefficients of curvature (Cc>1) are also large. This indicates a wider distribution of particle sizes, implying a well-graded nature. In such cases, the soil particles exhibit significant variations in size, encompassing both larger and smaller particles.
Figure 6.
The different diameter of undisturbed loess and landslide deposit in different depths.
Figure 6.
The different diameter of undisturbed loess and landslide deposit in different depths.
In
Table 2, the average
D60,
D50,
D30, and
D10 values of the landslide deposits are smaller than those of the undisturbed loess by 6.1μm, 1.3μm, 1.8μm, and 0.4μm, respectively. After experiencing seismic sliding, the larger particles in the soil have reduced. The coefficient of variation indicates that the particle size differences at various depths of the landslide deposits are minimal, suggesting that the particles have become more uniform across different depths due to the soil sliding process.
Table 2.
Mean value and coefficient of variation of grain size distribution of undisturbed loess and landslide deposit.
Table 2.
Mean value and coefficient of variation of grain size distribution of undisturbed loess and landslide deposit.
| |
|
m) |
m) |
m) |
m) |
Cu |
Cc |
| Samples in Slope |
Mean value |
25.6 |
18.3 |
8.8 |
1.4 |
19.3242 |
2.2822 |
| Coefficient of variation |
0.1549 |
0.1680 |
0.1821 |
0.4366 |
0.2490 |
0.2833 |
| Samples in deposit |
Mean value |
19.5 |
15.5 |
7.0 |
1.0 |
20.1573 |
2.5852 |
| Coefficient of variation |
0.0811 |
0.1309 |
0.2721 |
0.2729 |
0.1766 |
0.3723 |
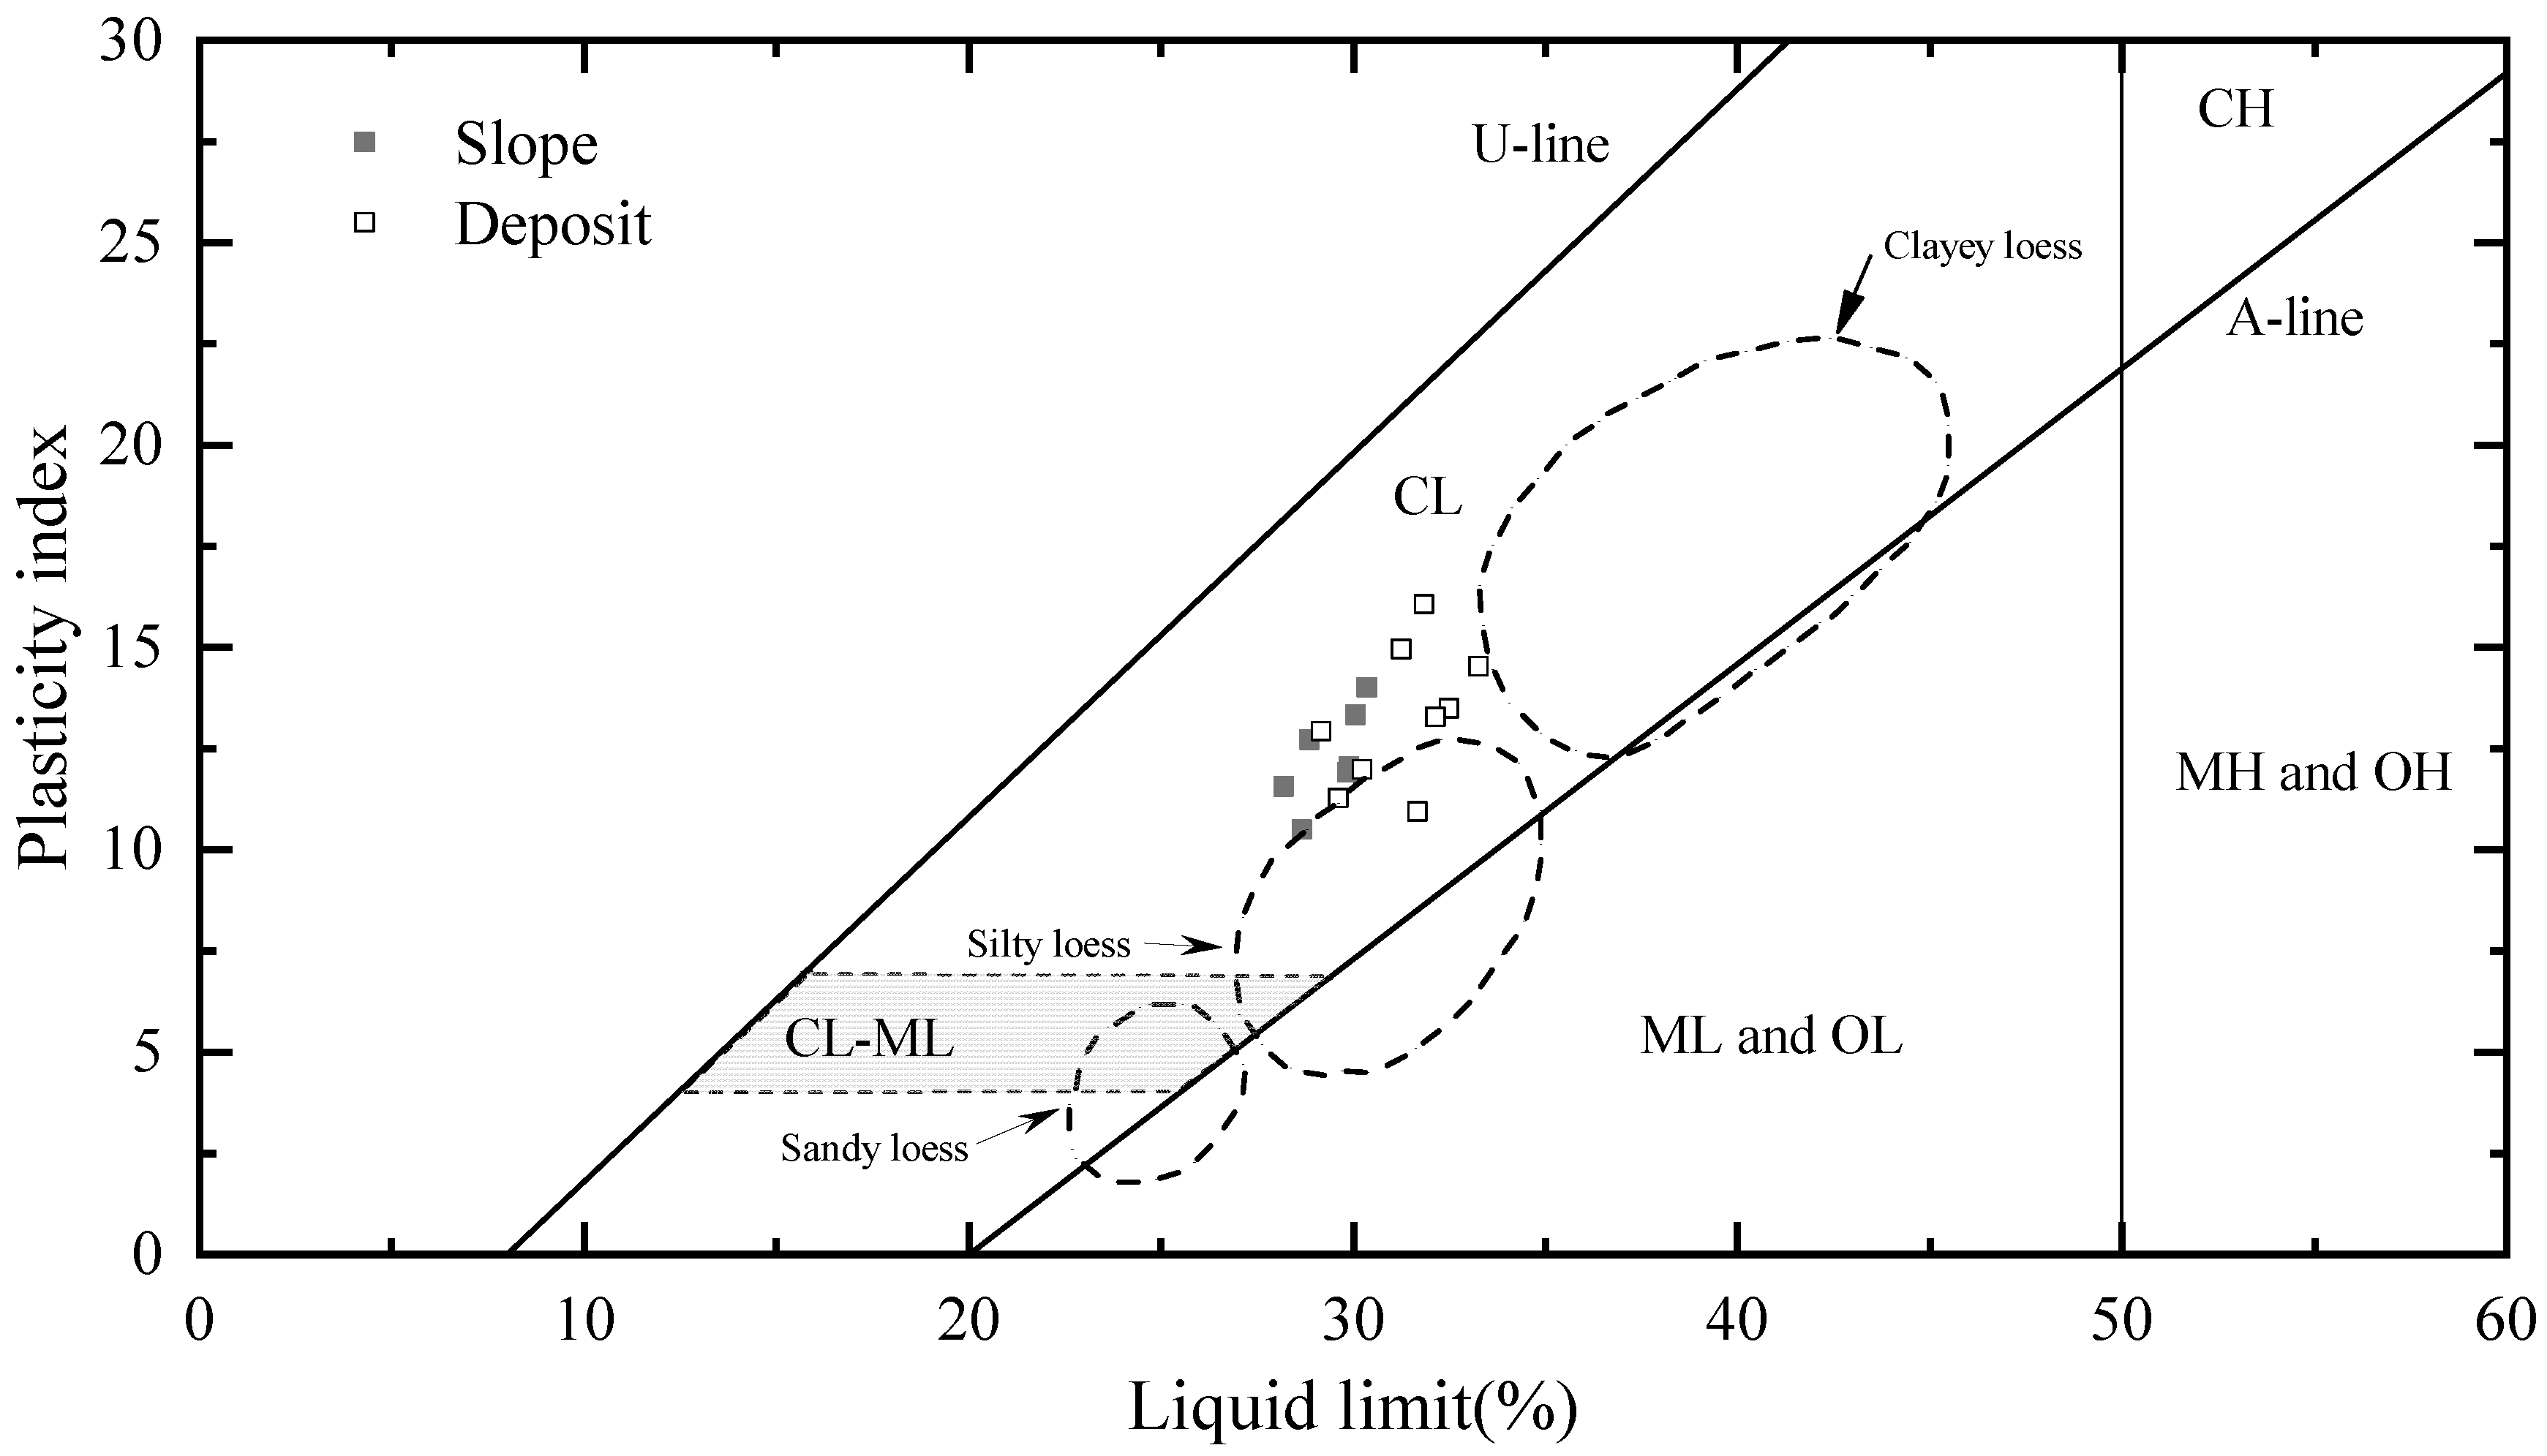
Soils with a higher proportion of smaller particles typically exhibit higher liquid limits. As shown in
Figure 7, according to Gibbs’ classification method based on liquid limit and plasticity index, both the undisturbed loess and landslide deposit fall between the A-line and U-line. The undisturbed loess has a lower liquid limit, closer to silty loess, while the landslide deposit has a higher liquid limit, closer to clayey loess. The liquid limit test results are consistent with the particle analysis results.
Figure 7.
Trends of plasticity characteristics of undisturbed loess and landslide deposit.
Figure 7.
Trends of plasticity characteristics of undisturbed loess and landslide deposit.
Based on the variations in pore structure and particle size of the undisturbed loess and landslide deposits, it can be inferred that during the occurrence and movement of a landslide, the loose and porous structure of the undisturbed loess undergoes fragmentation. Larger soil particles experience compression, friction, fragmentation, and abrasion during their movement, resulting in the formation of smaller particles. Additionally, as the landslide progresses, continuous collisions among larger particles cause them to move downward, leading to further fragmentation and abrasion. Simultaneously, smaller particles are more easily transported by the surrounding soil and water flow, tending to settle in the lower sections of the landslide deposit. Consequently, the lower parts of the landslide deposit might contain a higher proportion of smaller particles. This phenomenon can be attributed to the combined effects of the fragmentation and abrasion of larger particles during their movement and the selective transportation and deposition of particles of different sizes during the landslide process.
3.2. Consolidation characterization
The intact loess is a type of soil with strong structural strength and low initial density, and its mechanical properties are closely related to its structural characteristics. Its compression and plasticity characteristics also differ from other types of soils. The present study investigated the undisturbed loess and landslide deposit soil using standard consolidation test. The soil samples were subjected to consolidation at different pressure levels (12.5, 25, 50, 100, 200, 300, 400, 600, 800 kPa), and the rebound ratio of each level was recorded after 24 hours of unloading. The void ratio of the samples after consolidation is
ei,
In the equation, represents the initial void ratio, represents the initial height of the soil sample, and represents the deformation of the sample after achieving consolidation stability under a certain level of pressure.
The experimental data were processed using the da & de’s [
30] program and the Casagrande’s [
31] method was used to plot the compression curve, from which the compression index, pre-consolidation pressure (
Pc), and over-consolidation ratio (
OCR) were determined.
is the maximum vertical effective stress that a soil was subjected to in the past, is existing vertical effective stress.
The undisturbed loess has a strong structural behavior at low water content, which is manifested as a state of over-consolidation, i.e.
OCR is much greater than 1. As the water content of the soil sample increases, the structural behavior of the loess gradually weakens, and
OCR tends to approach 1, which is manifested as normal consolidation [
32]. As shown in
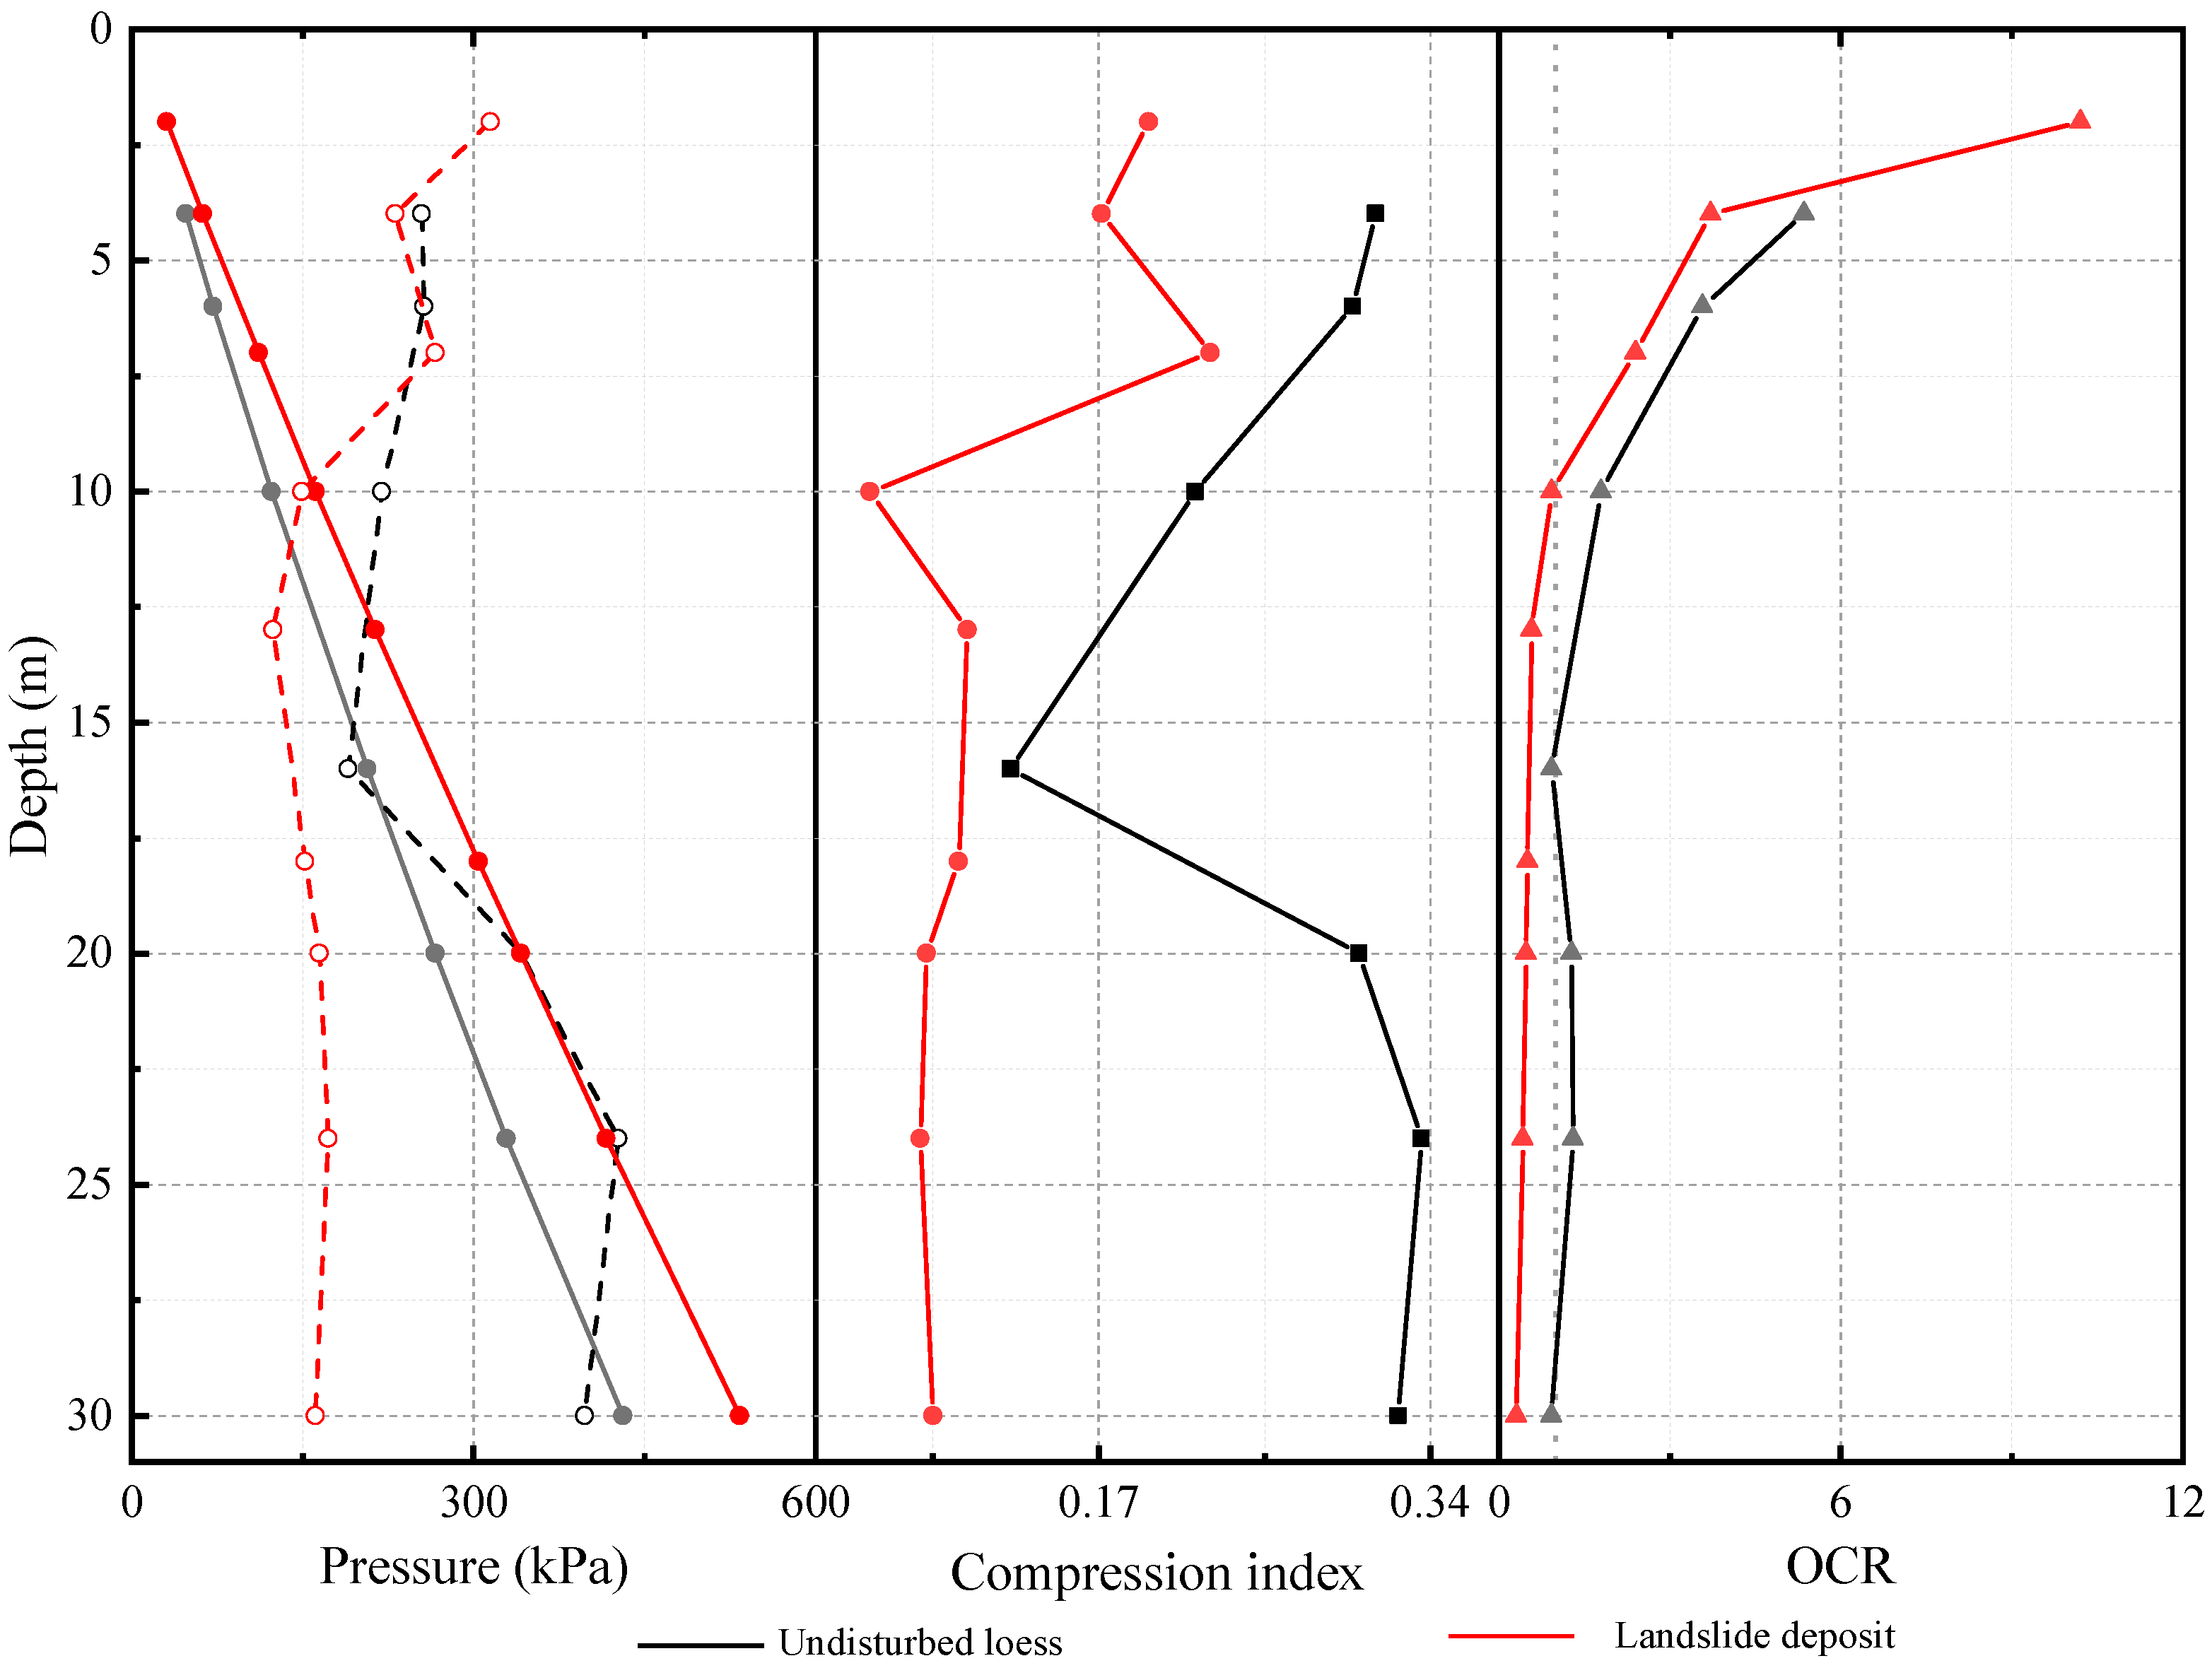
Figure 8, the initial pre-consolidation pressure of the undisturbed loess is notably higher than the vertical stress at depths exceeding 5 meters. With increasing depth and moisture content, the pre-consolidation pressure and vertical stress gradually converge. This trend aligns with the typical understanding of the dynamic consolidation pressure in loess. The compression index ranges from 0.13 to 0.33, indicating a soil of moderate compressibility.
The upper layer (above 5 meters) of the landslide deposit still maintains a pronounced structural behavior, whereas the vertical stress of soil samples at depths of 10 meters and below progressively surpasses the pre-consolidation pressure. Consequently, the consolidation state shifts from over-consolidation at the surface to normal consolidation and eventually to under-consolidation. The compression coefficient of soil samples at shallow depths ranges from 0.17 to 0.22, indicating moderate compressibility characteristics. Meanwhile, the compression coefficient of soil samples at greater depths varies from 0.08 to 0.1, signifying low compressibility characteristics.
The intact loess experiences a significant alteration in its compression properties as its structure gets disrupted during the sliding process and undergoes consolidation after deposition. The upper layer of the intact loess demonstrates characteristics of over-consolidated, under-compacted soil behavior at low water content, while the deeper layer shows characteristics of normally consolidated, under-compacted soil behavior at higher water content. The upper part of the landslide deposit exhibits over-consolidated, low-compression characteristics, whereas the lower part shows characteristics of under-consolidation with low compression. This phenomenon can be attributed to the greater compression and shear experienced by the deep-seated slide mass during movement, leading to more severe soil disruption, destruction of loess structure, reduced porosity, and tighter particle arrangement. Furthermore, the landslide deposit has undergone nearly a century of substantial re-consolidation, but its deep layers still exhibit under-consolidated features. Thus, for engineering construction on such deposits, attention should be paid to the compression characteristics of the deep soil layers.
Figure 8.
The compression index and OCR of undisturbed loess and landslide deposit in different depths.
Figure 8.
The compression index and OCR of undisturbed loess and landslide deposit in different depths.
3.3. Dynamic Shear Modulus Characteristics
Loess has long been a focus of researchers due to its strong sensitivity to water and vulnerability to earthquakes, particularly in terms of its dynamic properties, such as the dynamic shear modulus. However, little research has been done on whether the dynamic properties of the deposited soil mass change significantly after experiencing a landslide.
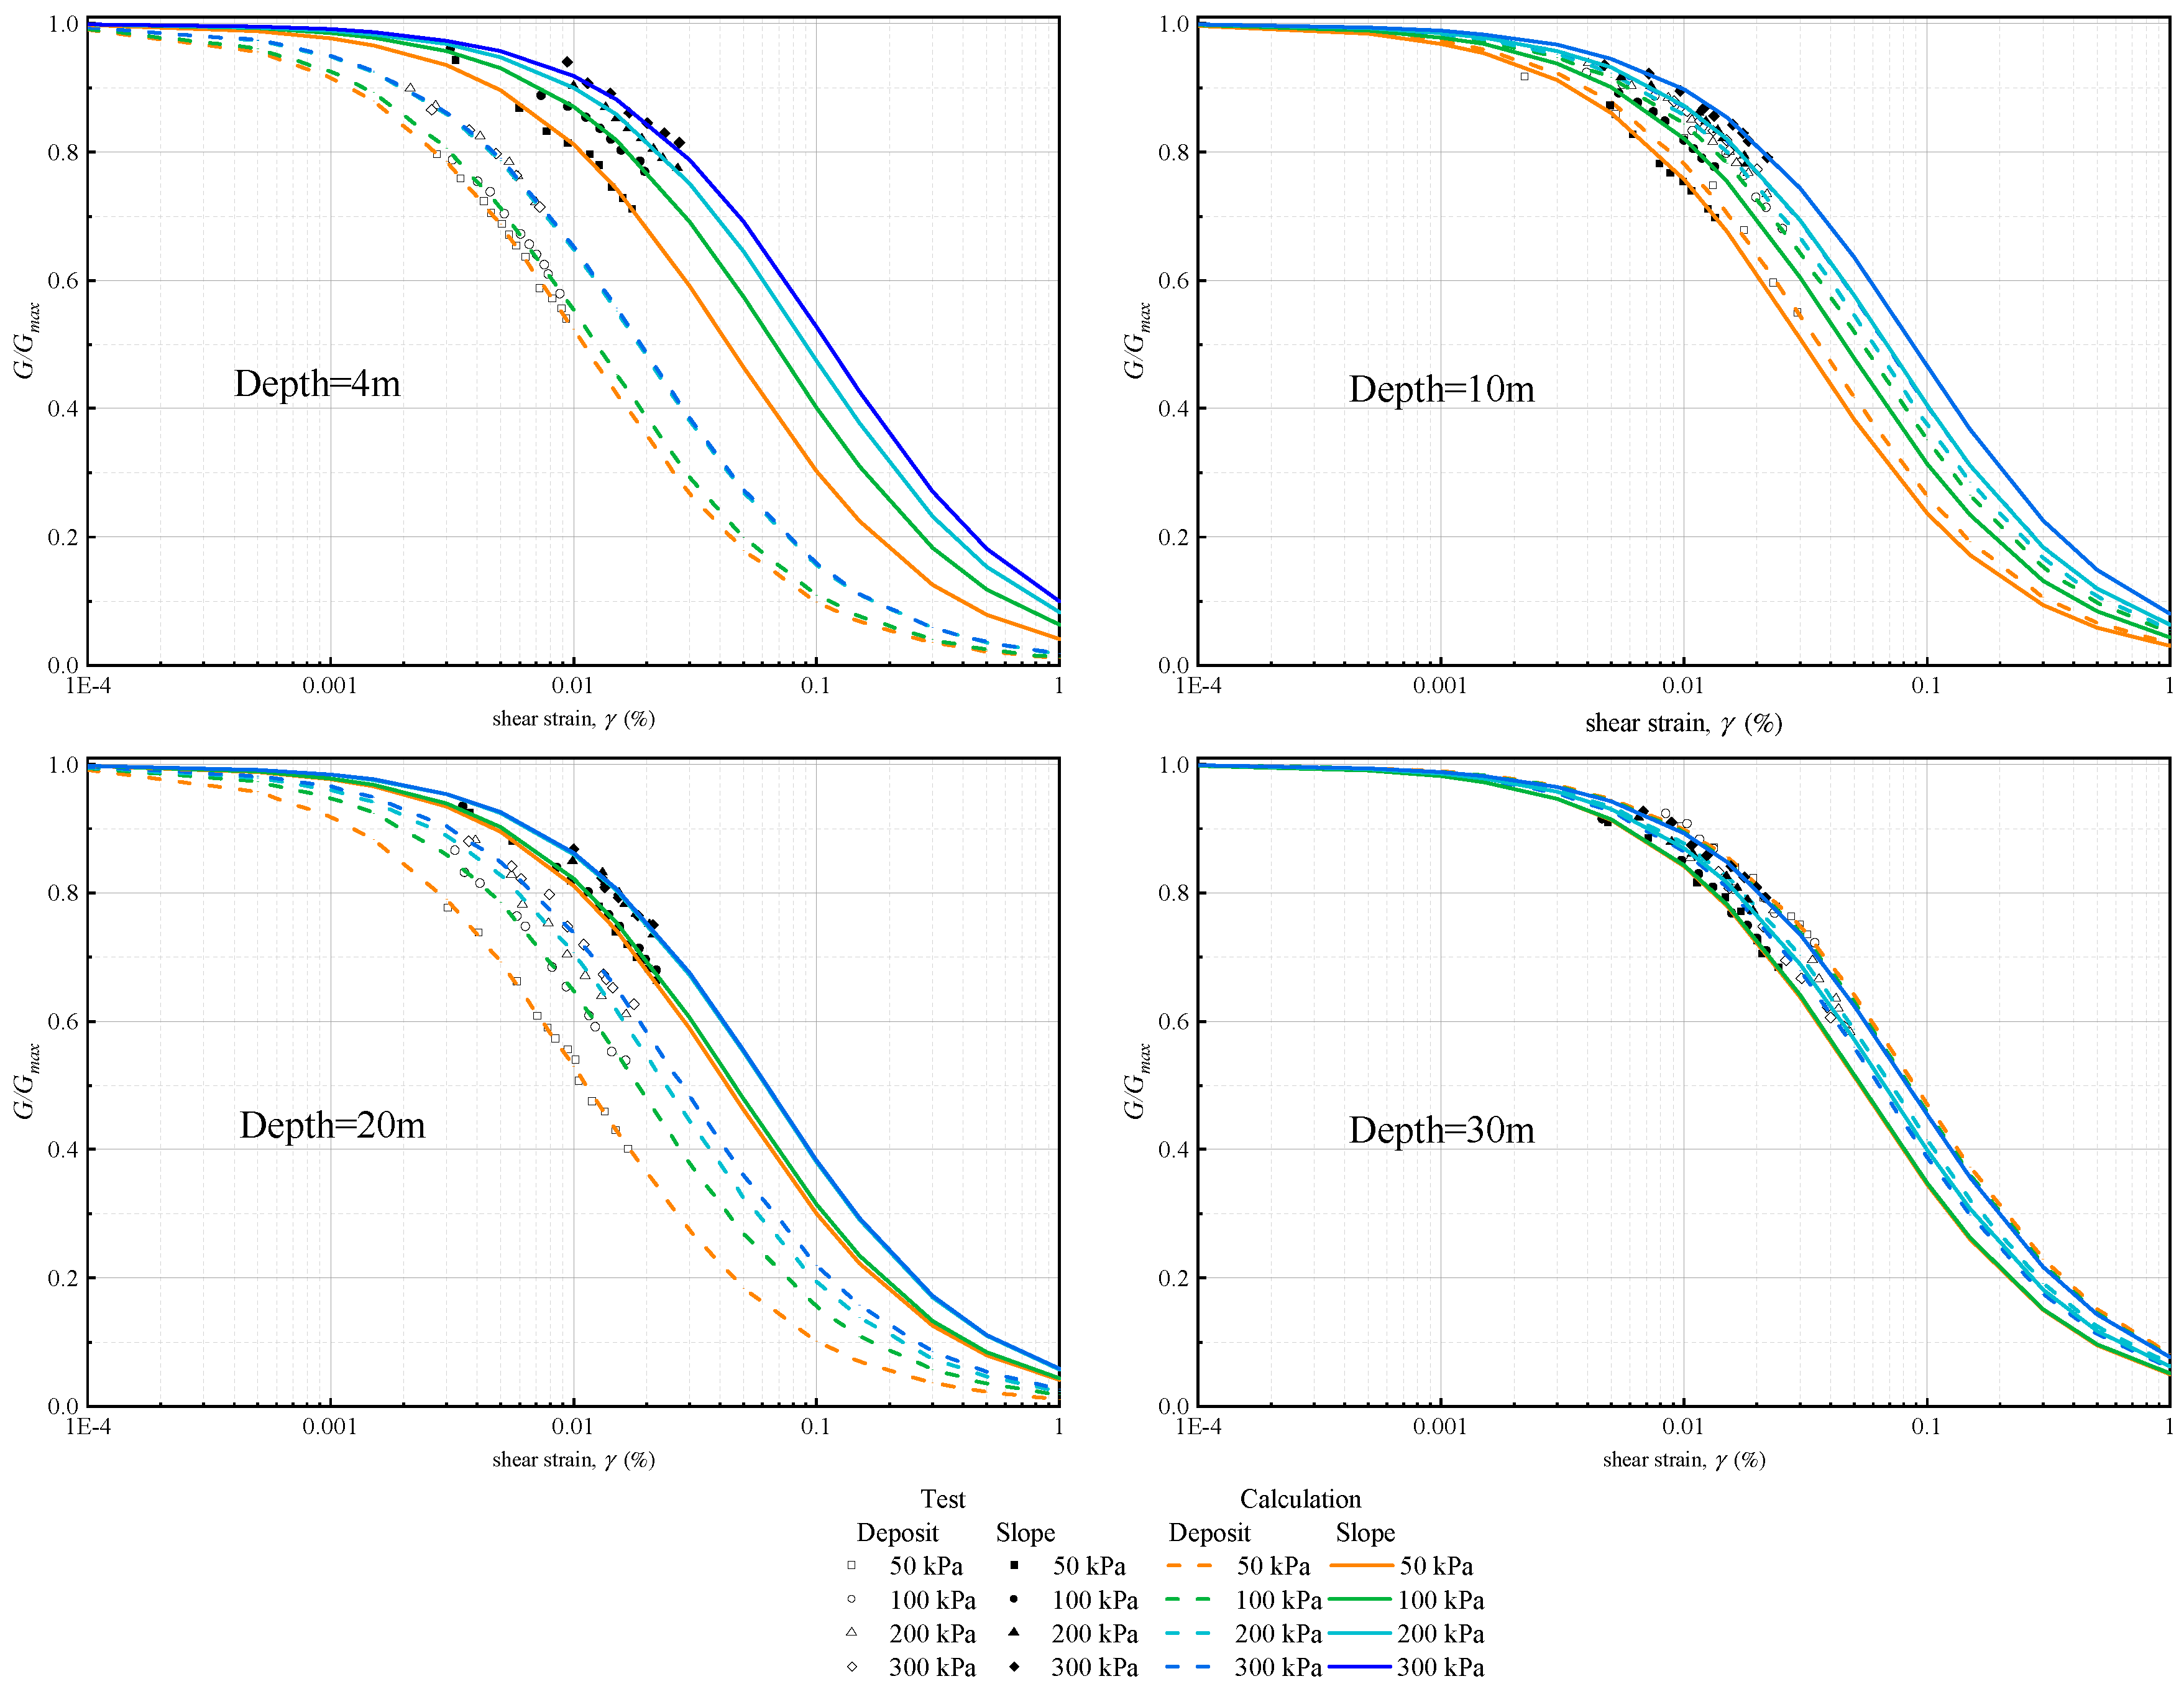
We normalized the results using G/G
max-γ, and the experimental and fitting results are shown in the
Figure 9 , soil samples of
D04,
D10,
D20,
D30 and
S04,
S10,
S20,
S30 were subjected to resonant column tests with varying confining pressures of 50, 100, 200, and 300 kPa. T The trends in the changes of loess and landslide deposits under different consolidation pressures were similar, with the attenuation rate slowing down as the confining pressure increased. The attenuation of intact loess was slower than that of landslide deposits at the same burial depth. The G/G
max-γ of intact loess had a larger variation range than that of landslide deposits under different confining pressures, indicating the pressure sensitivity of intact loess, especially at depths of 4m and 20m. At a depth of 30m, the curves for both the undisturbed loess and the landslide deposit are relatively similar.
The test results were processed using Hardin’s model [
33,
34] to obtain the maximum dynamic shear modulus (G
max) of the soil samples. As shown in the
Figure 10(a), both the undisturbed loess and the landslide deposit exhibit an increase in their dynamic shear modulus (G
max) with rising confining pressures. Nevertheless, across various depths, the G
max of the intact loess and the landslide deposit doesn’t exhibit significant differences in most cases. There is an exception in the S10 depth group, where the G
max is notably higher than the other depth groups. Within soil samples taken from different depths of both loess and landslide deposits, the rate of change in dynamic shear modulus with increasing confining pressure varies. Notably, for the intact loess with pronounced structural characteristics, the rate of change is slower in the upper layers compared to deeper layers when subjected to increasing confining pressures.
Furthermore, the Gmax acquired through the shear wave velocity method surpasses values obtained from conventional laboratory tests. This suggests that the shear wave velocity method is more sensitive and capable of providing a more accurate measurement of the maximum dynamic shear modulus of soil.
The moisture content is one of the key control factors for the maximum dynamic shear modulus of loess. Song’s [
35] experimental results showed that the maximum dynamic shear modulus of loess increased in three stages as the moisture content increased. When the moisture content of the loess is below its plastic limit, the dynamic shear modulus (G
max) decreases with increasing moisture content. When the moisture content of the loess approaches its plastic limit, G
max undergoes a sharp decrease, reaching its maximum attenuation rate. As the moisture content of the loess further increases and exceeds its plastic limit, the attenuation trend of G
max slows down and gradually stabilizes, even approaching saturation. Under low confining pressures, the initial dynamic shear modulus G
max of the intact loess exhibits relatively weak sensitivity to water content, but as the confining pressure increases, the water sensitivity of the loess becomes more pronounced.
In this study, as shown in the
Figure 10(b), when the moisture content of the intact loess is below its plastic limit, G
max initially increases and then rapidly decreases as the moisture content increases. With further increases in moisture content, the rate of G
max attenuation slows down, and G
max gradually stabilizes as it approaches saturation. This trend remains consistent under different confining pressures. However, the landslide deposit is less sensitive to changes in moisture content, and the attenuation trend of G
max is relatively gradual. Regardless of the confining pressure, the G
max of the landslide deposit is greater than that of the intact loess at the same moisture content. The results indicate that the sensitivity of the landslide deposit to moisture content is weaker compared to intact loess. This difference in sensitivity could be attributed to variations in material composition, particle arrangement, and structural characteristics of the deposit.
Figure 9.
Dynamic shear modulus ratio and dynamic shear strain curve of undisturbed loess and landslide deposit in different depths.
Figure 9.
Dynamic shear modulus ratio and dynamic shear strain curve of undisturbed loess and landslide deposit in different depths.
Figure 10.
(a) mean effective confining pressure with the maximum dynamic shear modulus (Gmax) of undisturbed loess and landslide deposit (b) water content w (%) with the maximum dynamic shear modulus (Gmax) of undisturbed loess and landslide deposit.
Figure 10.
(a) mean effective confining pressure with the maximum dynamic shear modulus (Gmax) of undisturbed loess and landslide deposit (b) water content w (%) with the maximum dynamic shear modulus (Gmax) of undisturbed loess and landslide deposit.
The G
max of soil is a crucial parameter for assessing the deformation and failure characteristics of soil under dynamic loading. It holds significant importance in various fields including engineering design, seismic disaster prediction, underground structure design, and foundation engineering. It is closely related to factors such as soil porosity, confining pressure, and the OCR. A Power empirical equation were developed by Hardin and Black [
36] and Hardin [
37], which considers the influence of pressure, void ratio and over-consolidation ratio on G
max:
where
is effective mean normal stress (kPa),
is atmospheric pressure(kPa),
k is the function of the plasticity index
, When
=0, 20, 40, 60, 80 and ≥100,
k= 0.0, 0.18, 0.31, 0.41, 0.48 and 0.5. Considering the fact that the over-consolidation characteristics of the undisturbed loess are irrelevant to the stress history, and no additional OCR issue is required, therefore, the OCR values of the undisturbed loess are all 1. In addition, the soil at 4m of landslide deposit also exhibits the over-consolidation characteristics which are still related to its structural properties, and thus the OCR value is also 1.
The fitting results for the undisturbed loess and landslide deposit are obtained, as shown in
Table 3. The differences in A and m values of undisturbed loess with depth reflect the longitudinal variability of soil properties. The A and m values of the landslide deposit exhibit relatively uniform changes, continuously increasing with depth and water content. In comparison to undisturbed loess, the A and m values of the landslide deposit have undergone significant variations longitudinally, characterized by a noticeable increase in A value. Notably, the m value is smaller than that of shallow-depth, low-water content undisturbed loess and larger than that of deep-depth, high-water content undisturbed loess.
Table 3.
Fitting parameters of Hardin and Black equation for undisturbed loess and landslide deposit.
Table 3.
Fitting parameters of Hardin and Black equation for undisturbed loess and landslide deposit.
| Sample |
Water content (%) |
OCR |
k |
A |
m |
Correlation coefficient R2 |
| S04 |
4.91 |
5.36 |
|
1322 |
0.1820 |
0.994 |
| S10 |
5.33 |
1.79 |
|
2869 |
0.1895 |
0.993 |
| S20 |
11.39 |
1.28 |
|
2002 |
0.3563 |
0.987 |
| S30 |
24.5 |
0.92 |
|
2008 |
0.3875 |
0.998 |
| D04 |
10.9 |
3.71 |
|
2802 |
0.2685 |
0.987 |
| D10 |
12.49 |
0.92 |
0.12 |
3224 |
0.2773 |
0.954 |
| D20 |
17.89 |
0.48 |
0.13 |
3570 |
0.2873 |
0.993 |
| D30 |
18.7 |
0.30 |
0.12 |
4263 |
0.2882 |
0.992 |
The correlation coefficient of the fitting results indicates that the predicted parameters are reasonable, and these parameters can provide references for the maximum dynamic shear modulus of soils at different depths in this region.

