3.1. Theoretical foundations and research hypotheses
Research hypotheses Urban areas face a variety of climate change-related hazards, such as intensifying weather patterns and extreme weather events. These risks affect city systems through the exposure and vulnerability pathways. Exposure is a measure of a city's vulnerability to climate events, reflecting the adverse effects of climate change risks, including economic losses, and so on. It is widely acknowledged that higher exposure magnifies the magnitude of climate risk impacts on cities, underscoring the critical importance of this metric. The term "vulnerability" refers to a city's exposure to climate risk. A higher vulnerability can exacerbate loss in the event of a meteorological disaster, making it crucial to decrease vulnerability to climate change. This is an essential proactive adaptation measure for human society. Resilience assesses a city's capacity to recover to its previous state following a climate event. The fifth report of the IPCC highlights the efficacy of bolstering climate resilience and pursuing a route of green and sustainable development in order to adapt to and alleviate the threats of climate change while also diminishing its risk. Therefore, city managers must integrate climate change adaptation policies into the urban planning process and make reducing exposure and vulnerability to meteorological hazards along with enhancing urban resilience primary objectives in urban public infrastructure and social security systems.[
19] This study merges current research with established urban planning policies to develop a framework for climate change adaptation. Based on this, the study combines existing research results to develop a climate resilience assessment system for 270 major cities in China, including exposure, vulnerability, and resilience indicators.
Fiscal policy is a crucial tool when it comes to enhancing the climate resilience of cities. Prevailing research findings generally concur that fiscal policy plays an indispensable role in tackling climate change. Governments across the globe face a shared challenge in how to optimize fiscal expenditures, foster positive collaboration between the government and market forces, and encourage mitigation and adaptation to the perils of climate change in urban areas[
20]. Fiscal policy is commonly used worldwide as a crucial tool for mitigating and dispersing climate change risks through innovative fiscal policy[
21]. It can help prevent climate change risks by offering incentives, synergies, and compensation mechanisms. Furthermore, it can contribute towards mitigating and adapting to climate change, enhancing the synergy between urban public policies and public service systems, effectively addressing the financial challenges of tackling climate change, reducing the costs associated with implementing public service policies, and strengthening the fundamental public service system in urban areas. The urban public service system comprises several key components. On one hand, fiscal policy incentivizes cities to lower pollutant emissions through taxation, transfer payments, and financial expenditures[
22]. Additionally, it mitigates conversion costs for cities adapting to climate change, speeds up the green transformation of cities, and helps achieve regional ecological protection and green development. Furthermore, fiscal policy aims to reduce the physical risks stemming from regional climate change[
23]. Below are some measures that may be taken to diminish the physical risks linked to regional climate change. On the contrary, financial outlays can lower city exposure to climate change hazards and limit economic, social, and environmental detriments by encouraging the creation of urban infrastructure and enhancing public amenities and social welfare schemes, thereby advancing the climate hardiness of cities.[
24] Overall, fiscal policy forms a crucial component of urban climate resiliency. In conclusion, fiscal policy serves as a critical tool for developing urban climate resilience systems. Ensuring a reasonable and adequate budget allocation and optimizing financial resource allocation are vital factors for enhancing the climate resilience of cities. The preceding discussion gives rise to the following research hypotheses:
H1:Local government spending has a substantial impact on the resilience of cities to climate change, and increasing such spending can greatly enhance this resilience.
The degree of urbanization offers robust backing for urban development and the National Development and Reform Commission has highlighted the great influence urbanization has on economic, social, ecological and infrastructure resilience of cities. Although it is widely acknowledged that the urbanization rate contributes to the construction of an urban resilience system in a broader sense by improving urban infrastructure, optimizing the urban industrial structure and enhancing urban economic strength, in terms of climate resilience, the increase in the urbanization rate may also lead to the consequences of increasing urban population density, intensifying pressure on public infrastructure, and deteriorating the ecology of the urban area. This may make the city increasingly vulnerable in the process of adapting to climate change. The susceptibility of urban areas to the effects of climate change is on the rise. The 2020 United Nations World Social Development Report notes that uncontrolled urban growth can result in congestion, pollution, social inequality, and insufficient public services thereby failing to ensure a minimum quality of life for all citizens.[
25] This phenomenon is partially explained by the inverted U-shaped relationship between urbanization rate and fiscal expenditure, suggesting that in later stages of urban development, with increasing income gaps amongst urban residents, the marginal effect of fiscal expenditure on urban GDP diminishes. Furthermore, the expansion of the urban population size adversely affects the living standards of urban residents instead. Based on the aforementioned conclusions, this paper aims to investigate the moderating impact of the urbanization rate on fiscal expenditure and its ability to boost urban climate resilience. This will be achieved through constructing a moderating effect model and proposing competing hypotheses as follows:
H2a: The urbanization rate positively moderates and strengthens the effect of fiscal expenditure on urban climate resilience.
H2b: The rate of urbanization has a moderating effect, which is negative, and counteracts the enhancing effect of fiscal expenditure on the resilience of urban climate.
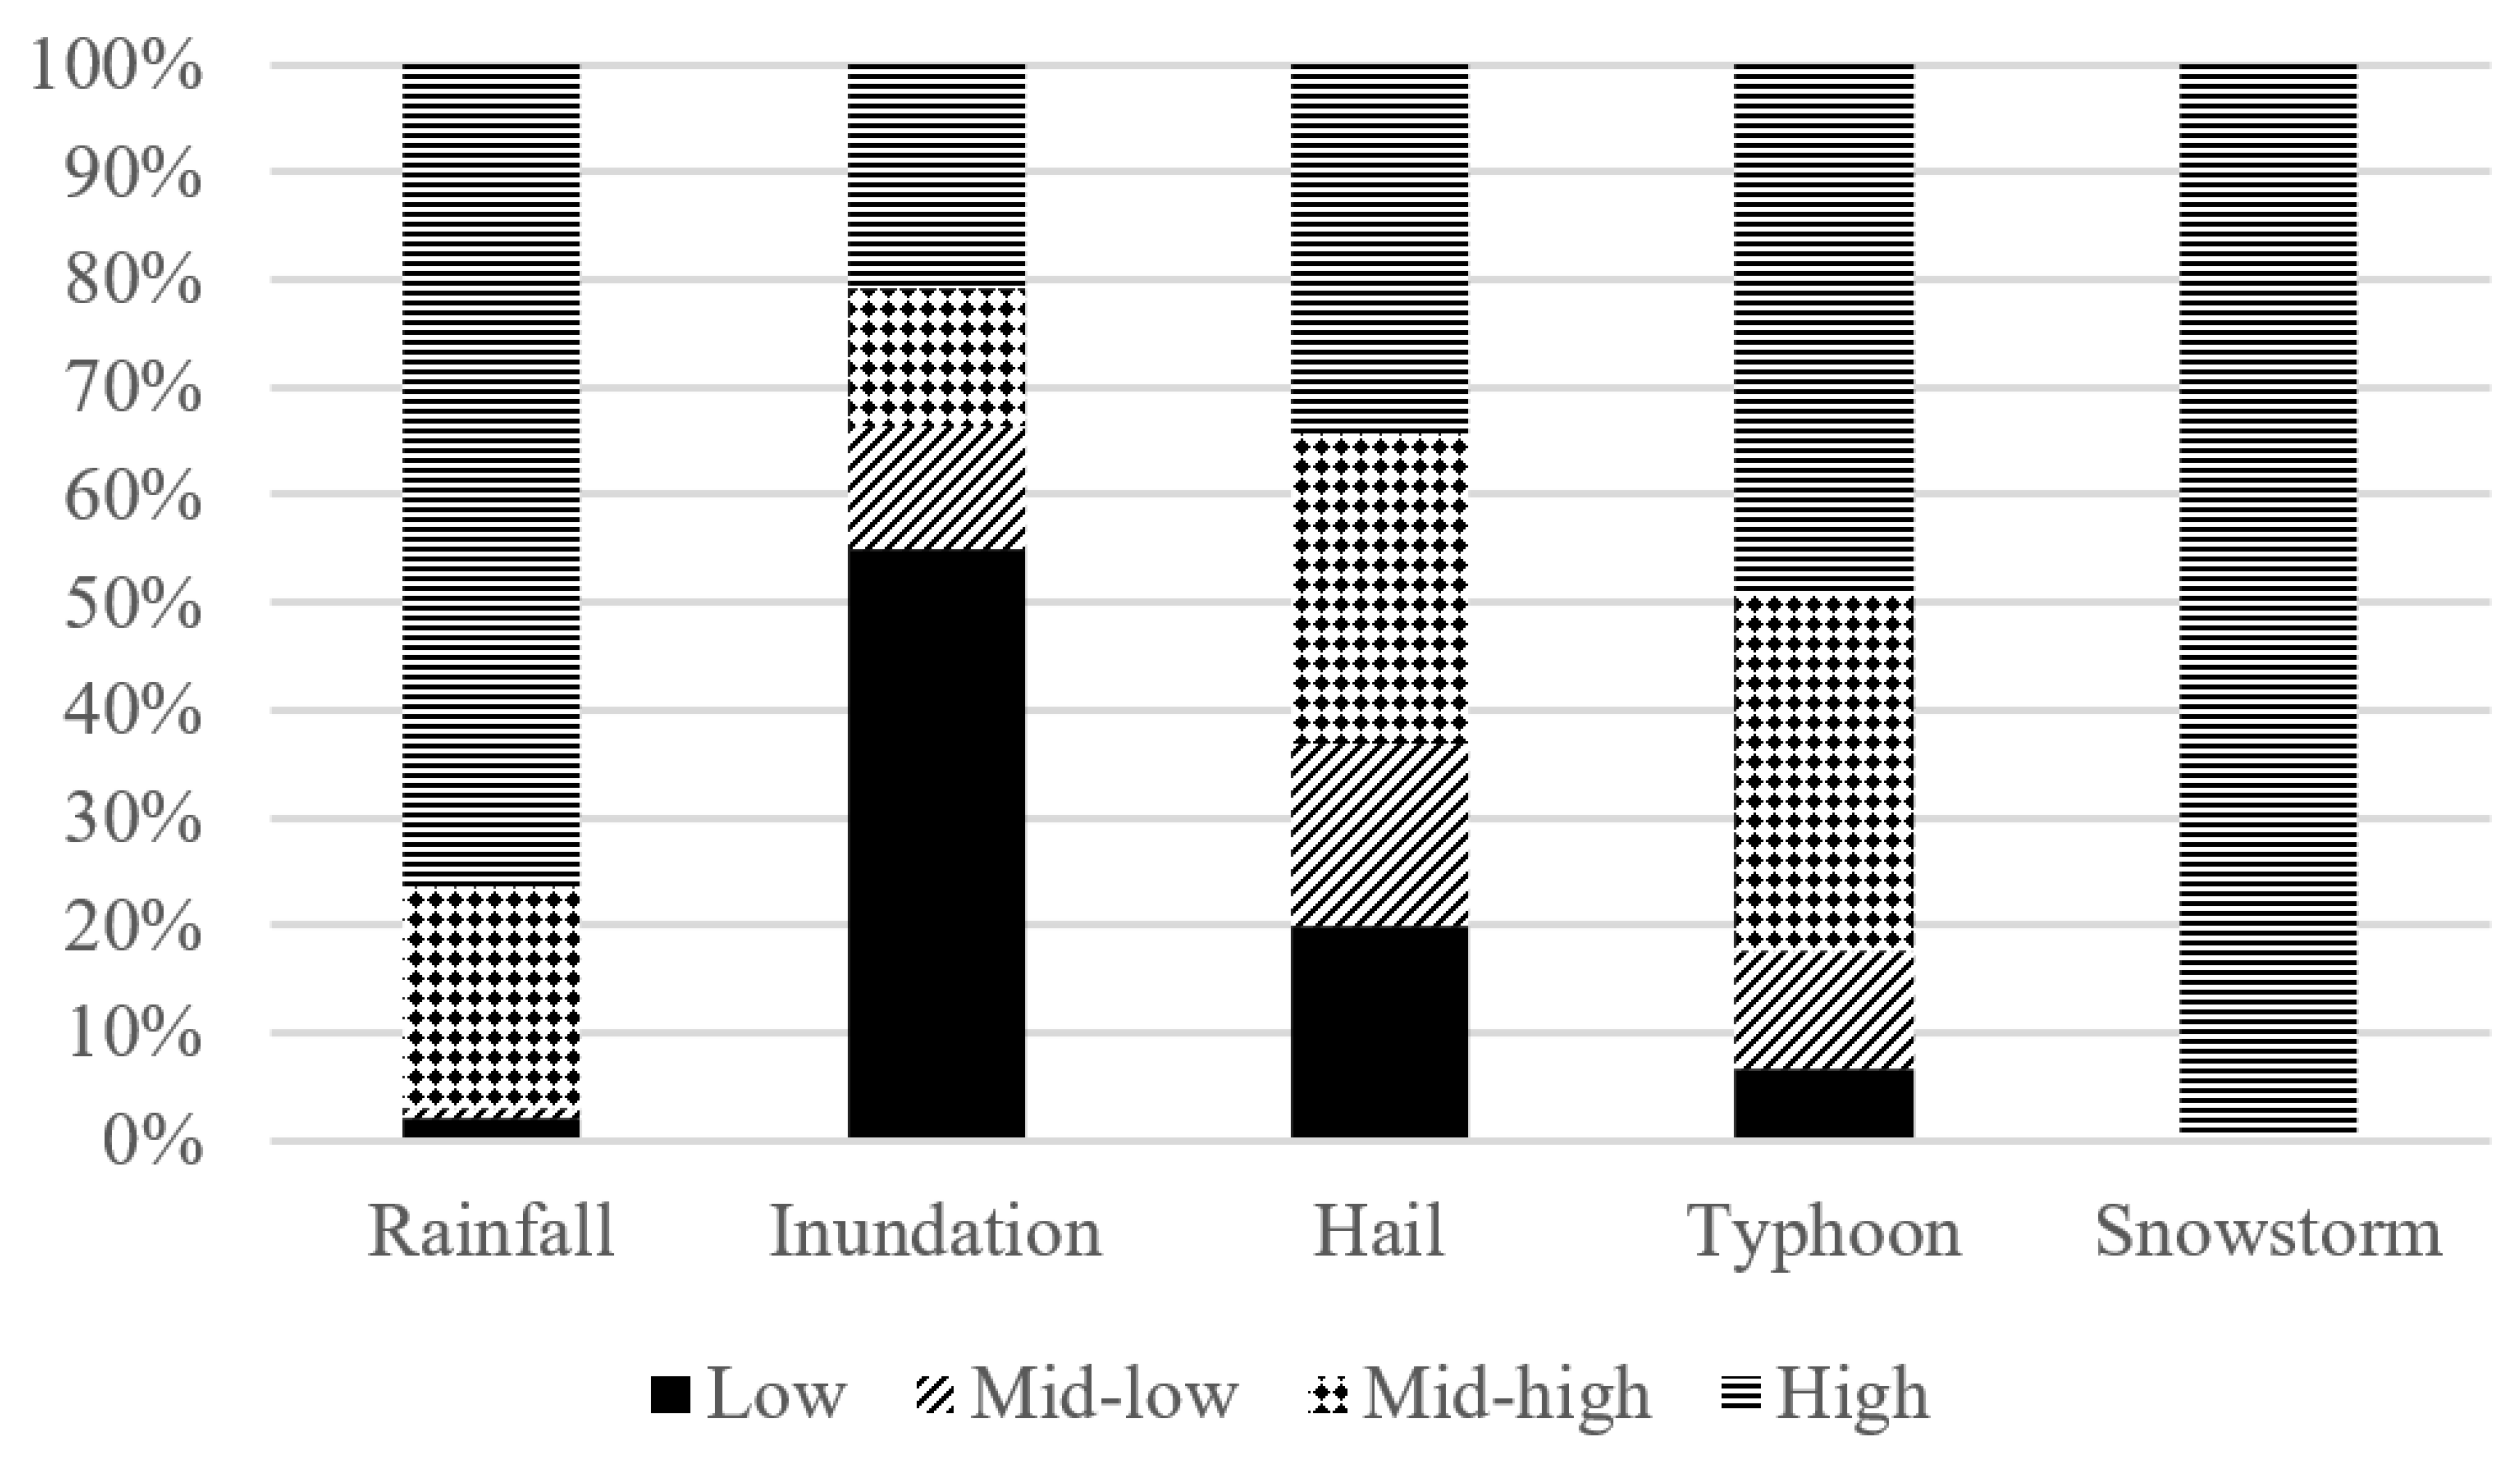
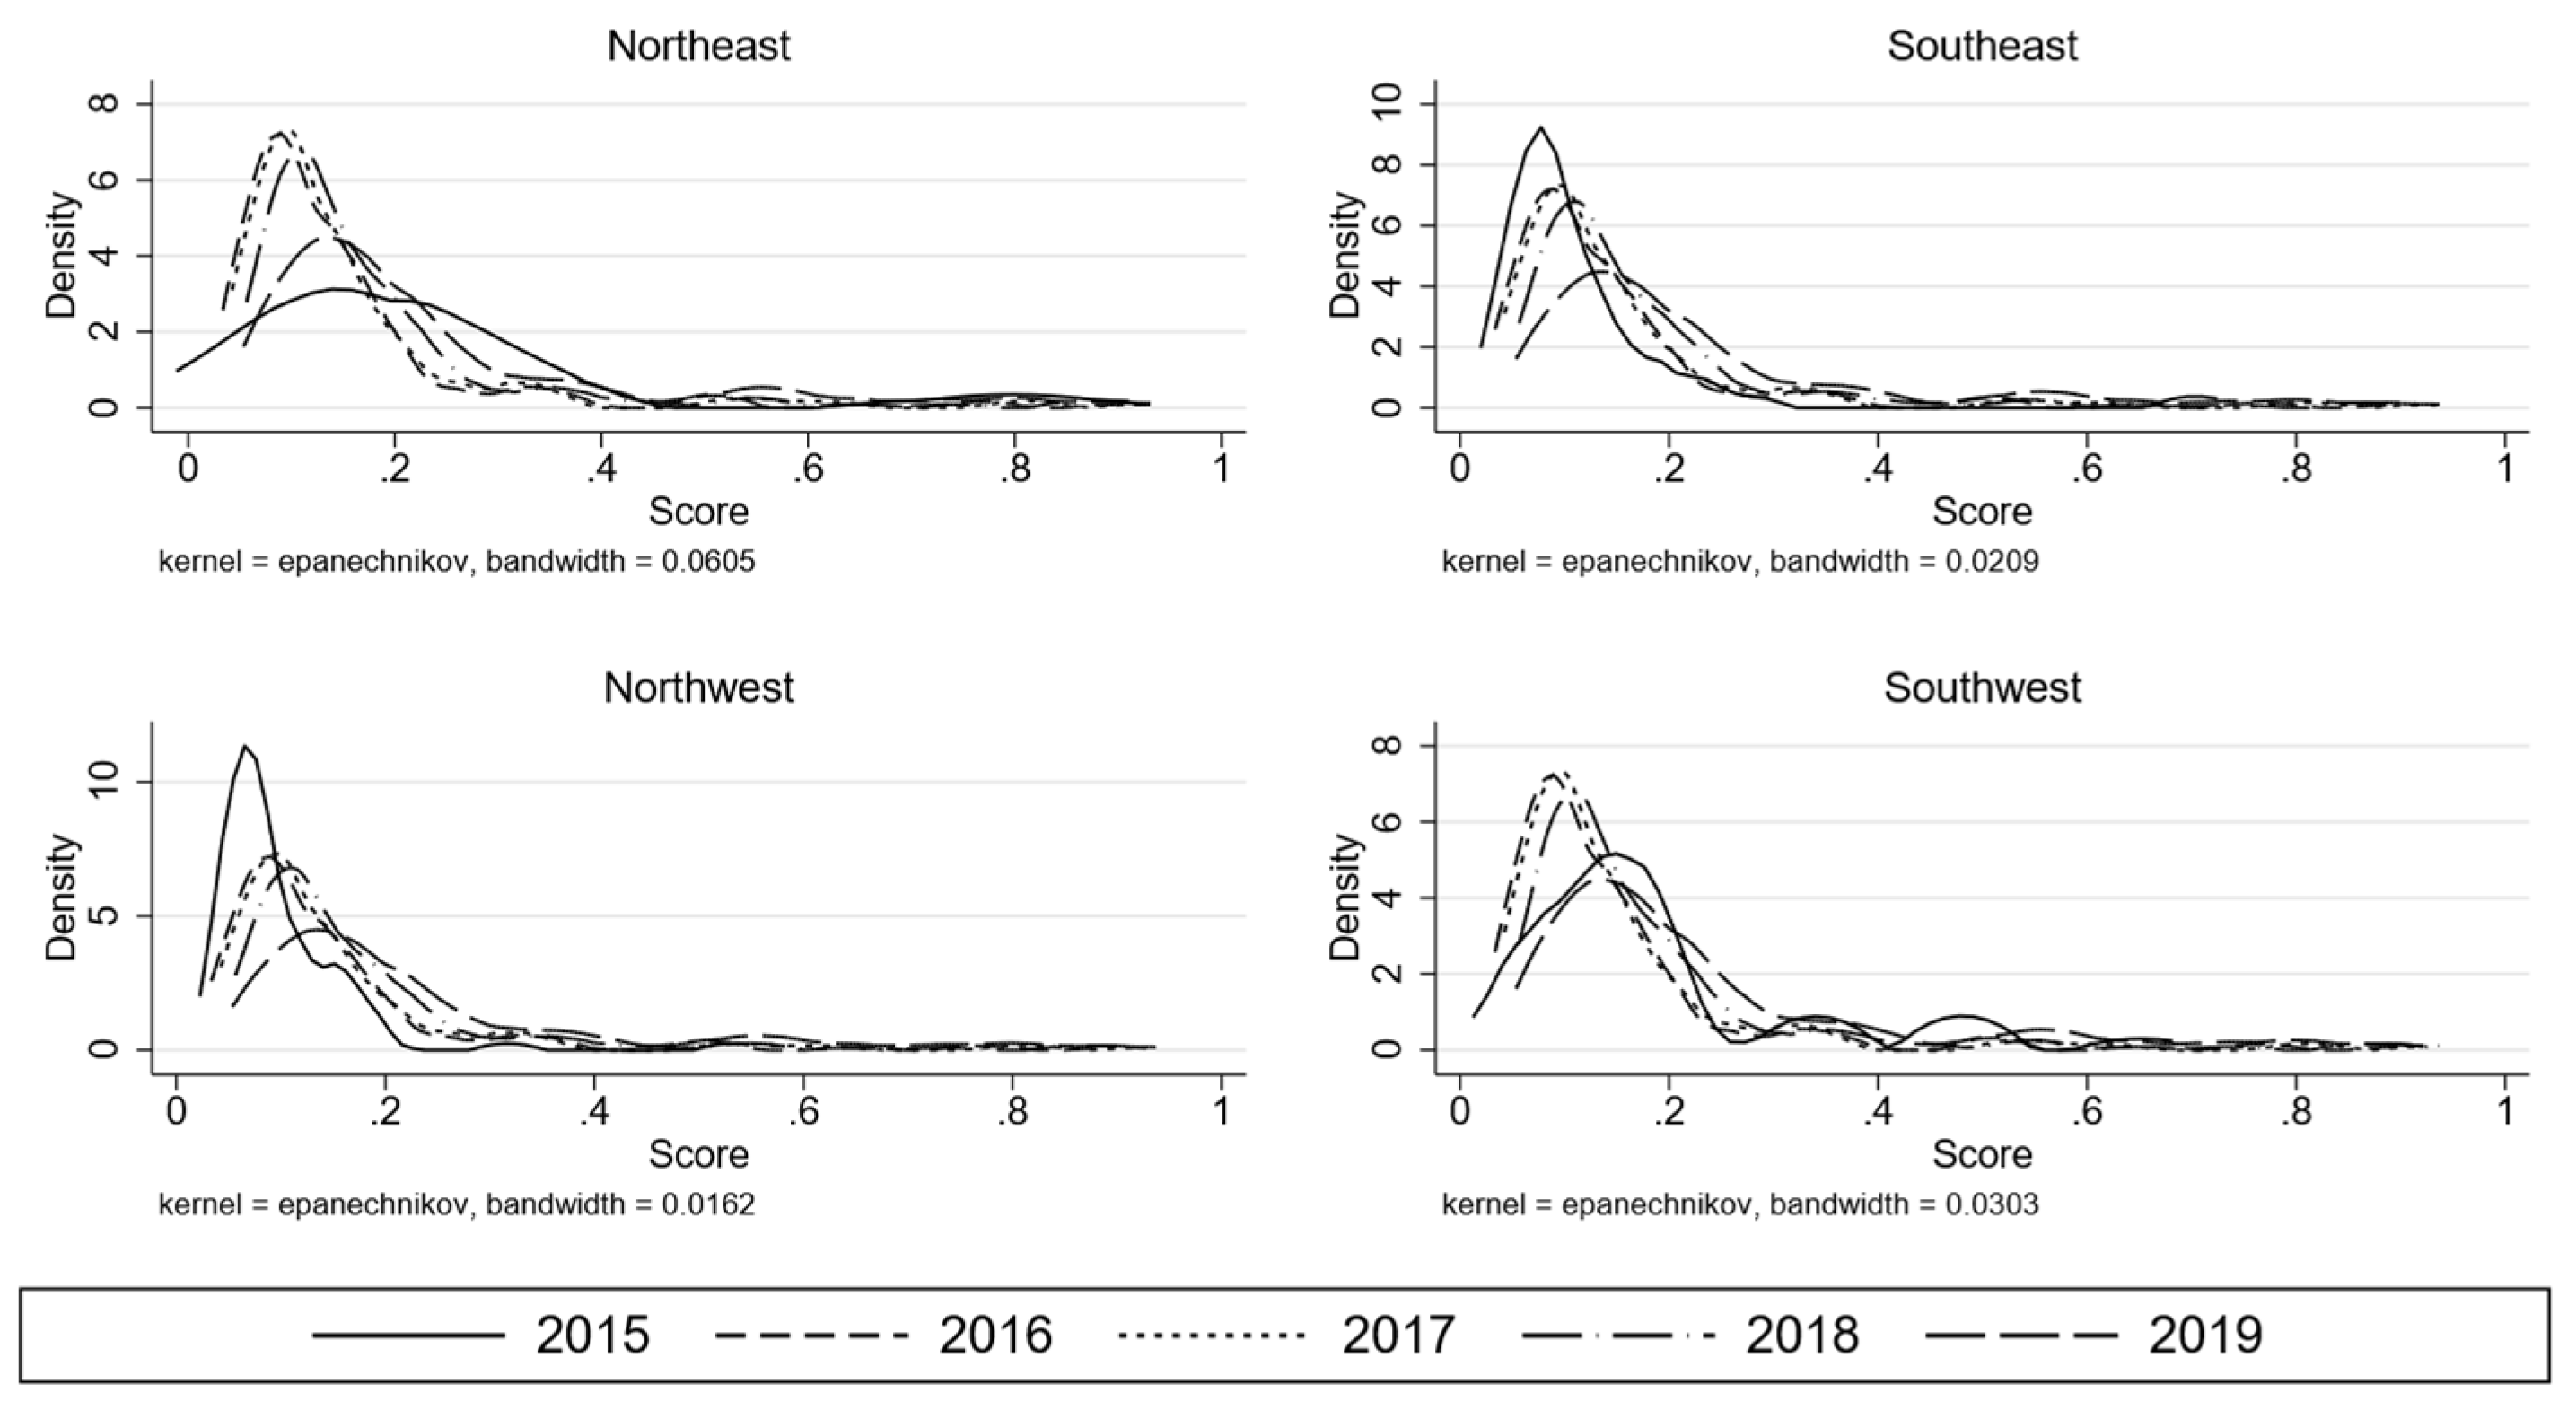
With China's extensive territory and the varied distribution of its cities, significant climatic and environmental differences exist between them. Moreover, the varying levels of economic development and sizes of urban populations necessitate the consideration of diverse levels of heterogeneity when measuring and analyzing urban climate resilience. Therefore, this paper aims to examine meteorological disaster data in various major cities throughout the country. It will analyze the dominant types of meteorological disasters in each city, based on their frequency and the resulting economic losses. This will serve as the foundation for assessing the climate resilience of 270 major cities in the country across five dimensions. Namely, the resilience of cities against rainfall, flooding, hail, typhoon, and snowstorm is evaluated. The climate resilience of the cities in each category is determined using the entropy weighting method.
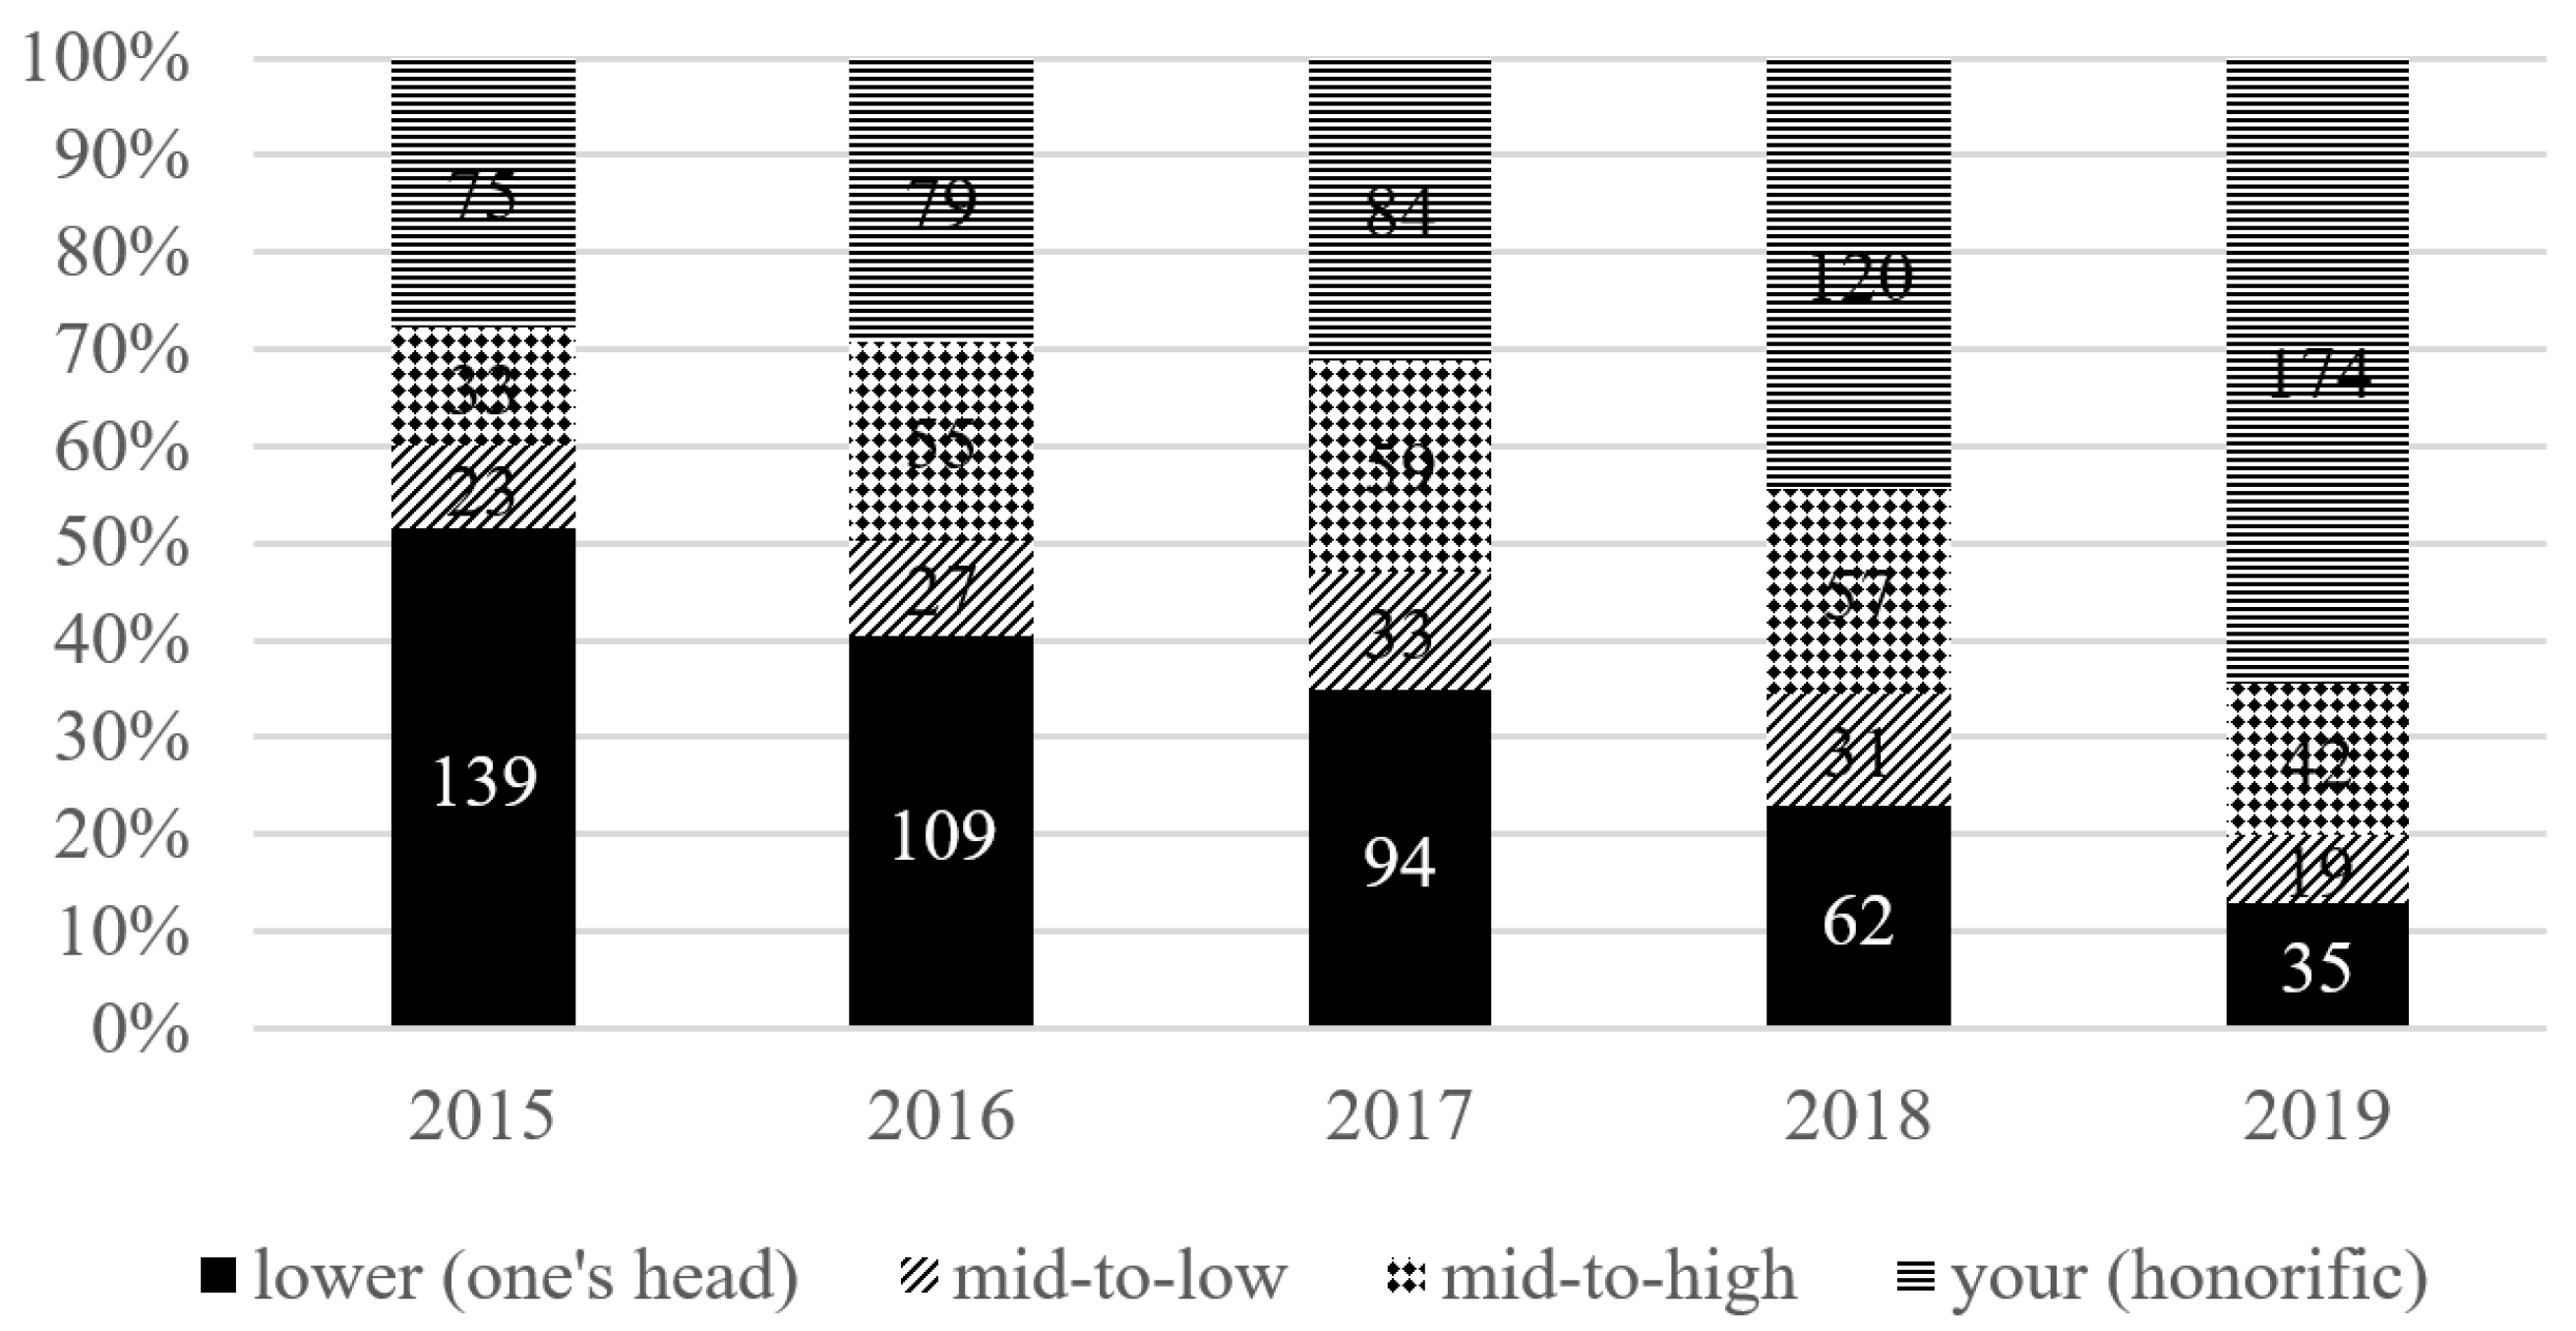
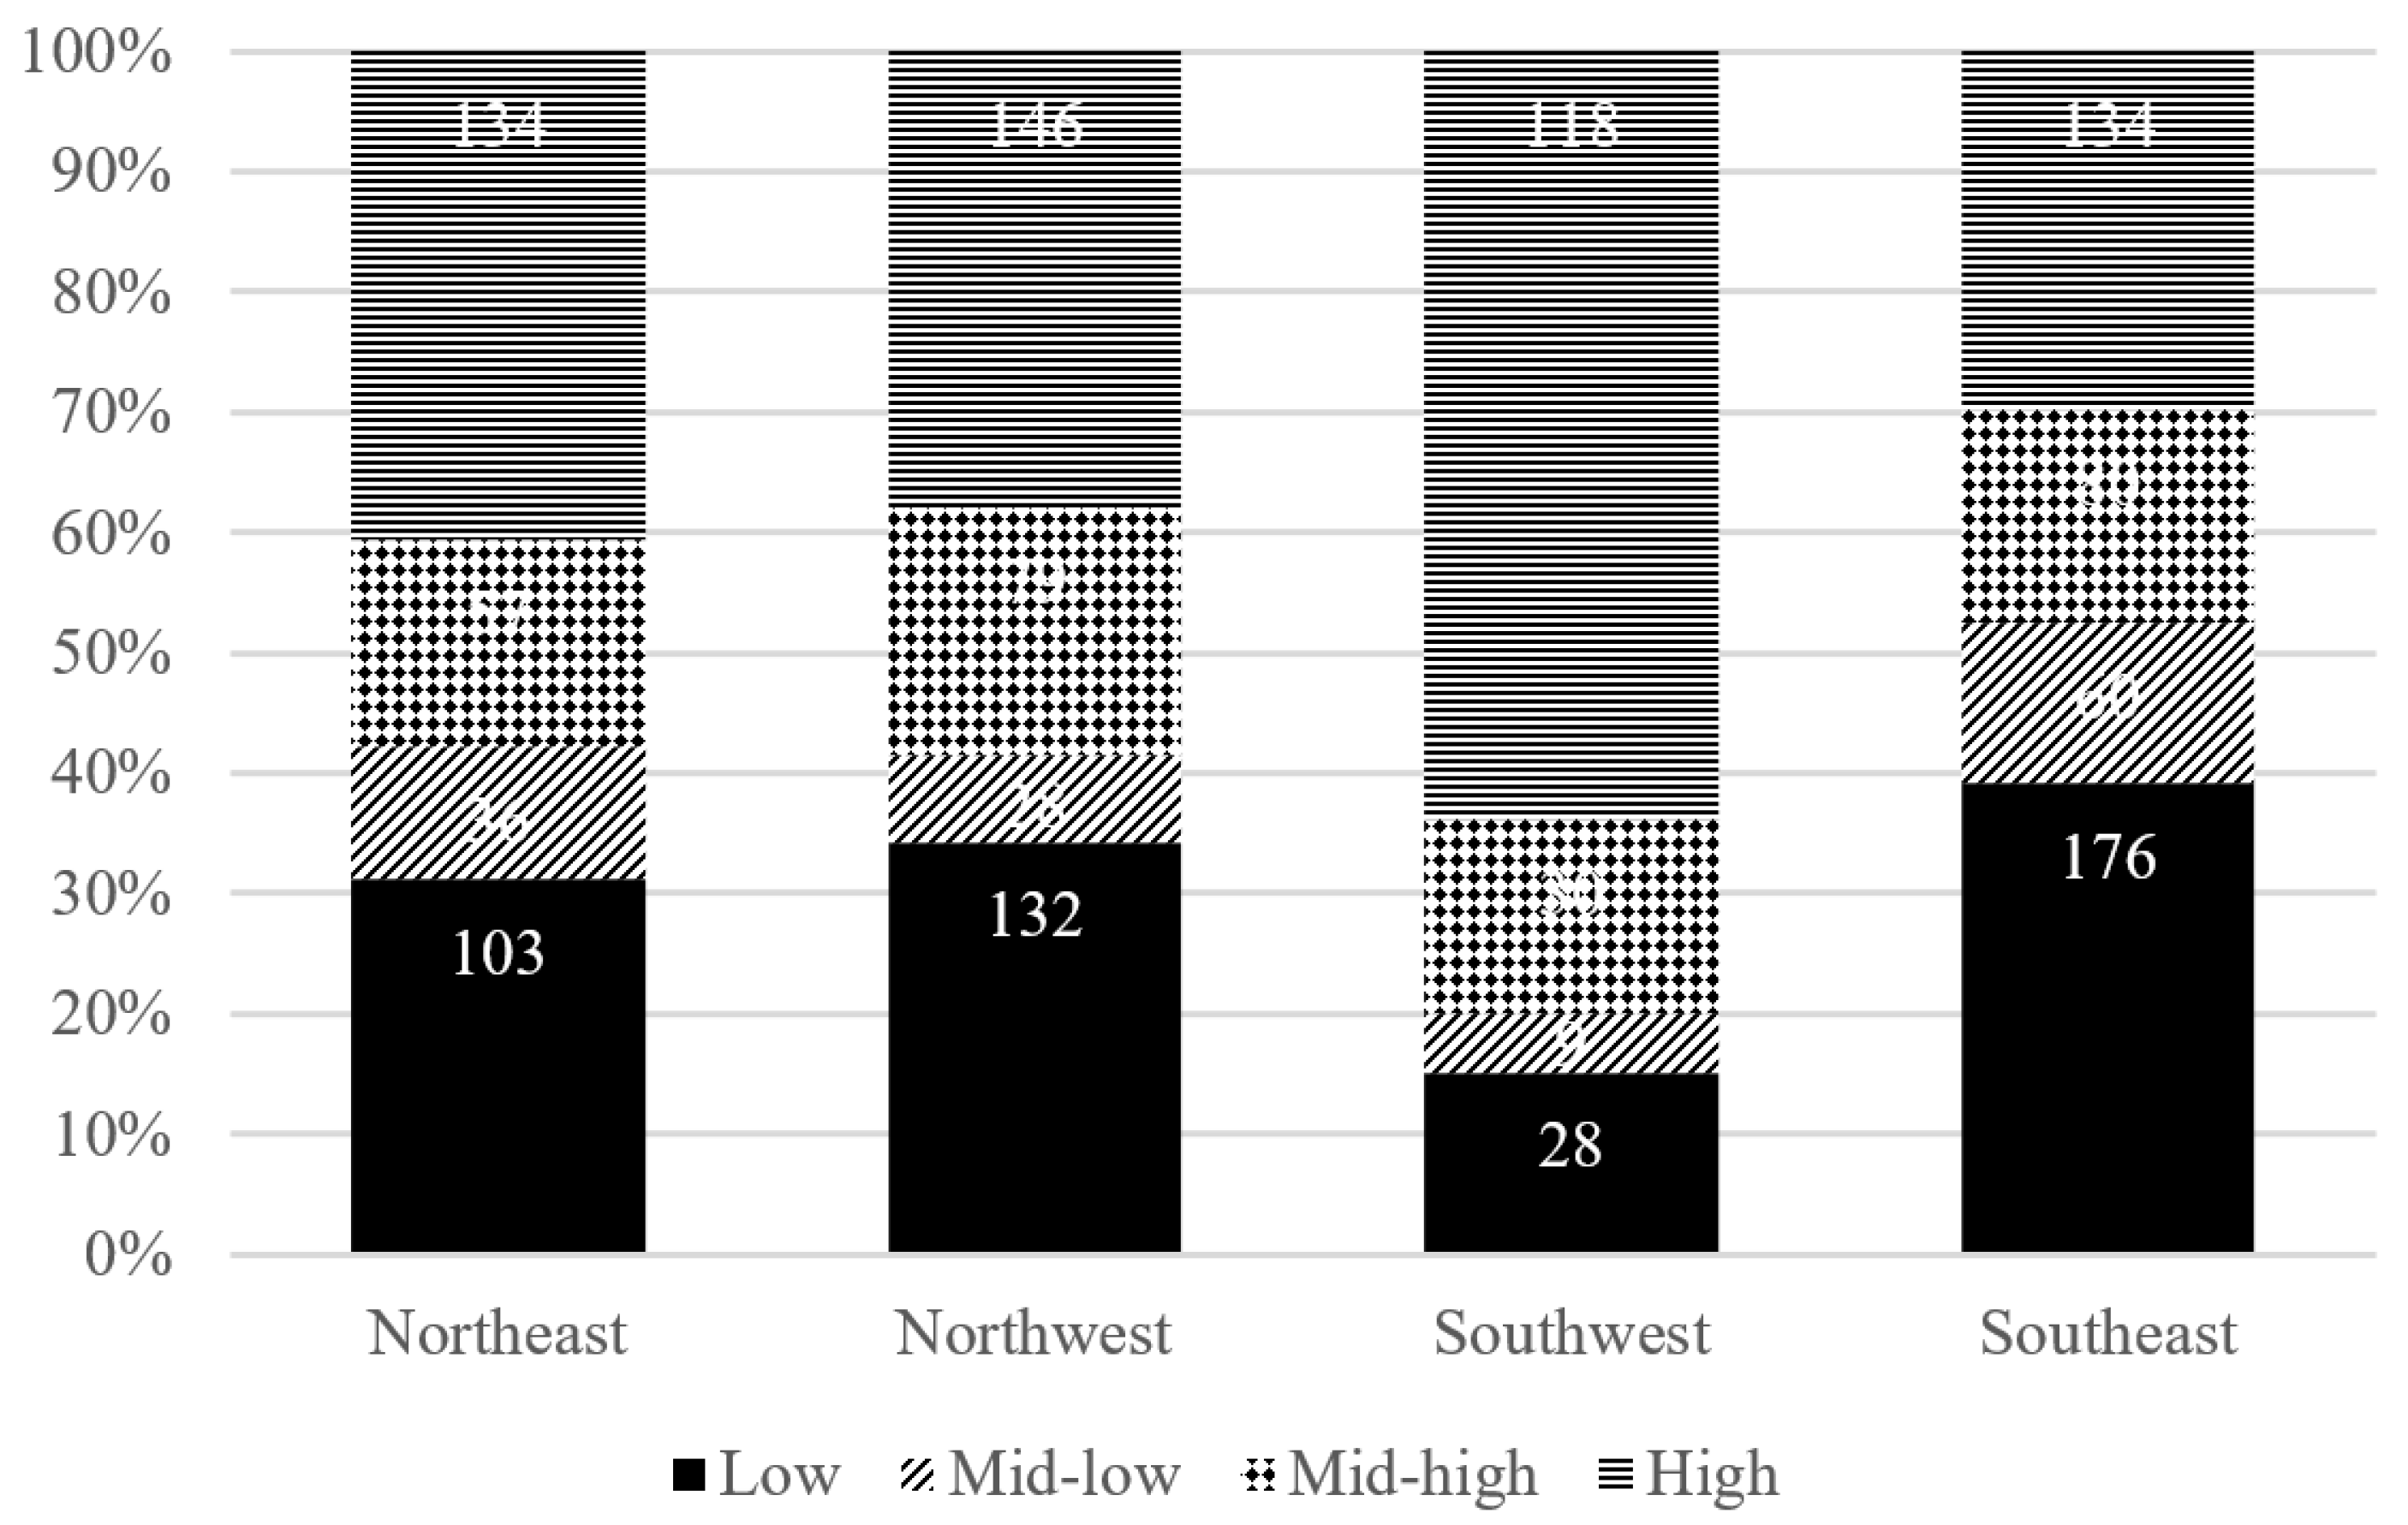
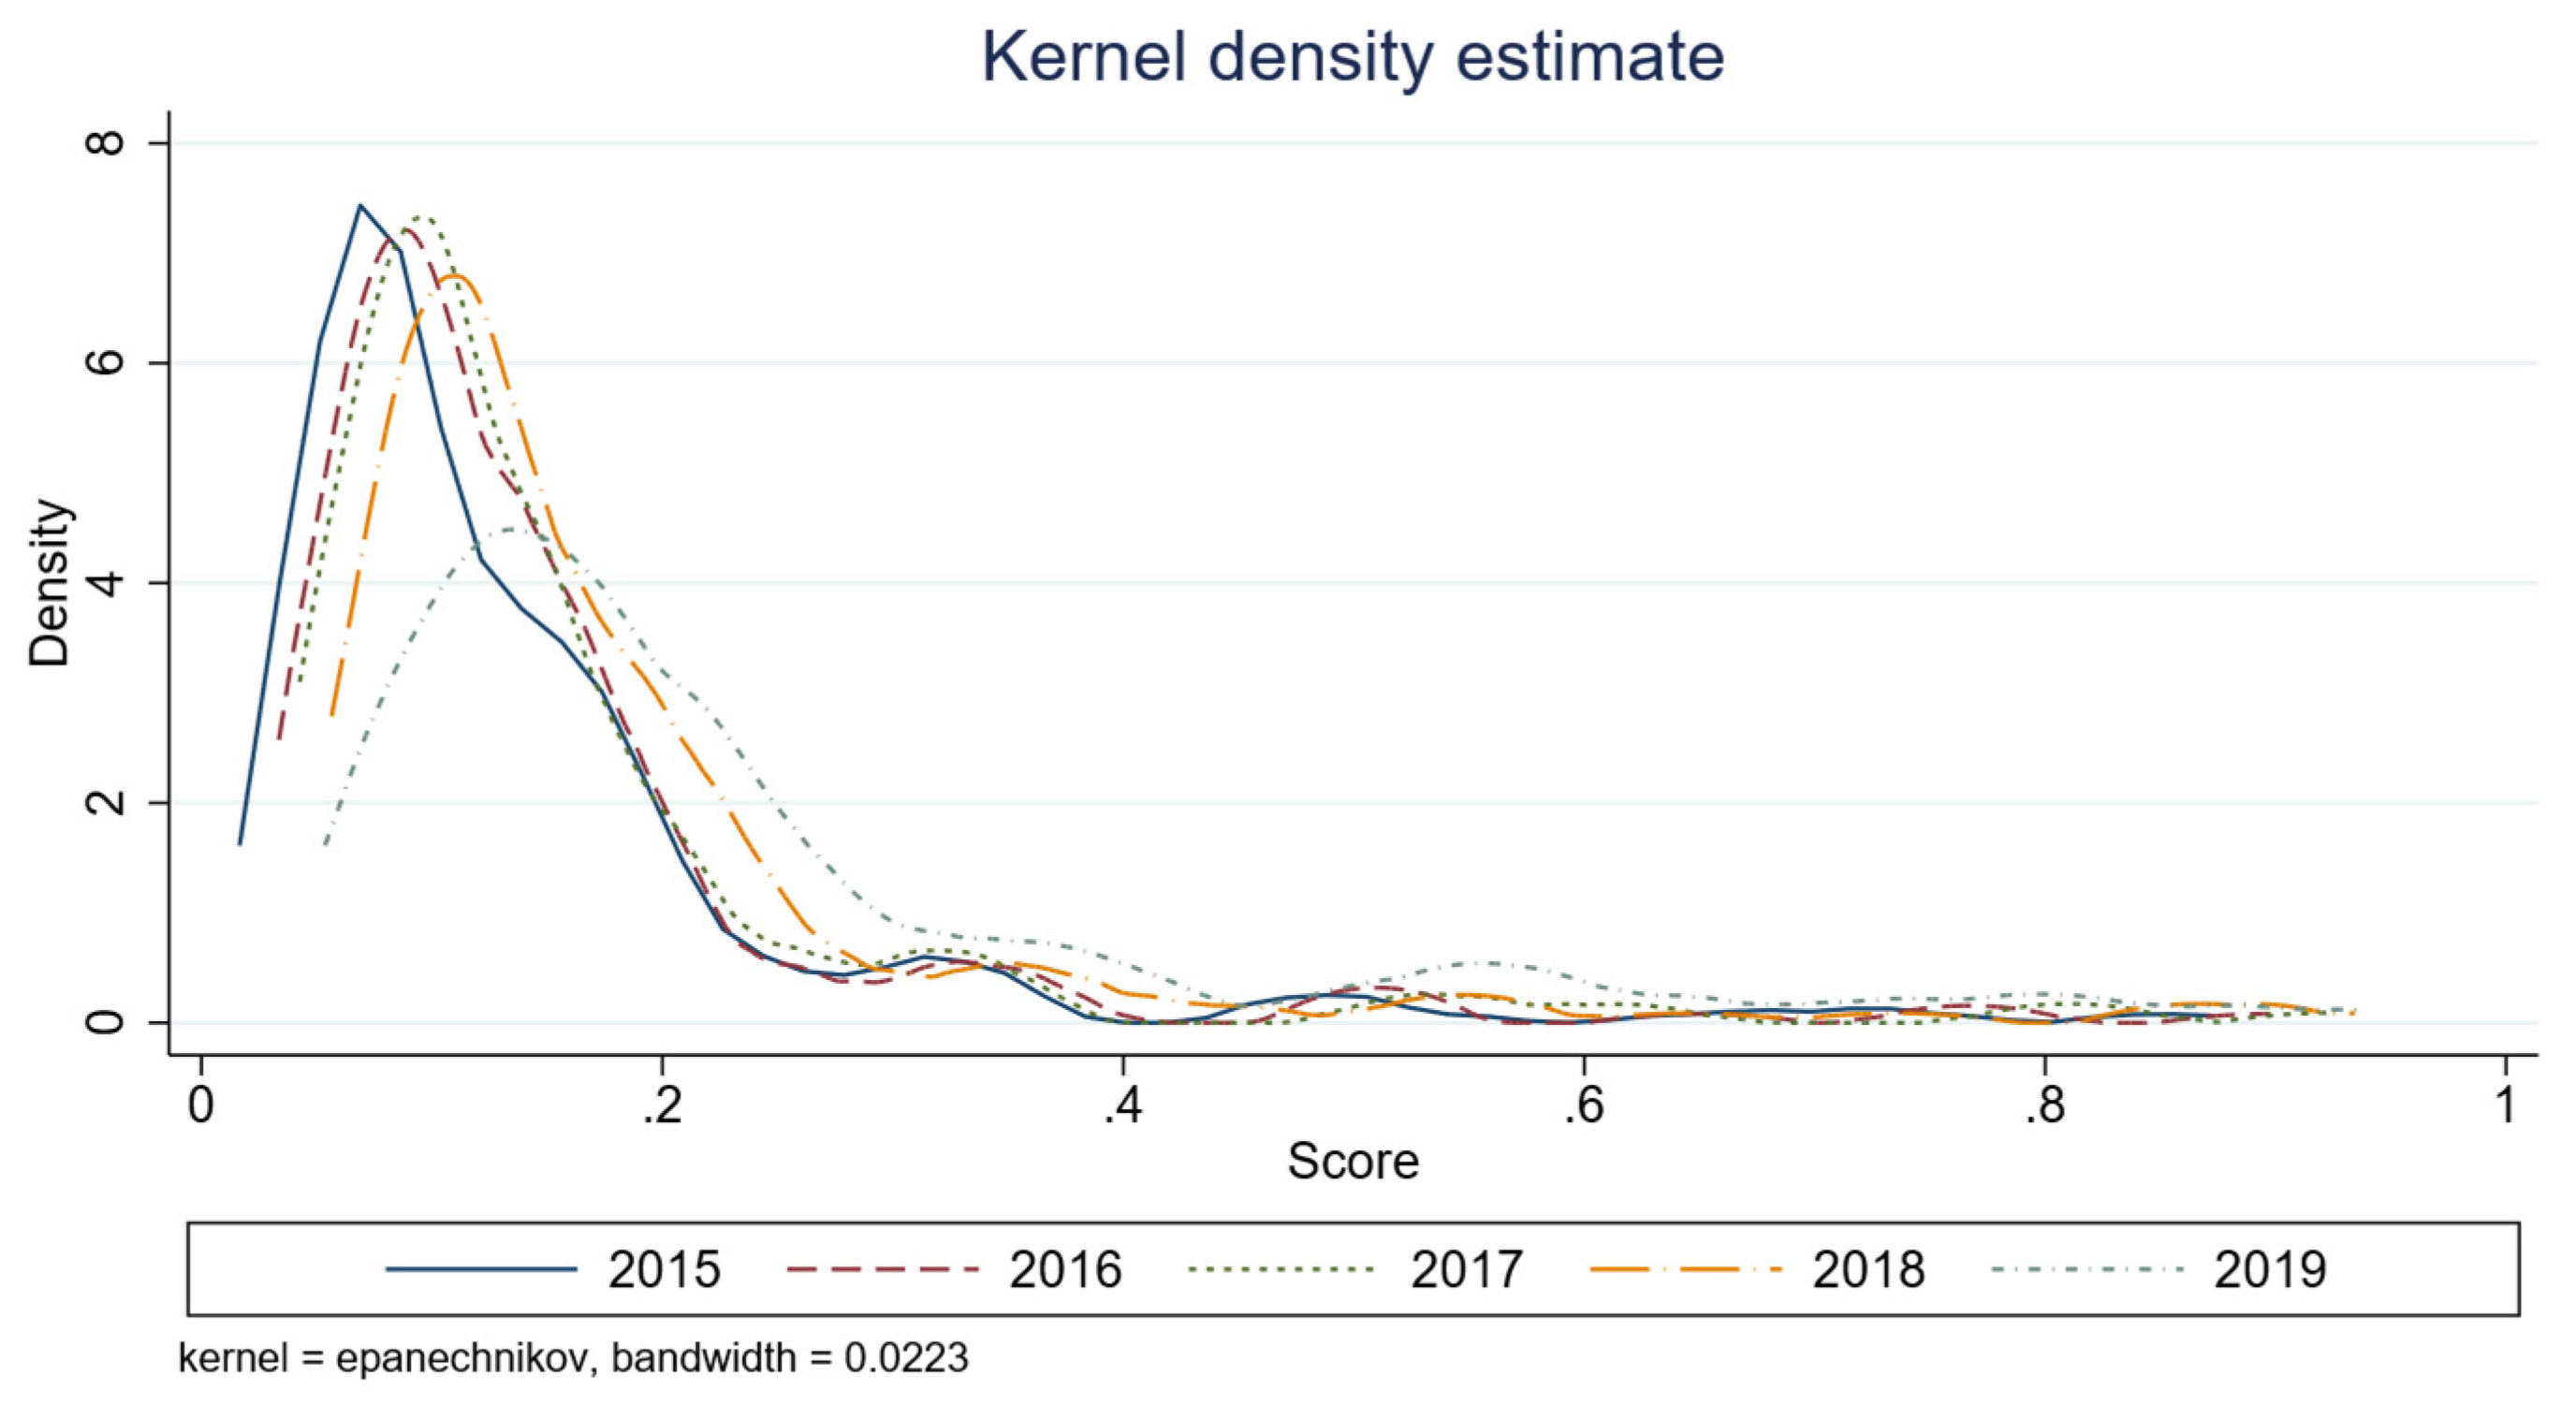
Urban climate resilience is a multifaceted concept that considers the geographical location, climatic conditions, and degree and characteristics of urban development. Its evaluative process involves assessing both the extent of damage to cities caused by climate-related hazards and the effectiveness of urban disaster prevention and mitigation measures. Therefore, when measuring variations in urban climate resilience, it is necessary to consider geographic location, regional climate fluctuations, as well as distinct factors such as the city's population and economic growth. Therefore, to analyses the regional variations in urban climate resilience, this study initially includes the cities' latitude and longitude in the samples and considers the latitude and longitude of China's population density demarcation line's midpoint west to east. "The Hu Huan Yong Line serves as the origin and divides major cities in China into four geographic quadrants: northeast, southeast, northwest and southwest. Additionally, the major cities in China are further described using Dagum's Gini coefficient test, which analyses the geographical distribution of climate resilience and its sources. This test provides insights into the variations in the resilience of major cities to climatic hazards." At the same time, this paper divides the urban climate resilience index into four quartiles representing low resilience, medium-low resilience, medium-high resilience and high resilience. It then divides the subsamples based on this and analyses the varied impacts of fiscal policies on the resilience intervals of different cities using the quartile regression model.
