Submitted:
06 September 2023
Posted:
08 September 2023
You are already at the latest version
Abstract
Keywords:
1. Introduction
1.1. Obliquity-oblateness feedback
- 1)
- searching worldwide new observational evidences for the link between obliquity damping and short eccentricity amplification from global and regional (Antarctic, Pacific, Atlantic, Mediterranean, Indian) climate-related proxies (Sect. 3.1);
- 2)
- discuting the role of the long-term cooling trend in the MPT debate and the relationships between orbital forcings and proxies (Sect. 3.2 and 3.3);
- 3)
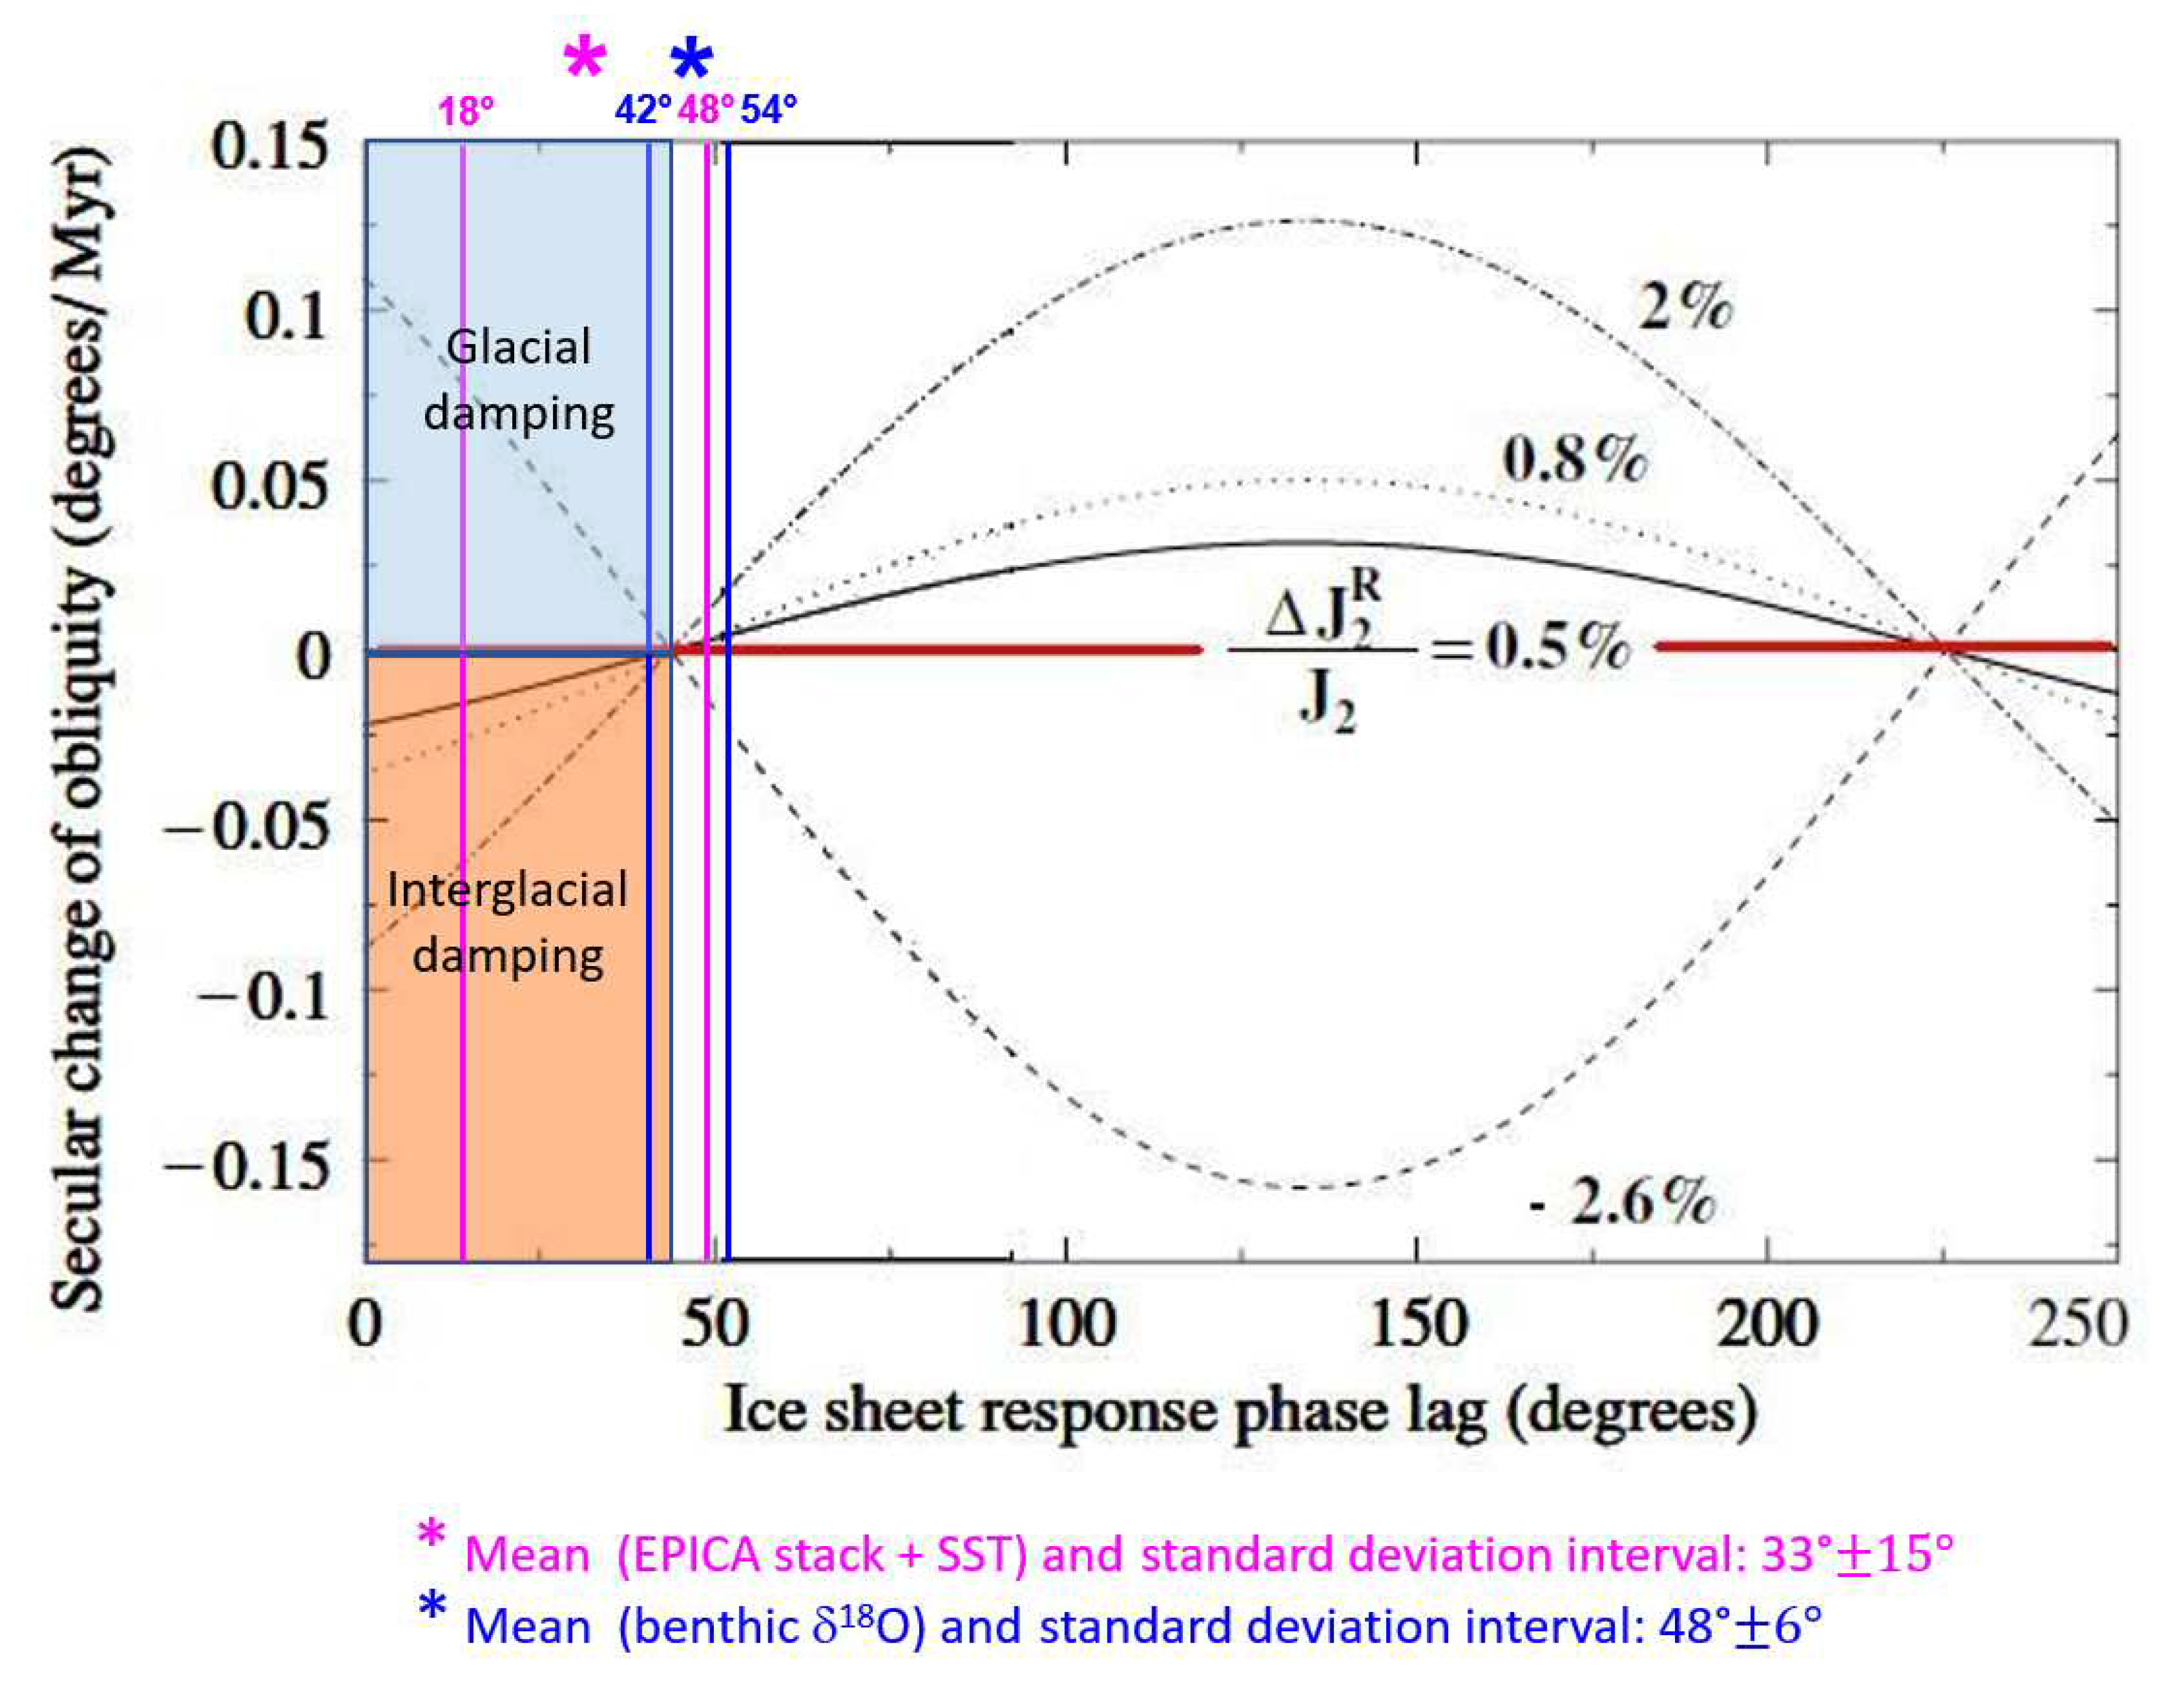
- by critically review the requisite theoretical constrains of ODH to establish that the obliquity-oblateness feedback could be the driving mechanism of the interglacial/glacial damping observed in Mid-Late Pleistocene obliquity responses (Sect. 3.4);
- 4)
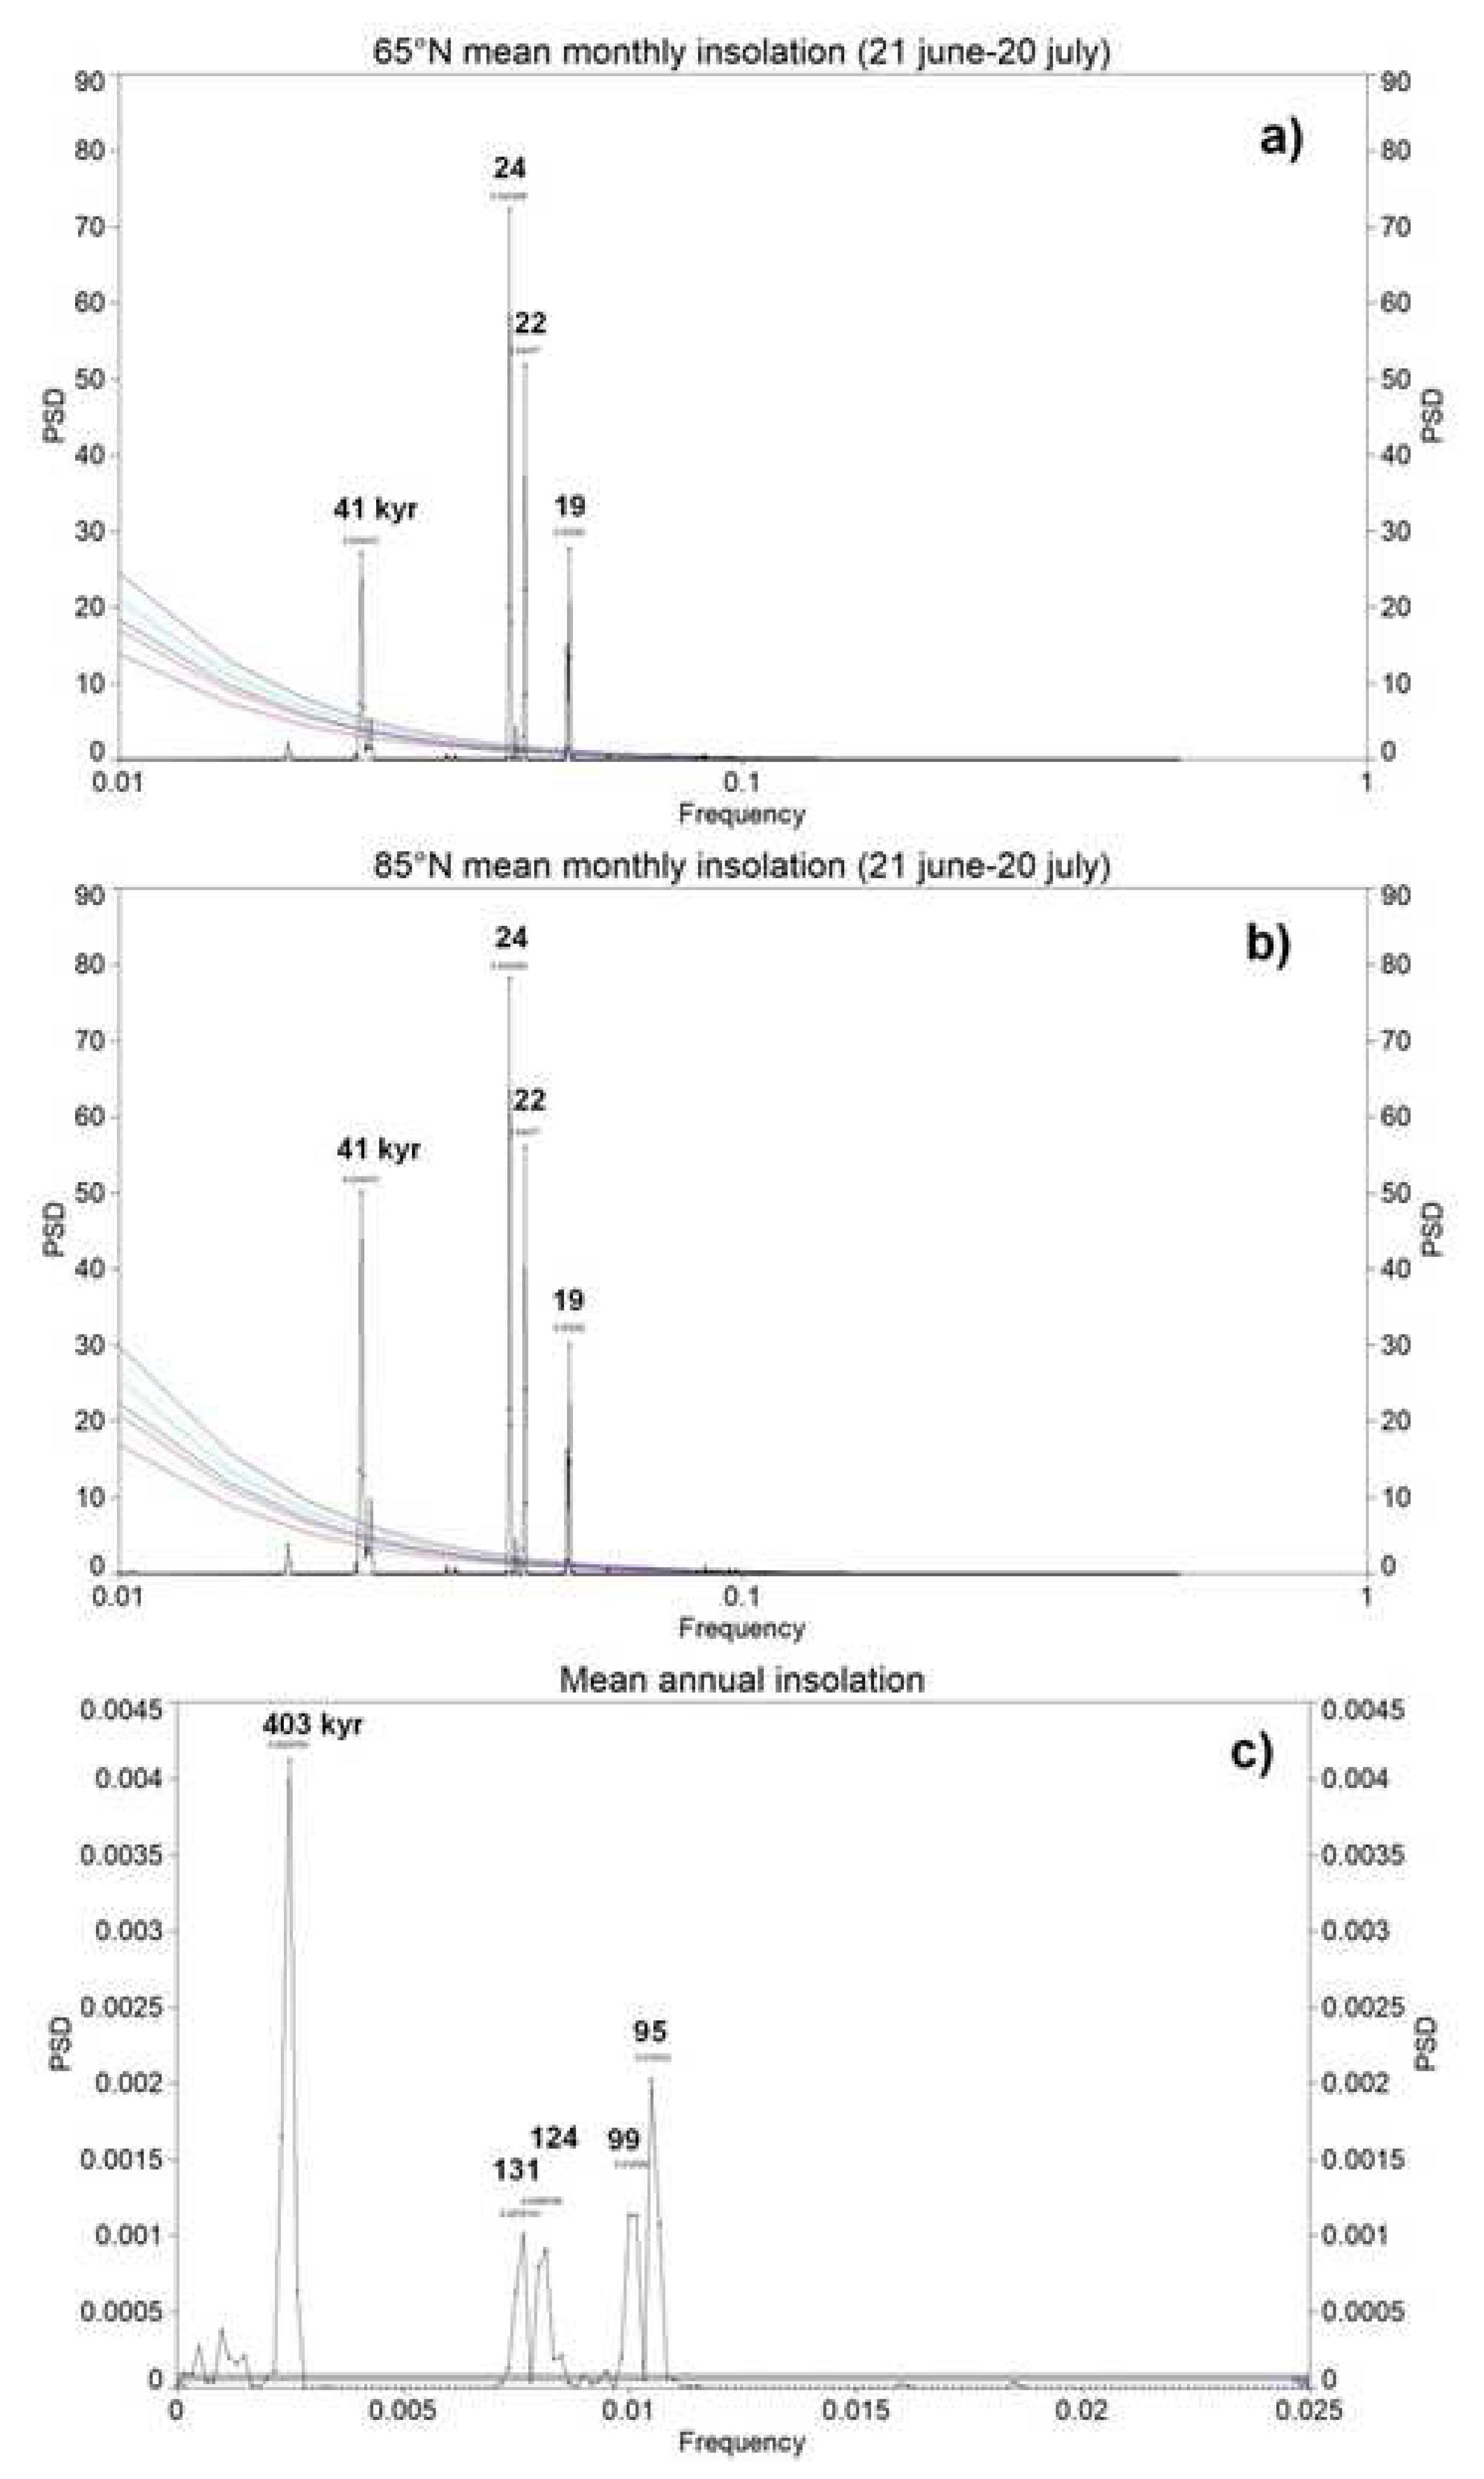
- refreshing by new cross-spectral data the role of the short eccentricity forcing (Sect. 3.5).
1.2. Key role of Obliquity Forcing on the Earth’s Climate System
2. Materials and Methods
2.1. Materials
Global proxies
Antarctica proxies
Atlantic proxies
Pacific proxies
Mediterranean proxies
Indian proxies
2.2. Statistical methods
3. Results and Discussion
3.1. Evidence of post-MPT Obliquity Damping
3.1.1. EPICA record
3.1.2. Sea-level Record of the Red Sea
3.1.3. LR04 δ18O and equatorial ODP Site 846 SST
3.1.4. Atlantic, Pacific, Mediterranean, and Indian proxies
3.2. Long-Term Cooling sets Boundary Conditions for Glacial/Interglacial cycles
3.3. Amplitude relationships between Orbital Forcings and Proxies
3.4. Why does Obliquity’s Response Damping?
3.4.1. Remarks on Obliquity phase lag and Temperature/Ice-volume proxies
3.4.2. Observations of Orbital phase lags between δ18O and Red Sea RSL records
3.4.3. Changes in Earth’s Oblateness
3.5. Earth’s eccentricity and the 100,000-year issue
4. Summary and conclusions
4.1. Main results
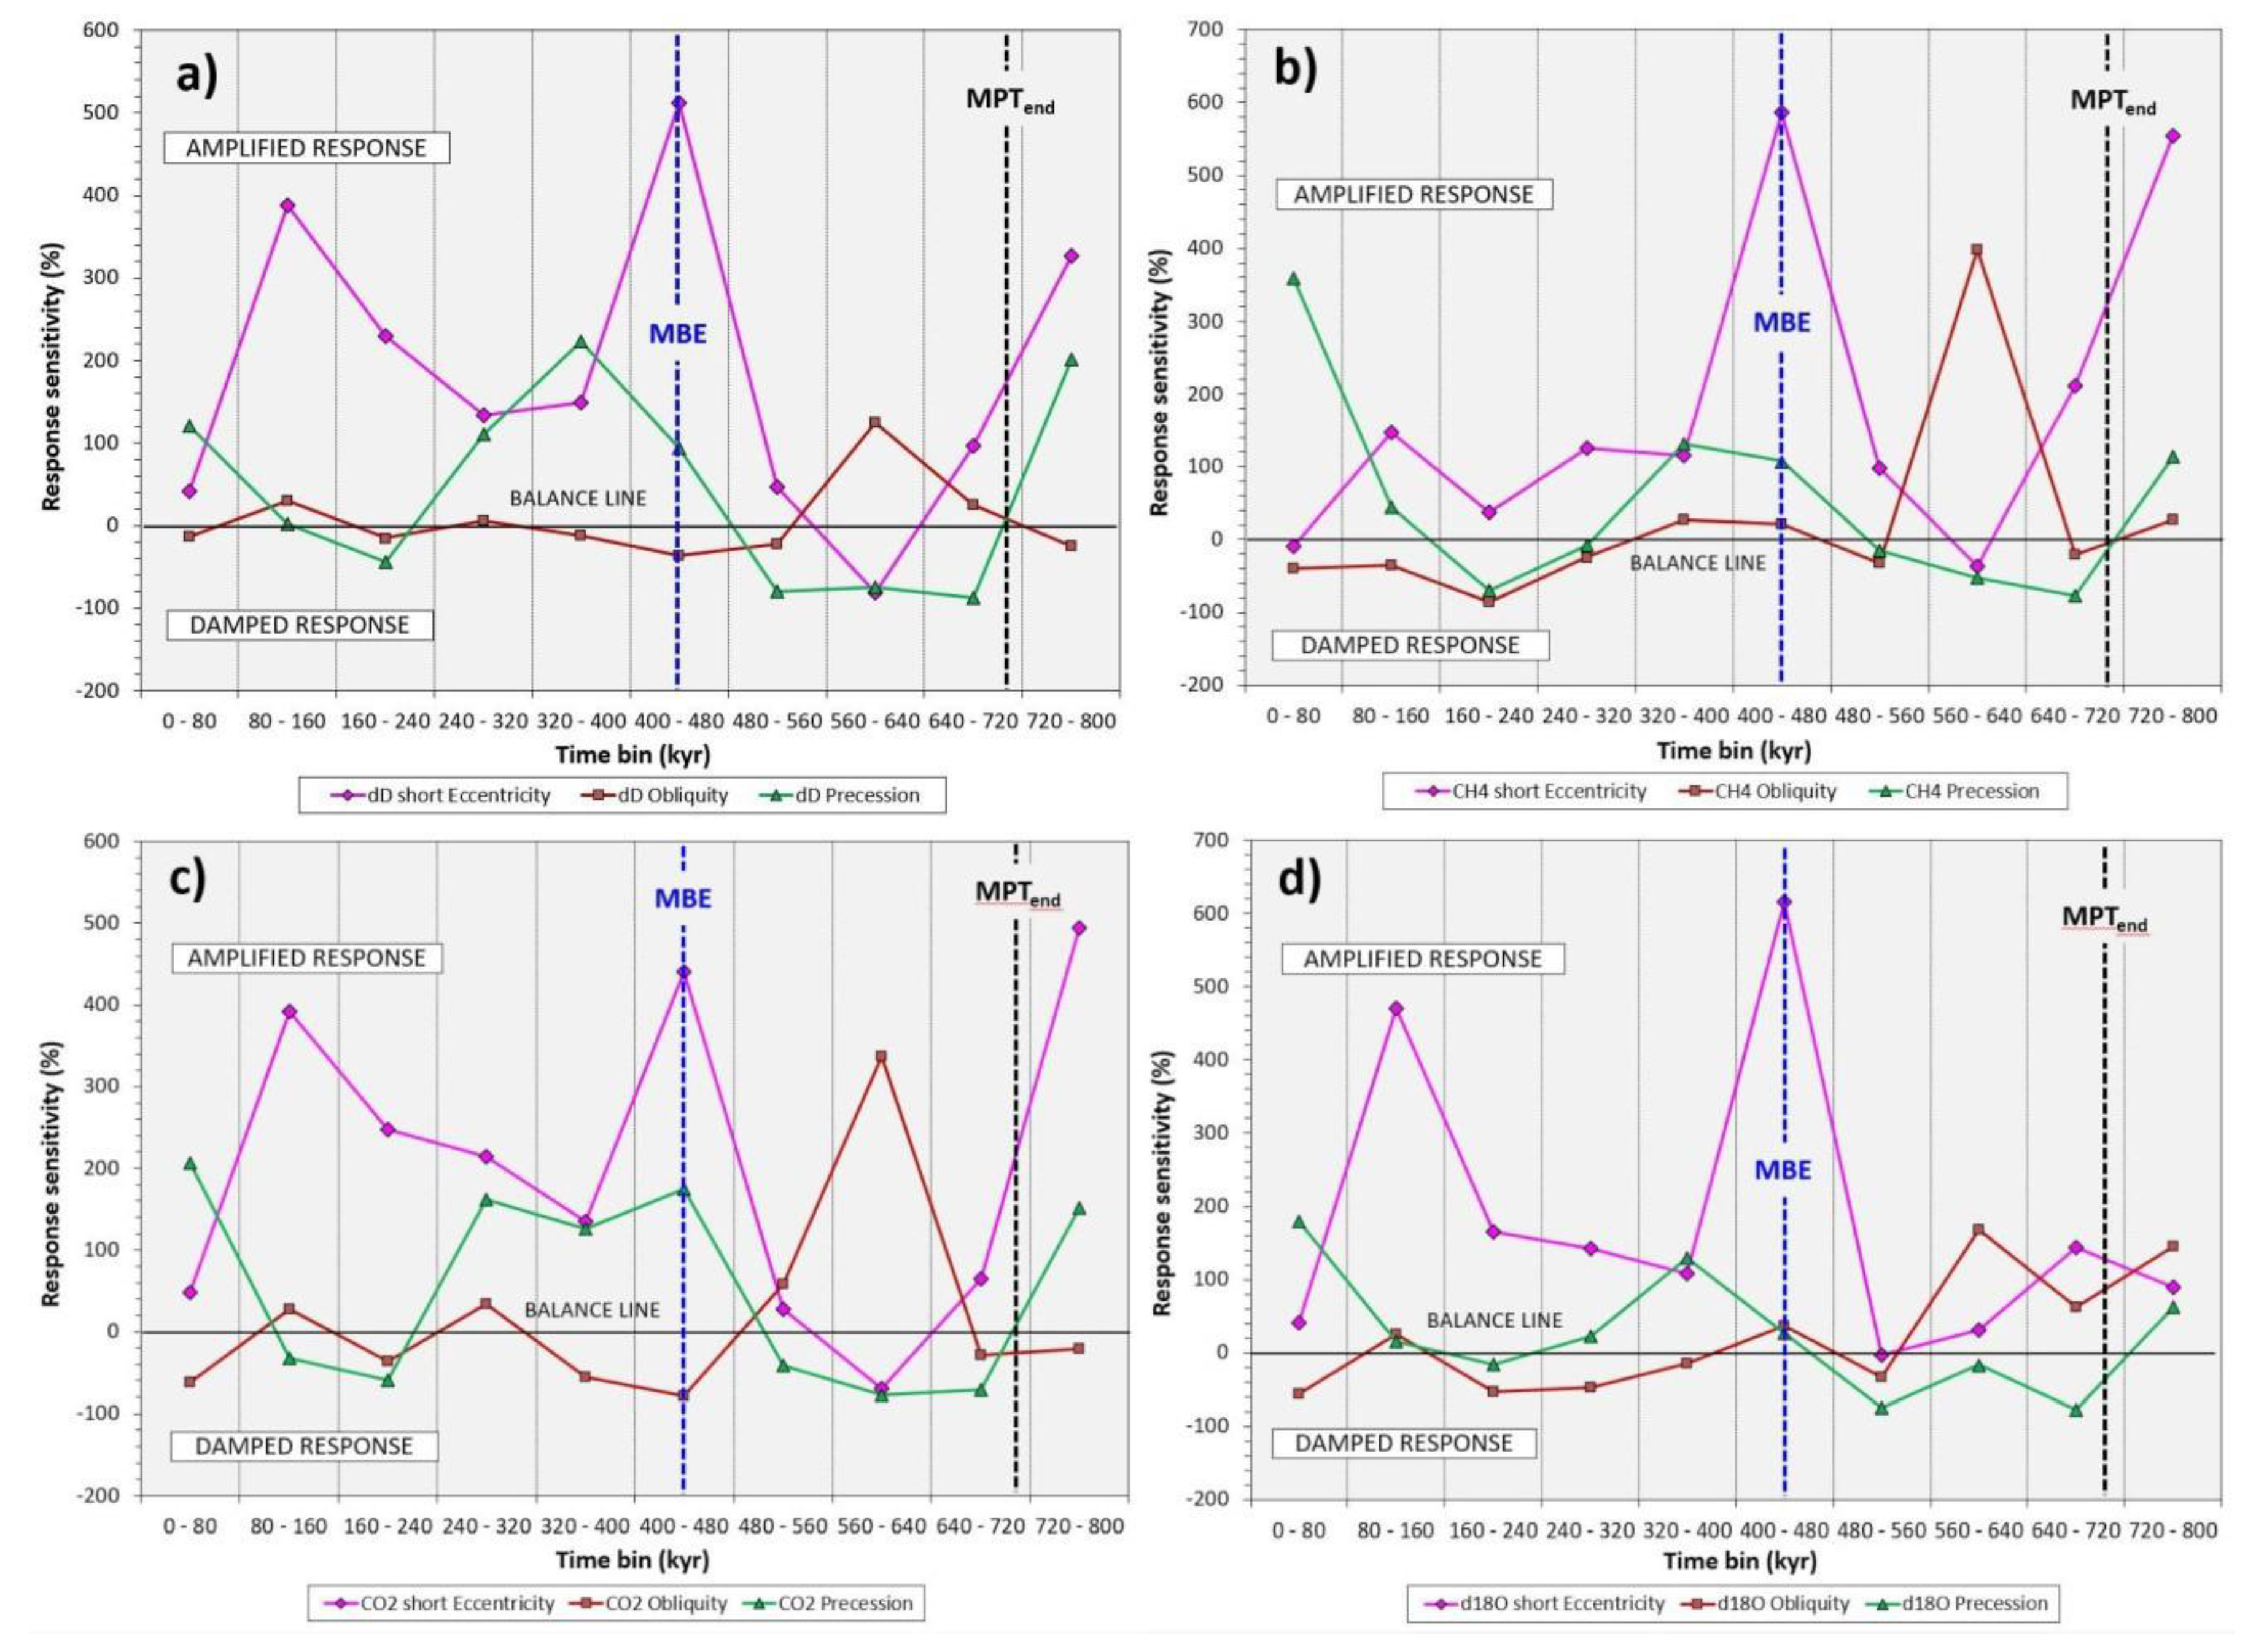
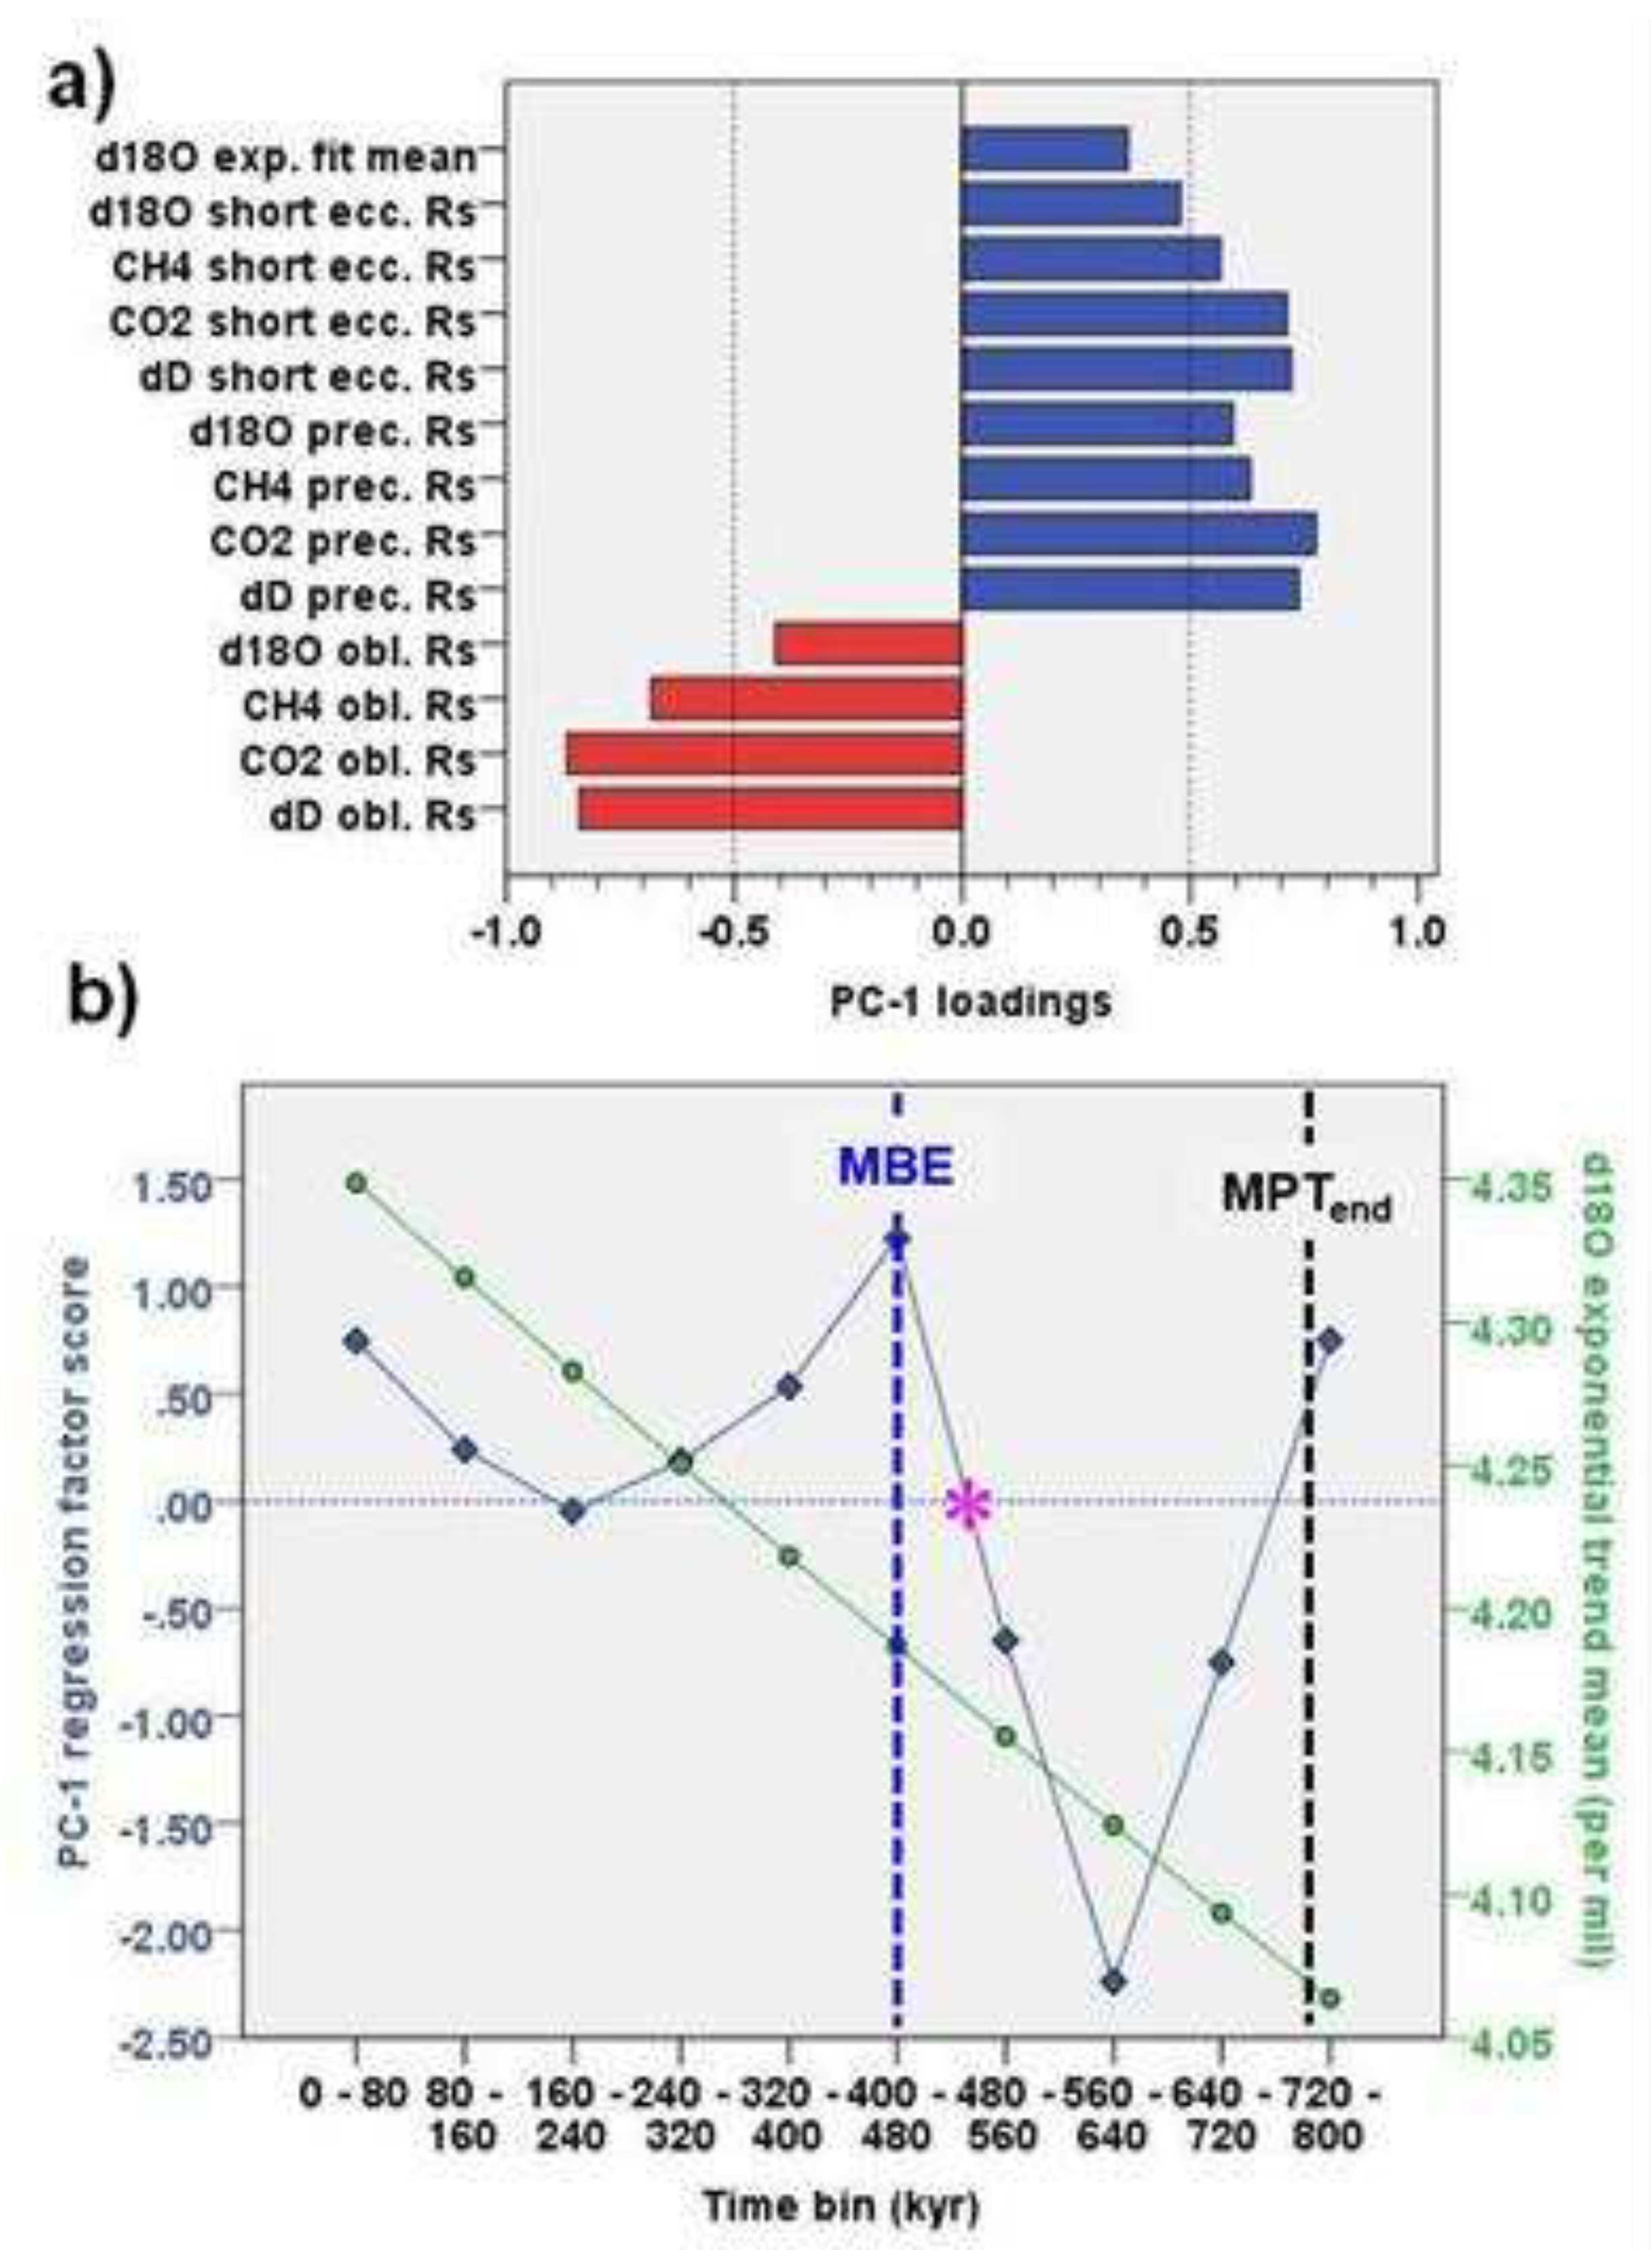
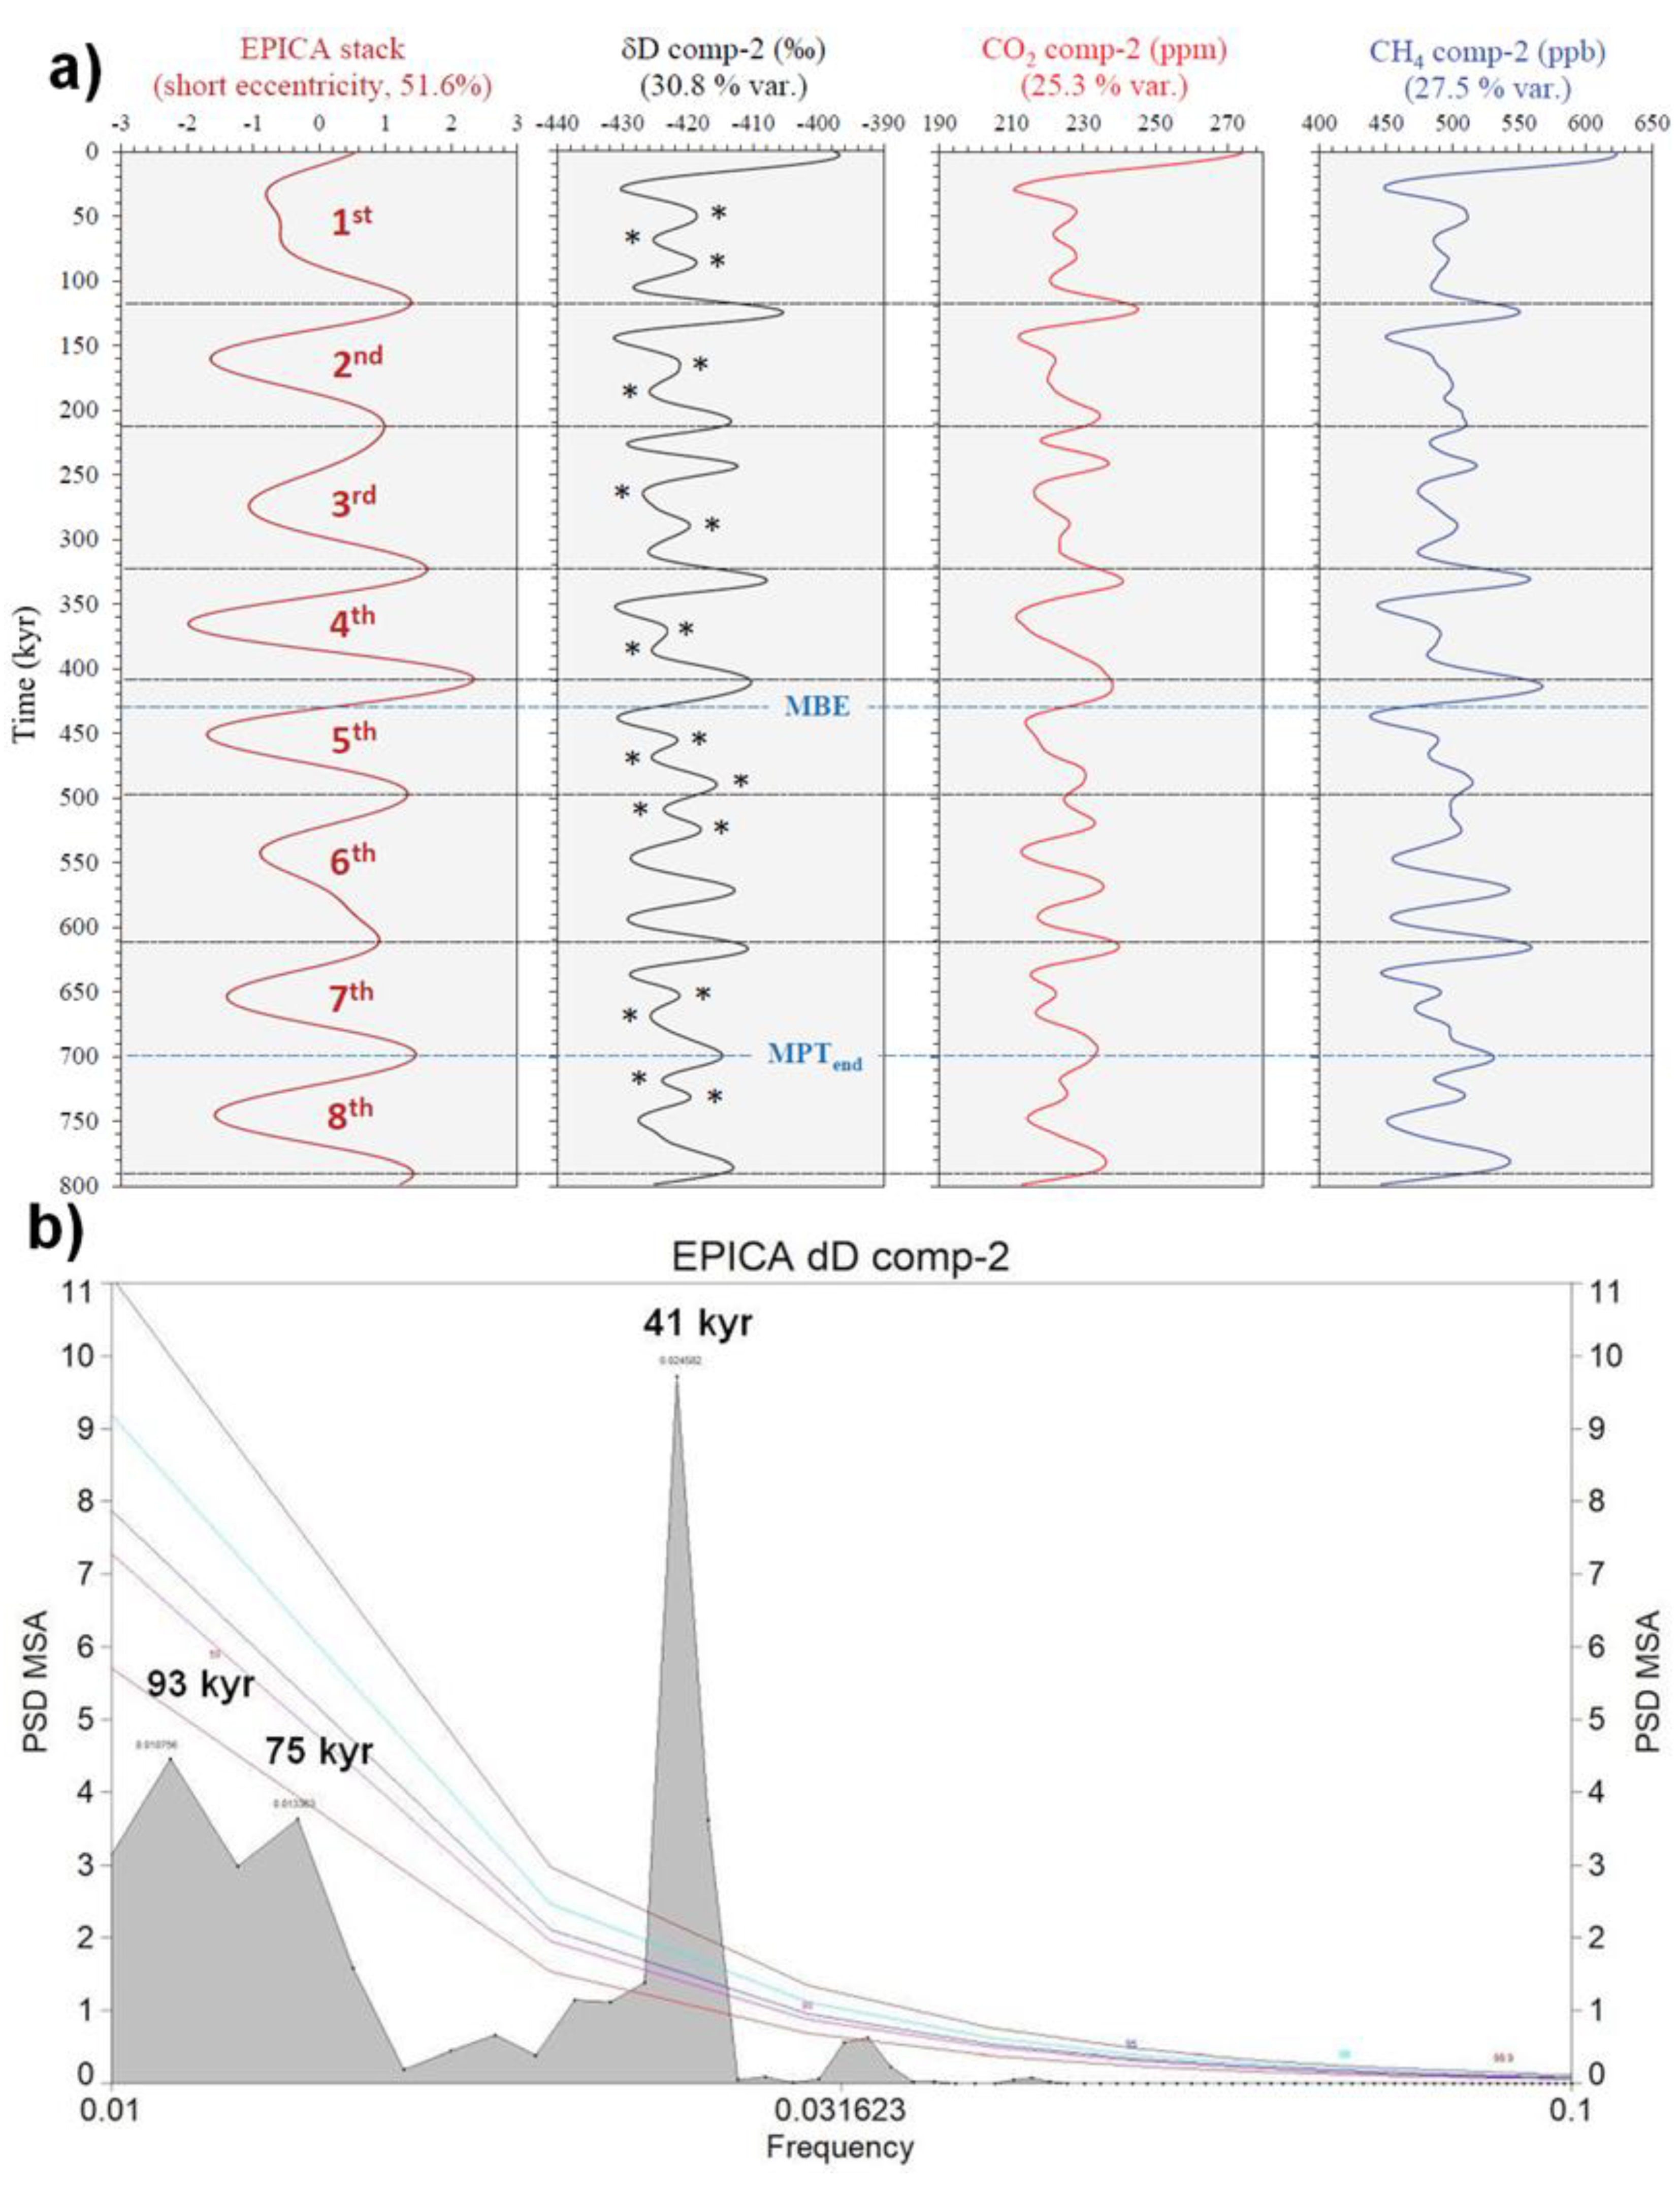
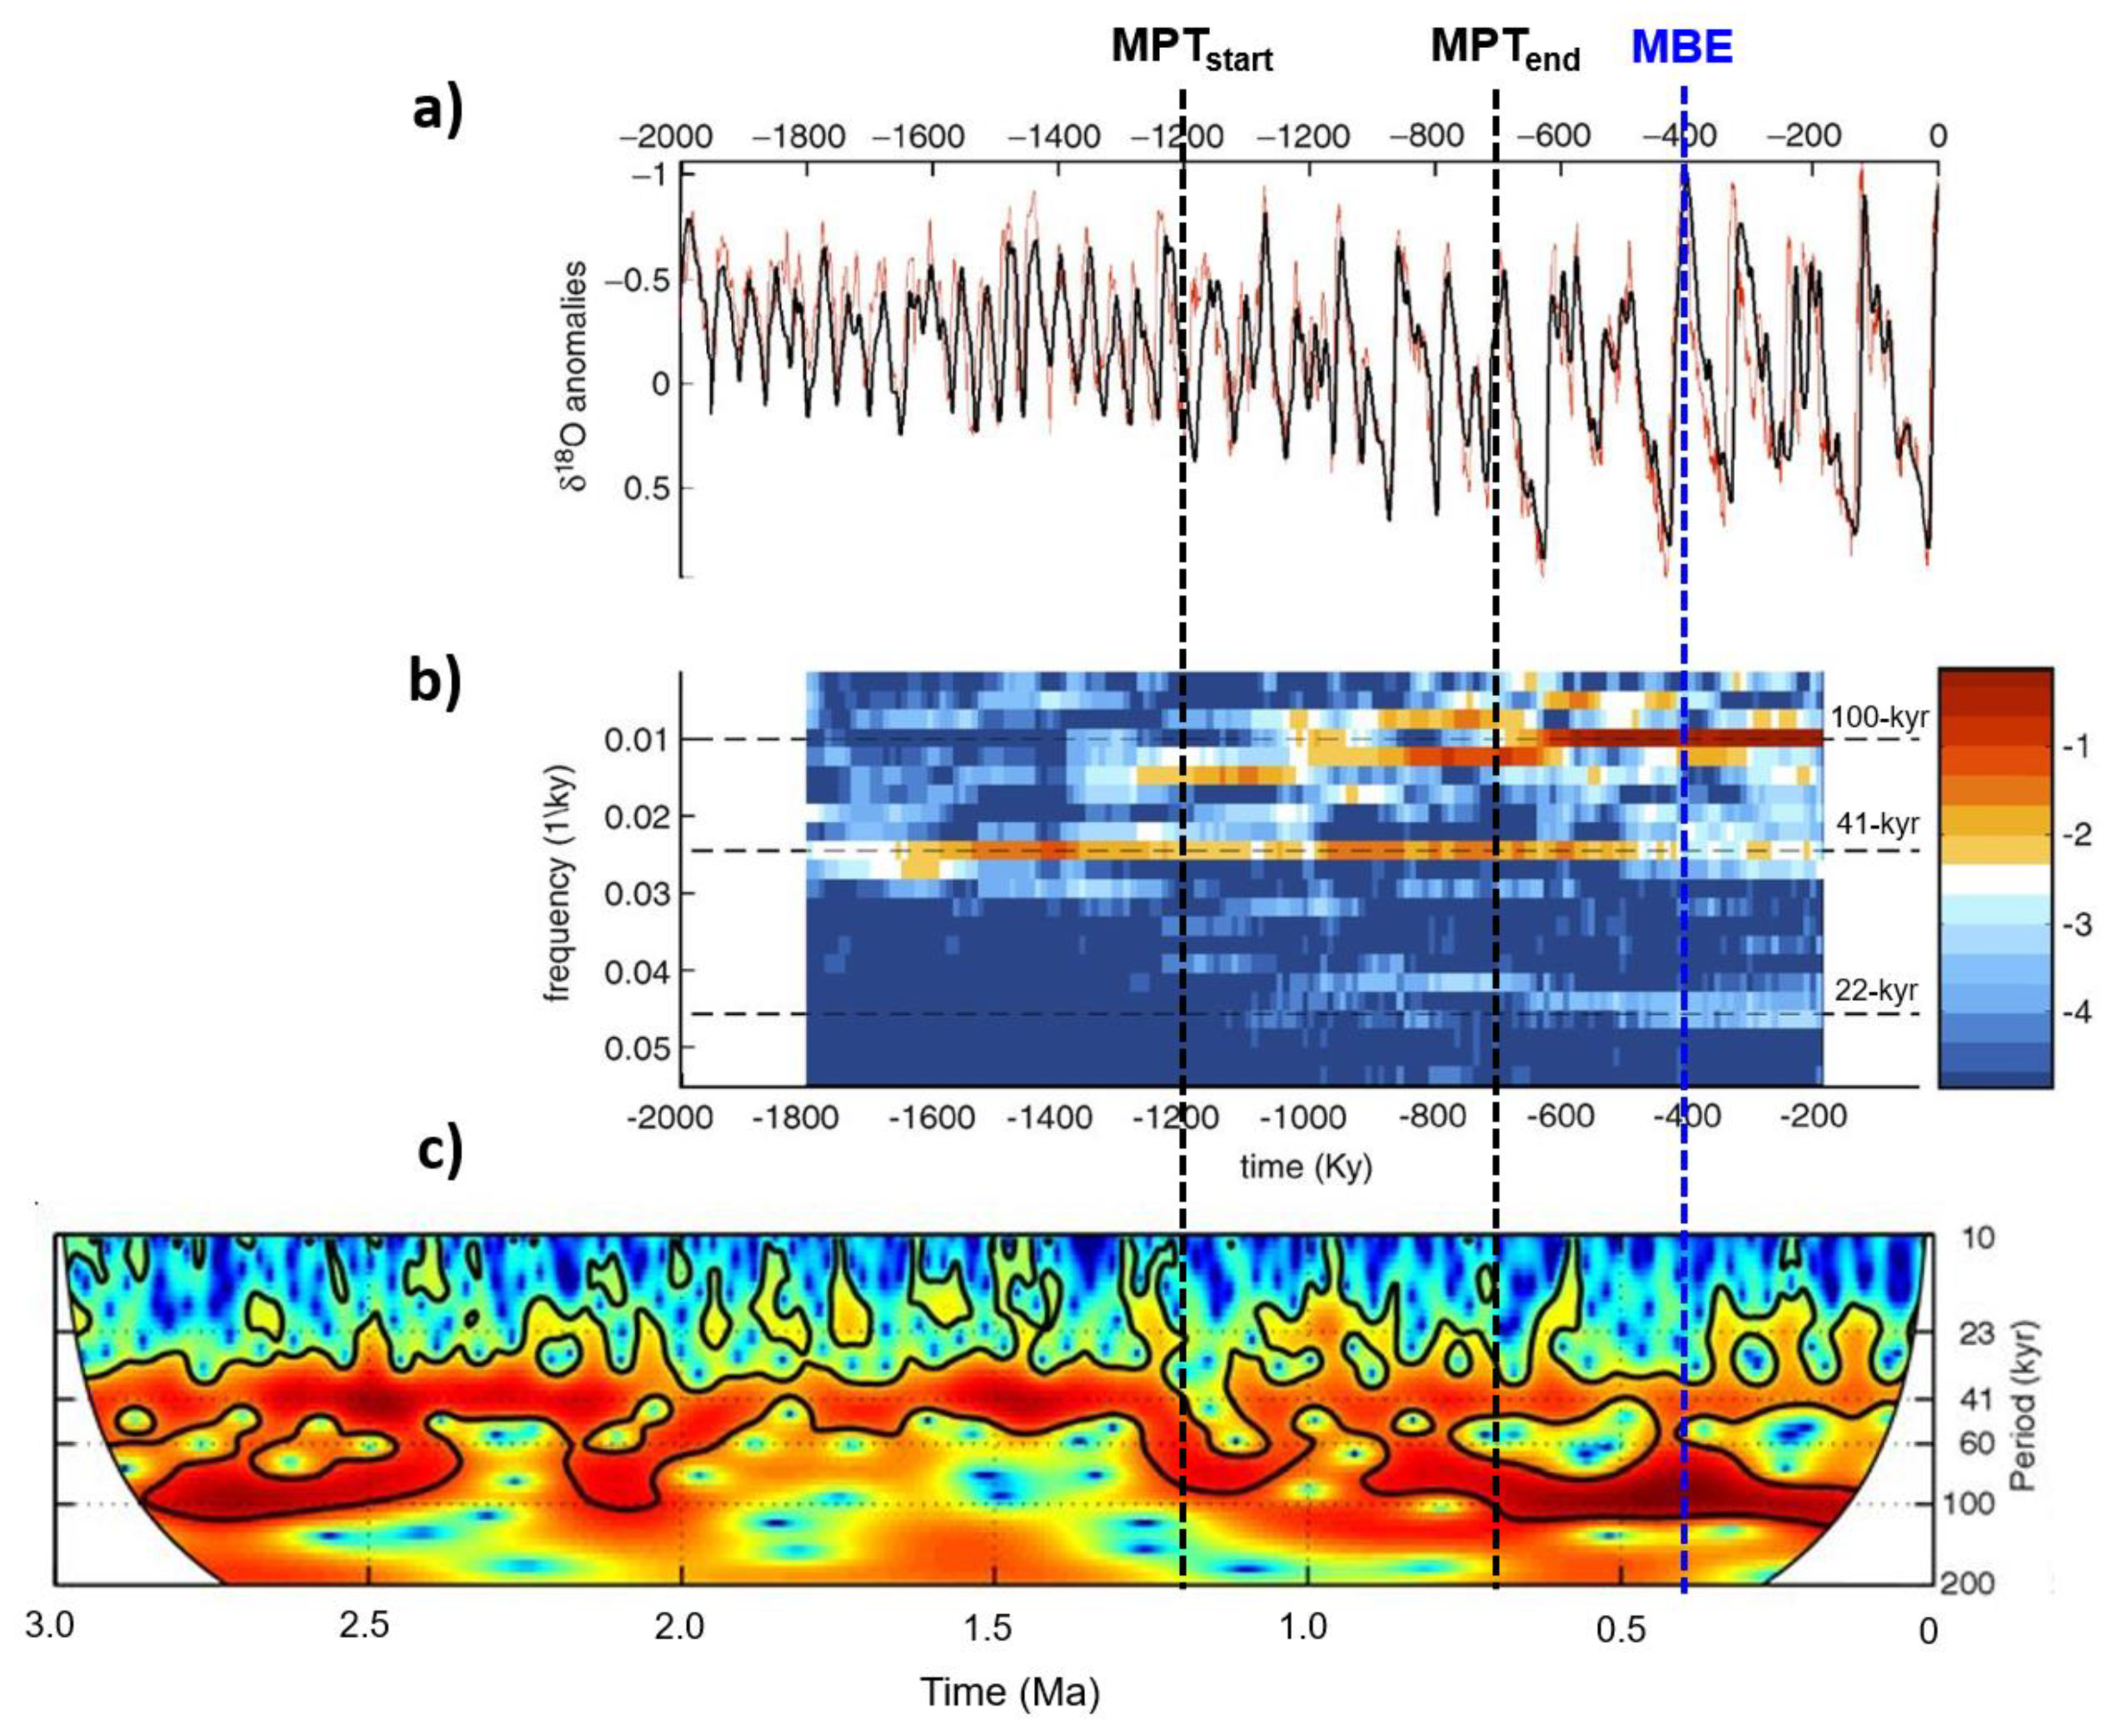
- The Antarctic orbital Rs demonstrates that since 560 kyr, a strong amplification of the short eccentricity signals has been occurring (up to 400%, 600%) coupled with damping of obliquity responses (up to ‒80%, –60%), confirming the marked asymmetry of the climate responses to orbital forcing. The PCA model of Rs data (EPICA, LR04 δ18O) suggests PC-1 to be a latent factor, indicating a post-MPT anticorrelation among obliquity and short eccentricity/precession Rs, which is related to the long-term growth of the cryosphere volume.
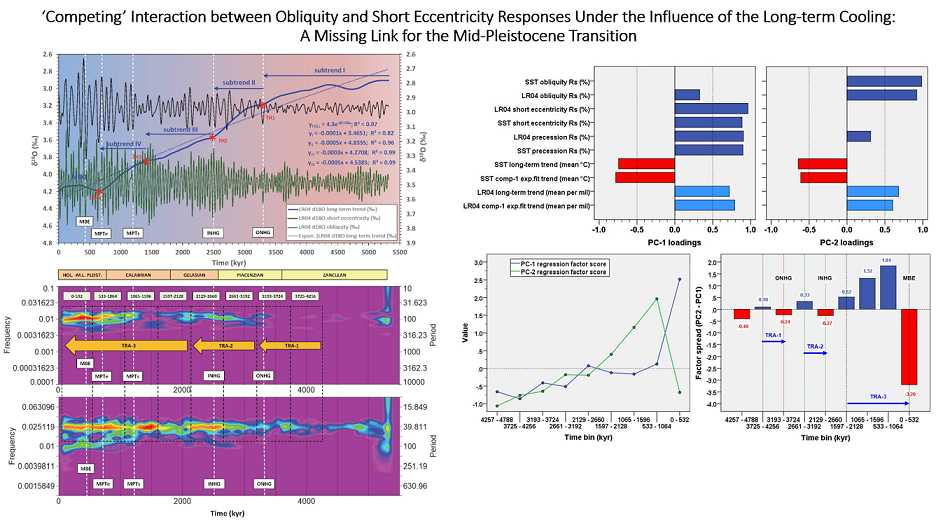
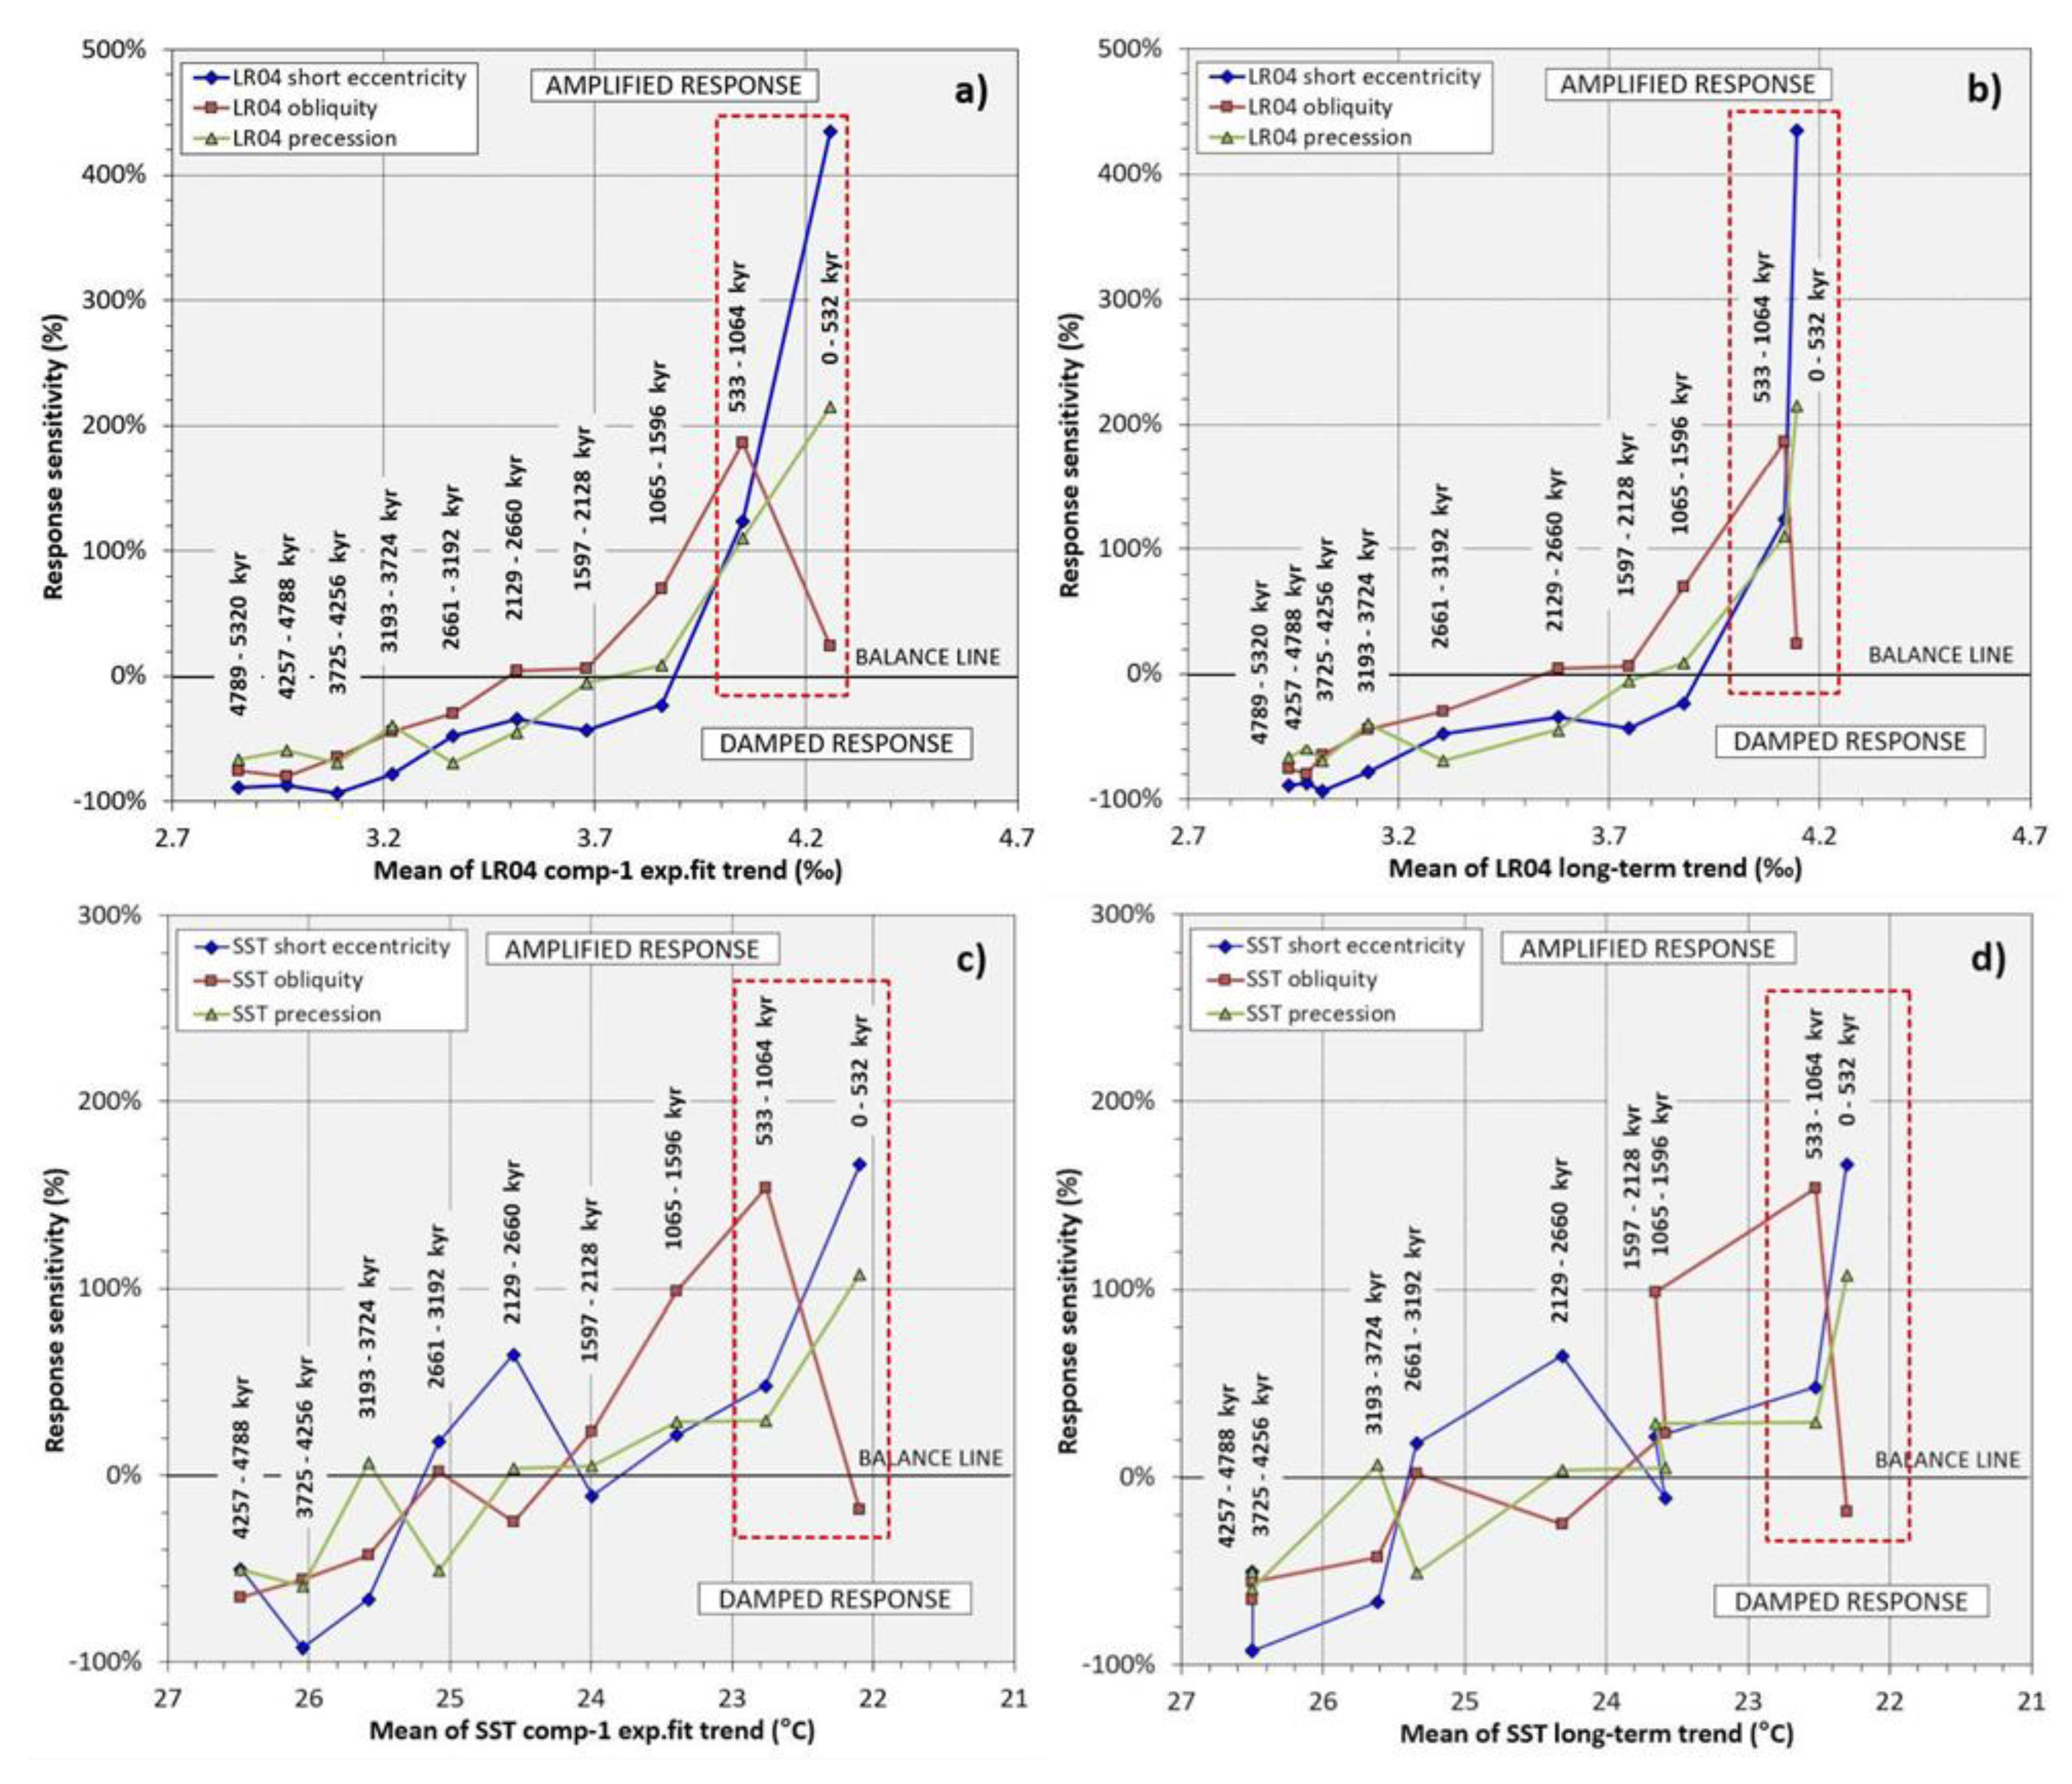
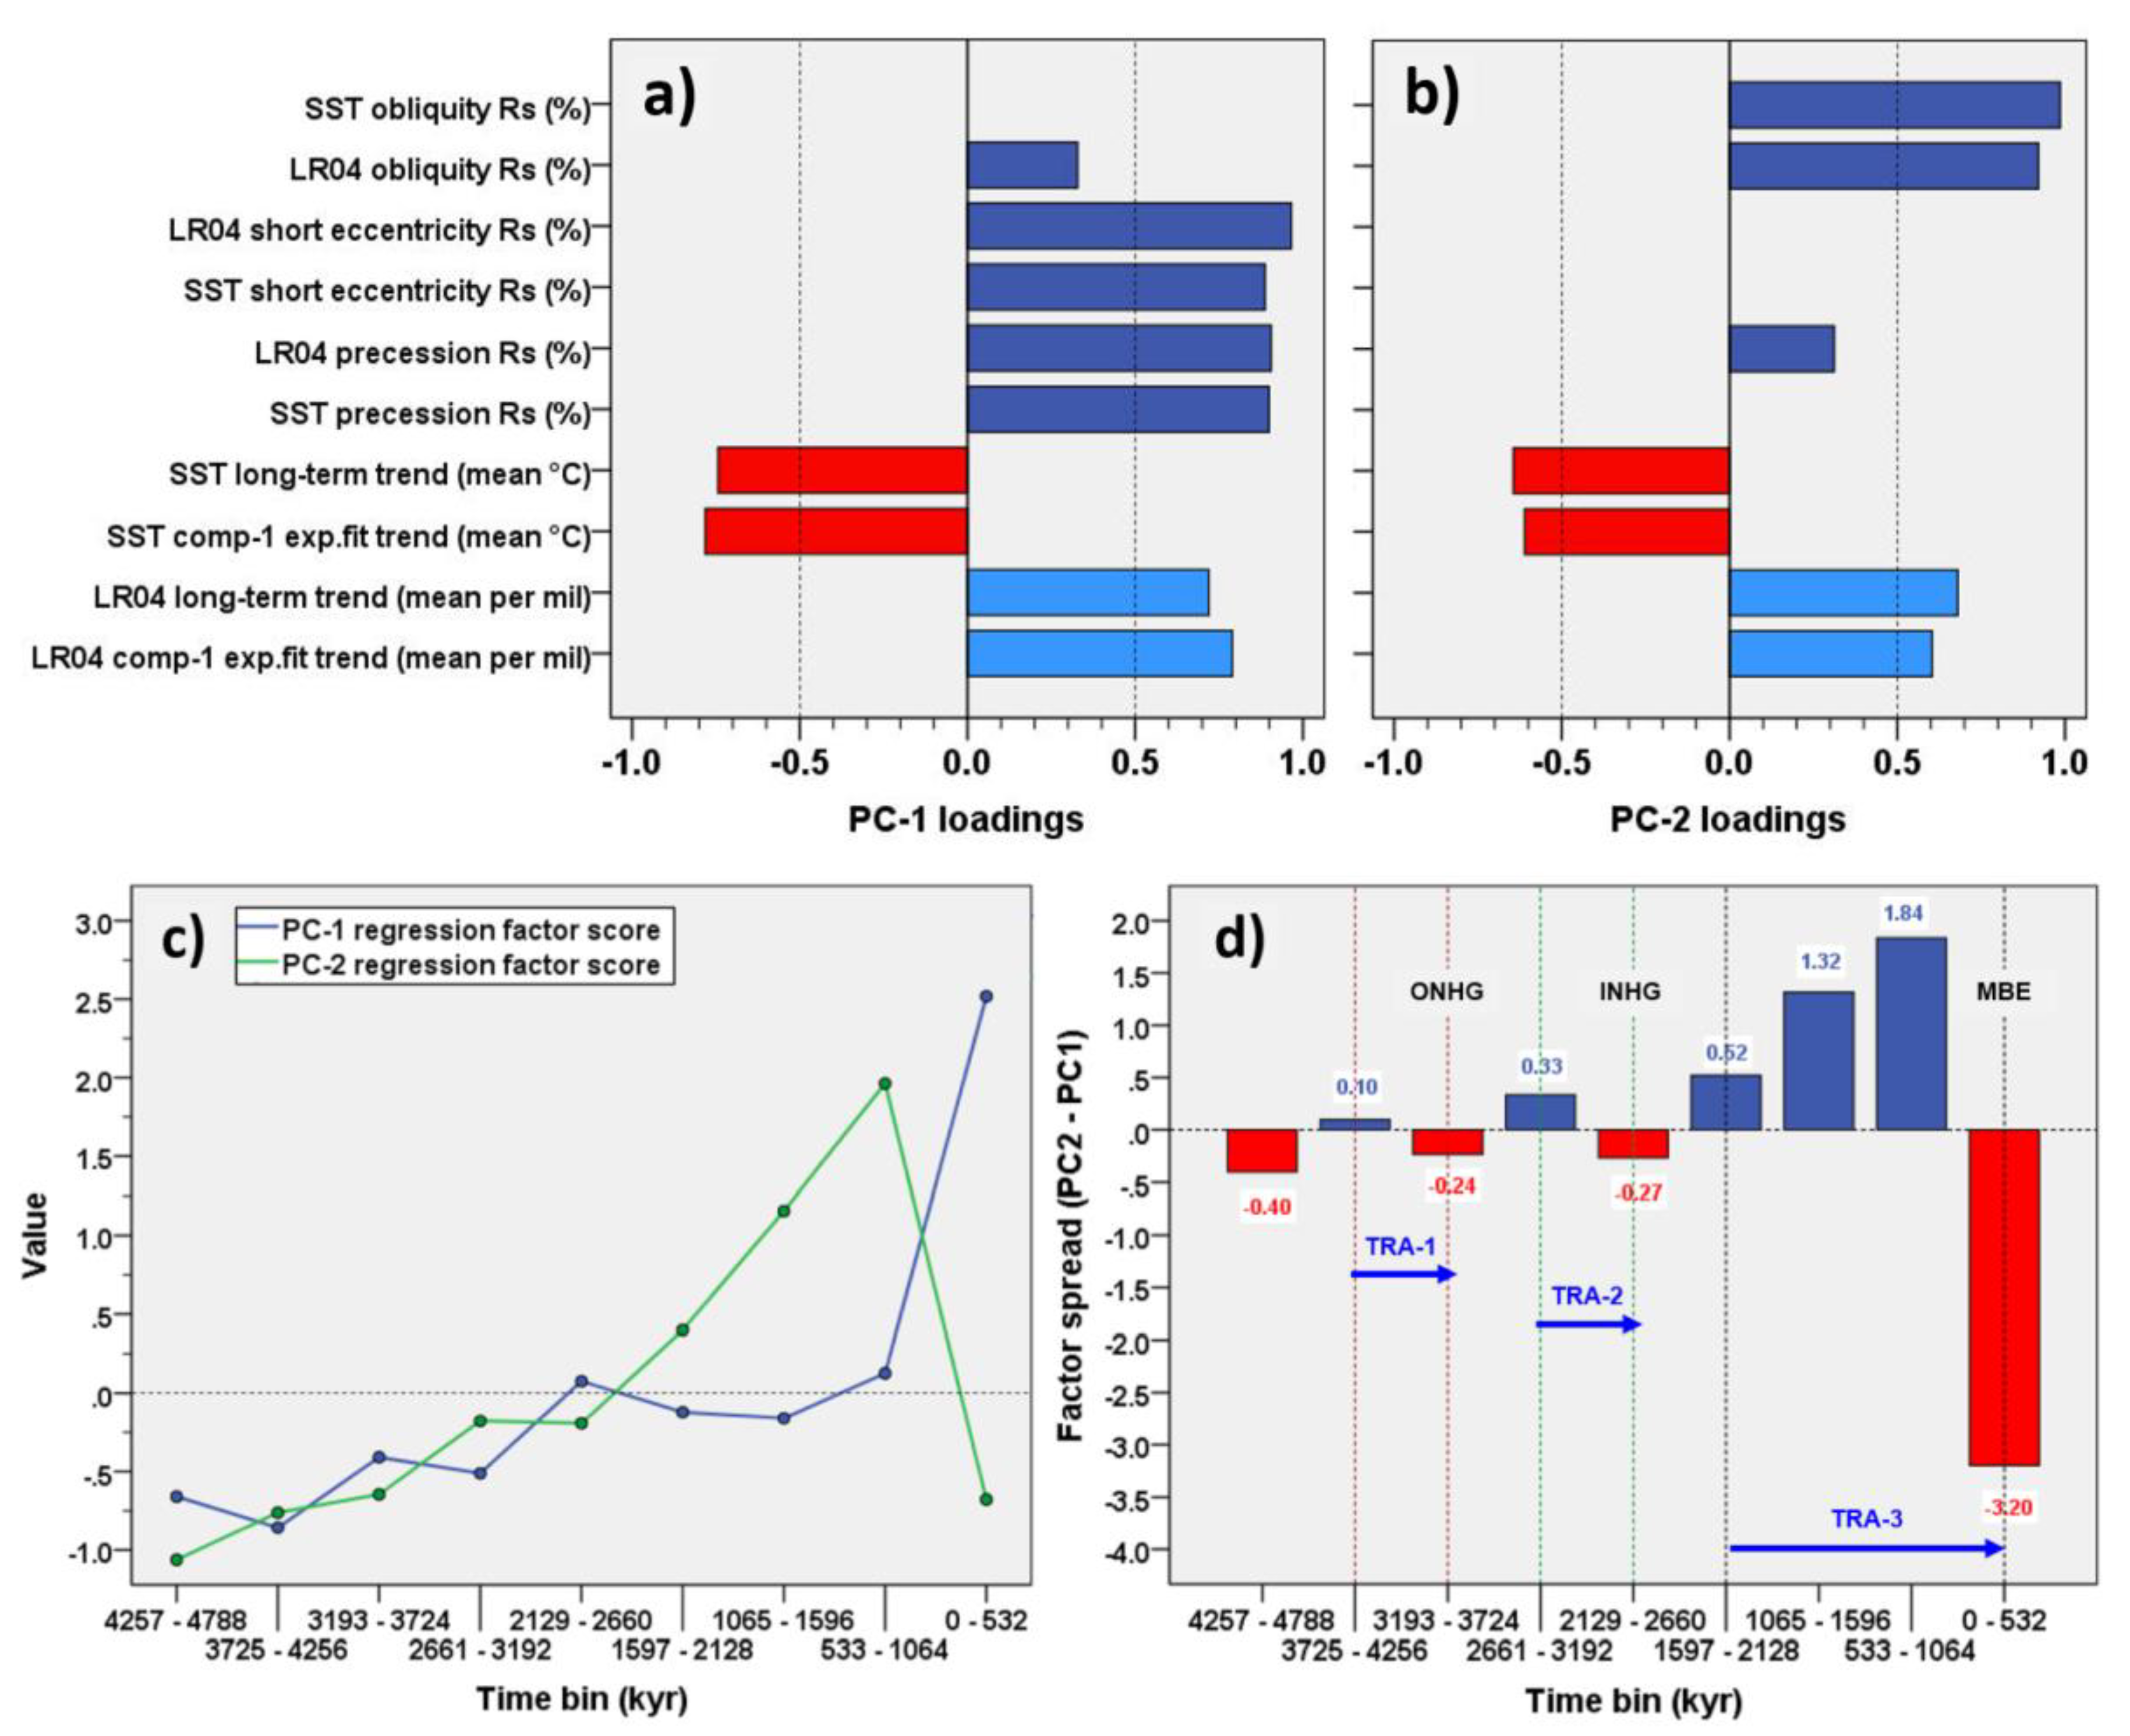
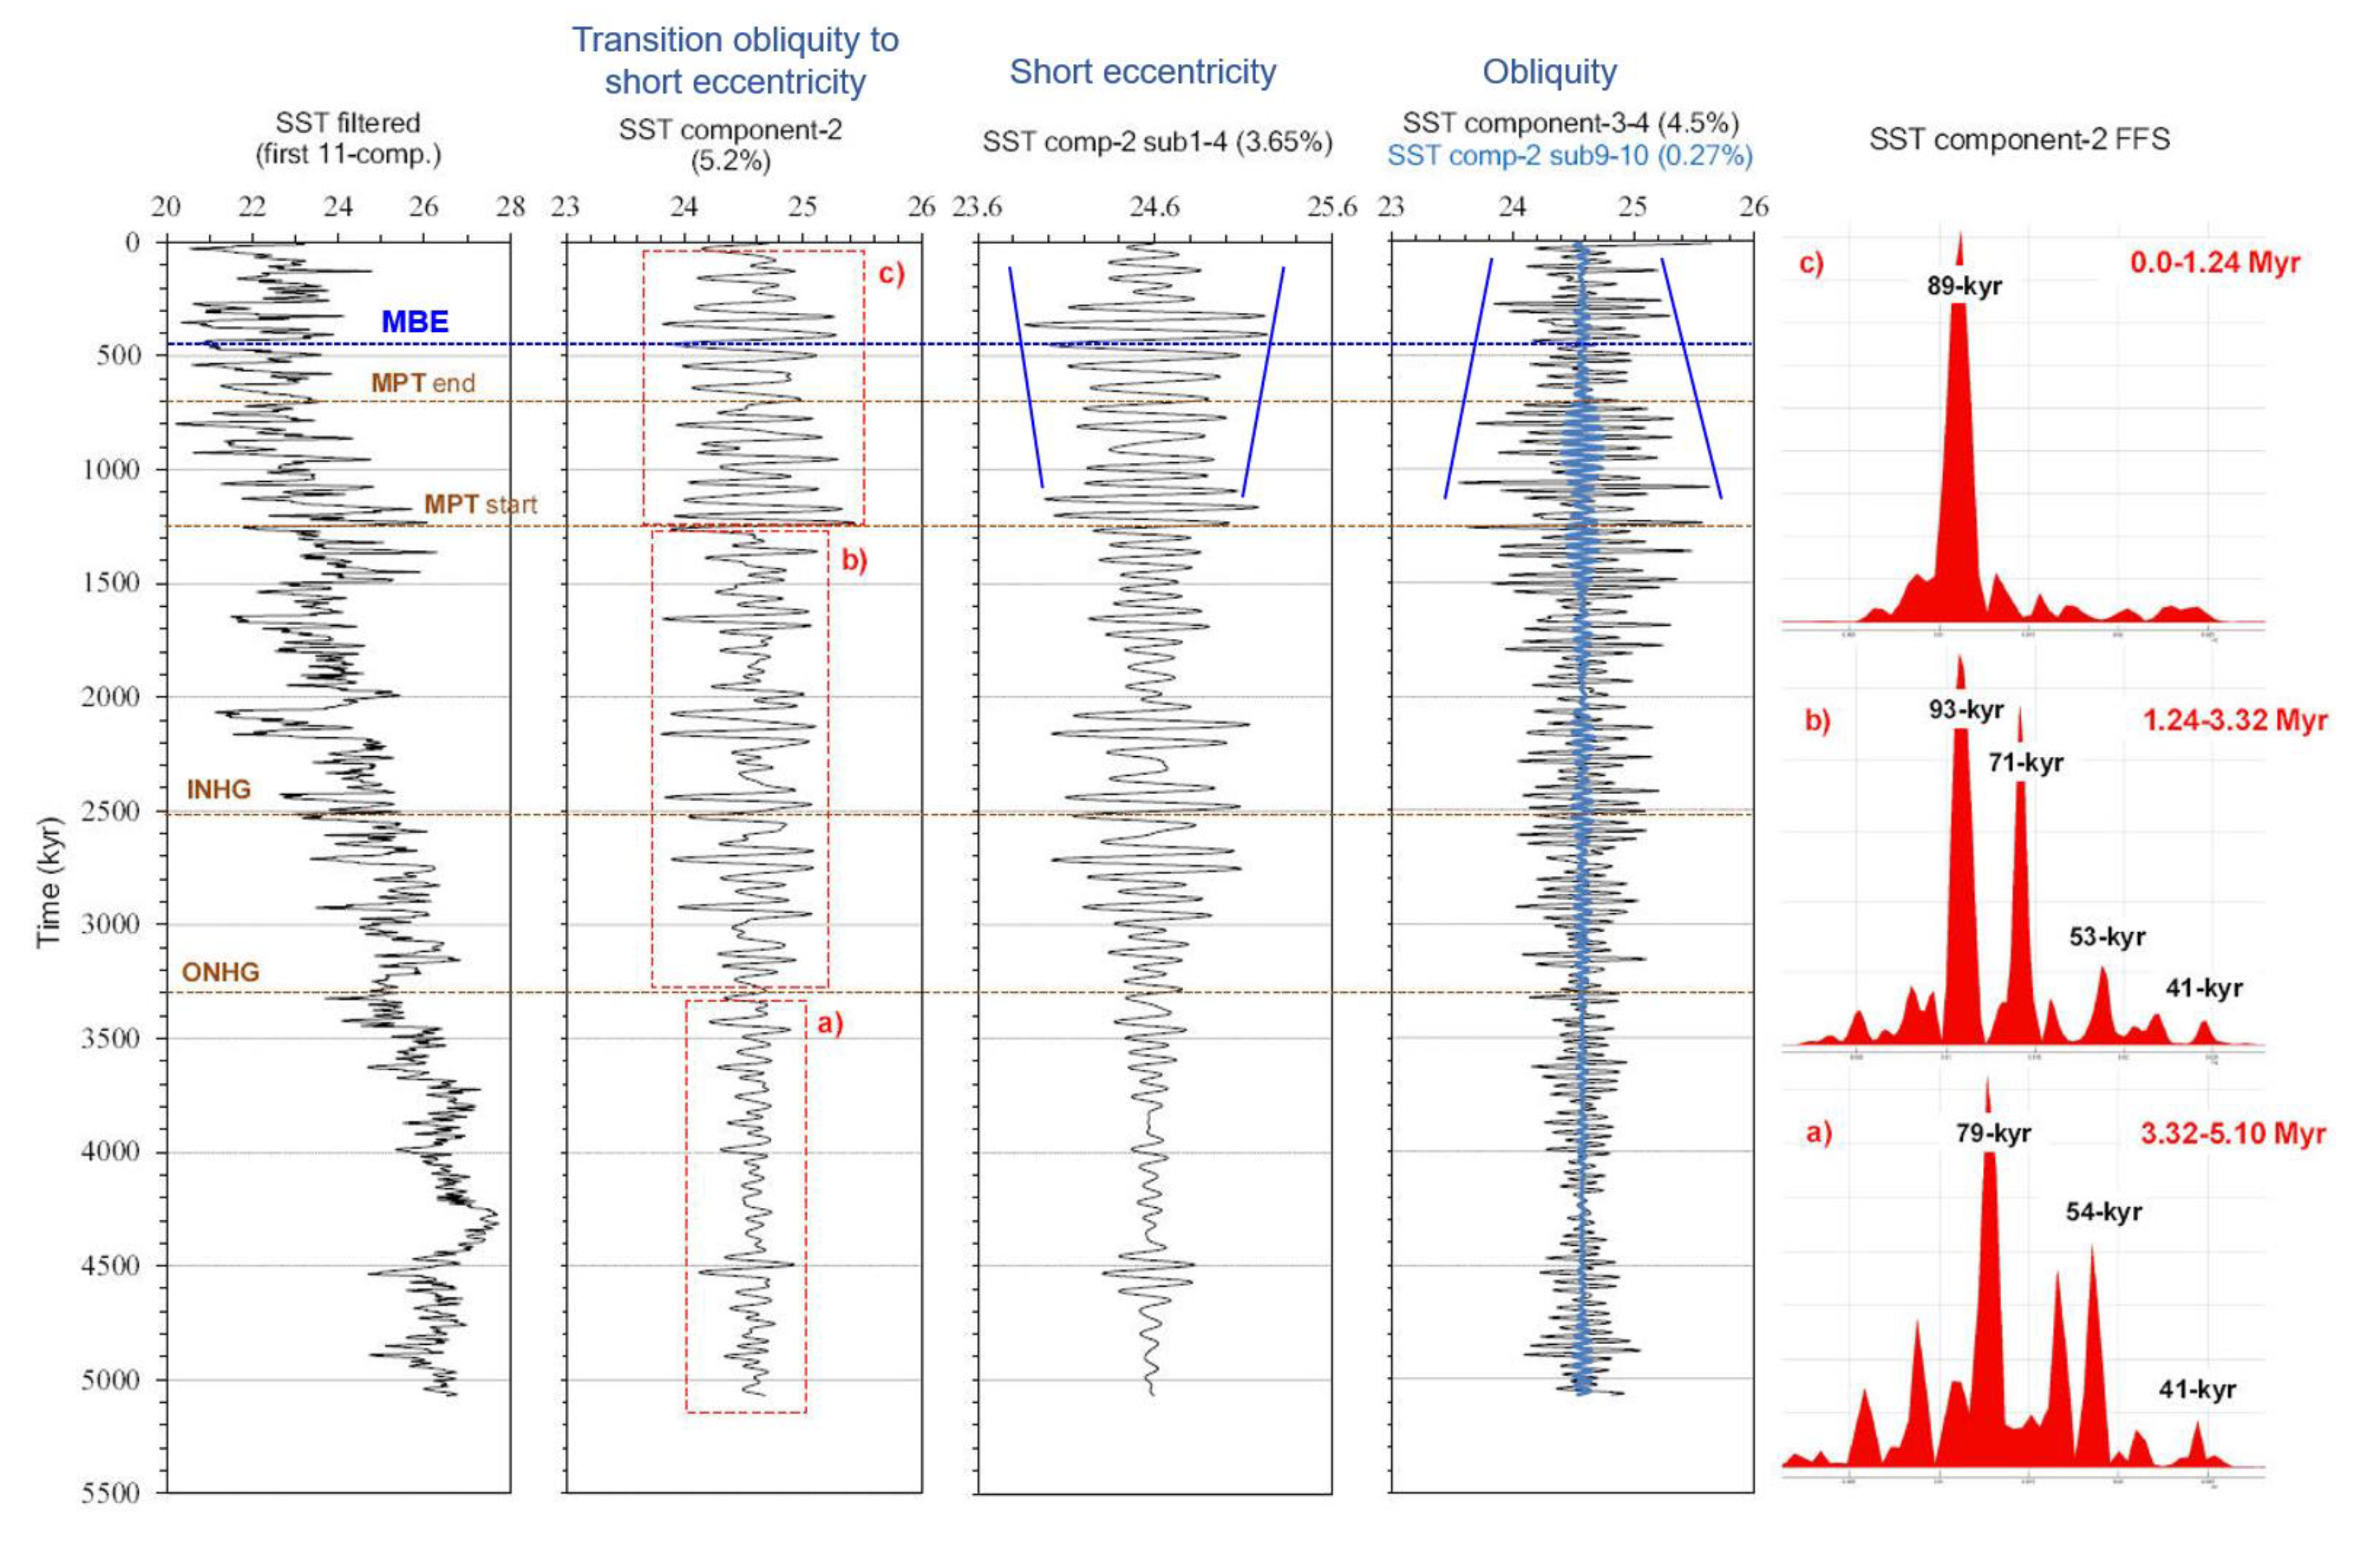
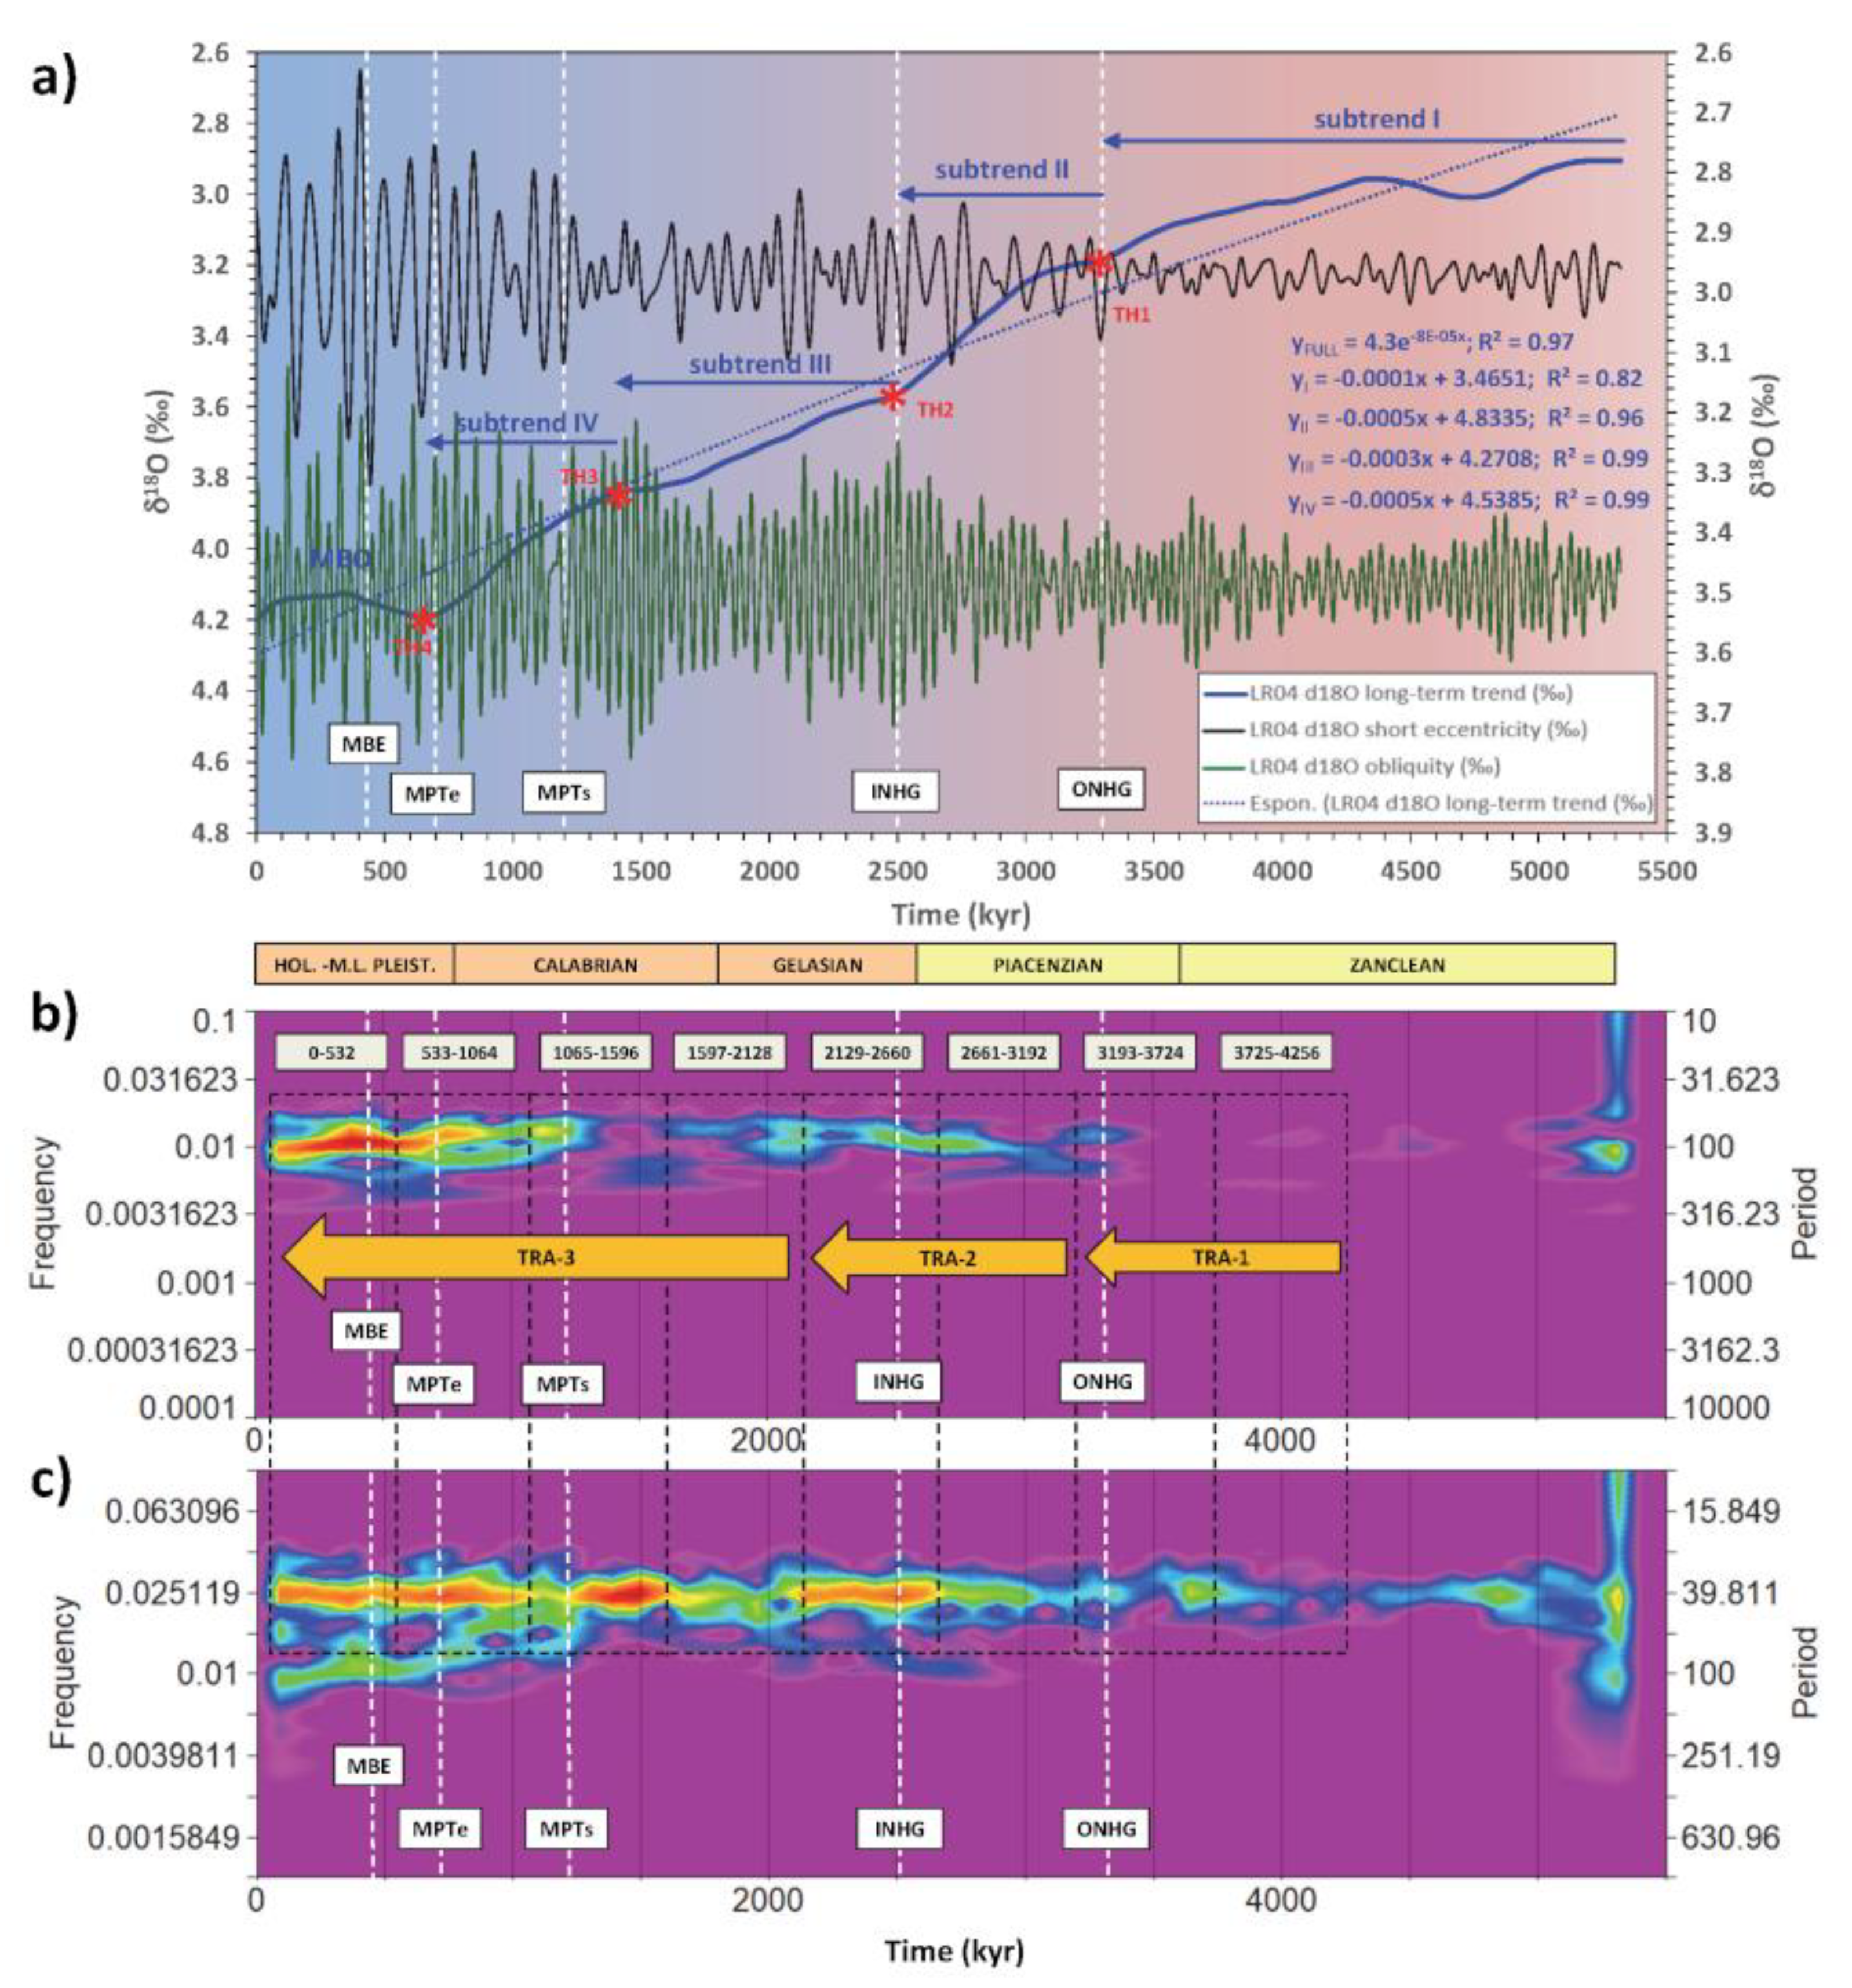
- The PCA model integrating Plio-Pleistocene orbital Rs data and the long-term components of both LR04 δ18O and Site 846 SST records identifies two PCs that are strictly related to the δ18O/SST short eccentricity/precession (PC-1) and obliquity (PC-2) amplification. Both are linked to the long-term δ18O enrichment and SST reduction. PC-2 factor highlights the post-MPT anomalous depletion of the obliquity Rs. These factors corroborate the latent link among the increasing amplitude of all orbital climate responses, the obliquity damping and the Earth’s icy-state developed through four stages of step-wise growth (subtrend I to IV).
- The spread of Plio-Pleistocene PCs factor exhibits two anticorrelation patterns of increasing absolute magnitude among forcing responses through time: positive spread showing high-obliquity associated with low-short eccentricity/precession Rs, and negative spread showing low-obliquity linked to high-short eccentricity/precession Rs. These response configurations are associated with three transition patterns of positive to negative spread including ONHG (Transition-1), INHG (Transition-2), and MBE (Transition-3), the latter being characterised by extremely high-magnitude and containing the MPT.
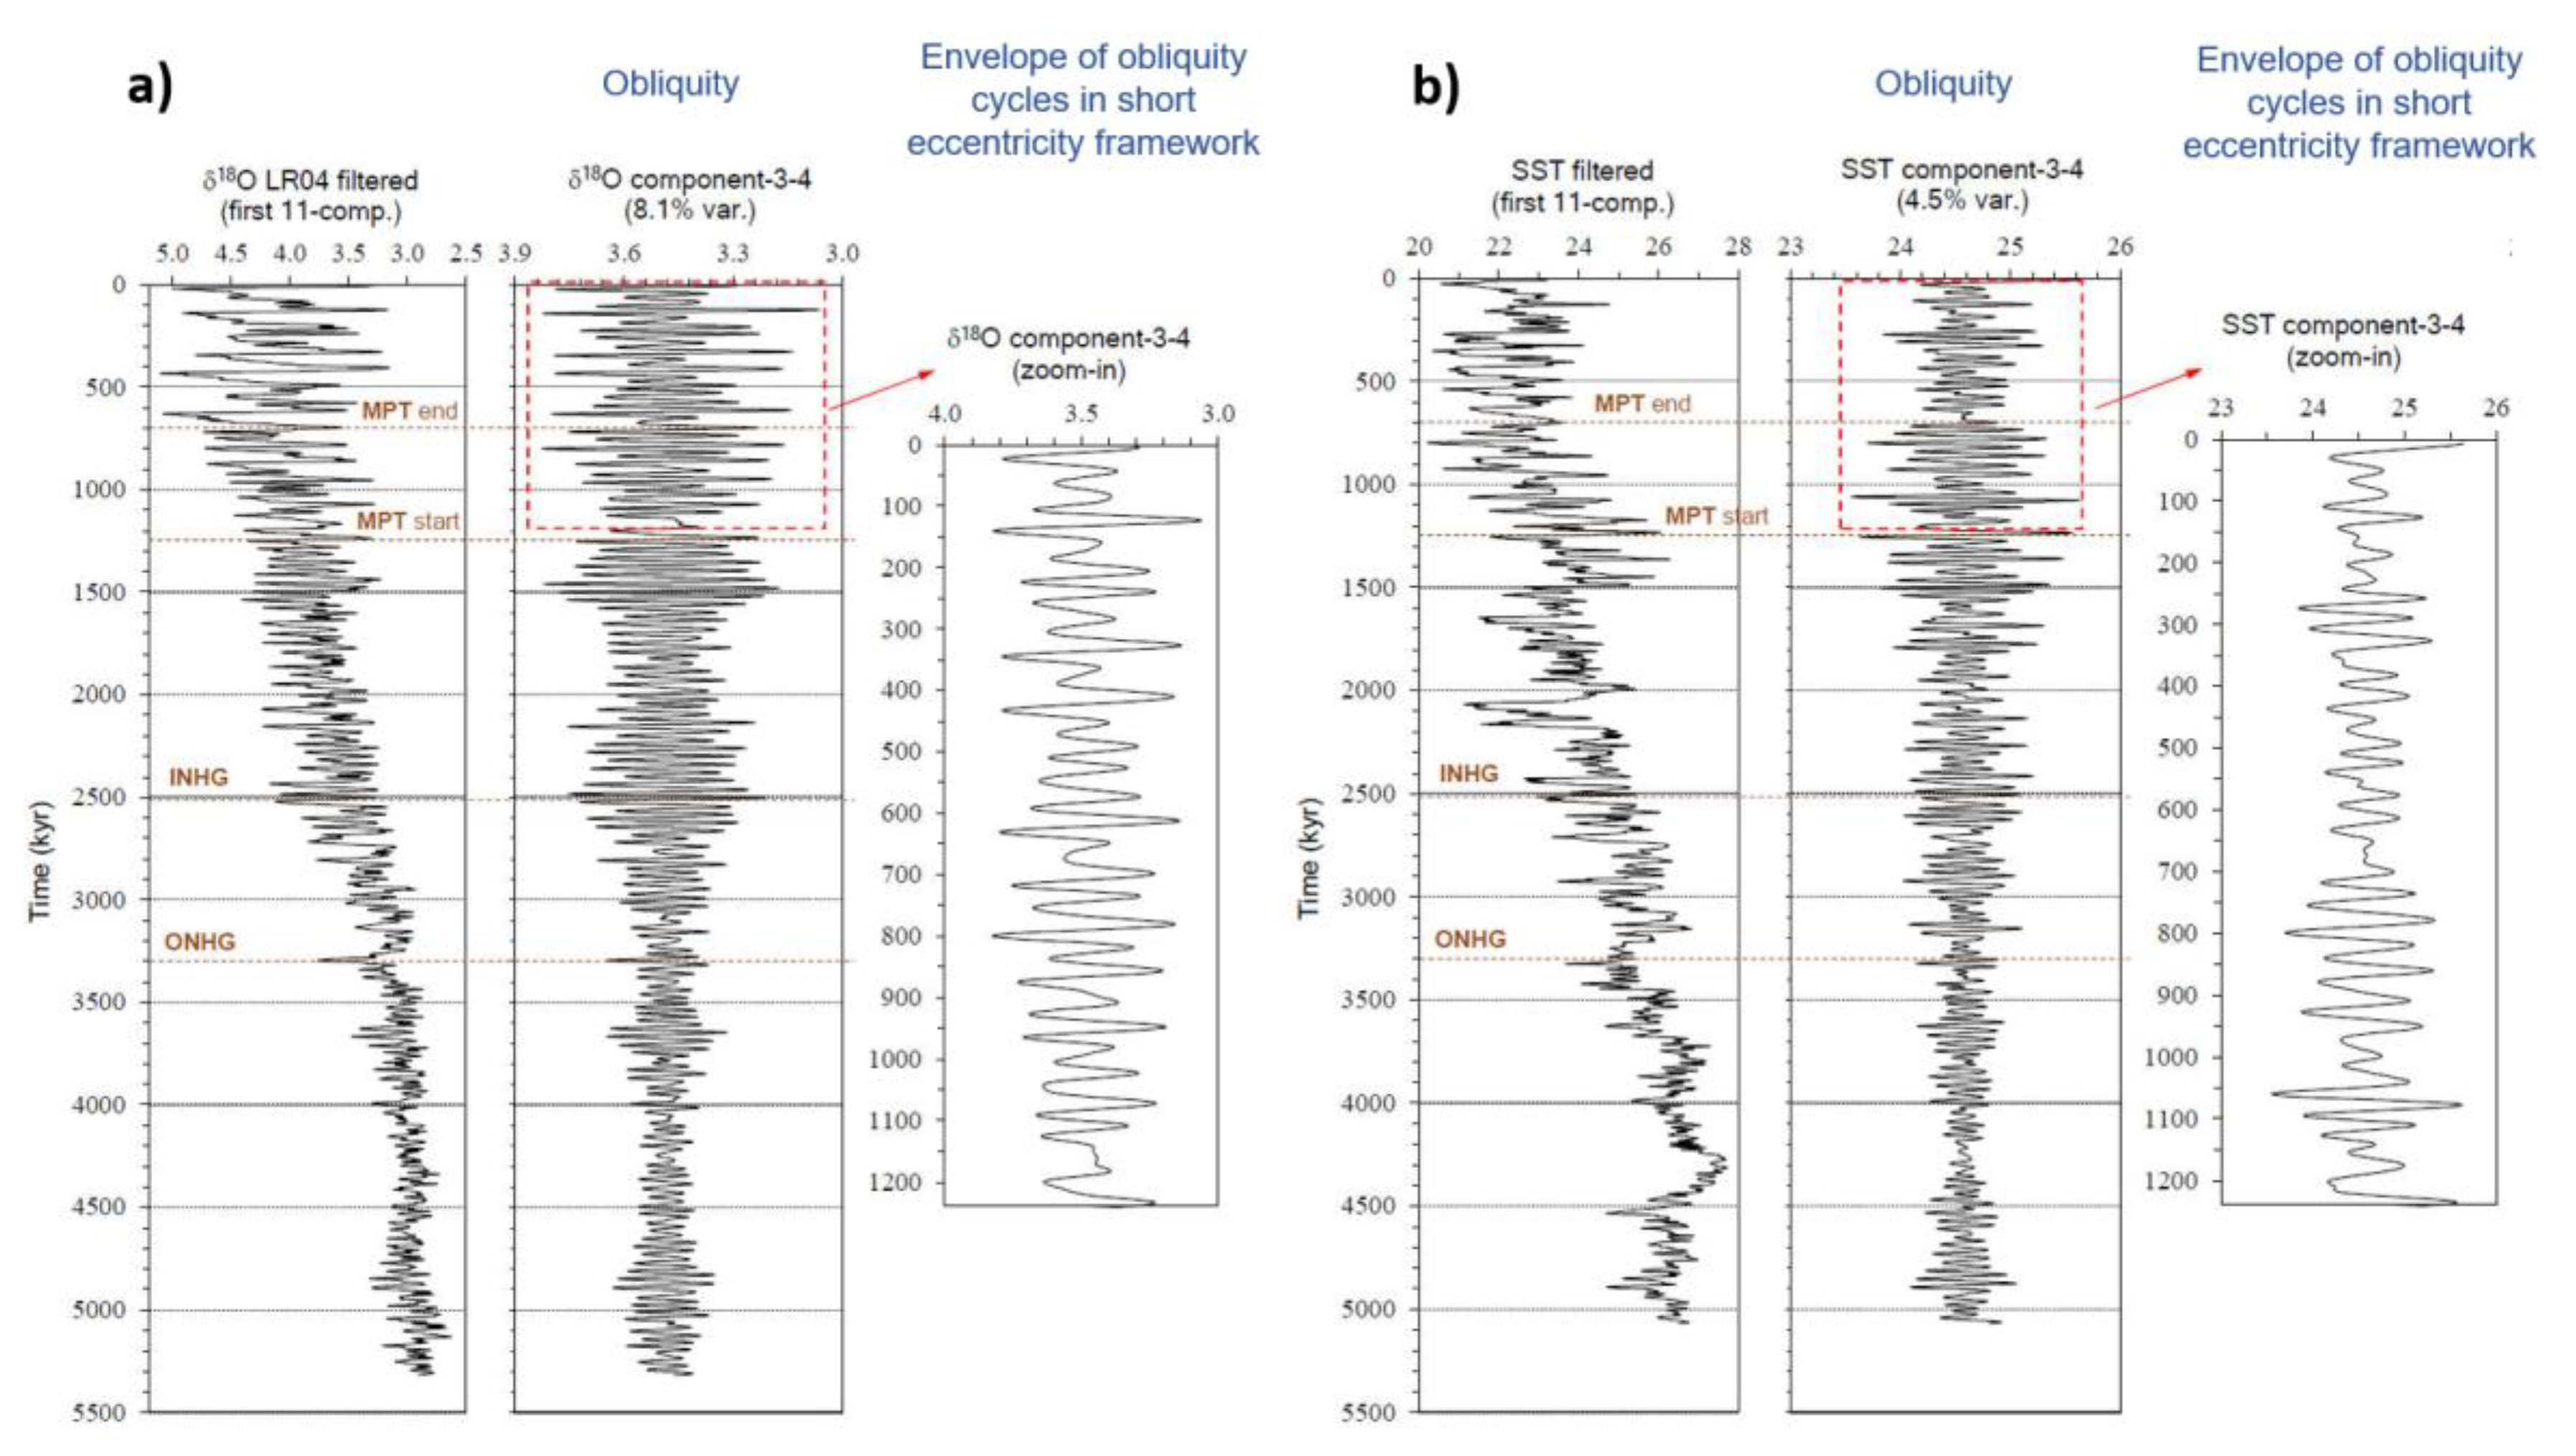
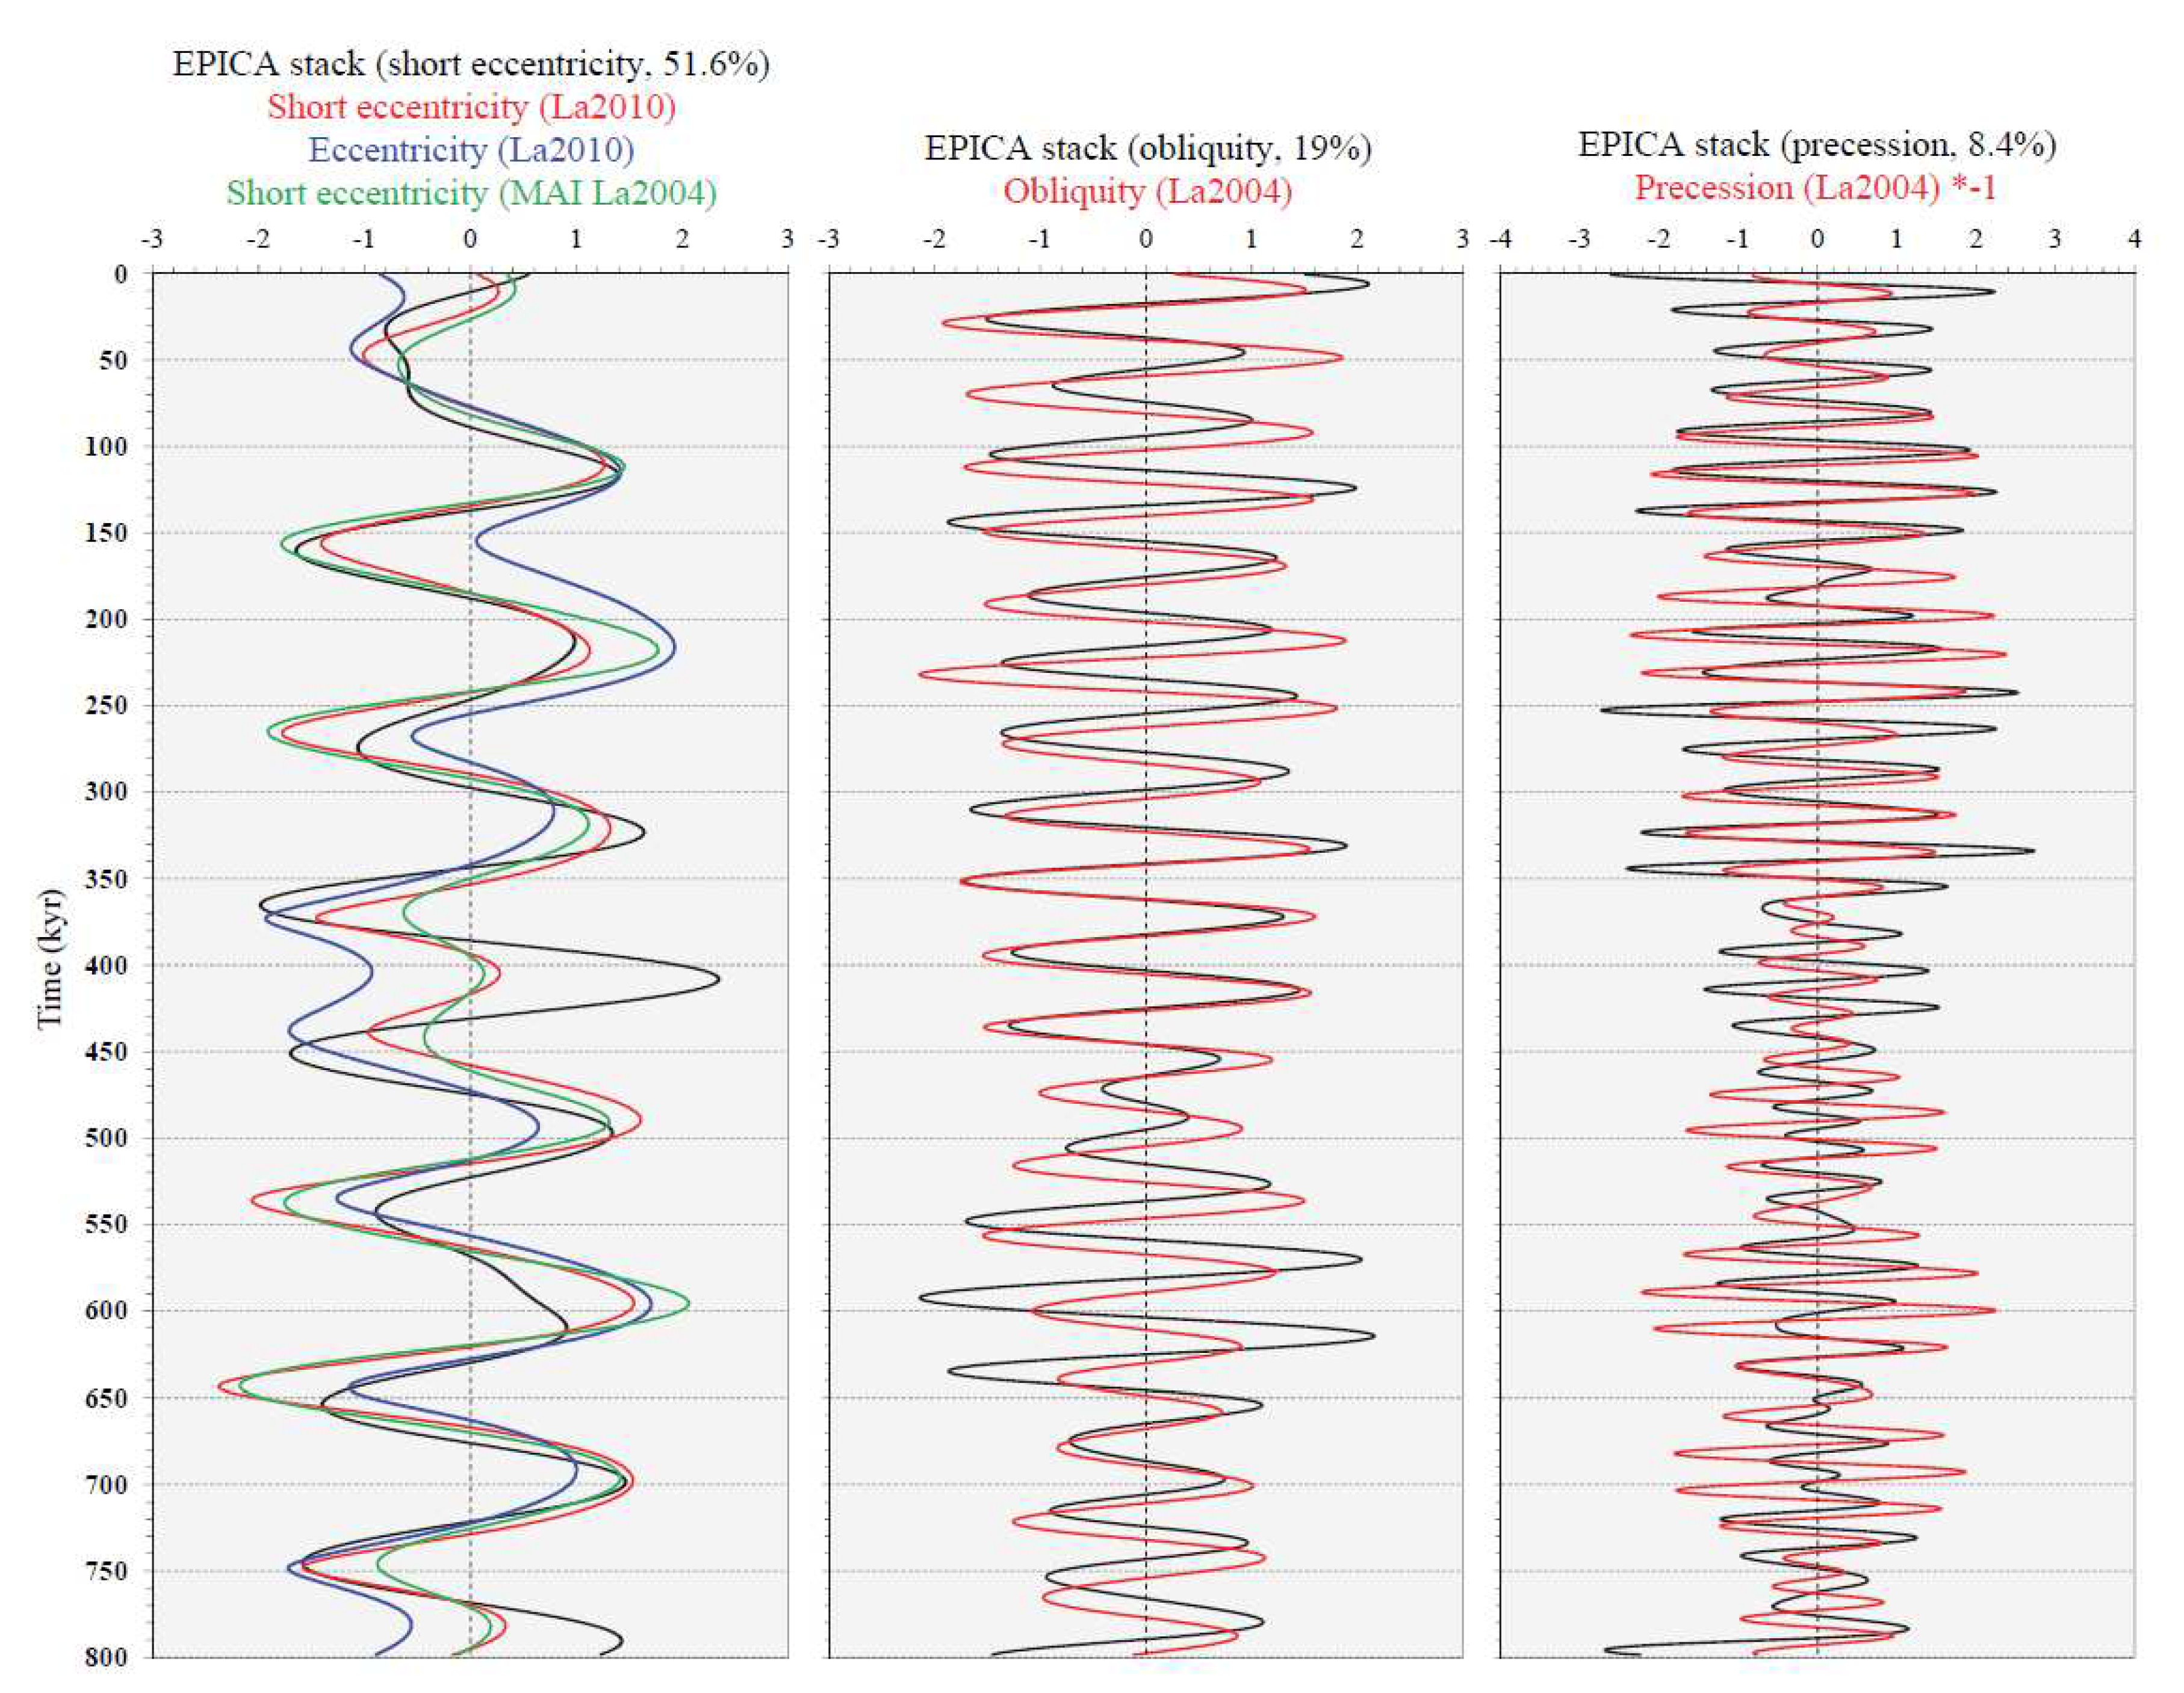
- EPICA orbital SSA-stacks, which are rescaled on Plio-Pleistocene variance, exhibit a short eccentricity estimate of 12.2%, which is very high compared to the global δ18O value of 6.5%. In addition, an obliquity estimate of 4.5% is very low compared to the δ18O value of 9.9%. This is in agreement with the results of the Rs analysis, indicating a post-MPT short eccentricity amplification vs. obliquity damping.
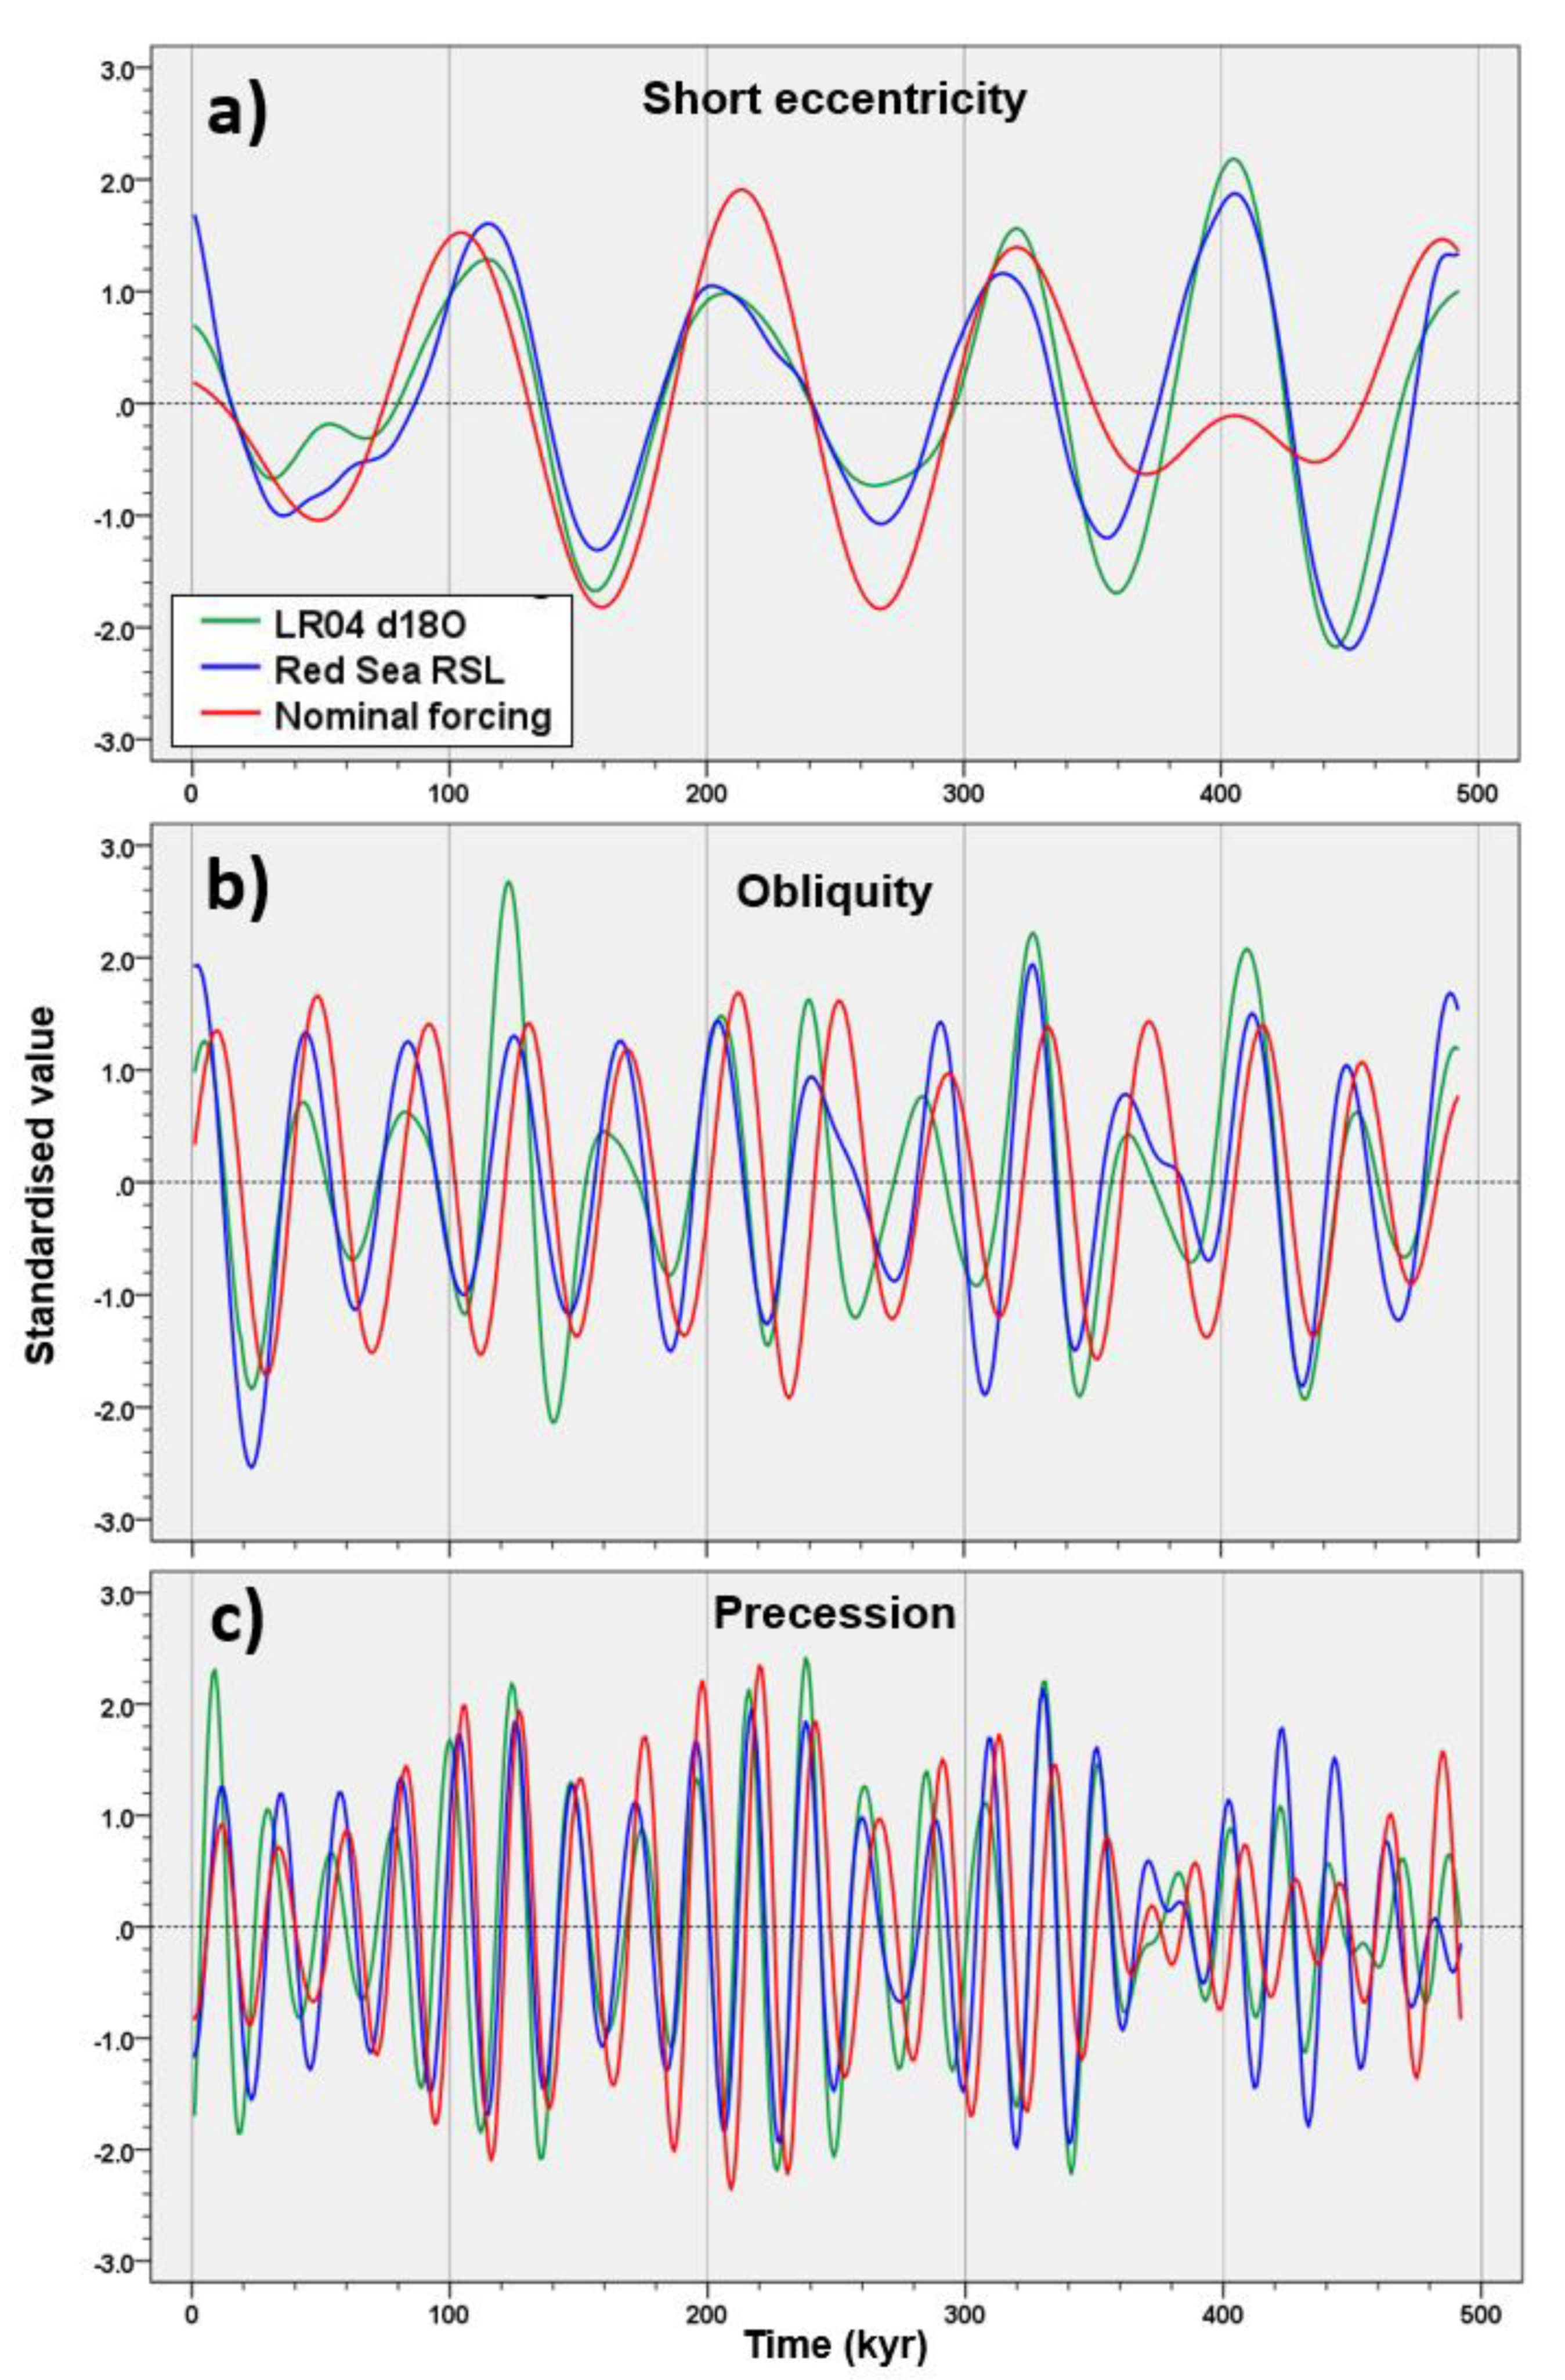
- Orbital SSA-components from the RSL record of the Red Sea exhibit a Plio-Pleistocene rescaled variance consistent with that of EPICA: short eccentricity (14.5%), obliquity (3.1%), and precession (2.8%). These data suggest post-MPT short eccentricity amplification vs. obliquity damping even in ESL fluctuations.
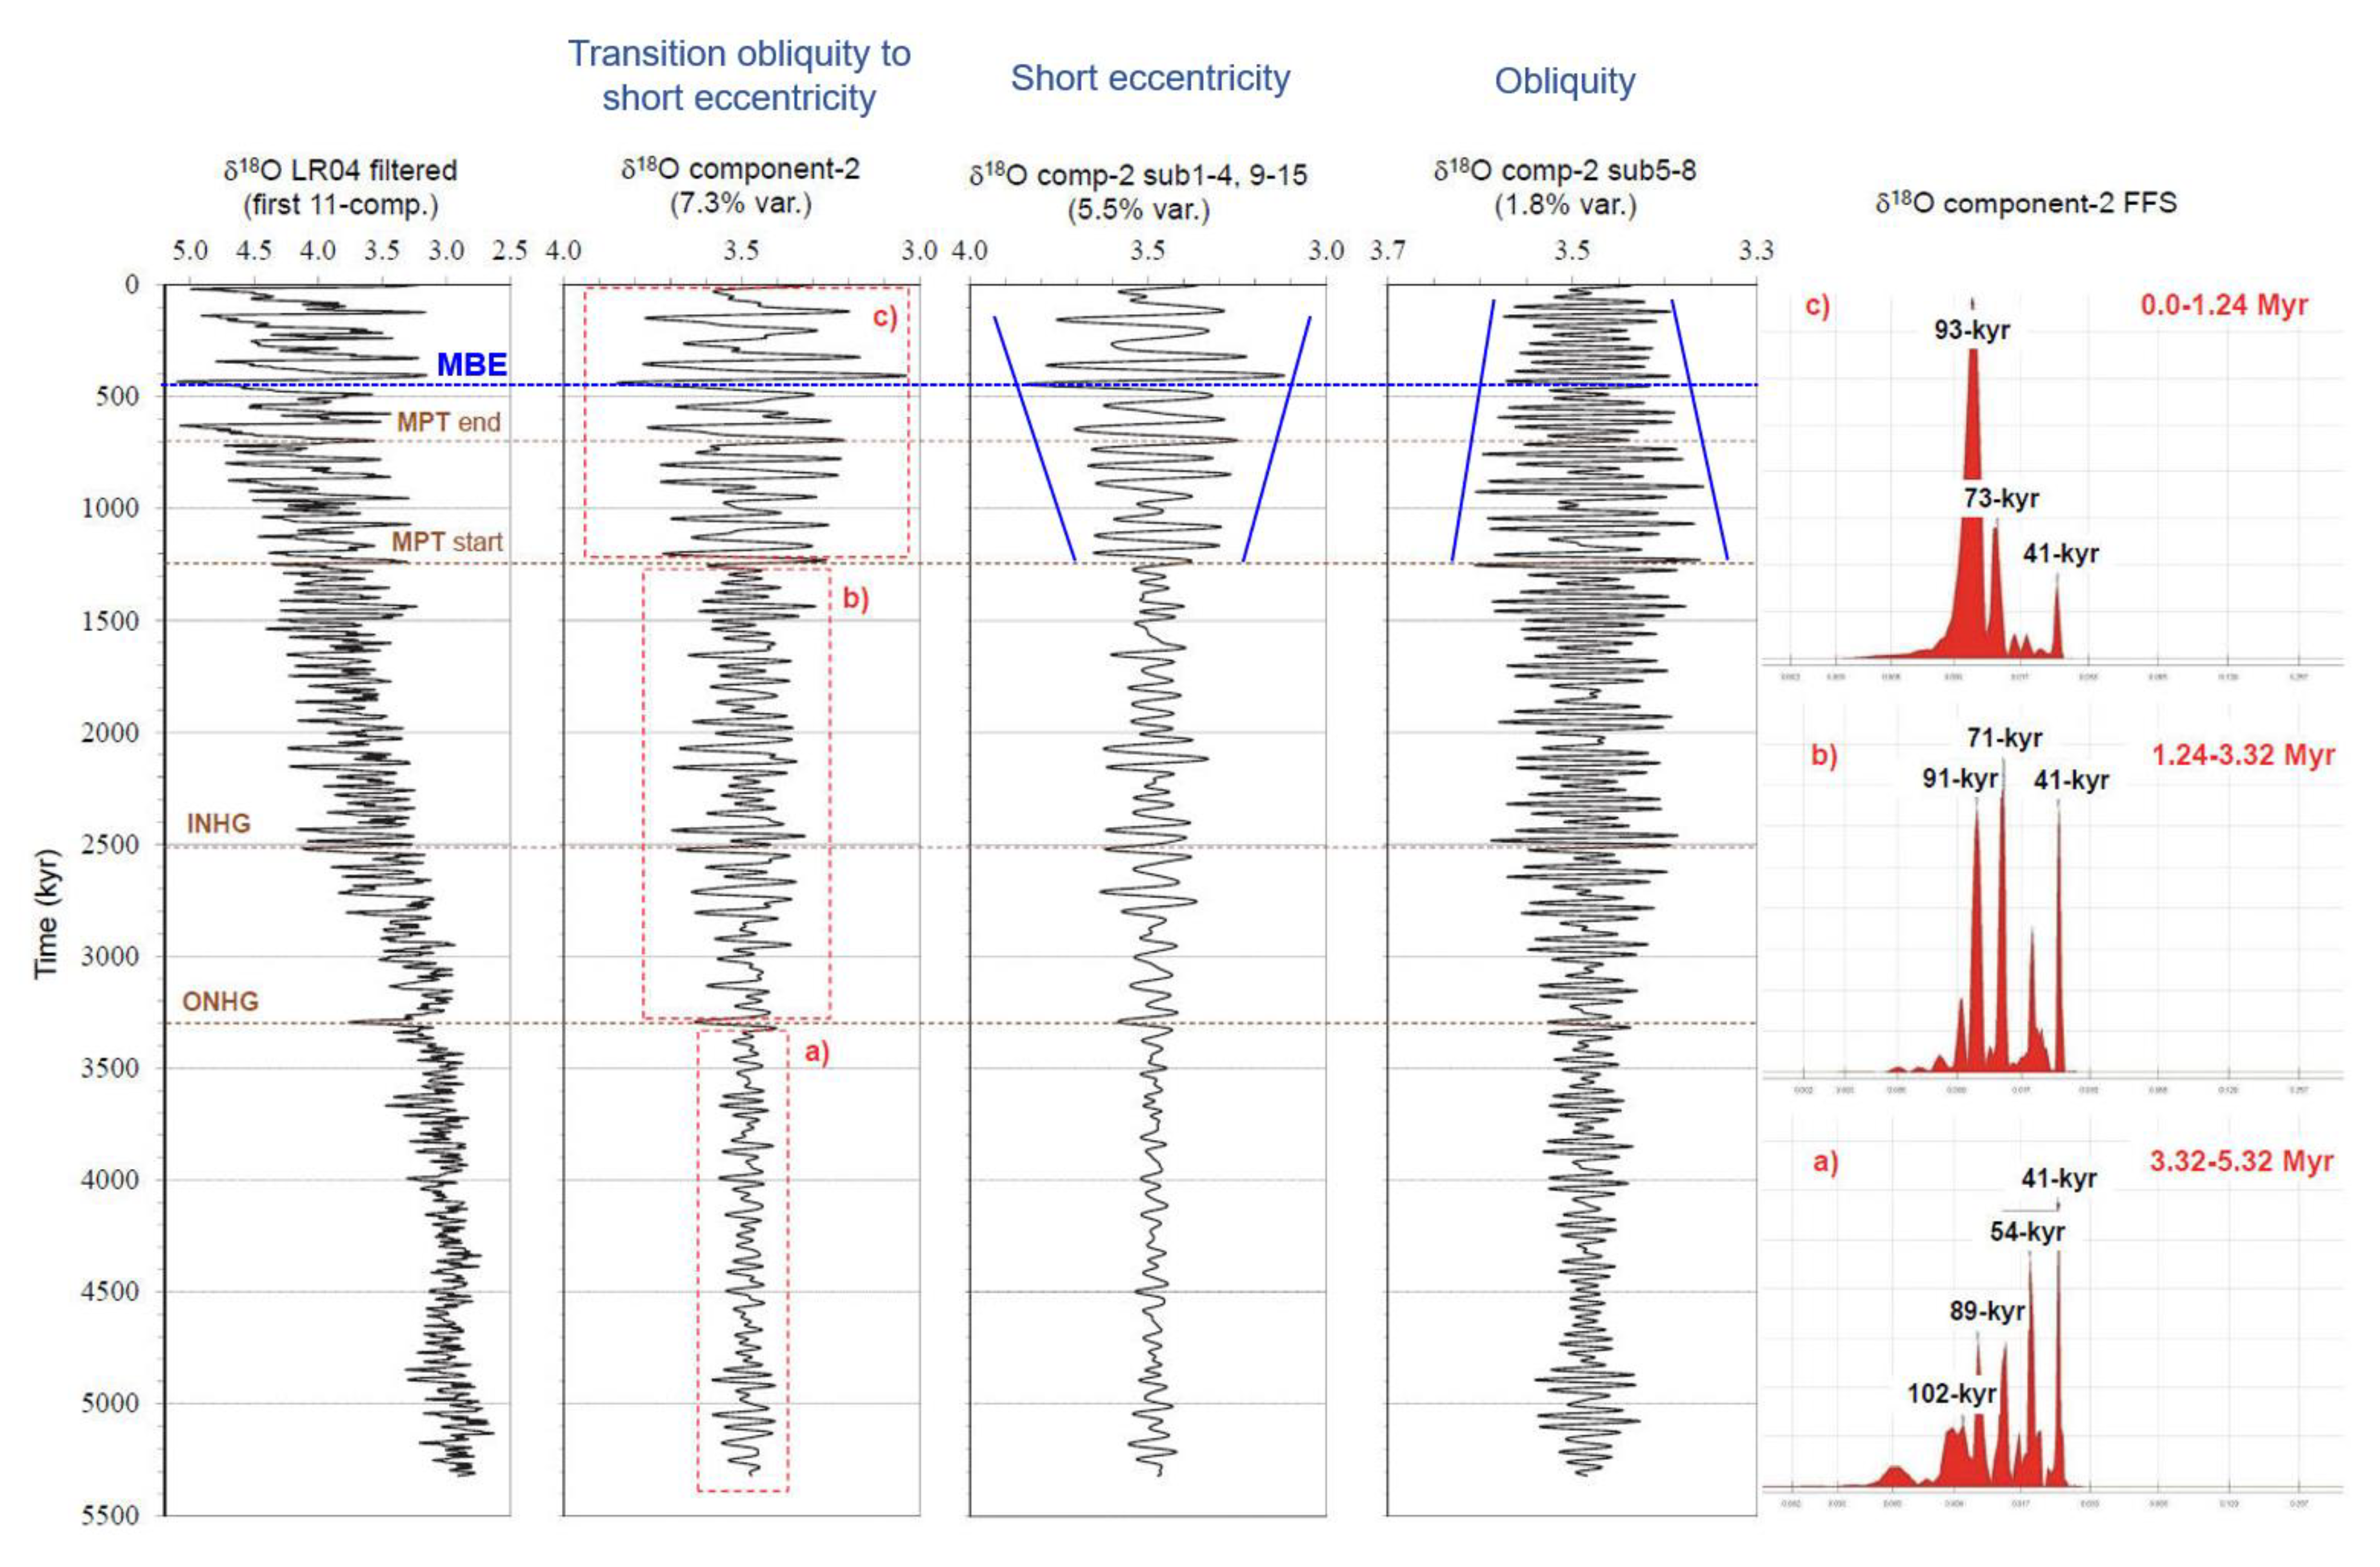
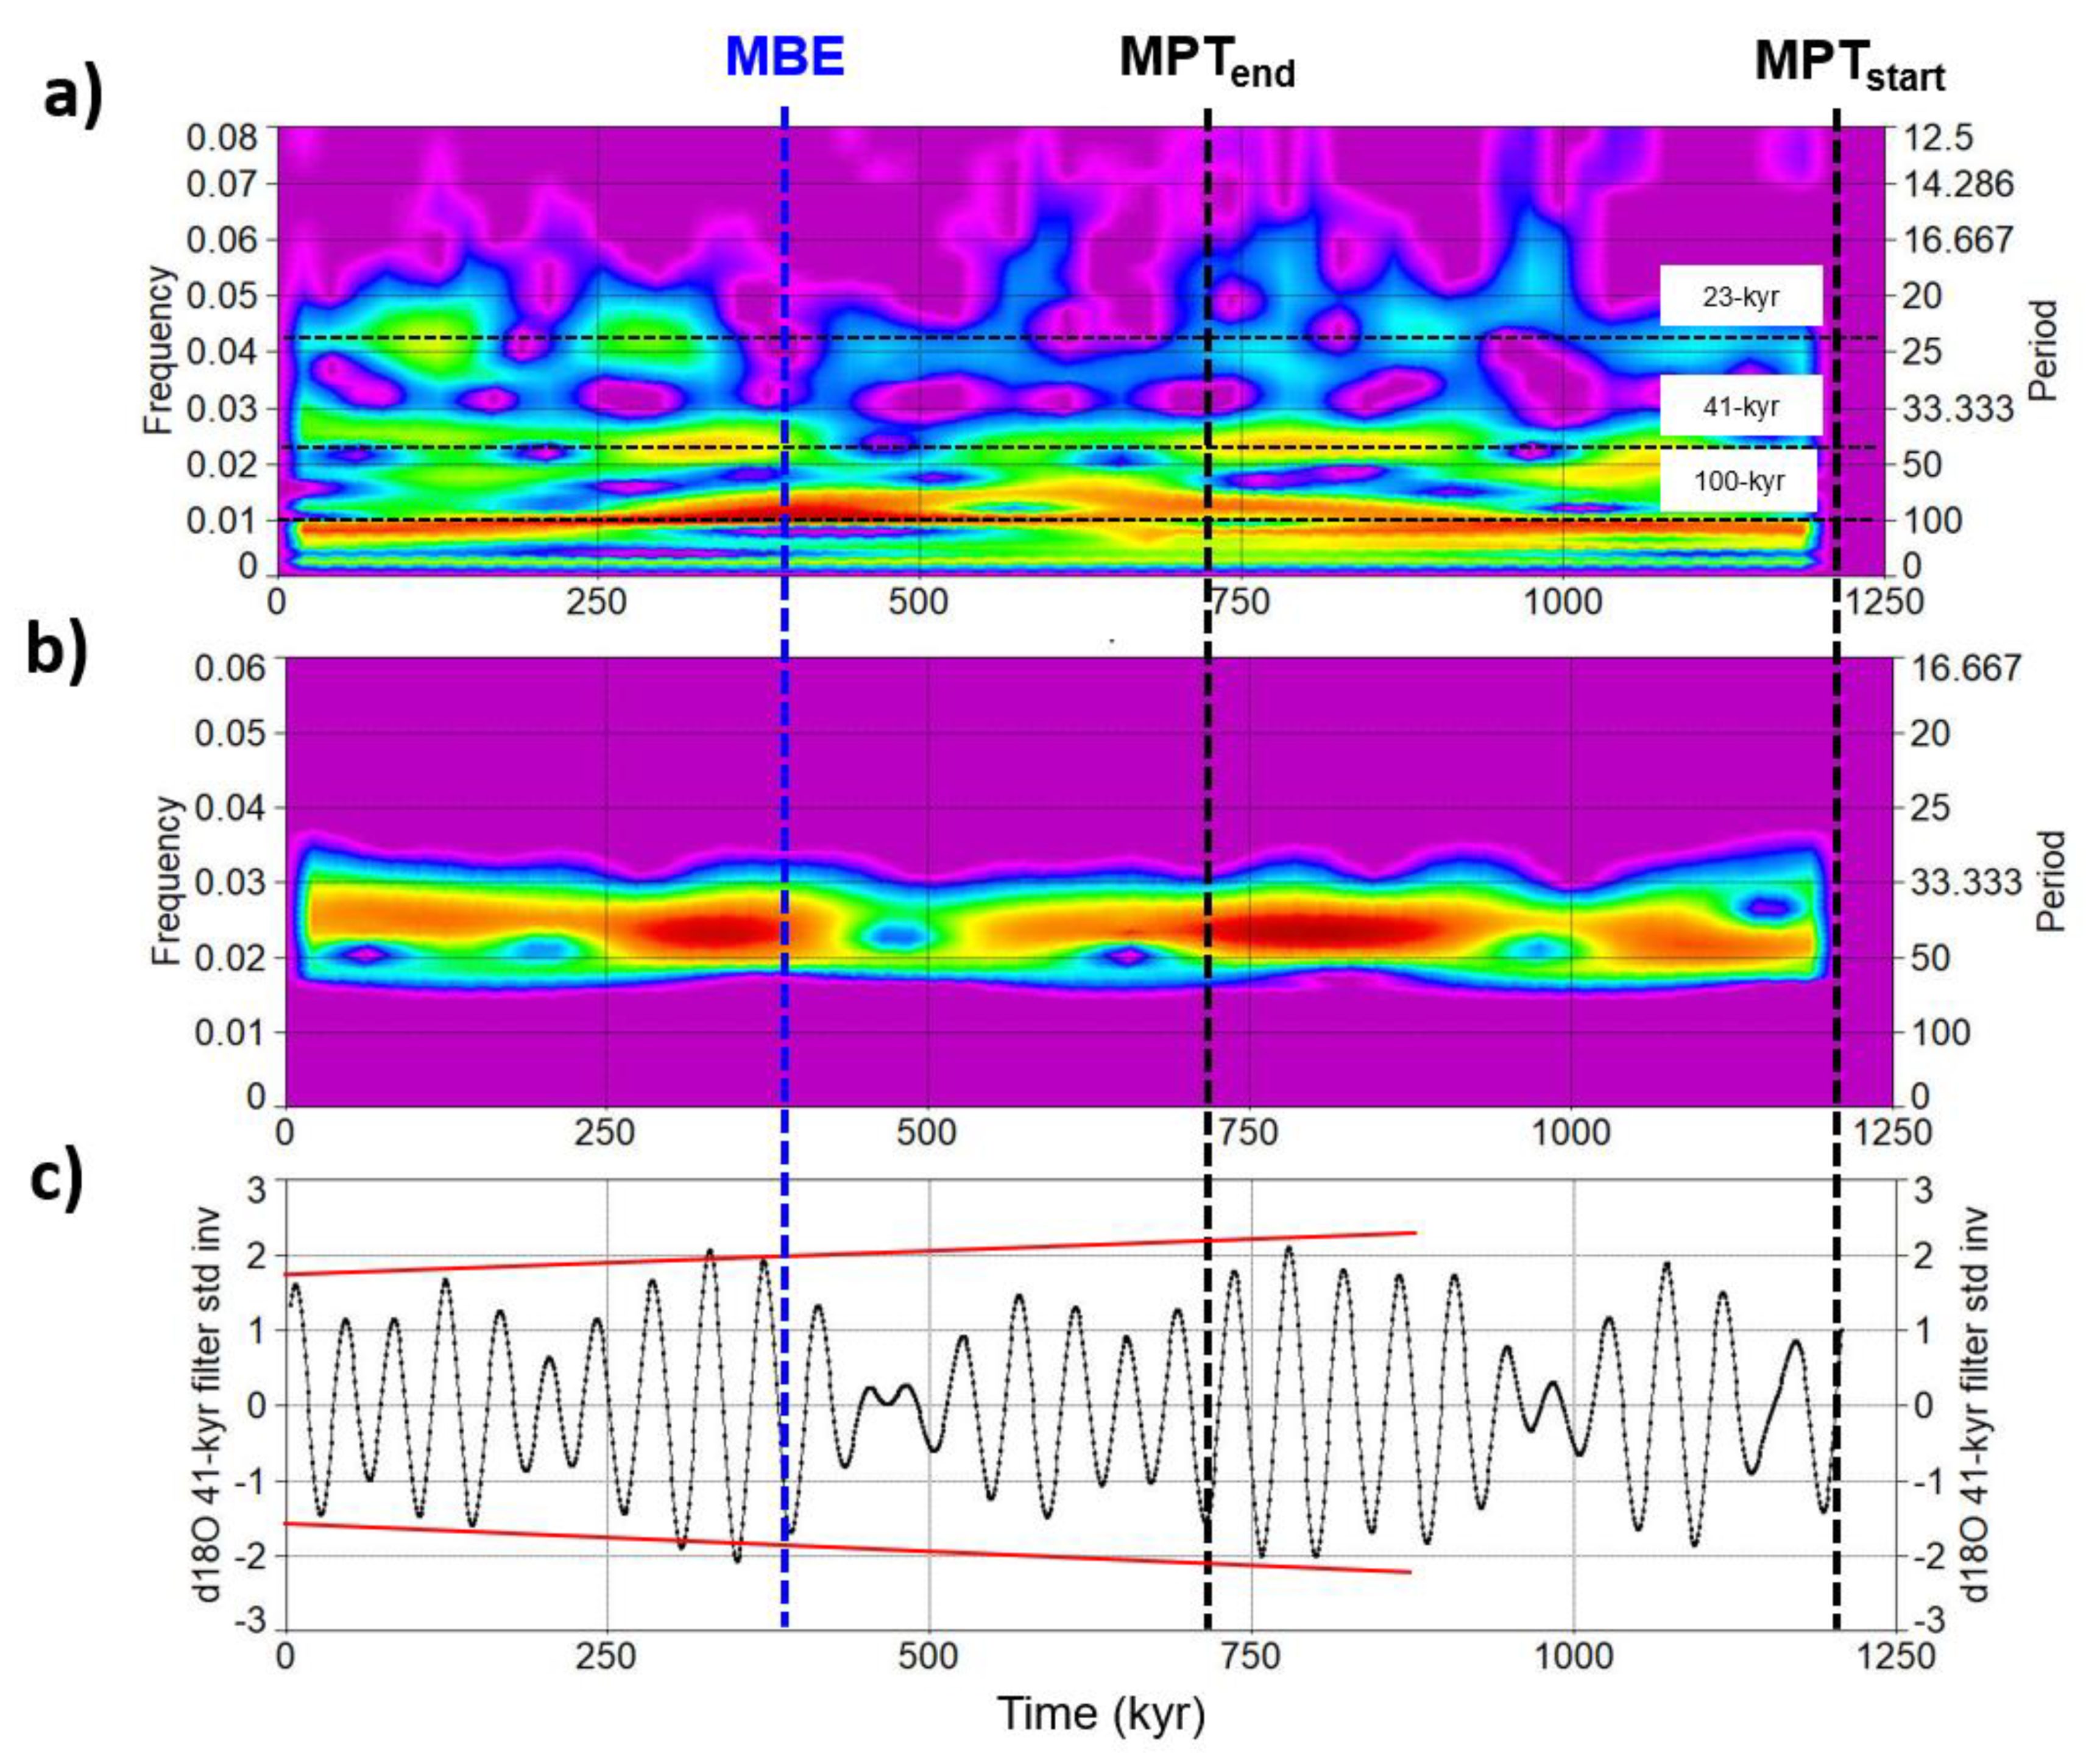
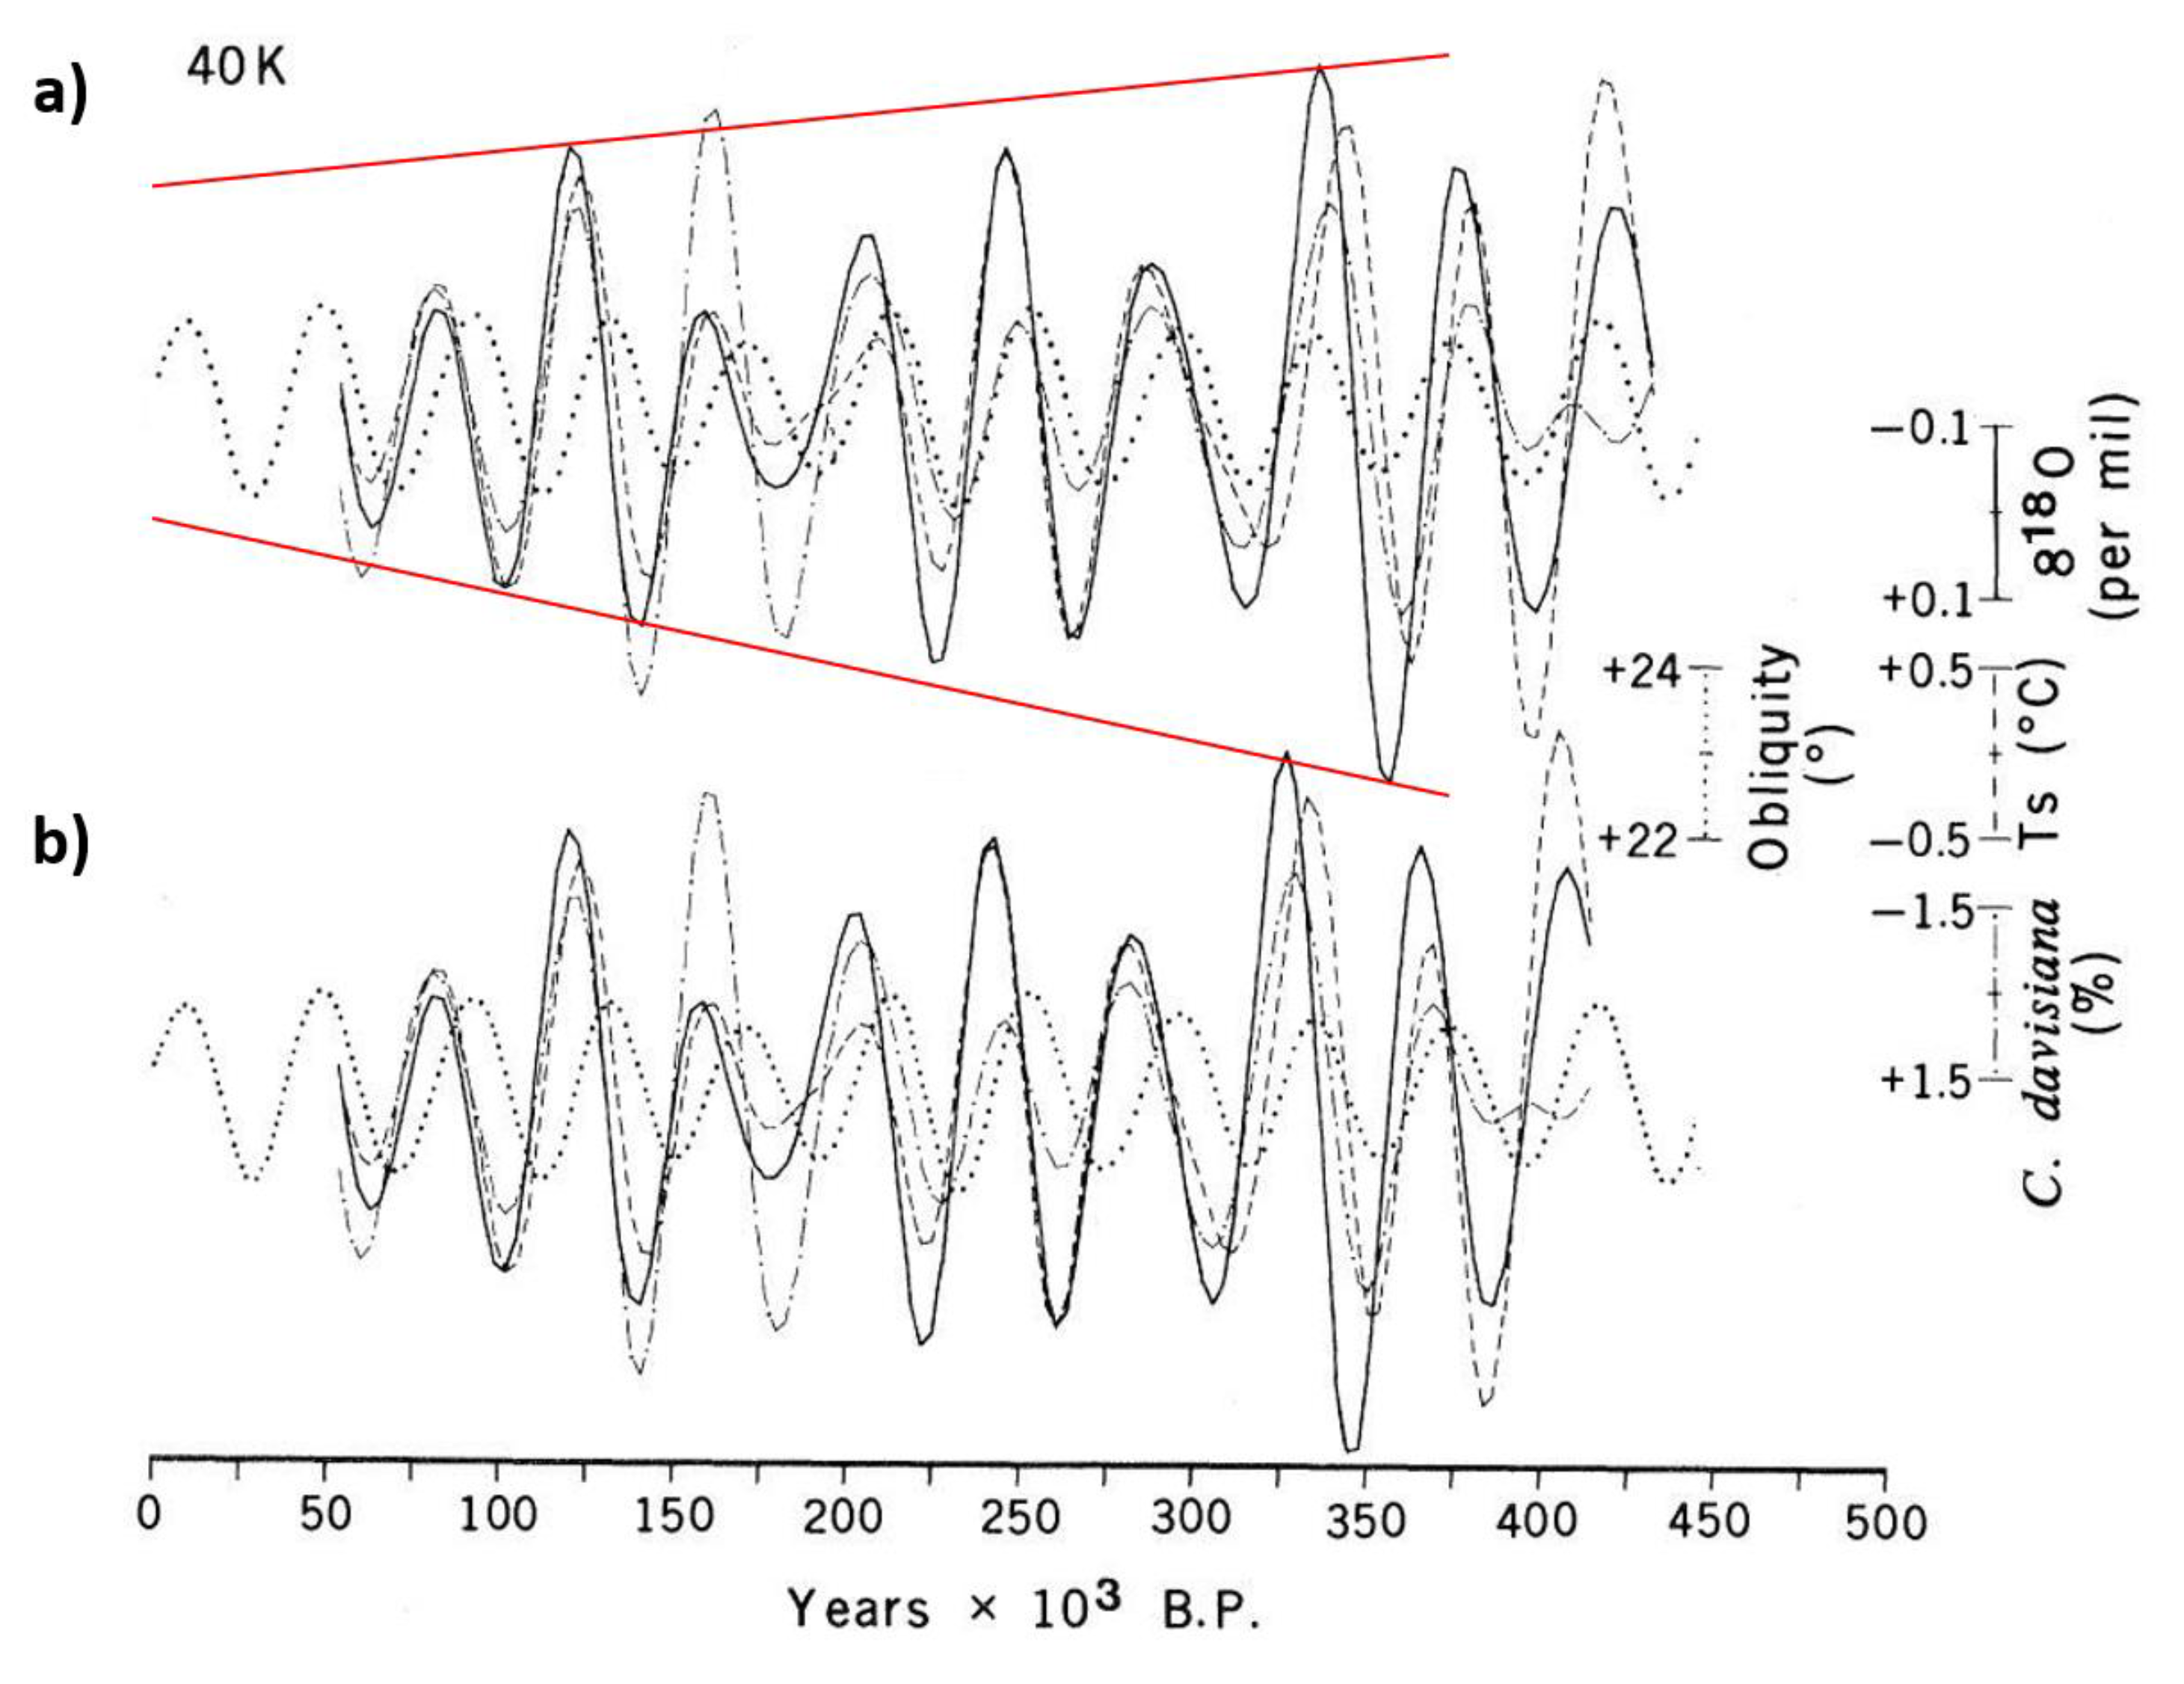
- Antarctic SSA-structural signal observation of two or three low-amplitude 41-kyr obliquity peaks (glacial/interglacial) embedded in a weak ~93/75-kyr short eccentricity framework determined from dD, CO2, and CH4 component-2s, are very similar in shape to the global LR04 δ18O and Site 846 equatorial Pacific SST component-3-4s during the MPT. These shapes may be further evidence of an obliquity attenuation phenomenon linked to the short eccentricity, and seem observational reminiscent of the ‘obliquity-cycle skipping’ model.
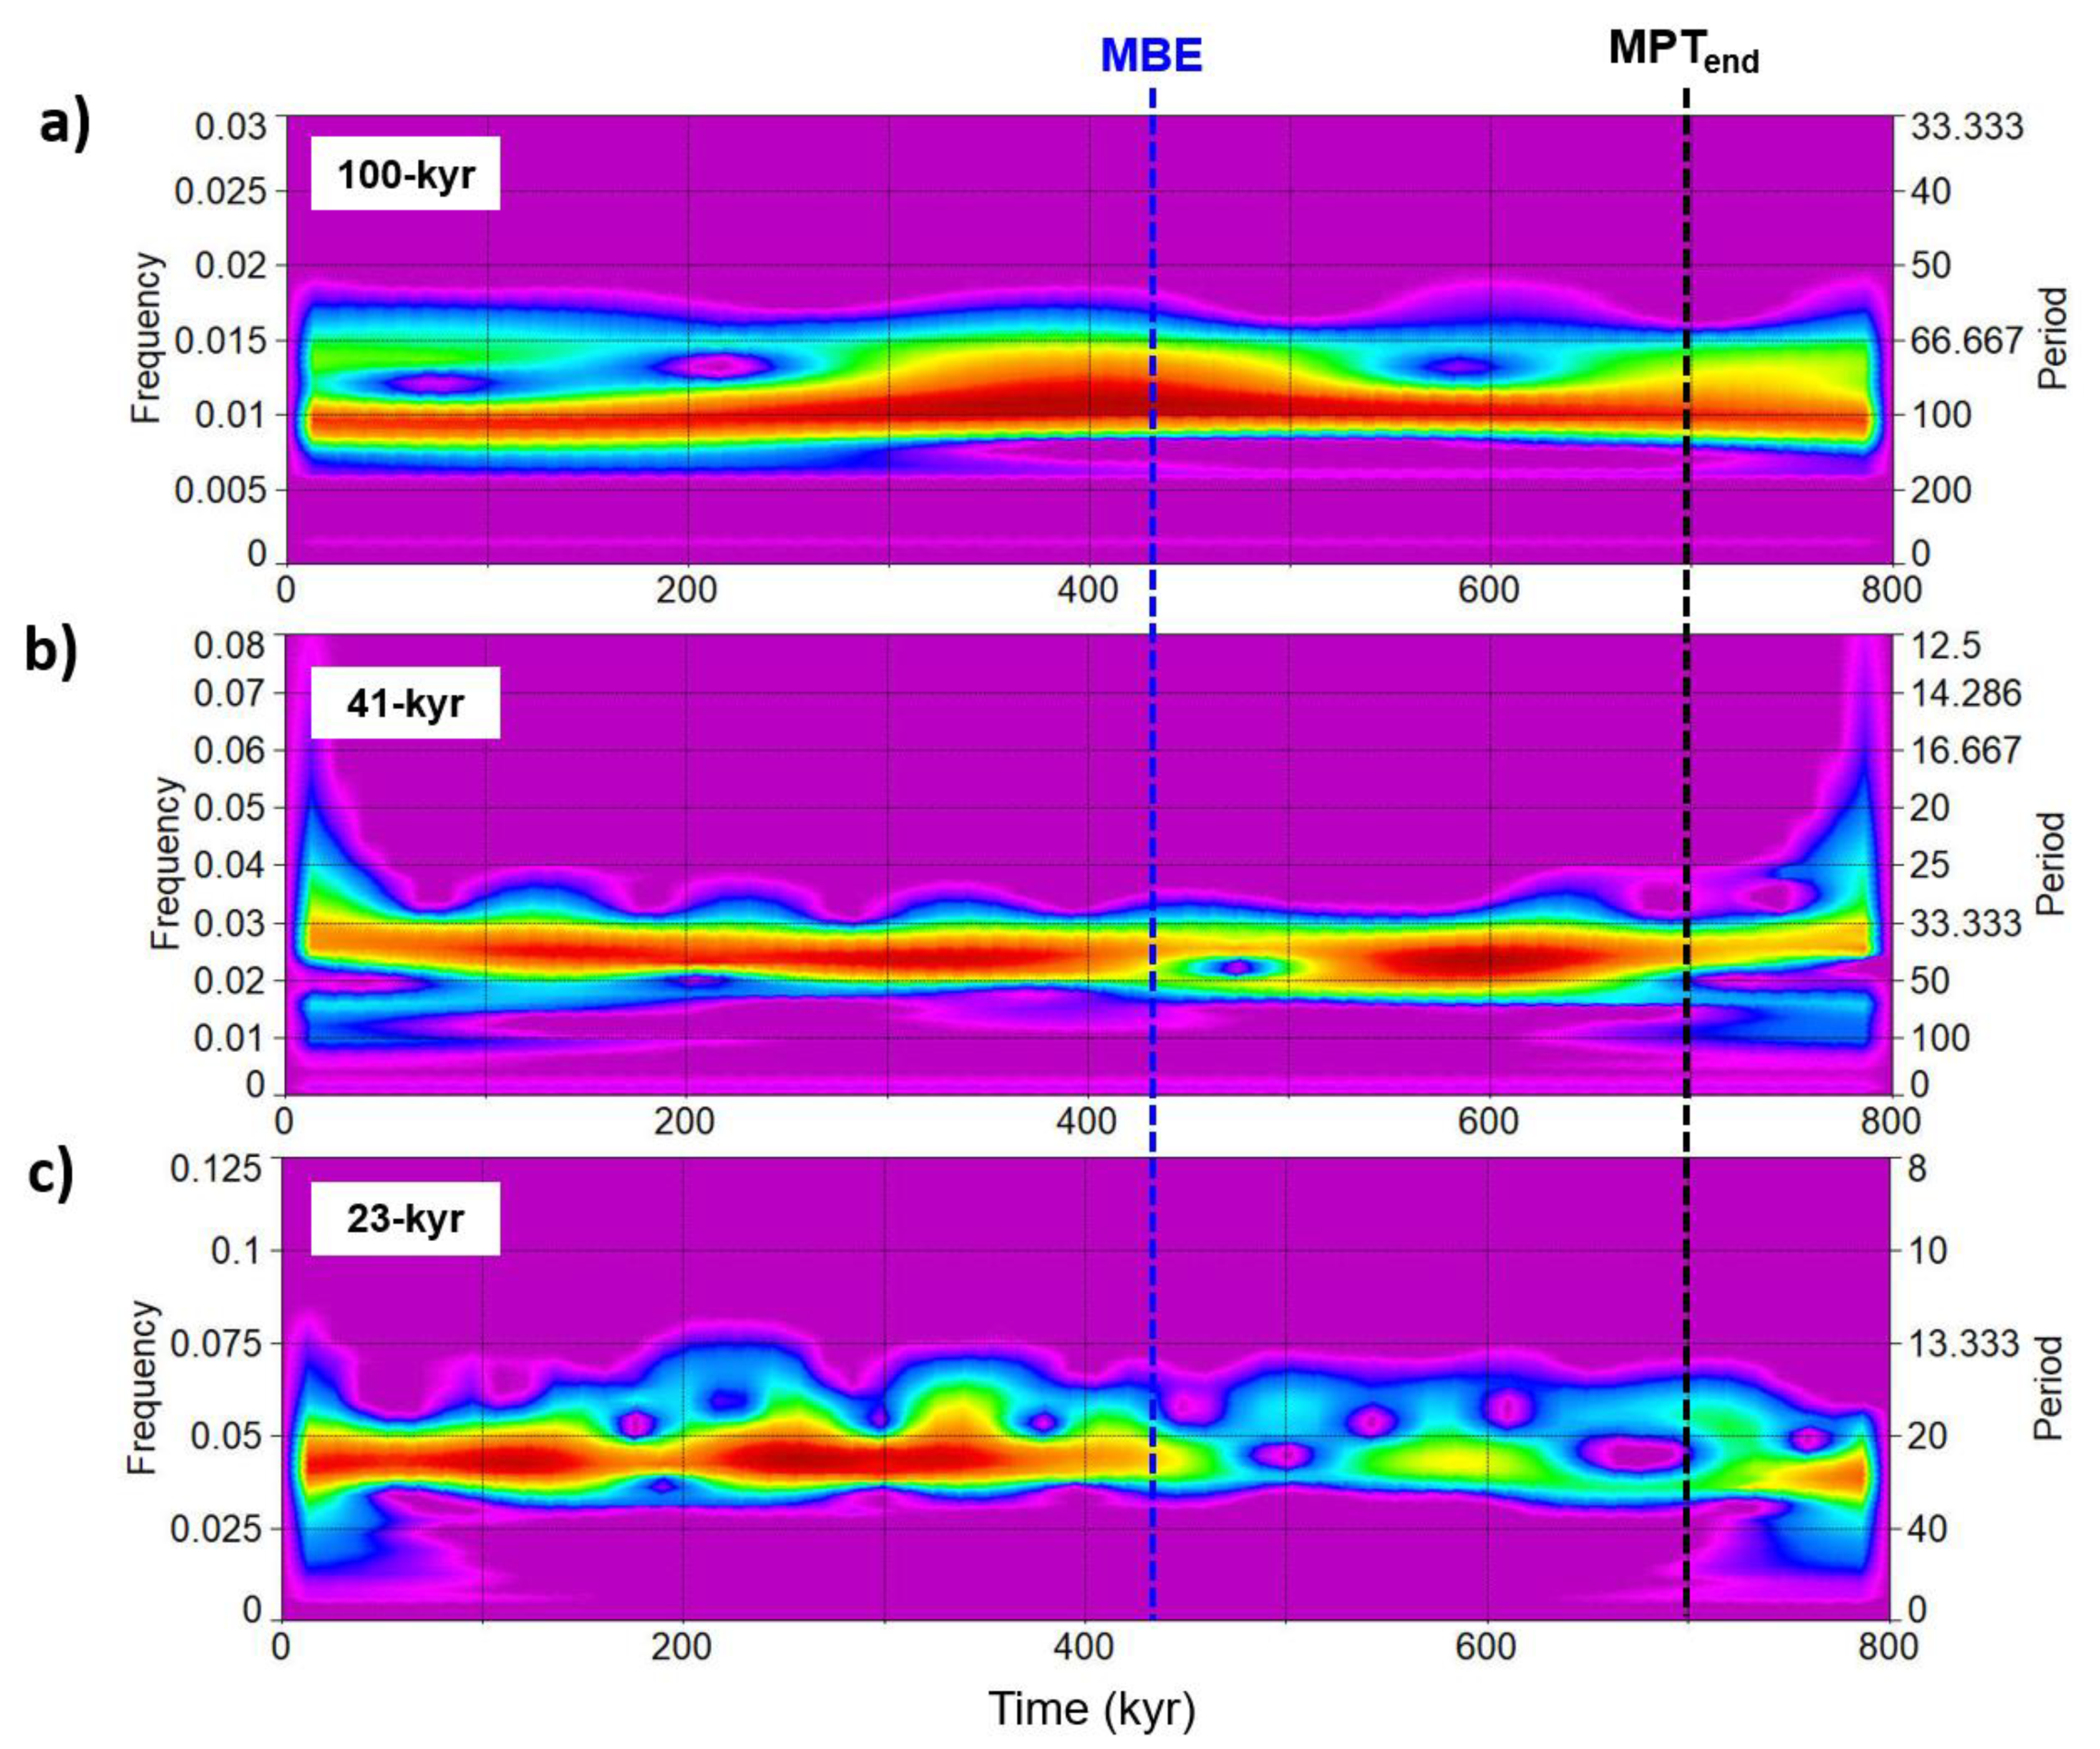
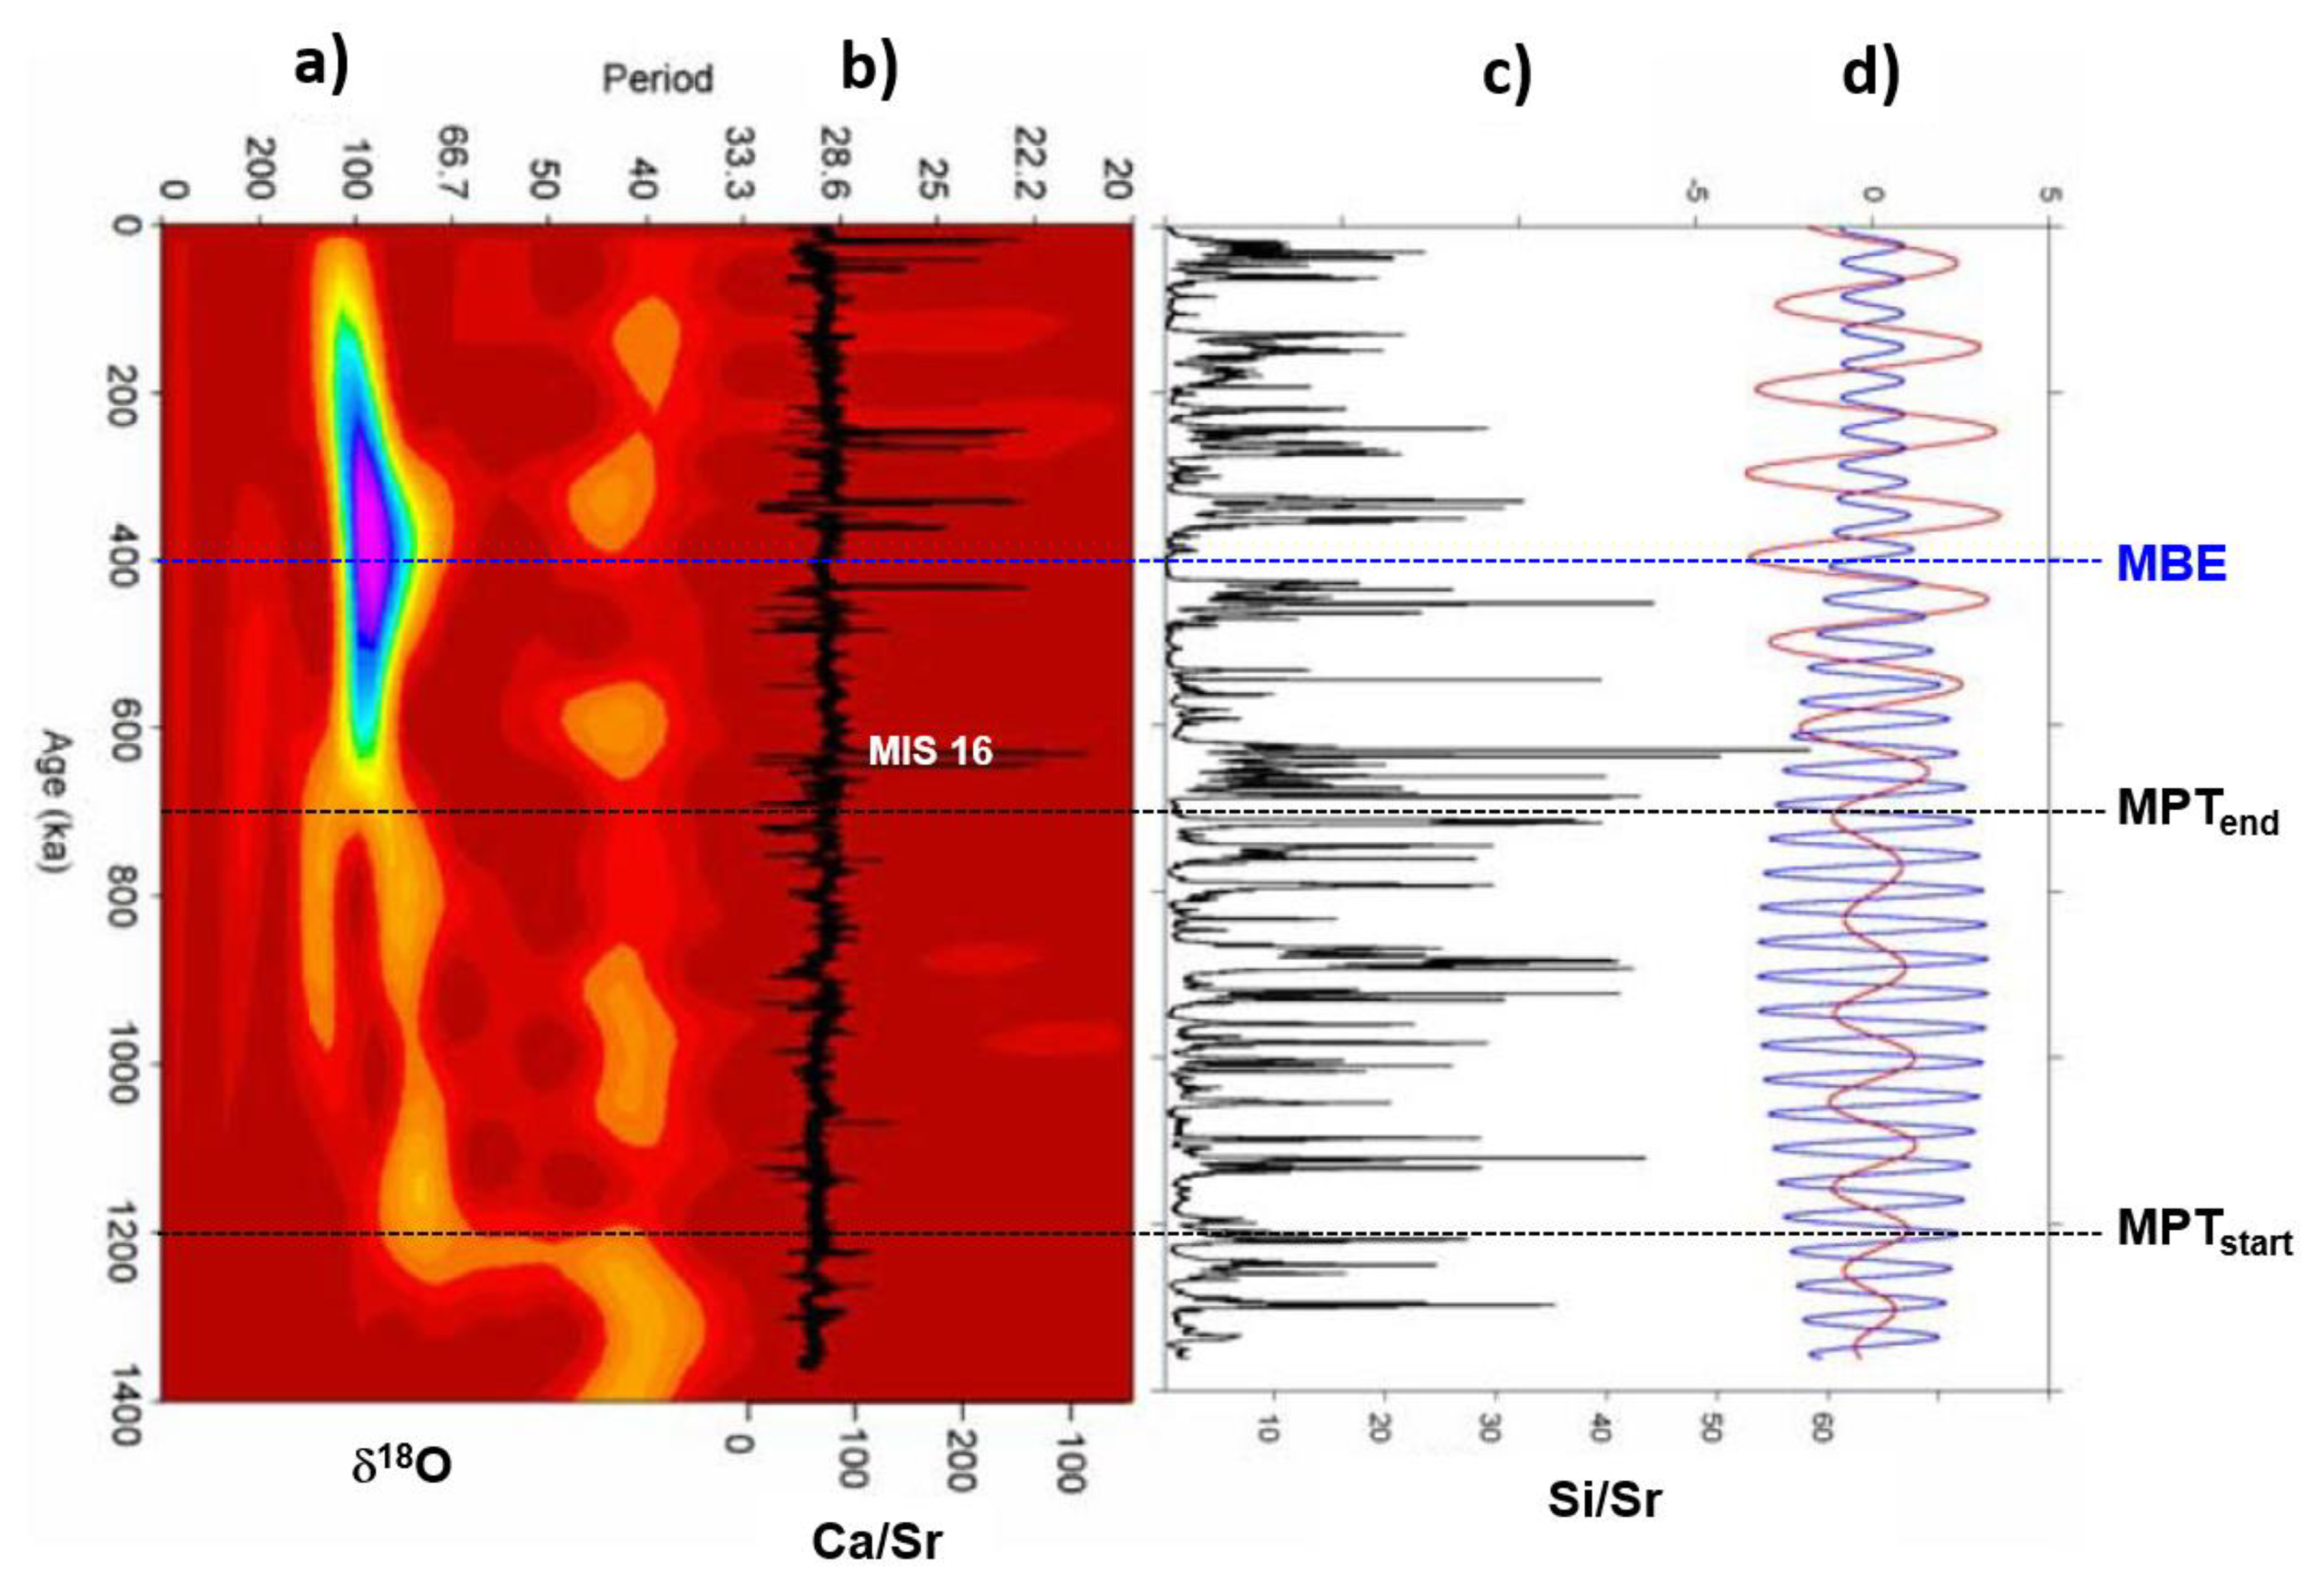
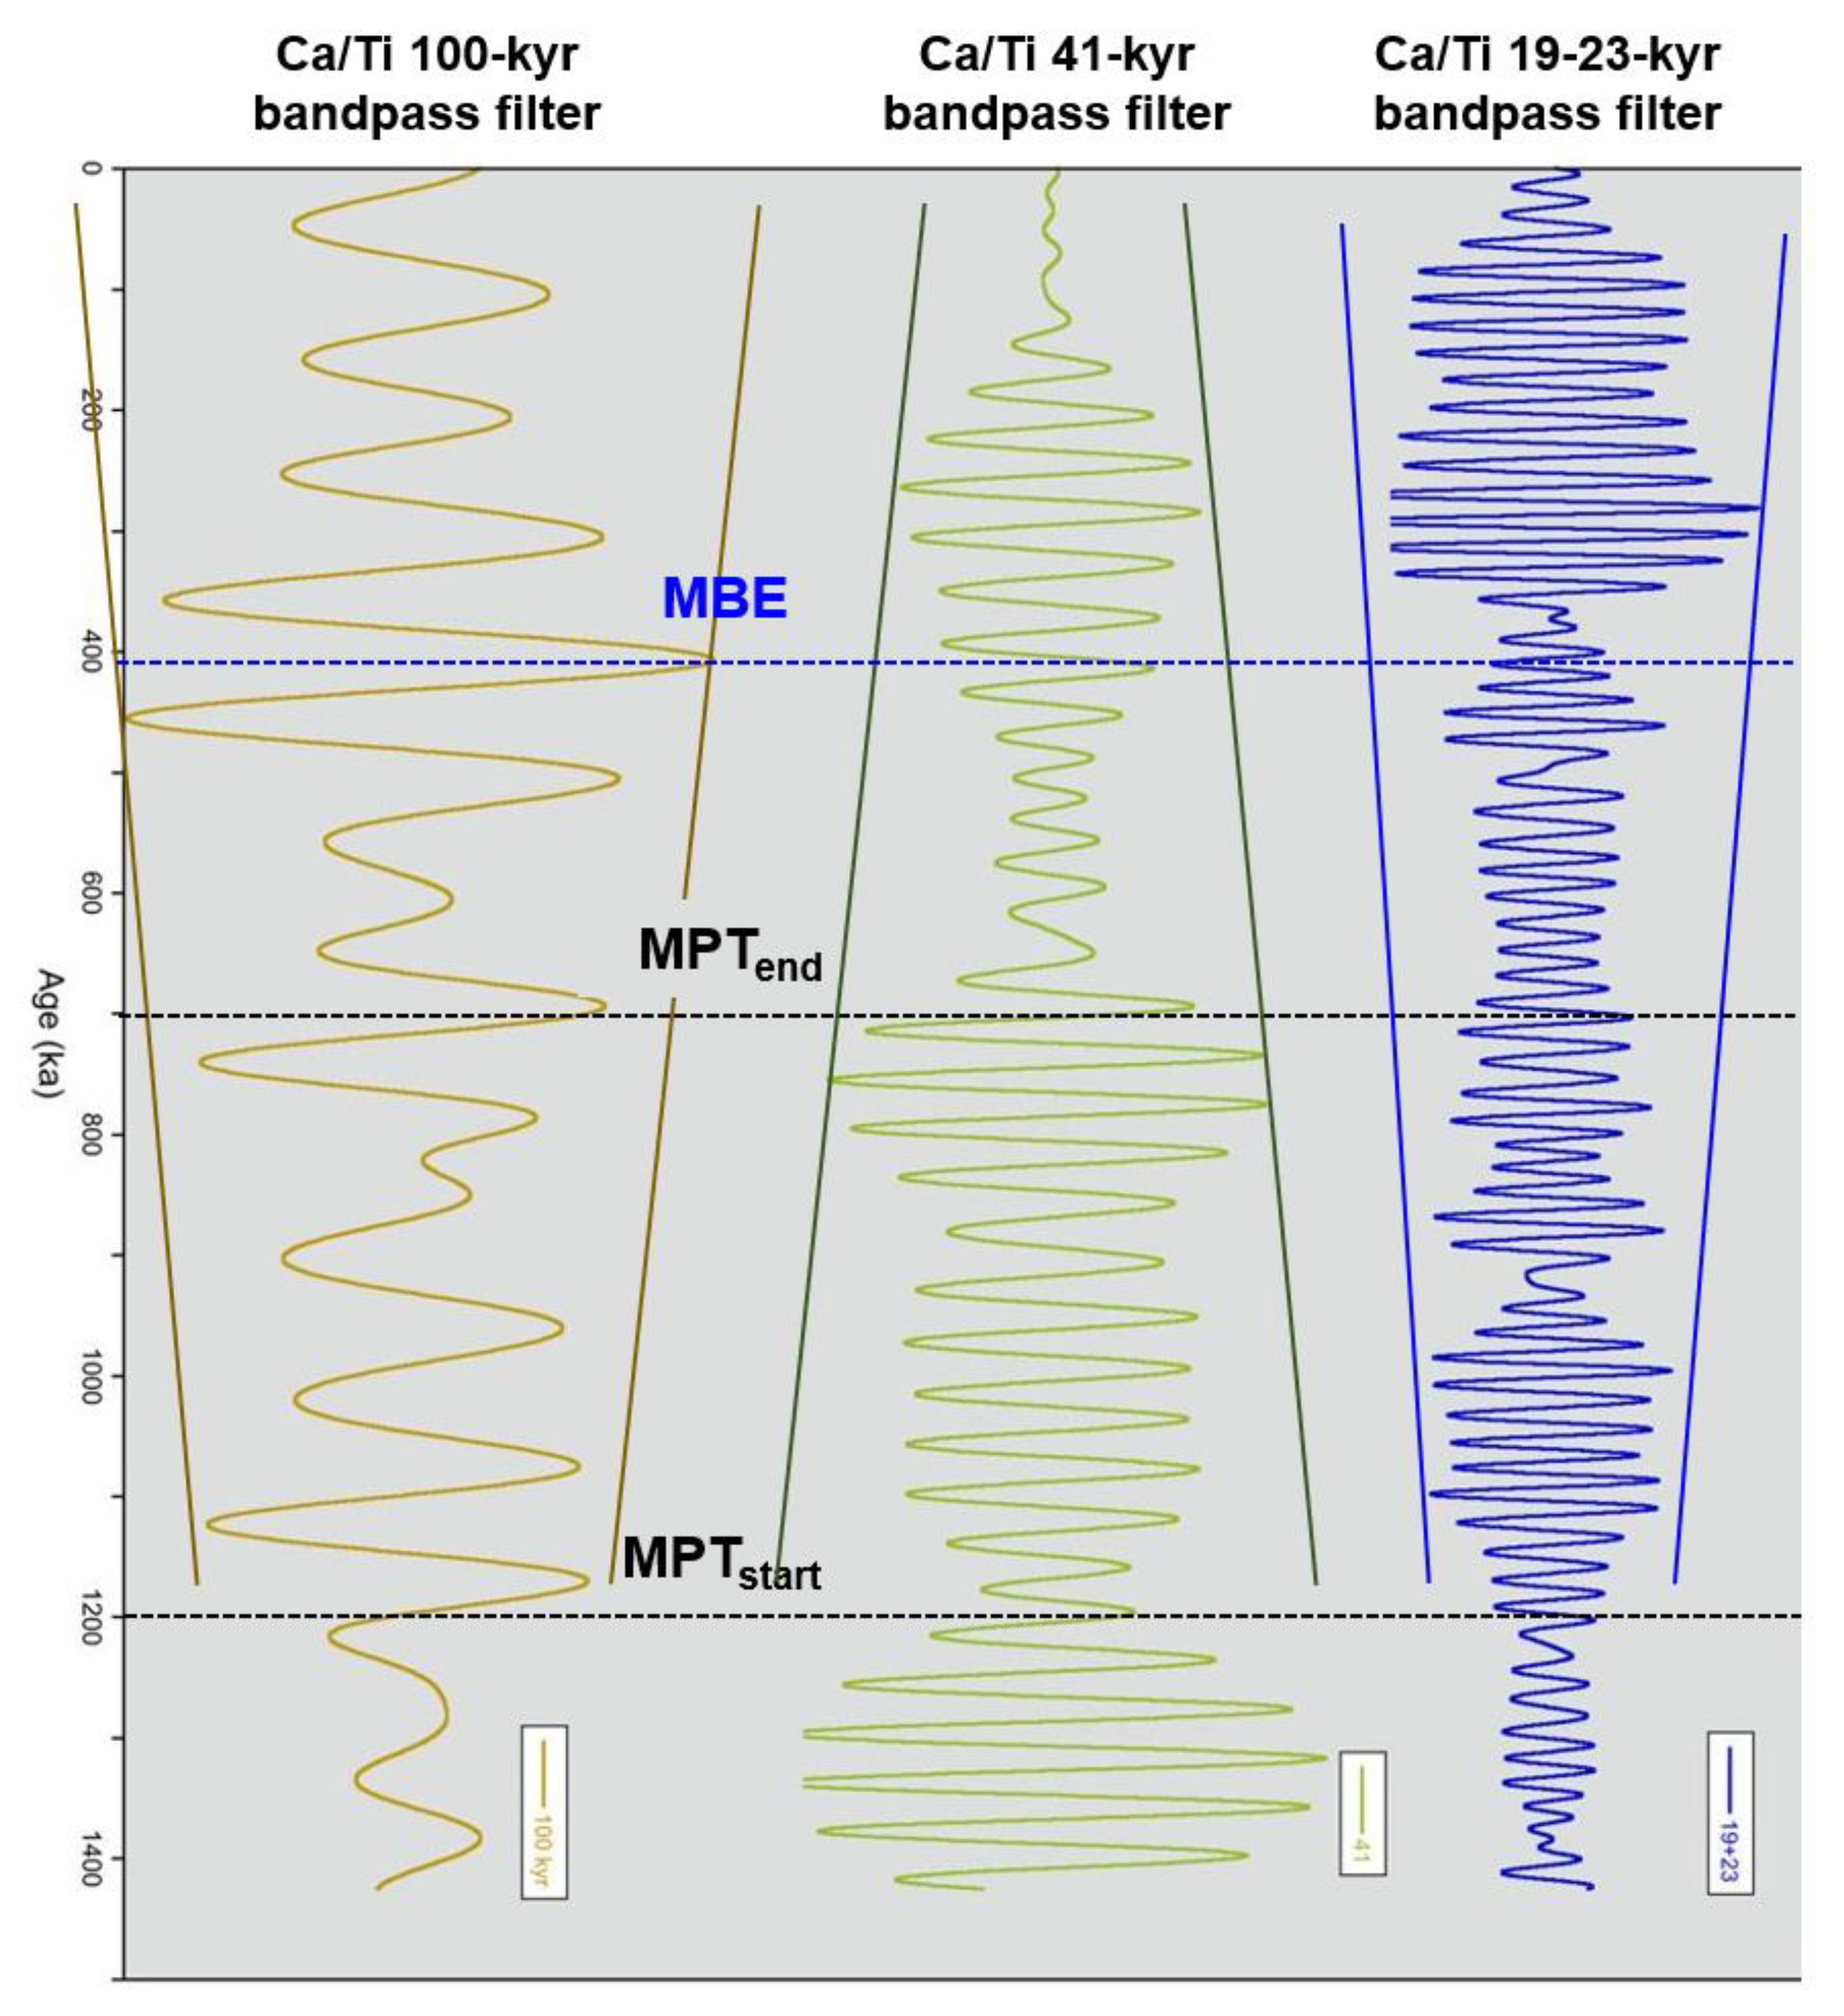
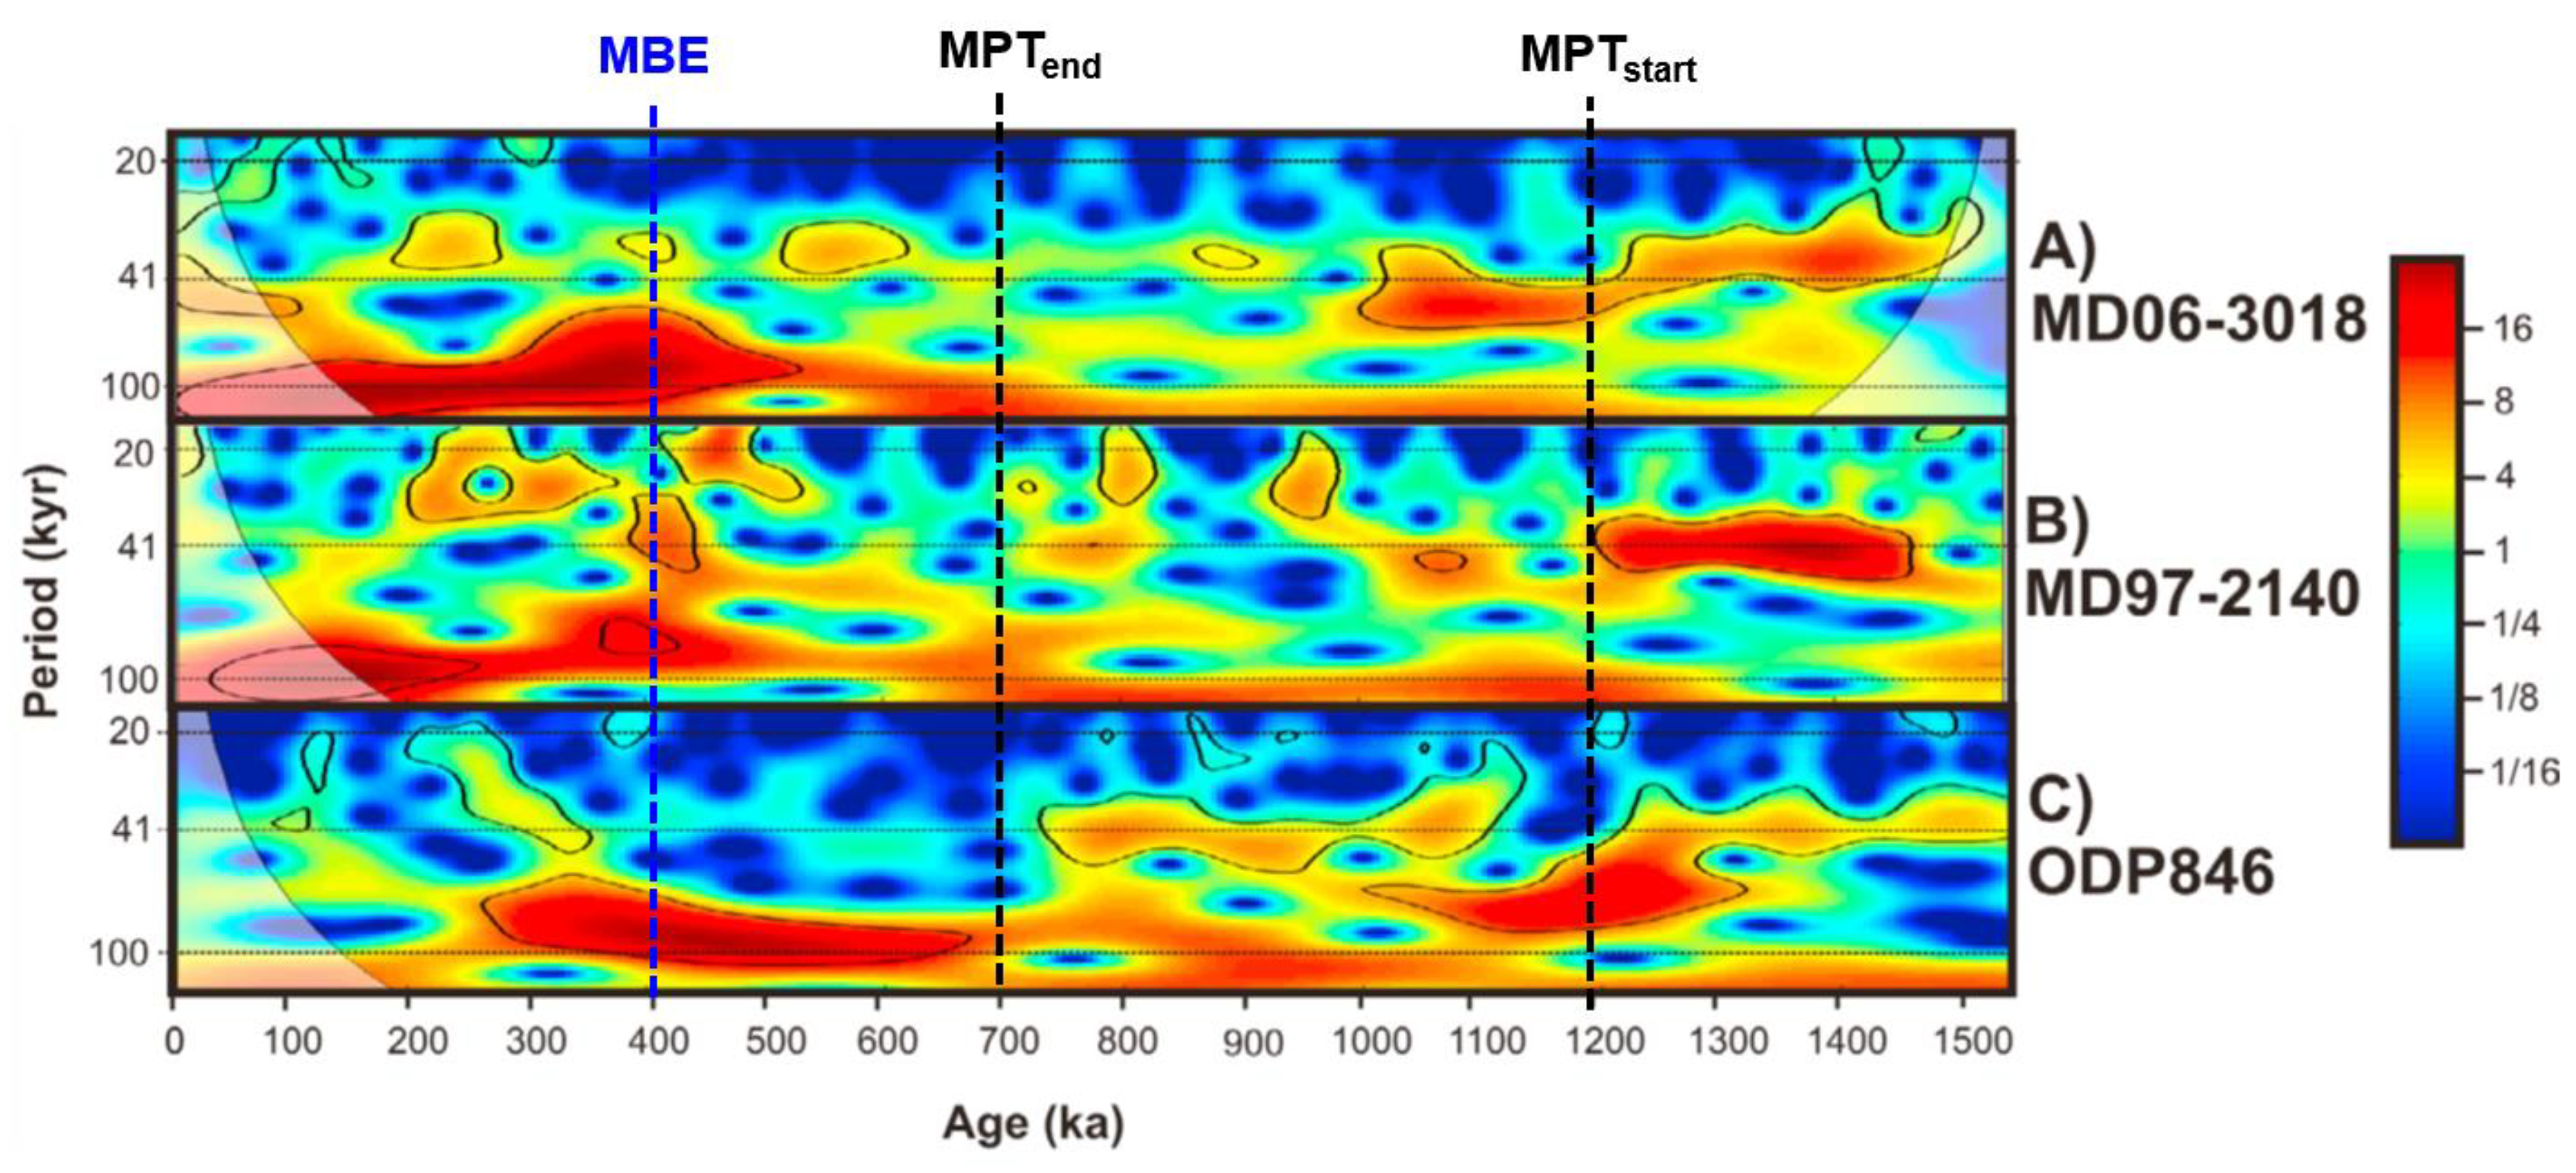
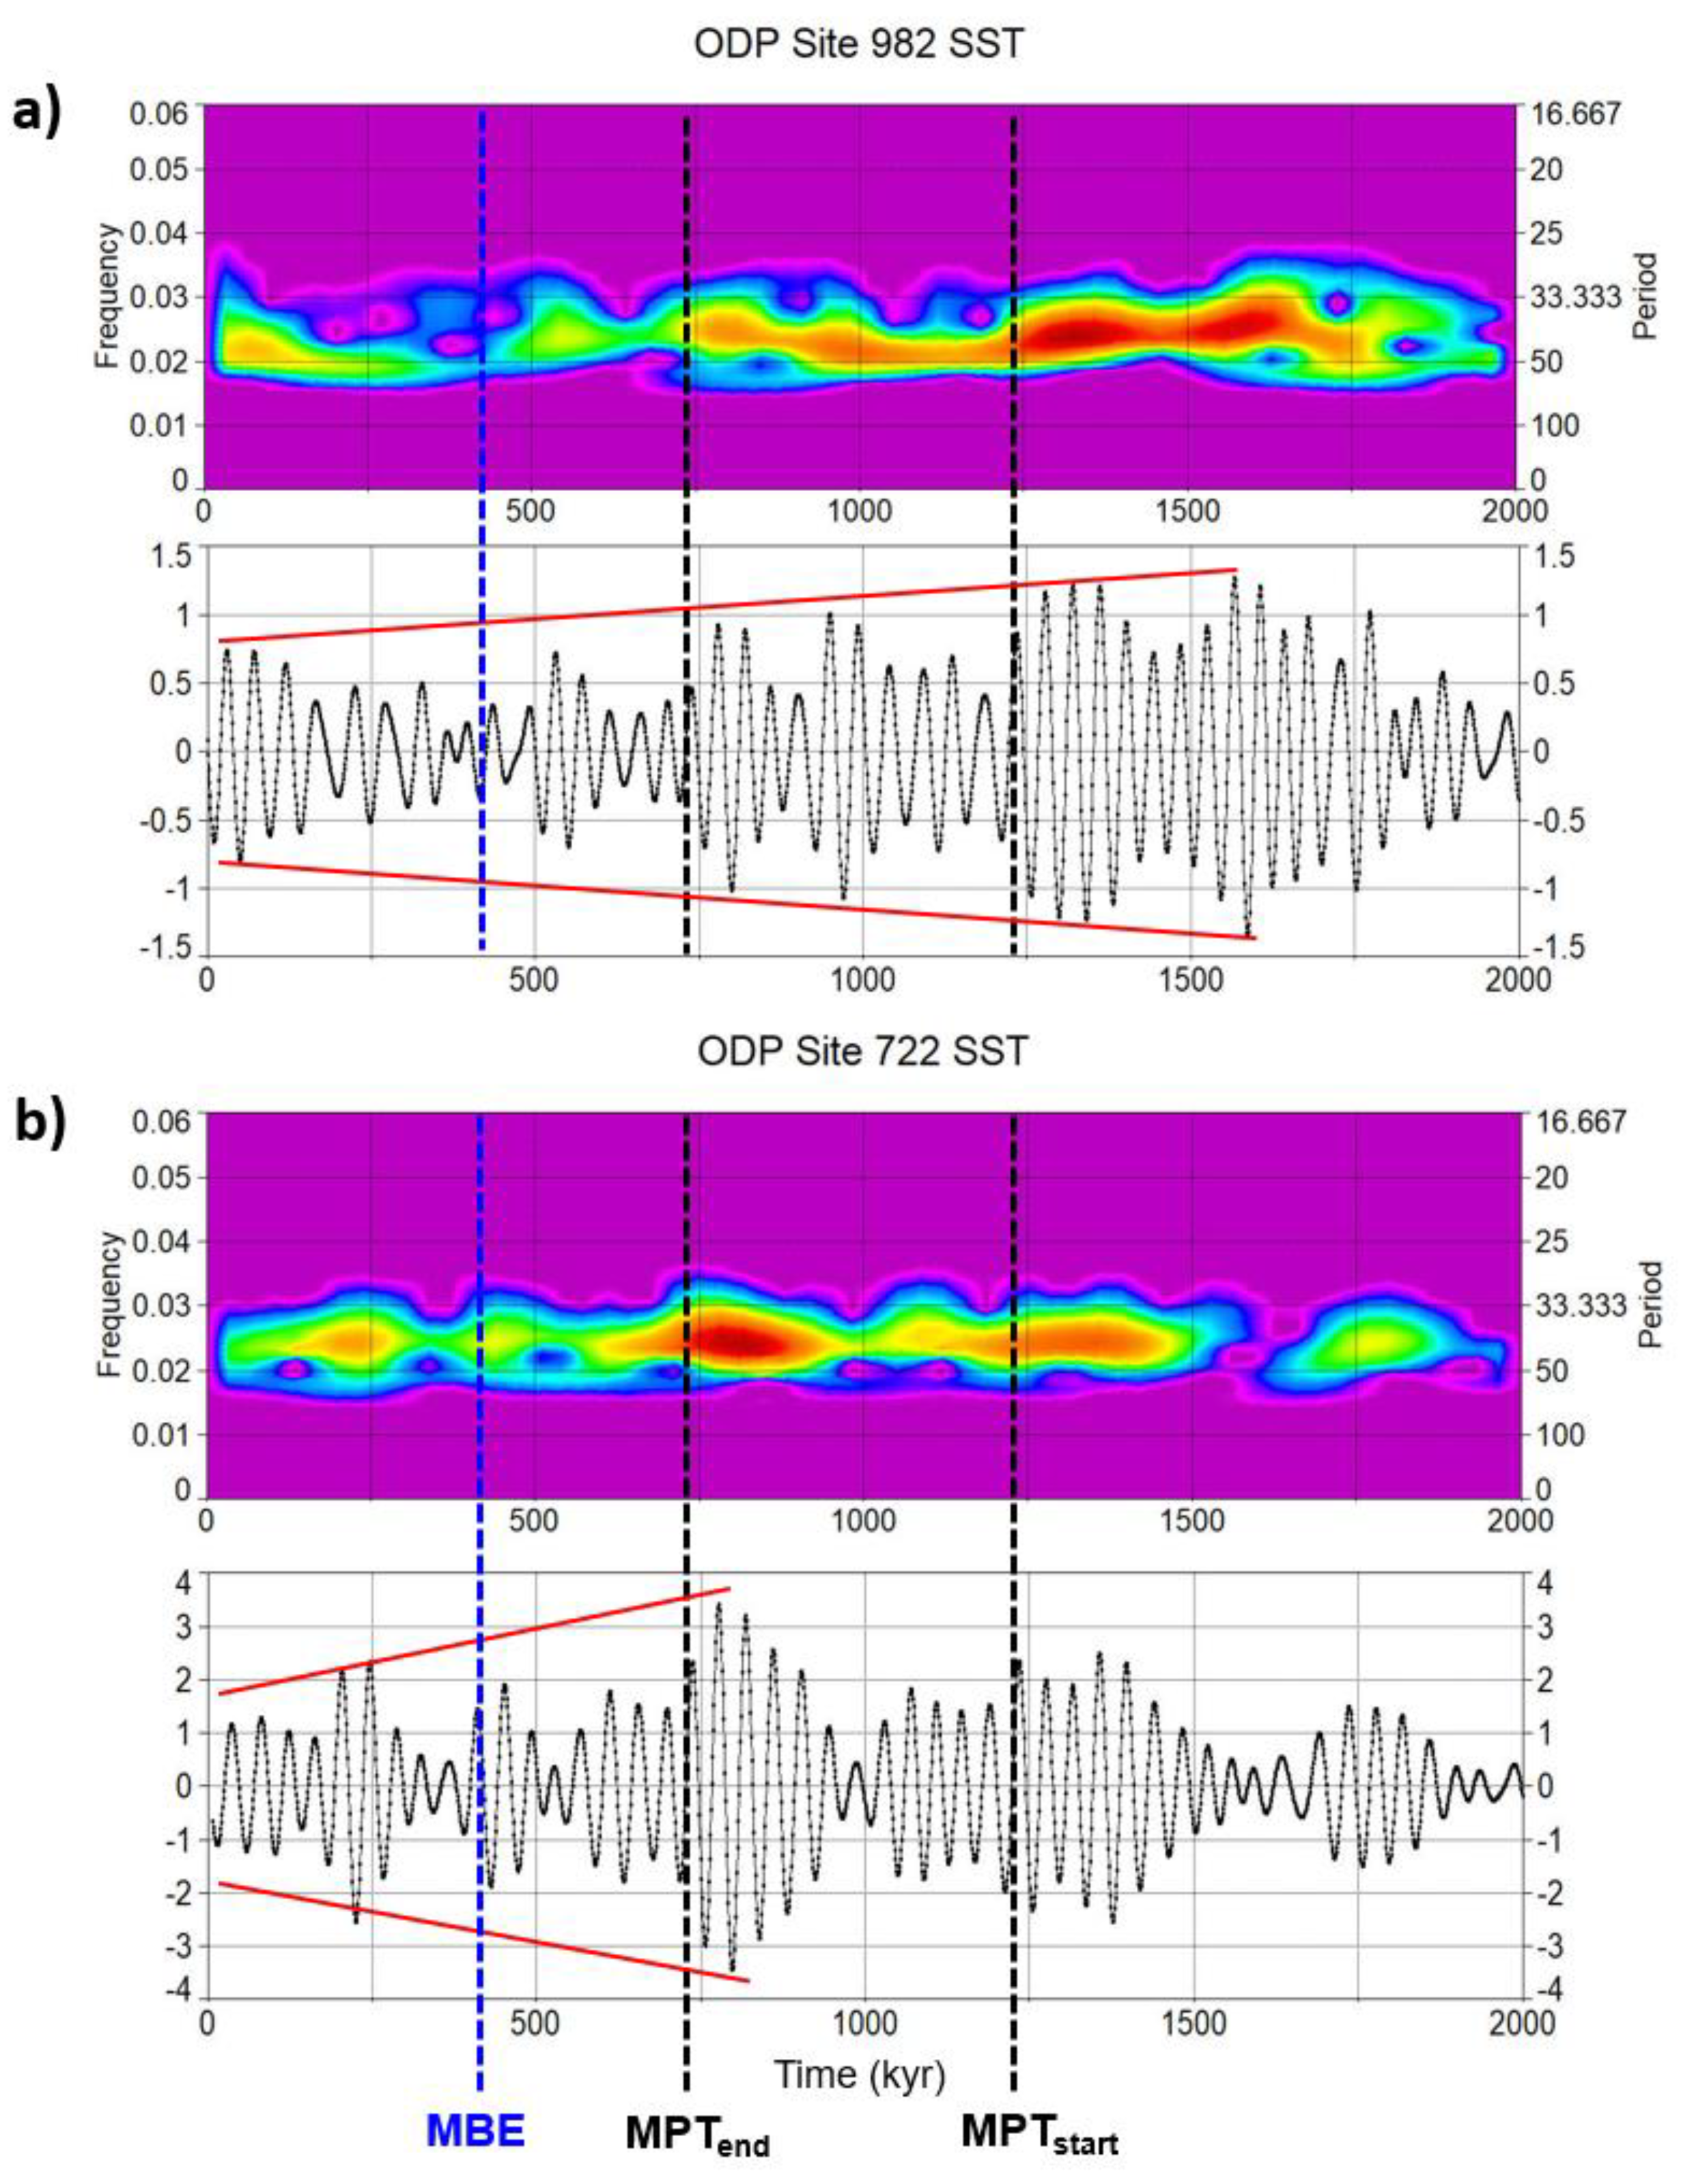
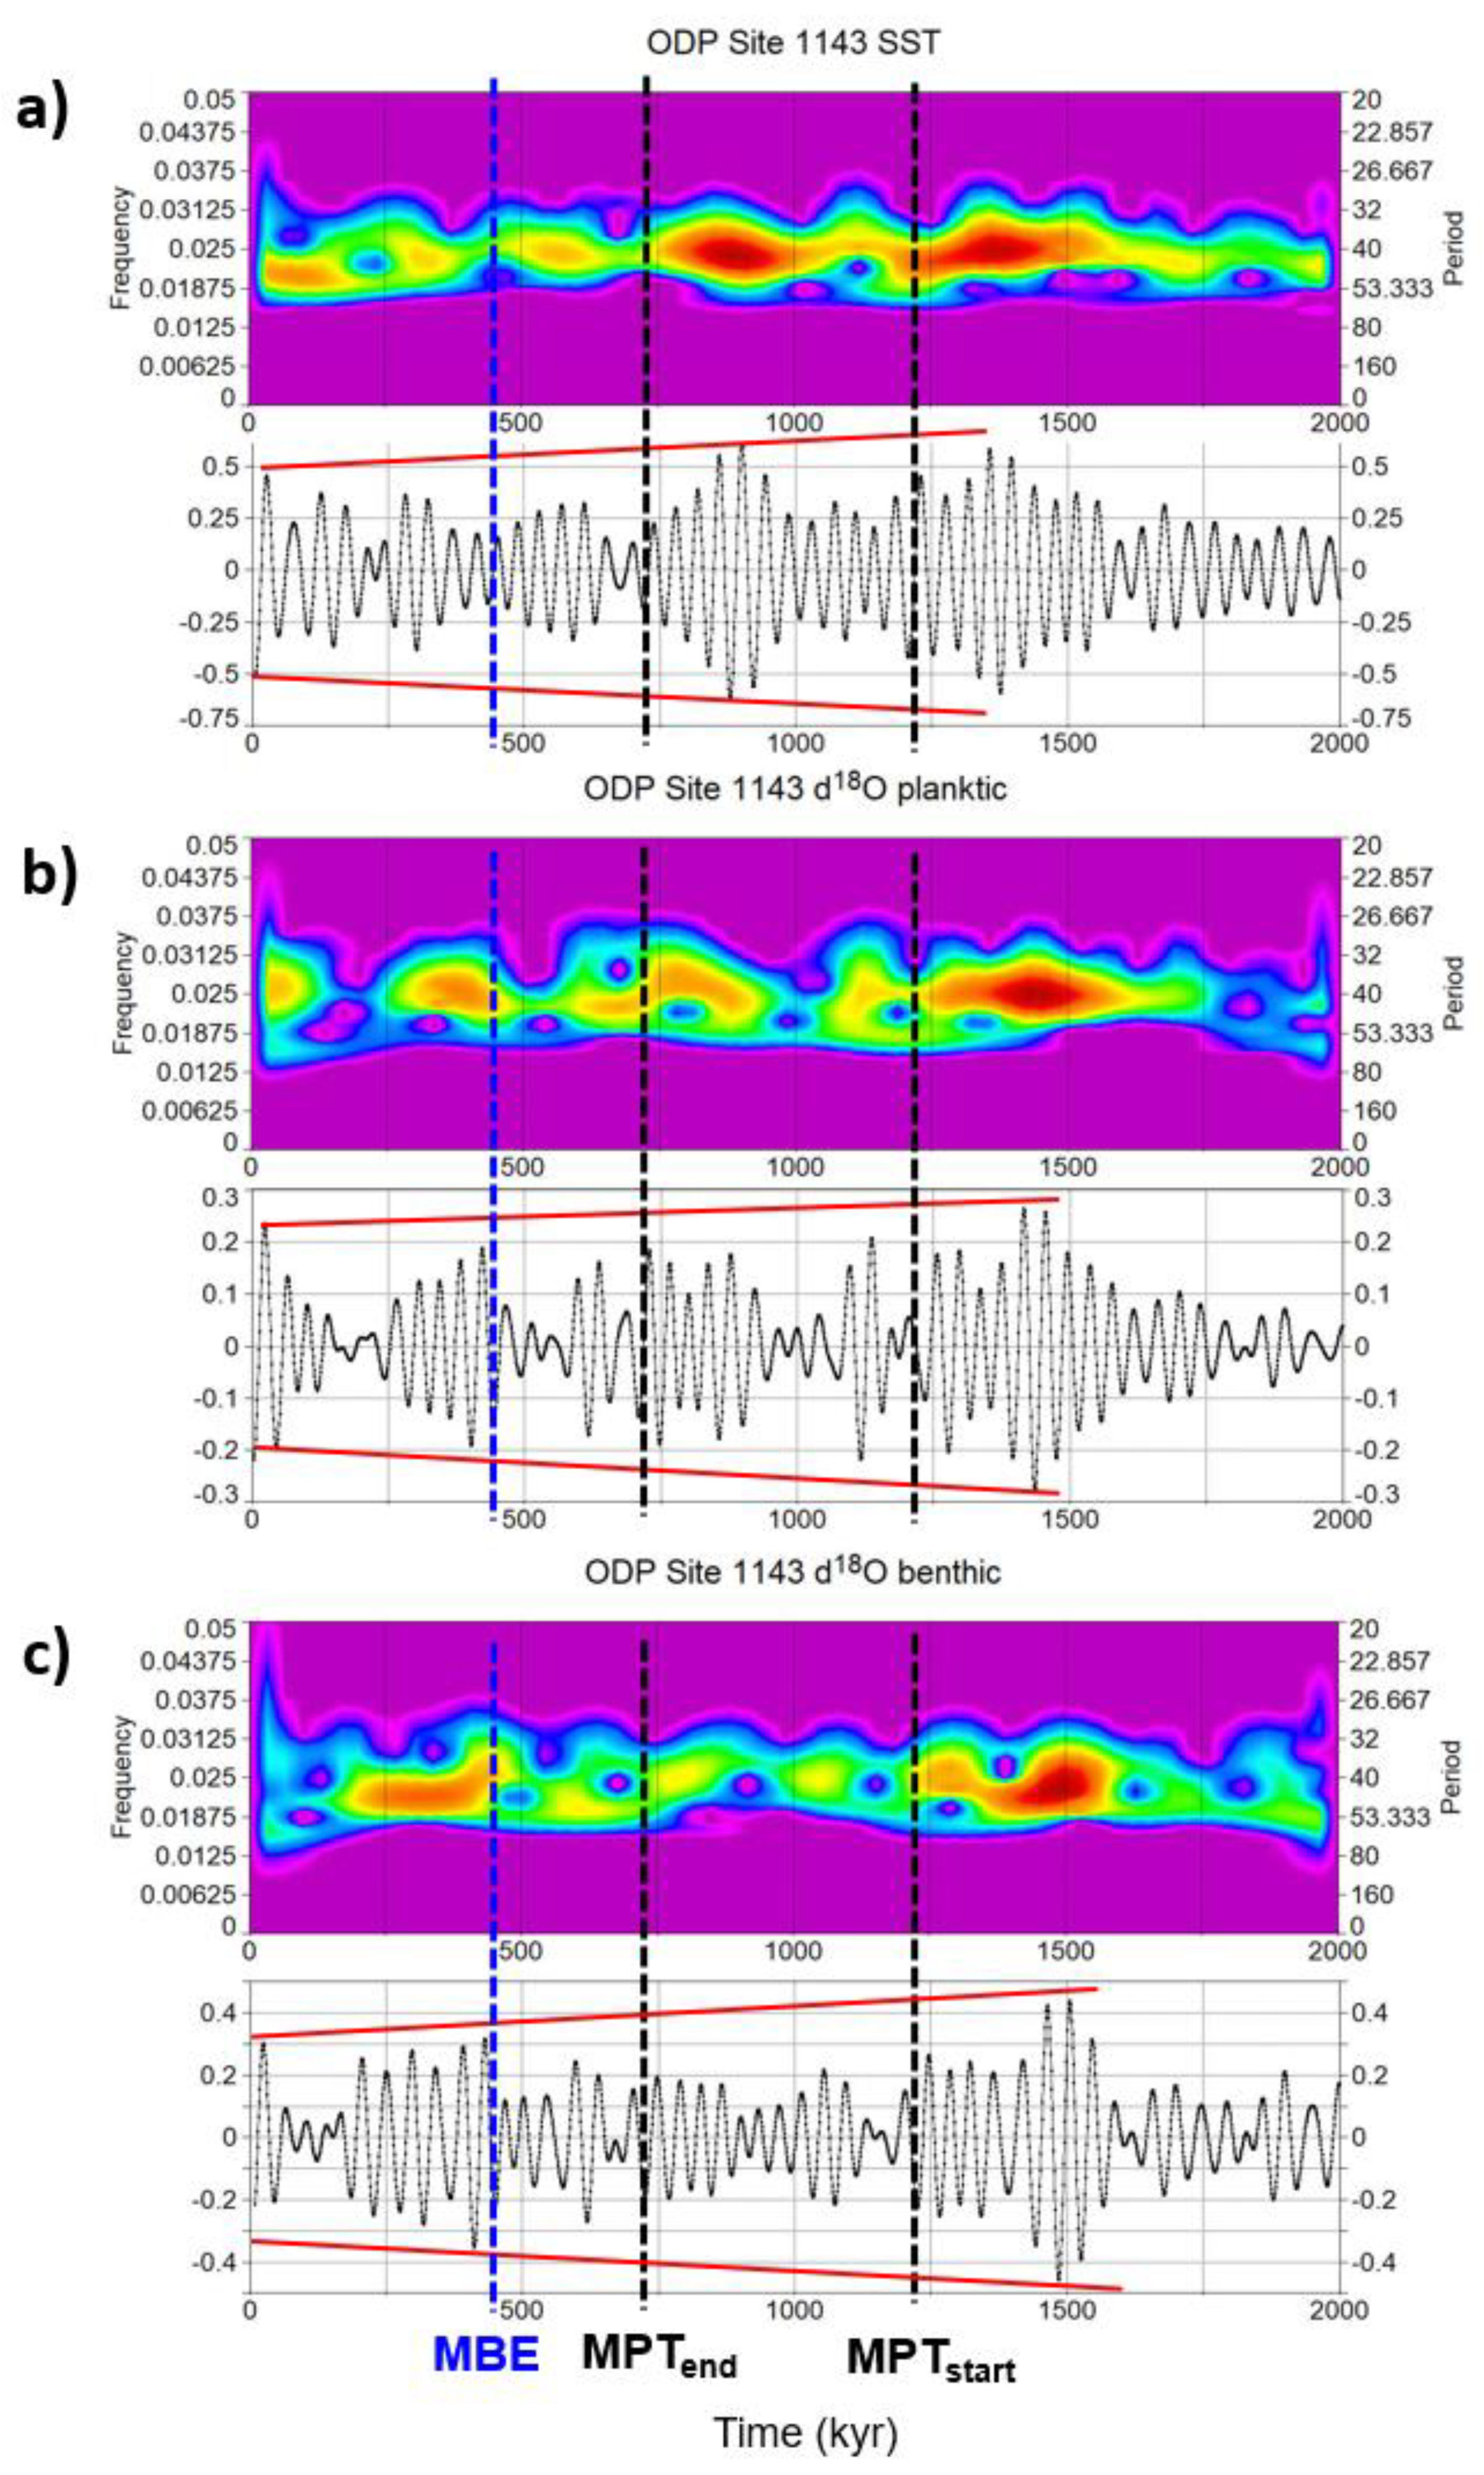
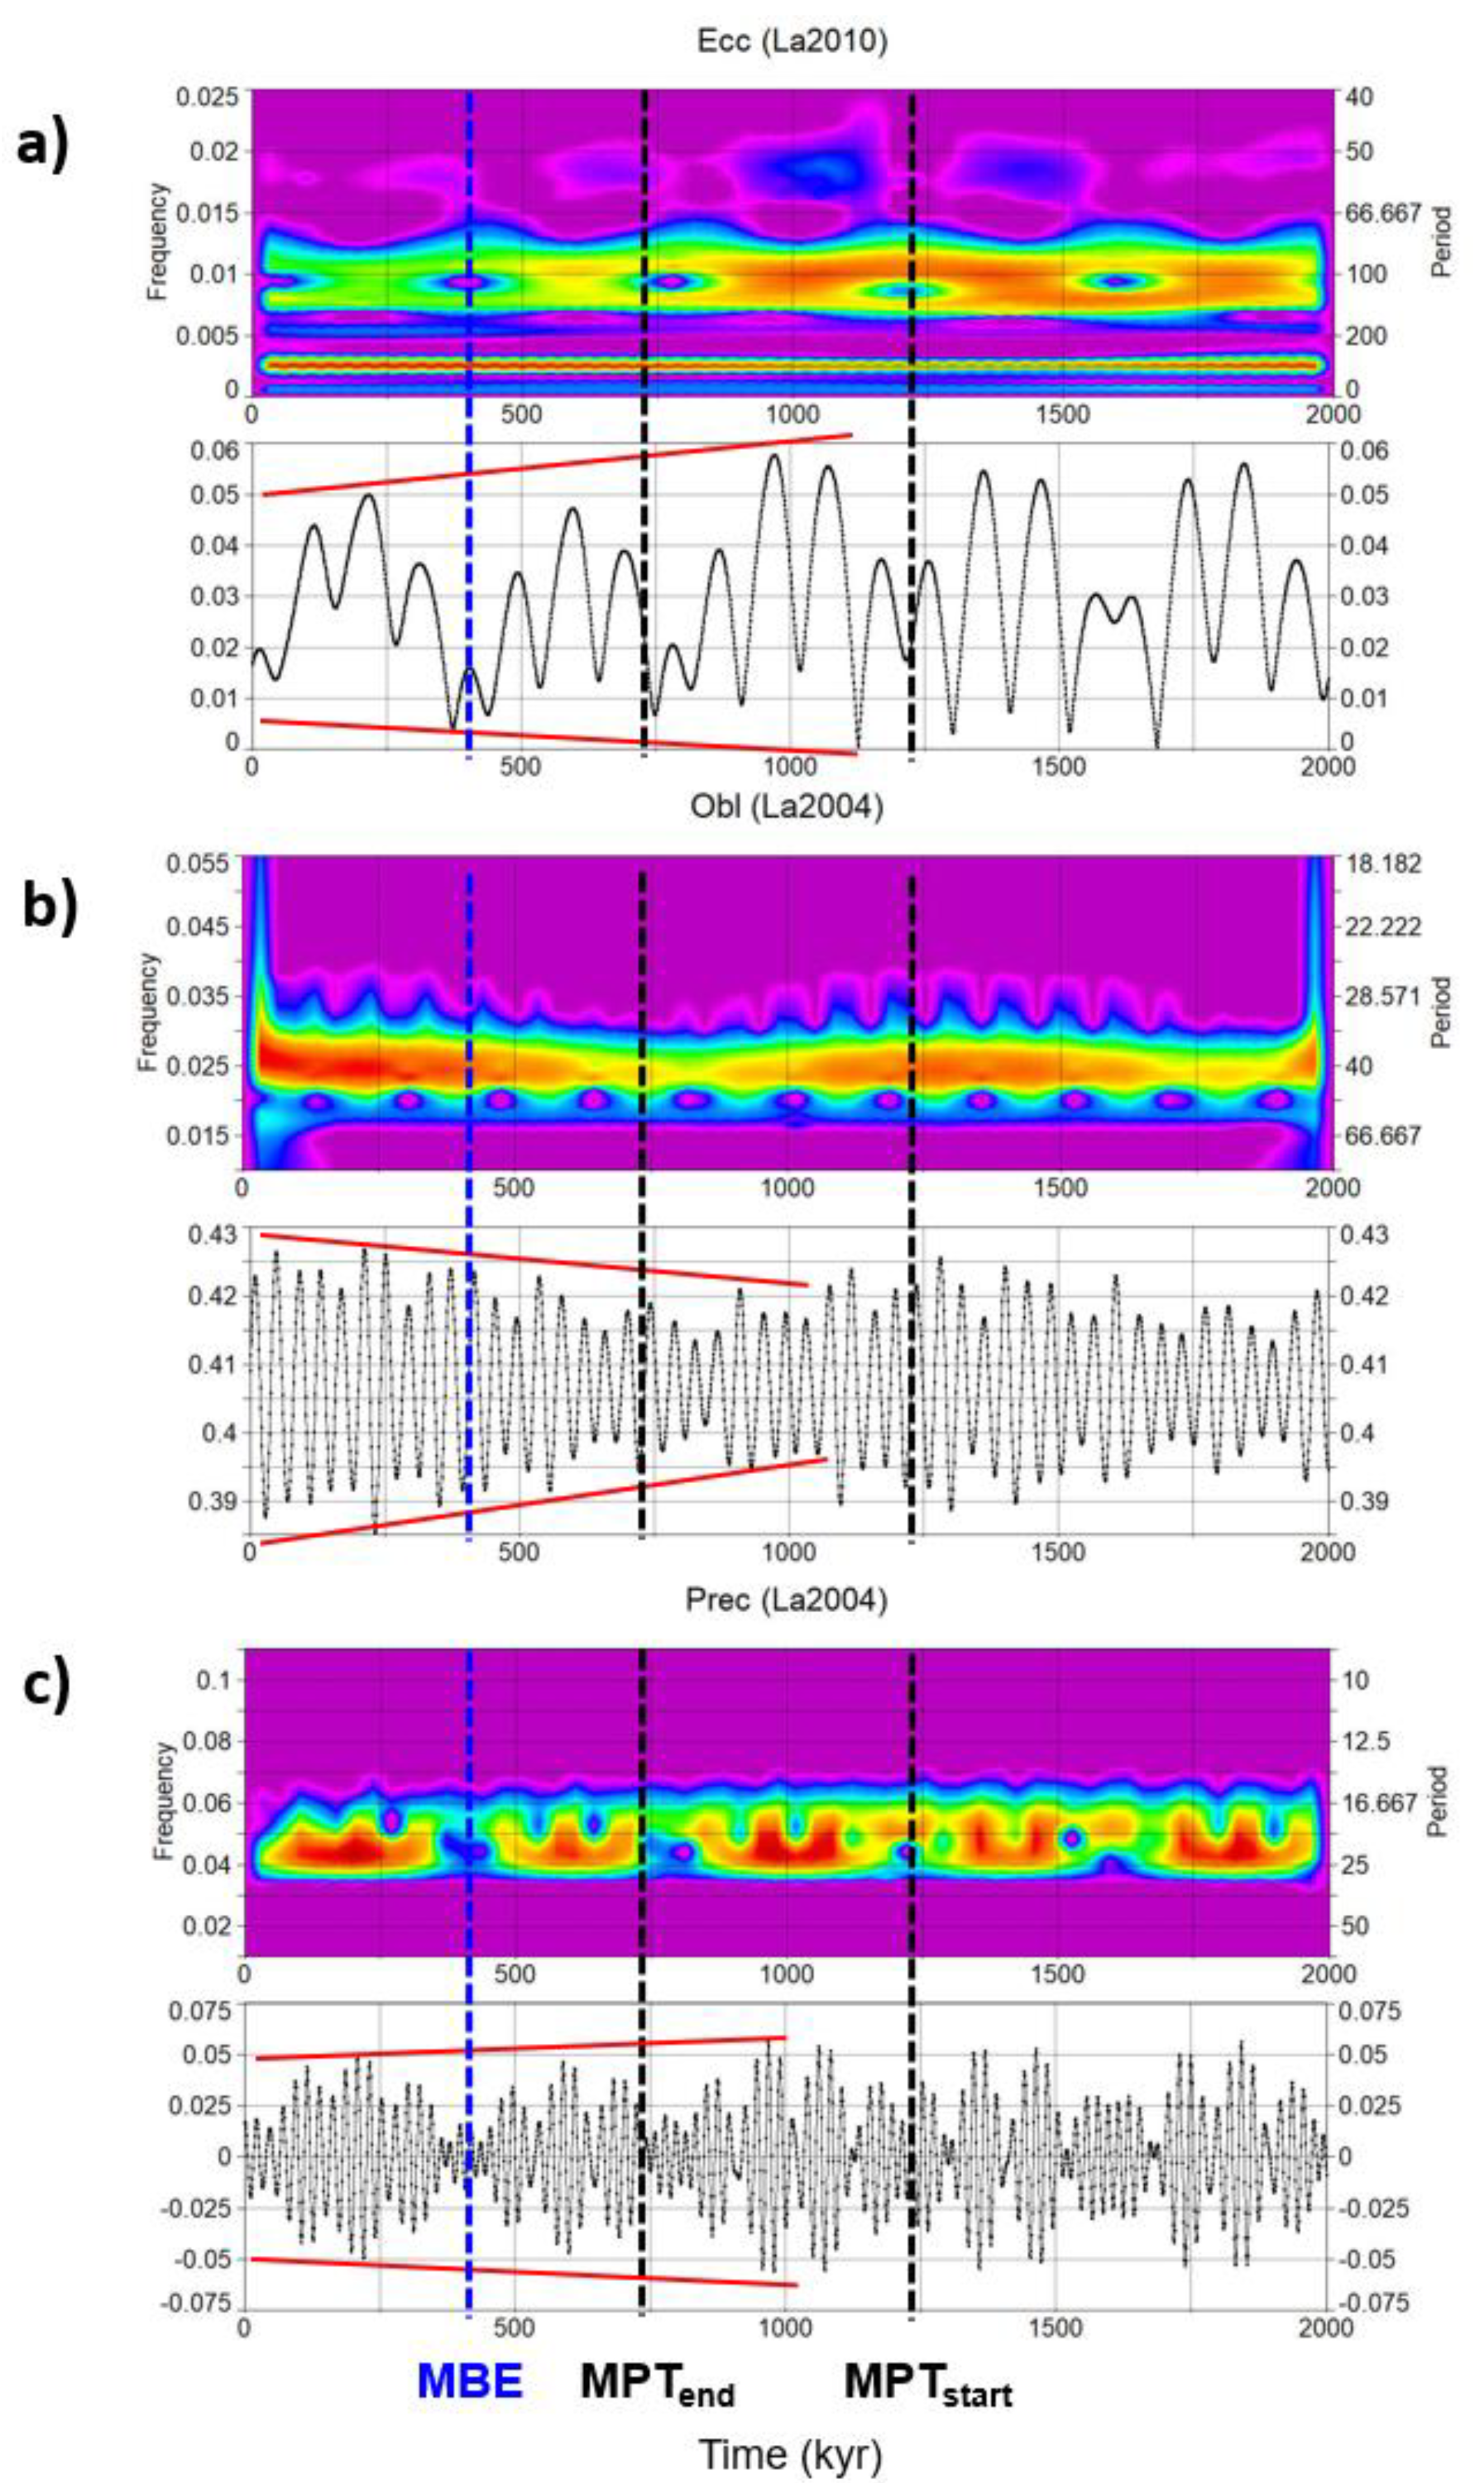
- Additional evidences of MPT and post-MPT anticorrelation between obliquity damping and short eccentricity amplification are highlighted from a variety of global and regional (Atlantic, Pacific, Mediterranean, Indian) climate-related records, hinting them to be a widespread feature of the Pleistocene climate system. However, this feature does not seem to be consistent with the nominal solutions.
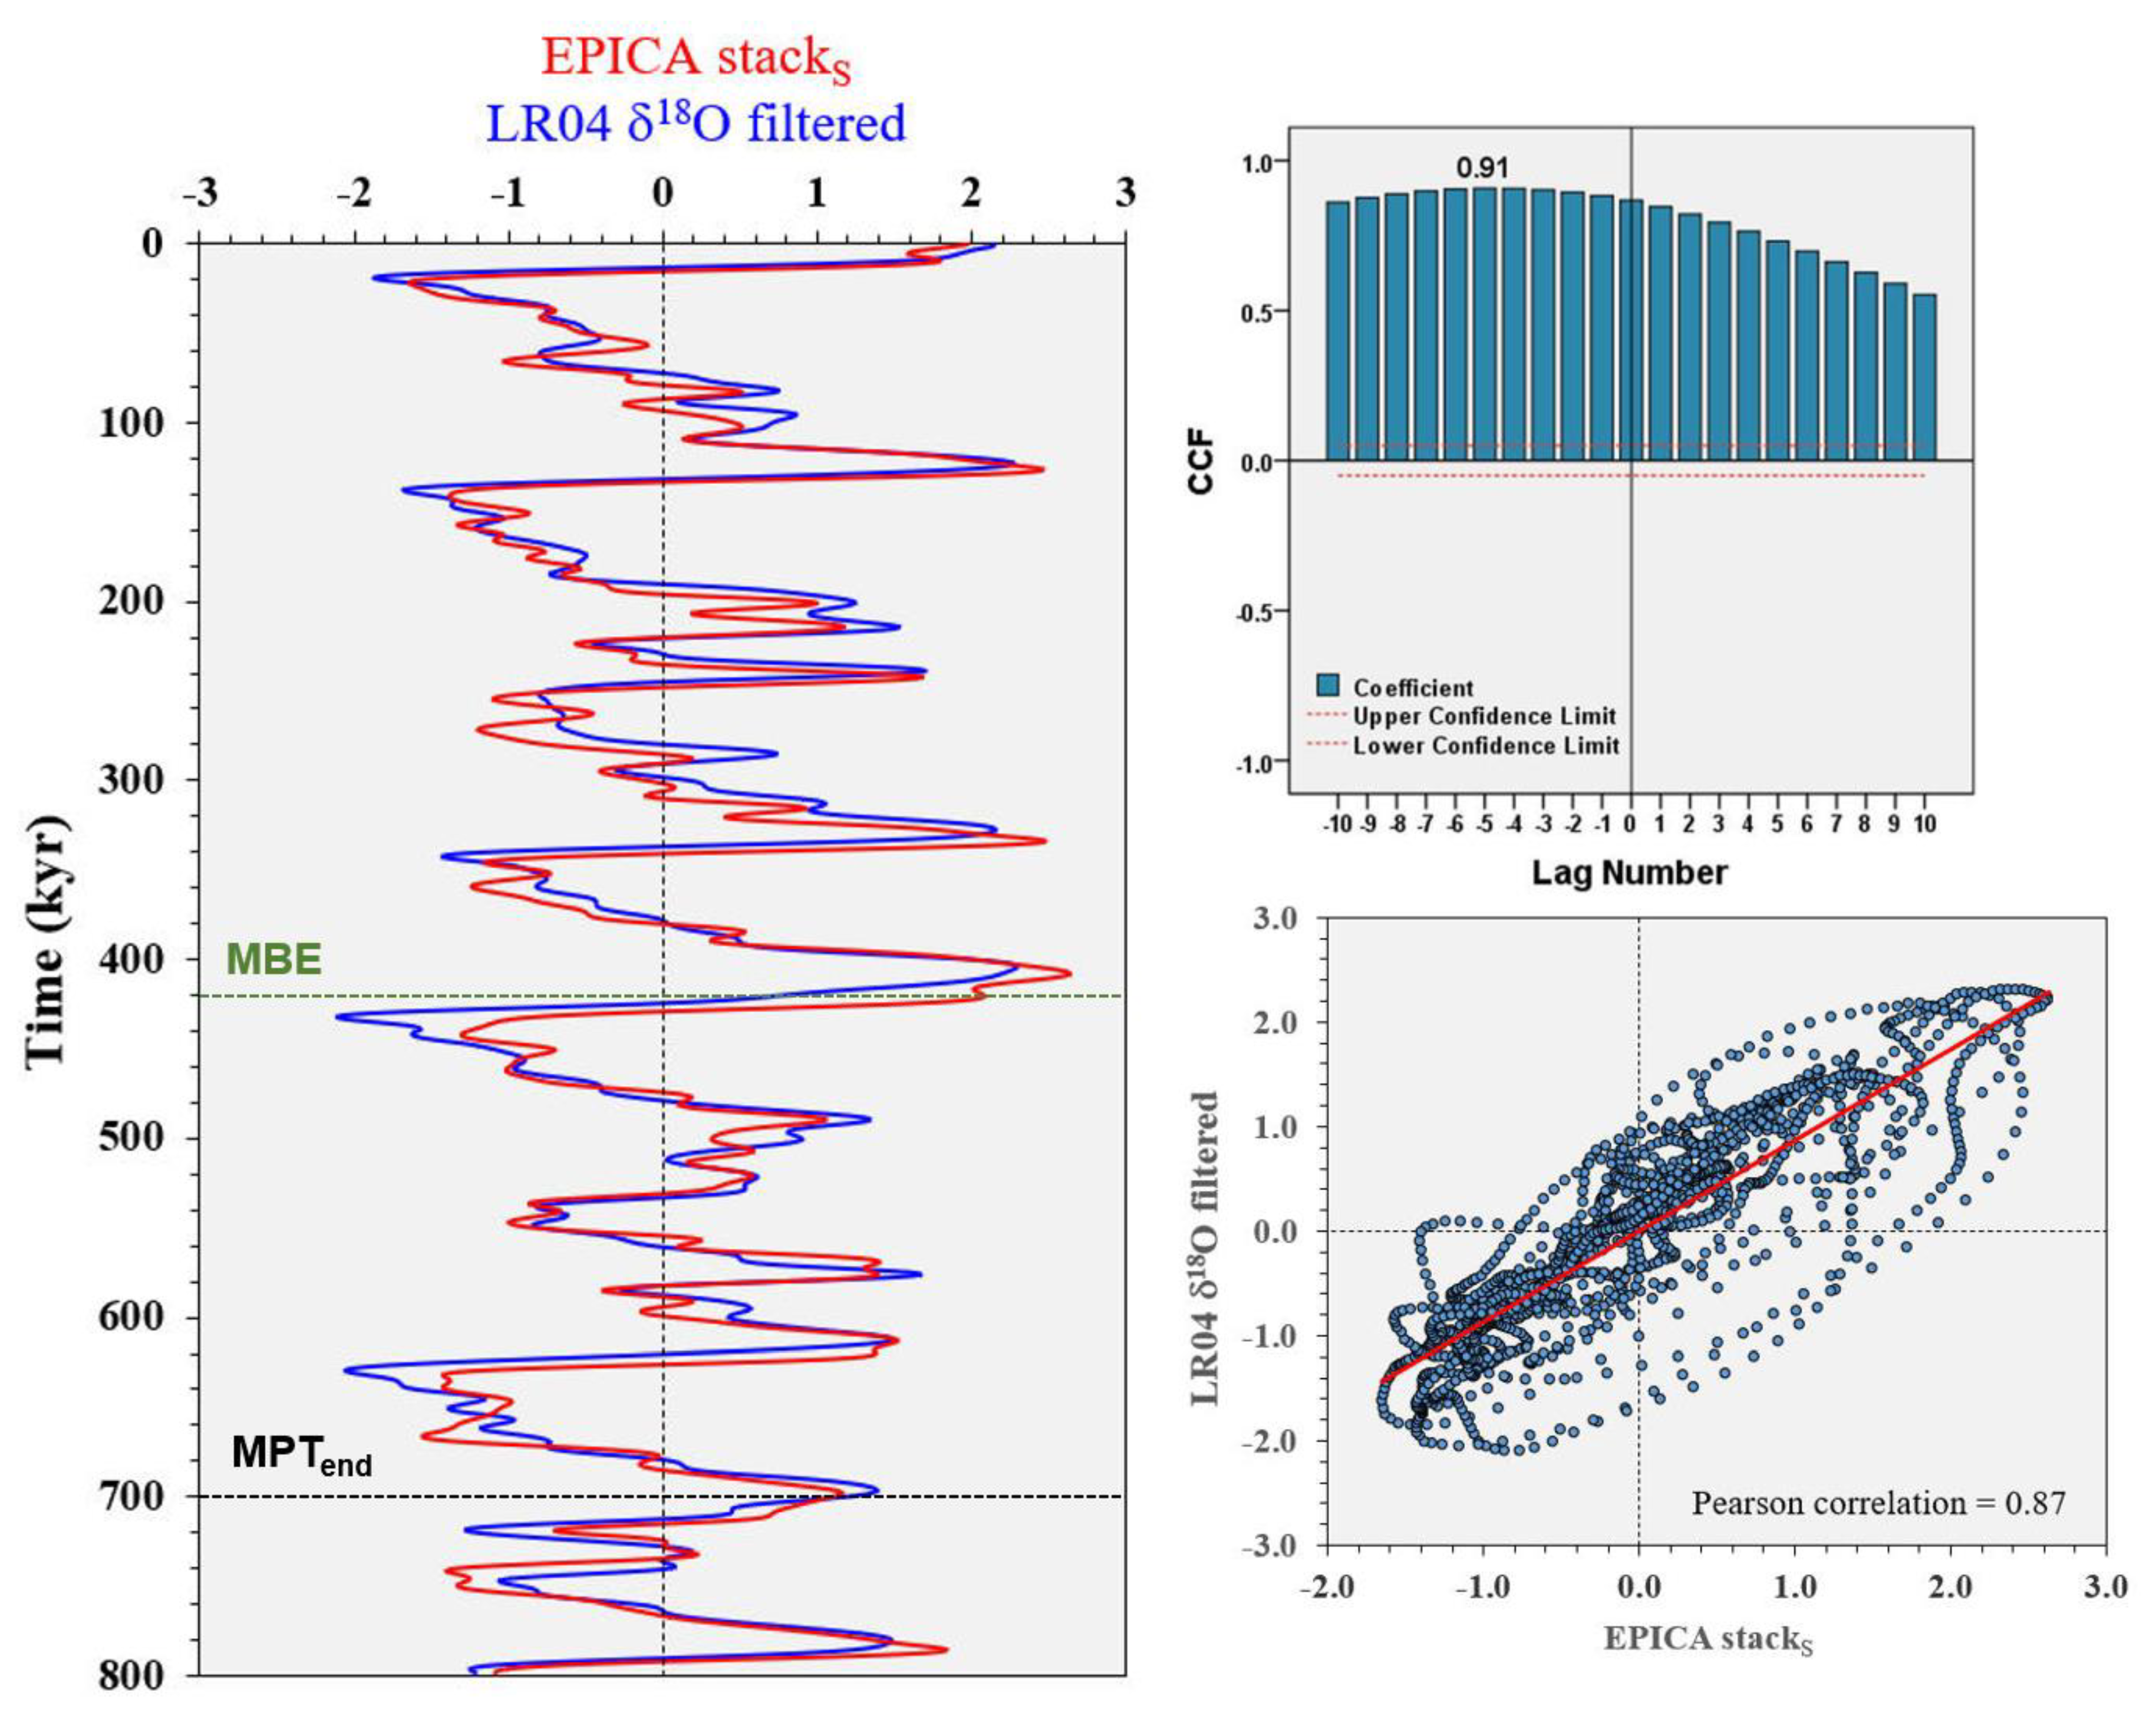
- Studies on Greenland and Antarctica indicate a fast response of the cryosphere mass balance to recent atmospheric and SST changes. The EPICA stacks better approximates the global benthic δ18O, the latter probably represents the most lagged signal in the climate chain, and may be considered a proxy of the global atmospheric temperature averaged by GHGs. Thus, it is likely that the phase lags averaged among surface temperature proxies approximate the phase lag of the ice-volume better, overcoming the deep temperature lag bias of the benthic δ18O.
- Assuming a fast response of the ice-volume to surface temperature changes (EPICA stack, SST), the mean value of obliquity lag <5.0 kyr (3.7±1.7 kyr) has been documented during the last 800 kyr. Also considering the benthic δ18O records, the obliquity mean phase lag is 5.3±0.6 kyr, which is very close to the theoretical threshold of 5.0 kyr and is significantly lower than the range of 6-10 kyr considered in previous studies.
- Cross-coherency data demonstrate that the Red Sea RSL record approximates extremely well the glacio-eustatic sea-level fluctuations linked to ice-volume and paced by orbital forcings, also in the short eccentricity band. Global benthic δ18O lags Red Sea ESL by ~2.0 kyr in the obliquity band, suggesting a delay bias that could be attributed to benthic δ18O deep-water temperature signal. Thus, the benthic δ18O obliquity mean phase lag of 5.3 kyr could be corrected to 3.3 kyr, close to the EPICA stack/SST mean of 3.7 kyr, which is significantly lower than the theoretical threshold of 5-kyr.
- Recent studies on variations in present-day satellite temporal gravity suggest the high sensitivity of the Earth to oblateness and highlight a concurrent slow-moderate negative (GIA rebound) and fast-robust positive (water-mass redistribution) J2 changes during the recent postglacial and global warming context, resulting in a J2 positive net change. Cross-spectral results from the Red Sea RSL over the last 500 kyr suggest a rapid and coherent oscillation in the obliquity band of the water layer component of the Earth’s oblateness.
- It is hypothesised that the fast and robust J2 water-mass redistribution component in the obliquity band, which is reasonably related to the glacio-eustatic variation of the sea level, could be a crucial element in determining +J2 ⟹ –during obliquity maxima (interglacial damping), and –J2 ⟹ +during obliquity minima (glacial damping). This would explain the fact that obliquity damping in climate proxies is basically symmetrical.
4.2. Obliquity damping hypothesis
- The widespread evidence from proxy records of anticorrelation between obliquity and short eccentricity/precession has been interpreted as an effect of the obliquity-oblateness feedback by critically reviewing its theoretical constrains, which support negative/positive secular change of obliquity for both low ice-volume phase lag (<5.0 kyr) and positive/negative net change of oblateness, respectively, in the obliquity band that are likely dominated by the J2 water-mass redistribution component.
- Obliquity damping during the interglacial stages might have contributed to the strengthening of the short eccentricity response by mitigating the obliquity’s ice-killing, favouring the obliquity-cycle skipping, and a ~100-kyr long-life feedback amplified ice-growth in the context of global icy-state.
- Orbitals, including short eccentricity, may pace the frequency beat of the climate response. The phase-locked feedback mechanisms might have non-linearly transferred most of the system energy depending on the long-term climate state and the cycle duration, overcoming the energy excess ‘paradox’ especially with respect to the eccentricity band.
- The observed transition patterns (TRA-1,-2,-3) of the orbitals Rs and the early onset of the short eccentricity response suggest the traditional notion of the MPT to be the final, high-magnitude, nonlinear transitional stage of a complex competing interaction between obliquity vs. short eccentricity forcing under the influence of both long-term cooling and obliquity-oblateness feedback, that had already started during the Piacenzian. The maximum expression of this mechanism would occur during TRA-3 that is associated with the maximum ice-volume development (subtrend IV) and a strong amplification of the obliquity response till the termination of the MPT (TH4).
- The Plio-Pleistocene long-term cooling is a relevant background forcing in setting boundary conditions to orbital climate responses, and is characterised by four step-wise subtrends (I to IV), where a mild curvilinear shape is broken by slope changes representing four thresholds (TH1 to TH4) of mean climate state change.
-
The role of the long-term cooling is outlined as follows:
- a.
- The non-linearity of the orbital responses is increased by the scale effect of the ice-sheet growth on feedback mechanisms, which are sensitive to long orbital periods. Specifically, the amplitude increases in the obliquity band of the ice-volume changes. It is hypothesised that the glacio-eustatic oscillations in the obliquity band inducing oblateness variations by dominant/fast water mass redistribution component could have led to the overcoming of the thresholds sensitive to secular change of obliquity. This mechanism would explain why the 100-kyr cycle reached its maximum expression post-MPT, albeit after a period of early/weak manifestations as early as in Piacenzian.
- b.
- The icy-state may have increased the sensitivity of the polar climate system to the minima of MAI by triggering a strong nonlinear energy transfer in the short eccentricity band by feedback mechanisms (primarily ice-albedo and GHGs).
4.3. Outlook
- Unbiased estimates of the ice-volume lag in the obliquity band.
- Modelling the changes in Earth’s oblateness in the obliquity band and its effects on the forcing, determined especially by considering the dominant/fast water mass redistribution component. This could make the difficult and uncertain solid Earth’s oblateness component less stringent among the theoretical constrains.
- Modelling the hypothesis with full observational evidence control.
- Role of the MAI and feedback mechanisms in a context of the Earth’s long-term icy-state.
Funding
Data Availability Statement
Acknowledgements
Conflicts of Interest
Abbreviations
| 1 |
Reconstruction of orbital SSA-components as follows (sub = subcomponent):
δ18O short eccentricity = (detrend comp-1 sub-3-11 * 0.95 + comp-2 sub-1-4;9-15 * 5.5) / 6.45;
δ18O obliquity = (comp-3-4 * 8.1 + comp-2 sub-5-8 * 1.8) / 9.9;
δ18O precession = comp-5-7;
δ18O lomg-term trend = comp-1 sub-1;
SST short eccentricity = (comp-2 sub-1-4 * 3.65 + comp-2 sub-5-8;11-15 * 0.5 + detr comp-1 sub-3-11 * 0.93) / 5.08; SST obliquity = (comp-3-4 * 4.5 + comp-2 sub-9-10 * 0.27 + comp-2 sub-5-8;11-15 * 0.76) / 5.53;
SST precession = comp-5-7;
SST lomg-term trend = comp-1 sub-1;
|
References
- Abe-Ouchi A, Saito F, Kawamura K, Raymo ME, Okuno J, Takahashi K, Blatter H (2013) Insolation-driven 100,000-year glacial cycles and hysteresis of ice-sheet volume. Nature 500. [CrossRef]
- Ao H, Dekkers MJ, Qin L, Xiao G (2011) Age models of ODP Site 184-1143. PANGAEA. [CrossRef]
- Archer D, Martin P, Buffett B, Brovkin V, Rahmstorf S, Ganopolski A (2004) The importance of ocean temperature to global biogeochemistry. Earth Planet Sci. Lett. 222(2004):333–348. [CrossRef]
- Bajo P, Drysdale RN, Woodhead JD, Hellstrom JC, Hodell D, Ferretti P, Voelker AHL, Zanchetta G, Rodrigues T, Wolff E, Tyler J, Frisia S, Spötl C, Fallick AE (2020) Persistent influence of obliquity on ice age terminations since the Middle Pleistocene transition. Science 367, 1235–1239 (2020). [CrossRef]
- Barth AM, Clark PU, Bill NS, He F, Pisias NG (2018) Climate evolution across the Mid-Brunhes Transition. Clim. Past, 14, 2071–2087, 2018. [CrossRef]
- Bartoli G, Hönisch B, Zeebe RE (2011) Atmospheric CO2 decline during the Pliocene intensification of northern hemisphere glaciations. Paleoceanography 26, PA4213. [CrossRef]
- Bazin L, Landais A, Lemieux-Dudon B, Toyé Mahamadou Kele H, Veres D, Parrenin F, Martinerie P, Ritz C, Capron E, Lipenkov V, Loutre M-F, Raynaud D, Vinther B, Svensson A, Rasmussen SO, Severi M, Blunier T, Leuenberger M, Fischer H, Masson-Delmotte V, Chappellaz J, Wolff E (2013) An optimized multi-proxy, multi-site Antarctic ice and gas orbital chronology (AICC2012): 120–800 ka. Clim. Past, 9, 1715–1731, 2013. [CrossRef]
- Bereiter B, Eggleston S, Schmitt J, Nehrbass-Ahles C, Stocker TF, Fischer H, Kipfstuhl S, Chappellaz J (2015) Revision of the EPICA Dome C CO2 record from 800 to 600 kyr before present. Geophys. Res. Lett., 42, 1-8. [CrossRef]
- Berends CJ, Köhler P, Lourens LJ, van de Wal RSW (2021) On the cause of the mid-Pleistocene transition. Reviews of Geophysics, 59, 1-20. [CrossRef]
- Berger A, Loutre MF, Tricot C (1993) Insolation and Earth’s orbital periods. Journal of Geophysical Research Atmospheres, 98, D6, 93. 19 June. [CrossRef]
- Berger A, Loutre MF (1997) Long-term variations in insolation and their effects on climate, the LLN experiments. Surv. Geophys 18, 147–161. [CrossRef]
- Berger A, Li XS, Loutre MF (1999) Modeling northern hemisphere ice volume over the last 3 Ma. Quaternary Science Reviews, 18, 1–11.
- Berger A, Yin Q (2012) Modeling the interglacials of the last 1 million years. In: Berger et al. (eds) Climate change: inferences from paleoclimate and regional aspects. Springer-Verlag, Wien 2012.
- Berger A, Mélice JL, Loutre MF (2005) On the origin of the 100-kyr cycles in the astronomical forcing, Paleoceanogr., 20:PA4019. [CrossRef]
- Berger A, Yin QZ, Herold N (2012) MIS-11 and MIS-19, analogs of our Holocene interglacial. In: 3rd Int. Conf. on Earth Syst. Model., Hamburg. https://meetingorganizer.copernicus.org/3ICESM/3ICESM-11.pdf.
- Bills BG (1994) Obliquity-oblateness feedback: Are climatically sensitive values of obliquity dynamically unstable? Geophys. Res. Lett., 21, 3, 177-180, , 1994. 1 February.
- Bills BG (1998) An oblique view of climate. Nature, 396, 405-406, 3 December.
- Bintanja R, van de Wal RSW (2008) North American ice-sheet dynamics and the onset of 100,000-year glacial cycles. Nature, Vol 454, , 869- 872. 14 August. [CrossRef]
- Box JE, Hubbard A, Bahr DB, Colgan WT, Fettweis X, Mankoff KD, Wehrlé A, Noël B, van den Broeke MR, Wouters B, Bjørk AA, Fausto RS (2022) Greenland ice sheet climate disequilibrium and committed sea-level rise. Nature Climate Change, Vol 12, 22, pp. 808–813. 20 September. [CrossRef]
- Brovkin V, Ganopolski A, Archer D, Rahmstorf S (2007) Lowering of glacial atmospheric CO2 in response to changes in oceanic circulation and marine biogeochemistry. Paleoceanogr 22, PA4202. [CrossRef]
- Chalk TB, Hain MP, Foster GL, Rohling EJ, Sexton PF, Badger MPS, Cherry SG, Hasenfratz AP, Haug GH, Jaccard SL, Martínez-García A, Pälike H, Pancost RD, Wilson PA (2017) Causes of ice age intensification across the Mid-Pleistocene Transition. Proceedings of the National Academy of Sciences, 17, 1-6. 20 November. [CrossRef]
- Chao BF (2006) Earth’s oblateness and its temporal variations. C. R. Geoscience, 338 (2006), 1123–1129. [CrossRef]
- Cheng M, Tapley BD (2004) Variations in the Earth’s oblateness during the past 28 years. J. of Geophys. Res.,109, B09402. [CrossRef]
- Cheng M, Tapley BD, Ries JC (2013) Deceleration in the Earth’s oblateness. J. of Geophys. Res.: Solid Earth, 118, 740–747. [CrossRef]
- Cheng X, Tian J, Wang P (2004) Stable foraminifer isotope composition of ODP Site 184-1143, South China Sea. PANGAEA. [CrossRef]
- Clark PU, Archer D, Pollard D, Blum JD, Rial JA, Brovkin V, Mix AC, Pisias NG, Roy M (2006) The middle Pleistocene transition: characteristics, mechanisms, and implications for long-term changes in atmospheric pCO2. Quat. Sci. Rev. [CrossRef]
- Crucifix M (2012) - Oscillators and relaxation phenomena in Pleistocene climate theory. Phil. Trans. R. Soc. A (2012) 370, 1140–1165. [CrossRef]
- Cuffey KM, Clow GD (1997) - Temperature, accumulation, and ice sheet elevation in central Greenland through the last deglacial transition. Journal of Geophysical Research, vol. 102, No. C12, pages 26,383-26,396, november 30, 1997.
- Daradich A, Huybers P, Mitrovica JX, Chan N-H, Austermann J (2017) The influence of true polar wander on glacial inception in North America. Earth and Planetary Science Letters, 461 (2017), 96–104. [CrossRef]
- Ditlevsen PD, Ashwin P (2018) Complex Climate Response to Astronomical Forcing: The Middle-Pleistocene Transition in Glacial Cycles and Changes in Frequency Locking. Front. Phys 6, 62. [CrossRef]
- Elderfield H, Ferretti P, Greaves M, Crowhurst S, McCave IN, Hodell D, Piotrowski AM (2012) Evolution of Ocean Temperature and Ice Volume Through the Mid-Pleistocene Climate Transition. Science 337, 704–709 (2012). [CrossRef]
- Ellis R, Palmer M (2016) Modulation of ice ages via precession and dust-albedo feedbacks. Geoscience Frontiers, v. 7 (2016), pp. 891-909. [CrossRef]
- Elsner JB, Tsonis AA (1996) Singular spectrum analysis: a new tool in time series analysis. Springer, 1996.
- Ettema J, van den Broeke MR, van Meijgaard E, van de Berg WJ, Bamber JL, Box JE, Bales RC (2009), Higher surface mass balance of the Greenland ice sheet revealed by highresolution climate modeling, Geophys. Res. Lett., 36, L12501. [CrossRef]
- Farmer JR, Hönisch B, Haynes LL, Kroon D, Jung S, Ford HL, Raymo ME, Jaume-Seguí M, Bell DB, Goldstein SL, Pena LD, Yehudai M, Kim J (2019) Deep Atlantic Ocean carbon storage and the rise of 100,000-year glacial cycles. Nature Geosci. [CrossRef]
- Feng F, Bailer-Jones CAL (2015) Obliquity and precession as pacemakers of Pleistocene deglaciations. Quaternary Science Reviews, v. 122, , pp. 166-179. 15 August. [CrossRef]
- Ghil M, Allen RM, Dettinger MD, Ide K, Kondrashov D, Mann ME, Robertson A, Saunders A, Tian Y, Varadi F, Yiou P (2002) Advanced spectral methods for climatic time series. Rev. Geophys. 40(1):3.1–3.41. [CrossRef]
- Govin A, Braconnot P, Capron E, Cortijo E, Duplessy J-C, Jansen E, Labeyrie L, Landais A, Marti O, Michel E, Mosquet E, Risebrobakken B, Swingedouw D, Waelbroeck C (2012) Persistent influence of ice sheet melting on high northern latitude climate during the early Last Interglacial. Clim. Past, 8, 483–507, 2012. [CrossRef]
- Grant KM, Rohling EJ, Bronk Ramsey C, Cheng H, Edwards RL, Florindo F, Heslop D, Marra F, Roberts AP, Tamisiea ME, Williams F (2014) Sea-level variability over five glacial cycles. Nat. Commun., 5, 5076. [CrossRef]
- Hanna E, Huybrechts P, Konrad Steffen K, Cappelen J, Huff R, Shuman C, Irvine-Fynn T, Wise S, Griffiths M (2008) Increased Runoff from Melt from the Greenland Ice Sheet: A Response to Global Warming. American Meteorological Society, 21, 331-341. [CrossRef]
- Hansen J, Sato M, Kharecha P, Russell G, Lea DW, Siddall M (2007) Climate change and trace gases. Phil Trans. R. Soc. A 365, 1925–1954. [CrossRef]
- Hansen J, Sato M, Kharecha P, von Schuckmann K (2011) Earth’s energy imbalance and implications. Atmos. Chem. Phys 11, 13421–13449. [CrossRef]
- Hasenfratz AP, Jaccard SL, Martínez-García A, Sigman DM, Hodell DA, Vance D, Bernasconi SM, Kleiven HF, Haumann FA, Haug GH (2019) The residence time of Southern Ocean surface waters and the 100,000-year ice age cycle. Sci. 363, 1080-1084 (2019), 1-5. [CrossRef]
- Hassani H (2007) Singular spectrum analysis: methodology and comparison. J. Data Sci. 5(2007):239–257. 2: 5(2007).
- Hays JD, Imbrie J, Shackleton NJ (1976) Variations in the Earth’s Orbit: Pacemaker of the Ice Ages. Science, Vol. 194, No. 4270 (Dec. 10, 1976), pp. 1121-1132. https://www.jstor.org/stable/1743620.
- Head MJ, Gibbard PL (2005) Early–Middle Pleistocene transitions. An overview and recommendation for the defining boundary. From: Head MJ & Gibbard PL (eds). Early–middle Pleistocene transitions: the land–ocean evidence. Geological Society, London, Special Publications, 247, 1–18. 0305–8719/05/$15© The Geological Society of London 2005.
- Head MJ, Pillans B, Farquhar SA (2008) The Early–Middle Pleistocene transition: characterization and proposed guide for the defining boundary. Episodes 31(2):255–259. 2: Episodes 31(2).
- Herbert TD, Peterson LC, Lawrence KT, Liu Z (2010) Tropical ocean temperatures over the past 3.5 million years. Sci. 2010, 328, 1530–1534. [CrossRef] [PubMed]
- Hilgen FJ, Lourens LJ, Berger A, Loutre MF (1993) Evaluation of the astronomically calibrated time scale for the Late Piocene and the earliest Pleistocene. Paleoceanography 8, 549–565. [CrossRef]
- Hodell DA, Channell JET, Curtis JH, Romero OE, Rohl U (2008) Onset of ‘‘Hudson Strait’’ Heinrich events in the eastern North Atlantic at the end of the middle Pleistocene transition (~640 ka)? Paleoceanogr., 23, PA4218. [CrossRef]
- Hodell D, Lourens L, Crowhurst S, Konijnendijk T, Tjallingii R, Jiménez-Espejo F, Skinner L, Tzedakis PC, Shackleton Site Project Members (2015) A reference time scale for Site U1385 (Shackleton Site) on the SW Iberian Margin. Global and Planetary Change, 133 (2015), 49–64. [CrossRef]
- Hönisch B, Hemming NG, Archer D, Siddall M, McManus JF (2009) Atmospheric carbon dioxide concentration across the mid-Pleistocene transition. Science 324, 1551. [CrossRef]
- Huybers P (2006) Early Pleistocene glacial cycles and the integrated summer insolation forcing. Science, 313. [CrossRef]
- Huybers P (2007) Glacial variability over the last two million years: an extended depth-derived age model, continuous obliquity pacing, and the Pleistocene progression. Quat. Sci. Rev. 26 (2007):37–55. [CrossRef]
- Huybers P, Tziperman E (2008) Integrated summer insolation forcing and 40,000-year glacial cycles: The perspective from an ice-sheet/energy-balance model. Paleoceanography, vol. 23, 1-18. [CrossRef]
- Imbrie J, Berger A, Boyle EA, Clemens SC, Duffy A, Howard WR, Kukla G, Kutzbach J, Martinson DG, Mcintyre A, Mix AC, Molfino B, Morley, JJ, Peterson LC, Pisias NG, Prell WL, Raymo ME, Shackleton NJ, Toggweile JR (1993) On the structure and origin of major glaciation cycles 2. The 100,000-year cycle. Paleoceanogr. 8(6):699–735.
- Imbrie J, Imbrie-Moore A, Lisiecki LE (2011) A phase-space model for Pleistocene ice volume. Earth Planet Sci Lett 307, 94–102. [CrossRef]
- Jouzel J et al. (1997) Validity of the temperature reconstruction from water isotopes in ice cores, J. Geophys. Res., 102(C12), 26,471–26,487.
- Jouzel J et al. (2007) Orbital and millennial Antarctic climate variability over the past 800,000 years. Sci 317, 793–796. [CrossRef]
- Kender S, Ravelo AC, Worne S, Swann GEA, Leng MJ, Asahi H, Becker J, Detlef H, Aiello IW, Andreasen D, Hall IR (2018) Closure of the Bering Strait caused Mid-Pleistocene Transition cooling. Nature Commun. (2018) 9, 5386. [CrossRef]
- King MD, Howat IM, Candela SG, Noh MJ, Jeong S, Noël BPY, van den Broeke MR, Wouters B, Negrete A (2020) Dynamic ice loss from the Greenland Ice Sheet driven by sustained glacier retreat. Communications Earth & Environment (2020) 1, 1. [CrossRef]
- Köhler P, Bintanja R, Fischer H, Joos F, Knutti R, Lohmann G, Masson-Delmotte V (2010) What caused Earth’s temperature variations during the last 800,000 years? Data-based evidence on radiative forcing and constraints on climate sensitivity. Quat. Sci. Reviews 29 (2010) 129–145. [CrossRef]
- Köhler P, van de Wal RSW (2020) Interglacials of the Quaternary defined by northern hemispheric land ice distribution outside of Greenland. Nature Commun. (2020) 11, 5124. [CrossRef]
- Konijnendijk TYM, Ziegler M, Lourens LJ (2015) On the timing and forcing mechanisms of late Pleistocene glacial terminations: Insights from a new high- resolution benthic stable oxygen isotope record of the eastern Mediterranean. Quaternary Science Reviews, 129 (2015), 308-320. [CrossRef]
- Lang N, Wolff EW (2011) Interglacial and glacial variability from the last 800 ka in marine, ice and terrestrial archives. Clim. Past, 7, 361–380, 2011. [CrossRef]
- Laskar J, Joutel F, Boudin F (1993) - Orbital, precessional and insolation quantities for the Earth from -20 Myr to +10 Myr. Astronomy & Astrophysics, Vol. 270, pp. 522– 533.
- Laskar J, Robutel P, Joutel F, Gastineau M, Correia ACM, Levrard B (2004) A long term numerical solution for the insolation quantities of the Earth. Astron. Astrophys 428, La2004.
- Laskar J, Fienga A, Gastineau M, Manche H (2011) La2010: a new orbital solution for the long-term motion of the Earth. Astron. Astrophys 532, A89. [CrossRef]
- Lawrence DM, Slater AG, Tomas RA, Holland MM, Deser C (2008) Accelerated Arctic land warming and permafrost degradation during rapid sea ice loss. Geophys Res Lett 35, L11506. [CrossRef]
- Lawrence KT, Herbert TD, Brown CM, Raymo ME, Haywood AM (2009) High-amplitude variations in North Atlantic sea surface temperature during the early Pliocene warm period. Paleoceanography, vol. 24, PA2218. [CrossRef]
- Lawrence KT, Sosdian S, White HE, Rosenthal Y (2010) North Atlantic climate evolution through the Plio-Pleistocene climate transitions. Earth and Planetary Science Letters, 300 (2010), 329–342. [CrossRef]
- Lemke P, Ren J, Alley RB, Allison I, Carrasco J, Flato G, Fujii Y, Kaser G, Mote P, Thomas RH, Zhang T (2007) Observations: Changes in Snow, Ice and Frozen Ground. In: Climate Change 2007.
- Levrard B, Laskar J (2003) Climate friction and the Earth’s obliquity. Geophys. J. Int 154, 970–990. [CrossRef]
- Li L, Qianyu L, Jun T, Pinxian W, Hui W, Zhonghui L. (2011) A 4-Ma record of thermal evolution in the tropical western Pacific and its implications on climate change. Earth and Planetary Science Letters, 309 (2011), 10–20. [CrossRef]
- Lisiecki LE, Raymo ME (2005) A Pliocene-Pleistocene stack of 57 globally distributed benthic δ18O records. Paleoceanogr 20, PA1003. [CrossRef]
- Lisiecki LE, Raymo ME (2007) Plio–Pleistocene climate evolution; trends and transitions in glacial cycle dynamics. Quat. Sci. Rev. 26(2007):56– 69. [CrossRef]
- Lisiecki LE, Raymo ME (2009) Diachronous benthic δ18O responses during late Pleistocene terminations, Paleoceanography, 24, PA3210. d.
- Lisiecki LE (2010) Links between eccentricity forcing and the 100,000-year glacial cycle. Nature Geoscience, vol 3, may 2010, 349-352. [CrossRef]
- Lisiecki LE (2014) Atlantic overturning responses to obliquity and precession over the last 3 Ma. Paleoceanogr., 29, 71–86. [CrossRef]
- Liu Z, Cleaveland LC, Herbert TD (2008) Early onset and origin of 100-kyr cycles in Pleistocene tropical SST records. Earth and Planetary Science Letters 265 (2008), 703–715. [CrossRef]
- Loulergue L, Schilt A, Spahni R, Masson-Delmotte V, Blunier T, Lemieux B, Barnola JM, Raynaud D, Stocker TF, Chappellaz J (2008) Orbital and millennial-scale features of atmospheric CH4 over the past 800,000 years. Nature 453. [CrossRef]
- Luthi D, Le Floch M, Bereiter B, Blunier T, Barnola JM, Siegenthaler U, Raynaud D, Jouzel J, Fischer H, Kawamura K, Stocker TF (2008) High-resolution carbon dioxide concentration record 650,000–800,000 years before present. Nature 453. [CrossRef]
- Martinez-Boti MA, Foster GL, Chalk TB, Rohling EJ, Sexton PF, Lunt DJ, Pancost RD, Badger MPS, Schmidt DN (2015) Plio-Pleistocene climate sensitivity evaluated using high-resolution CO2 records. Nature 518. [CrossRef]
- Masson-Delmotte V et al. (2006) Past and future polar amplification of climate change: climate model intercomparisons and ice-core constraints. Climate Dynamics (2006) 26, 513–529. [CrossRef]
- Masson-Delmotte V, Braconnot P, Hoffmann G, Jouzel J, Kageyama M, Landais A, Lejeune Q, Risi C, Sime L, Sjolte J, Swingedouw D, Vinther B (2011) Sensitivity of interglacial Greenland temperature and δ18O: ice core data, orbital and increased CO2 climate simulations. Clim. Past, 7, 1041–1059, 2011. [CrossRef]
- McClymont EL, Sosdian SM, Rosell-Melé A, Rosenthal Y (2013) Pleistocene sea-surface temperature evolution: Early cooling, delayed glacial intensification, and implications for the mid-Pleistocene climate transition. Earth-Science Reviews, Volume 123, 173-193. [CrossRef]
- Meyers SR and Hinnov LA (2010), Northern Hemisphere glaciation and the evolution of Plio-Pleistocene climate noise, Paleoceanography, 25, PA3207. d.
- Miller GH, Alley RB, Brigham-Grette J, Fitzpatrick JJ, Polyak L, Serreze MC, White JWC (2010) Arctic amplification: can the past constrain the future? Quaternary Science Reviews, 29 (2010), 1779–1790. [CrossRef]
- Mitrovica JX, Peltier WR (1993) - Present-day secular variations in the zonal harmonics of the Earth’s geopotential. J. Geophys. Res., 98 (B3), 4509–4526. [CrossRef]
- Mukhin D, Gavrilov A, Loskutov E, Kurths J, Feigin A (2019) Bayesian Data Analysis for Revealing Causes of the Middle Pleistocene Transition. Scientific Reports (2019), 9, 7328. [CrossRef]
- Nakada M, Okuno J (2017) Secular variations in zonal harmonics of Earth’s geopotential and their implications for mantle viscosity and Antarctic melting history due to the last deglaciation. Geophys. J. Int. (2017) 209, 1660–1676. [CrossRef]
- Nerem RS, Wahr J (2011) Recent changes in the Earth’s oblateness driven by Greenland and Antarctic ice mass loss. Geophys. Res. Lett. 38, L13501. [CrossRef]
- Nyman KHM, Ditlevsen PD (2019) The middle Pleistocene transition by frequency locking and slow ramping of internal period. Climate Dynamics. [CrossRef]
- Past interglacials working group of PAGES (2016), Interglacials of the last 800,000 years. Rev. Geophys 54, 162–219. [CrossRef]
- Pattyn F, Ritz C, Hanna E, Asay-Davis X, DeConto R, Durand G, Favier L, Fettweis X, Goelzer H, Golledge NR, Munneke PK, Lenaerts JTM, Nowicki S, Payne AJ, Robinson A, Seroussi H, Trusel LD, van den Broeke M (2018) The Greenland and Antarctic ice sheets under 1. 5 °C global warming. Nature Climate Change. [CrossRef]
- Quinn C, Sieber J, von der Heydt AS, Lenton TM (2018) The Mid-Pleistocene Transition induced by delayed feedback and bistability. Dynamics and Statistics of the Climate System, 2018, 1–17. [CrossRef]
- Raymo ME (1997) The timing of major climate terminations. Paleoceanography, Vol. 12, No. 4, Pages 577-585, August 1997.
- Raymo ME, Nisancioglu K (2003) The 41 kyr world: Milankovitch’s other unsolved mystery. Paleoceanography, vol. 18, no. 1. [CrossRef]
- Rial JA (1999) Pacemaking the Ice Ages by frequency modulation of Earth’s orbital eccentricity. Science 285, 564–568.
- Rial JA, Pielke RA Sr, Beniston M, Claussen M, Canadell J, Cox P, Held H, deNoblet-Ducoudré N, Prinn R, Reynolds JF, Salas JD (2004) Nonlinearities, feedbacks and critical thresholds within the Earth’s climate system. Clim. Chang. 65(1–2):11–38, 2004.
- Rubincam DP (1993) The obliquity of Mars and climate friction. J. Geophys. Res 98, 10827–10832.
- Ruddiman WF (2003) Orbital insolation, ice volume, and greenhouse gases. Quat. Sci. Rev. 22, 1597–1629.
- Russon T, Elliot M, Sadekov A, Cabioch G, Corrège T, De Deckker P (2011), The mid-Pleistocene transition in the subtropical southwest Pacific, Paleoceanography, 26, PA1211.
- Seki O, Foster GL, Schmidt DN, Mackensen A, Kawamura K, Pancost RD (2010) Alkenone and boron-based Pliocene pCO2 records. Earth Planet Sci Lett 292(2010):201–211. [CrossRef]
- Seo K-W, Chen J, Wilson CR, Lee C-K (2015) Decadal and quadratic variations of Earth’s oblateness and polar ice mass balance from 1979 to 2010. Geophys. J. Int. (2015) 203, 475–481. [CrossRef]
- Shackleton NJ (1967) Oxygen isotope analysis and pleistocene temperature reassessed. Nature 215, 15–17.
- Shackleton NJ (2000) The 100,000-year ice-age cycle identified and found to lag temperature, carbon dioxide, and orbital eccentricity. Sci 289, 1897–1902.
- Shoenfelt EM, Winckler G, Lamy F, Anderson RF, Bostick BC (2018) Highly bioavailable dust-borne iron delivered to the Southern Ocean during glacial periods. PNAS, 1-6,. [CrossRef]
- Skinner LC, Shackleton NJ (2005), An Atlantic lead over Pacific deep-water change across Termination I: Implications for the application of the marine isotope stage stratigraphy, Quat. Sci. Rev., 24, 571–580. [CrossRef]
- Steinberger B, Spakman W, Japsen P, Torsvik TH (2015) The key role of global solid-Earth processes in preconditioning Greenland’s glaciation since the Pliocene. Terra Nova, 27, 1–8, 2015. [CrossRef]
- Steinhilber, F., Abreu, J.A., Beer, J., Brunner, I., Christl, M., Fischer, H., Heikkil¨a, U., Kubik, P.W., Mann, M., McCracken, K.G., Miller, H., Miyahara, H., Oerter, H., Wilhelms, F., 2012. 9,400 years of cosmic radiation and solar activity from ice cores and tree rings. PNAS, April 109 (16), 5967–5971. 10 April. [CrossRef]
- Sun Y, Riva R, Ditmar P, Rietbroek R (2019) Using GRACE to explain variations in the Earth’s oblateness. Geophysical Research Letters, 46. [CrossRef]
- Sun Y, Riva R (2020) A global semi-empirical glacial isostatic adjustment (GIA) model based on Gravity Recovery and Climate Experiment (GRACE) data. Earth Syst. Dynam., 11, 129–137, 2020. [CrossRef]
- Tarnocai C, Canadell JG, Schuur EAG, Kuhry P, Mazhitova G, Zimov S (2009) Soil organic carbon pools in the northern circumpolar permafrost region. Global Biogeochem. Cycles 23, GB2023. [CrossRef]
- Vautard R, Ghil M (1989) Singular spectrum analysis in nonlinear dynamics, with applications to paleoclimatic time series. Physica D 35(1989):395–424 North-Holland, Amsterdam.
- Viaggi P (2018a) δ18O and SST signal decomposition and dynamic of the Pliocene-Pleistocene climate system: new insights on orbital nonlinear behavior vs. long-term trend. Prog. in Earth and Planet. Sci., 2018, 5:81, 7 December 2018. [CrossRef]
- Viaggi P (2018b) δ18O and SST signal decomposition and dynamic of the Pliocene-Pleistocene climate system: new insights on orbital nonlinear behavior vs. long-term trend. Prog. in Earth and Planet. Sci., 2018, 5:81, 7 December 2018, Supplementary data set: https://static-content.springer.com/esm/art%3A10.1186%2Fs40645-018-0236-z/MediaObjects/40645_2018_236_MOESM2_ESM.xls. 7 December.
- Viaggi P, Scotti P, Previde Massara E, Knezaurek G, Menichetti E, Piva A, Torricelli S, Gambacorta G (2019) Paleoceanographic Evolution of mid-Cretaceous Paleobioproductivity and Paleoredox Chemometric Signals. Link to Cretaceous Long-term Eustatic Climax from a Central Atlantic Well Sequence. Conference presentation, STRATI 2019, 3rd International Congress on Stratigraphy (2-, Milan). 5 July. [CrossRef]
- Viaggi P (2021a) Quantitative impact of astronomical and sun-related cycles on the Pleistocene climate system from Antarctica records. Quaternary Science Advances, Volume 4, October 2021. [CrossRef]
- Viaggi P (2021b) Quantitative impact of astronomical and sun-related cycles on the Pleistocene climate system from Antarctica records. Quaternary Science Advances, Volume 4, October 2021, Supplementary data set: https://ars.els-cdn.com/content/image/1-s2.0-S2666033421000162-mmc2.xlsx.
- Viaggi P (2021c) Evidence of Climate Mitigation Feedbacks by Global Forest Cover Expansion during the Pliocene. Int J Environ Sci Nat Res, 2021, 28(5), 1-5. [CrossRef]
- Waelbroeck C, Levi C, Duplessy J-C, Labeyrie L, Michel E, Cortijo E, Bassinot F, Guichard F (2006) Distant origin of circulation changes in the Indian Ocean during the last deglaciation. Earth Planet. Sci. Lett., 243, 244–251.
- Whitehouse PL (2018) Glacial isostatic adjustment modelling: historical perspectives, recent advances, and future directions. Earth Surf. Dynam., 6, 401–429, 2018. [CrossRef]
- Williams DM, Kasting JF, Frakes LA (1998) Low-latitude glaciations and rapid changes in the Earth’s obliquity explained by obliquity–oblateness feedback. Nature 396, 453–455. [CrossRef]
- Wunsch C (2004) Quantitative estimate of the Milankovitch-forced contribution to observed Quaternary climate change. Quat. Sci. Rev. 23(2004):1001–1012. [CrossRef]
- Yehudai M, Kim J, Penac LD, Jaume-Seguì M, Knudson KP, Bolge L, Malinverno A, Bickert T, Goldstein SL (2021) Evidence for a Northern Hemispheric trigger of the 100,000-y glacial cyclicity. PNAS 2021, Vol. 118 No. 46, pp. 1-11. [CrossRef]
- Yin J, Overpeck JT, Griffies SM, Hu A, Russell JL, Stouffer RJ (2011) Different magnitudes of projected subsurface ocean warming around Greenland and Antarctica. Nature Geoscience, 1-5. [CrossRef]
- Yin QZ, Berger A (2012) Individual contribution of insolation and CO2 to the interglacial climates of the past 800,000 years. Clim Dyn (2012) 38, 709–724. [CrossRef]
- Zachos JC, Pagani M, Sloan L, Thomas E, Billups K (2001) Trends, rhythms, and aberrations in global climate 65 Myr to present. Science 292, pp.686-693. Zachos JC, Dickens GR, Zeebe RE (2008) An early Cenozoic perspective on greenhouse warming and carbon-cycle dynamics. NATURE, Vol. 451, 17 January 2008. [CrossRef]
- Zharkova V, Shepherd SJ, Zharkov SI (2012) Principal component analysis of background and sunspot magnetic field variations during solar cycles 21–23. Mon. Not. R. Astron. Soc. 424, 2943–2953 (2012). [CrossRef]
| Rs statistic | Signal | Short eccentricity | Obliquity | Precession |
|---|---|---|---|---|
| Max | D | 6.40 | 1.56 | 2.78 |
| CO2 | 6.18 | 4.21 | 2.58 | |
| CH4 | 7.32 | 4.97 | 4.48 | |
| 18O | 7.70 | 2.11 | 2.25 | |
| Min | D | –1.02 | –0.45 | –1.10 |
| CO2 | –0.88 | –0.97 | –0.96 | |
| CH4 | –0.46 | –1.08 | –0.96 | |
| 18O | –0.04 | –0.70 | –0.97 |
| RSL component rank | RSL component variance | Frequency (kyr-1) | TISA power (%) | Period (kyr) | Forcing |
|---|---|---|---|---|---|
| 1-2;7-10 | 61.4 % | 0.01001973 | 100.0 | 100 | Short eccentricity |
| 3-4;13-14 | 13.1 % | 0.02460637 | 84.8 | 41 | Obliquity |
| 0.03244360 | 15.2 | 31 | |||
| 5-6;11-12 | 11.7 % | 0.04393214 | 80.9 | 23 | Precession |
| 0.05342083 | 19.1 | 19 | |||
| 15-200 | 13.8 % | Suborbital + noise |
| Forcing | Red Sea1 | Antarctica1 | LR04 | ||
|---|---|---|---|---|---|
| RSL (%) | Δσ (%) | EPICA (%) | Δσ (%) | δ18O (%) | |
| Short eccentricity | 14.5 | 8.0 | 12.2 | 5.7 | 6.5 |
| Obliquity | 3.1 | –6.8 | 4.5 | –5.4 | 9.9 |
| Precession | 2.8 | 0.8 | 2.0 | 0.0 | 2.0 |
| 1 rescaled variance | |||||
| Obliquity component | Cross- spectrum freq. (kyr-1) | Cross- spectrum period (kyr) | Coherency | Phase shift (Deg, kyr) | |
| EPICA D (0-800 kyr)1 | 0.02500 | 40.0 | 0.93 | –37 | –4.1 |
| EPICA CO2 (0-800 kyr)1 | 0.02500 | 40.0 | 0.23a | –63 | –7.0 |
| EPICA CH4 (0-800 kyr)1 | 0.02500 | 40.0 | 0.76 | –29 | –3.2 |
| EPICA stack (0-800 kyr)1 | 0.02500 | 40.0 | 0.79 | –38 | –4.2 |
| SST East Equatorial Pacific ODP 846 (6-800 kyr)2 | 0.02500 | 40.0 | 0.59 | –9 | –1.0 |
| SST North Atlantic DSDP 607 (250-2000 kyr)*3 | 0.02444 | 40.9 | 0.64 | –34 | –3.9 |
| SST West Tropical Pacific IODP 1146 (6-800 kyr)*4 | 0.02500 | 40.0 | 0.86 | –52 | –5.7 |
| SST Arabian Sea ODP 722 (8-800 kyr)*4 | 0.02500 | 40.0 | 0.83 | –34 | –3.8 |
| 18O benthic LR04 global stack (0-800 kyr)2 | 0.02500 | 40.0 | 0.88 | –50 | –5.5 |
| 18O benthic Atlantic stack (0-800)*5 | 0.02500 | 40.0 | 0.86 | –52 | –5.8 |
| 18O benthic Pacific stack (0-800)*5 | 0.02500 | 40.0 | 0.88 | –51 | –5.7 |
| 18O benthic East Mediterr. ODP 967/968 (0-800 kyr)*6 | 0.02500 | 40.0 | 0.69 | –40 | –4.4 |
| Mean (EPICA stack + SST) | 0.02489 | 40.2 | 0.74 | –33 ± 15 | –3.7 ± 1.7 |
| Mean (benthic18O) | 0.02500 | 40.0 | 0.83 | –48 ± 6 | –5.3 ± 0.6 |
| * Morlet wavelet 41-kyr component (filter centred on main frequency 0.0241±0.005 kyr-1) | |||||
| Forcing | Signal | Cross-spectrum freq. (kyr-1) | Cross-spectrum period (kyr) | Coherency | Phase shift (Deg, kyr) | ||
| Short eccentricity* | RSL | 0.010 | 100.0 | 0.78 | –12.6 | –3.50 | RSL lags short ecc. |
| 18O | 0.010 | 100.0 | 0.75 | –9.8 | –2.72 | 18O lags short ecc. | |
| RSL vs.18O | 0.010 | 100.0 | 0.94 | 2.8 | 0.78 | 18O leads RSL | |
| Obliquity | RSL | 0.024 | 41.7 | 0.88 | –48.8 | –5.65 | RSL lags obl. |
| 18O | 0.024 | 41.7 | 0.86 | –66.1 | –7.65 | 18O lags obl. | |
| RSL vs.18O | 0.024 | 41.7 | 0.83 | –17.3 | –2.00 | 18O lags RSL | |
| Precession | RSL | 0.044 | 22.7 | 0.92 | –46.3 | –2.92 | RSL lags prec. |
| 18O | 0.044 | 22.7 | 0.88 | –62.7 | –3.96 | 18O lags prec. | |
| RSL vs.18O | 0.044 | 22.7 | 0.92 | –16.5 | –1.04 | 18O lags RSL | |
| Forcing | EPICA signal | Cross-spectrum freq. (kyr-1) | Cross-spectrum period (kyr) | Coherency | Phase shift (Deg, kyr) | ||
| Eccentricity | Short ecc. stack | 0.01125 | 88.9 | 0.94 | 17.4 | 4.30 | EPICA signal leads |
| Short eccentricity1 | Short ecc. stack | 0.01125 | 88.9 | 0.94 | 18.3 | 4.52 | EPICA signal leads |
| Mean annual insolation (short eccentricity1) | Short ecc. stack | 0.01 | 100.0 | 0.72 | 13.8 | 3.83 | EPICA signal leads |
| Obliquity | Obliquity stack | 0.025 | 40.0 | 0.98 | -37.9 | -4.21 | EPICA signal lags |
| Precession | Precession stack | 0.0425 | 23.5 | 0.67 | -60.8 | -3.97 | EPICA signal lags |
| 1400-kyr band filtered out by wavelet analysis. | |||||||
Disclaimer/Publisher’s Note: The statements, opinions and data contained in all publications are solely those of the individual author(s) and contributor(s) and not of MDPI and/or the editor(s). MDPI and/or the editor(s) disclaim responsibility for any injury to people or property resulting from any ideas, methods, instructions or products referred to in the content. |
© 2023 by the authors. Licensee MDPI, Basel, Switzerland. This article is an open access article distributed under the terms and conditions of the Creative Commons Attribution (CC BY) license (http://creativecommons.org/licenses/by/4.0/).


