Submitted:
08 September 2023
Posted:
11 September 2023
You are already at the latest version
Abstract
Keywords:
1. Introduction
2. Structure and Performance Parameters
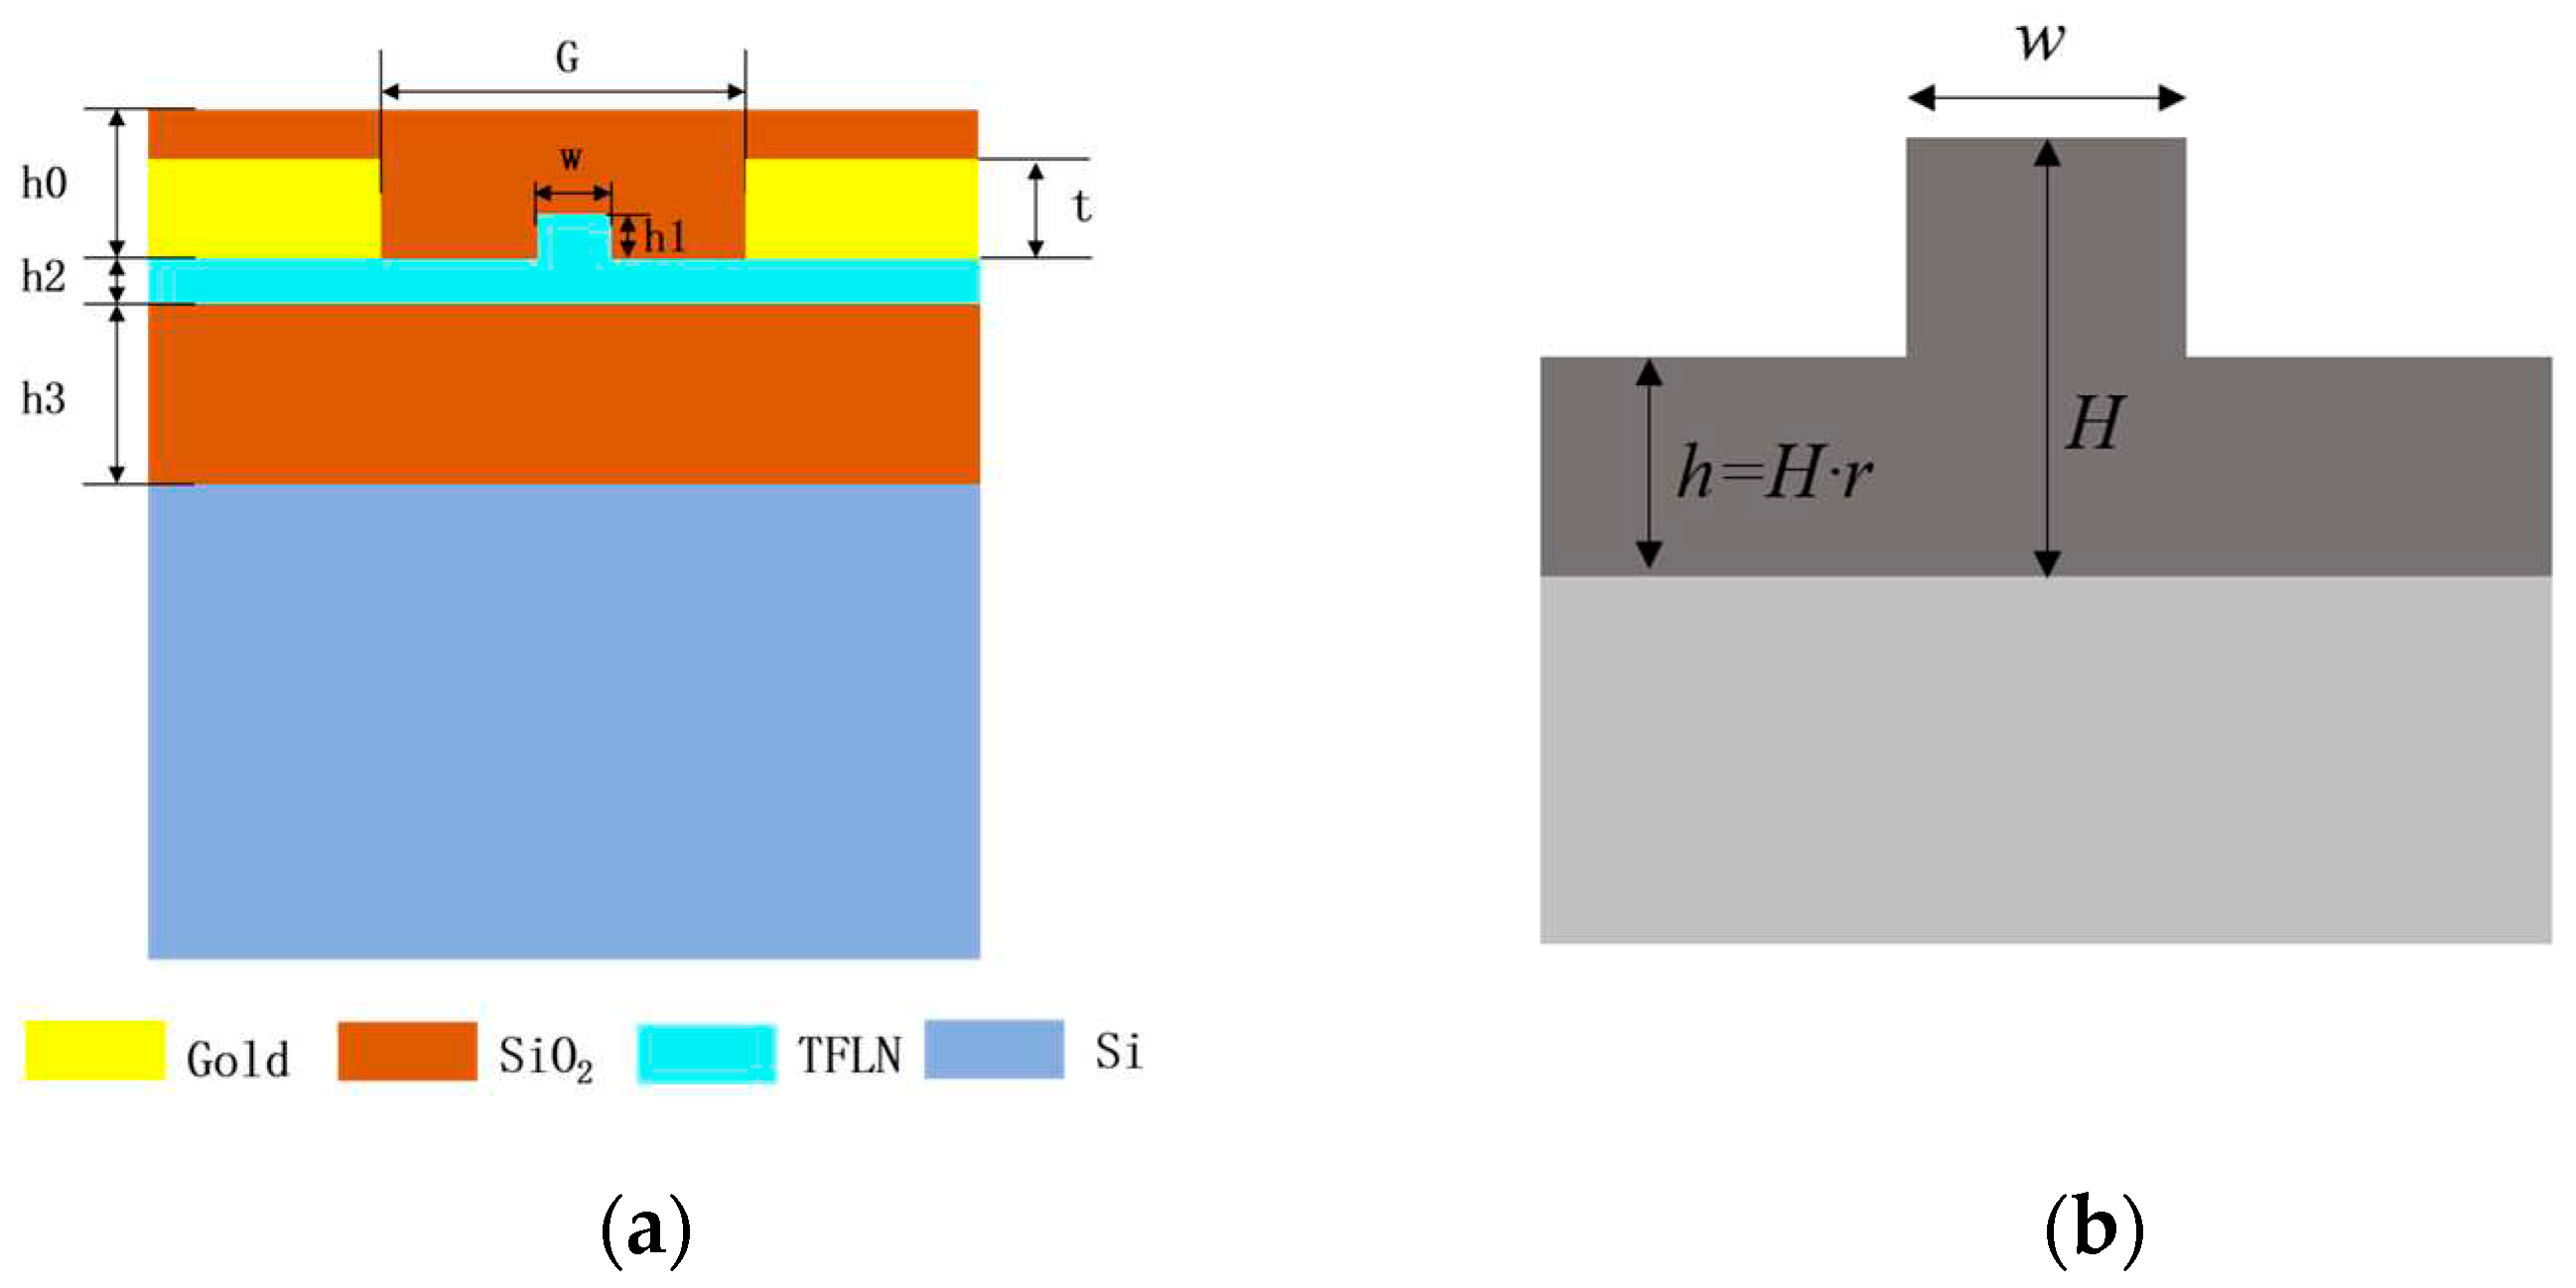
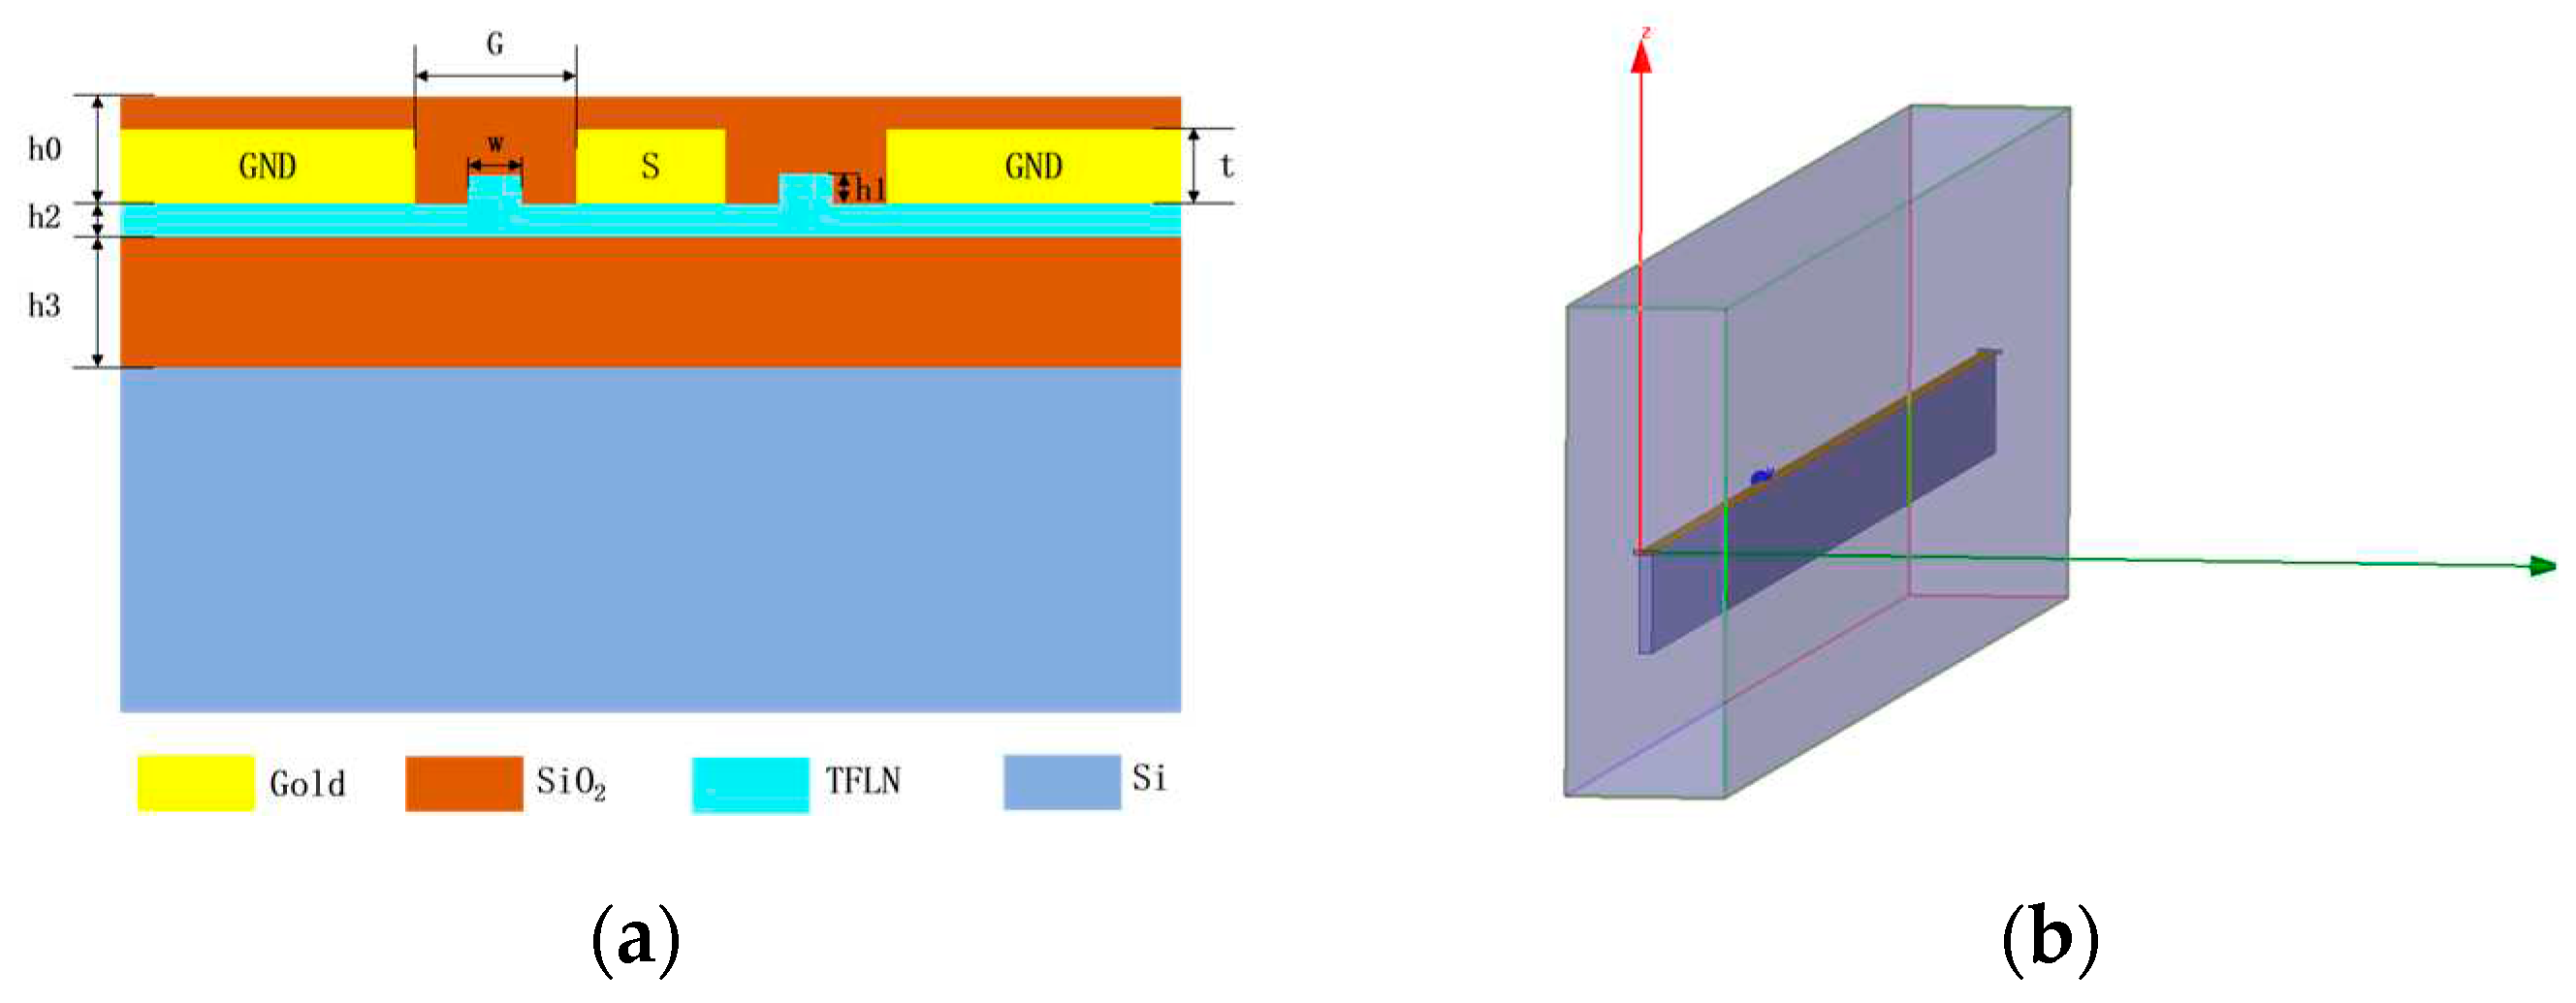
2.1. Modulator Structure
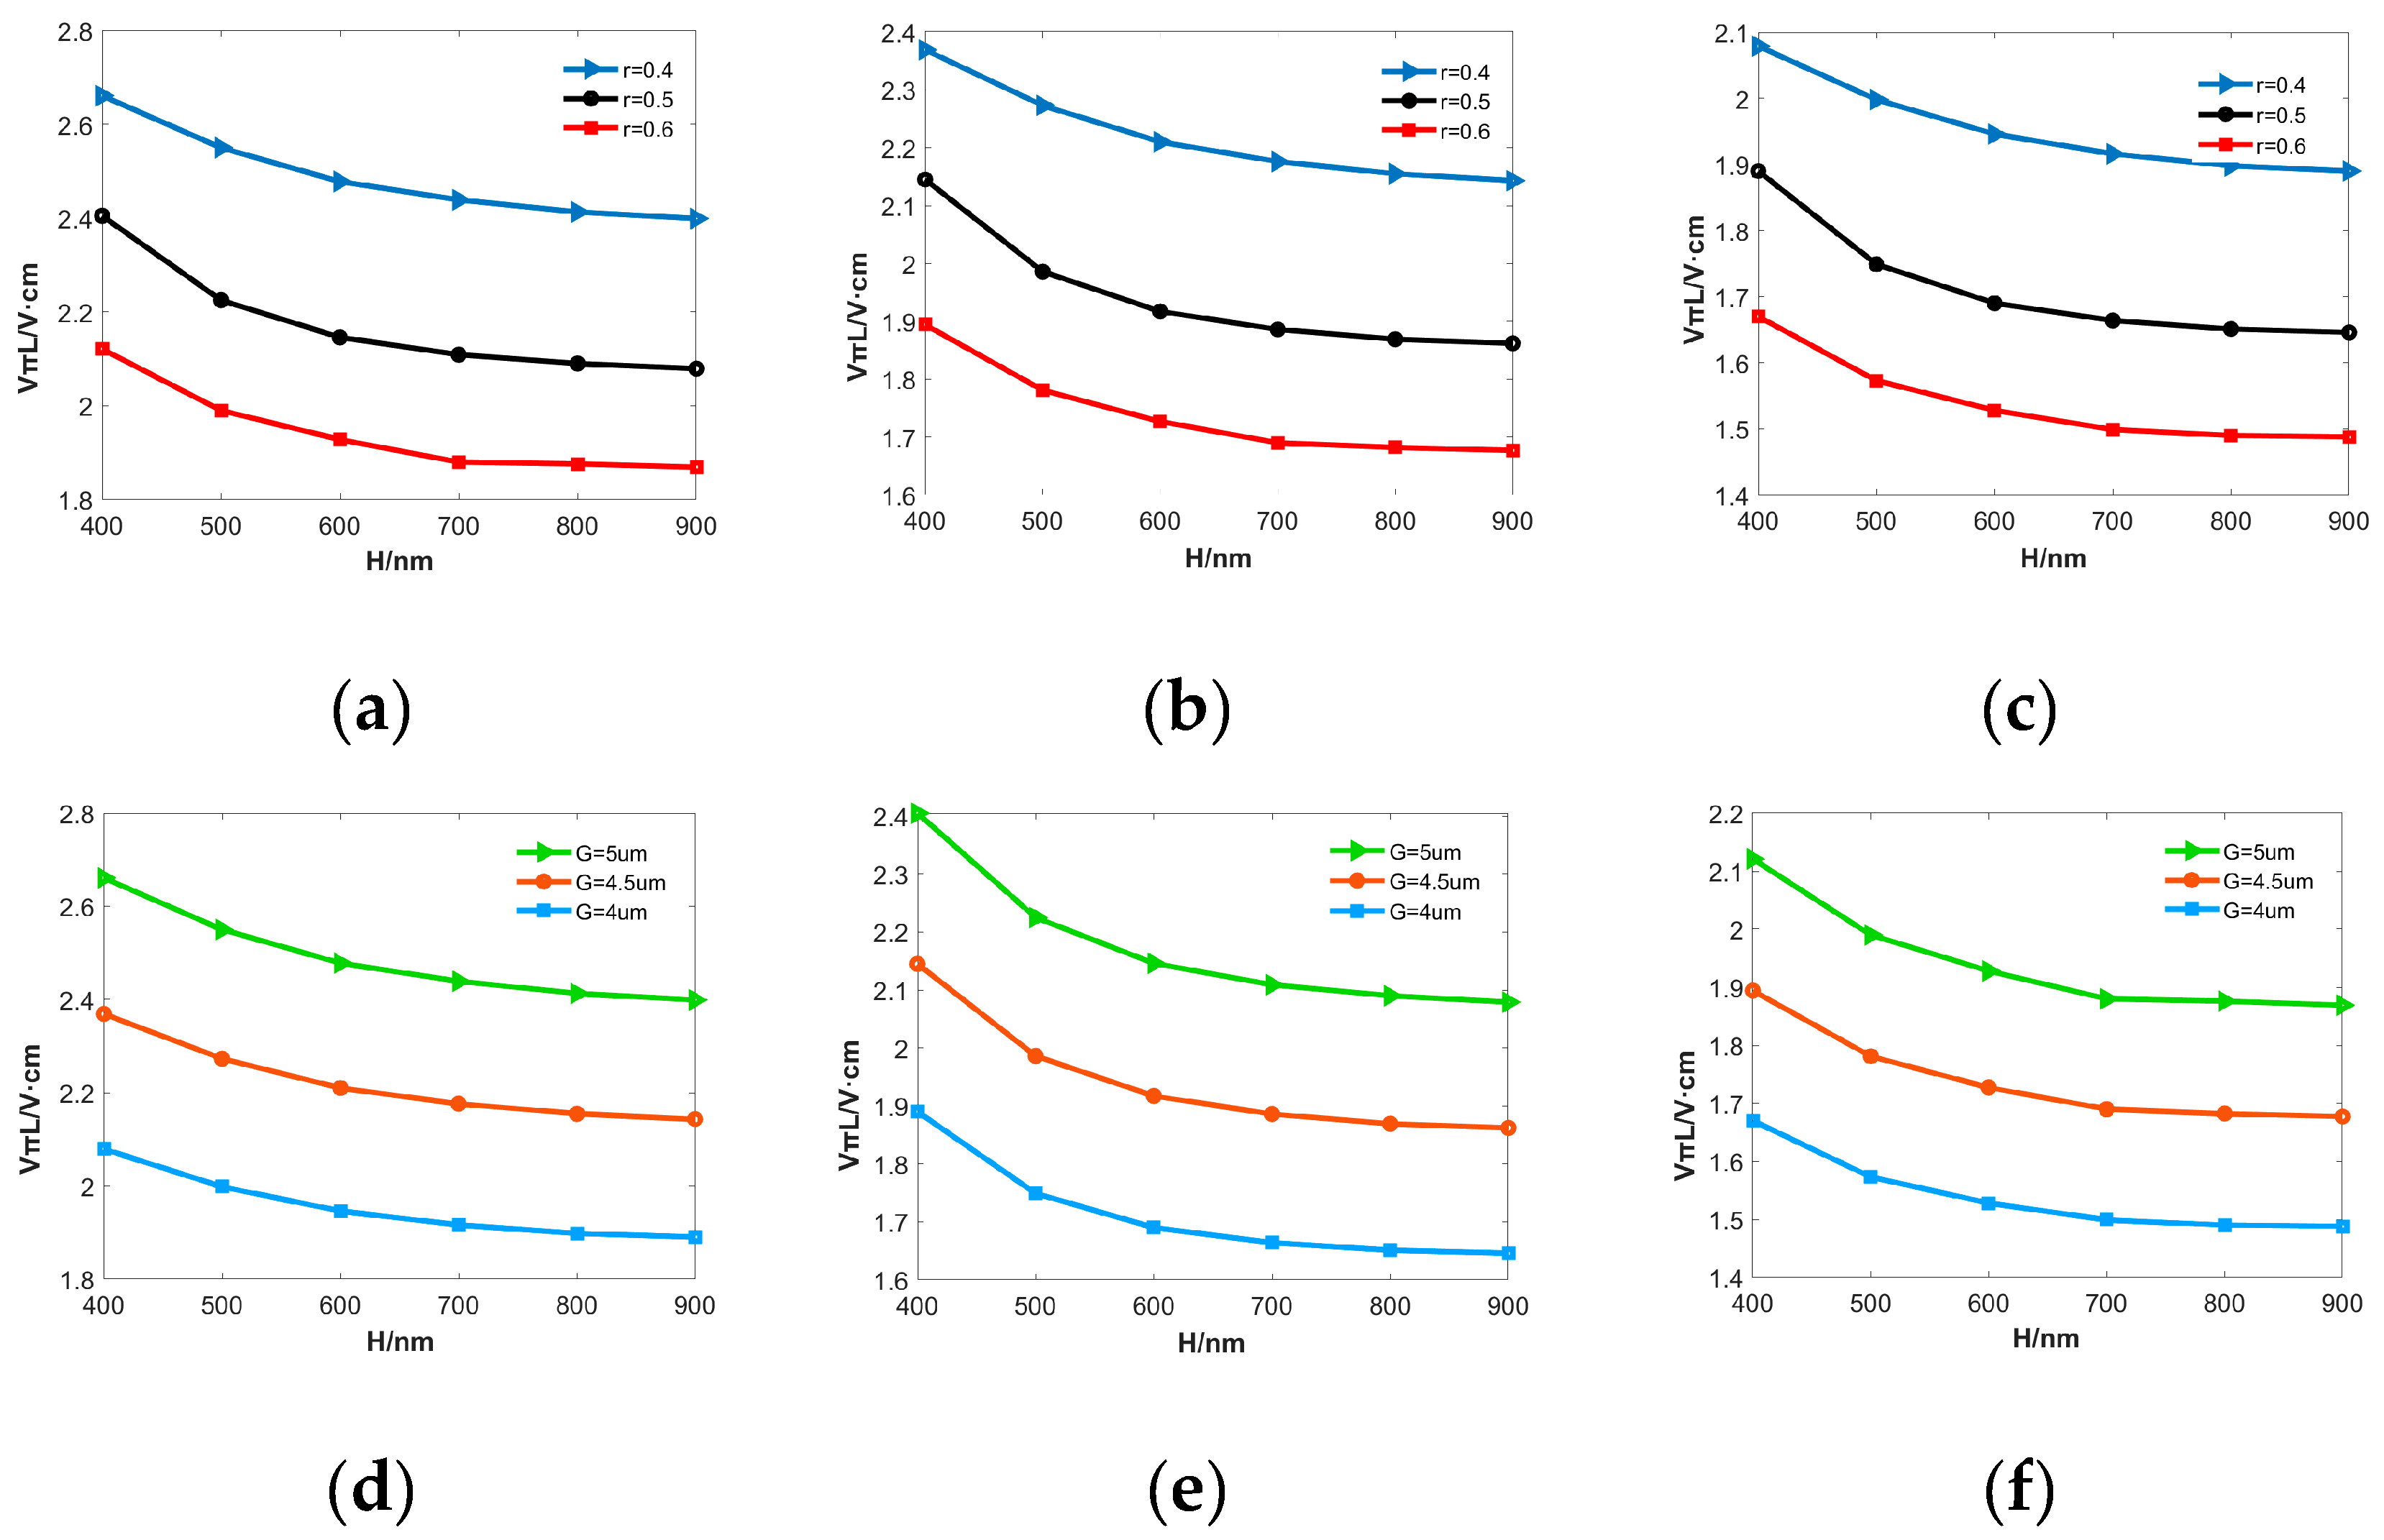
2.2. The half-wave voltage-length product
2.3. 3dB Modulation Bandwidth
2.4. Other Performance Metrics
3. Design and Optimization of Traveling Wave Modulator Structure
3.1. Optical Modeling and performaces Optimizing of the Travelling Waveguide Structure
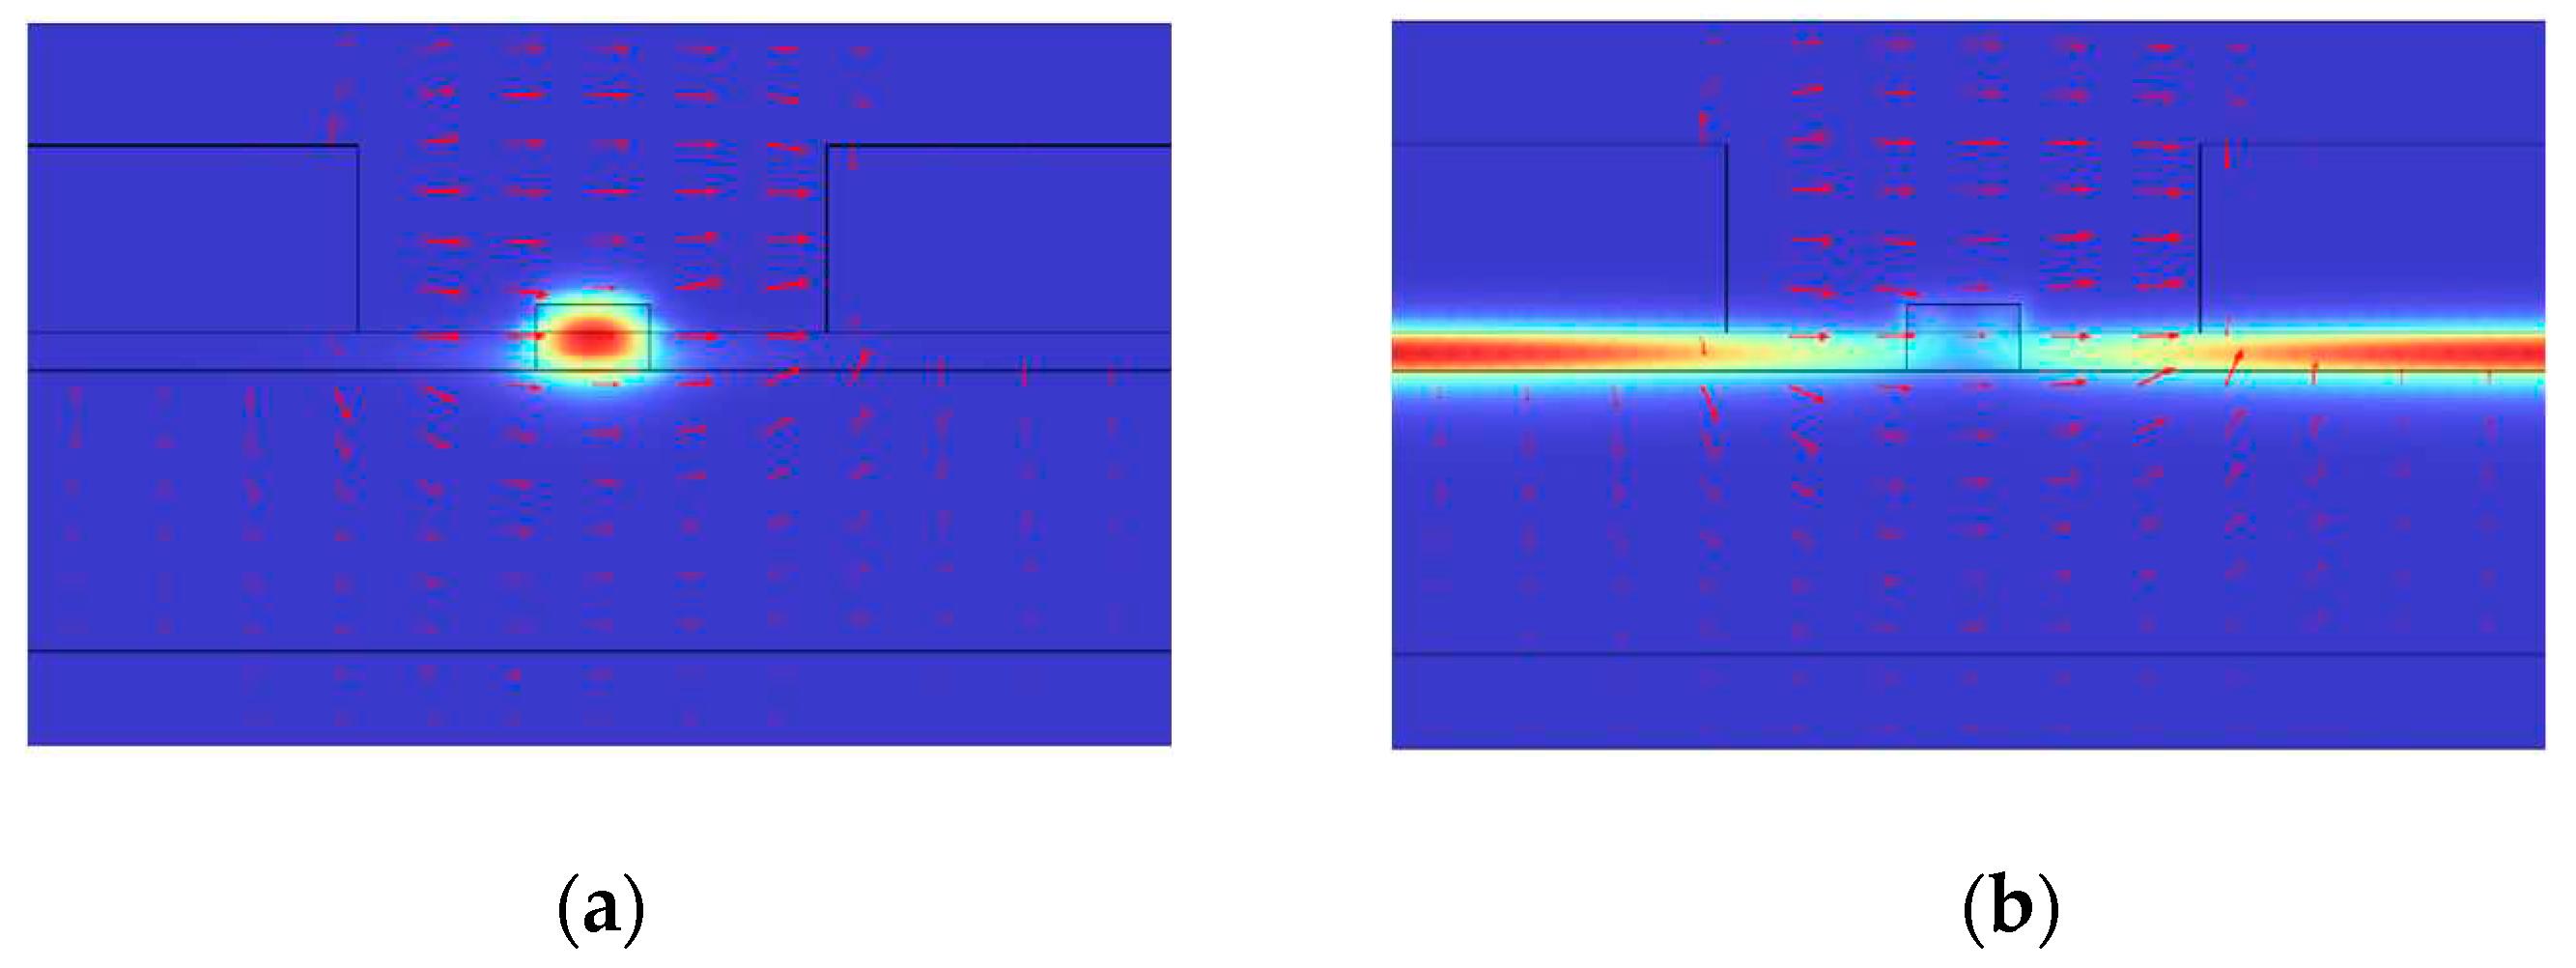
3.1.1. Design of steady-state distribution of optical mode field
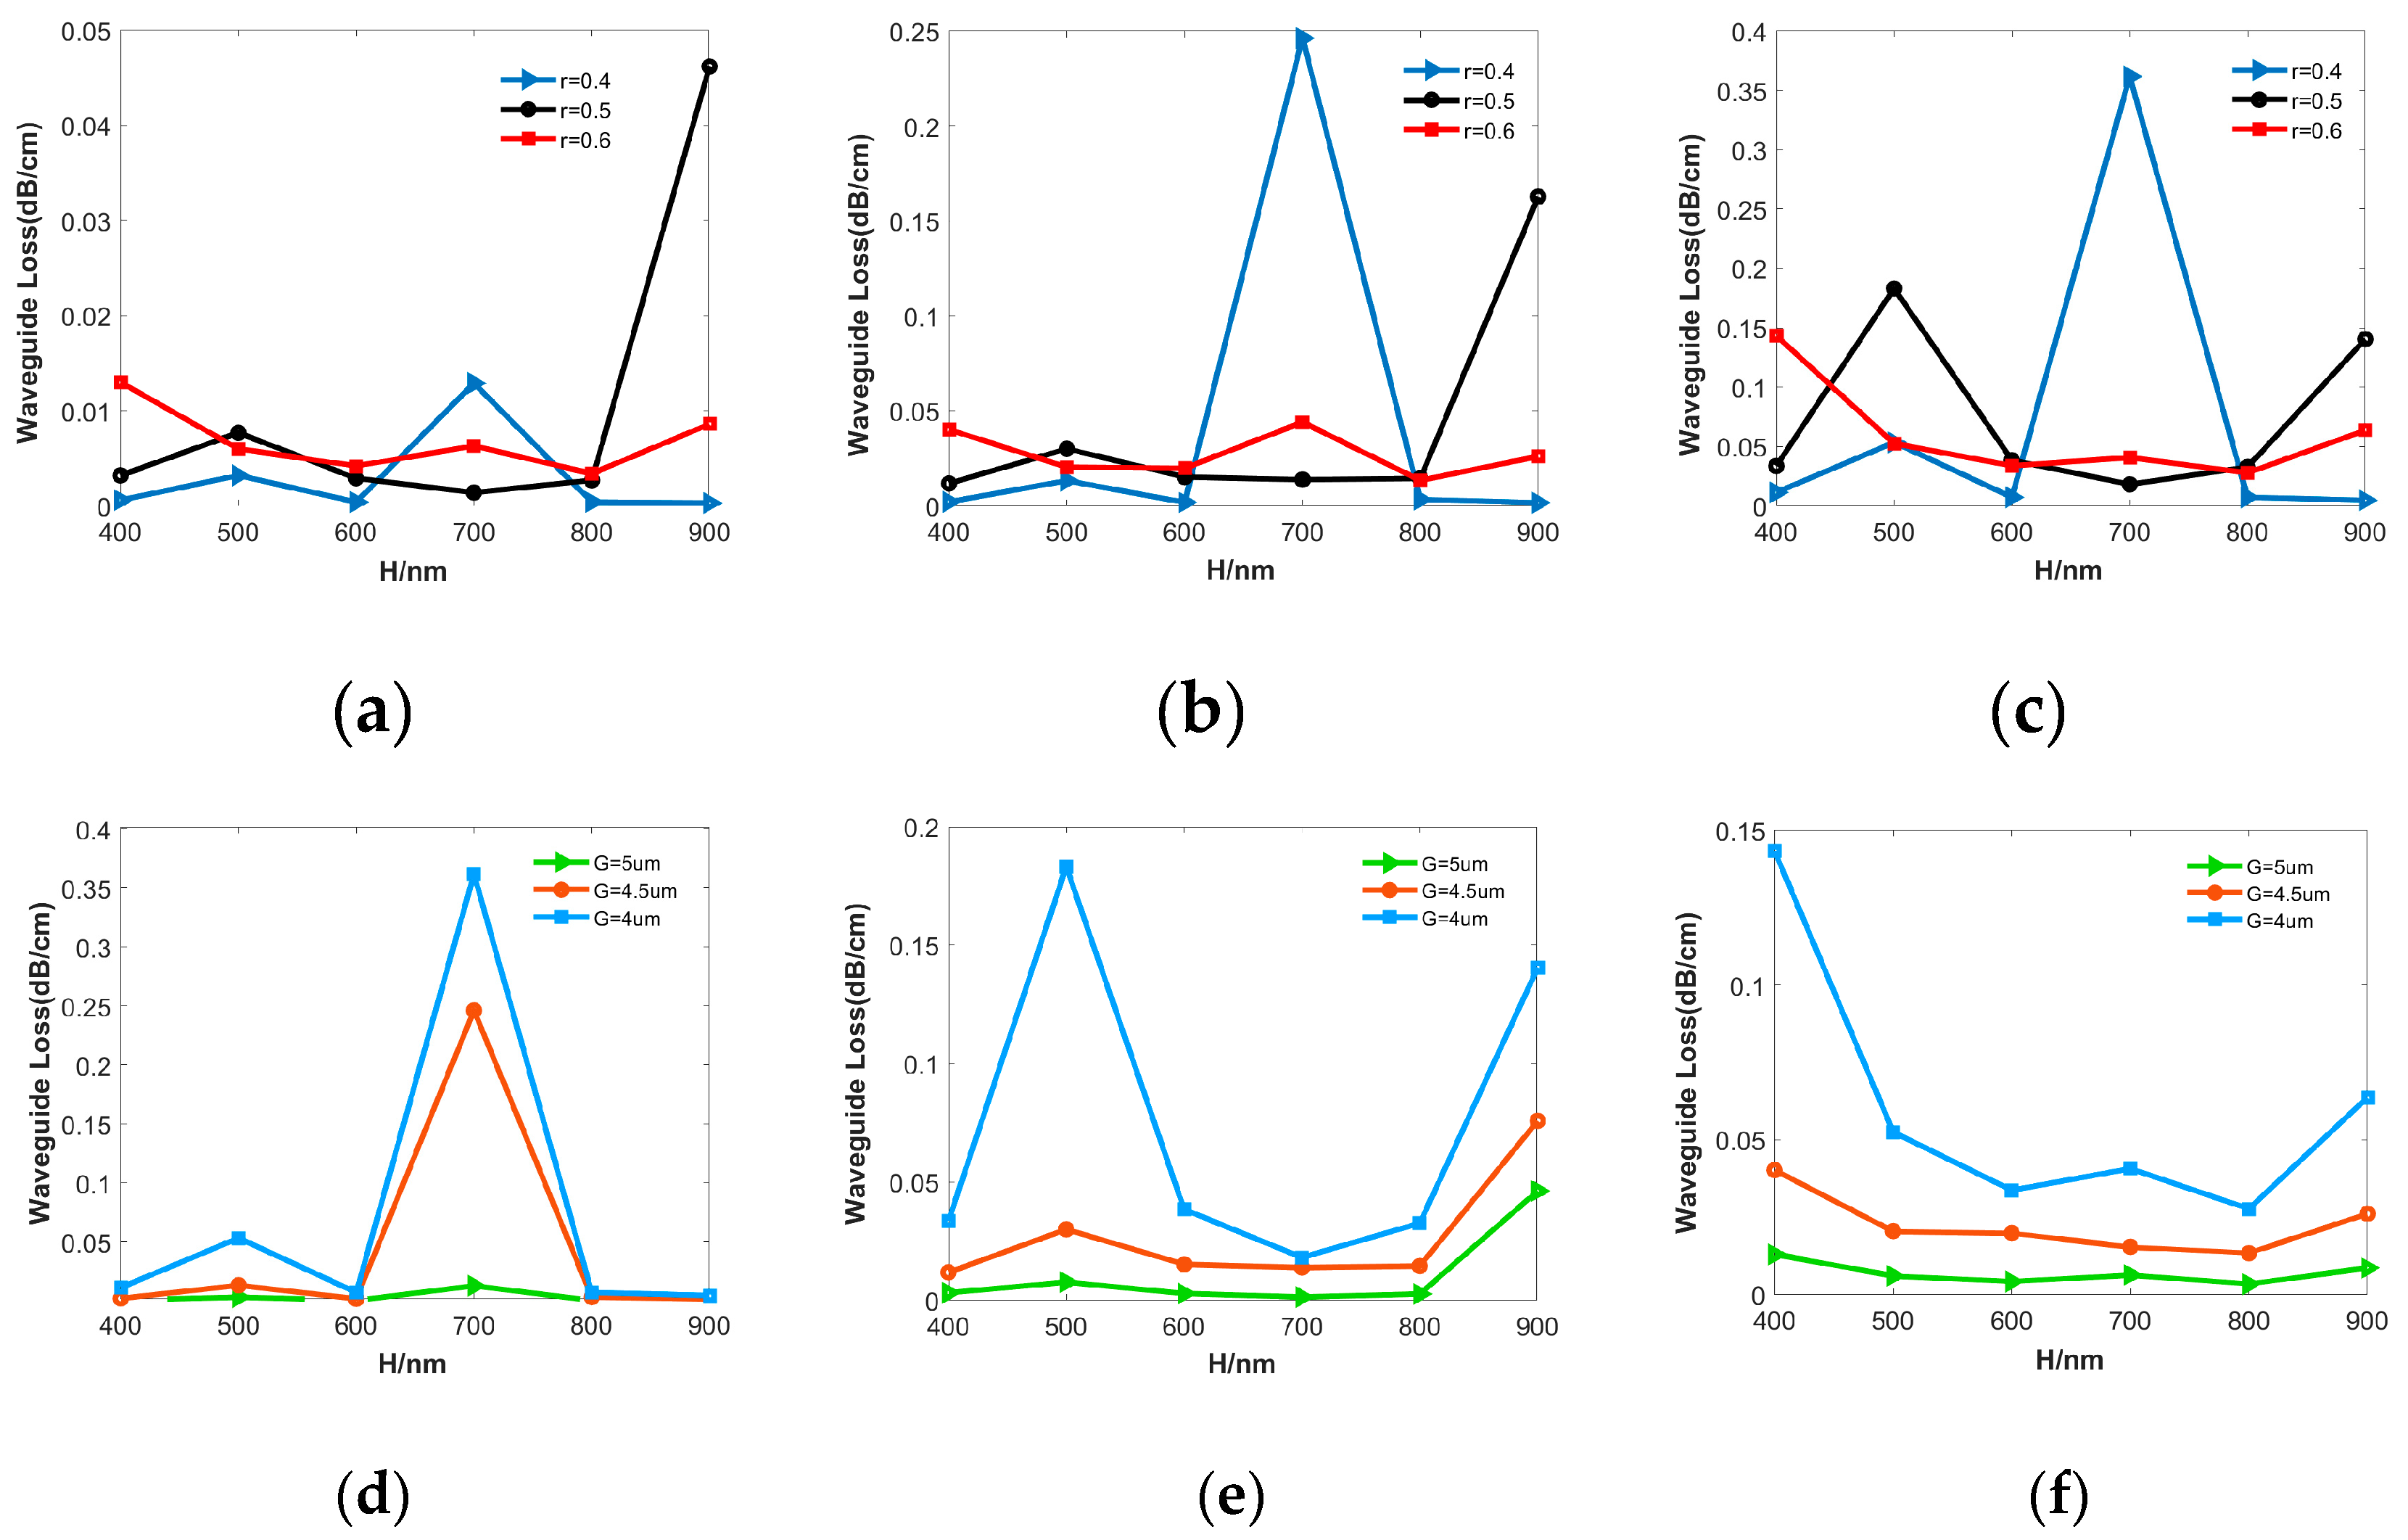
3.1.2. Trade-off between electrode spacing and waveguide losses
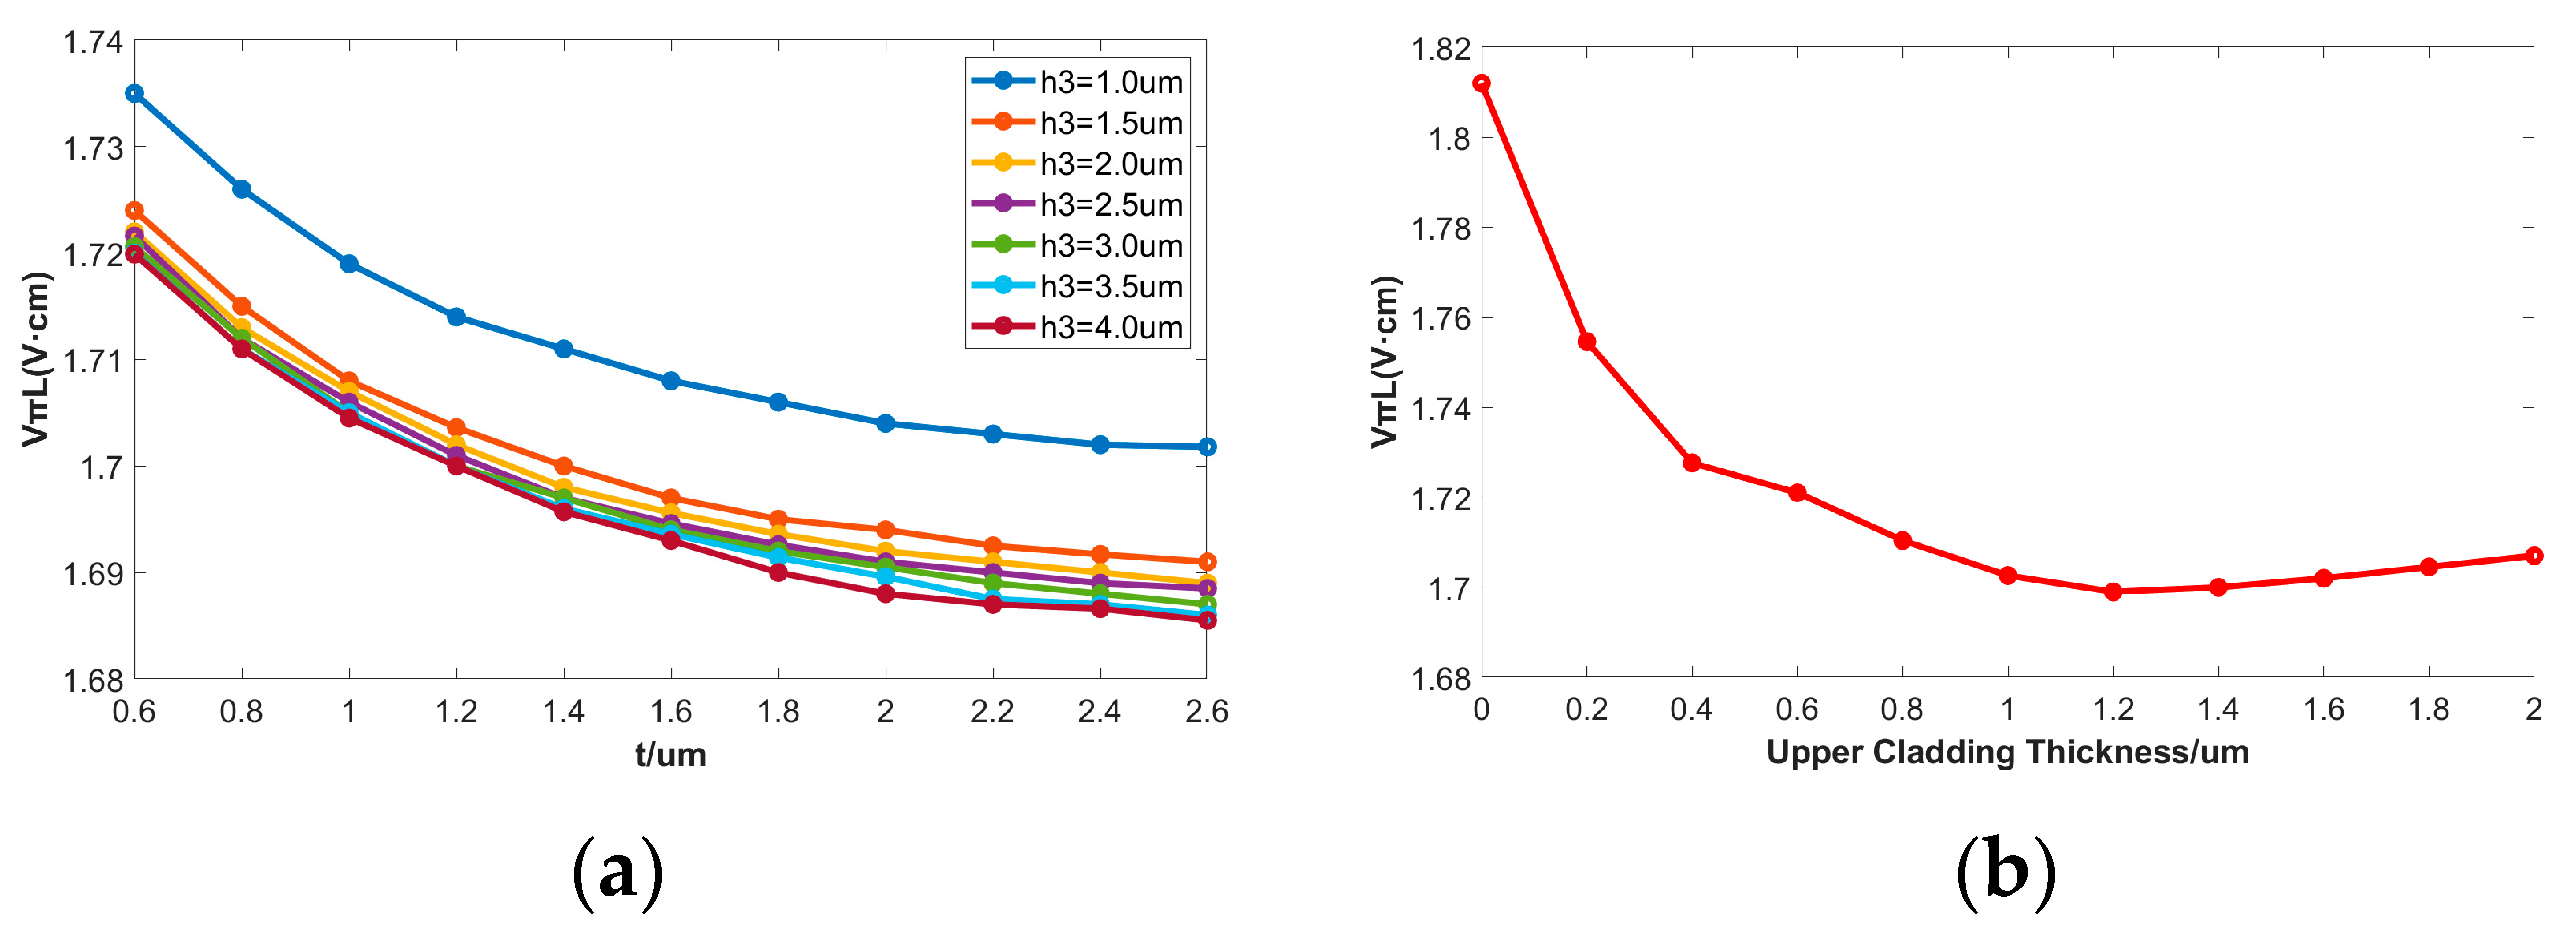
3.1.3. Analysis of cladding structure
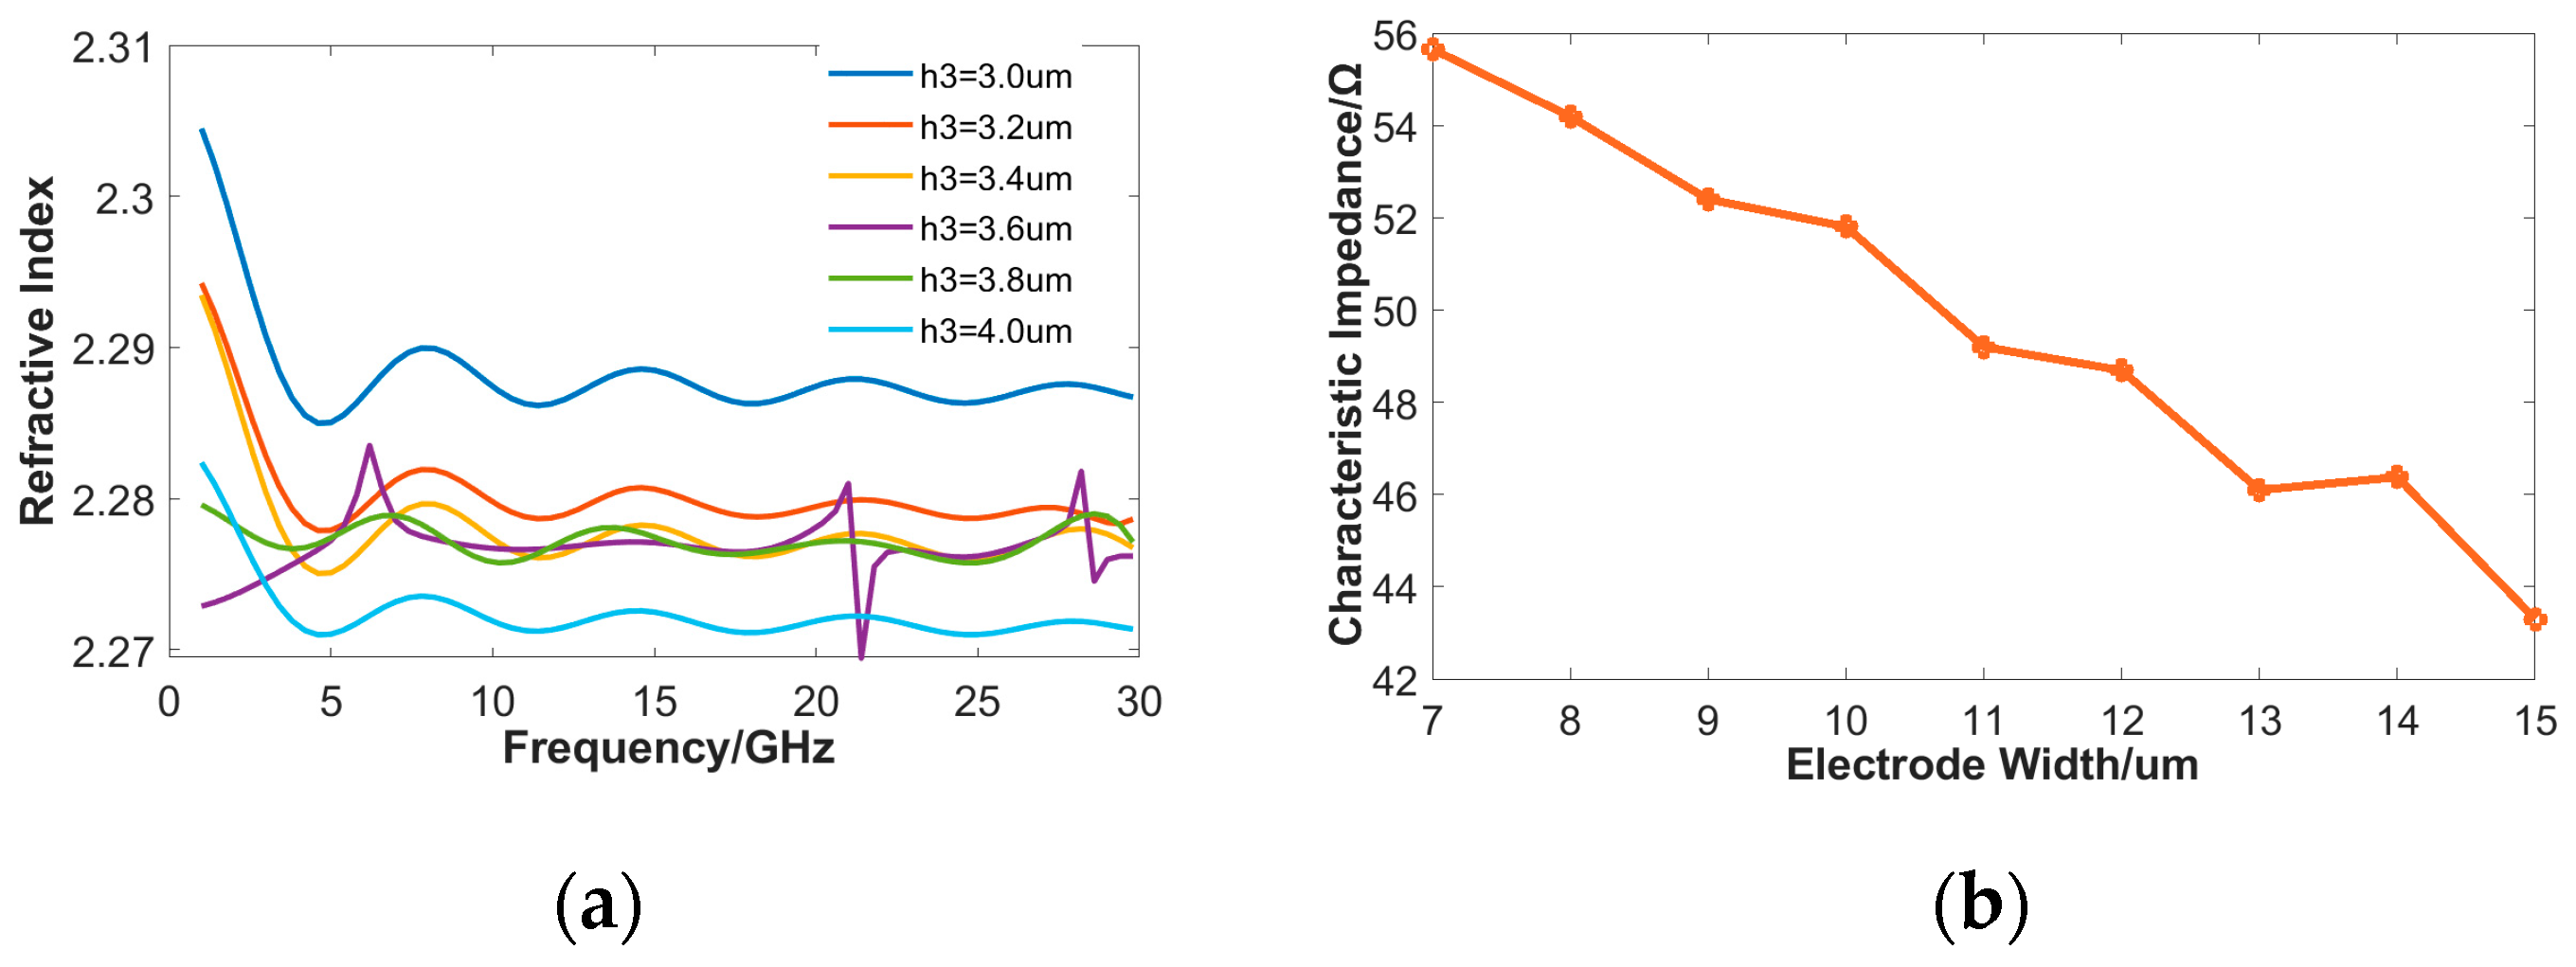
3.2. 3D microwave modeling and simulation of the modulation region
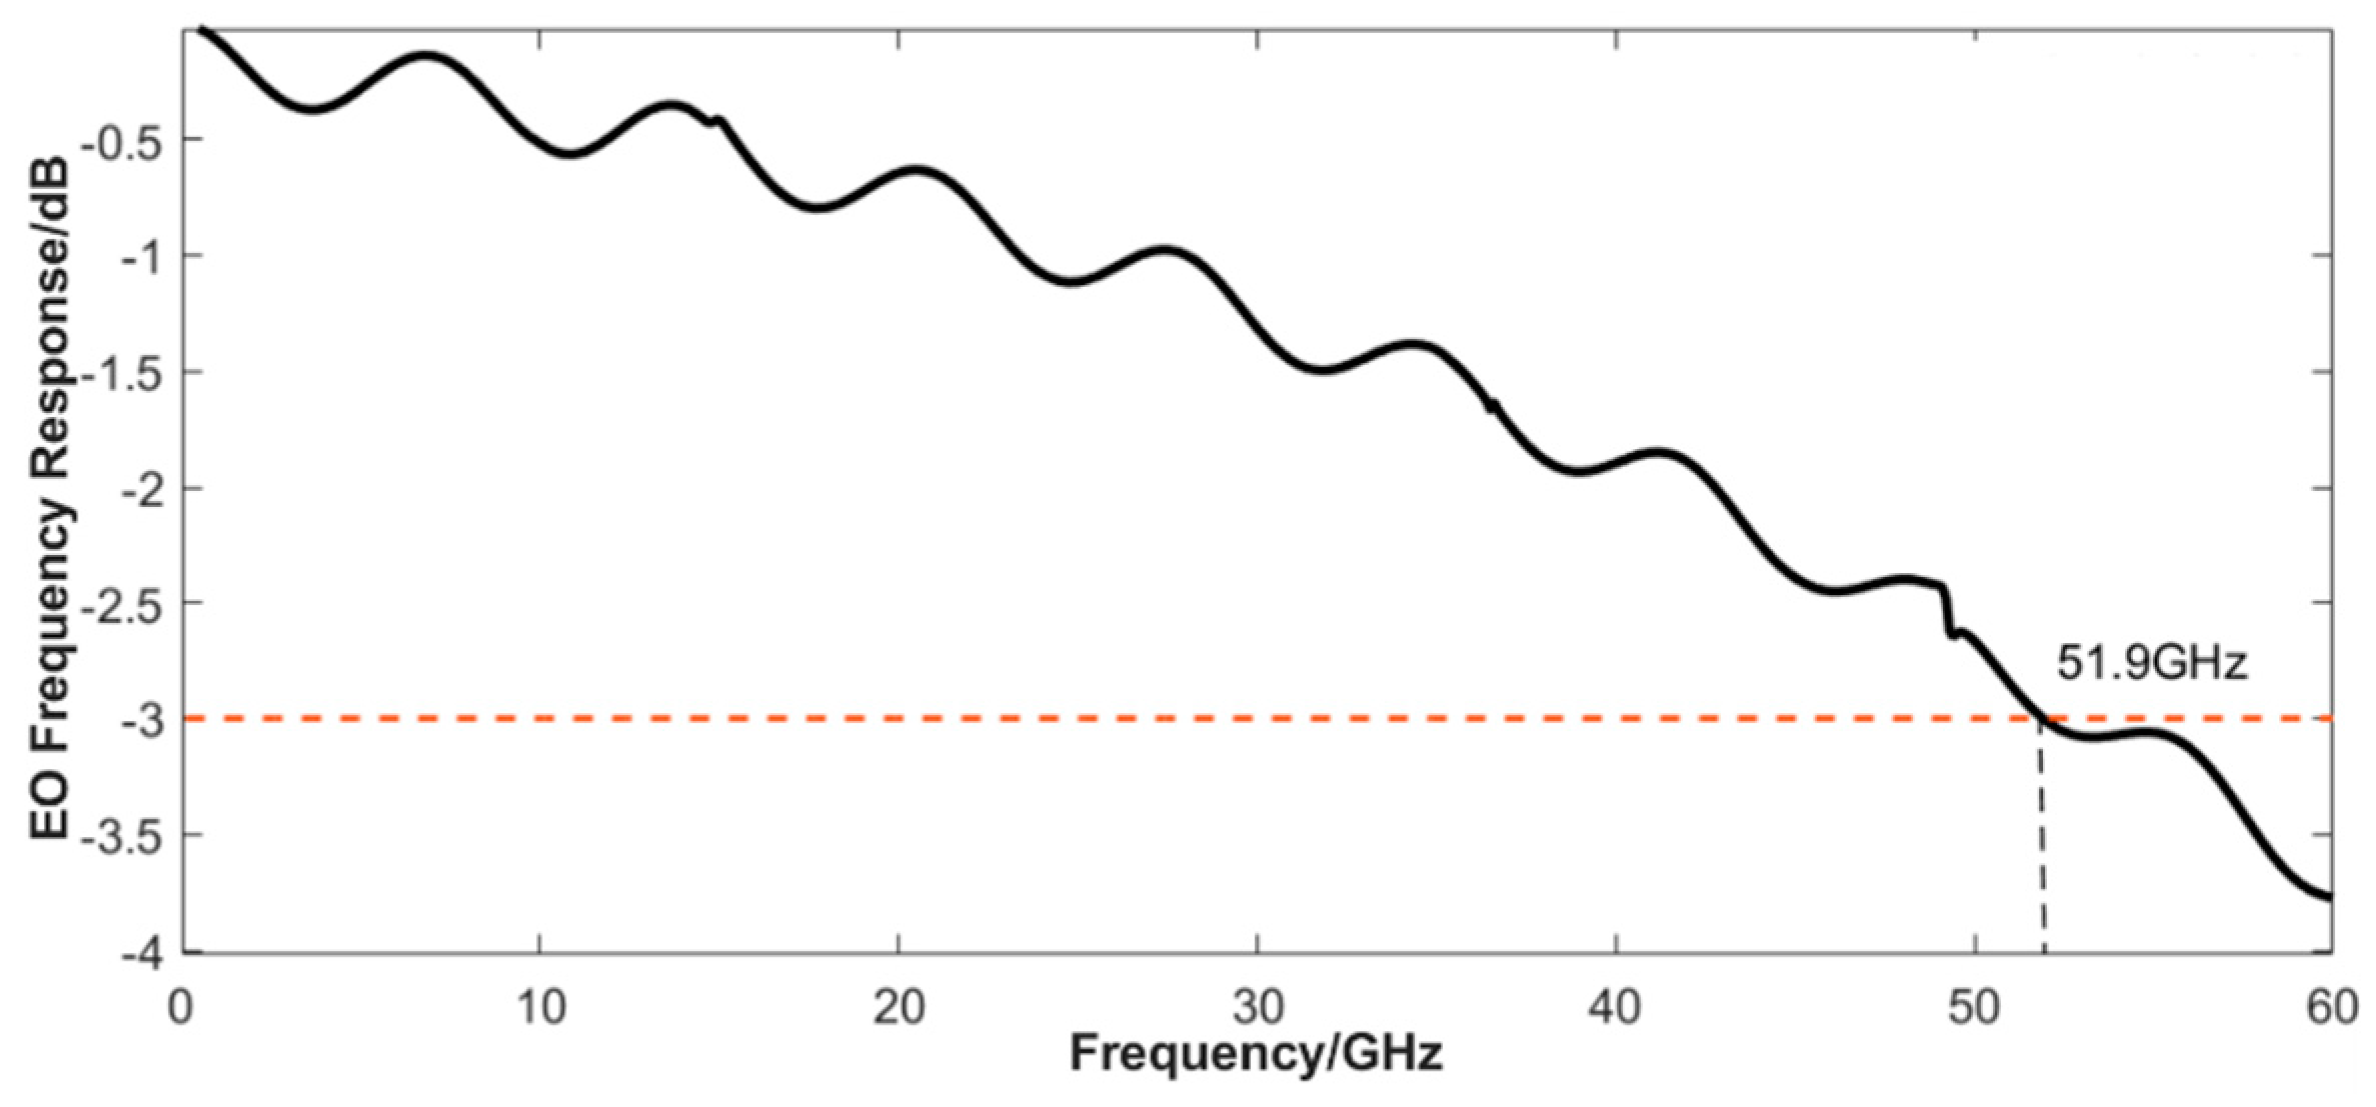
3.3. Comprehensive Structure Design Optimizaiton and Comparation
4. Conclusions
Author Contributions
Funding
Institutional Review Board Statement
Informed Consent Statement
Data Availability Statement
Conflicts of Interest
References
- Marpaung, D.; Yao, J.; Capmany, J. Integrated microwave photonics. Nat. Photon. 2019, 13, 80–90. [Google Scholar] [CrossRef]
- Yue, Y.; Wang, Q.; Anderson, J. Experimental investigation of 400 gb/s data center interconnect using unamplified high-baud-rate and high-order qam single-carrier signal. Appl. Sci. 2019, 9(12), 2455. [Google Scholar] [CrossRef]
- Zhu, D.; Shao, L.; Yu, M.; et al. Integrated photonics on thin-film lithium niobate. Adv. Opt. Photon. 2021, 13, 242–352. [Google Scholar] [CrossRef]
- Huang, X.; Liu, Y.; et al. Linearity-enhanced dual-parallel mach–zehnder modulators based on a thin-film lithium niobate platform. Photonics 2022, 9, 197. [Google Scholar] [CrossRef]
- Alloatti, L.; Palmer, R. ; Diebold, S; et al. 100 GHz silicon–organic hybrid modulator. Light Sci Appl. 2014, e173. [Google Scholar] [CrossRef]
- Liu, X.; Xiong, B.; Sun, C.; Wang, J.; et al. Sub-terahertz bandwidth capactively-loaded thin-film lithium niobate electro-optic modulators based on an undercut structure. Opt. Express 2021, 29, 41798. [Google Scholar] [CrossRef]
- Wu, Y. T.; Chiu; Lin, F. High-Speed (60 GHz) and Low-Voltage-Driving Electroabsorption Modulator Using Two-Consecutive-Steps Selective-Undercut-Wet-Etching Waveguide. IEEE Photon. Technol. Lett. 2008, 20, 1261. [Google Scholar] [CrossRef]
- Doi, M.; Sugiyama, M.; et al. Advanced LiNbO/sub 3/ optical modulators for broadband optical communications. IEEE J. Sel. Top. Quantum Electron 2006, 12, 745. [Google Scholar] [CrossRef]
- Khilo, A.; Sorace, C. M.; Kärtner, F. X. Broadband linearized silicon modulator. Opt. Express 2011, 19, 4485. [Google Scholar] [CrossRef]
- Li, E.; Wang, A. X. Theoretical Analysis of Energy Efficiency and Bandwidth Limit of Silicon Photonic Modulators. J. Lightwave Technol. 2019, 37, 5801. [Google Scholar] [CrossRef]
- Walker, R. G. High-speed III-V semiconductor intensity modulators. IEEE J. Quantum Electron 1991, 27, 654. [Google Scholar] [CrossRef]
- Bortz, M. L.; Fejer, M. M. Annealed proton-exchanged LiNbO3 waveguides. Opt. Lett. 1991, 16, 1844. [Google Scholar] [CrossRef] [PubMed]
- Weis, R. S.; Gaylord, T. K. Lithium niobate: summary of physical properties and crystal structure. Appl. Phys. A 1985, 37, 191–203. [Google Scholar] [CrossRef]
- Gaur, T.; Mishra, P.; Hegde, G.; Srinivas, T. Modeling and Analysis of Device Orientation, Analog and Digital Performance of Electrode Design for High Speed Electro-Optic Modulator. Photonics 2023, 10, 301. [Google Scholar] [CrossRef]
- Poberaj, G.; Hu, H.; et al. Lithium niobate on insulator (LNOI) for micro-photonic device. Laser Photon 2012, 6, 488. [Google Scholar] [CrossRef]
- Janner, D.; Tulli, D.; M. ; et al. Micro-structured integrated electro-optic LiNbO3 modulators. Laser Photon 2009, 3, 301. [Google Scholar] [CrossRef]
- Jin, M.; Chen, J.; Sua, Y.; et al. Efficient electro-optical modulation on thin-film lithium niobate. Opt. Lett. 2021, 46(18), 1884–1887. [Google Scholar] [CrossRef]
- Rabiei, P.; Steier, W. H. Lithium niobate ridge waveguides and modulators fabricated using smart guide. Appl. Phys. Lett. 2005, 86(16), 1–3. [Google Scholar] [CrossRef]
- Wang, C.; Zhang, M.; Stern, B.; et al. Nanophotonic lithium niobate electro-optic modulators. Opt. Express 2018, 26(2), 1547–1555. [Google Scholar] [CrossRef]
- Wang, C.; Zhang, M.; et al. Integrated lithium niobate electro-optic modulators operating at CMOS-compatible voltages. Nature 2018, 562(7725), 101–104. [Google Scholar] [CrossRef]
- Liu, Y.; Li, H.; Liu, J.; et al. Low Vπ thin-film lithium niobate modulator fabricated with photolithography. Opti. Express 2021, 29(5), 6320–6329. [Google Scholar] [CrossRef] [PubMed]
- Weigel, P. O. High-Speed Hybrid Silicon-Lithium Niobate Electro-Optic Modulators & Related Technologies. San Diego:UC San Diego, 2018.
- Chung, H.; William, S.C.; Alder, E. L.; et al. Modeling and optimization of traveling-wave LiNbO3 interferometric modulators. IEEE J. Sel. Top. Quantum Electron 1991, 27(3), 608–617. [Google Scholar] [CrossRef]
- Honardoost, A.; Safian, R.; Rao, A.; et al. High-Speed Modeling of Ultracompact Electrooptic Modulators. J. Lightwave Technol 2018, 36, 5893–5902. [Google Scholar] [CrossRef]
- Tian, X.D. Research on Low Loss and Low Half Wave Voltage PLZT Thin Film Modulator. Diploma thesis, Southeast University, Nanjing China, 2020.
- Dai, D.; Sheng, Z. Numerical analysis of silicon-on-insulator ridge nanowires by using a full-vectorial finite-difference method mode solver. J. Opt. Soc. Am. B. 2007, 24, 2853–2859. [Google Scholar] [CrossRef]
- Soref, R.A.; Schmidtchen, J.; Peterman, K. Large single-mode rib waveguides in GeSi-Si and Si-on-SiO2. IEEE J. Sel. Top. Quantum Electron 1991, 27, 1971–1974. [Google Scholar] [CrossRef]
- Westphal, W. B.; Sils, A. Dielectric Constant and Loss Data. In Ohio:Technical Report AFML-TR-72-39; 1972. [Google Scholar]
- Krupka, J.; Kaminski, P.; Kozlowski, R. Dielectric properties of semi-insulating silicon at microwave frequencies. Appl. Phys. Lett. 2015, 107, 082105. [Google Scholar] [CrossRef]
- Lee, M. Dielectric constant and loss tangent in LiNbO3 crystals from 90 to 147 GHz. Appl. Phys. Lett. 2001, 79, 1342–1344. [Google Scholar] [CrossRef]
- Han, H.; Xiang, B. Integrated Electro-Optic Modulators in x-Cut Lithium Niobate Thin Film. Optik. 2020, 212, 164691. [Google Scholar] [CrossRef]
- Yang, D.; Chen, Y.; Wang, Y.; Xiang, M.; Chen, Z.; Liu, P.; Lan, T. Collaborative Simulation and Optimal Design of LiNbO3 Thin Film Modulator. Journal of Beijing University of Technology. 2021, 47, 565–572. [Google Scholar]
- Li, X.W. Research on Thin Film Lithium niobate Electro optic Modulator Based on Slit Waveguide. Diploma thesis, Jiangnan University, Wuxi China, 2022. [Google Scholar]


| H/um | 0.4 | 0.5 | 0.6 | 0.7 | 0.8 | 0.9 |
|---|---|---|---|---|---|---|
| r/um | ||||||
| r=0.4 | 0.98 | 0.93 | 0.95 | 0.98 | 1.03 | 1.08 |
| r=0.5 | 0.86 | 0.98 | 1.06 | 1.11 | 1.17 | 1.23 |
| r=0.6 | 1.03 | 1.04 | 1.02 | 0.96 | 1.32 | 1.40 |
| G/um | H/nm | r | VπL(V·cm) | waveguide loss (dB/cm) |
|---|---|---|---|---|
| 4 | 800 | 0.6 | 1.49 | 0.028 |
| 4 | 700 | 0.5 | 1.664 | 0.018 |
| 4.5 | 800 | 0.6 | 1.682 | 0.013 |
| 5 | 800 | 0.6 | 1.876 | 0.003 |
| 5[20] | 600 | 0.5 | 2.15 | 0.028 |
| H/um | impedance/Ω | refractive index | VπL(V·cm) |
|---|---|---|---|
| 2 | 47.9 | 2.197 | 1.687 |
| 1.9 | 49 | 2.2 | 1.688 |
| 1.8 | 49.3 | 2.19 | 1.689 |
| Parameter | Value/um | Parameter | Value/um |
|---|---|---|---|
| w | 1.2 | G | 4.4 |
| h1 | 0.35 | ws | 10 |
| h2 | 0.45 | wg | 17 |
| h3 | 4 | L | 1×10⁴ |
| h0 | 2.1 | r | 9×10³ |
| h4 | 410 | Gcp | 1.5 |
| t | 1.8 | Lcp | 255 |
Disclaimer/Publisher’s Note: The statements, opinions and data contained in all publications are solely those of the individual author(s) and contributor(s) and not of MDPI and/or the editor(s). MDPI and/or the editor(s) disclaim responsibility for any injury to people or property resulting from any ideas, methods, instructions or products referred to in the content. |
© 2023 by the authors. Licensee MDPI, Basel, Switzerland. This article is an open access article distributed under the terms and conditions of the Creative Commons Attribution (CC BY) license (https://creativecommons.org/licenses/by/4.0/).


