1. Introduction
Non-alcoholic fatty liver disease (NAFLD) is metabolic dysfunction that exerts its influence on approximately one-quarter of the global populace, thereby emerging as a significant worldwide health concern [
1,
2]. It is distinguished by the occurrence of fat formation within the liver without alcohol intake. The spectrum of these conditions encompasses a range from uncomplicated hepatic steatosis to non-alcoholic steatohepatitis (NASH), which represents an advanced manifestation of the disease distinguished by inflammatory and fibrotic changes within the liver. NASH has the potential to evolve into long-term liver conditions, encompassing compensated cirrhosis, decompensated cirrhosis, and uncorrectable hepatocellular carcinoma. [
1,
3]. Moreover, NASH exhibits a strong correlation with metabolic disorders, including obesity, dyslipidemia, insulin resistance, and chronic kidney dysfunction. [
4,
5,
6,
7,
8,
9]. Despite the urgent need for effective NAFLD treatments, there currently exist no approved pharmaceutical agents that specifically target this disorder. In recent years, various therapeutic agents, including pharmacological agents and natural compounds, have been assessed for their effectiveness in managing of NAFLD.
Several pharmacological agents, such as pioglitazone, vitamin E, and obeticholic acid, have exhibited encouraging outcomes undergoing clinical trials for the therapeutic intervention of NAFLD [
10]. Pioglitazone, a thiazolidinedione, is an insulin sensitizer that has been documented efficacy in enhancing hepatic steatosis, lipid metabolism, and insulin resistance among individuals diagnosed with NAFLD. [
11]. Vitamin E, a potent agent of antioxidant, has demonstrated its effectiveness in enhancing liver biochemical and histological parameters of the liver in patients with NASH [
12]. Furthermore, obeticholic acid, a farnesoid X receptor agonist, has been reported to significantly enhance fibrotic liver lesions among individuals diagnosed with NASH [
13]. However, these medicinal agents are subject to limitations, including potential adverse effects and an absence of extensive, long-term safety documentation.
It is crucial to develop a NASH treatment with minimal side effects that targets both inflammation and oxidative stress, as these factors are closely related to the progression and recurrence of the disease [
14]. An overabundance of fat buildup within the liver can trigger an inflammatory reaction within Kupffer cells, inducing the expulsion of proinflammatory cytokines and activation of the immune system [
15]. The ensuing inflammatory response may further amplify the production of reactive oxygen species (ROS), leading to a vicious cycle of inflammation and oxidative stress that can ultimately advance to more severe forms of NASH [
16]. Therefore, natural compounds with anti-inflammatory and antioxidant properties are particularly promising for preventing and managing of NASH.
Agrimonia pilosa (
A. pilosa), also known as hairy agrimony or Chinese agrimony, is a perennial herbaceous plant classified within the Rosaceae family.
A. pilosa is native to Asia, including China, Korea, Japan, and Vietnam, and is commonly found growing on grassy slopes, in meadows, and in forests.
A. pilosa has been used in traditional remedy for centuries as a treatment for various conditions such as fever, diarrhea, dysentery, liver and gallbladder disorders, and inflammatory diseases. The phytochemicals in
A. pilosa include triterpenoids, phenolic acids, tannins, and flavonoids, which exhibit antioxidant and anti-inflammatory effects [
17,
18]. Recent scientific research has focused on investigating the potential of
A. pilosa as a natural remedy for several diseases. Several studies have demonstrated that
A. pilosa extract (APE) has anti-inflammatory properties in lipopolysaccharide-stimulated macrophages and alleviates the release of proinflammatory cytokines in a mouse model of croton oil-induced ear edema [
19,
20]. Another study showed that APE can ameliorate hyperglycemia and hepatic steatosis provoked by a lack of estrogen in a mouse model simulating postmenopausal metabolic syndrome [
21]. However, the potential of
A. pilosa in the treatment of NASH is not well understood.
In this study, we examined the therapeutic effects of A. pilosa on cellular hepatic steatosis in HepG2 cells exposed to free fatty acids (FFAs), and its potential in mitigating the development of NAFLD/NASH in a CDAHFD diet-induced NASH mouse model. Our findings offer valuable insights into the potential use of A. pilosa as a therapeutic agent for NAFLD/NASH, highlighting the importance of regulating hepatic immune responses and oxidative stress as key elements in the treatment of these diseases.
2. Materials and Methods
2.1. Preparation of Agrimonia pilosa Extract
Agrimonia pilosa extract (APE) was provided from BTC Corporation (Sangnok-gu, Ansan, Korea). The dried leaves of A. pilosa was extracted with 50% ethanol (Ducksan, Ansan, Republic of Korea) at 80℃ for 2 h twice. The first and second extracts were acquired after filtering, separately. The supernatants of two extractions were blended well. The complete extract was concentrated through vacuum evaporation and dehydrated to produce APE.
2.2. High-Performance Liquid Chromatography (HPLC) Analysis
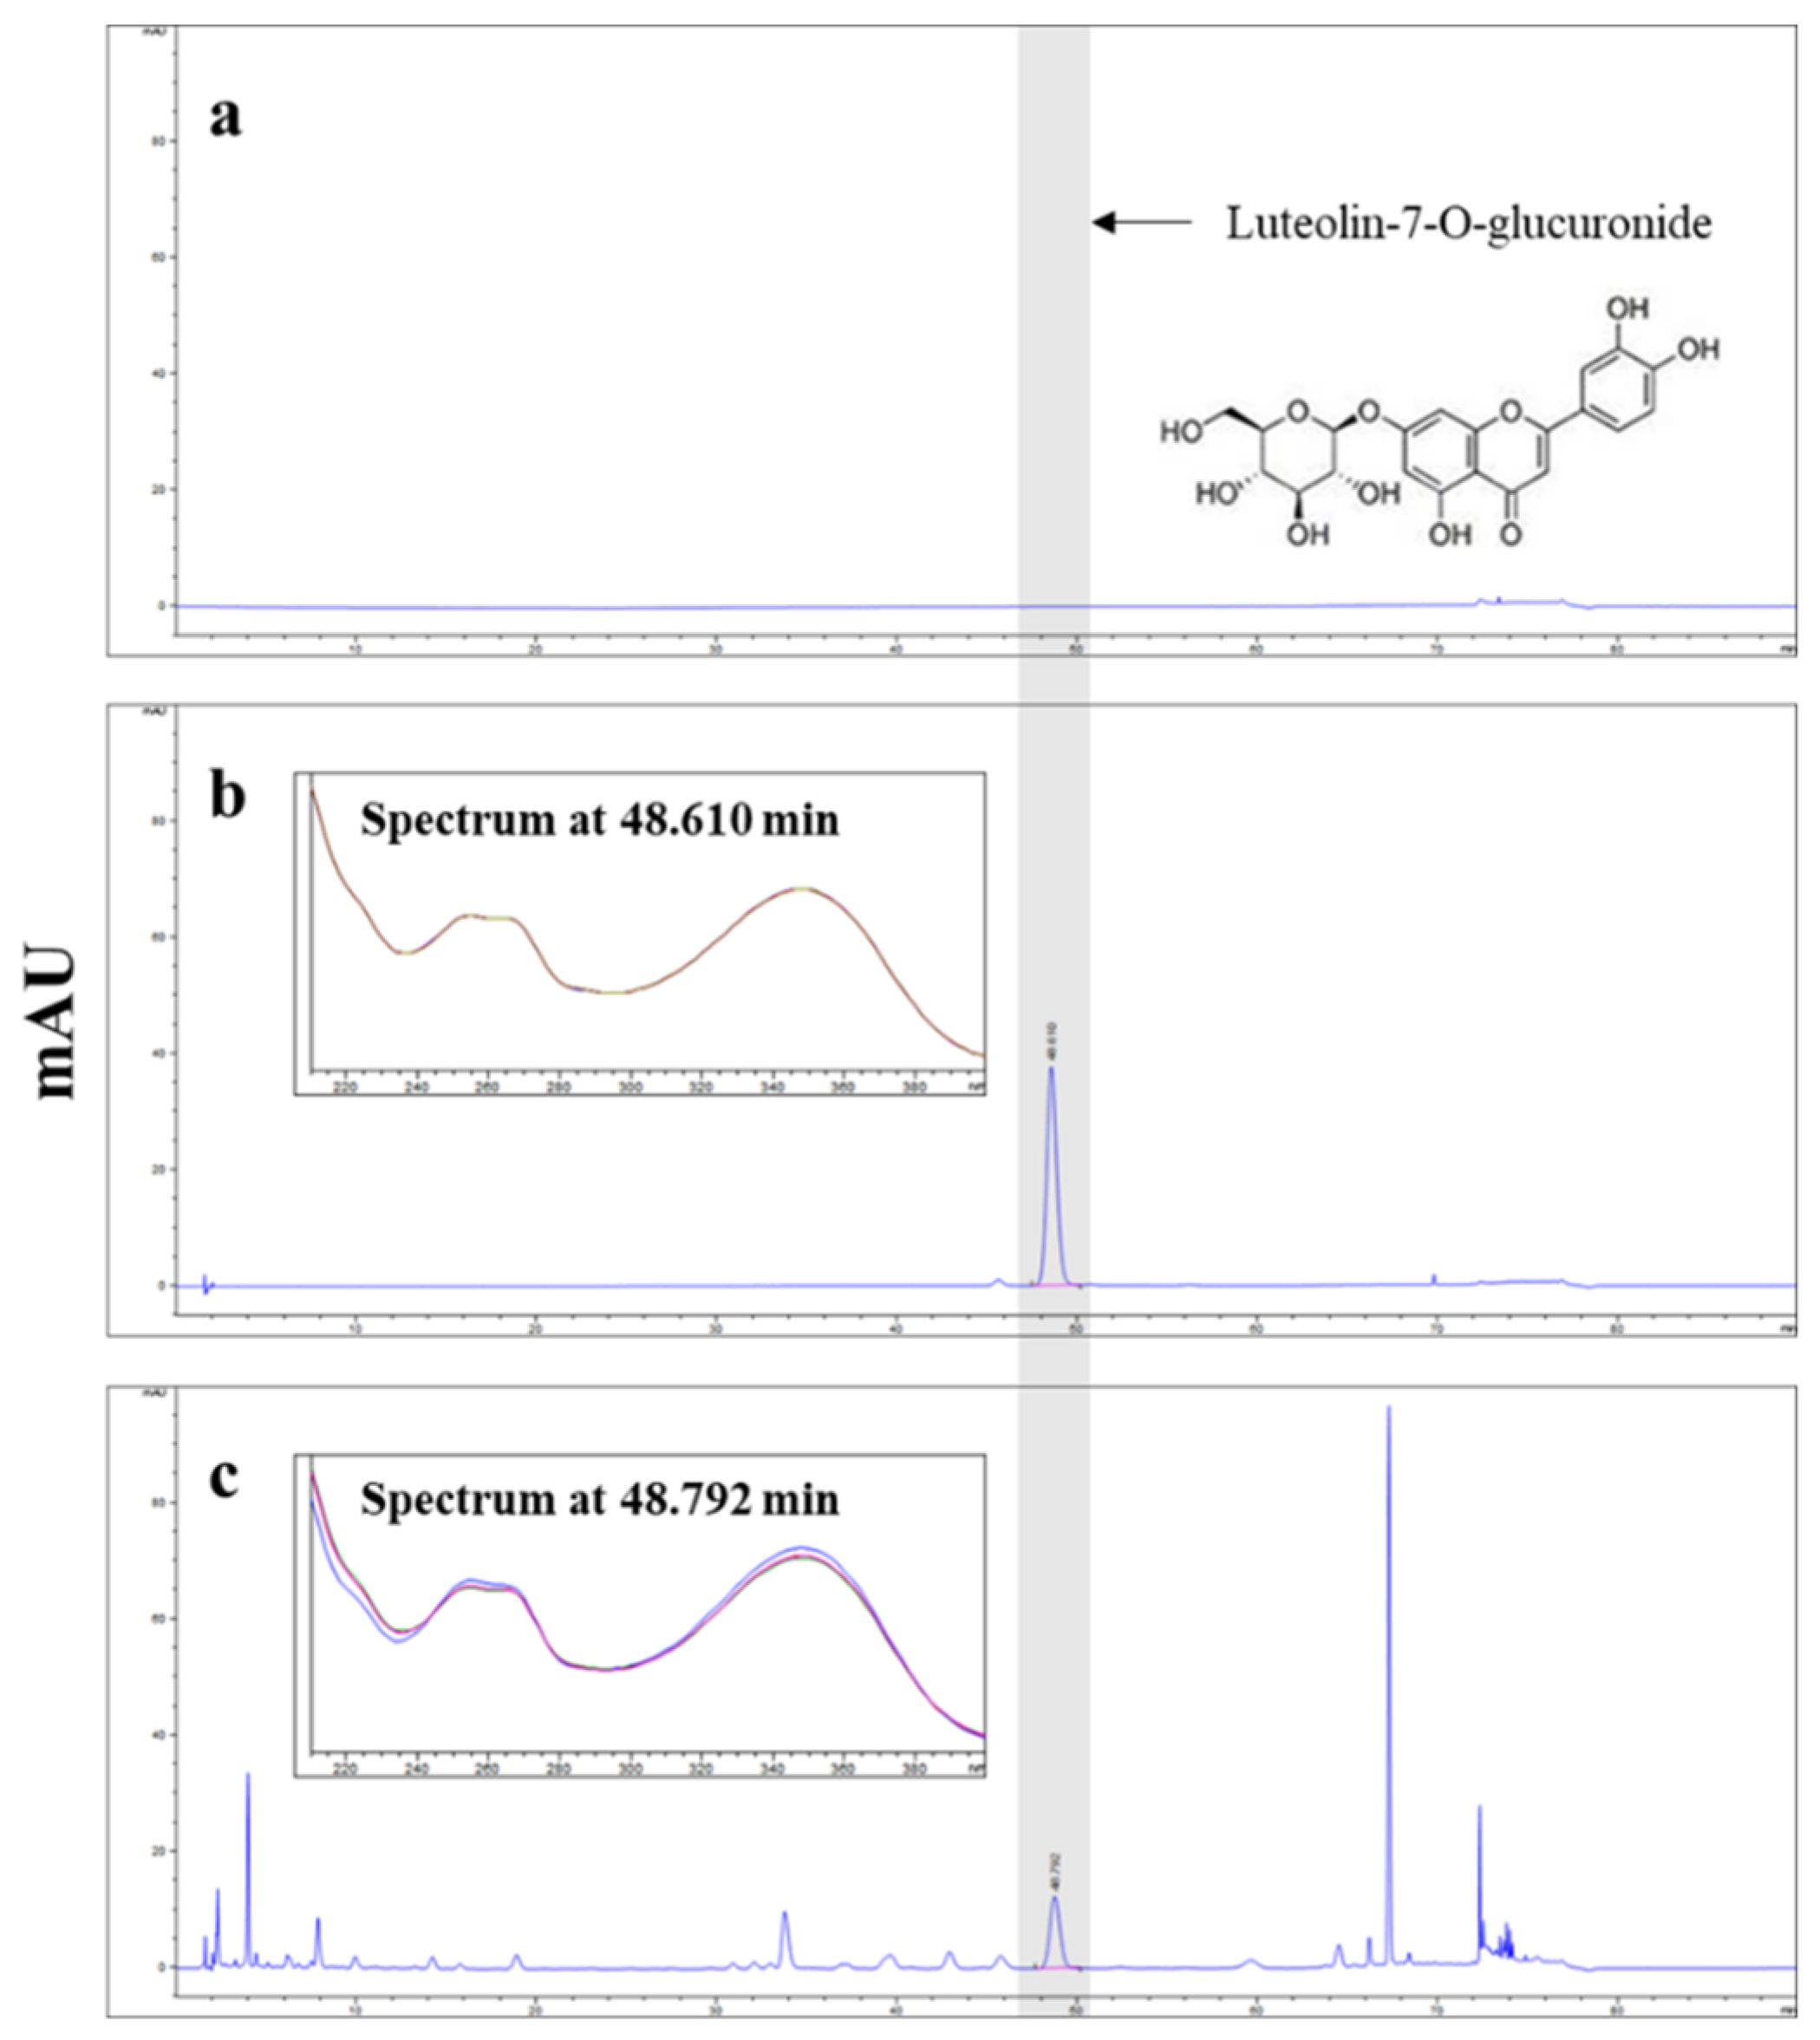
The concentration of luteolin-7-O-glucuronide in APE was determined by HPLC using an Agilent Infinity 1260 series system with a diode array detector (Agilent Technologies, Palo Alto, CA, USA). The separation was conducted at 30℃ using a X Select HSS C18 column (4.6 X 250 mm, 5 μm, Waters, Milford, MA, USA). The mobile phase composition was as follows: A, 0.1% phosphoric acid in distilled water; B, Acetonitrile. The gradient elution conditions were as follows; 0-20 min, 10% B; 20-35 min, 10%-12% B; 35-60 min, 12%-12% B; 60-70 min, 12%-30% B; 70-72 min, 30%-80% B; 72-75 min, 80%-80% B; 75-76 min, 80%-10% B; 76-90 min, 10%-10% B. The flow rate was 1.6 mL/min, and the injection volume was 5 μL. The chromatograms were obtained at 350 nm. APE was standardized to obtain at least 0.55% luteolin-7-O-glucuronide (
Figure 1).
2.3. Cell Culture
The human liver carcinoma cell line HepG2 cells were sourced from American Type Culture Collection (ATCC, Rockville, MD, USA). The cells were cultured in Minimum Essential Medium with Earle’s Balanced Salts Medium (MEM/EBSS) (Hyclone, South Logan, UT, USA) with 10% fetal bovine serum (FBS), 100 U/mL penicillin, and 100 U/mL streptomycin (Gibco, MA, USA) in a CO2 incubator containing 5% CO2 at 37℃. All the experiments were conducted when the cells reached 80% confluence.
2.4. Preparation of Stock solution of Fatty acids
To prepare the FFA-BSA conjugate, we conjugated palmitic acid (PA) and oleic acid (OA) with fatty acid-free bovine serum albumin (BSA) according to protocol described below. We dissolved 0.0641 g PA and 79 μL OA in 2.5 mL 100% ethanol (Sigma-Aldrich, St. Louis, MO, USA) to acquire a FFA concentration of 100 mM FFA stock solution. Then, we conjugated these solutions with 20% fatty acid-free BSA in PBS at 70℃ for 1 h to obtain an ultimate FFA stock solution (10 mM). All stock solutions were stored at -20℃.
2.5. Cell Viability Assay
Cell viability was evaluated using the Cell Counting Kit-8 (CCK-8) (Dojindo Molecular Technologies, Japan). Briefly, HepG2 cells were initially seeded at a density of 1 × 10⁵ cells/well in 96-well plates (SPL Life Science, South Korea) and incubated overnight at 37℃ for attachment. Subsequently, various concentrations of APE (ranging from 0 to 400 μg/mL) or 0.125 mM FFA in combination with varying APE concentrations were administered to the cells for 24 h. The cells were treated with 10 μL of CCK-8 solution per well and incubated for 2 h in a CO2 incubator. The absorbance of each well was then quantified at 450 nm using a microplate reader (Bio-Tek Instruments, Winooski, VT, USA).
2.6. Oil-Red O Staining
To visualize the accumulation of lipid droplets in HepG2 cells, the cells were initially seeded at a density of 2.5 × 10⁵ cells/well in 12-well plates and incubated overnight. Subsequently, the cells were pre-treated with APE at the indicated concentrations for 2 h, followed by exposure to 0.125 mM FFA for 24 h. Cells were then fixed using 4% paraformaldehyde (PFA) at room temperature for 30 min. Following fixation, cells were subjected to a rinse with 60% isopropanol, followed by staining utilizing a diluted Oil-Red O working solution for 10 min. Lipid droplets were visualized on an inverted microscope. For quantification of the lipid droplets, they were extracted with isopropanol and their absorbance was subsequently determined at 500 nm.
2.7. Triglyceride (TG) Assay
TG levels were determined using TG Quantification Kit (MAK266, Sigma-Aldrich, St. Louis, MO, USA). Briefly, HepG2 cells were initially seeded at a density of 5 × 10⁵ cells/well in 6-well plates and incubated overnight. Subsequently, the cells received a pre-treatment with APE at concentrations as indicated for 2 h, followed by exposure to 0.125 mM FFA for 24 h. After treatment, cells were lysed in 200 μL of Triglyceride Regent. The lysates were centrifuged at 10,000 × g for 10 min at 4℃, resulting in the collection of supernatants utilized for TG quantification. The supernatants of 10 μL were mixed with 50 μL of the Master Reaction Mix to each well, and incubated at 37℃ for 30 min. The absorbance of each well was then quantified at 570 nm using a microplate reader. TG levels were calculated based on a standard curve generated with Triglyceride standards.
2.8. Animals and Experimental Protocols
Male C57BL/6J mice (6-week-old) were purchased from Joongang Experimental Animal Co. (Seoul, South Korea). The animals were accommodated in separate, ventilated cages within a controlled laboratory environment (22-24℃, 40%-50% humidity) with a 12 h light/dark cycle. Following a 1 week period of acclimation, the mice were randomly distributed to seven groups (n = 8 mice in each group) as follows: Group 1, Control: Mice were fed with a normal diet (Teklad 2018S, Envigo, Madison, WI, USA); Group 2, NASH: fed with a CDAHFD (A06071302, Research Diets Inc., New Brunswick, NJ, USA); Groups 3, 4, and 5, APE 25, 50, and 100: fed a CDAHFD with oral administration of APE (25, 50, and 100 mg/kg per day); Group 6, Sily: fed a CDAHFD with oral administration of silymarin (100 mg/kg per day); Group 7, Lute: fed a CDAHFD with oral administration of luteolin-7-O-glucuronide (luteolin) (20 mg/kg per day) for 12 weeks. At the end of the 12-week experimental period, mice were anesthetized using the isoflurane, liver samples and blood from the portocaval vein were collected and stored at -75℃ until further analysis. All animal experiments were approved by the Kyungpook National University Institutional Animal Care and Use Committee (authorization no. KNU- 2021-0224).
2.9. Measurement of Biochemical Markers
To evaluate liver function and detect liver damage, the blood samples were obtained and centrifuged at 8,000 rpm for 30 min at 4℃ to isolate the serum. The serum levels of aspartate transaminase (AST), and alanine transaminase (ALT) were analyzed using a Fuji DRI-CHEM NX500i plasma biochemistry analyzer (Fujifilm Corporation, Tokyo, Japan).
2.10. Histological Analysis
The liver tissues were preserved in 10% neutral buffered formalin and then embedded in paraffin. The paraffin embedded liver samples were cut at a thickness of 3 μm, and then stained with hematoxylin and eosin (H&E), or Sirius Red to assess fibrosis using standard procedures. For H&E staining, the sections were first deparaffinized with xylene and gradually rehydrated using a series of alcohol solutions with varying concentrations. Subsequently, they were treated with hematoxylin for 4 minutes, and counterstained with eosin for 3 minutes. Afterward, the sections were subjected to dehydration using graded alcohols, clearing in xylene, and finally mounted with Canada balsam (Sigma-Aldrich, St. Louis, MO, USA). For Sirius Red staining, the sections were first deparaffinized with xylene and gradually rehydrated using a series of alcohol solutions with varying concentrations, and rinsed with distilled water. They were then exposed to a solution of 0.1% Sirius Red (Direct Red 80; Sigma-Aldrich, St. Louis, MO, USA) in saturated picric acid at room temperature for 1 h. The sections were subsequently rinsed twice in acidified water, dehydrated through graded alcohols, cleared in xylene, and mounted with Canada balsam. The microscopic examination of these liver sections was conducted using a Nikon ECLIPS 80i microscope. To quantify fibrosis, the areas of Sirius Red-stained regions were quantified in random 10x magnification fields of Sirius Red-stained sections using ImageJ software.
2.11. Immunohistochemical Staining (IHC)
Immunohistochemistry was carried out to analyze the expression of inflammation and fibrosis-related proteins in the liver tissue. Paraffin-embedded liver tissues were deparaffinized, and rehydrated using a series of alcohol solutions with varying concentrations, and rinsed with distilled water. The sections underwent incubation with a 3% hydrogen peroxide (H2O2) solution in methanol for a duration of 10 min. Antigen retrieval was facilitated by subjecting the sections to citrate buffer within a pressure cooker at 110℃ for 5 min. The sections were then performed with Histostatin Plus Broad Spectrum (Invitrogen, California, USA). The primary antibodies were used F4/80, Collagen Ⅰ (COLⅠ), Collagen Ⅴ (COLⅤ) (Abcam, Cambridge, UK). The sections were subjected to an overnight incubation with these primary antibodies at a temperature of 4℃. Following a thorough rinse with PBS, the sections were incubated with secondary antibody for 30 min. Then, the sections underwent an incubation step with streptavidin peroxidase conjugate solution lasting for 30 min. Finally, the sections were subjected to diaminobenzidine (DAB) substrate for 5 min and were counterstained briefly with hematoxylin for 10 s. After dehydration in graded alcohols and clearing in xylene, the sections were mounted with Canada balsam. Images were observed under a Nikon ECLIPS 80i microscope.
2.12. Real-time Polymerase Chain Reaction
Liver samples were homogenized using a FastPrep-24
TM 5G Homogenizer (MP biomedicals, Solon, OH, USA) and total RNA was extracted from the HepG2 cells and liver samples using TRIzol reagent (Life Technologies, Grand Island, NY) following the manufacturer’s protocol. For the reverse transcription process, 2.5 μg of total RNA was converted into cDNA using SuperiorScript Ⅲ RT Master Mix (Enzynomics, South Korea), incubating at 25℃ for 10 min, and 42℃ for 60 min, and 85℃ for 5 min. Real-time polymerase chain reaction (Real-time PCR) was conducted using TOPreal
TM qPCR 2X PreMIX (SYBR Green with low ROX) (Enzynomics, South Korea) on a qTOWER
3G instrument (Analytik Jena, Germany). The thermal cycling conditions were as follows: 95℃ for 10 min; 40 cycles of 95℃ for 10 s, 60℃ for 15 s, 72℃ for 30 s; and 72℃ for 7 min. To ensure primer specificity, a melting curve analysis was carried out for each sequence-specific primer. Subsequent to data acquisition, relative gene expression levels were computed using the comparative Ct method (2
-ΔΔCt) with β-actin as the reference gene. The results were indicated as the fold-change of gene expression in the experimental group compared to the control group. The primer sequences for target genes are shown in
Table 1.
2.13. Western Blot
HepG2 cells and mouse liver samples were homogenized in RIPA buffer (Millipore, Bedford, MA, USA) adding the protease inhibitors (Roche, Swiss). The homogenates were centrifuged at 13,000 rpm for 30 min at 4℃, with subsequent collection of the supernatants. Equivalents of protein were loaded onto SDS-PAGE gels, ranging from 7.5% to 12%, and electrophoretically separated. The separated proteins were transferred onto PVDF membranes (Millipore, Bedford, MA, USA). After transfer, the membranes were blocked with 5% non-fat dry milk in Tris-buffered saline with 0.1% Tween-20 (TBST) at room temperature for 1 h. The blocking membranes were then incubated overnight at 4℃ with primary antibodies targeting specific proteins, including sterol regulatory element-binding protein 1c (SREBP-1c, MyBioSource, San Diego, CA, USA), CCAAT enhancer-binding protein alpha (C/EBPα, SantaCruz, CA, USA), carnitine palmitoyltransferase 1A (CPT1a, Abcam, Cambridge, UK), sirtuin 1 (SIRT1, Abcam, Cambridge, UK), phospho-AMP-activated protein kinase (p-AMPKα, Cell Signaling, Beverly, MA, USA), AMPKα (Cell Signaling, Beverly, MA, USA), cyclooxygenase 2 (COX-2, Abcam, Cambridge, UK), alpha-smooth muscle actin (α-SMA, Sigma-Aldrich, St. Louis, MO, USA), nuclear factor erythroid 2-related factor 2 (Nrf2, Santa Cruz, CA, USA), heme oxygenase-1 (HO-1, Cell Signaling, Beverly, MA, USA), β-actin (Cell Signaling, Beverly, MA, USA). Following thorough washing with TBST, the membranes underwent incubation with specific HRP-conjugated secondary antibodies at an 1 : 1000 dilution in TBST with 5% skim milk at room temperature for 1 h. After washing the secondary antibodies with TBST, protein bands were visualized utilizing the SuperSignal West Pico PLUS Chemiluminescent Substrate (Thermo Fisher Scientific, Waltham, MA) and were captured using the C-DiGit Blot Scanner (Li-COR, Corp., Lincoln, NE, USA).
2.14. Statistical Analysis
Data are expressed as the means ± standard deviation (SD). Statistical analysis was determined one-way analysis of variance (ANOVA) followed by Dunnett’s test. * p < 0.05, ** p < 0.01, *** p < 0.001, # p < 0.05, ## p < 0.01, and ### p < 0.001 were regarded as demonstrating a statistically significant distinction. Data were evaluated using Prism software Version 5.0 (GraphPad Prism Software, Inc.).
4. Discussion
NASH is a complex liver condition characterized by the accumulation of excess fat in liver cells, inflammation, and liver damage. [
27]. NASH treatments have seen development efforts on a global scale. However, their limited success can be attributed to the lack of drugs capable of effectively and comprehensively regulating the diverse pathways involved in the progression of NASH. In particular, synthetic pharmaceutical agents are typically formulated to selectively obstruct a singular signaling pathway. Consequently, addressing the intricate task of mitigating NASH is expected to present an even greater level of complexity. Natural products such as herbs, plant extracts, and dietary supplements often contain bioactive compounds with hepatoprotective properties that can act on multiple targets and pathways involved in NASH pathogenesis. The natural compounds used for NASH treatment should possess the capacity to mitigate oxidative stress and inflammation, which are key drivers of NASH progression. Several natural compounds have been shown to possess antioxidant and anti-inflammatory properties, including polyphenols, such as resveratrol, curcumin, and quercetin, as well as omega-3 FAs found in fish oil [
28,
29,
30,
31]. These compounds have been studied extensively in animal models and some clinical trials, with promising results in terms of their ability to mitigate oxidative stress and inflammation as well as improve liver histology and function. One potential advantage of natural compounds over synthetic drugs is their relatively low toxicity and fewer side effects.
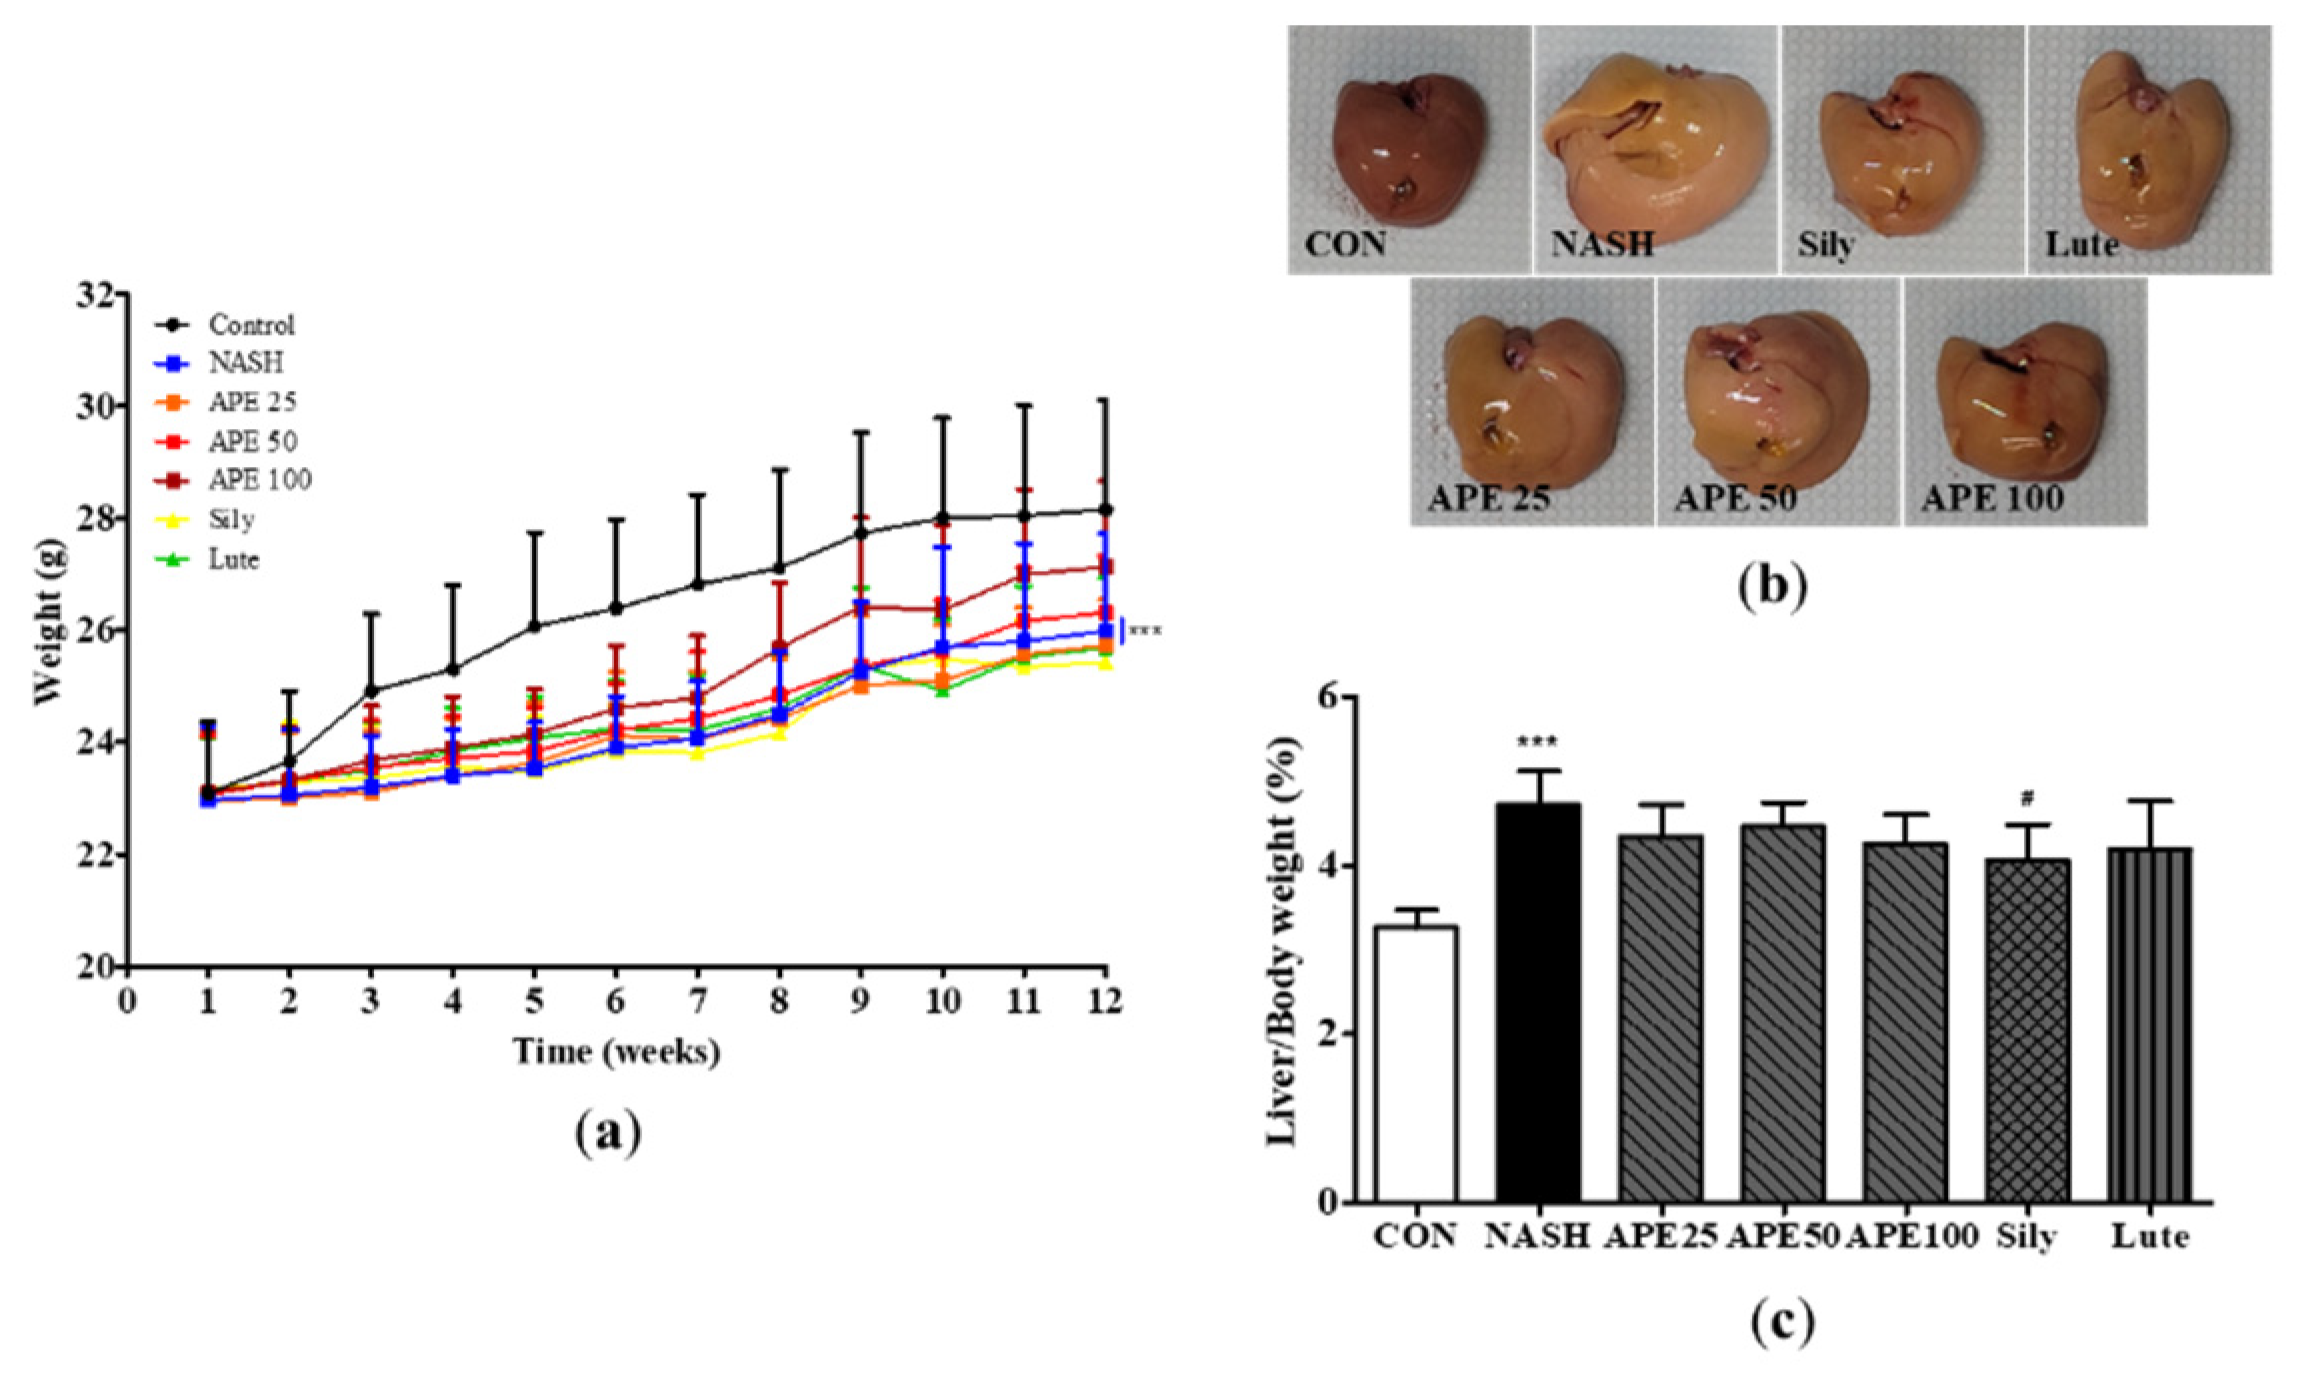
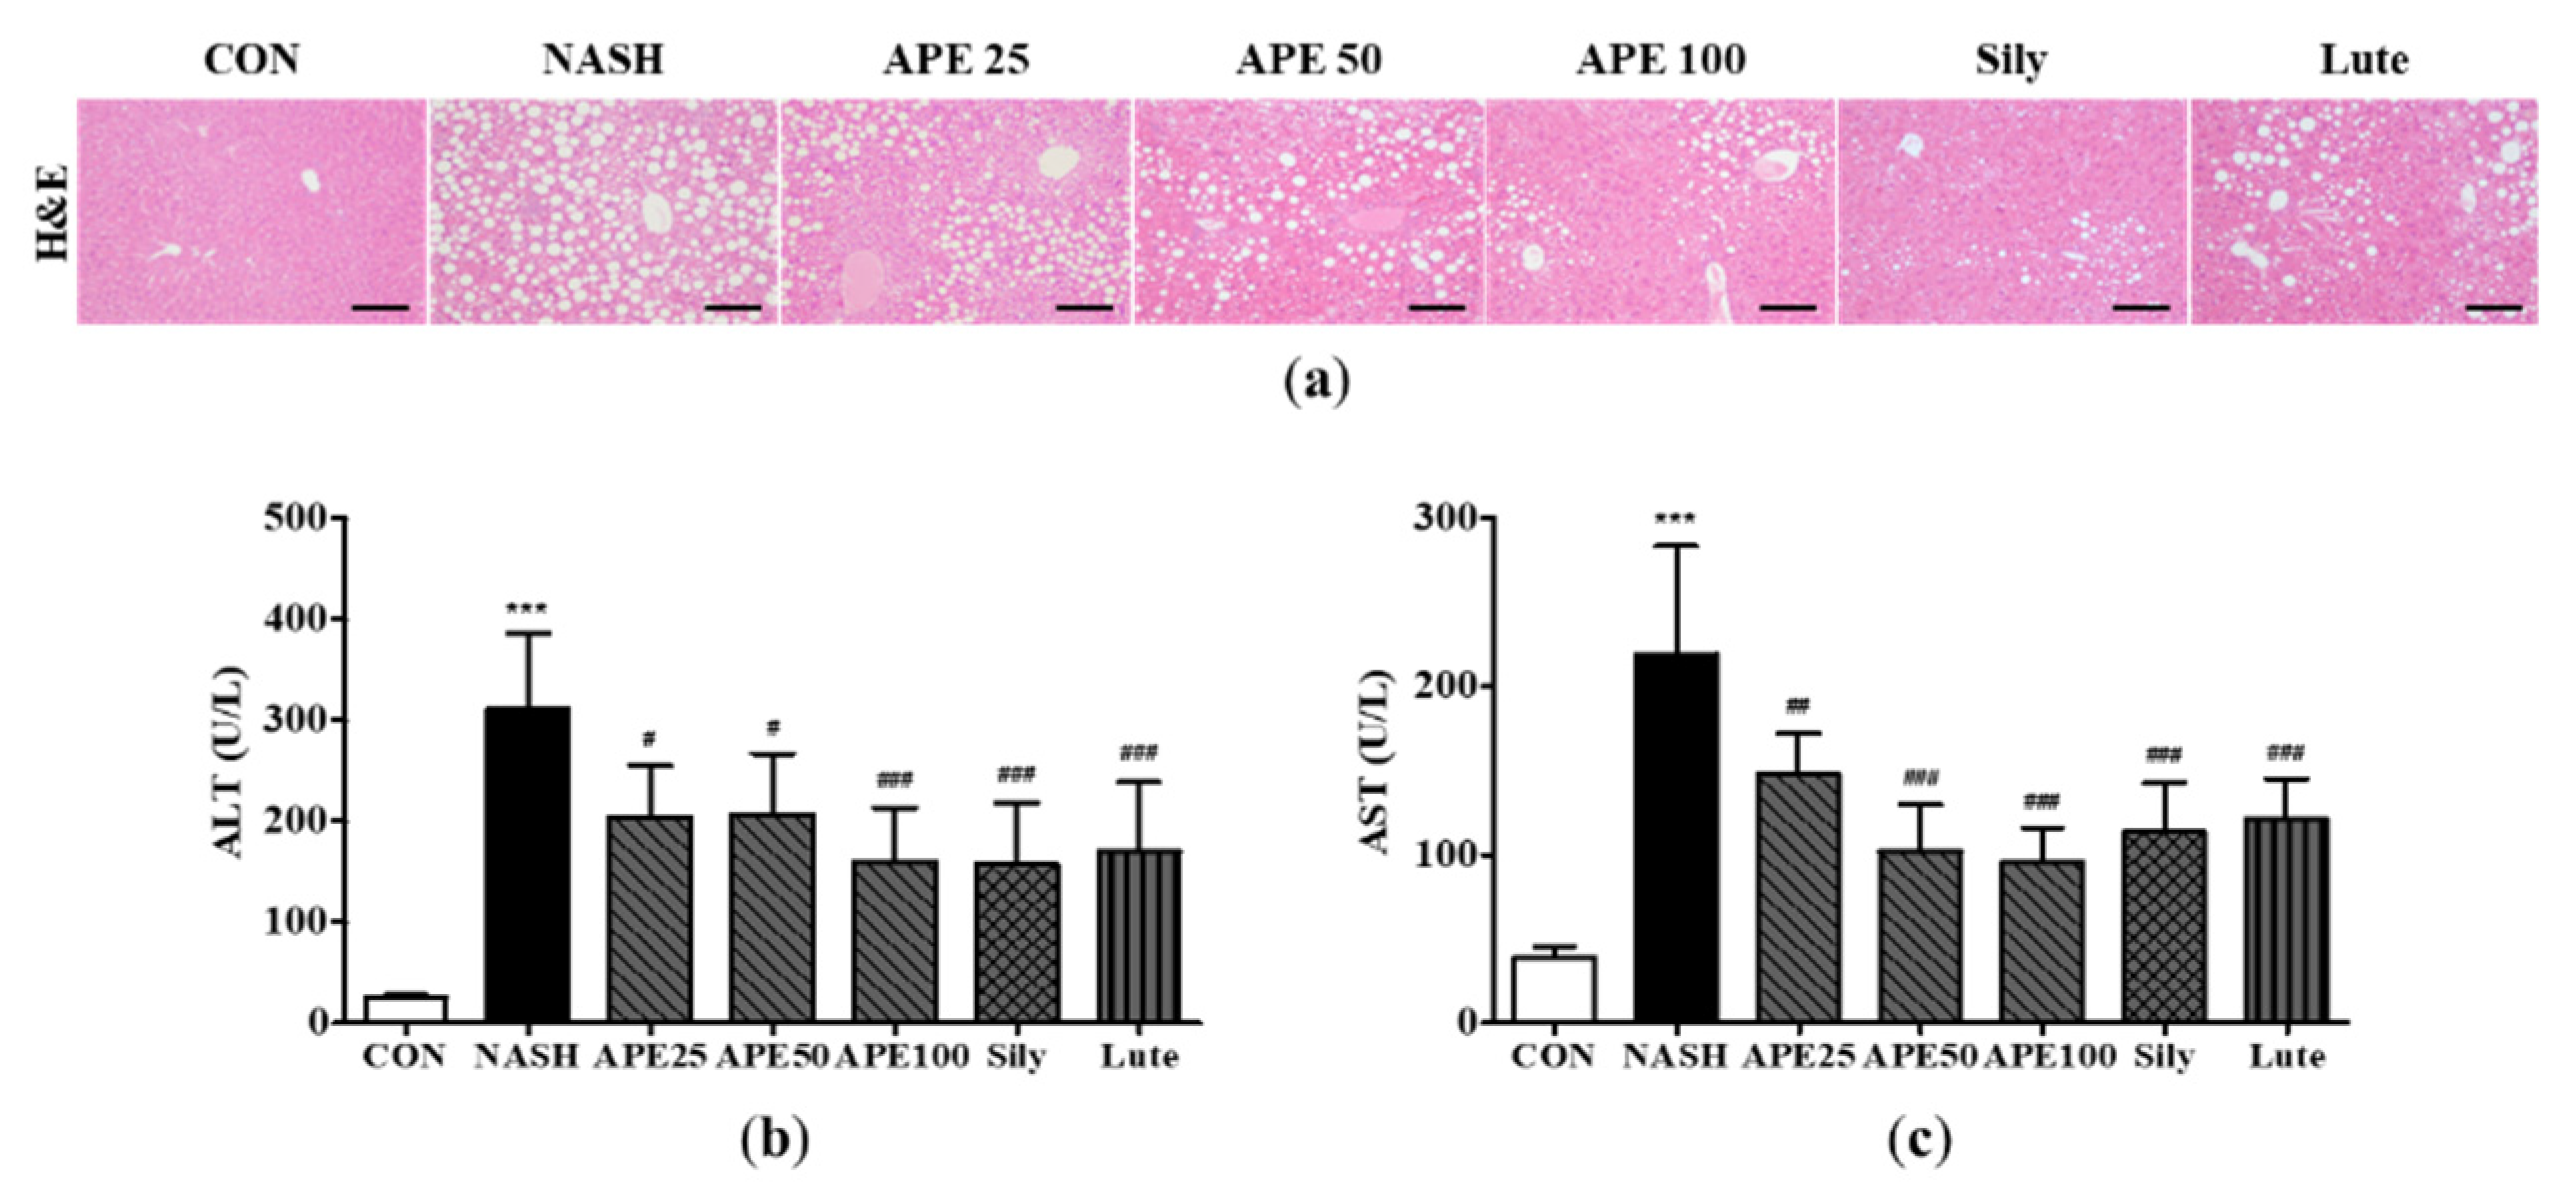
Therefore, our study tested the potential of APE as a candidate material for the treatment of NASH based on its strong antioxidant and anti-inflammatory effects. In the present study, we conducted experiments via FFA-induced cellular steatosis in HepG2 cells and a CDAHFD-induced NASH model in mice. Our findings revealed that A. pilosa exerted inhibitory effects on the accumulation of intracellular lipid droplets and TG in both FFA-treated HepG2 cells and the liver tissue of CDAHFD-induced NASH mice.
Furthermore, we aimed to evaluate the expression of genes related to lipid metabolism, specifically concerning the inhibition of fat globule accumulation and TG reduction following the administration of APE. Several cell signaling pathways are involved in the regulation of fat metabolism and contribute to the development and progression of NASH. Among these pathways, the SREBP pathway plays a prominent role in the regulation of lipogenesis. Transcription factors known as SREBPs control the expression of genes involved in FA and TG synthesis. Dysregulation of the SREBP pathway in NASH can lead to excessive lipogenesis and an augmented accumulation of TGs within hepatocytes [
32,
33]. Another significant pathway implicated in NASH is the PPARγ pathway. PPARγ, a nuclear receptor, plays a significant role in adipocyte differentiation and lipid metabolism. Activation of PPARγ promotes adipogenesis and facilitates lipid storage. Aberrant activation of PPARγ in NASH can contribute to generated lipogenesis and lipid droplets accumulation in the liver [
34,
35]. In addition, the AMPK pathway, serving as a key cellular energy sensor, regulates lipid metabolism. Activation of AMPK promotes lipolysis by phosphorylating and inhibiting key enzymes involved in lipogenesis while simultaneously activating enzymes responsible for TG breakdown. Impaired AMPK signaling in NASH disrupts lipolysis and contributes to the accumulation of TGs [
36,
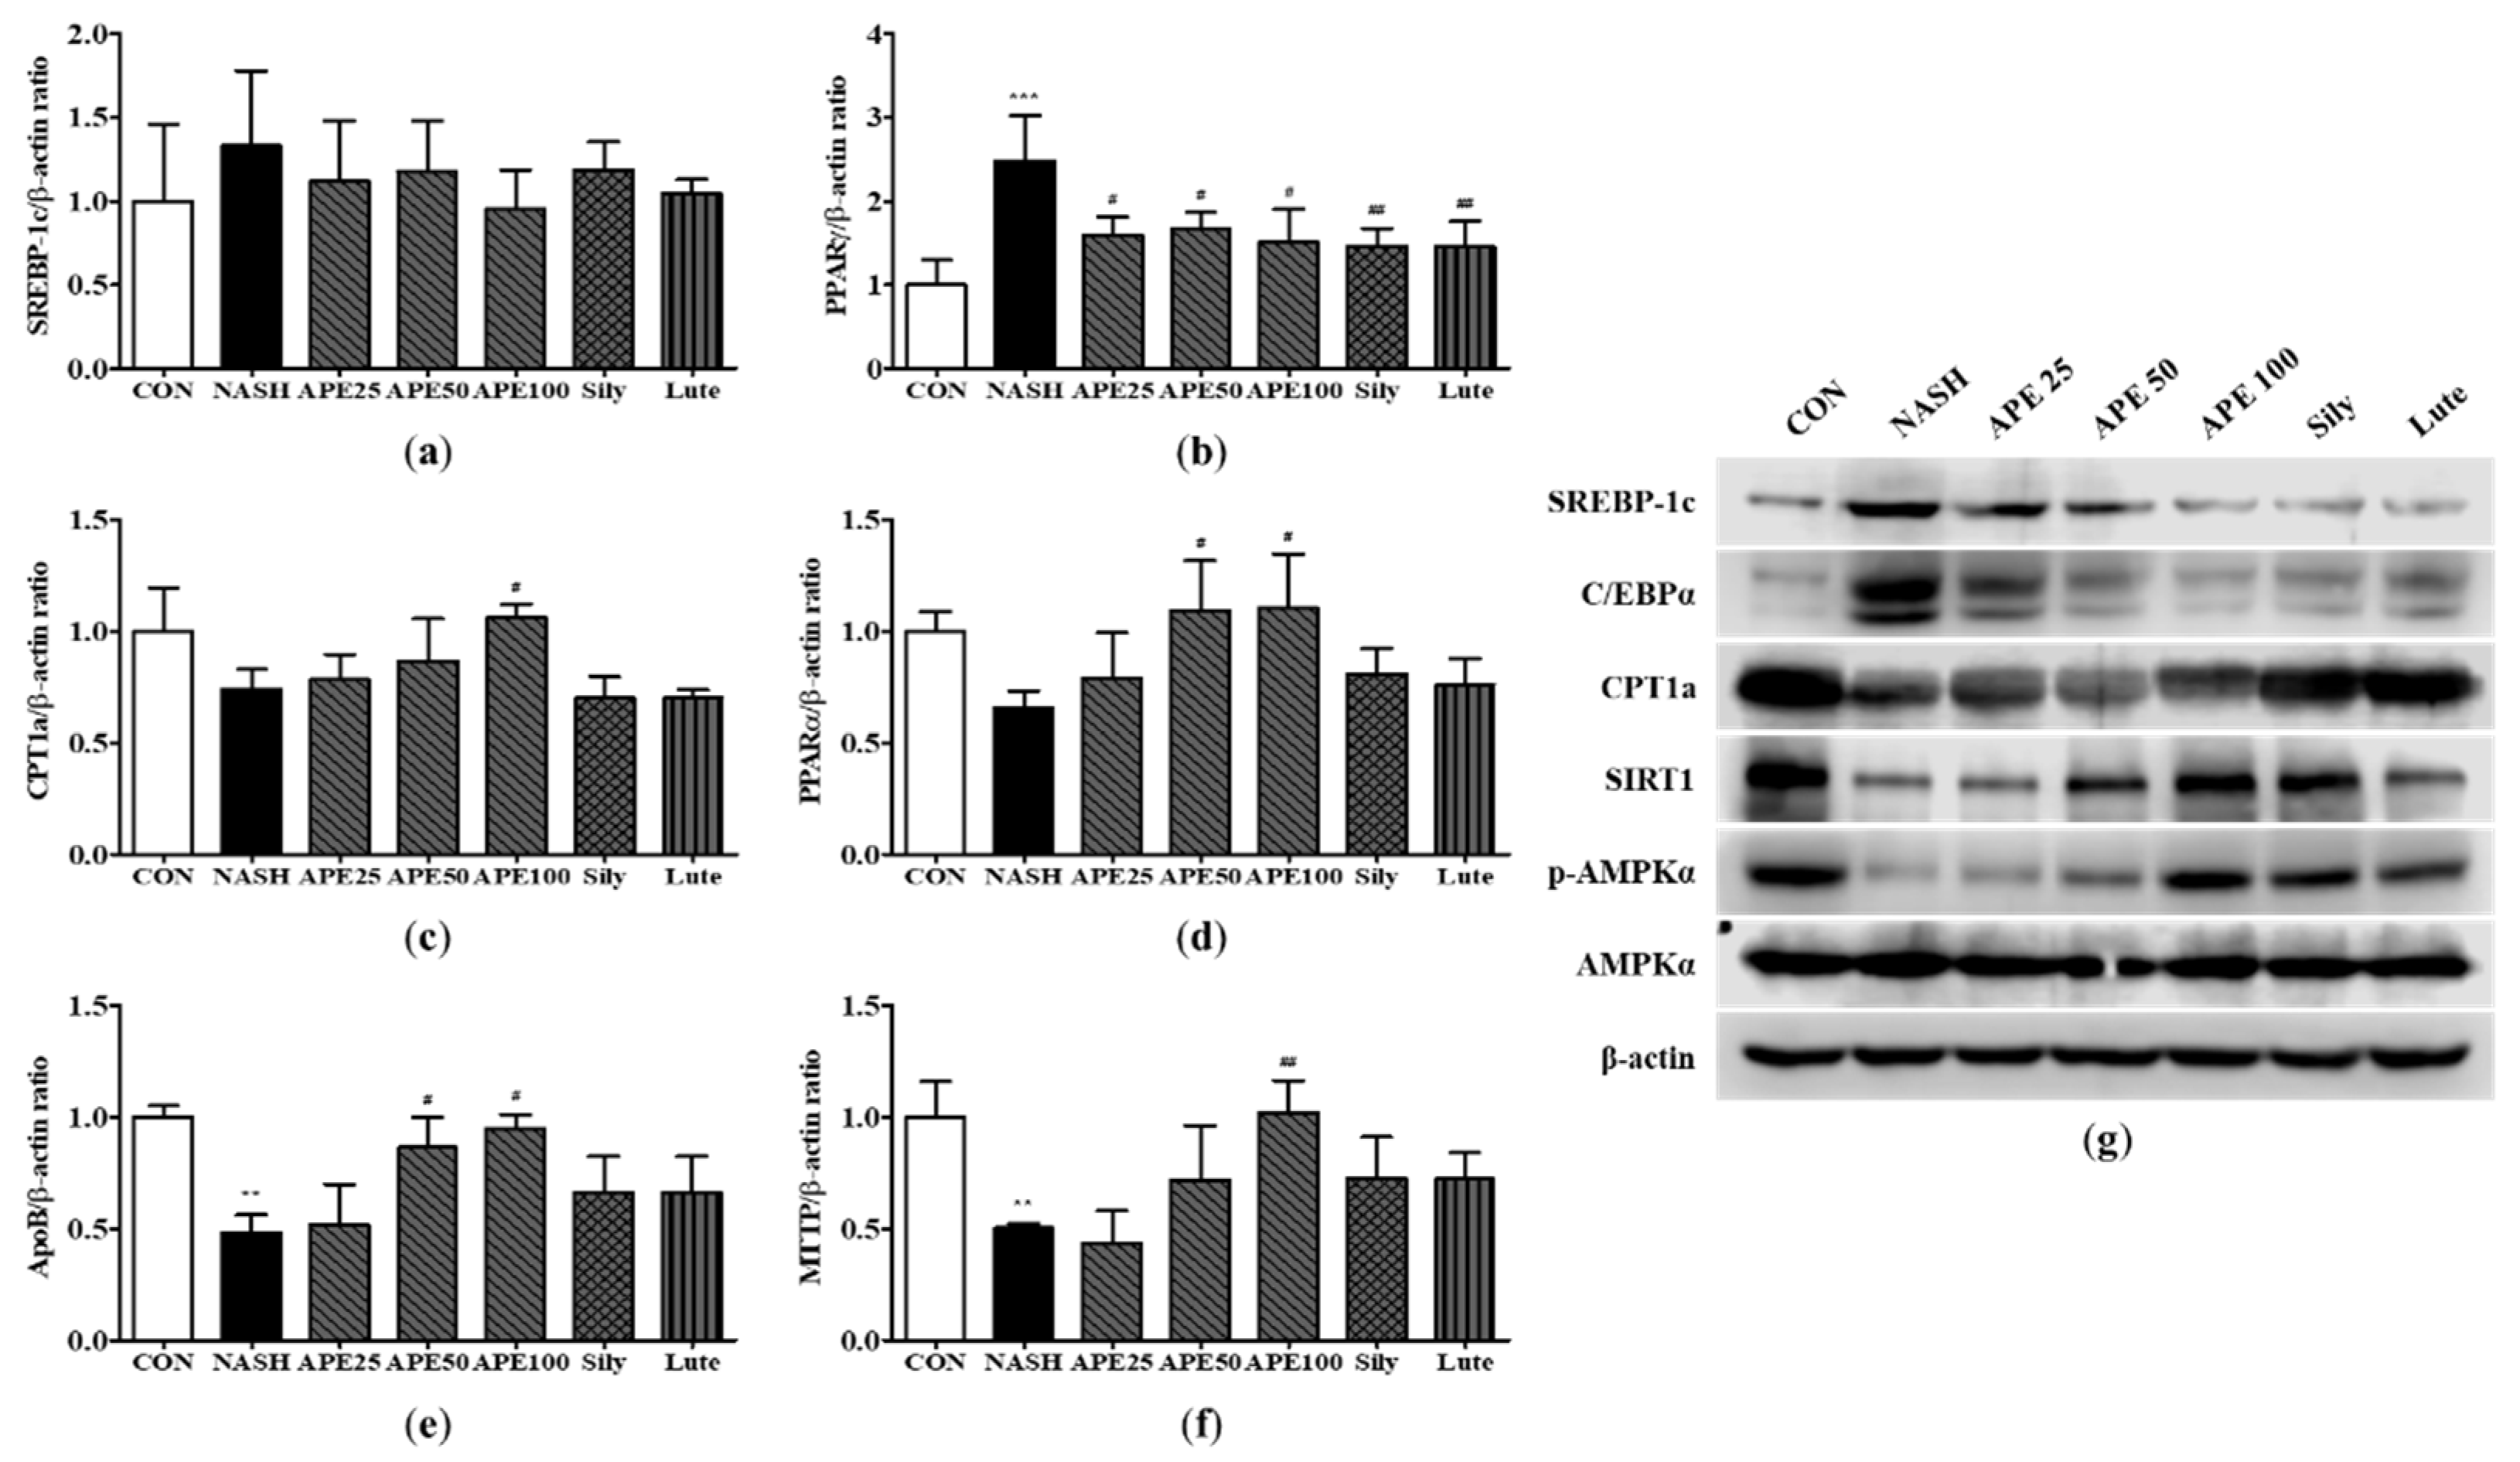
37]. These pathways interact with and influence each other, collectively forming a complex network that governs lipid metabolism. Our study found that treatment with APE in FFA-induced hepatic steatosis reduced the expression levels of lipid metabolism-related genes, such as SREBP-1c and C/EBPα, and elevated the expression levels of FA oxidation-related genes, such as CPT1a and PPARα, via the AMPK/SIRT1 pathway. Furthermore, in line with our in vitro data, treatment of APE in a CDAHFD-induced NASH mouse model downregulated SREBP-1c expression, activated AMPK, and upregulated PPARα expression in the liver. These results demonstrate that AMPK/SIRT1 activation and subsequent lipid metabolism inhibition is a potential mechanism for the beneficial effect of
A. pilosa on hepatic steatosis.
Considering the complex pathogenesis of NASH, we further investigated the effects of
A. pilosa the expression of genes related to on inflammation, oxidative stress, ER stress, and liver fibrosis. Inflammation and oxidative stress play a crucial role in the development of NASH by triggering a cascade of events that lead to more severe liver diseases. In addition, inflammation and oxidative stress are known to contribute to ER stress by increasing the demand for protein folding and promoting the accumulation of misfolded proteins. In turn, ER stress can also activate the unfolded protein response and contribute to the development of inflammation and oxidative stress [
38,
39]. The interplay among inflammation, oxidative stress, and ER stress in NASH can lead to fibrosis, cirrhosis, and hepatocellular carcinoma. In the present study, we additionally conducted an examination of gene expression patterns associated with inflammation, oxidative stress, ER stress, and liver fibrosis to assess the potential inhibitory impact of
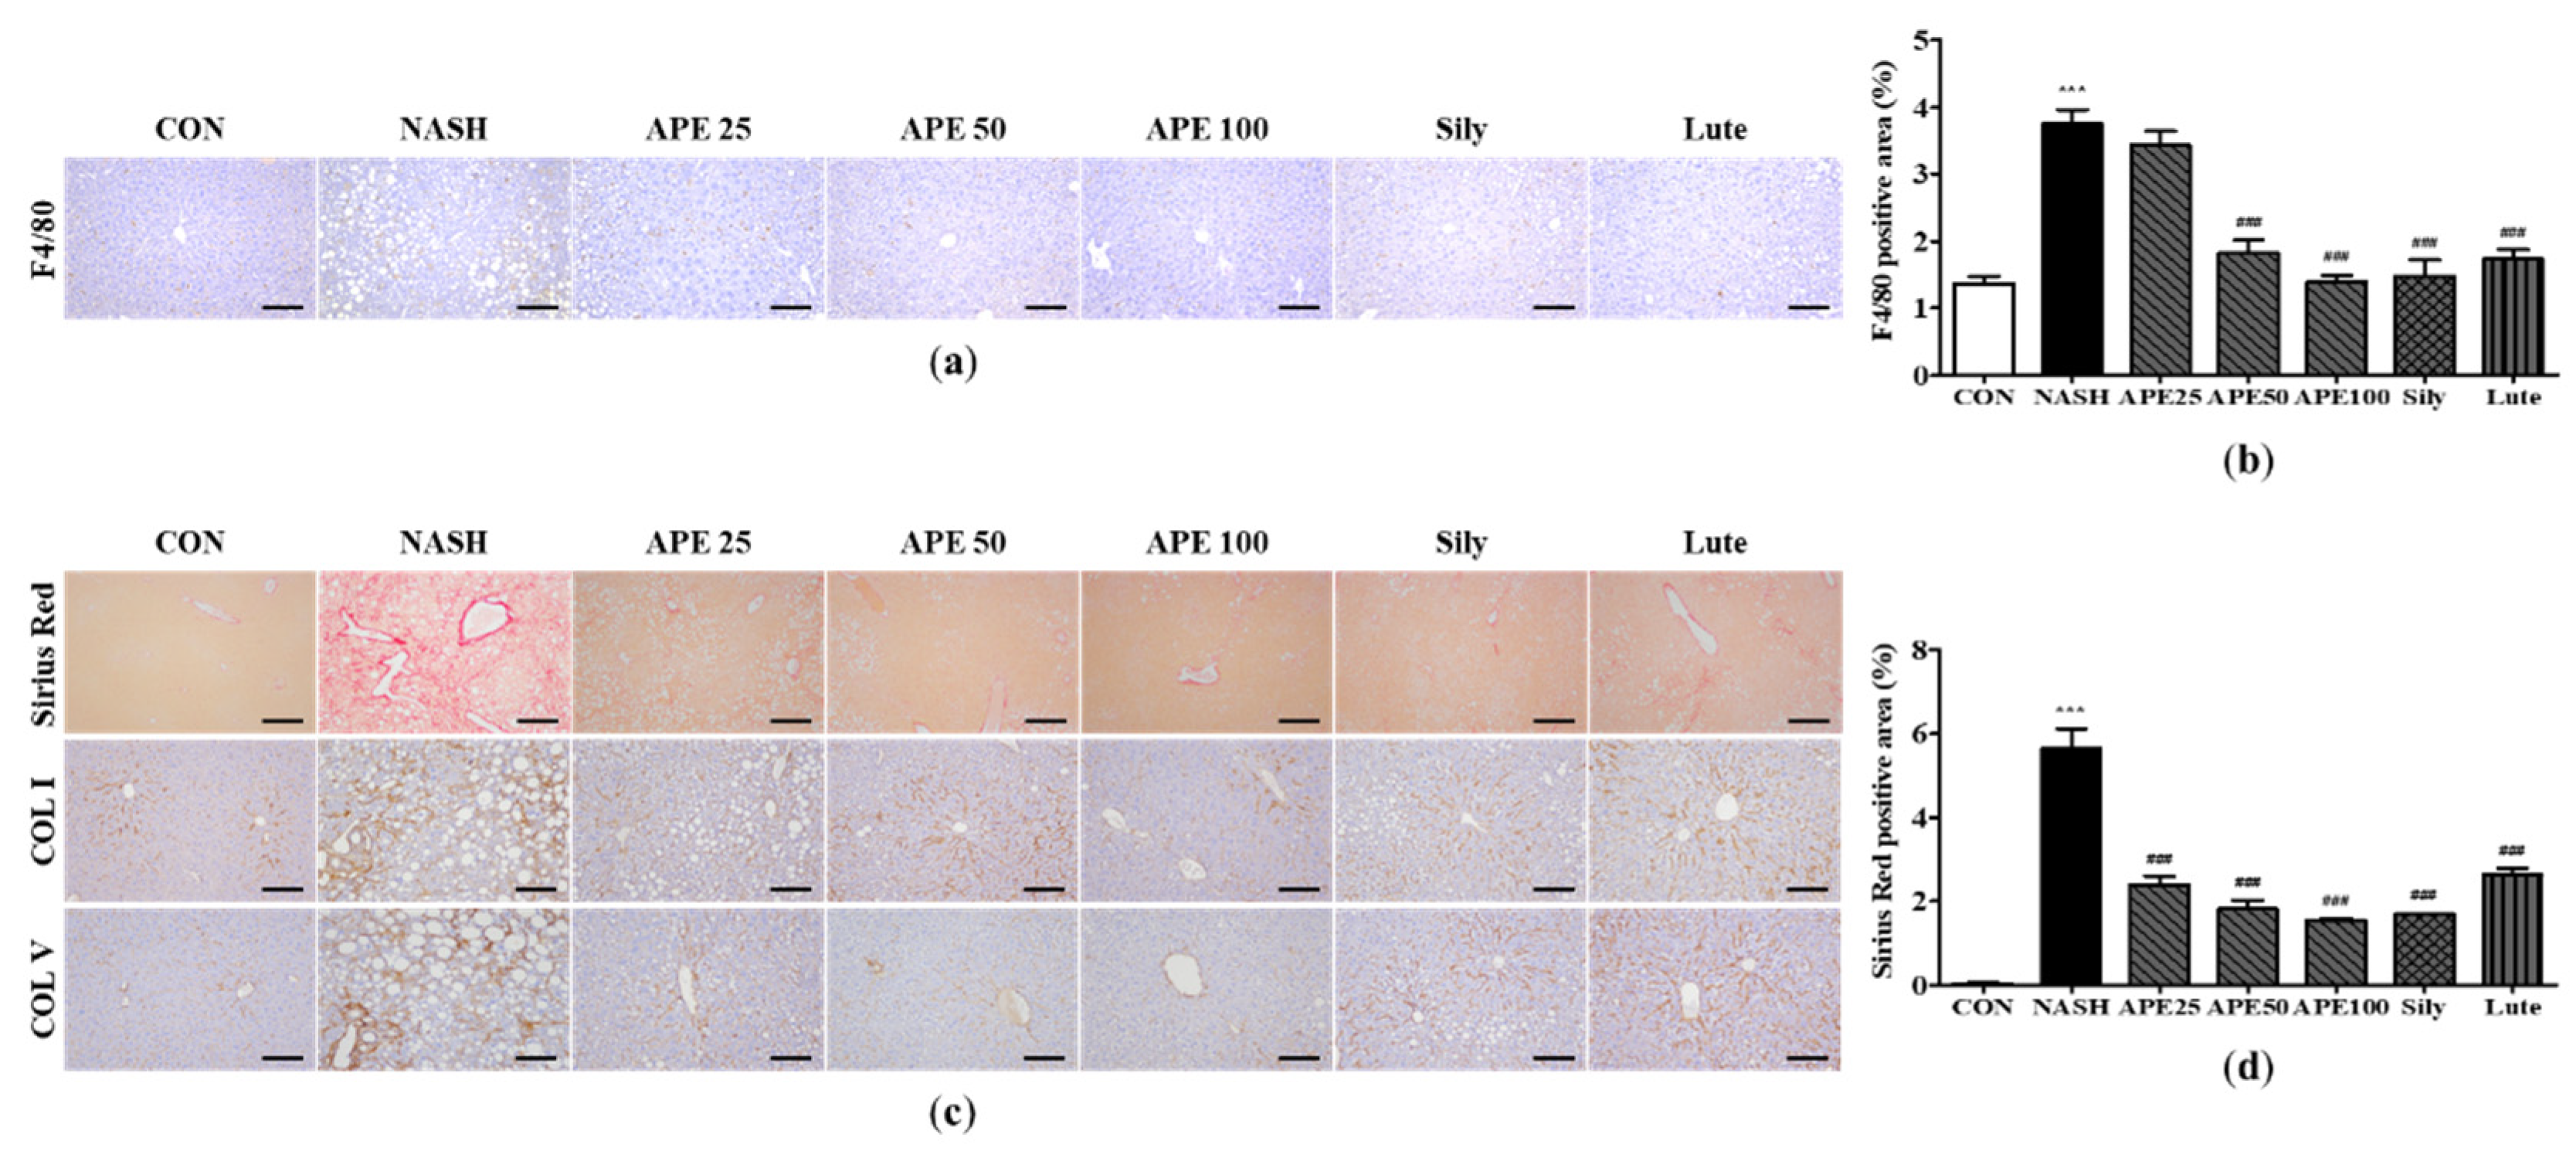
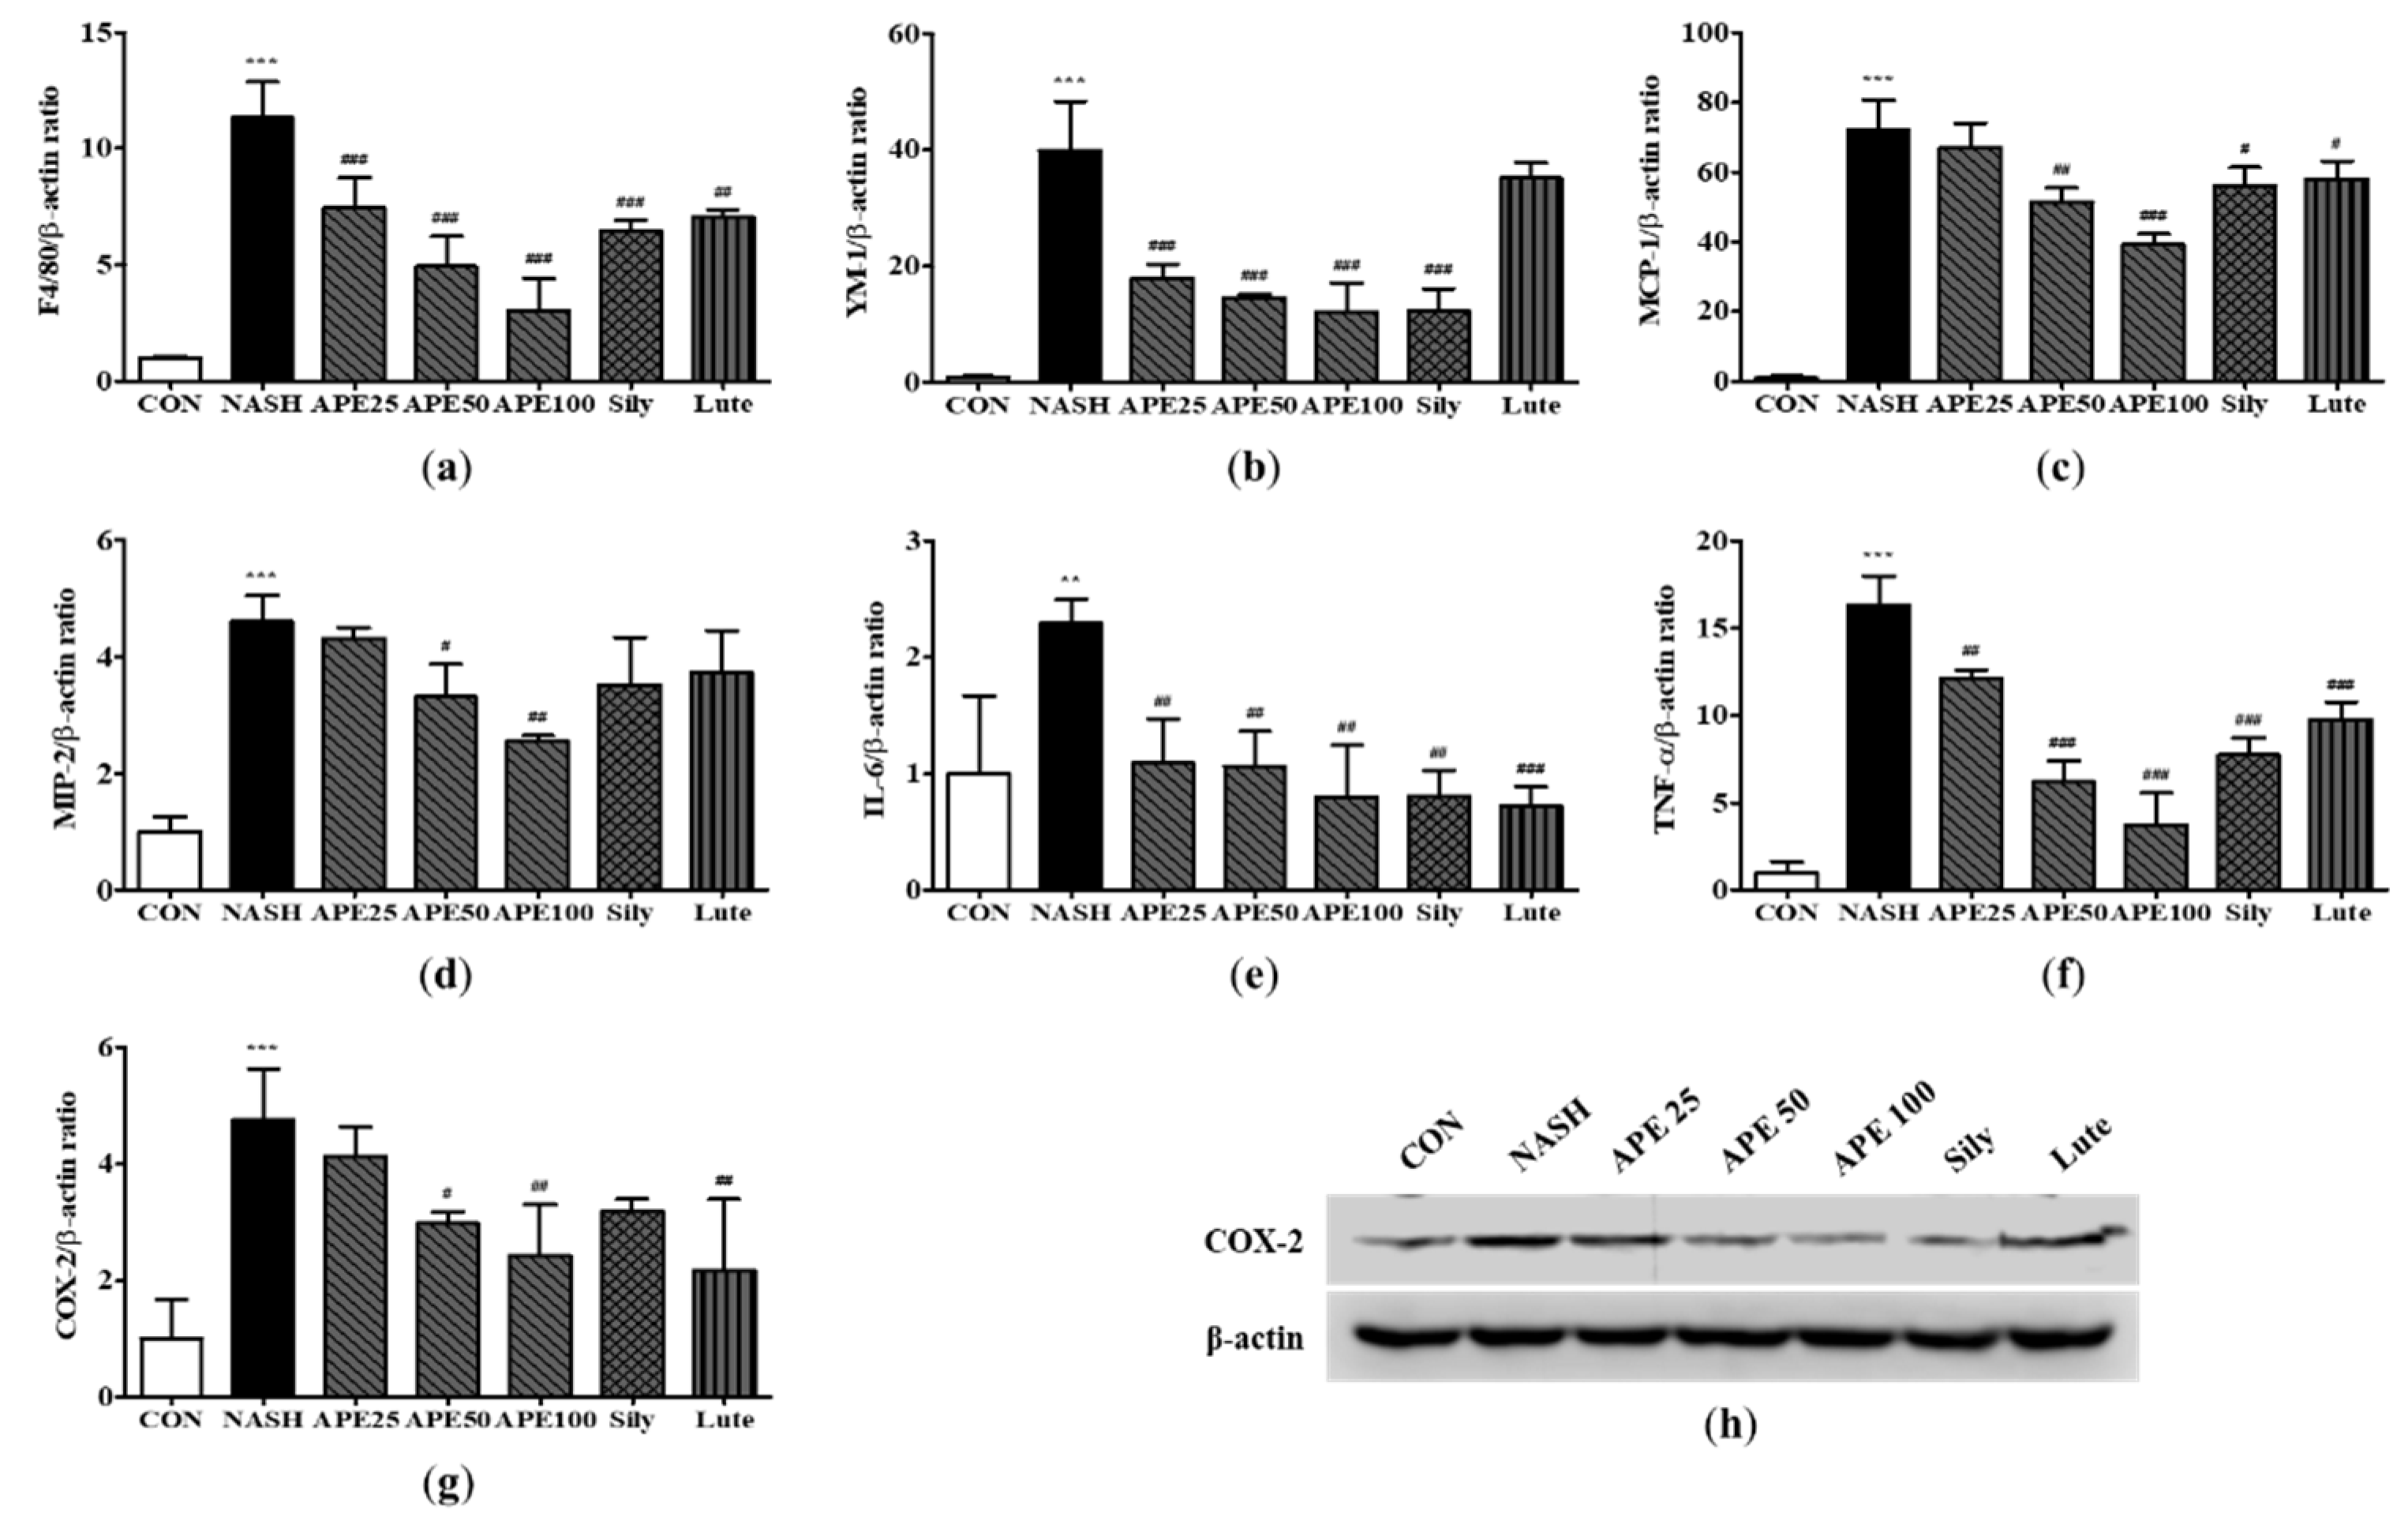
A. pilosa on NASH. Notably, our findings revealed that treatment with APE strongly attenuated inflammation, as evidenced by the decreased expression of key macrophage, cytokine, and chemokine markers, including F4/80, MCP-1, IL-6, TNF-α, and COX-2. Moreover,
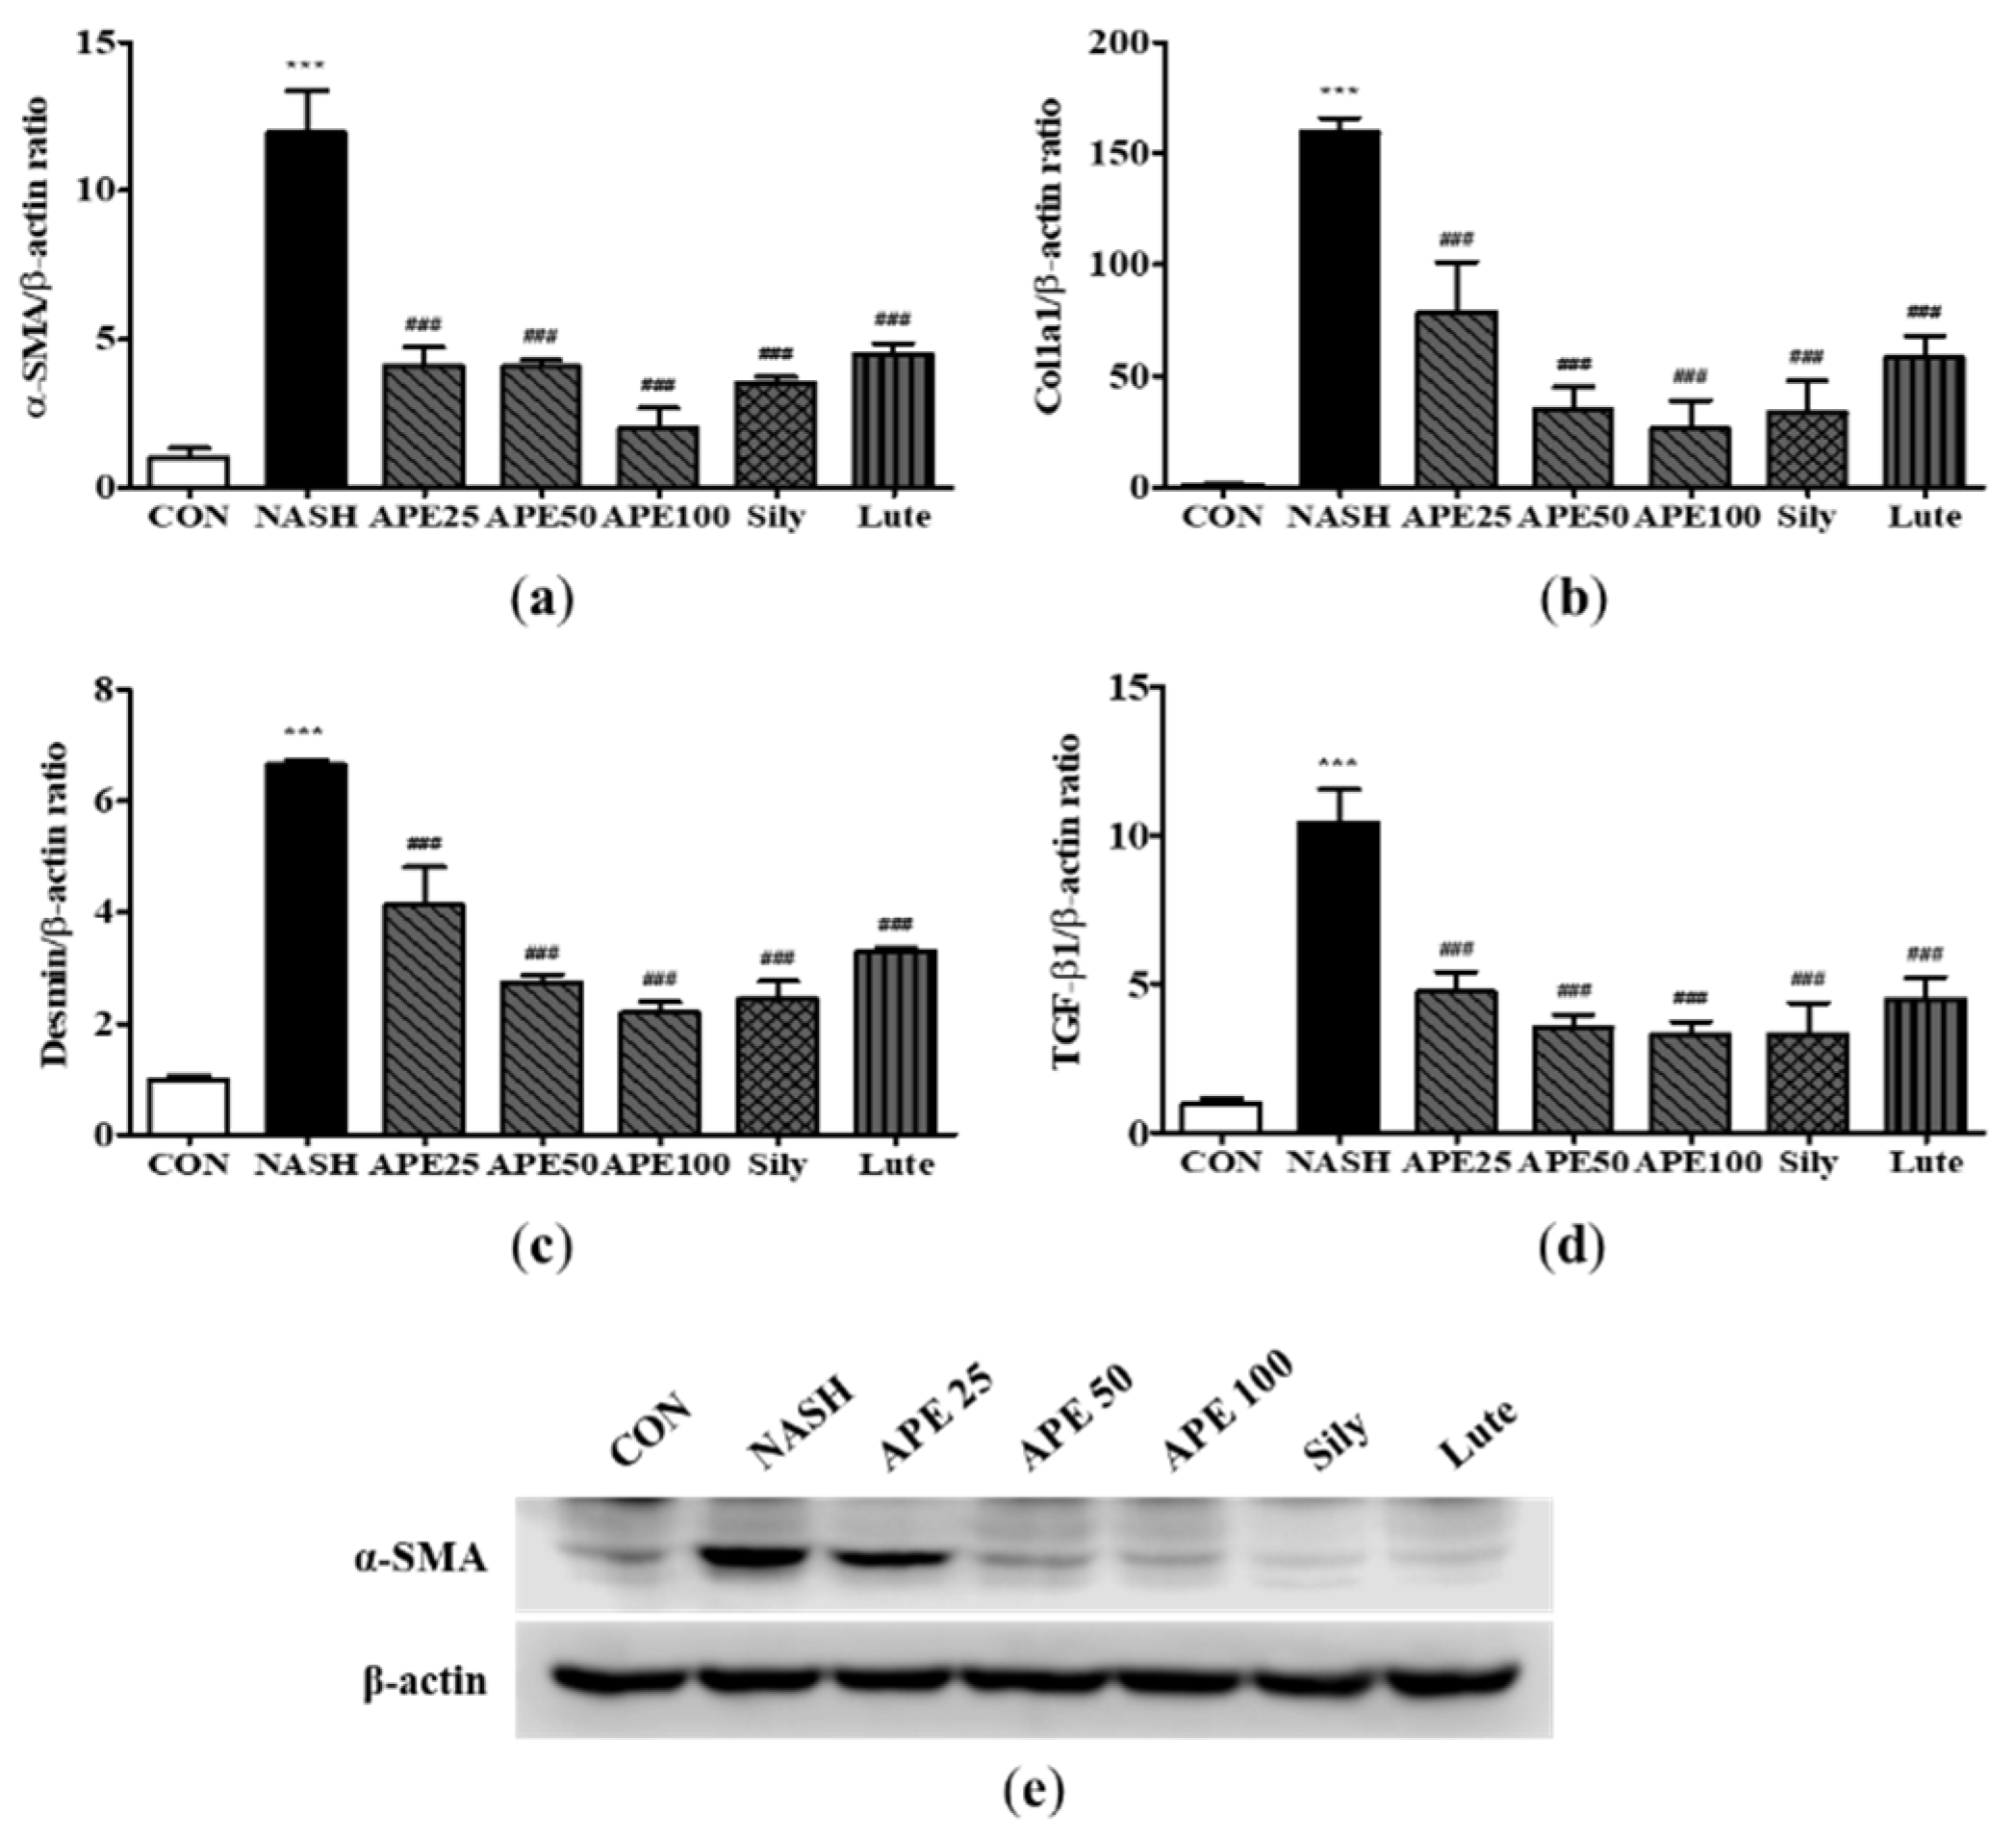
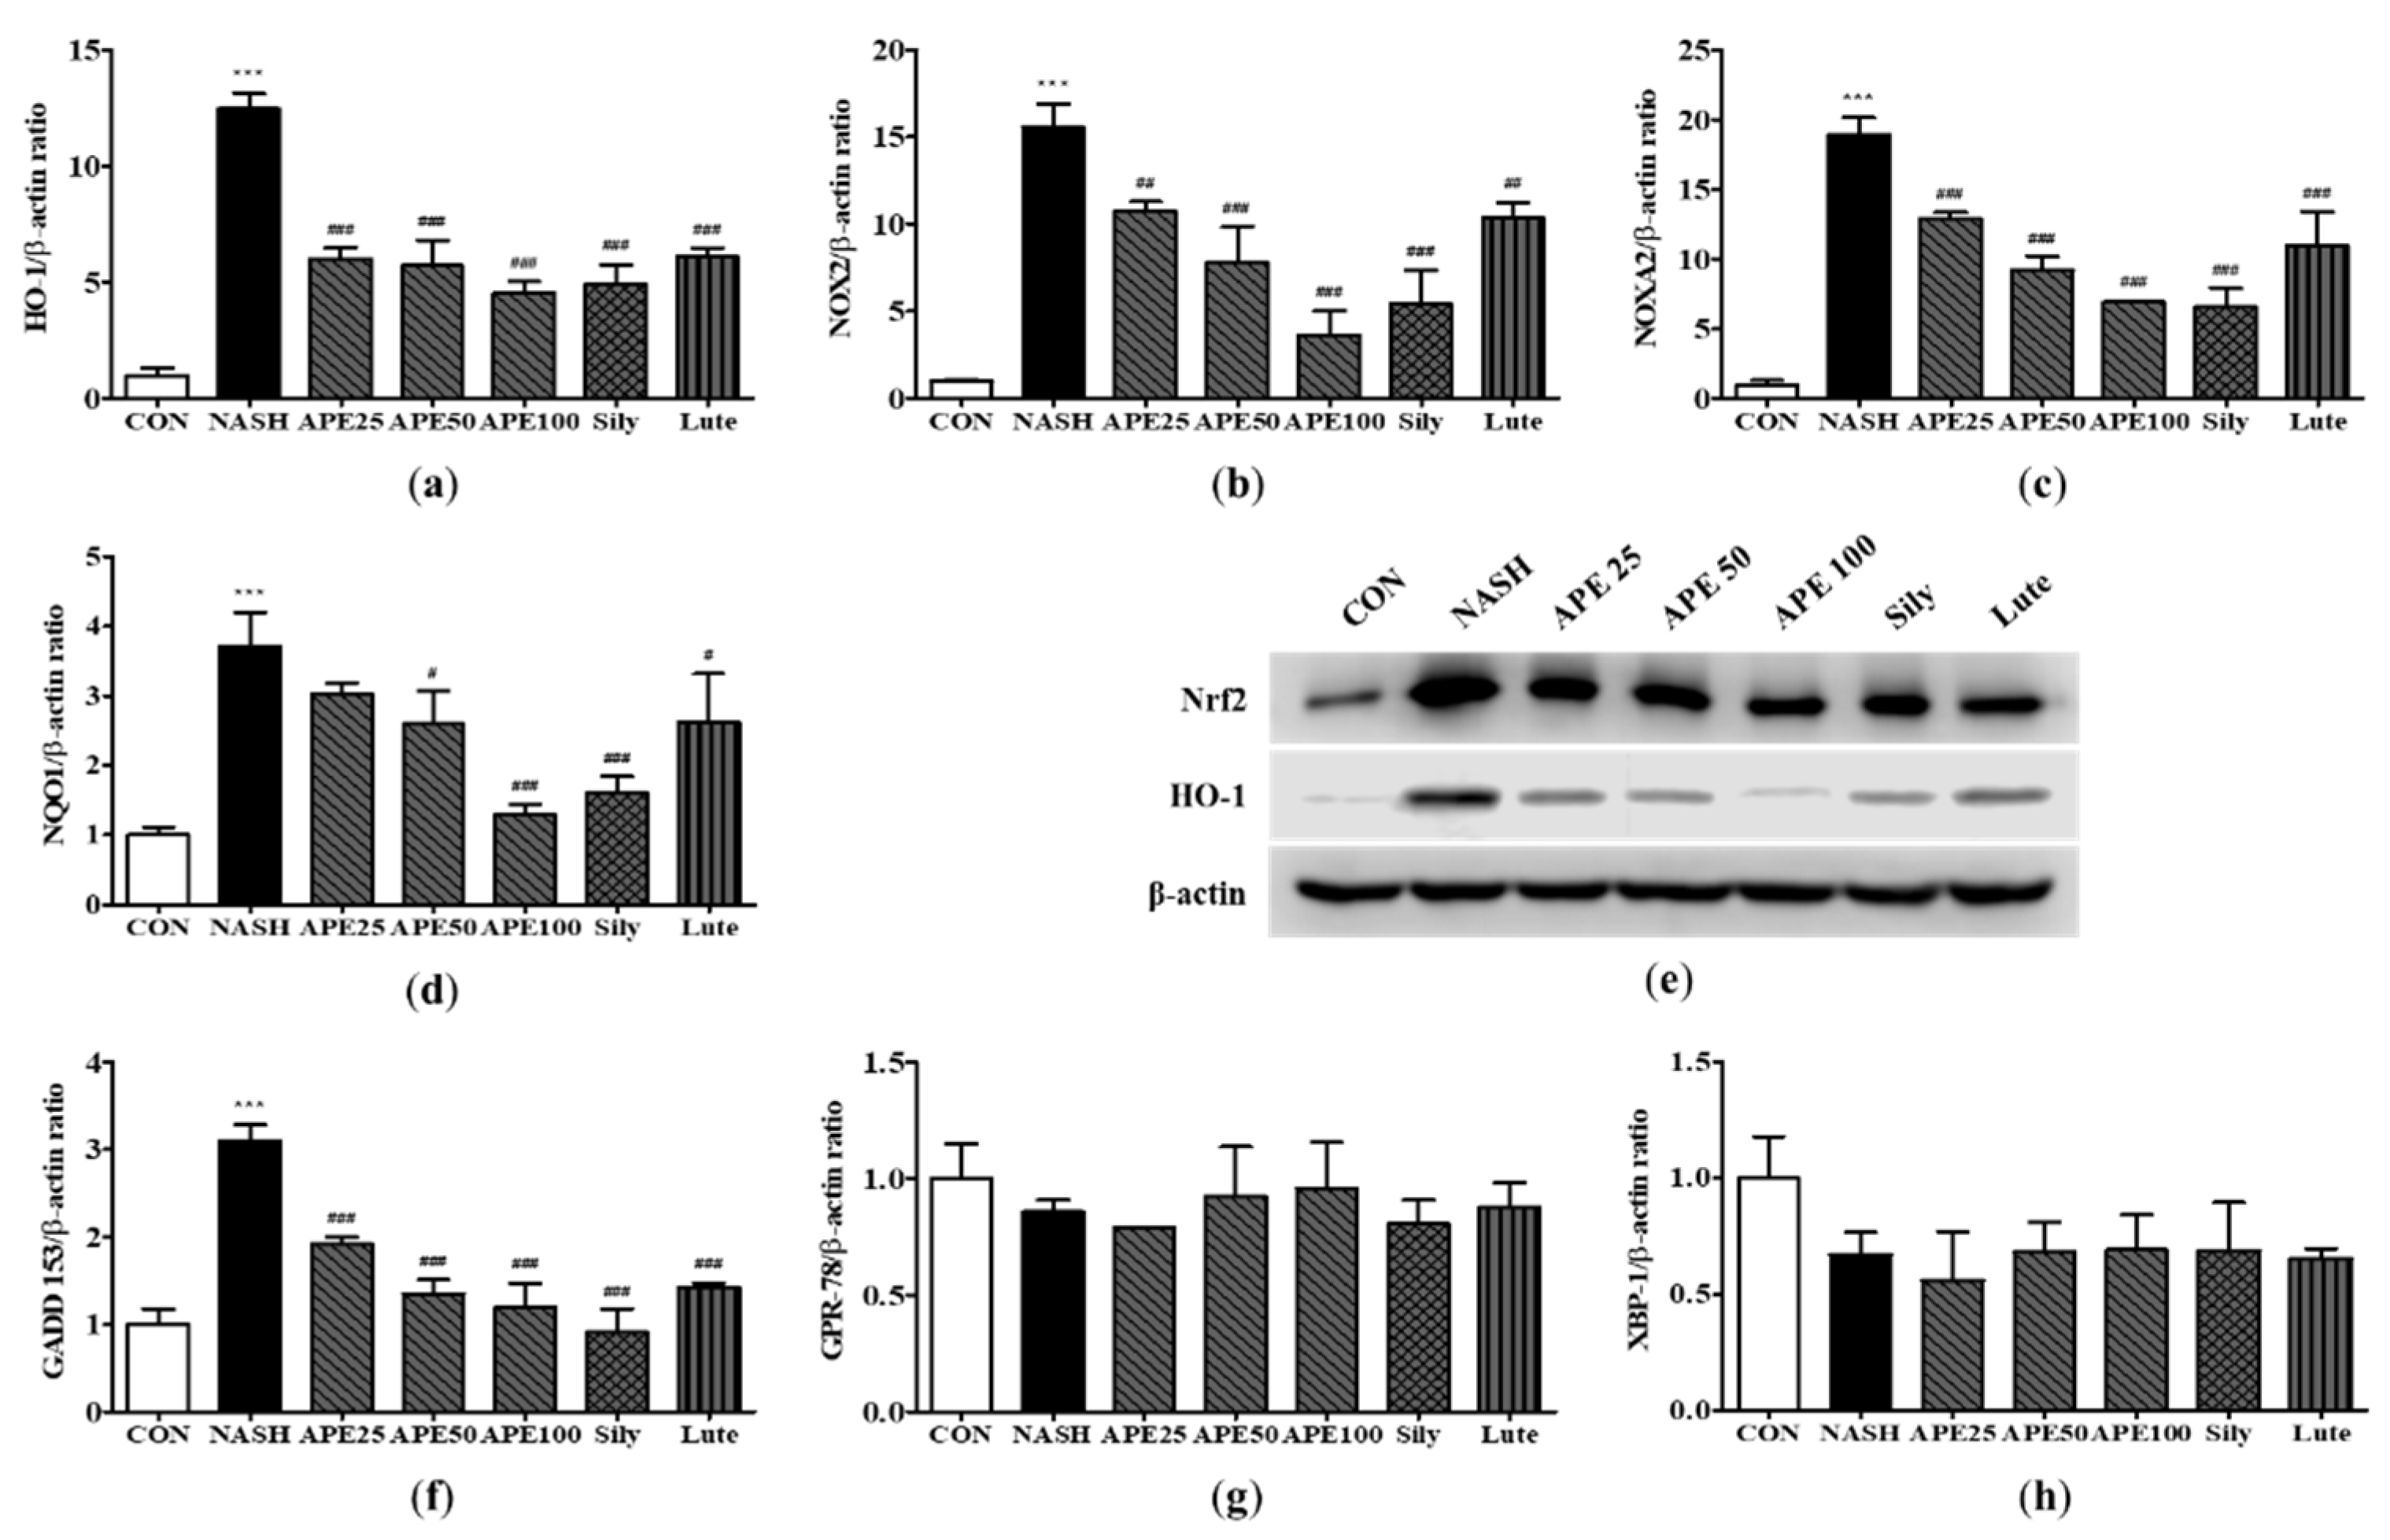
A. pilosa demonstrated its ability to suppress hepatic oxidative stress and ER stress, as indicated by the lower expression levels of Nrf2, HO-1, and GADD 153. We also demonstrated that APE treatment led to a decrease in hepatic fibrosis markers, such as α-SMA, COL1A1, desmin, and TGF-β1. The above results indicate that
A. pilosa contributes to the prevention of the advancement towards hepatic fibrosis through the suppression of lipid metabolism, attenuation of damage induced by various intracellular stressors, and inhibition of intrahepatic fat accumulation.
Overall, A. pilosa is expected to be more competitive than other plant extracts. These results are attributed to the influence of various active ingredients, as they exhibit higher efficacy compared to luteolin, one of the liver damage-inhibiting constituents present in the APE studied in this study.
Figure 1.
High-performance liquid chromatography with diode array detection (HPLC-DAD) chromatograms. Panel (a) represents the blank chromatogram. Panel (b) shows the chromatogram of the luteolin-7-O-glucuronide standard. Panel (c) displays the chromatogram of Agrimonia pilosa with excitation at 350 nm.
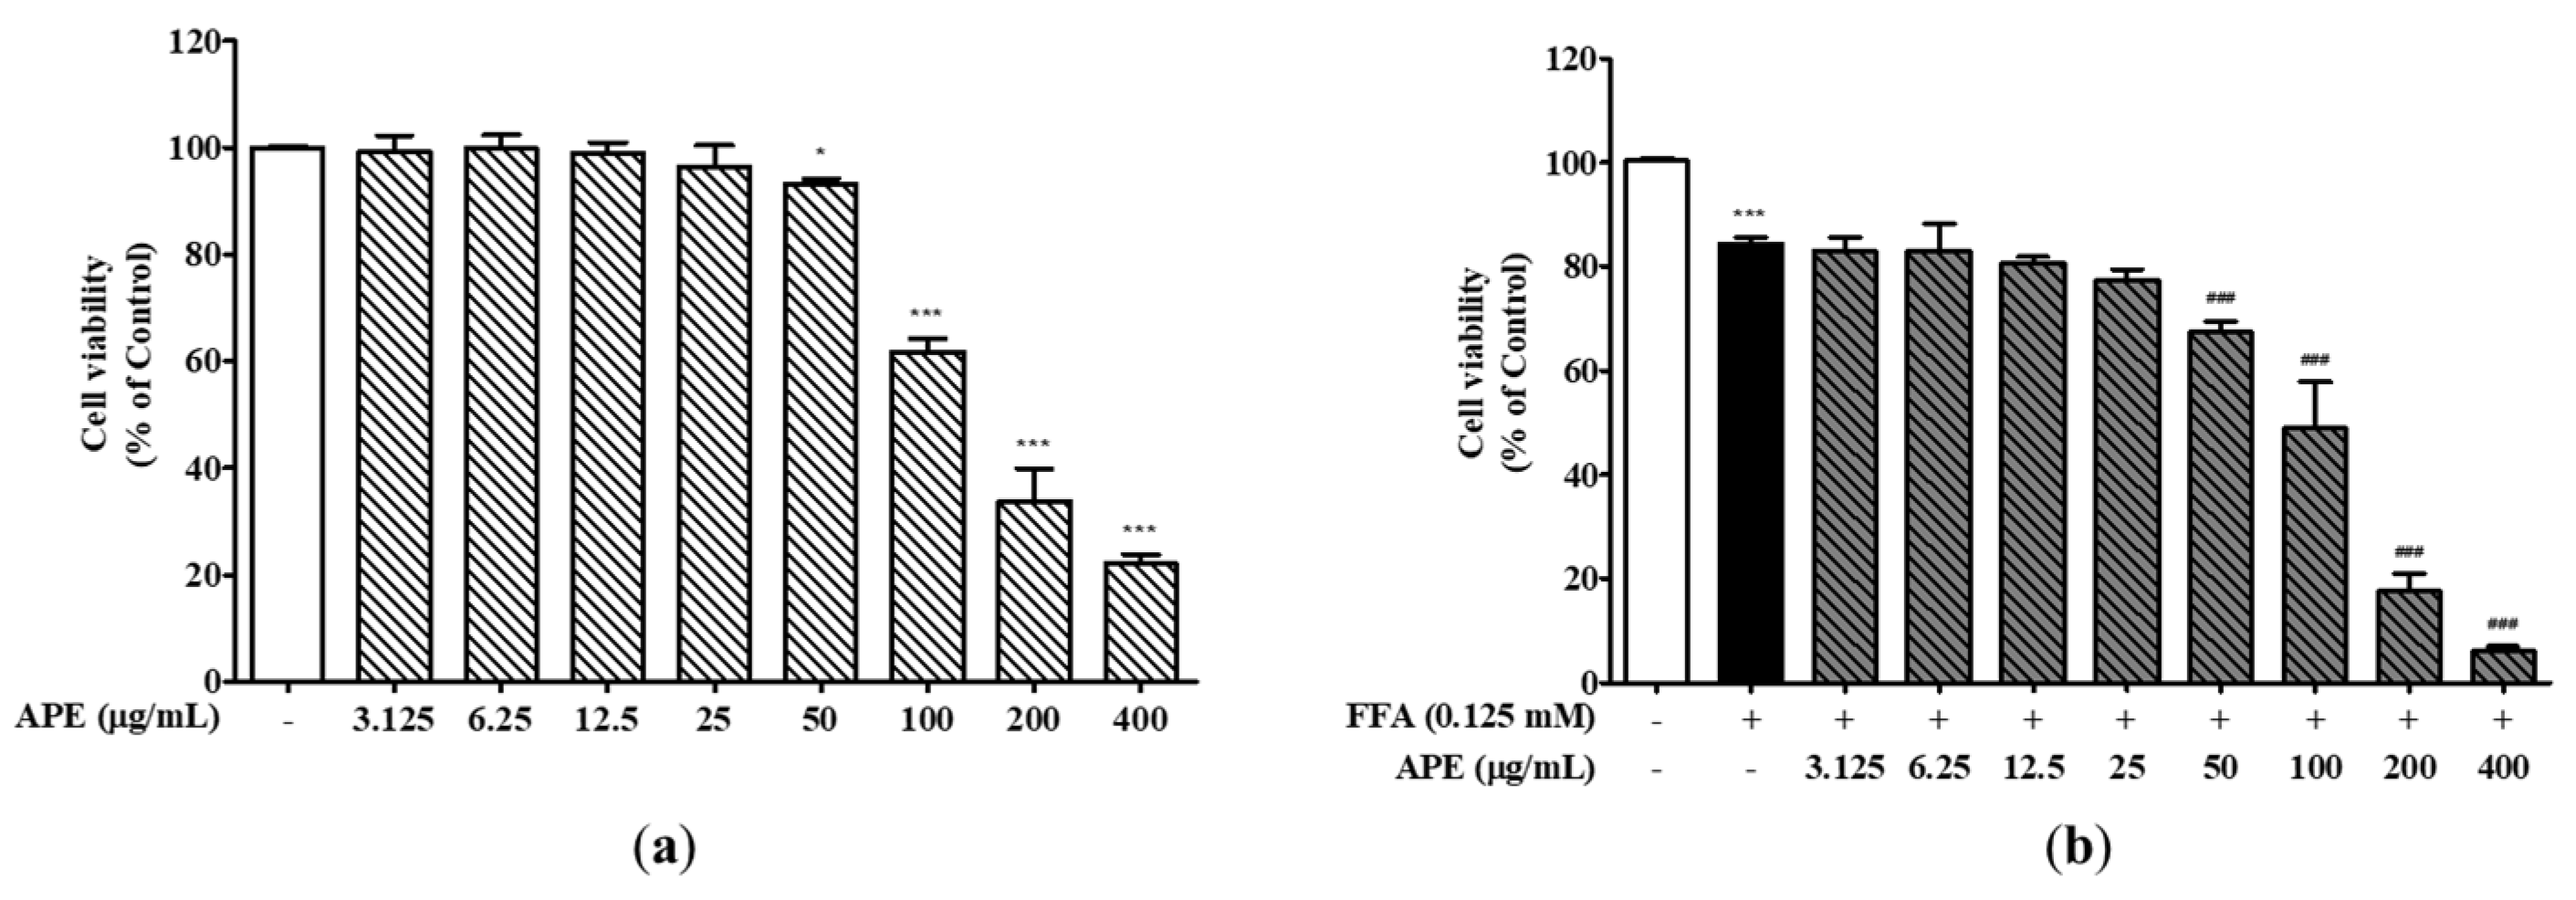
Figure 2.
Effects of APE on the cell viability of HepG2 cells. (a) HepG2 cells were treated with different concentrations of APE (0, 3.125, 6.25, 12.5, 25, 50, 100, 200, and 400 μg/mL) for 24 h. (b) Cells were exposed with 0.125 mM FFA and different concentrations of APE (0, 3.125, 6.25, 12.5, 25, 50, 100, 200, and 400 μg/mL) for 24 h. Cell viability was assessed through the utilization of the CCK-8 assay. The data are presented as the mean ± SD. * p < 0.05, *** p < 0.001 vs. the control group; ### p < 0.001 vs. the group treated with FFA alone.
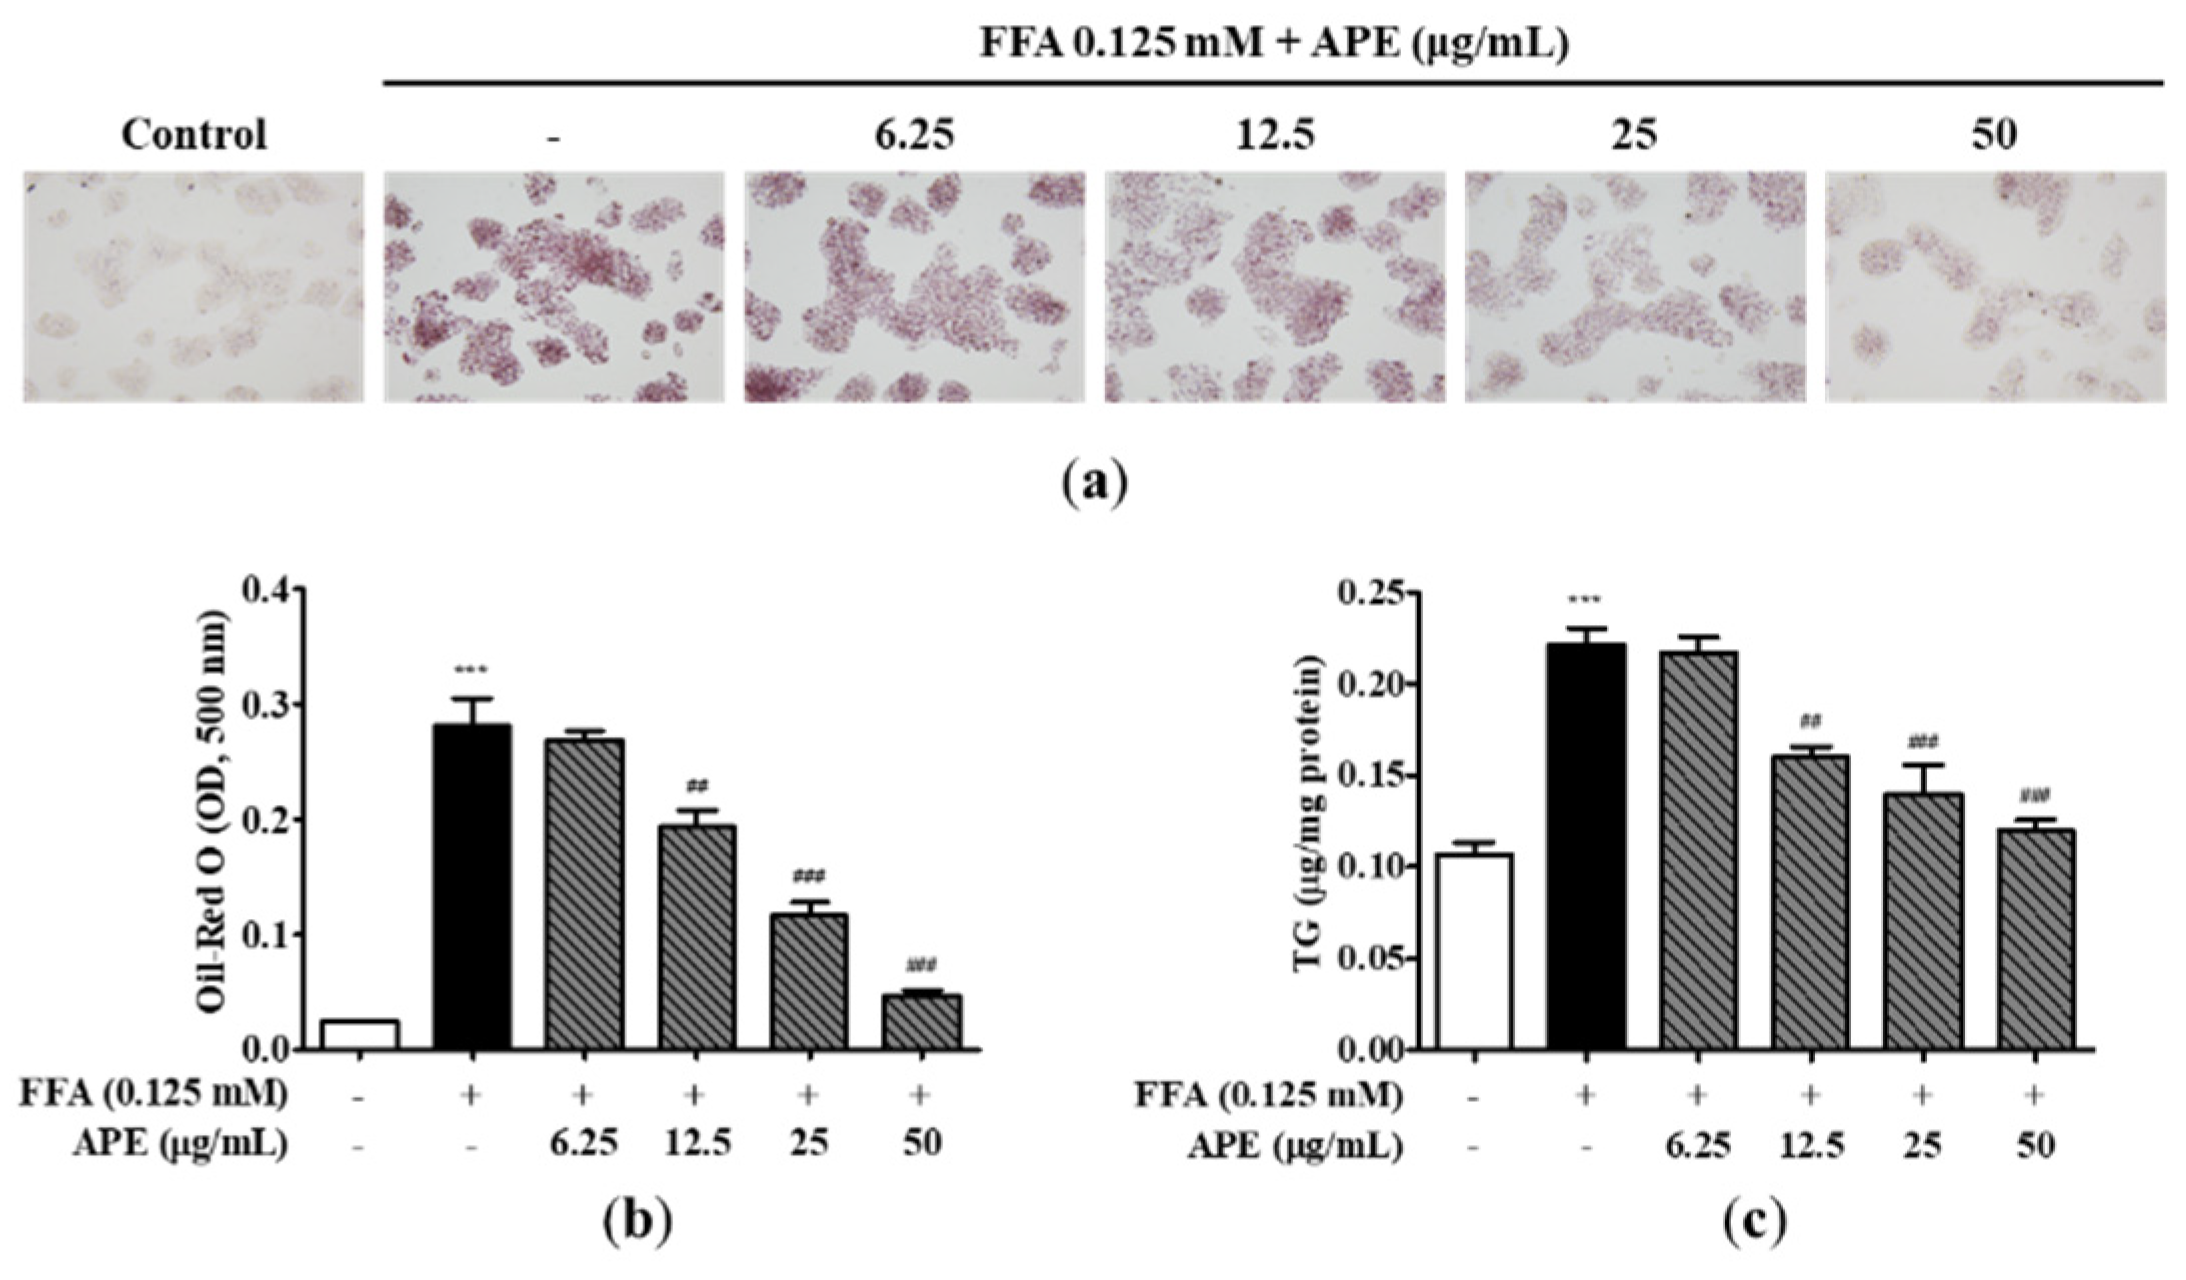
Figure 3.
Effects of APE on intracellular lipid accumulation in HepG2 cells. HepG2 cells were initially pre-treated with the indicated concentrations of APE (0, 6.25, 12.5, 25, 50 μg/mL) for 2 h, followed by a 24 h treatment with 0.125 mM FFA. Cells were stained with Oil-Red O; (a) accumulation of lipid droplets were visualized using a microscope (200x magnification), and (b) Oil-Red O absorption was quantified by assessing the optical density at 500 nm. (c) Intracellular TG contents were analyzed with a TG quantification kit. The data are presented as the mean ± SD. *** p < 0.001 vs. the control group; ## p < 0.01, ### p < 0.001 vs. the group treated with FFA alone.
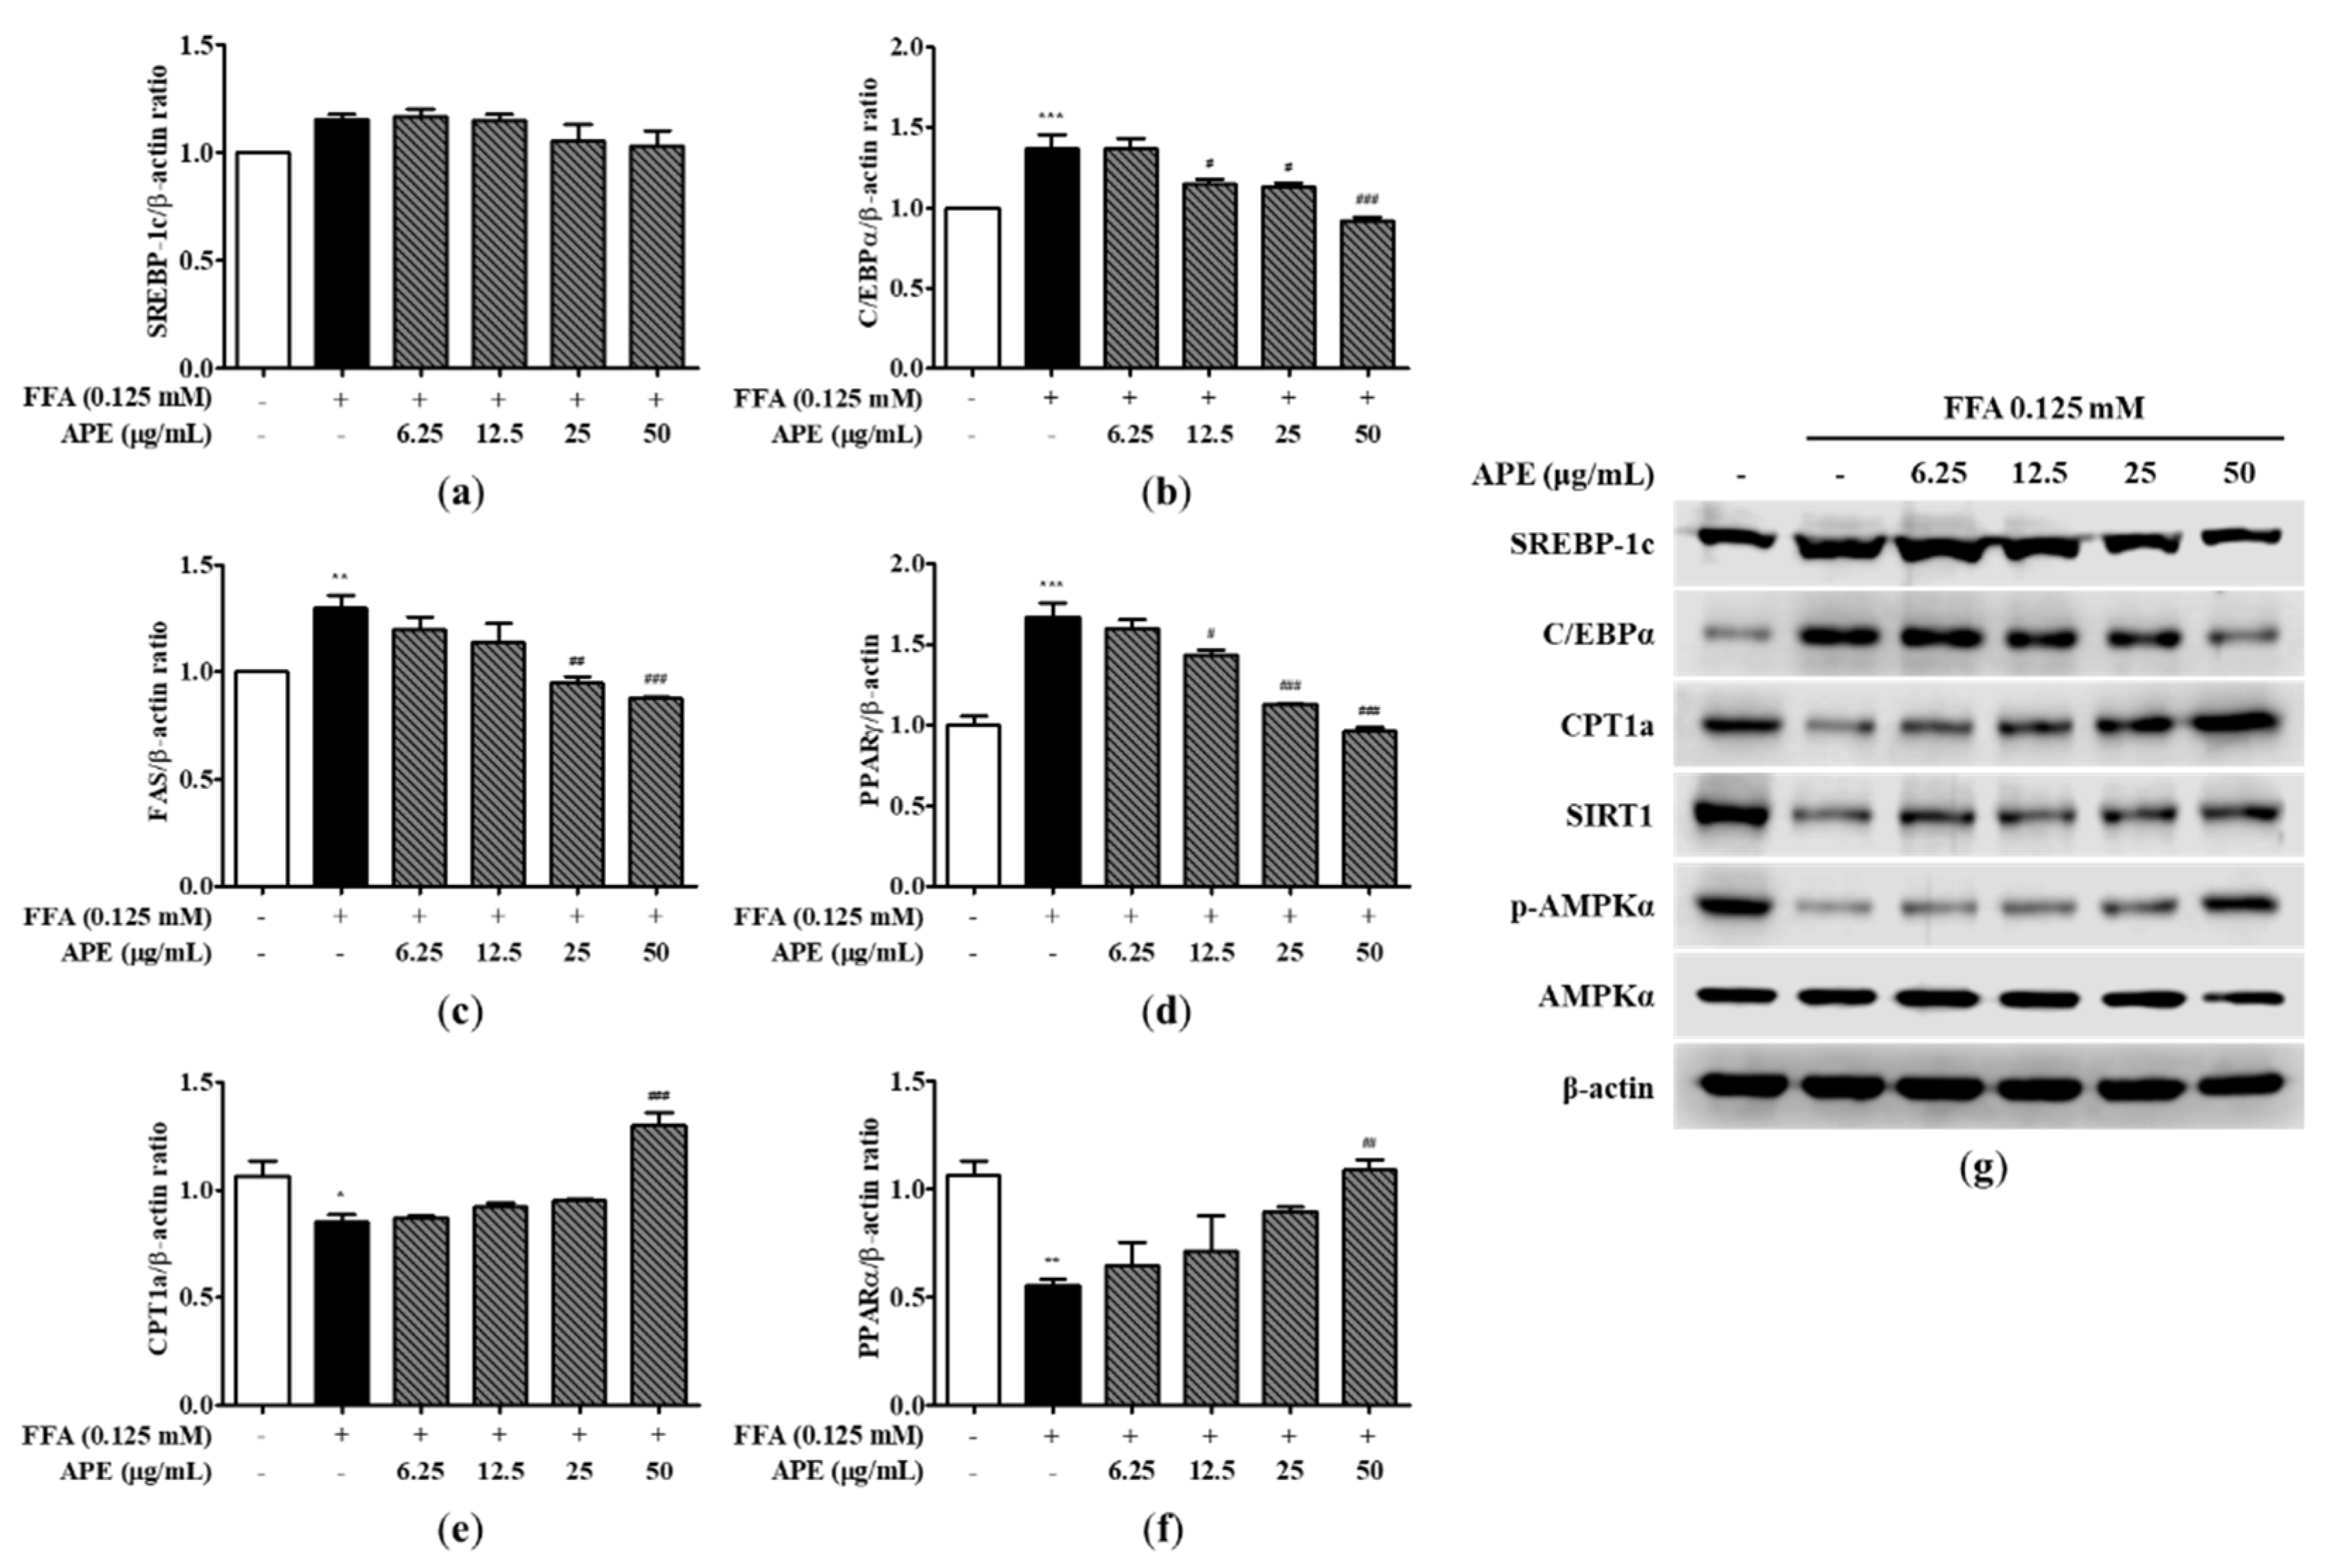
Figure 4.
Effect of APE on the expression of lipid metabolism-related genes and proteins in HepG2 cells. mRNA expression levels of (a) SREBP-1c, (b) C/EBPα, (c) FAS, (d) PPARγ, (e) CPT1a, and (f) PPARα were analyzed using quantitative real-time PCR and normalized to β-actin. (g) Protein expression levels of SREBP-1c, C/EBPα, CPT1a, SIRT1, phosphorylated-AMPKα, and AMPKα were determined using western blot analysis. The data are presented as the mean ± SD. * p < 0.05, ** p < 0.01, *** p < 0.001 vs. the control group; # p < 0.05, ## p < 0.01, ### p < 0.001 vs. the group treated with FFA alone.
Figure 5.
Effects of APE on mouse body weight and liver weight in a CDAHFD-induced NASH mouse model. (a) Body weight of mice in the CON (normal diet and vehicle), NASH (CDAHFD and vehicle), APE (CDAHFD and 25, 50, 100 mg/kg of APE), Sily (CDAHFD and 100 mg/kg of silymarin), and Lute (CDAHFD and 20 mg/kg of luteolin) groups over the course of 12 weeks. (b) Representative morphology of liver tissues. (c) Ratios of liver weight to body weight. The data are presented as the mean ± SD. ** p < 0.01, *** p < 0.001 vs. the CON group; # p < 0.05 vs. the NASH group.
Figure 6.
Effect of APE on hepatic steatosis and serum markers of liver injury in a CDAHFD-induced NASH mouse model. (a) Representative histological images stained with H&E (200x magnification). Serum levels of (b) ALT and (c) AST. The data are presented as the mean ± SD. *** p < 0.001 vs. the CON group, # p < 0.05, ## p < 0.01, ### p < 0.001 vs. the NASH group.
Figure 7.
Effect of APE on histopathology and immunohistochemistry of the liver in a CDAHFD-induced NASH mouse model. (a) Representative images of immunohistochemical staining for F4/80 (200x magnification). (b) Quantification of the positive areas of F4/80. (c) Representative images of Sirius Red staining and immunohistochemical staining of COLⅠ and COLⅤ (200x magnification). (d) Quantification of the positive areas of Sirius Red staining. The data are presented as the mean ± SD. *** p < 0.001 vs. the CON group, ### p < 0.001 vs. the NASH group.
Figure 8.
Effects of APE on the expression of lipid metabolism-related genes and proteins in a CDAHFD-induced NASH mouse model. mRNA expression levels of (a) SREBP-1c, (b) PPARγ, (c) CPT1a, (d) PPARα, (e) ApoB, and (f) MTTP were analyzed via quantitative real-time PCR and normalized to β-actin. (g) Protein expression levels of SREBP-1c, C/EBPα, CPT1a, SIRT1, phosphorylated-AMPKα, and AMPKα were determined via western blot analysis. The data are presented as the mean ± SD. ** p < 0.01, *** p < 0.001 vs. the CON group, # p < 0.05, ## p < 0.01 vs. the NASH group.
Figure 9.
Effects of APE on the expression of inflammatory factors in a CDAHFD-induced NASH mouse model. mRNA expression levels of (a) F4/80, (b) YM-1, (c) MCP-1, (d) MIP-2, (e) IL-6, (f) TNF-α, and (g) COX-2 were analyzed via quantitative real-time PCR and normalized to β-actin. (h) The protein expression level of COX-2 was determined via western blot analysis. The data are presented as the mean ± SD. ** p < 0.01, *** p < 0.001 vs. the CON group, # p < 0.05, ## p < 0.01, ### p < 0.001 vs. the NASH group.
Figure 10.
Effects of APE on the expression of fibrosis-related proteins in a CDAHFD-induced NASH mouse model. mRNA expression levels of (a) α-SMA, (b) COL1A1, (c) desmin, and (d) TGF-β1 were analyzed via quantitative real-time PCR and normalized to β-actin. (e) Protein expression level of α-SMA was determined via western blot analysis. The data are presented as the mean ± SD. *** p < 0.001 vs. the CON group, ### p < 0.001 vs. the NASH group.
Figure 11.
Effect of APE on the expression of oxidative stress and ER stress in a CDAHFD-induced NASH mouse model. mRNA expression levels of (a) HO-1, (b) NOX2, (c) NOXA2, (d) NQO1, (f) GADD 153, (g) GPR-78, and (h) XBP-1 were analyzed via quantitative real-time PCR and normalized to β-actin. (e) Protein expression levels of Nrf2 and HO-1 were determined via western blot analysis. The data are presented as the mean ± SD. *** p < 0.001 vs. the CON group, # p < 0.05, ## p < 0.01, ### p < 0.001 vs. the NASH group.
Table 1.
Real-time PCR primers used in this study.
Table 1.
Real-time PCR primers used in this study.
| Genes |
Forward primer |
Reverse primer |
| human |
|
|
| hSREBP-1c |
GCGCCTTGACAGGTGAAGTC |
GCCAGGGAAGTCACTGTCTTG |
| hC/EBPα |
TGGACAAGAACAGCAACGAGTA |
ATTGTCACTGGTCAGCTCCAG |
| hFAS |
CCCCTGATGAAGAAGGATCA |
ACTCCACAGGTGGGAACAAG |
| hPPARγ |
TGCAGGTGATCAAGAAGACG |
AGTGCAACTGGAAGAAGGGA |
| hCPT1a |
CCTCCGTAGCTGACTCGGTA |
GGAGTGACCGTGAACTGAAA |
| hPPARα |
ACGATTCGACTCAAGCTGGT |
GTTGTGTGACATCCCGACAG |
| |
|
|
| mouse |
|
|
| mSREBP-1c |
GCTACCGGTCTTCTATCAATG |
GCAAGAAGCGGATGTAGTC |
| mPPARγ |
AGGCCGAGAAGGAGAAGCTGTTG |
TGGCCACCTCTTTGCTCTGCTC |
| mCPT1a |
TCCACCCTGAGGCATCTATT |
ATGACCTCCTGGCATTCTCC |
| mPPARα |
AGAGCCCCATCTGTCCTCTC |
ACTGGTAGTCTGCAAAACCAAA |
| mApoB |
GGACTGTCTGACTTCCATATTC |
AAGACTTGCCACCCAAAG |
| mMTTP |
TCTCACAGTACCCGTTCTT |
TCTTCTCCGAGAGACATATCC |
| mF4/80 |
CAACACTCTCGGAAGCTATTAT |
GAATTCCTGGAGCACTCATC |
| mYM-1 |
TCTGGTGAAGGAAATGCGTA |
AATGATTCCTGCTCCTGTGG |
| mMCP-1 |
TGCTTCTGGGCCTGCTGTTC |
ACCTGCTGCTGGTGATCCTCT |
| mMIP-2 |
CACTGCGCCCAGACAGAAGT |
GGGCTTCAGGGTCAAGGCAA |
| mIL-6 |
TAGTCCTTCCTACCCCAATTTCC |
TTGGTCCTTAGCCACTCCTTC |
| mTNF-α |
GCTGAGCTCAAACCCTGGTA |
AGTACTTGGGCAGATTGACCT |
| mCOX-2 |
GCCTACTACAAGTGTTTCTTTTTGCA |
CATTTTGTTTGATTGTTCACACCAT |
| mα-SMA |
CTGACAGAGGCACCACTGAA |
GAAGGAATAGCCACGCTCAG |
| mCol1a1 |
TCCTCCAGGGATCCAACGA |
GGCAGGCGGGAGGTCTT |
| mDesmin |
TACACCTGCGAGATTGATGC |
ACATCCAAGGCCATCTTCAC |
| mTGF-β1 |
TTGCTTCAGCTCCACAGAGA |
TGGTTGTAGAGGGCAAGGAC |
| mHO-1 |
CACGCATATACCCGCTACCT |
CCAGAGTGTTCATTCGAGCA |
| mNOX2 |
TGGACGGCCCAACTGGGATA |
CAAGGCTTCAGGGCCACACA |
| mNOXA2 |
CCGAGCAGGCCTTCACCAAA |
TCCCACGAAGCTGCGTCAAG |
| mNQO1 |
TTCCCATTGCAGTGGTTTGG |
CTGCTACGAGCACTCTCTCA |
| mGADD 153 |
CTGGAAGCCTGGTATGAGGAT |
CAGGGTCAAGAGTAGTGAAGGT |
| mGPR-78 |
CGAAGGGATCATCTGCTATTAC |
CTTCATAGTCCTGCCCATTG |
| mXBP-1 |
TCCGCAGCACTCAGACTATG |
ACAGGGTCCAACTTGTCCAG |
