Submitted:
06 September 2023
Posted:
11 September 2023
Read the latest preprint version here
Abstract
Keywords:
1. Introduction
2. Materials and Methods
2.1. Preparation of oil extracts
2.2. Determination of total phenolics content (TPC)
2.3. Determination of total flavonoids content (TFC)
2.4. Determinations of antioxidant capacity
2.4.1. DPPH radical scavenging assay
2.4.2. Ferric reducing antioxidant power (FRAP)
2.4.3. ABTS radical scavenging assay
2.5. Cell culture
2.6. Cell treatments and viability assay
2.7. Localization and quantification of cellular ROS by Fluorescence Microscopy (FM)
2.8. Detection of intracellular lipid droplets by Nile Red staining
2.9. Preparation of cell extracts
2.10. Protein assay
2.11. Total superoxide dismutase (SOD) activity measurement
2.12. Catalase (CAT) activity measurement
2.13. Glutathione peroxidase (GPX) activity measurement
2.14. Determination of the level of glutathione (GSH)
2.15. Lipid peroxidation measurement
2.16. FM Immunolocalization of SOD, CAT and GPX
2.17. Statistical Analysis
3. Results
3.1. Total polyphenols and flavonoids content
3.2. Antioxidant activity and free radical scavenging capacity
3.2.1. DPPH• radical scavenging activity
3.2.2. FRAP assay
3.2.3. ABTS•+ radical cation scavenging activity
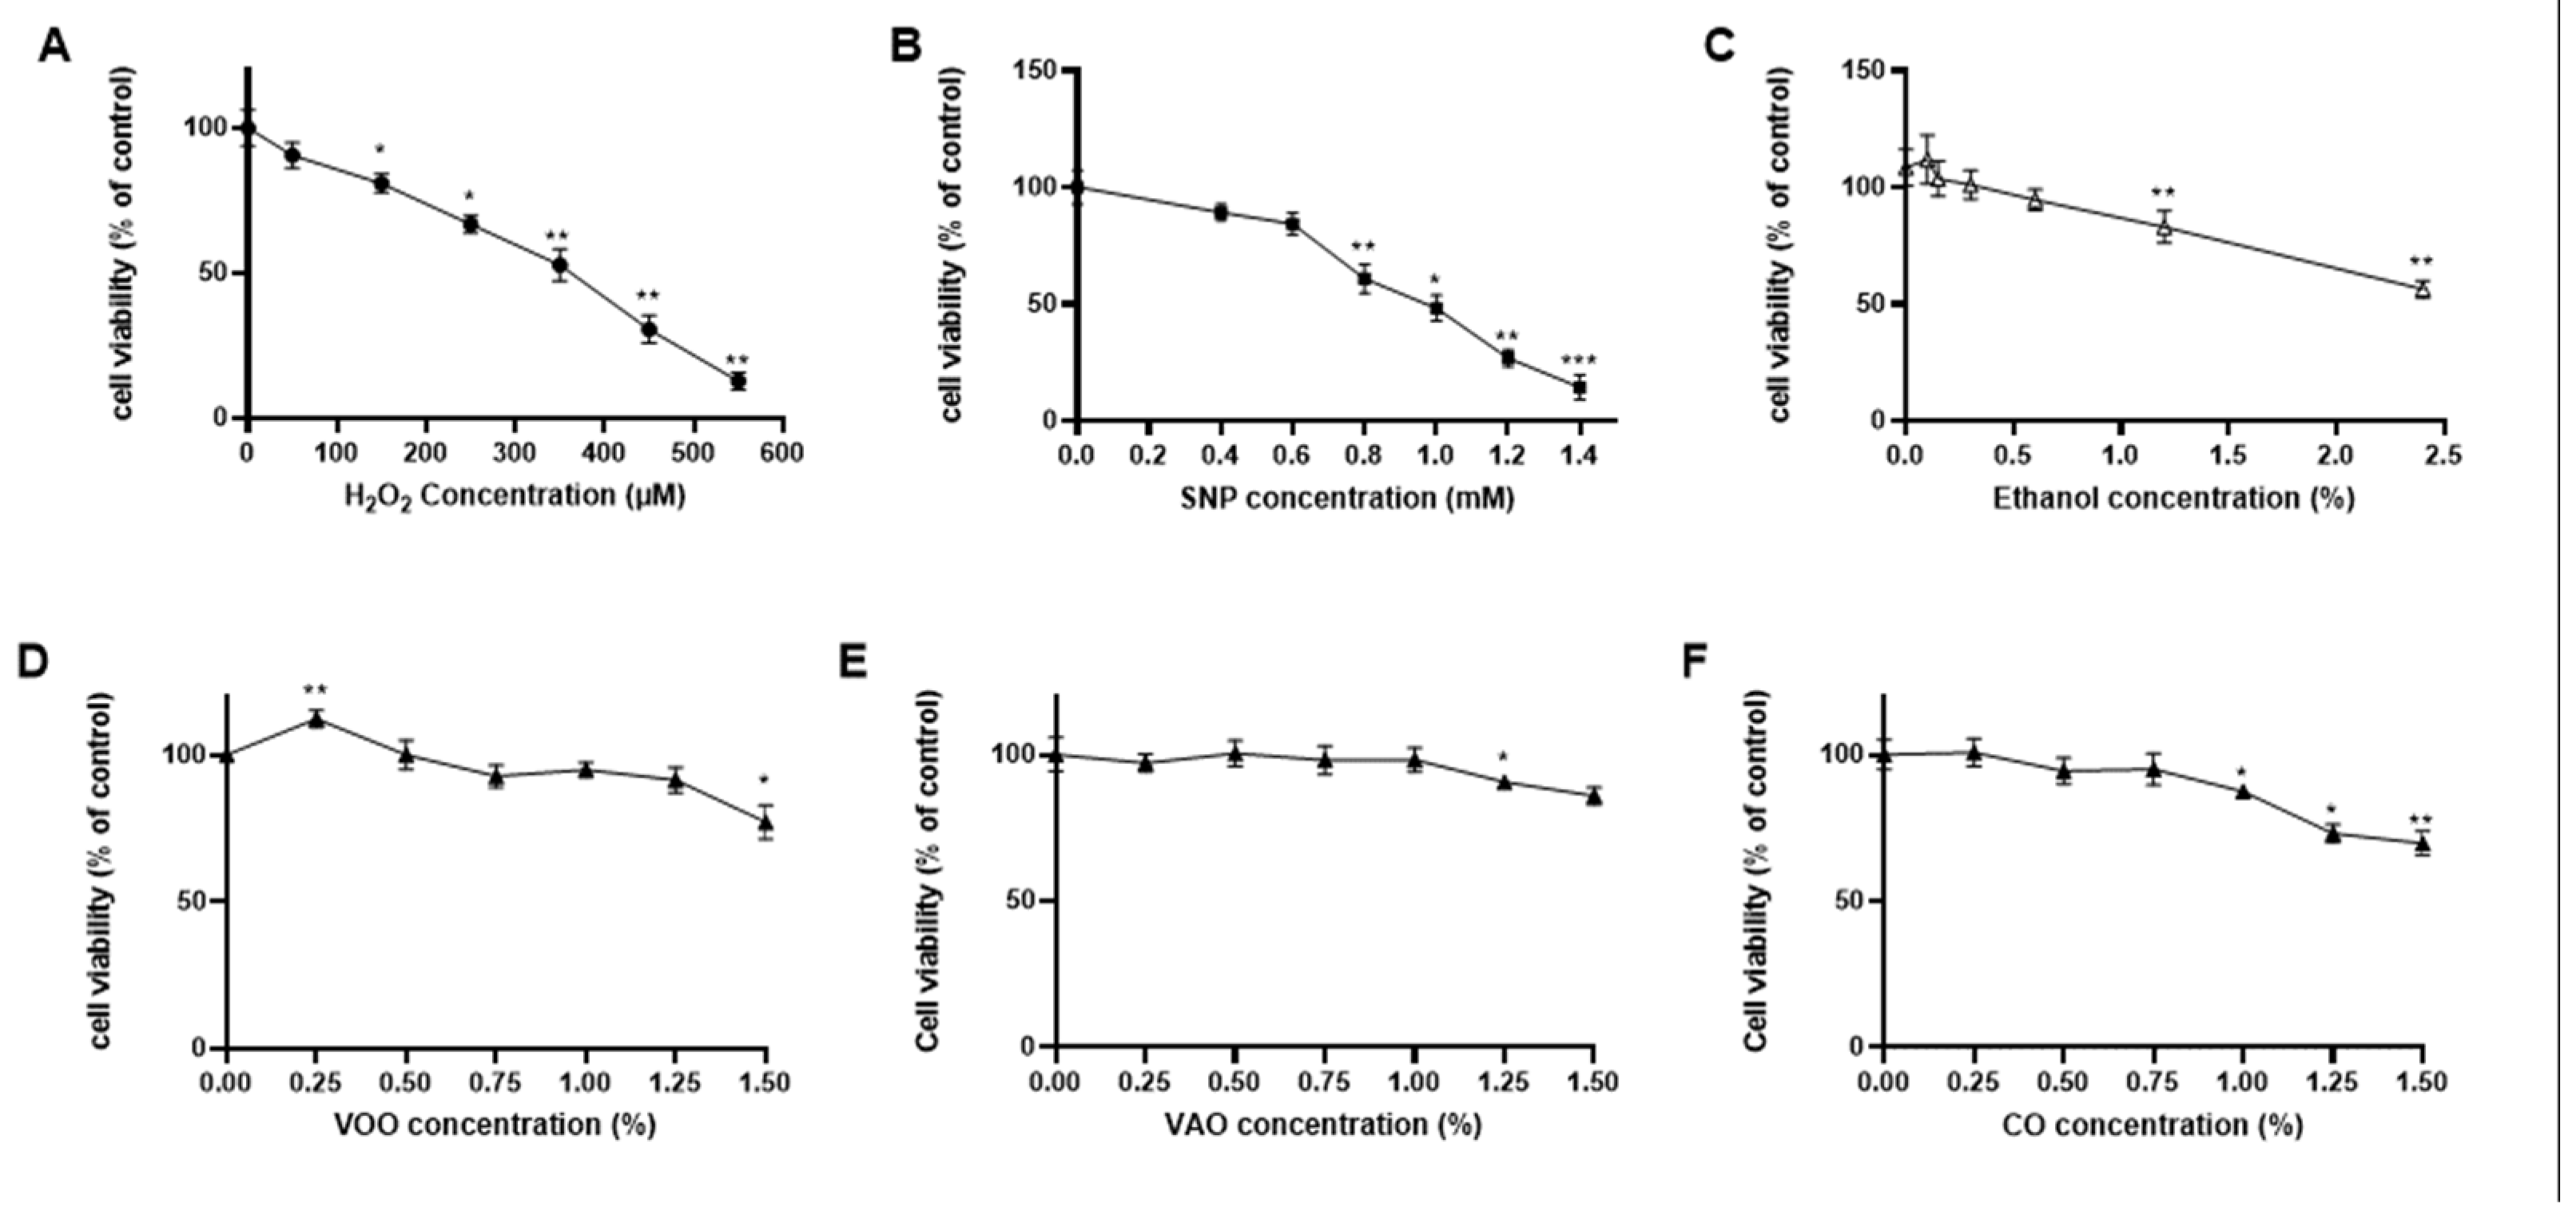
3.2.4. Determination of potential cytotoxic effects of the treatments
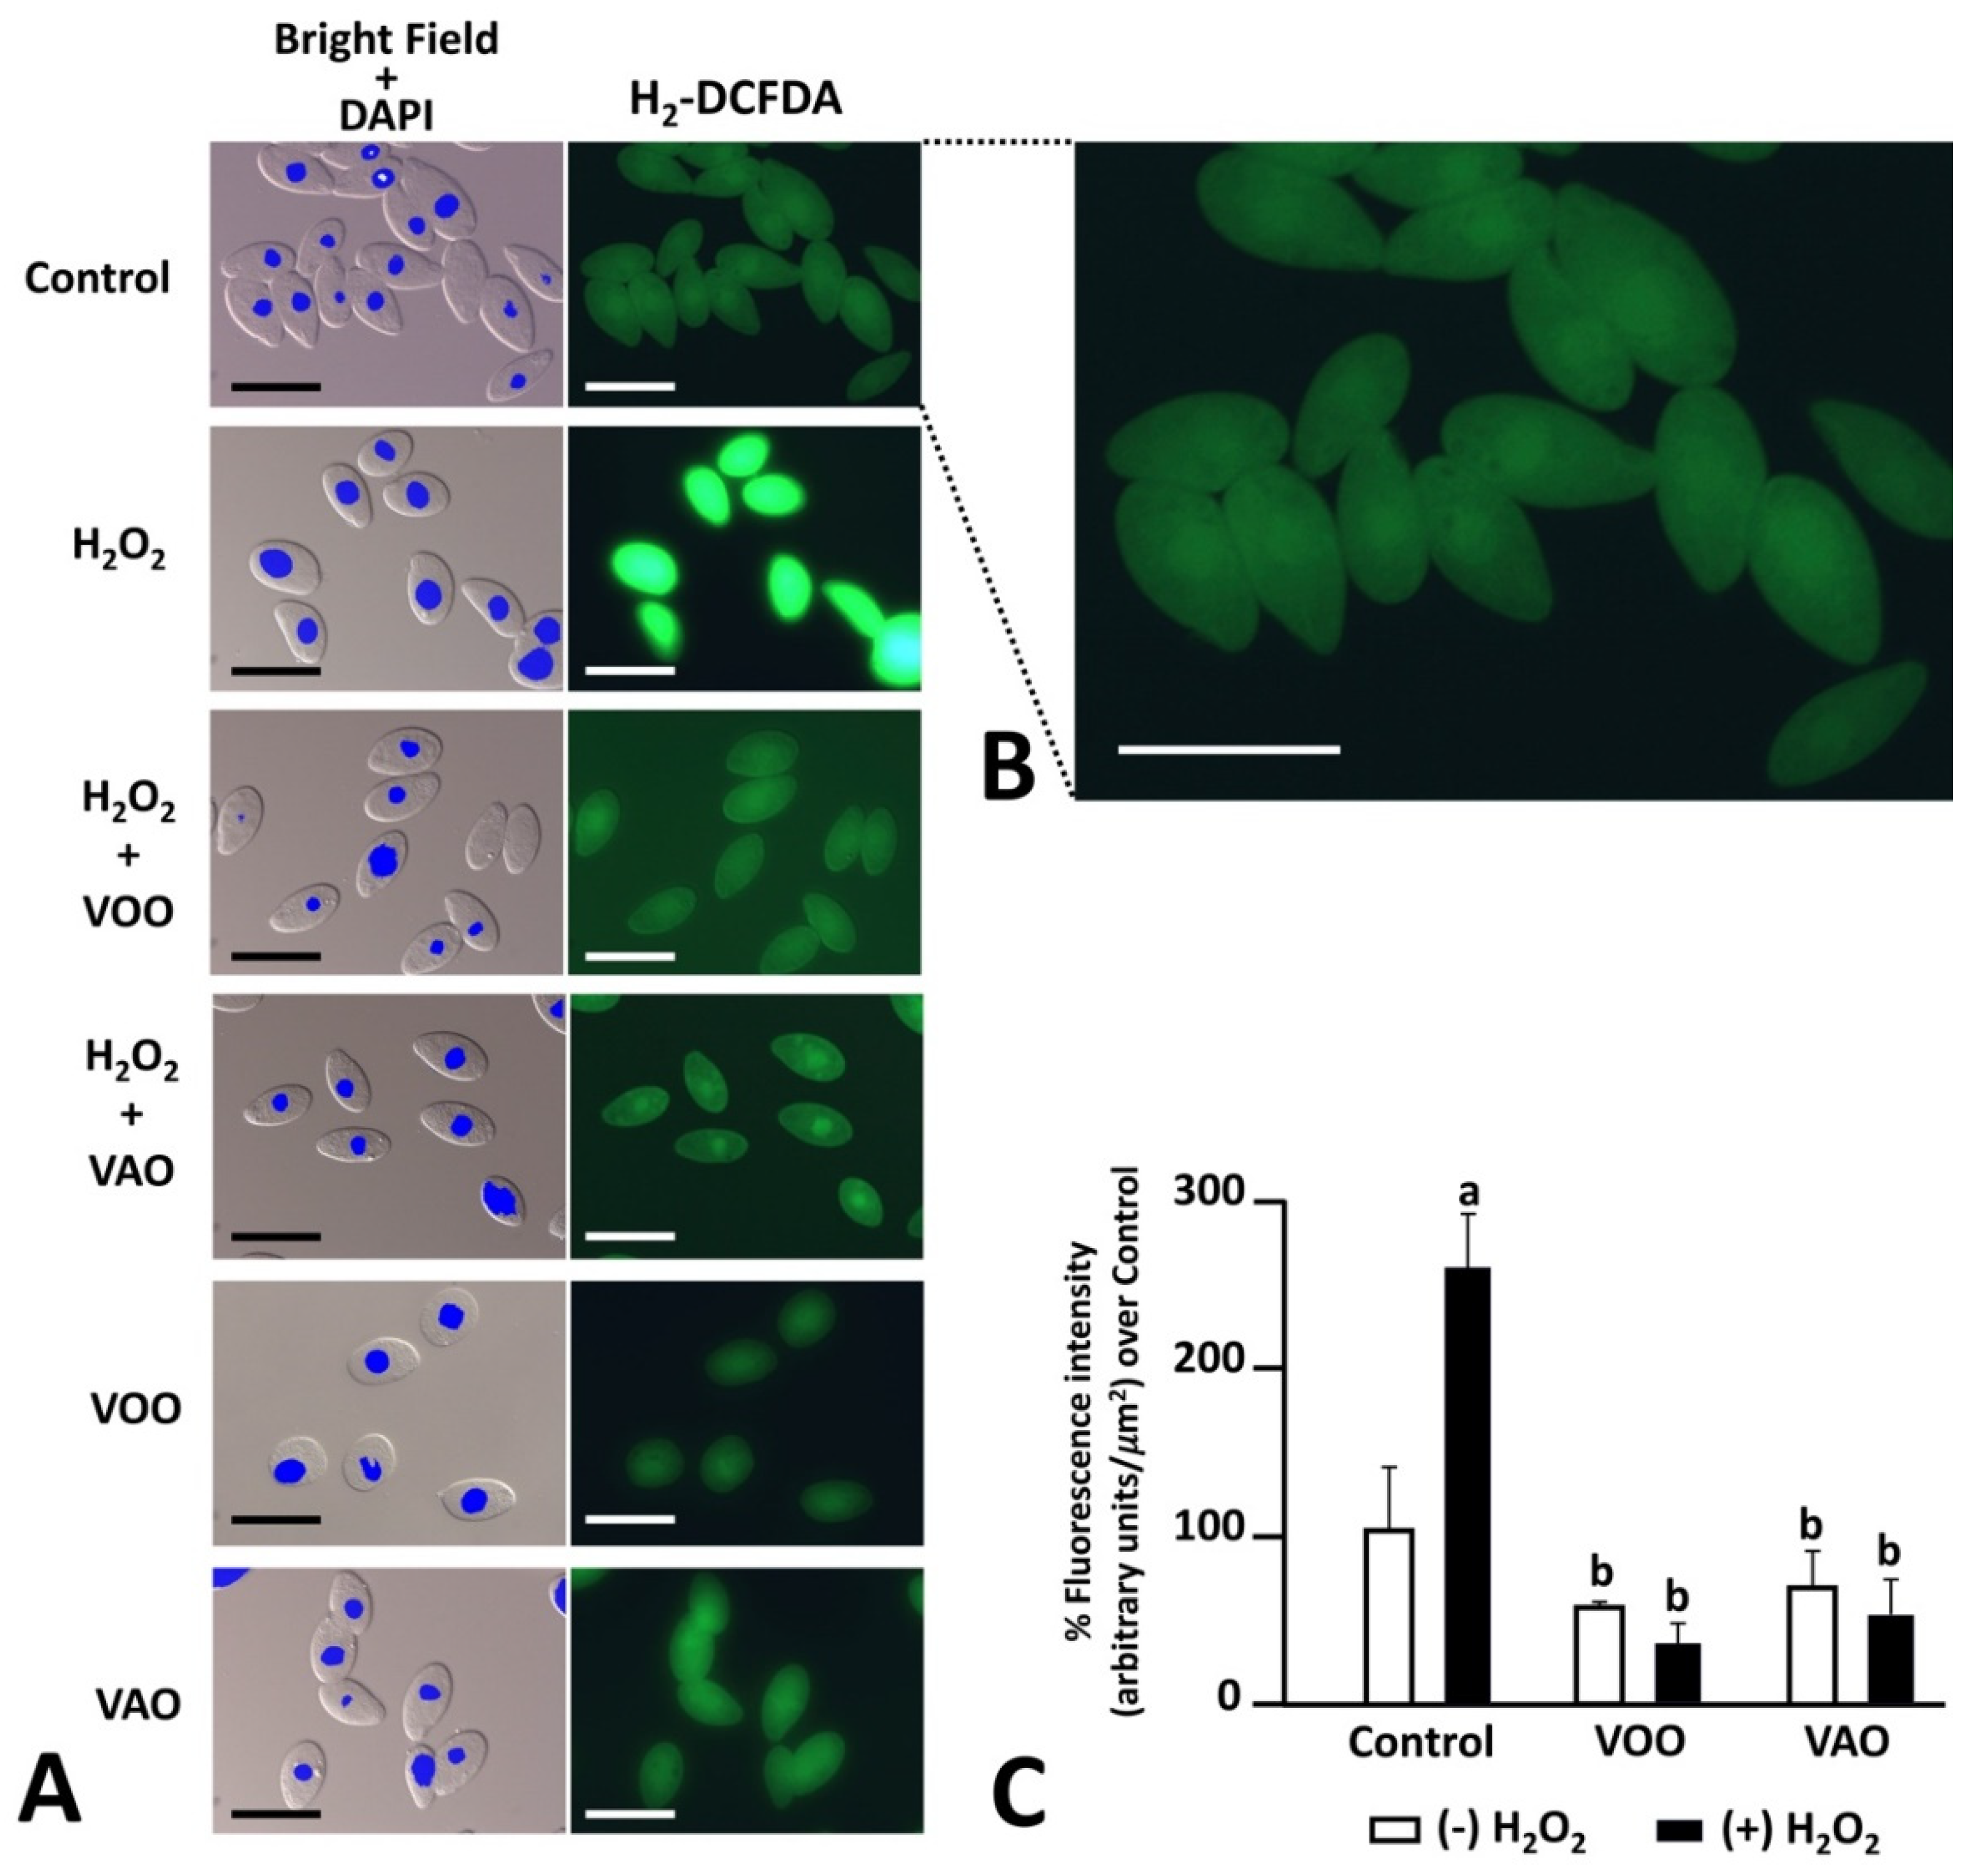
3.2.5. Fluorescence detection of ROS by H2-DCFDA in challenged cultures
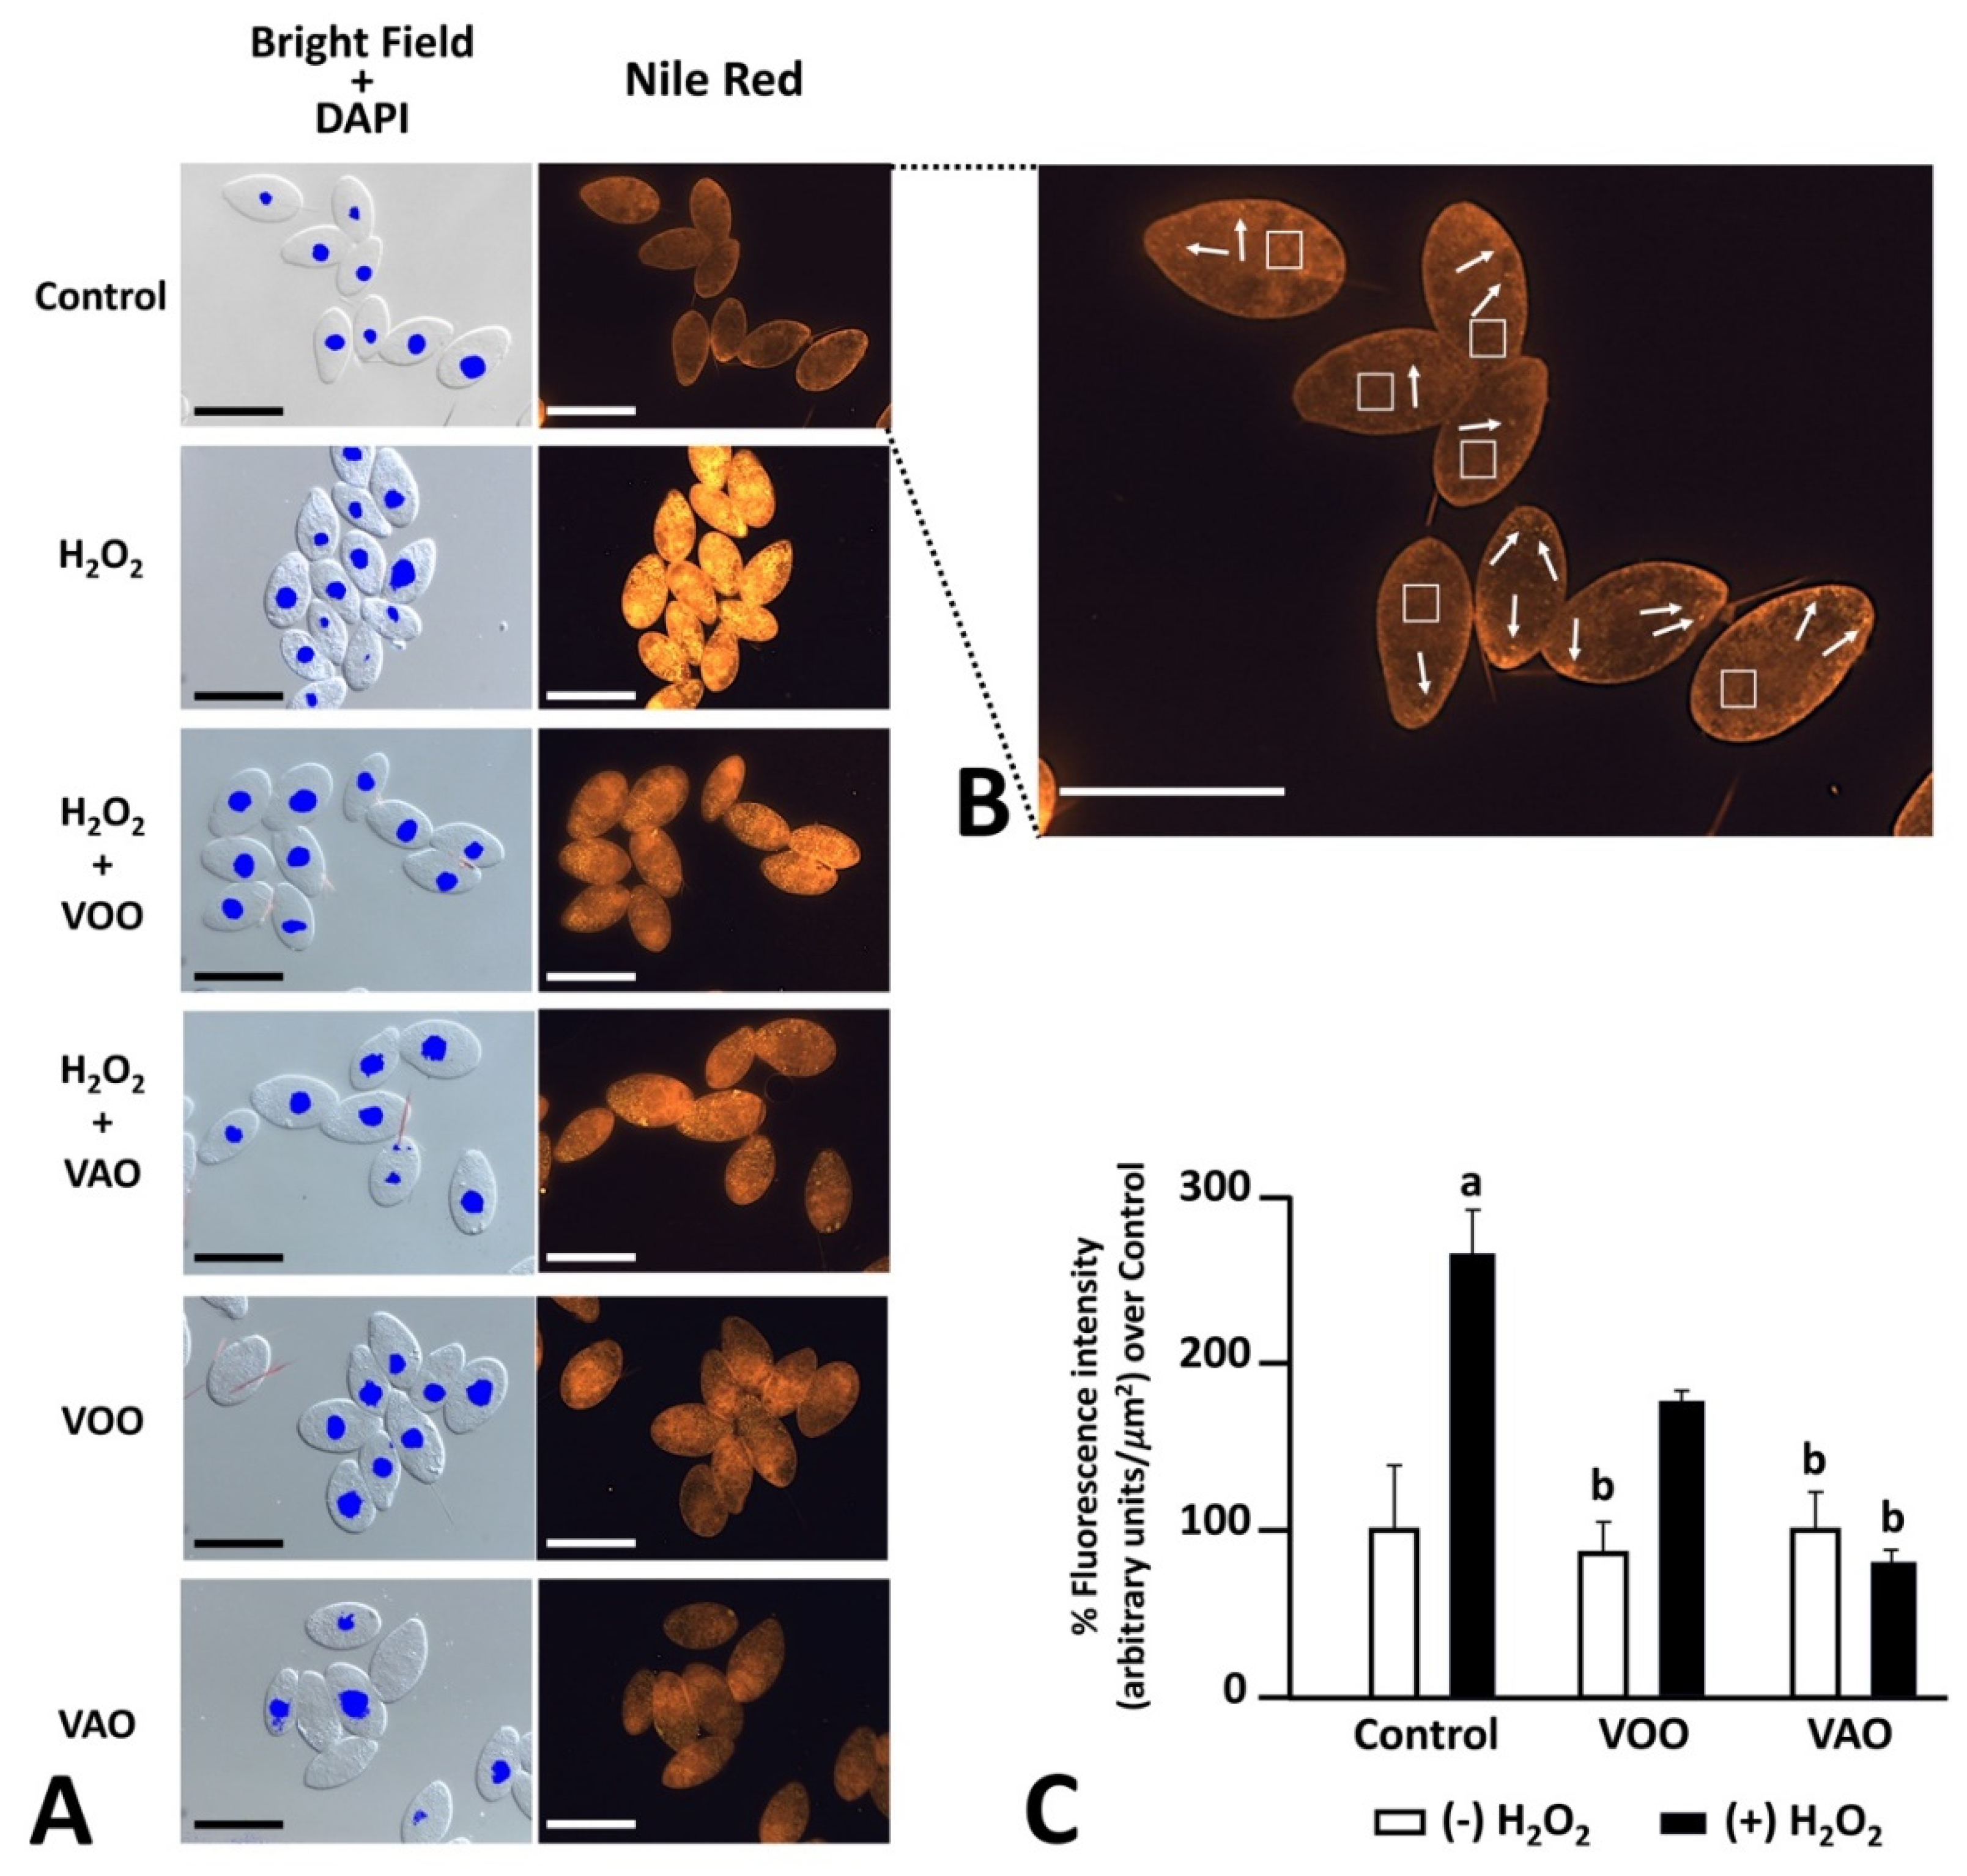
3.2.6. Effects of oxidative treatments on the presence of lipids and lipid droplets
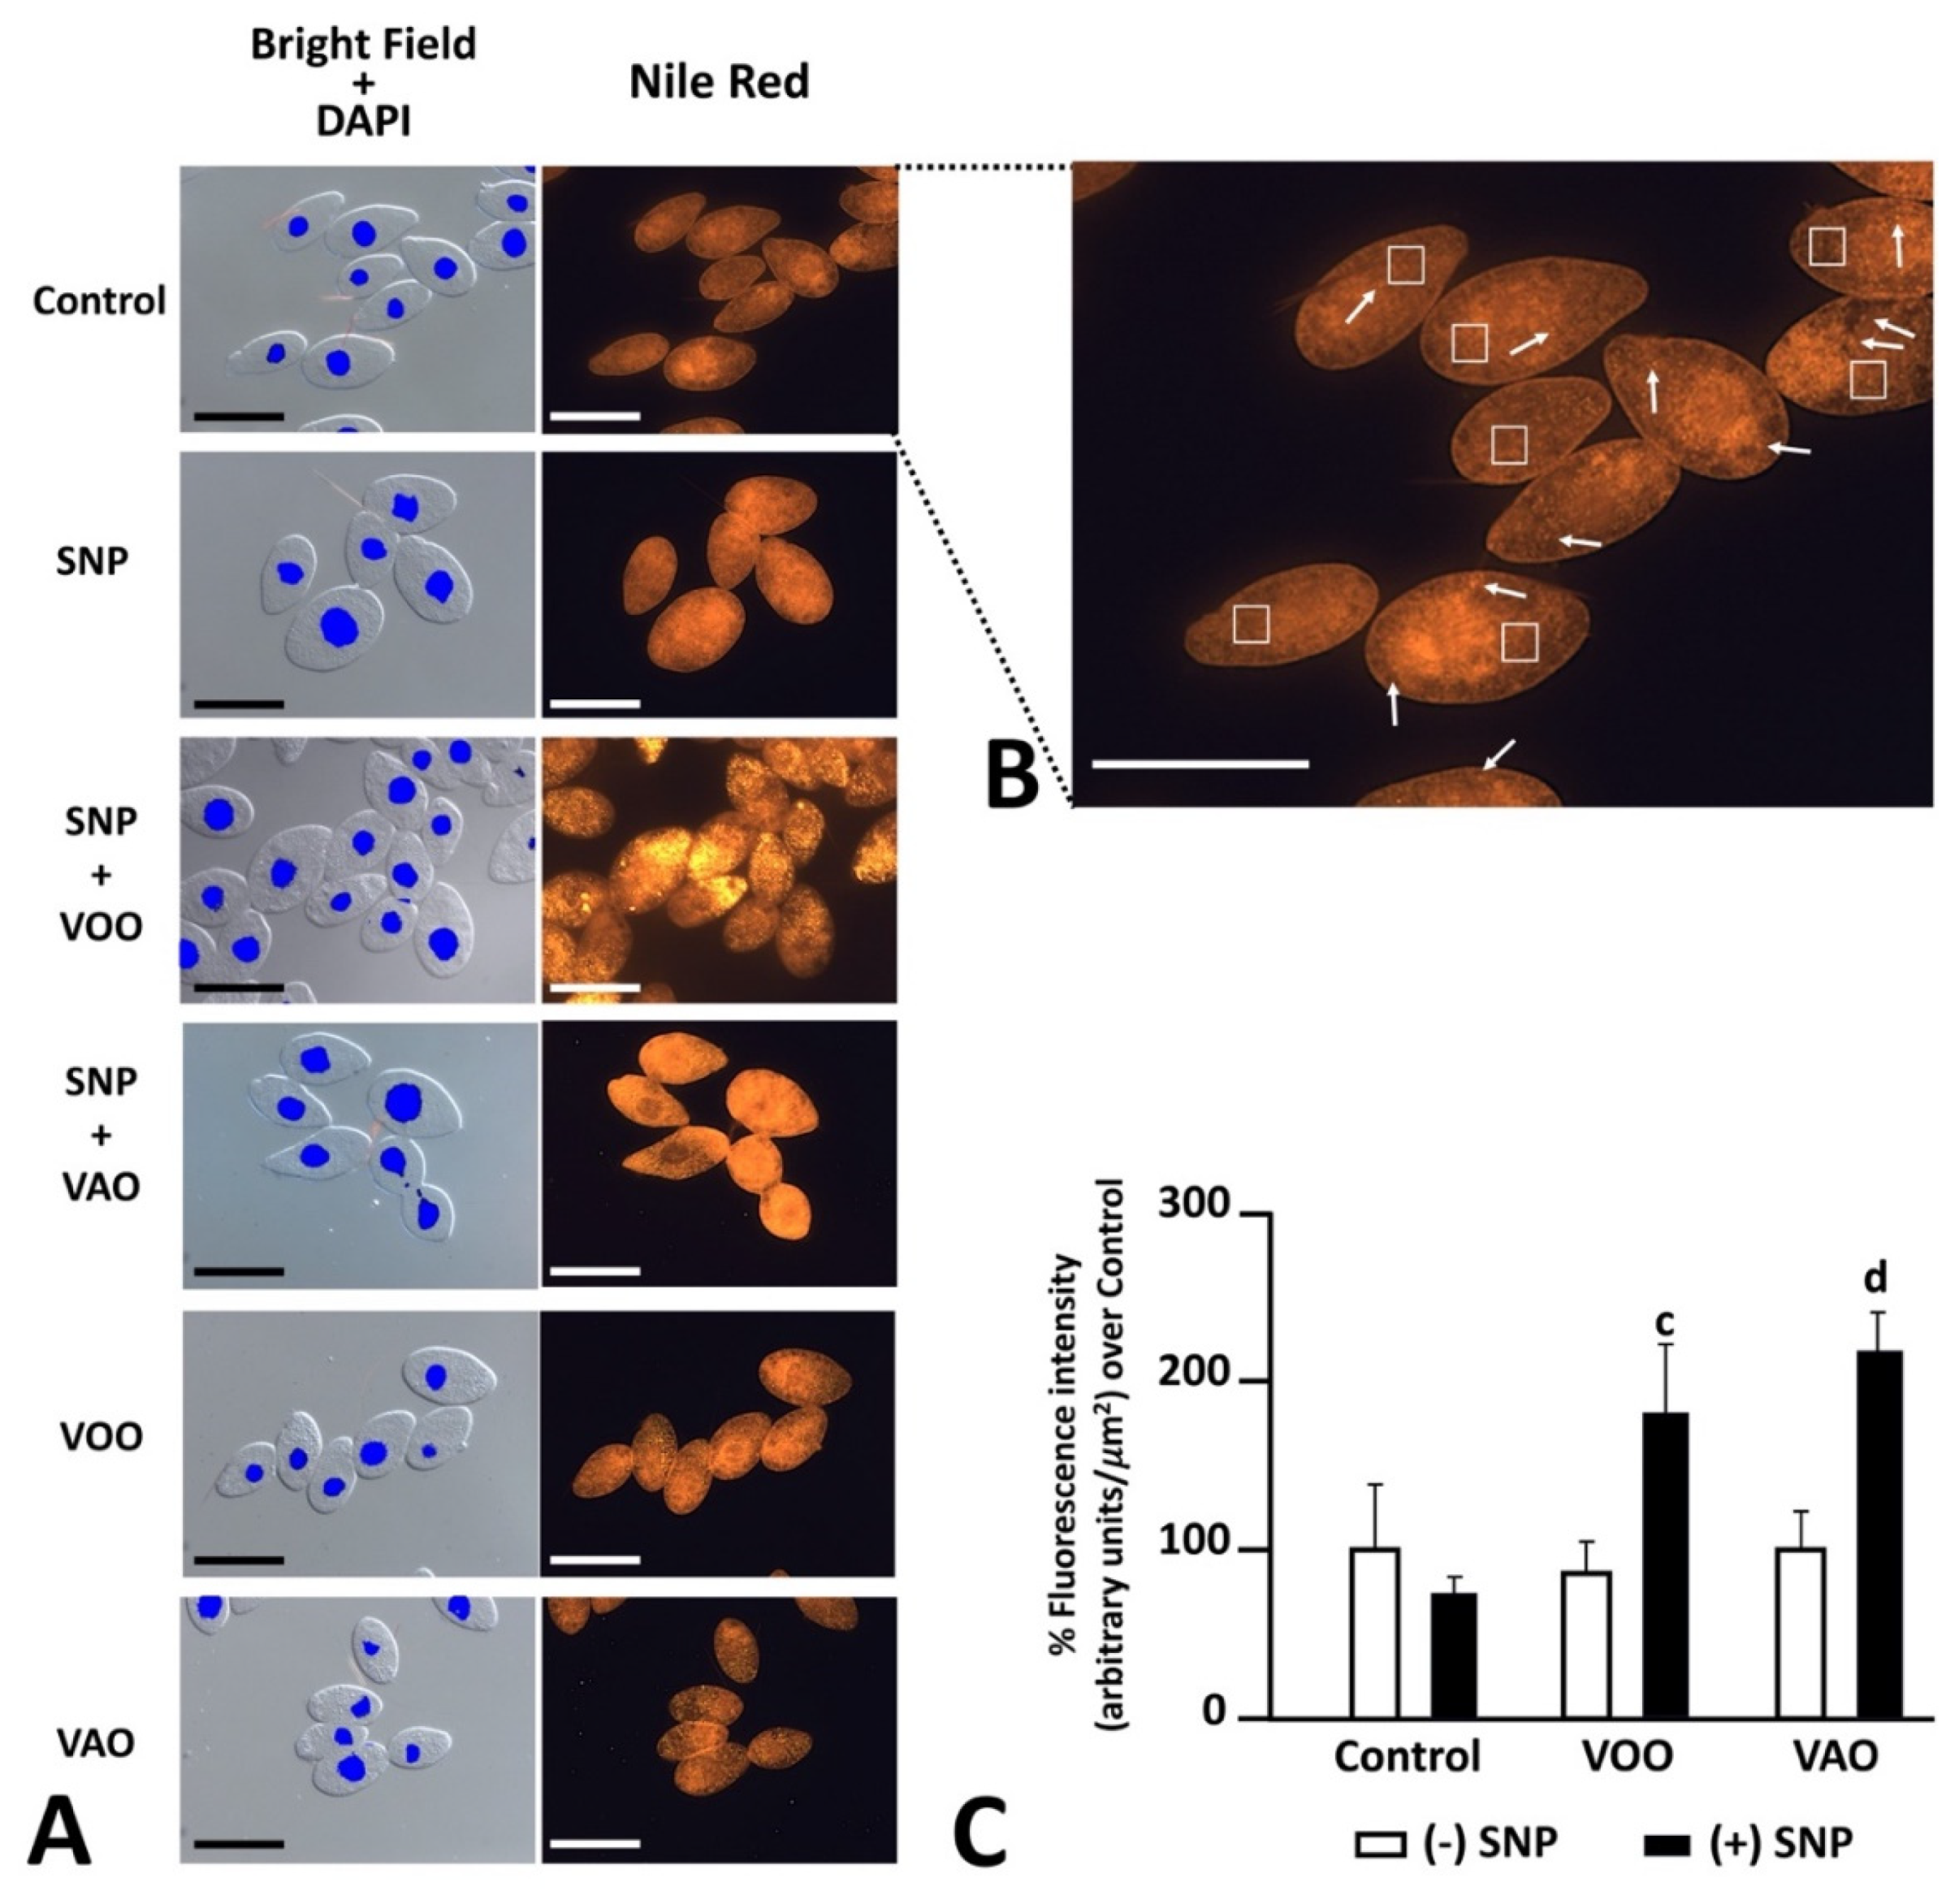
3.2.7. Effects of nitrosative treatments on the presence of lipids and lipid droplets
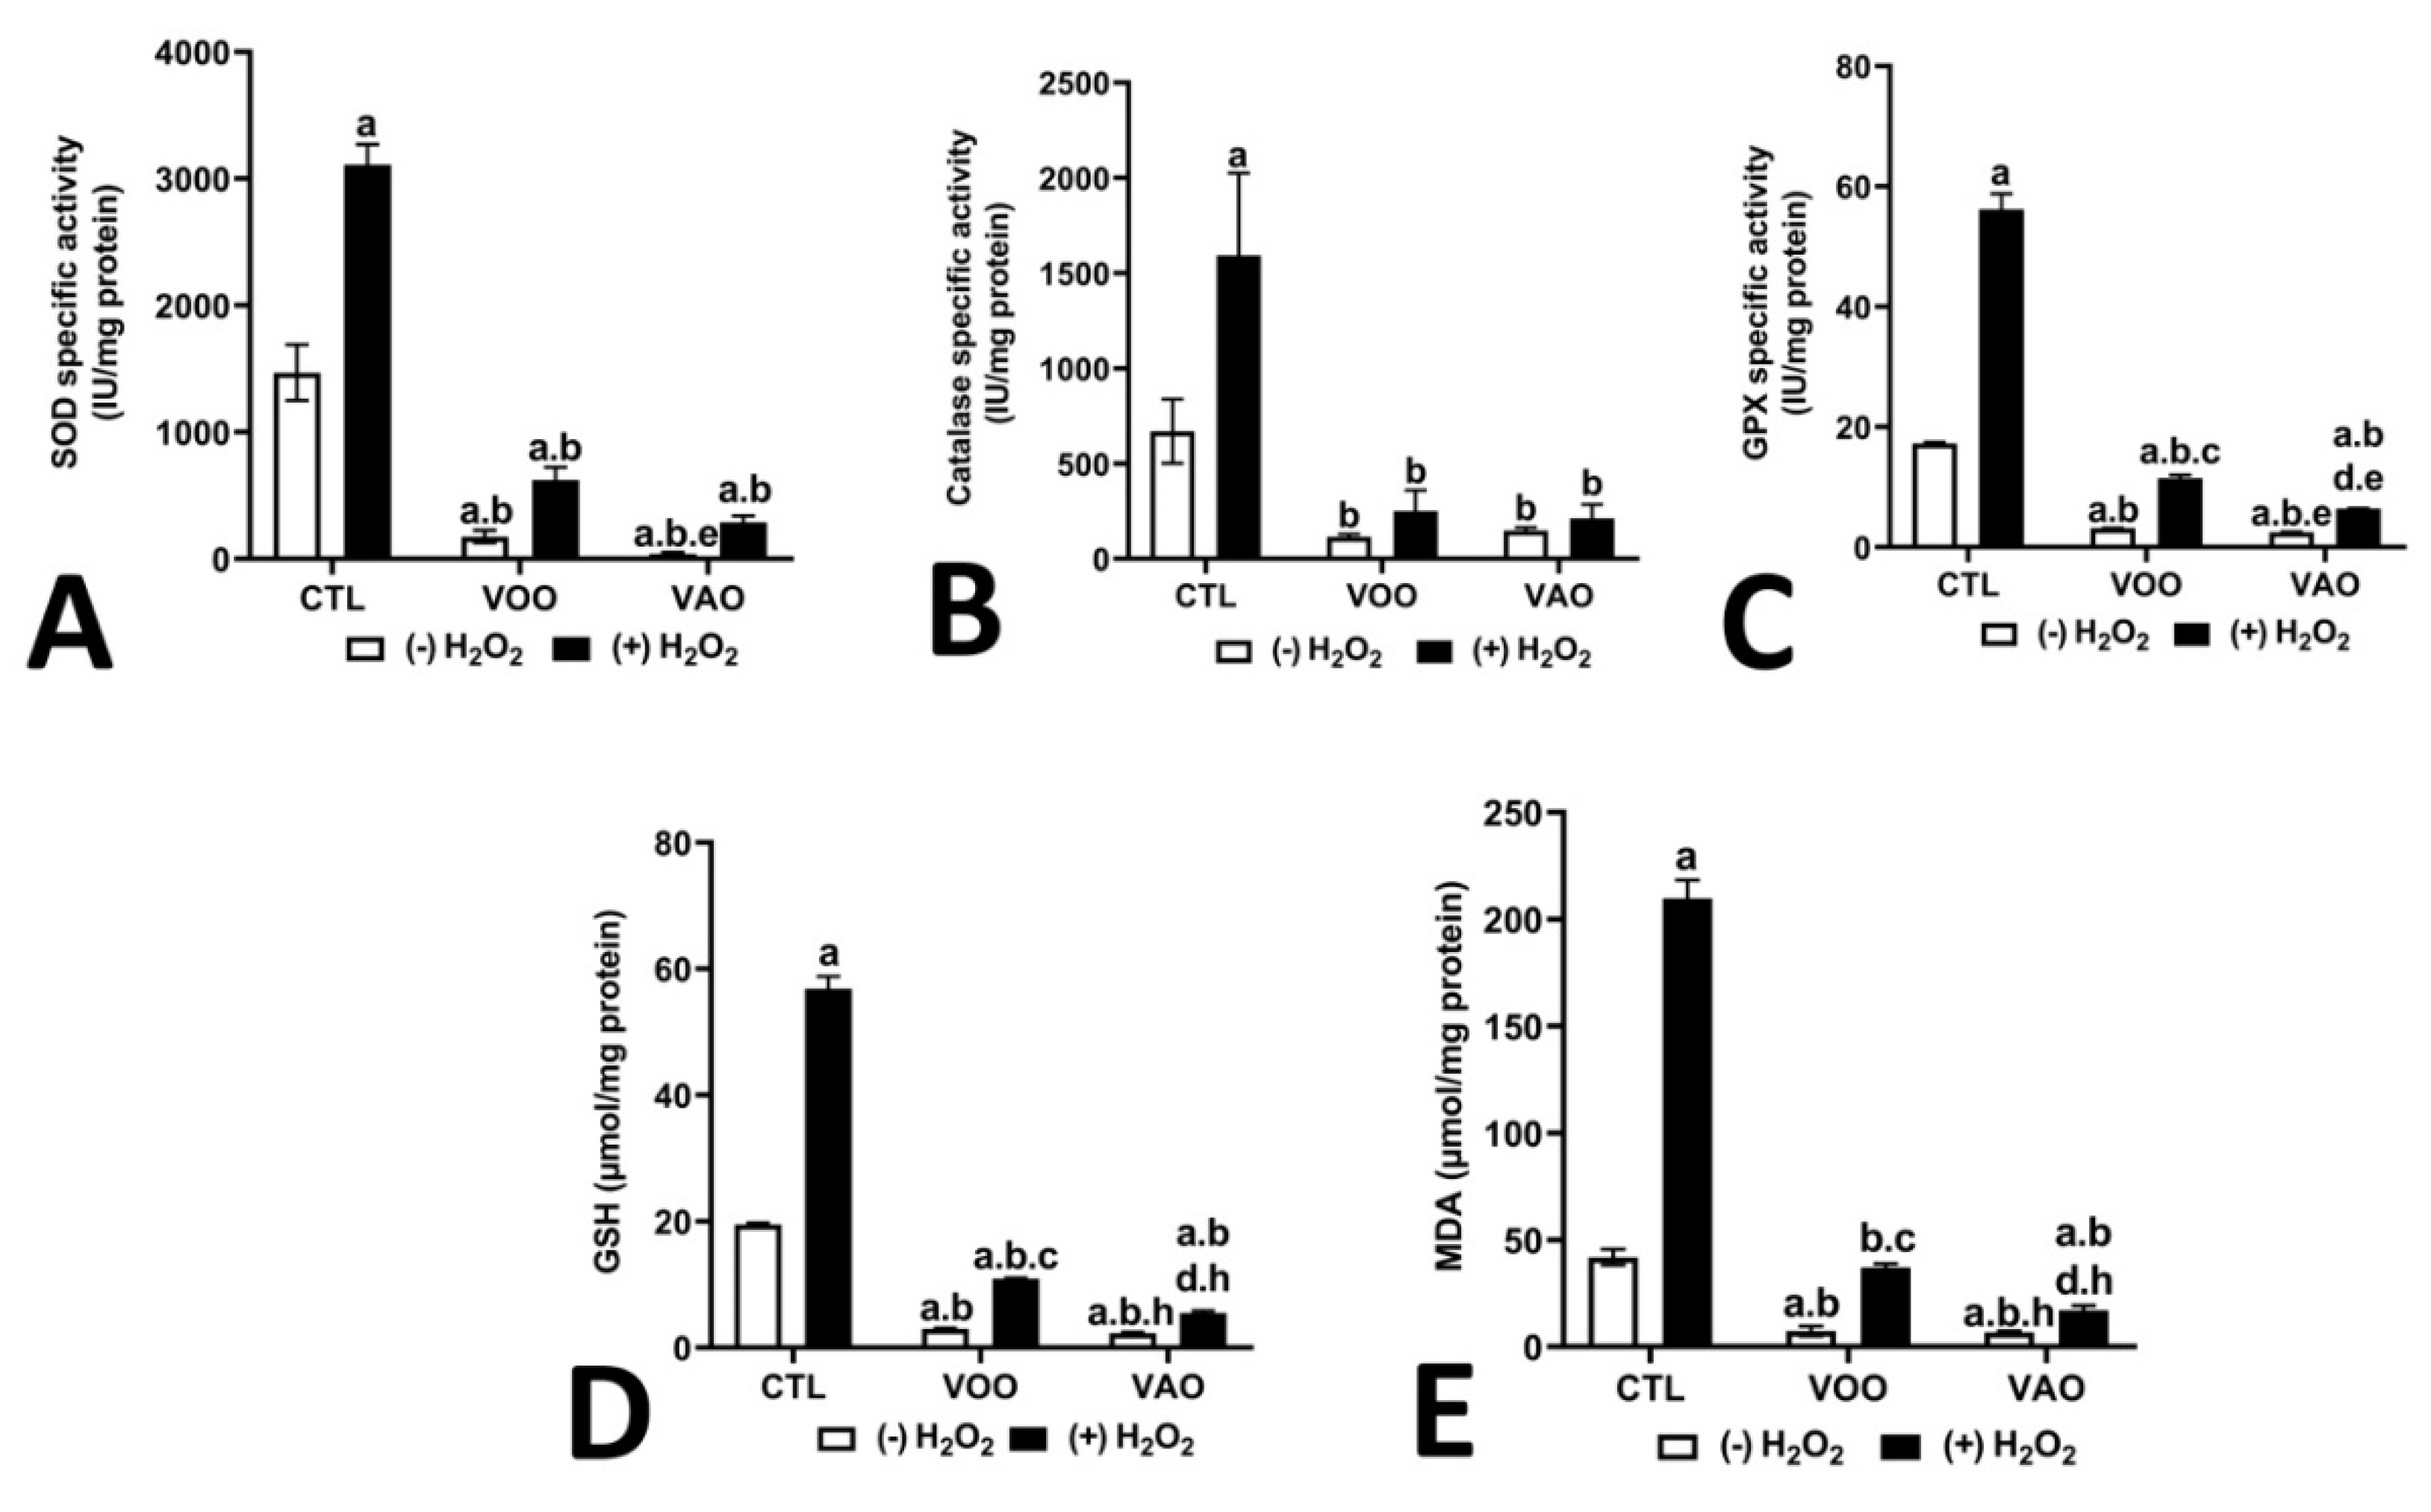
3.2.8. Effect of oxidative stress treatment on the activity of key antioxidant enzymes and substrates
3.2.9. Effect of nitrosative stress treatment on the activity of key antioxidant enzymes and substrates
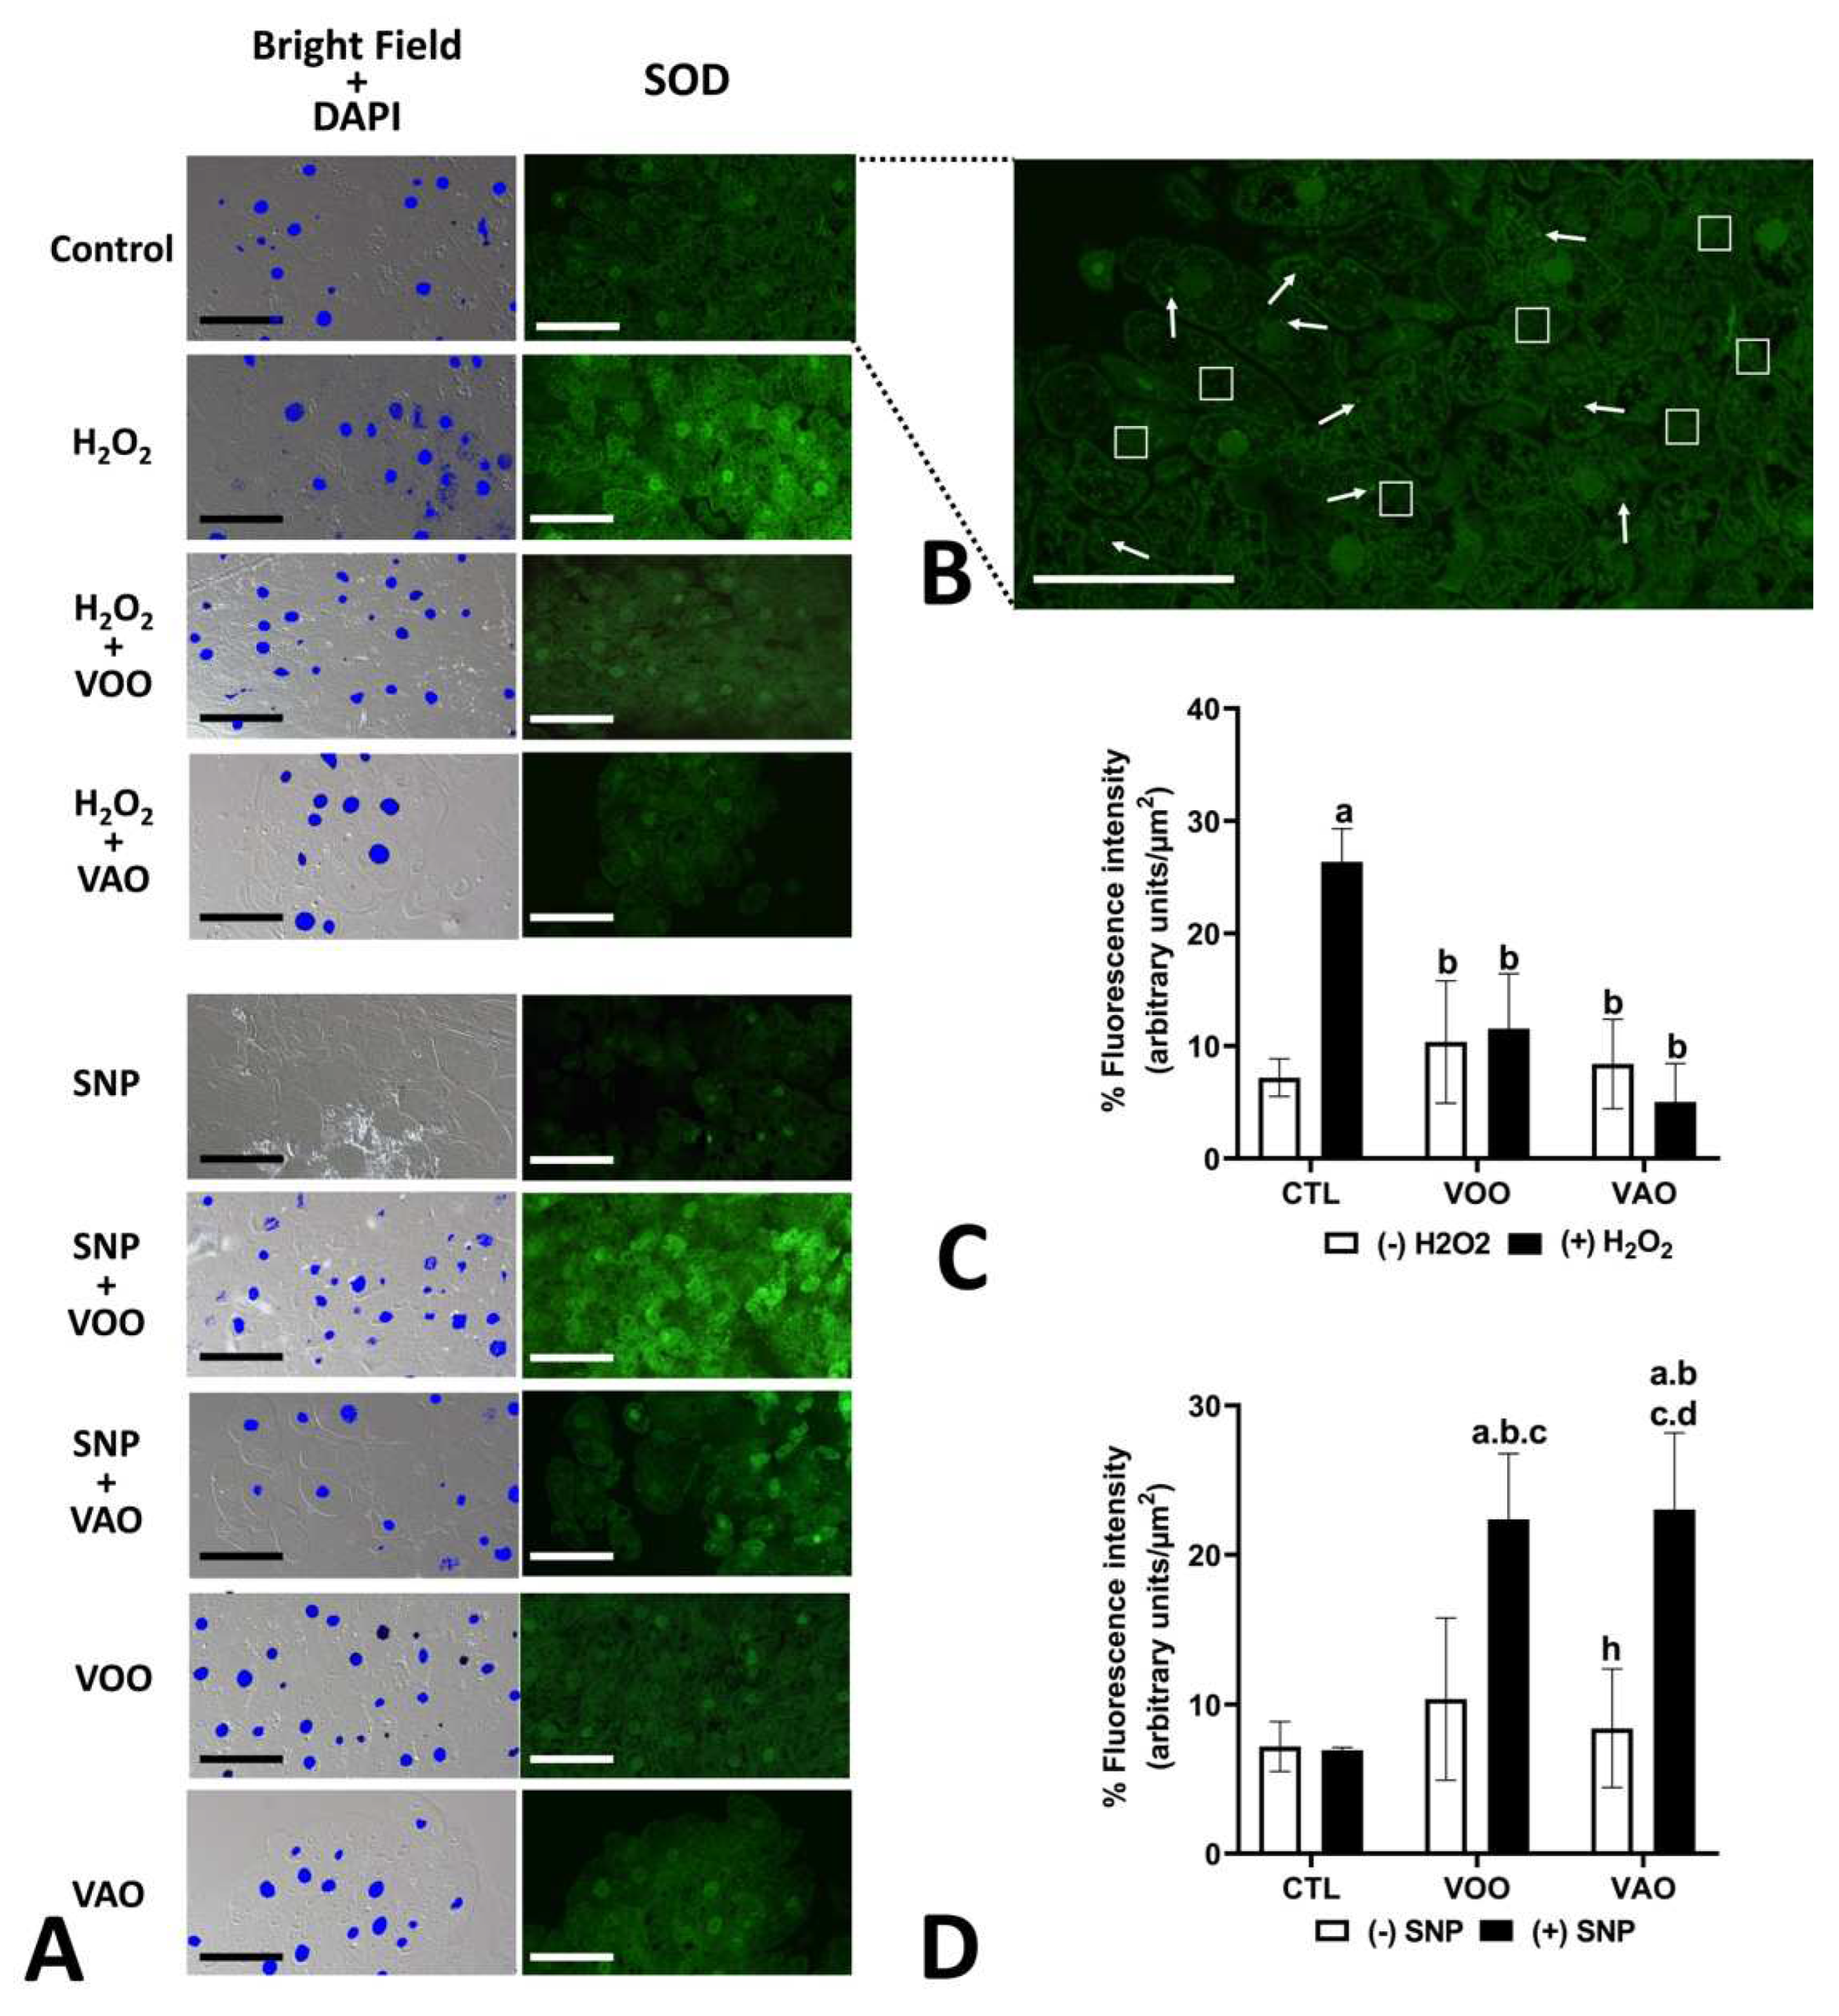
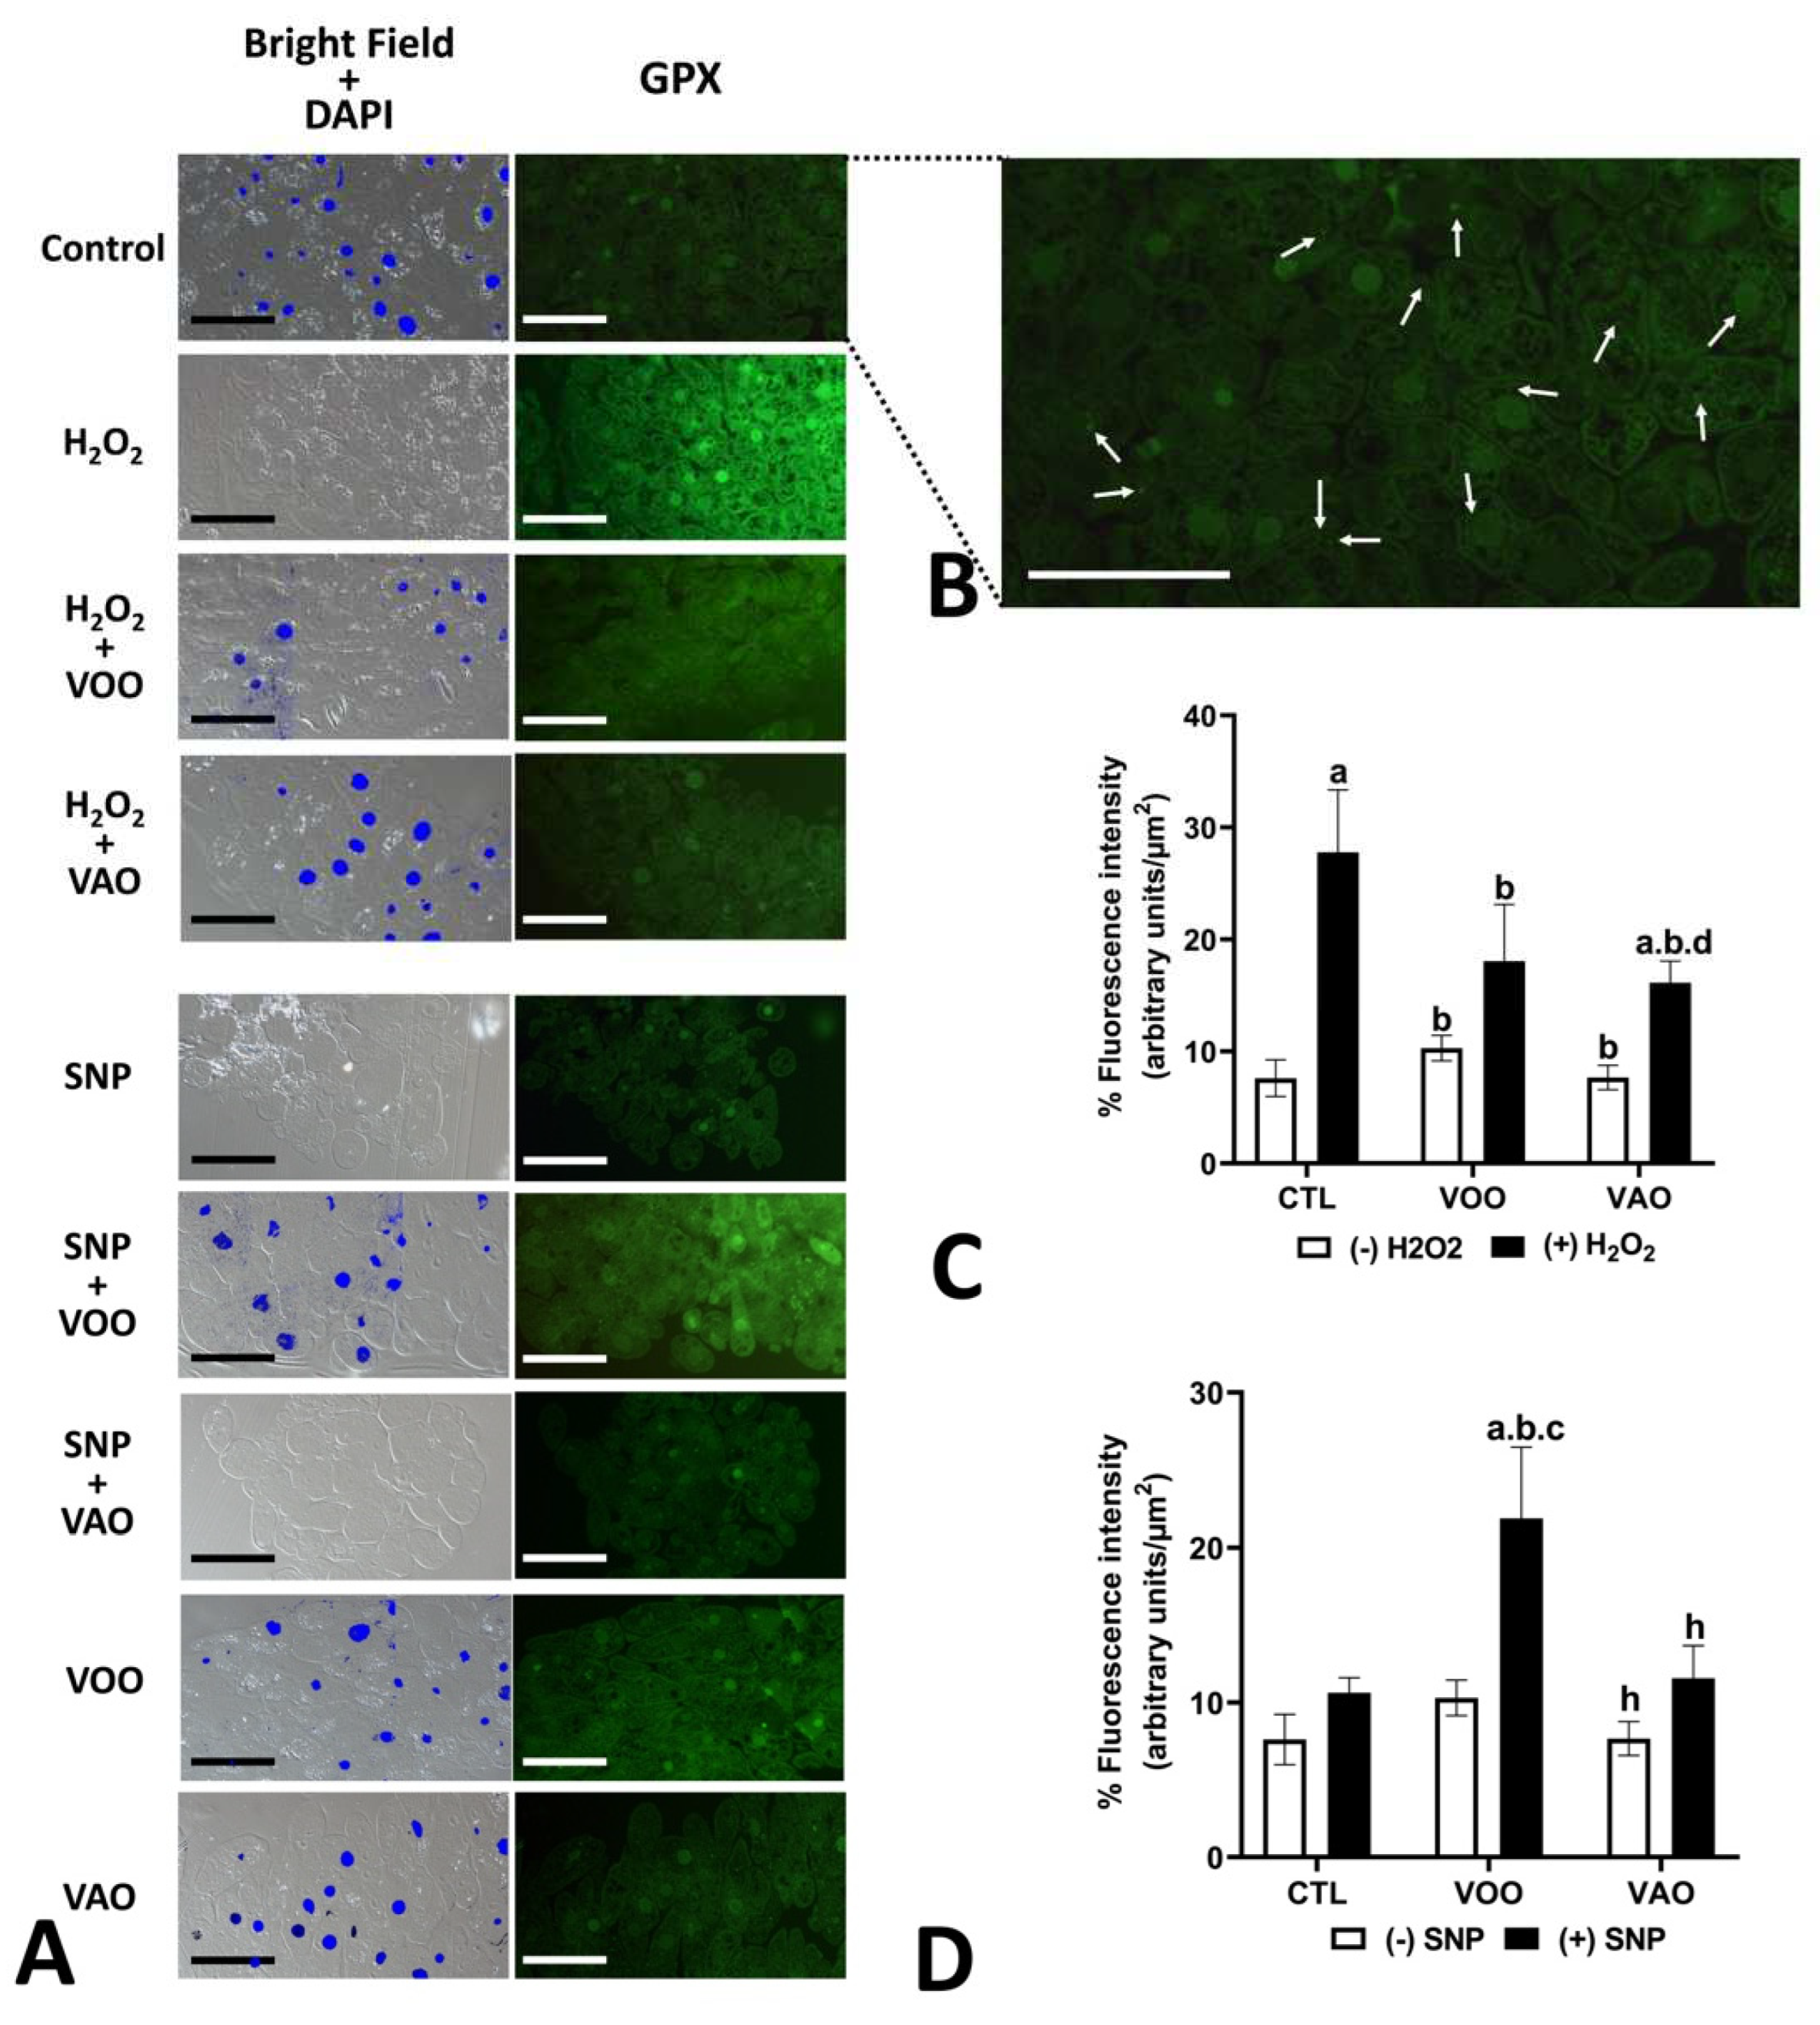
3.2.10. Immunocytochemical evidence of the effects of oxidative and nitrosative stress treatments on the presence of key antioxidant enzymes
4. Discussion
5. Conclusions
Author Contributions
Funding
Acknowledgments
Conflicts of Interest
References
- Charrouf, Z.; Guillaume, D. Argan oil: Occurrence, composition and impact on human health. European Journal of Lipid Science and Technology 2008, 110(7), 632–636. [Google Scholar] [CrossRef]
- Boucetta, K. Q.; Charrouf, Z.; Derouiche, A., Rahali; Y., Bensouda, Y. Skin hydration in postmenopausal women : argan oil benefit with oral and/or topical use. Prz Menopauzalny 2014, 13(5), 280–288. [CrossRef]
- Cherki, M.; Berrougui, H.; Drissi, A.; Adlouni, A.; Khalil, A. Argan oil : Which benefits on cardiovascular diseases ? Pharmacological Research 2006, Issue 1, 1–5. [Google Scholar] [CrossRef]
- Khallouki, F.; Younos, C.; Soulimani, R.; Oster, T.; Charrouf, Z.; Spiegelhalder, B.; Bartsch, H.; Owen, R.W. Consumption of argan oil (Morocco) with its unique profile of fatty acids, tocopherols, squalene, sterols and phenolic compounds should confer valuable cancer chemopreventive effects. European Journal of Cancer Prevention 2003, 12(1), 67–75. [Google Scholar] [CrossRef] [PubMed]
- Bakour, M.; Soulo, N.; Hammas, N.; Fatemi, H.E.L.; Aboulghazi, A.; Taroq, A.; Abdellaoui, A.; Al-waili, N. The antioxidant content and protective effect of argan oil and Syzygium aromaticum essential oil in hydrogen peroxide-induced biochemical and histological changes. Int. J. Mol. Sci. 2018, 19(2), 610. [Google Scholar] [CrossRef]
- Drissi, A.; Girona, J., Cherki, M.; Godàs, G.; Derouiche; A., El Messal, M.; Saile, R.; Kettani, A.; Solà, R., Masana, L.; Adlouni, A. Evidence of hypolipemiant and antioxidant properties of argan oil derived from the argan tree (Argania spinosa). Clinical Nutrition 2004, 23(5), 1159–1166. [CrossRef]
- Haimeur, A., Messaouri, H., Ulmann, L.; Mimouni, V.; Masrar, A.; Chraibi, A., Tremblin, G.; Meskini, N. Argan oil prevents prothrombotic complications by lowering lipid levels and platelet aggregation, enhancing oxidative status in dyslipidemic patients from the area of Rabat (Morocco). Lipids in Health and Disease 2013, 12(1), 1–9. [CrossRef]
- Kamal, R.; Kharbach, M., Vander, Y.; Zohra, H.; Ghchime, R.; Bouklouze, A.; Cherrah, Y.; Alaoui, K. In vivo anti - inflammatory response and bioactive compounds’ profile of polyphenolic extracts from edible Argan oil (Argania spinosa L .), obtained by two extraction methods. Journal of food biochemistry 2019, 43(12), e13066. [CrossRef]
- Menni, H.B.; Belarbi, M.; Menni, D. B.; Bendiab, H. , Kherraf, Y.; Ksouri, R.; Djebli, N.; Visioli, F. Anti-inflammatory activity of argan oil and its minor components. International Journal of Food Sciences and Nutrition 2019, 0(0), 1–8. [Google Scholar] [CrossRef]
- El Abbassi, A.; Khalid, N.; Zbakh, H.; Ahmad, A. Physicochemical Characteristics, Nutritional Properties, and Health Benefits of Argan Oil: A Review. Critical Reviews in Food Science and Nutrition 2014, 54(11), 1401–1414. [Google Scholar] [CrossRef]
- Ursoniu, S.; Serban, M.C. (2017). The impact of argan oil on plasma lipids in humans: Systematic review and meta - analysis of randomized controlled trials. Phytotherapy Research 2017, 32(3), 377-383. [CrossRef]
- Teres, S.; Coblijn, G.B.; Benet, M.; Alvarez, R.; Bressani, R., Halver, J. Oleic acid content is responsible for the reduction in blood pressure induced by olive oil. 105(37). Proceedings of the National Academy of Sciences 2008, 105(37), 13811-13816. [CrossRef]
- Sies, H. Physiological Society Symposium : Impaired Endothelial and Smooth Muscle Cell Function in Oxidative Stress Reaction of Nitric Oxide With Superoxide : Experimental Physiology 1997, 13(December 1995), 305–316. 19 December.
- Liguori, L. , Russo, G., Curcio, F.; Bulli, G.; Aran, L.; Della-morte, D.; Testa, G.; Cacciatore, F., Bonaduce, D.; Abete, P. Oxidative stress, aging, and diseases. Clinical interventions in aging 2018, 13, 757–772. [Google Scholar] [CrossRef]
- Holzerová, E.; Prokisch, H. Mitochondria: Much ado about nothing? How dangerous is reactive oxygen species production? International Journal of Biochemistry and Cell Biology 2015, 63, 16–20. [Google Scholar] [CrossRef]
- Tang, S.Y.; Whiteman, M.; Peng, Z.F.; Jenner, A.; Yong, E.L.; Halliwell, B. Characterization of antioxidant and antiglycation properties and isolation of active ingredients from traditional chinese medicines. Free Radical Biology and Medicine 2004, 36(12), 1575–1587. [Google Scholar] [CrossRef]
- Kobayashi, N.; DeLano, F.A., Schmid-Schönbein, G.W. Oxidative stress promotes endothelial cell apoptosis and loss of microvessels in the spontaneously hypertensive rats. Arteriosclerosis, Thrombosis, and Vascular Biology 2005, 25(10), 2114–2121. [CrossRef]
- Xu, H.; Li, C.; Mozziconacci, O.; Zhu, R.; Xu, Y.; Tang, Y.; Chen, R.; Huang, Y., Holzbeierlein, J.M.; Christian Schöneich, J.H.; Li, B. Xanthine oxidase-mediated oxidative stress promotes cancer cell-specific apoptosis. Free Rad. Biol. Med. 2019, Aug 1;139:70-79. [CrossRef]
- Zhang, J., Zheng, S., Wang, S., Liu, Q., & Xu, S. Cadmium-induced oxidative stress promotes apoptosis and necrosis through the regulation of the miR-216a-PI3K/AKT axis in common carp lymphocytes and antagonized by selenium. Chemosphere 2020, 258, 127341. [CrossRef]
- Mirończuk-Chodakowska, I.; Witkowska, A.M.; Zujko, M.E. Endogenous non-enzymatic antioxidants in the human body. Advances in Medical Sciences 2018, 63(1), 68–78. [Google Scholar] [CrossRef] [PubMed]
- Younus, H. Therapeutic potentials of superoxide dismutase. International Journal of Health Sciences 2018, 12(3), 88–93. https://www.ncbi.nlm.nih.gov/pmc/articles/PMC5969776/pdf/IJHS-12-88.pdf.
- Adwas, A.A.; Elsayed, A.; Azab, A.E.; Quwaydir, F.A. Oxidative stress and antioxidant mechanisms in human body. J. J. Appl. Biotechnol. Bioeng 2019, 6(1), 43–47. [Google Scholar] [CrossRef]
- Kanarek, N.; Petrova, B.; Sabatini, D.M. Dietary modifications for enhanced cancer therapy. Nature 2020, 579(7800), 507–517. [Google Scholar] [CrossRef] [PubMed]
- Biel, S.; Mesa, M.D.; de la Torre, R.; Espejo, J.A., Fernández-Navarro, J.R.; Fitó, M.; Sánchez-Rodriguez, E.; Rosa, C.; Marchal, C.; Alche, J.D.; Expósito, M.; Brenes, M.; Gandul, B.; Calleja, M.A.; Covas, M.I. The NUTRAOLEOUM Study, a randomized controlled trial, for achieving nutritional added value for olive oils. BMC complementary and alternative medicine 2016, 16(1), 1-9. [CrossRef]
- Sanchez-Rodriguez, E.; Lima-Cabello, E.; Biel-Glesson, S.; Fernandez-Navarro, J.R.; Calleja, M.A.; Roca, M.; Espejo Calvo, J.A.; Extremera, B.G., Florido, M.S.; de la Torre, R., Fito, M.; Covas, M.I.; Alché, J.D.; Martinez de Victoria, E.; Gil, A.; Mesa, M. D. Effects of virgin olive oils differing in their bioactive compound contents on metabolic syndrome and endothelial functional risk biomarkers in healthy adults: a randomized double-blind controlled trial. Nutrients 2018, 10(5), 626. pii: E626. E: 626. pii. [CrossRef]
- Sanchez-Rodriguez, E.; Biel-Glesson, S.; Fernandez-Navarro, J.R.; Calleja, M.A.; Espejo-Calvo, J.A.; Gil-Extremera, B.; de la Torre, R.; Fito, M.; Covas, M.I.; Vílchez, P.; Alché, J.D.; Martinez de Victoria, E.; Gil, A.; Mesa, M. D. Effects of virgin olive oils differing in their bioactive compound contents on biomarkers of oxidative stress and inflammation in healthy adults: A randomized double-blind controlled trial. Nutrients 2019, 11(3), 561. [Google Scholar] [CrossRef]
- Hamilton, R.T.; Walsh, M.E.; Van Remmen, H. Mouse models of oxidative stress indicate a role for modulating healthy aging. J Clin Exp Pathol 2012, ; Suppl 4. [CrossRef]
- Navarro, A., Gomez, C., López-Cepero, J. M., Boveris, A. Beneficial effects of moderate exercise on mice aging: survival, behavior, oxidative stress, and mitochondrial electron transfer. American journal of physiology-regulatory, integrative and comparative physiology 2004, 286(3), R505-R511.
- Yamauchi, Y.; Matsuno, T.; Omata, K.; Satoh, T. Relationship between hyposalivation and oxidative stress in aging mice. Journal of Clinical Biochemistry and Nutrition 2017, 61(1), 40–46. [Google Scholar] [CrossRef] [PubMed]
- Devaraj, E.; Roy, A.; Royapuram Veeraragavan, G.; Magesh, A.; Varikalam Sleeba, A.; Arivarasu, L.; Marimuthu Parasuraman, B. β-Sitosterol attenuates carbon tetrachloride–induced oxidative stress and chronic liver injury in rats. Naunyn-Schmiedeberg’s Archives of Pharmacology 2020, 393, 1067–1075. [Google Scholar] [CrossRef] [PubMed]
- Samarghandian, S.; Farkhondeh, T.; Samini, F.; Borji, A. (2016). Protective effects of carvacrol against oxidative stress induced by chronic stress in rat’s brain, liver, and kidney. Biochemistry research international 2016. [CrossRef]
- Marrocco, I.; Altieri, F.; Peluso, I. (2017). Review Article Measurement and Clinical Significance of Biomarkers of Oxidative Stress in Humans. Oxidative medicine and cellular longevity 201. 2017. [CrossRef]
- Usharani, P.; Merugu, P.L.; Nutalapati, C. (2019). Evaluation of the effects of a standardized aqueous extract of Phyllanthus emblica fruits on endothelial dysfunction, oxidative stress, systemic inflammation and lipid profile in subjects with metabolic syndrome : a randomised, double blind, placebo controlled clinical study. BMC complementary and alternative medicine 2019, 19, 1–8. [Google Scholar] [CrossRef]
- Cassidy-Hanley, D. M. Tetrahymena in the Laboratory: Strain Resources, Methods for Culture, Maintenance, and Storage. In: Methods in Cell Biology Volume 109, 2012, Pages 237-276. [CrossRef]
- Espín, J.C., Soler-Rivas, C.; Wichers, H.J. Characterization of the total free radical scavenger capacity of vegetable oils and oil fractions using 2,2-diphenyl-1-picrylhydrazyl radical. Journal of Agricultural and Food Chemistry 2000, 48(3), 648–656. [CrossRef]
- Osorio-Esquivel, O.; Álvarez, V.B.; Dorantes-Álvarez, L.; Giusti, M.M. Phenolics, betacyanins and antioxidant activity in Opuntia joconostle fruits. Food Research International 2011, 44(7), 2160–2168. [Google Scholar] [CrossRef]
- Dehpour, A.A.; Ebrahimzadeh, M.A.; Fazel, N.S.; Mohammad, N.S. Antioxidant activity of the methanol extract of Ferula assafoetida and its essential oil composition. Grasas y aceites 2009, 60(4), 405–412. [Google Scholar]
- Huang, B.; Ke, H.; He, J.; Ban, X. , Zeng, H.; Wang, Y. Extracts of Halenia elliptica exhibit antioxidant properties in vitro and in vivo. Extracts of Halenia elliptica exhibit antioxidant properties in vitro and in vivo. Food and Chemical Toxicology 2011, 49(1), 185–190. [Google Scholar] [CrossRef]
- Oyaizu, M. Studies on products of browning reaction antioxidative activities of products of browning reaction prepared from glucosamine. The Japanese journal of nutrition and dietetics 1986, 44(6), 307–315. [Google Scholar] [CrossRef]
- Re, R.; Pellegrini, N.; Proteggente, A.; Pannala, A.; Yang, M.; Rice-Evans, C. Antioxidant activity applying an improved ABTS radical cation decolorization assay. Free radical biology and medicine 1999, 26(9-10), 1231-1237. 1231. [CrossRef]
- Lizard, G.; Gueldry, S.; Deckert, V.; Gambert, P.; Lagrost, L. Evaluation of the cytotoxic effects of some oxysterols and of cholesterol on endothelial cell growth: methodological aspects. Pathologie-biologie 1997, 45(4), 281-290. /: 281-290. https.
- Dürichen, H. , Siegmund, L.; Burmester, A.; Fischer, M.S.; Wöstemeyer, J. Ingestion and digestion studies in Tetrahymena pyriformis based on chemically modified microparticles. European Journal of Protistology 2016, 52, 45–57. [Google Scholar] [CrossRef] [PubMed]
- Lowry, O.; Rosebrough, N. , Farr, A.L.; Randall, R. Protein measurement with the Folin phenol reagent. Protein measurement with the Folin phenol reagent. Journal of biological chemistry 1951, 193(1), 265–275. [Google Scholar] [CrossRef]
- Paoletti, F.; Aldinucci, D.; Mocali, A.; Caparrini, A. A sensitive spectrophotometric method for the determination of superoxide dismutase activity in tissue extracts. Analytical biochemistry 1986, 154(2), 536–541. [Google Scholar] [CrossRef] [PubMed]
- Aebi, H. Catalase in vitro. Metods in Enzymology 1984, 105(1947), 121–126. [Google Scholar] [CrossRef]
- Gonzler, W.A. The term glutathione peroxidase (glutathione: H202 oxidoreductase, EC 1. 11. 1.9) is reserved for the selenoprotein catalyzing the reaction: Heal. San Fr 1984, 105, 114–120. [Google Scholar]
- Ellman, G.L. Tissue sulfhydryl groups. Archives of biochemistry and biophysics 1959, 82(1), 70–77. [Google Scholar] [CrossRef]
- Ohkawa, H.; Ohishi, N.; Yagi, K. Assay for Lipid Peroxides in Animal Tissues Thiobarbituric Acid Reaction. Analytical biochemistry 1979, 95(2), 351–358. [Google Scholar] [CrossRef]
- Houshia, O.J.; Qutit, A., Zaid, O., Shqair, H., Zaid, M. Determination of Total Polyphenolic Antioxidants Contents in West-Bank Olive Oil. Journal of Natural Sciences Research 2014, 4(15), 71–76.
- Nenadis, N.; Mastralexi, A.; Tsimidou, M.Z. Physicochemical characteristics and antioxidant potential of the Greek PDO and PGI Virgin Olive Oils (VOOs). European journal of lipid science and technology 2019, 121(3), 1800172. [Google Scholar] [CrossRef]
- Marfil, R.; Giménez, R., Martínez, O.; Bouzas, P.R.; Rufián-Henares, J.A.; Mesías, M.; Cabrera-Vique, C. Determination of polyphenols, tocopherols, and antioxidant capacity in virgin argan oil (Argania spinosa, Skeels). European Journal of Lipid Science and Technology 2011, 113(7), 886–893. [CrossRef]
- Zarrouk, A.; Martine, L.; Grégoire, S.; Nury, T.; Meddeb, W.; Camus, E.; Badreddine, A; Durand, Ph.; Namsi, A.; Yammine, A.; Nasser, B.; Mejri, M.; Bretillon, L.; Mackrill, J.J.; Cherkaoui-Malki, M.; Hammami, M.; Lizard, G.; Lizard, G. Profile of fatty acids, tocopherols, phytosterols and polyphenols in mediterranean oils (argan oils, olive oils, milk thistle seed oils and nigella seed oil) and evaluation of their antioxidant and cytoprotective activities. Current pharmaceutical design 2019, 25(15), 1791-1805. 1791. [CrossRef]
- Saffar, S.; Jafari, S.M.; Bahrami, A. Evaluation of changes in the quality of extracted oil from olive fruits stored under different temperatures and time intervals Scientific Reports 2019, 9(1), 19688. [CrossRef]
- Bongiorno, D.; Di Stefano, V.; Indelicato, S.; Avellone, G.; Ceraulo, L. Bio-phenols determination in olive oils: Recent mass spectrometry approaches. Mass Spectrometry Reviews 2021, e21744. [Google Scholar] [CrossRef]
- Çelik, S.E.; Özyürek, M.; Güçlü, K.; Apak, R. Solvent effects on the antioxidant capacity of lipophilic and hydrophilic antioxidants measured by CUPRAC, ABTS/persulphate and FRAP methods. Talanta 2010, 81(4–5), 1300–1309. [CrossRef]
- Cayuela, J.A.; Rada, M.; Pérez-camino, M.C., Benaissa, M; Abdelaziz, E., Guinda, Á. Characterization of artisanally and semiautomatically extracted argan oils from Morocco. haracterization of artisanally and semiautomatically extracted argan oils from Morocco 2008, 110(12), 1159–1166. [CrossRef]
- Ahamed, M.; Akhtar, M.J.; Alaizeri, Z.A.M.; Alhadlaq, H.A. TiO2 nanoparticles potentiated the cytotoxicity, oxidative stress and apoptosis response of cadmium in two different human cells. Environmental Science and Pollution Research 2020, 27(10), 10425–10435. [Google Scholar] [CrossRef] [PubMed]
- Coyle, C.H.; Martinez, L.J.; Coleman, M.C.; Spitz, D.R.; Weintraub, N.L.; Kader, K.N. Mechanisms of H2O2-induced oxidative stress in endothelial cells. Free Radical Biology and Medicine 2006, 40(12), 2206–2213. [Google Scholar] [CrossRef] [PubMed]
- Ghosh, A.S.; Dutta, S.; Raha, S. Hydrogen peroxide-induced apoptosis-like cell death in Entamoeba histolytica. Parasitology International 2010, 59, 166–172. [Google Scholar] [CrossRef]
- Ryter, S.W.; Kim, H.P.; Hoetzel, A.; Park, J.W.; Nakahira, K.; Wang, X.; Choi, A.M. Mechanisms of cell death in oxidative stress. Antioxidants & redox signaling 2007, 9(1), 49-89. [CrossRef]
- Kiritsakis, A.K.; Kiritsakis, K.A.; Tsitsipas, C.K. A review of the evolution in the research of antioxidants in olives and olive oil during the last four decades. Journal of Food Bioactives 2020, 11. [Google Scholar] [CrossRef]
- Dinda, B.; Dubnath, S.; Harigaya, Y. Naturally occurring iridoids. A review, part 1. Chem. Pharm. Bull. 2007, 55, 159–222. [Google Scholar] [CrossRef]
- Fabiani, R.; Rosignoli, P.; de Bartolomeo, A.; Fuccelli, R.; Servili, M.; Montedoro, G.F.; Morozzi, G. Oxidative DNA damage is prevented by extracts of olive oil, hydroxytyrosol, and other olive phenolic compounds in human blood mononuclear cells and HL60 cells. J. Nutr. 2008, 138, 1411–1416. [Google Scholar] [CrossRef] [PubMed]
- Tundis, R.; Loizzo, M.; Menichini, F.; Statti, G.; Menichini, F. Biological and pharmacological activities of iridoids: Recent developments. Mini Rev. Med. Chem. 2008, 8, 399–420. [Google Scholar] [CrossRef]
- Midaoui, A.; El Haddad, Y.; Filali-Zegzouti, Y.; Couture, R. Argan Oil as an Effective Nutri-Therapeutic Agent in Metabolic Syndrome: A Preclinical Study. International Journal of Molecular Sciences 2017, 18(11), 2492. [Google Scholar] [CrossRef]
- Orabi, S.H.; Allam, T.S.; Shawky, S.M.; El-Aziz Tahoun, A.; Khalifa, H.K.; Almeer, R., Abdel-Daim, M.M.; Borai El-Borai, N.; Mousa, A.A.; Eg, A.A.M. The Antioxidant, Anti-Apoptotic, and Proliferative Potency of Argan Oil against Betamethasone-Induced Oxidative Renal Damage in Rats. Biology, 2020, 352. [CrossRef]
- Şekeroğlu, Z.A.; Aydın, B. , Şekeroğlu, V. Argan oil reduces oxidative stress, genetic damage and emperipolesis in rats treated with acrylamide. Biomedicine and Pharmacotherapy 2017, 94, 873–879. [Google Scholar] [CrossRef]
- Haman, N.; Longo, E.; Schiraldi, A. , Scampicchio, M. Radical scavenging activity of lipophilic antioxidants and extra-virgin olive oil by isothermal calorimetry. Thermochimica Acta 2017, 658, 1–6. [Google Scholar] [CrossRef]
- Paradiso, V.M.; Flamminii, F.; Pittia, P.; Caponio, F.; Mattia, C.Di. (2020). Radical Scavenging Activity of Olive Oil Phenolic Antioxidants in Oil or Water Phase during the Oxidation of O/W Emulsions: An Oxidomics Approach. Antioxidants 2020, 9(10), 996. [CrossRef]
- Quintero-Flórez, A.; Pereira-Caro, G.; Sánchez-Quezada, C.; Moreno-Rojas, M.; Gaforio, J.J.; Jimenez, A.; Beltrán, G. Effect of olive cultivar on bioaccessibility and antioxidant activity of phenolic fraction of virgin olive oil. European Journal of Nutrition 2018, 57, 1925–1946. [Google Scholar] [CrossRef] [PubMed]
- Rossi, M., Caruso, F.; Kwok, L.; Lee, G.; Caruso, A.; Gionfra, F.; Candelotti, E.; Belli, S.L.; Molasky, N.; Raley-Susman, K.M.; Leone, S.; Filipský, T.; Tofani, D.; Pedersen, J.; Incerpi, S. (2017). Protection by extra virgin olive oil against oxidative stress in vitro and in vivo. Chemical and biological studies on the health benefits due to a major component of the Mediterranean diet. PLoS One, 12(12), e0189341. [CrossRef]
- Cadi, R.; Mounaji, K.; Amraoui, F.; Soukri, A. Protective and antioxidant potential of the argan oil on induced oxidative stress in Tetrahymena pyriformis. Journal of Medicinal Plants Research 2013, 7(27), 1961–1968. [Google Scholar] [CrossRef]
- Zafra, A.; Rodríguez-García, M.I.; Alché, J.D.D. Cellular localization of ROS and NO in olive reproductive tissues during flower development. BMC Plant Biology 2020, 10(1), 1–14. [Google Scholar] [CrossRef] [PubMed]
- Listenberger, L.L.; Brown, D.A. Fluorescent Detection of Lipid Droplets and Associated Proteins. Current Protocols in Cell Biology 2007, 35(1), 1–11. [Google Scholar] [CrossRef]
- Cruz, A.L.S.; Barreto, E.D.A.; Bozza, P.T. Lipid droplets : platforms with multiple functions in cancer hallmarks. Cell Death and Disease 2020. [CrossRef]
- Lee, S.; Zhang, J.; Choi, A.M.K.; Kim, H.P. Mitochondrial Dysfunction Induces Formation of Lipid Droplets as a Generalized Response to Stress. Oxidative medicine and cellular longevity 2013. [CrossRef]
- Lee, J.; Homma, T.; Kurahashi, T.; Kang, E.S.; Fujii, J. Biochemical and Biophysical Research Communications Oxidative stress triggers lipid droplet accumulation in primary cultured hepatocytes by activating fatty acid synthesis. Biochemical and Biophysical Research Communications 2015, 1–7. [Google Scholar] [CrossRef]
- Petan, T.; Jarc, E.; Jusovic, M. (2018). Lipid Droplets in Cancer : Guardians of Fat in a Stressful World. Molecules 2018, 23(8), 194111–15. [CrossRef]
- Del Rio, L.A., Sandalio, L.M.; Corpas, F.J., Palma, M., Barroso, J.B.. Reactive Oxygen Species and Reactive Nitrogen Species in Peroxisomes . Production , Scavenging , and Role. Plant physiology 2006, 141(2), 330-335. [CrossRef]
- Chen, R.; Tai, Y.; Chen, T.; Lin, T. Propofol protects against nitrosative stress-induced apoptotic insults to cerebrovascular endothelial cells via an intrinsic mitochondrial mechanism. Surgery 2013, 154(1), 58–68. [Google Scholar] [CrossRef]
- Chen, T.; Wu, G.; Hsu, C.; Fong, T.; Chen, R. Chemico-Biological Interactions Nitrosative stress induces osteoblast apoptosis through downregulating MAPK-mediated NF B/AP-1 activation and subsequent Bcl-X L expression. Chemico-Biological Interactions 2010, 184(3), 359–365. [CrossRef]
- Rogstam, A.; Larsson, J.T.; Kjelgaard, P.; Wachenfeldt, C. Von. (2007). Mechanisms of Adaptation to Nitrosative Stress in Bacillus subtilis. ( 189(8), 3063–3071. [CrossRef]
- Takahashi, H.K.; Cambiaghi, T.D.; Luchessi, A.D.; Hirabara, S.M.; Vinolo, M.A.R.; Newsholme, P.; Curi, R. Activation of survival and apoptotic signaling pathways in lymphocytes exposed to palmitic acid. Journal of cellular physiology 2012, 227(1), 339–350. [Google Scholar] [CrossRef]
- Guenaou, I.; Hmimid, F.; Azzahra, F.; Errami, A.; Santé, L.; Environnement, E., Des, F.; Ain, S.; Hassan, U., Casablanca, I. I. De. (2021). Comparative Biochemistry and Physiology , Part C Cytoprotective effect of ethyl acetate fraction from Ephedra fragilis on H2O2 - induced oxidative damage in Tetrahymena pyriformis. Comparative Biochemistry and Physiology Part C: Toxicology & Pharmacology 2021, 239, 108899. [CrossRef]
- Salla, S.; Sunkara, R.; Ogutu, S.; Walker, L.T., Verghese, M. Antioxidant activity of papaya seed extracts against H2O2 induced oxidative stress in HepG2 cells. LWT - Food Science and Technology 2015. [CrossRef]
- Zhang, L.; Liu, Y.; Li, J.Y.; Li, L.Z.; Zhang, Y.L.; Gong, H.Y.; Cui, Y. Protective Effect of Rosamultin against H2O2 -Induced Oxidative Stress and Apoptosis in H9c2 Cardiomyocytes. Oxidative Medicine and Cellular Longevity 2018. [CrossRef] [PubMed]
- Zwiewka, M.; Bielach, A.; Tamizhselvan, P.; Madhavan, S.; Dobrev, P.; Vankova, R.; Ryad, E.E.; Tan, S. Root Adaptation to H2O2 -Induced Oxidative Stress by ARF-GEF BEN1- and Cytoskeleton-Mediated PIN2 Trafficking. Plant and Cell Physiology 2019, February 2019, 255–273. [Google Scholar] [CrossRef]
- Grina, F.; Abdellatif, R.; Talal, S.; Nasser, B. (2020). Could the Fucus Spiralis Algal Extract Prevent the Oxidative Stress in Could the Fucus Spiralis Algal Extract Prevent the Oxidative Stress in Tetrahymena Pyriformis Model ? Biointerface Research in Applied Chemistry 2020, 11(2), 8978–8995. [Google Scholar] [CrossRef]
- Fourrat, L.; Iddar, A.; Valverde, F.; Serrano, A.; Soukri, A. Effects of Oxidative and Nitrosative Stress on Tetrahymena pyriformis Glyceraldehyde-3-Phosphate Dehydrogenase. Journal of eukaryotic microbiology 2007, 54(4), 338–346. [Google Scholar] [CrossRef] [PubMed]
- Ayd, B. (2017). Effects of argan oil on the mitochondrial function, antioxidant system and the activity of NADPH- generating enzymes in acrylamide treated rat brain. Biomedicine & pharmacotherapy 2017, 87, 476–481. [Google Scholar] [CrossRef]
- Er, R.; Aydın, B.; Şekeroğlu, V.; Atlı Şekeroğlu, Z. Protective effect of Argan oil on mitochondrial function and oxidative stress against acrylamide-induced liver and kidney injury in rats. Biomarkers 2020, 25(6), 458–467. [Google Scholar] [CrossRef]
- lavarasi, K., Kiruthiga, P.V.; Pandian, S.K.; Devi, K. P. Chemosphere Hydroxytyrosol , the phenolic compound of olive oil protects human PBMC against oxidative stress and DNA damage mediated by 2 , 3 , 7 , 8-TCDD. Chemosphere 2011, 84(7), 888–893. Chemosphere. [CrossRef]
- Molassiotis, A.; Fotopoulos, V. Oxidative and nitrosative signaling in plants: two branches in the same tree?. Plant Signaling & Behavior 2011,, 6(2), 210-214. [CrossRef]
- Corpas, F.J.; Alché, J.D.; Barroso, J. B. Current overview of S-nitrosoglutathione (GSNO) in higher plants. Frontiers in plant science 2013, 4, 126. [Google Scholar] [CrossRef]
- Chaki, M.; Begara-Morales, J.C.; Valderrama, R.; Aranda-Caño, L.; Barroso, J.B. New Insights into the Functional Role of Nitric Oxide and Reactive Oxygen Species in Plant Response to Biotic and Abiotic Stress Conditions. In: Plant Growth and Stress Physiology. Plant in Challenging Environments, vol 3. Gupta, D.K., Palma, J.M. (eds) Springer, Plant Growth and Stress Physiology. Plant in Challenging Environments, vol 3. 2021 Cham. 215-235. [CrossRef]
- Bączek-Kwinta, R. Nitric Oxide and Reactive Oxygen Species Interactions in Plant Tolerance and Adaptation to Stress Factors. In: Biotic and Abiotic Stress Tolerance in Plants. Vats, S. (eds) Springer, 2018, Singapore. 239-256. [CrossRef]
- Goshi, E.; Zhou, G.; He, Q. Nitric oxide detection methods in vitro and in vivo. Medical gas research 2019, 9(4), 192. [Google Scholar] [CrossRef]
- Crouch, R. K.; Thaete, L.G. Immunolocalization of CuZn SOD. In Handbook Methods For Oxygen Radical Research 271-276. CRC Press. 2018.
- Michonneau, P.; Fleurat-Lessard, P.; Roblin, G.; Béré, E. CuZn-superoxide dismutase is differentially modified in localization and expression by three abiotic stresses in miniature rose bushes. Micron 2023, 103524. [Google Scholar] [CrossRef] [PubMed]
- Dvořák, P.; Krasylenko, Y.; Ovečka, M.; Basheer, J.; Zapletalová, V.; Šamaj, J.; Takáč, T. In vivo light-sheet microscopy resolves localisation patterns of FSD1, a superoxide dismutase with function in root development and osmoprotection. Plant, Cell & Environment 2021, 44(1), 68-87. [CrossRef]
- Lohana, P.; Suryaprawira, A.; Woods, E.L.; Dally, J.; Gait-Carr, E.; Alaidaroos, N.Y.; Heard, Ch.M.; Lee, K.Y.; Ruge, F.; Farrier, J.N.; Enoch, S.; Caley, M.P.; Peake, M.A.; Davies, L.C.; Giles, P.J.; Thomas, D.W.; Stephens, Ph.; Moseley, R. Role of enzymic antioxidants in mediating oxidative stress and contrasting wound healing capabilities in oral mucosal/skin fibroblasts and tissues. Antioxidants 2023, 12(7), 1374. [Google Scholar] [CrossRef] [PubMed]
- Grzegorzewska, A.K.; Ocłoń, E. , Kucharski, M.; Sechman, A. Effect of in vitro sodium fluoride treatment on CAT, SOD and Nrf mRNA expression and immunolocalisation in chicken (Gallus domesticus) embryonic gonads. Theriogenology 2020, 157, 263–275. [Google Scholar] [CrossRef] [PubMed]
- Mata-Pérez, C.; Sánchez-Calvo, B.; Padilla-Serrano, M.N.; Begara-Morales, J.C.; Luque, F.; Melguizo, M.; Jiménez-Ruiz, J.; Fierro-Risco, J.; Peñas-Sanjuán, A.; Valderrama, R.; Corpas, F.J.; Barroso, J.B. Nitro-fatty acids in plant signaling: nitro-linolenic acid induces the molecular chaperone network in Arabidopsis. Plant Physiol, 170:686-670. [CrossRef]
- Mata-Pérez C, Sánchez-Calvo B, Padilla M.N.; Begara-Morales, J.C.; Valderrama, R.; Corpas, F.J.; Barroso, J.B (2017) Nitro-fatty acids in plant signaling: new key mediators of nitric oxide metabolism. Redox Biol 2016, 11:554–561. [CrossRef]


| Virgin Olive Oil (VOO) | Virgin Argan Oil (VAO) | |||||
|---|---|---|---|---|---|---|
| MF | LF | TO | MF | LF | TO | |
| Total polyphenols (mg EAG/g dry weight) | 80.64±1.32 | 50.73±1.63 | 66.72±1.36 | 76.20±2.33 | 31.10±1.69 *** |
50.85±1.51 ** |
| Flavonoids (mg EQ/mg of dry weight) | 169±9.24 | 100.5±9.78 | 139.36±5.63 | 151.18±8.53 ** |
72.72±8.41 | 103.48±4.2 * |
| DPPH (% of inhibition) | 55.35±1.71 | 43.76±1.03 | 54.43±0.99 | 47.27±0.68 ** |
39.33±0.88 | 42.95±1.03 ** |
| FRAP (mg EAA/g of the extract) | 71.65±4.33 | 32.99±2.36 | 55.68±3.76 | 66.76±1.61 |
33.31±2.76 | 51.65±2.58 |
| ABTS (% of inhibition) | 49.31±1.48 | 32.24±1.77 | 50.11±0.72 | 39.26±1.51 * |
26.50±0.82 | 55.09±2.24 |
Disclaimer/Publisher’s Note: The statements, opinions and data contained in all publications are solely those of the individual author(s) and contributor(s) and not of MDPI and/or the editor(s). MDPI and/or the editor(s) disclaim responsibility for any injury to people or property resulting from any ideas, methods, instructions or products referred to in the content. |
© 2023 by the authors. Licensee MDPI, Basel, Switzerland. This article is an open access article distributed under the terms and conditions of the Creative Commons Attribution (CC BY) license (http://creativecommons.org/licenses/by/4.0/).


