1. Introduction
The successful execution of the race strategy at the major competitions of the season represents the final challenge after months of training and preparation. To perform to the best of their abilities while remaining healthy, engaged, and injury-free, athletes must be mentored and coached in proper energy management through an appropriate pacing strategy, whether during training or competitions. Given the highly resistive properties of water, pacing strategy in swimming is a crucial aspect of performance and it can significantly impact training and race outcomes [
1,
2,
3,
4,
5,
6,
7,
8,
9].
Events of different lengths support various pacing strategies [
3]. An "all-out" sprint strategy may be advantageous for sprints lasting less than 60 seconds, whereas athletes' longer-duration endurance performances may be enhanced by distributing energy resources more evenly, with minimal speed variation from lap to lap and an end spurt [
5,
10]. It has been reported that swimmers competing in the shortest event had a minimal gap between them and the leaders had begun the race in the head group. Successful swimmers in the longer events adopted a more cautious strategy in the first half of the race by positioning themselves in the middle group [
11]. It is important to note that reports of ~2.1% per decade improvements in swimming ability have been made. However, the long-distance pool swimming race splits showed improvements, but not consistently. The percentage changes in the first, second, penultimate, and last splits did not coincide with the percentage changes in race time, indicating that the gain in race time was primarily attained in the middle of the race. The slight decrease in lap-to-lap variability, which indicated that swimmers had gradually developed smoother pacing profiles, was the other notable change in pacing parameters [
12]. It is therefore evident that the study of pacing strategy must be continuously updated in the light of the evolution of sports performance.
Evidence suggests that the overall pacing strategy is adjusted during prolonged exercise to prevent early exhaustion brought on by a malfunction of one or more physiological systems. Therefore, it is asserted that pacing strategies are indicators of the physiological regulation that underlies them and that pacing strategies are influenced by adjustments in muscle activation that are anticipatory in nature, based on afferent data from a variety of physiological systems [
13,
14,
15]. Due to the low mechanical efficiency of swimming the correct administration of the available energy is also highly dependent on technical abilities. However, in competition the athlete's surroundings constantly and simultaneously present various external stimuli, requiring decision-making regarding where and when to allocate their accessible energy resources. These calls for action can appear and disappear over time and prompt an athlete to decide whether to maintain their current speed, slow down, or speed up [
16]. It could thus be assumed that swimmers would be more or less exposed to those external stimuli depending on the length of the race. Studying the pace strategy in events with similar energetic resources but different durations may aid in understanding how much pacing decision-making is influenced by external factors [
16,
17,
18].
At least 90% of the energy used during the 800 and 1500-meter freestyle competitions is thought to come from aerobic metabolism [
19,
20]. Indeed, numerous swimmers actually compete in both distances due to their similar energy requirements. Although few studies have compared their race tactics, it appears plausible that they adopted similar pacing strategies, so a parallel analysis of the two events may be instructive [
7,
8,
21].
World records are an excellent paradigm of study because they led to the most optimal and outstanding performances in history. The study of world-class athletes’ performance can provide a near-absolute standard of what athletes can achieve at their peak [
22]. Simulating their competition strategy in training and minor races could provide useful indications to develop the swimmer’s individual best pacing strategy for future events [
9,
23,
24,
25,
26,
27]. To provide the most individualised spectrum of the best pacing strategy, the analysis of real-world top-level competitions should be differentiated by sex, age, and competition level [
3,
28,
29].
The aim of the study was to determine whether choosing a swimming pacing strategy depends on the length of the competition and to conduct an updated parallel analysis of two endurance swimming events supported by similar energy resources but of different durations. To this purpose, the pacing strategies of all the elite and junior 2022-2023 world championships finalists in the 800 and 1500-meter freestyle competitions have been compared. To gain deeper insight into the specificity of swimmer’s tactics the analysis was also differentiated by sex, age, and performance level.
2. Materials and Methods
All procedures were conducted according to the Helsinki Declaration. The ethics committee of the University of Rome Foro Italico approved and authorised this project, assigning the code CAR 155/2023. Informed consent from athletes was not deemed necessary, since only publicly available information was used. Competitions data on the male and females 800 and 1500-meter freestyle swimming long-course world championships were downloaded from the websites
https://www.worldaquatics.com/swimming, consulted from 1 to 20 August 2023. All data were gathered and retrospectively analysed anonymously. Each competition report included a subject identification number for each athlete, the name of the competition, distance, overall finishing position (ranking), split times (split) every 50 m, and the completion time. Procedures and methods of the present work have been previously described [
9].
A total of 96 results relative to 48 male and 48 female finalists of the 800 and 1500-meter freestyle at long course elite and junior world championships held in 2022 and 2023 were studied. The results of the 19th FINA World Championships Budapest (Hungary), 8th FINA World Junior Swimming Championships Lima (Peru), World Aquatics Championships Fukuoka (Japan) were analysed. Elite swimmers’ age was 23.2±3.4 years, juniors’ age was 16.4±1.4 years.
2.1. Data analysis
A mathematical analysis was applied to test the randomness of splits variations through the median time and to analyse the ascendent and descendent trend of the time series. The time series analysis consists of assessing whether the split times should be considered as a true time series or as random samples. The study of data indexed by time is mathematically meaningless if a statistical test performed on the data does not lead to the rejection of randomness. A standard statistical test was applied to reject, or not, the null hypothesis that a sequence is a random sample counting turning points, phase lengths, difference-sign, rank correlation, records, and rank serial correlation. The test is based on a statistic denoted by (n an t), with critical values given by and defined as follows: it is considered a series a maximal sequence of consecutive measurements that is monotonous; then, n is the number of such series and t the length of the longest one. If one of the inequalities
where [x] denotes the integer part of x, we reject randomness; in other words, we conclude that the sequence x1, …, xn can be considered as a true time series, not as a random sample. In our case, n = 16 and n=30 so that the critical region is given by
n > 4.204 or τ < 5 for 800-meter and n > 9.723 or τ < 6 for 1500-meter
For each finalist, the length of split sequences was calculated as the count of how many consecutive splits were held faster (indicated with − “minus” sign) or slower (indicated with + “plus” sign) than the median velocity. The number of sequences of splits was assessed as the count of the number of − or + sequence. The maximal length of split sequences was assessed as the longest sequence holding the same − or + sign.
2.2. Variables analysed
Race Time % Record Time – To assess performance level of each athlete, we considered their finish time of the competition as percentage of their respective record time (Race Time % Record Time) and divided in performers closest (100-105% of WR) and farther from the record time (105-112% of WR).
Coefficient of variation - The coefficient of variation in velocity along the race has been calculated as percentage of the standard deviation of the split times divided by the mean of the split times (CV%).
Sequences Number % Splits' Number - The count of the number of negative or positive (− or +) acceleration sequence as percentage of the number of splits of each race.
Maximal length of sequences % Splits' Number - The longest sequence holding the same − or + sign as percentage of the number of splits of each race.
Time series - When the sequence represented a true time series it has been given the value 1, half of the sequence was a true time series the value 2 and if it was a random series the value 3 (Time series 1 - Half 2 - Random 3).
Normalised velocity - Each split time has been expressed as percentage of the mean individual split times. To compare the split times between the two distances the splits 2-29 of the 1500-meter race have been considered every 100 m thus obtaining the same number of splits as the 800-meter race (n=16).
All variables have been compared between 800 and 1500-meter races in all swimmers, and then separating males and females, elite and junior, medallists (placed from 1st to 3rd) and non-medallists (placed from 4th to last), 100-105% and 105-112% of world records.
2.3. Statistical Analysis
Descriptive statistics (mean±SD) and effect size (ES) are reported for each category. The normality of the data was analysed by the Shapiro–Wilk test. ANOVA, Mann–Whitney U, or Kruskal-Wallis for repeated measures with post-hoc corrected for Bonferroni tests, were applied when appropriate depending on data distribution.
Statistical analyses were performed using IBM SPSS Statistics for Windows, version 26.0 (IBM Corp, Armonk, NY, United States). Level of significance was set at p < 0.05.
3. Results
As described in
Table 1, None of the swimmers of the world championships analysed reached or improved the respective world record. All final times resulted within 101% and 112% of world records. Race times in percentage of respective word records presented no differences between the 800 and 1500-meter competitions, except for males, elite and 100-105% swimmers that reached times closer to the respective world records in the 1500-meter race.
As shown in
Table 2, sequence numbers were significantly higher in the 800-meter competitions for all swimmer’s groups. The maximal length of sequences of the same sign (- or +) were longer in the 800-meter competitions but the difference reached significant level only when all swimmers were analysed as a whole and for the junior, medallists and 105-112% groups.
As displayed in
Table 3, the time series analysis revealed that the 1500-meter competitions presented significantly higher occurrence of “true” time series with respect to the 800-meter competitions when all swimmers results were taken as a whole, and for the male and the elite groups. The coefficient of variation in velocity along the race (CV%) was non significantly greater in the 800-meter competitions for all groups.
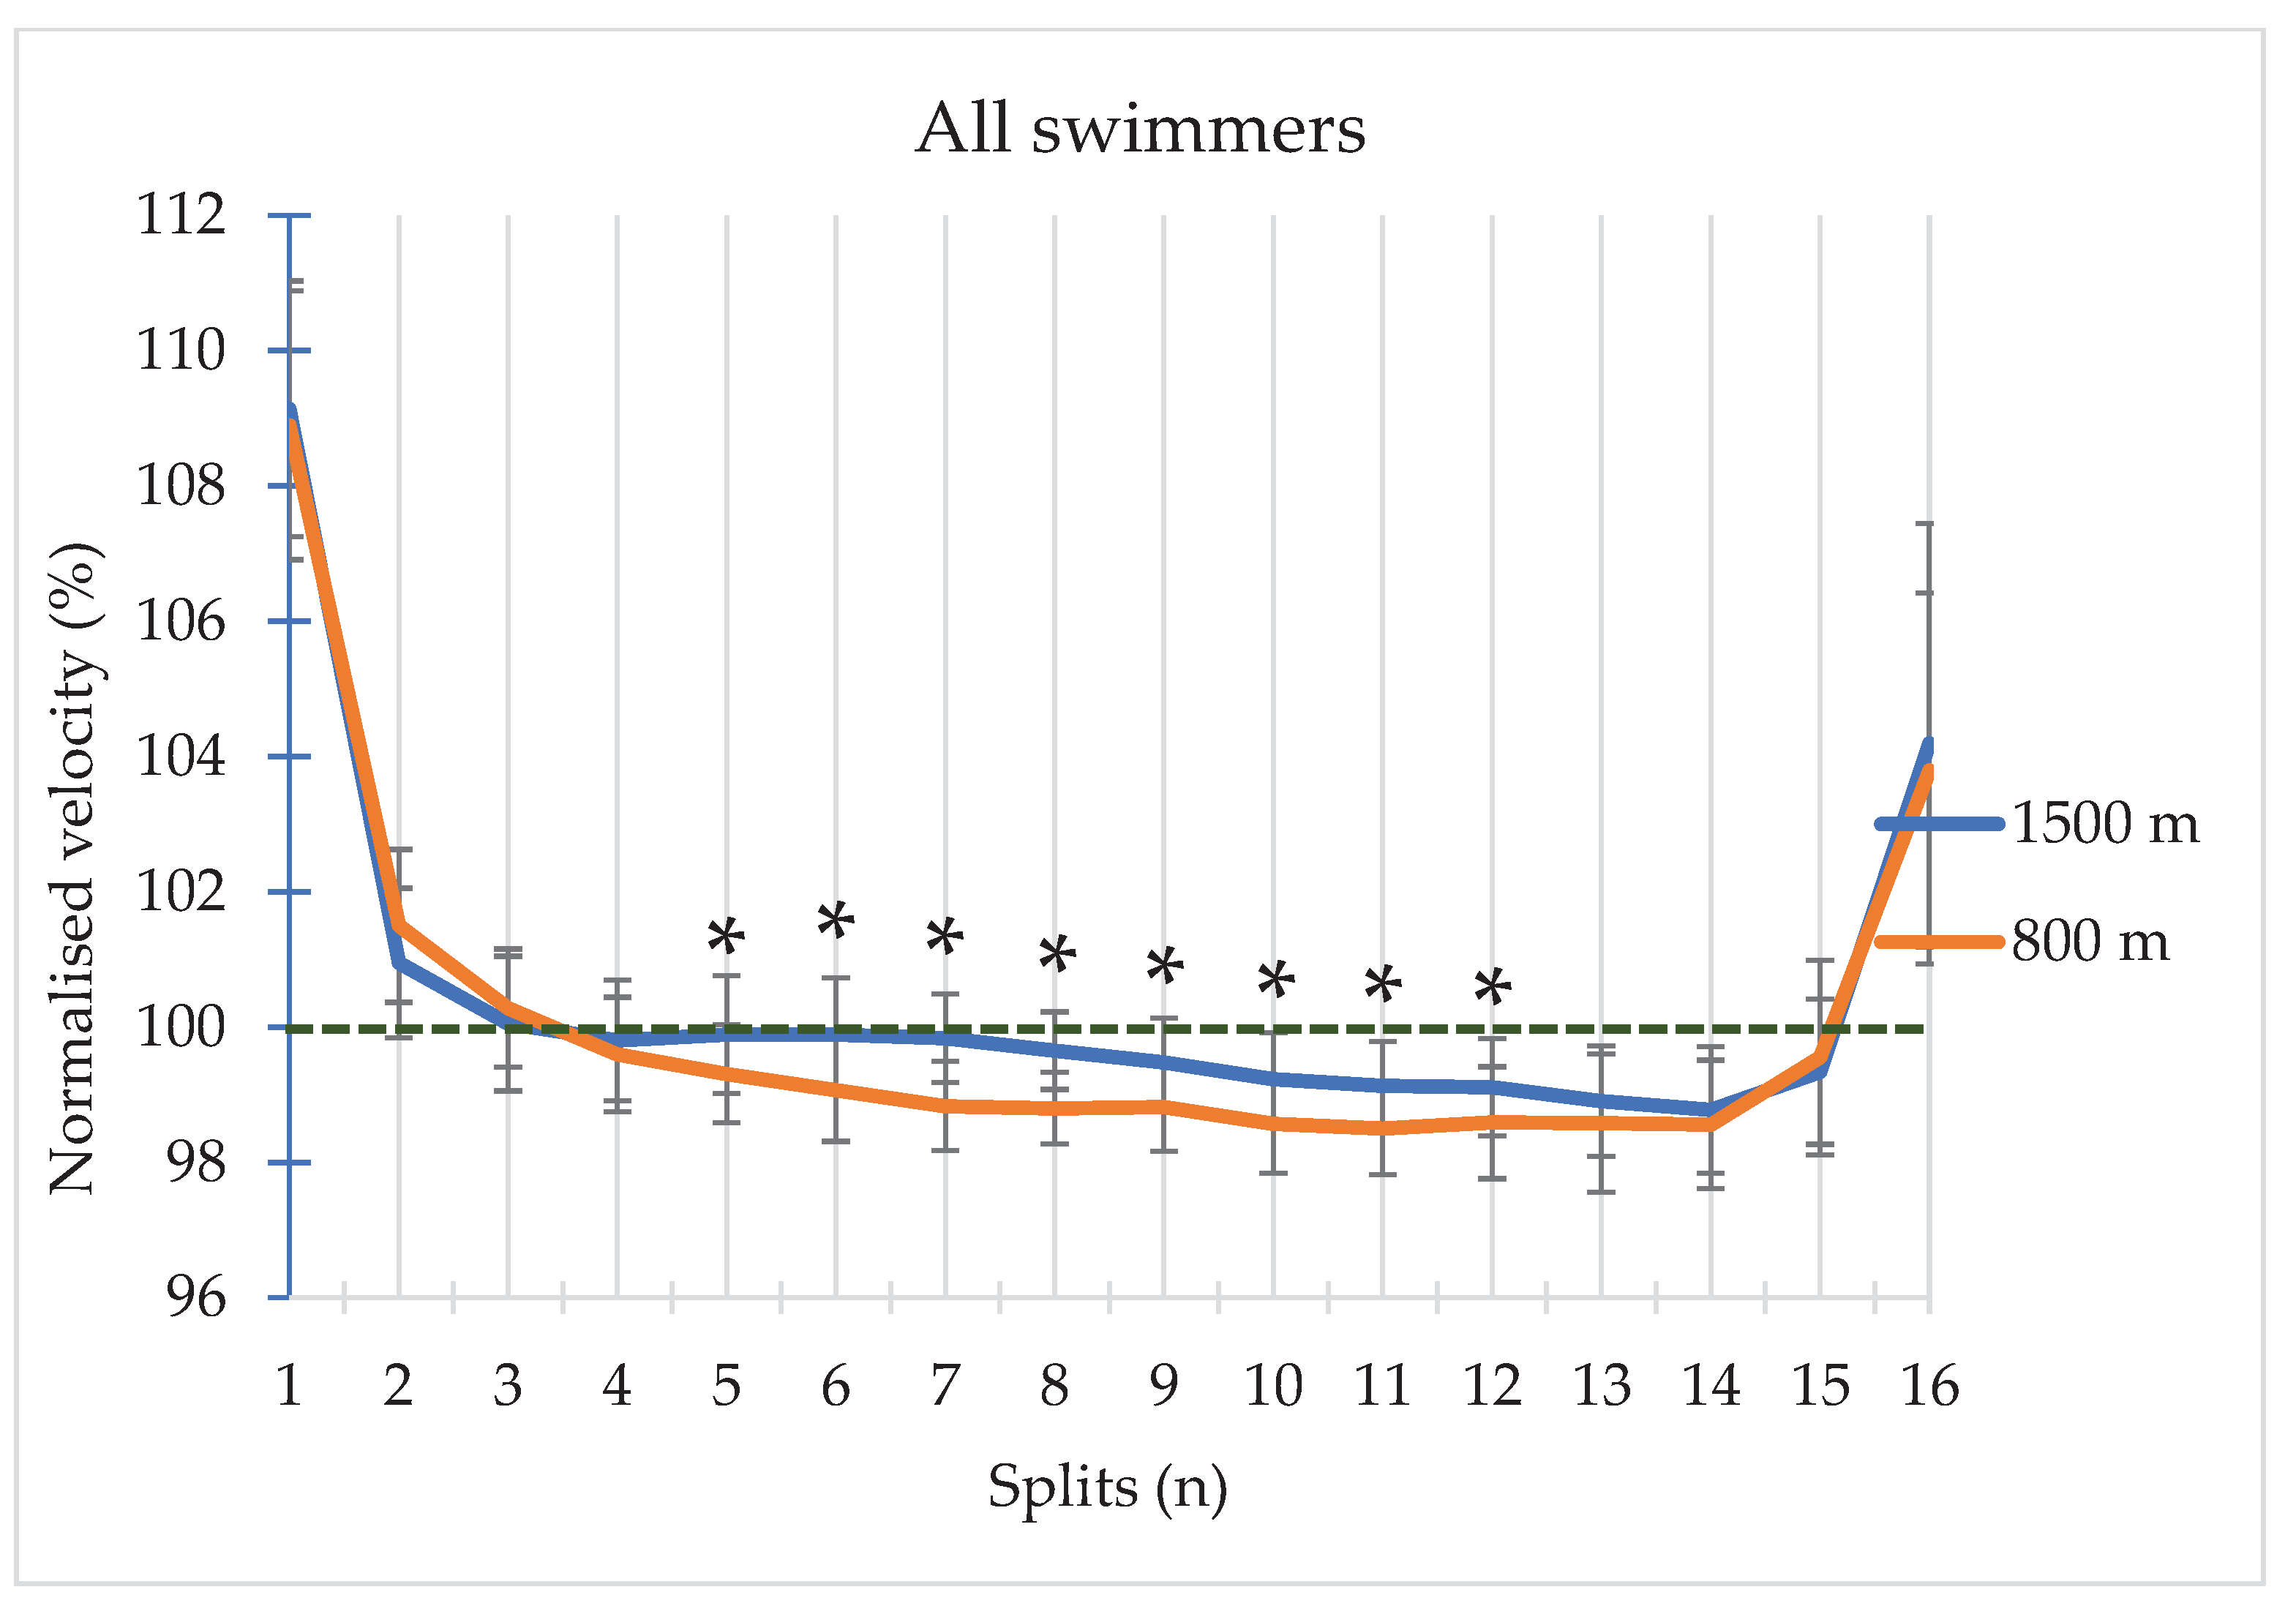
Figure 1 illustrates how the normalised velocity of the whole group of swimmers in the 1500-meter with respect to the 800-meter competitions resulted significantly faster from the 5th to the 12th split. The 1500-meter velocity remained closed to the mean velocity (100%) from the 3rd to the 7th split and declined afterwards until the spurt of the two last splits. The 800-meter were competed at velocity notably below the mean from the 5th to the 14th split.
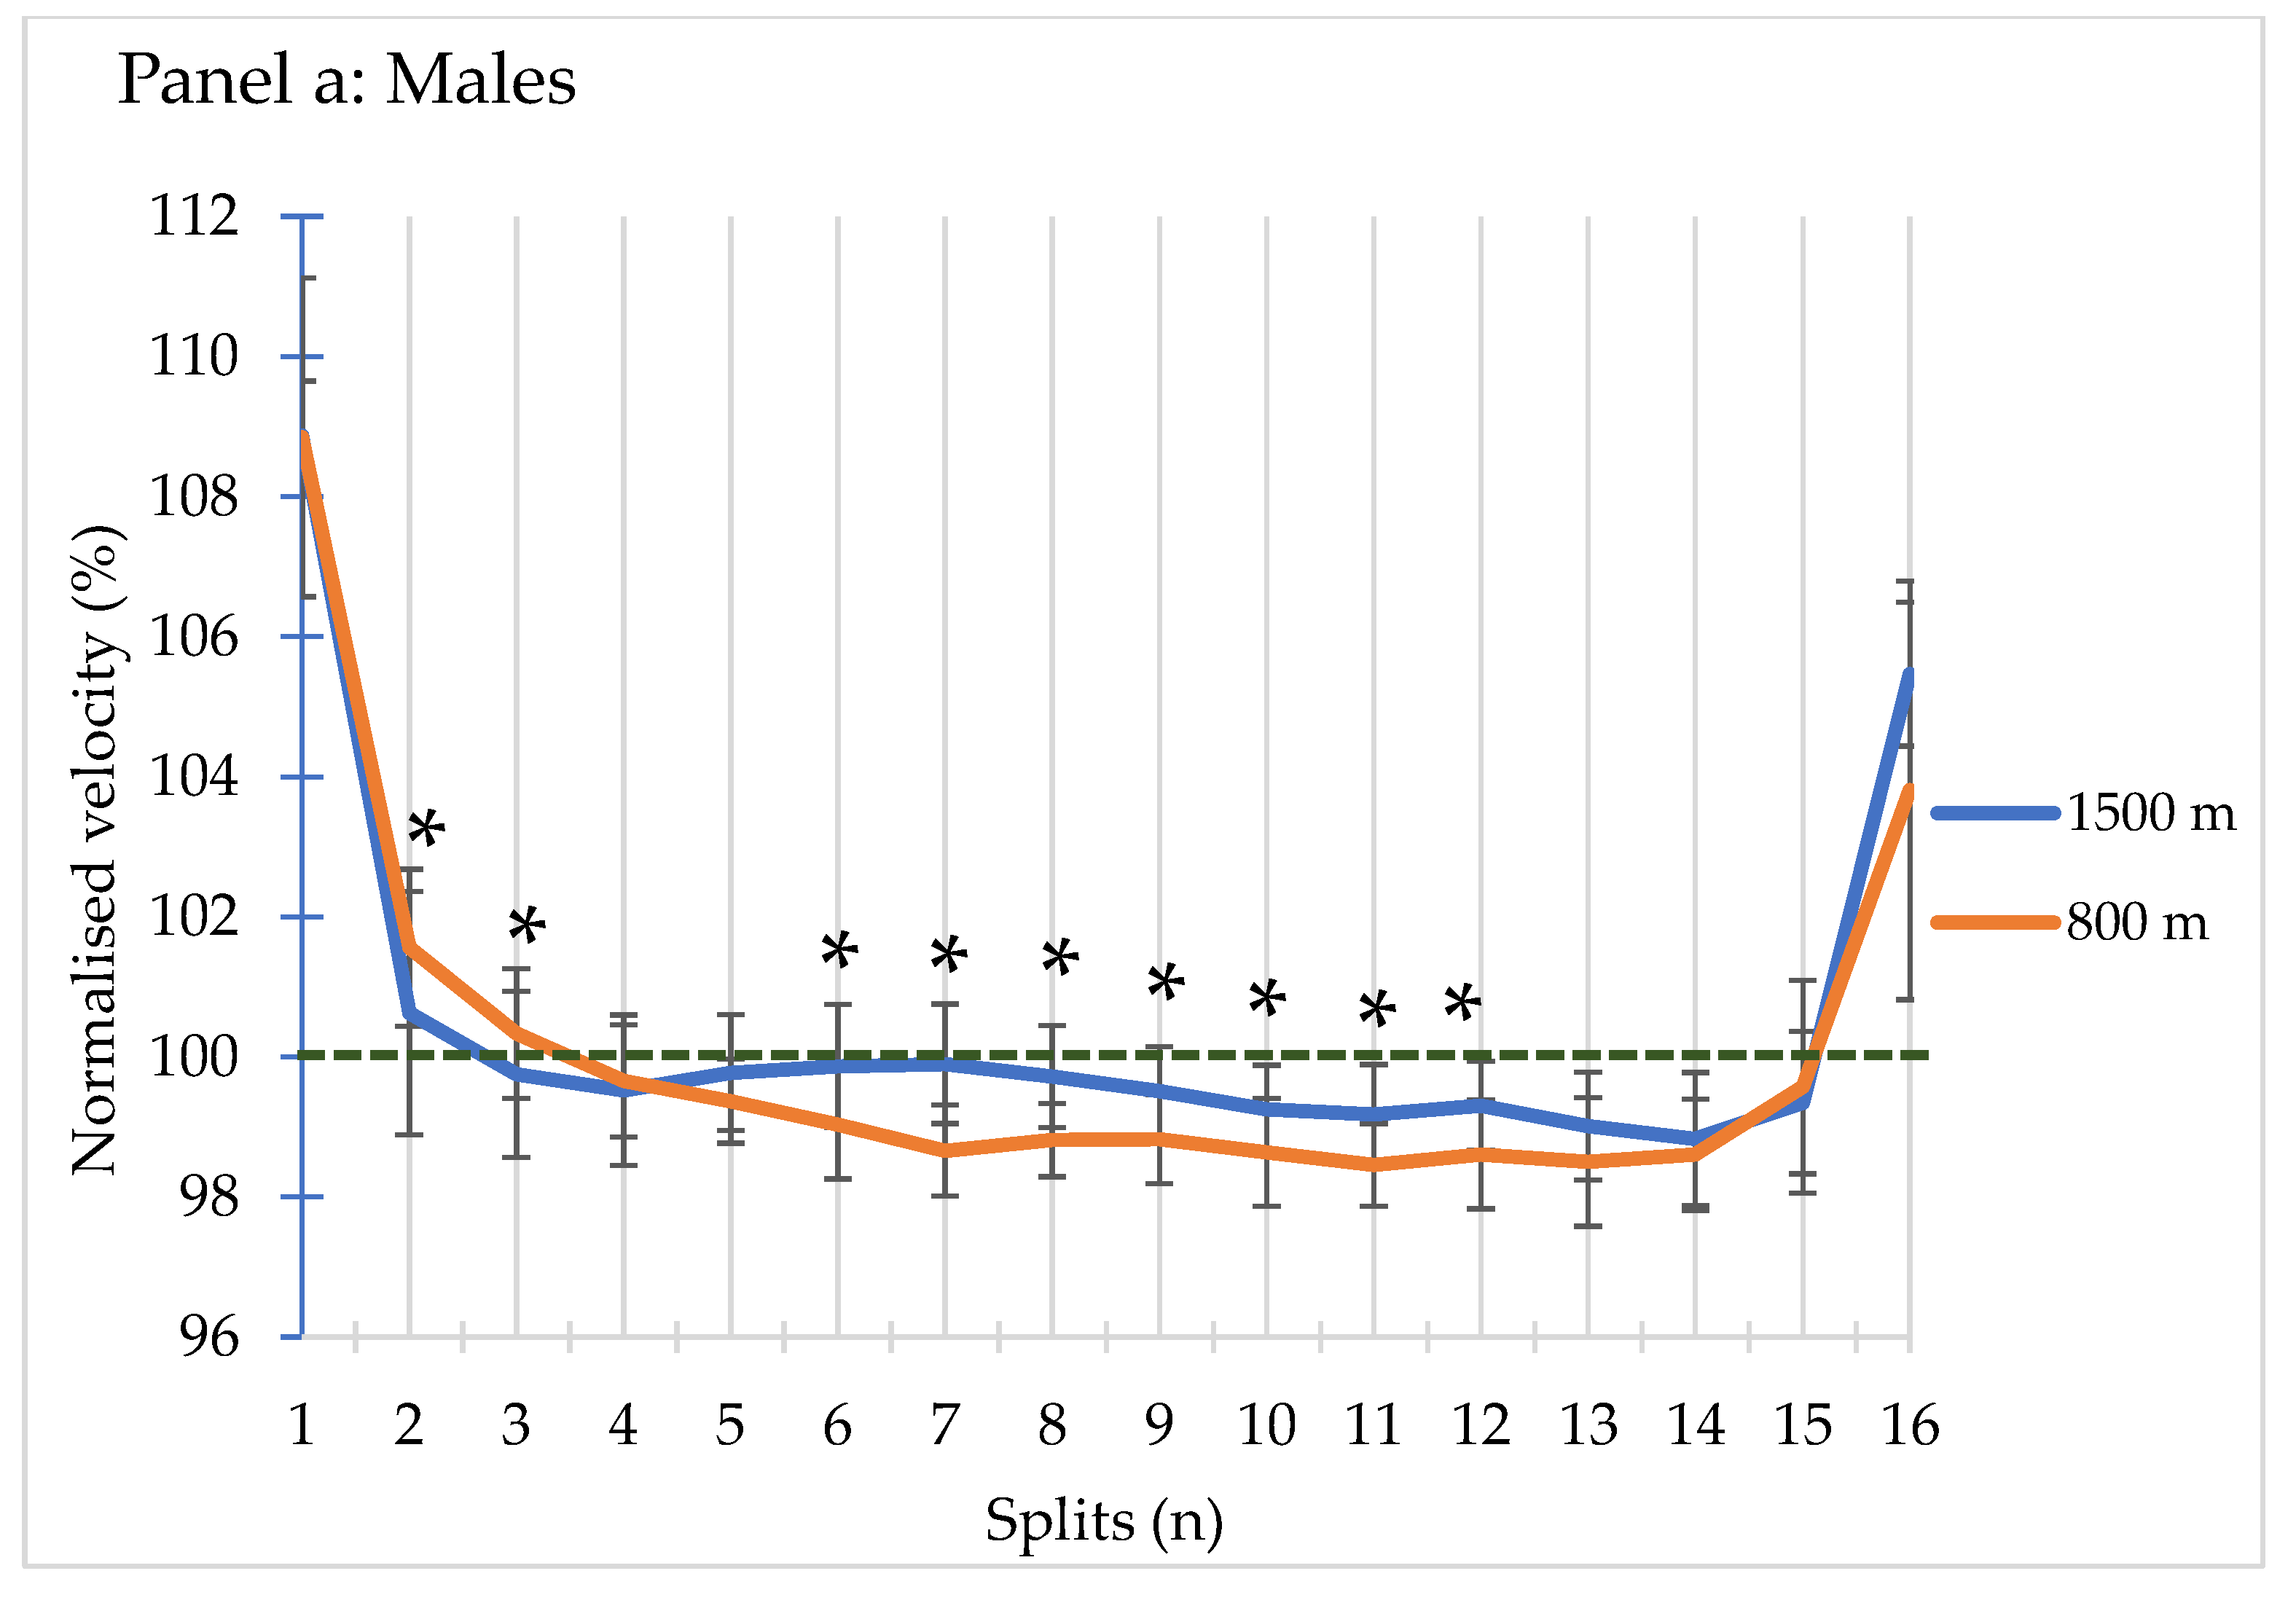
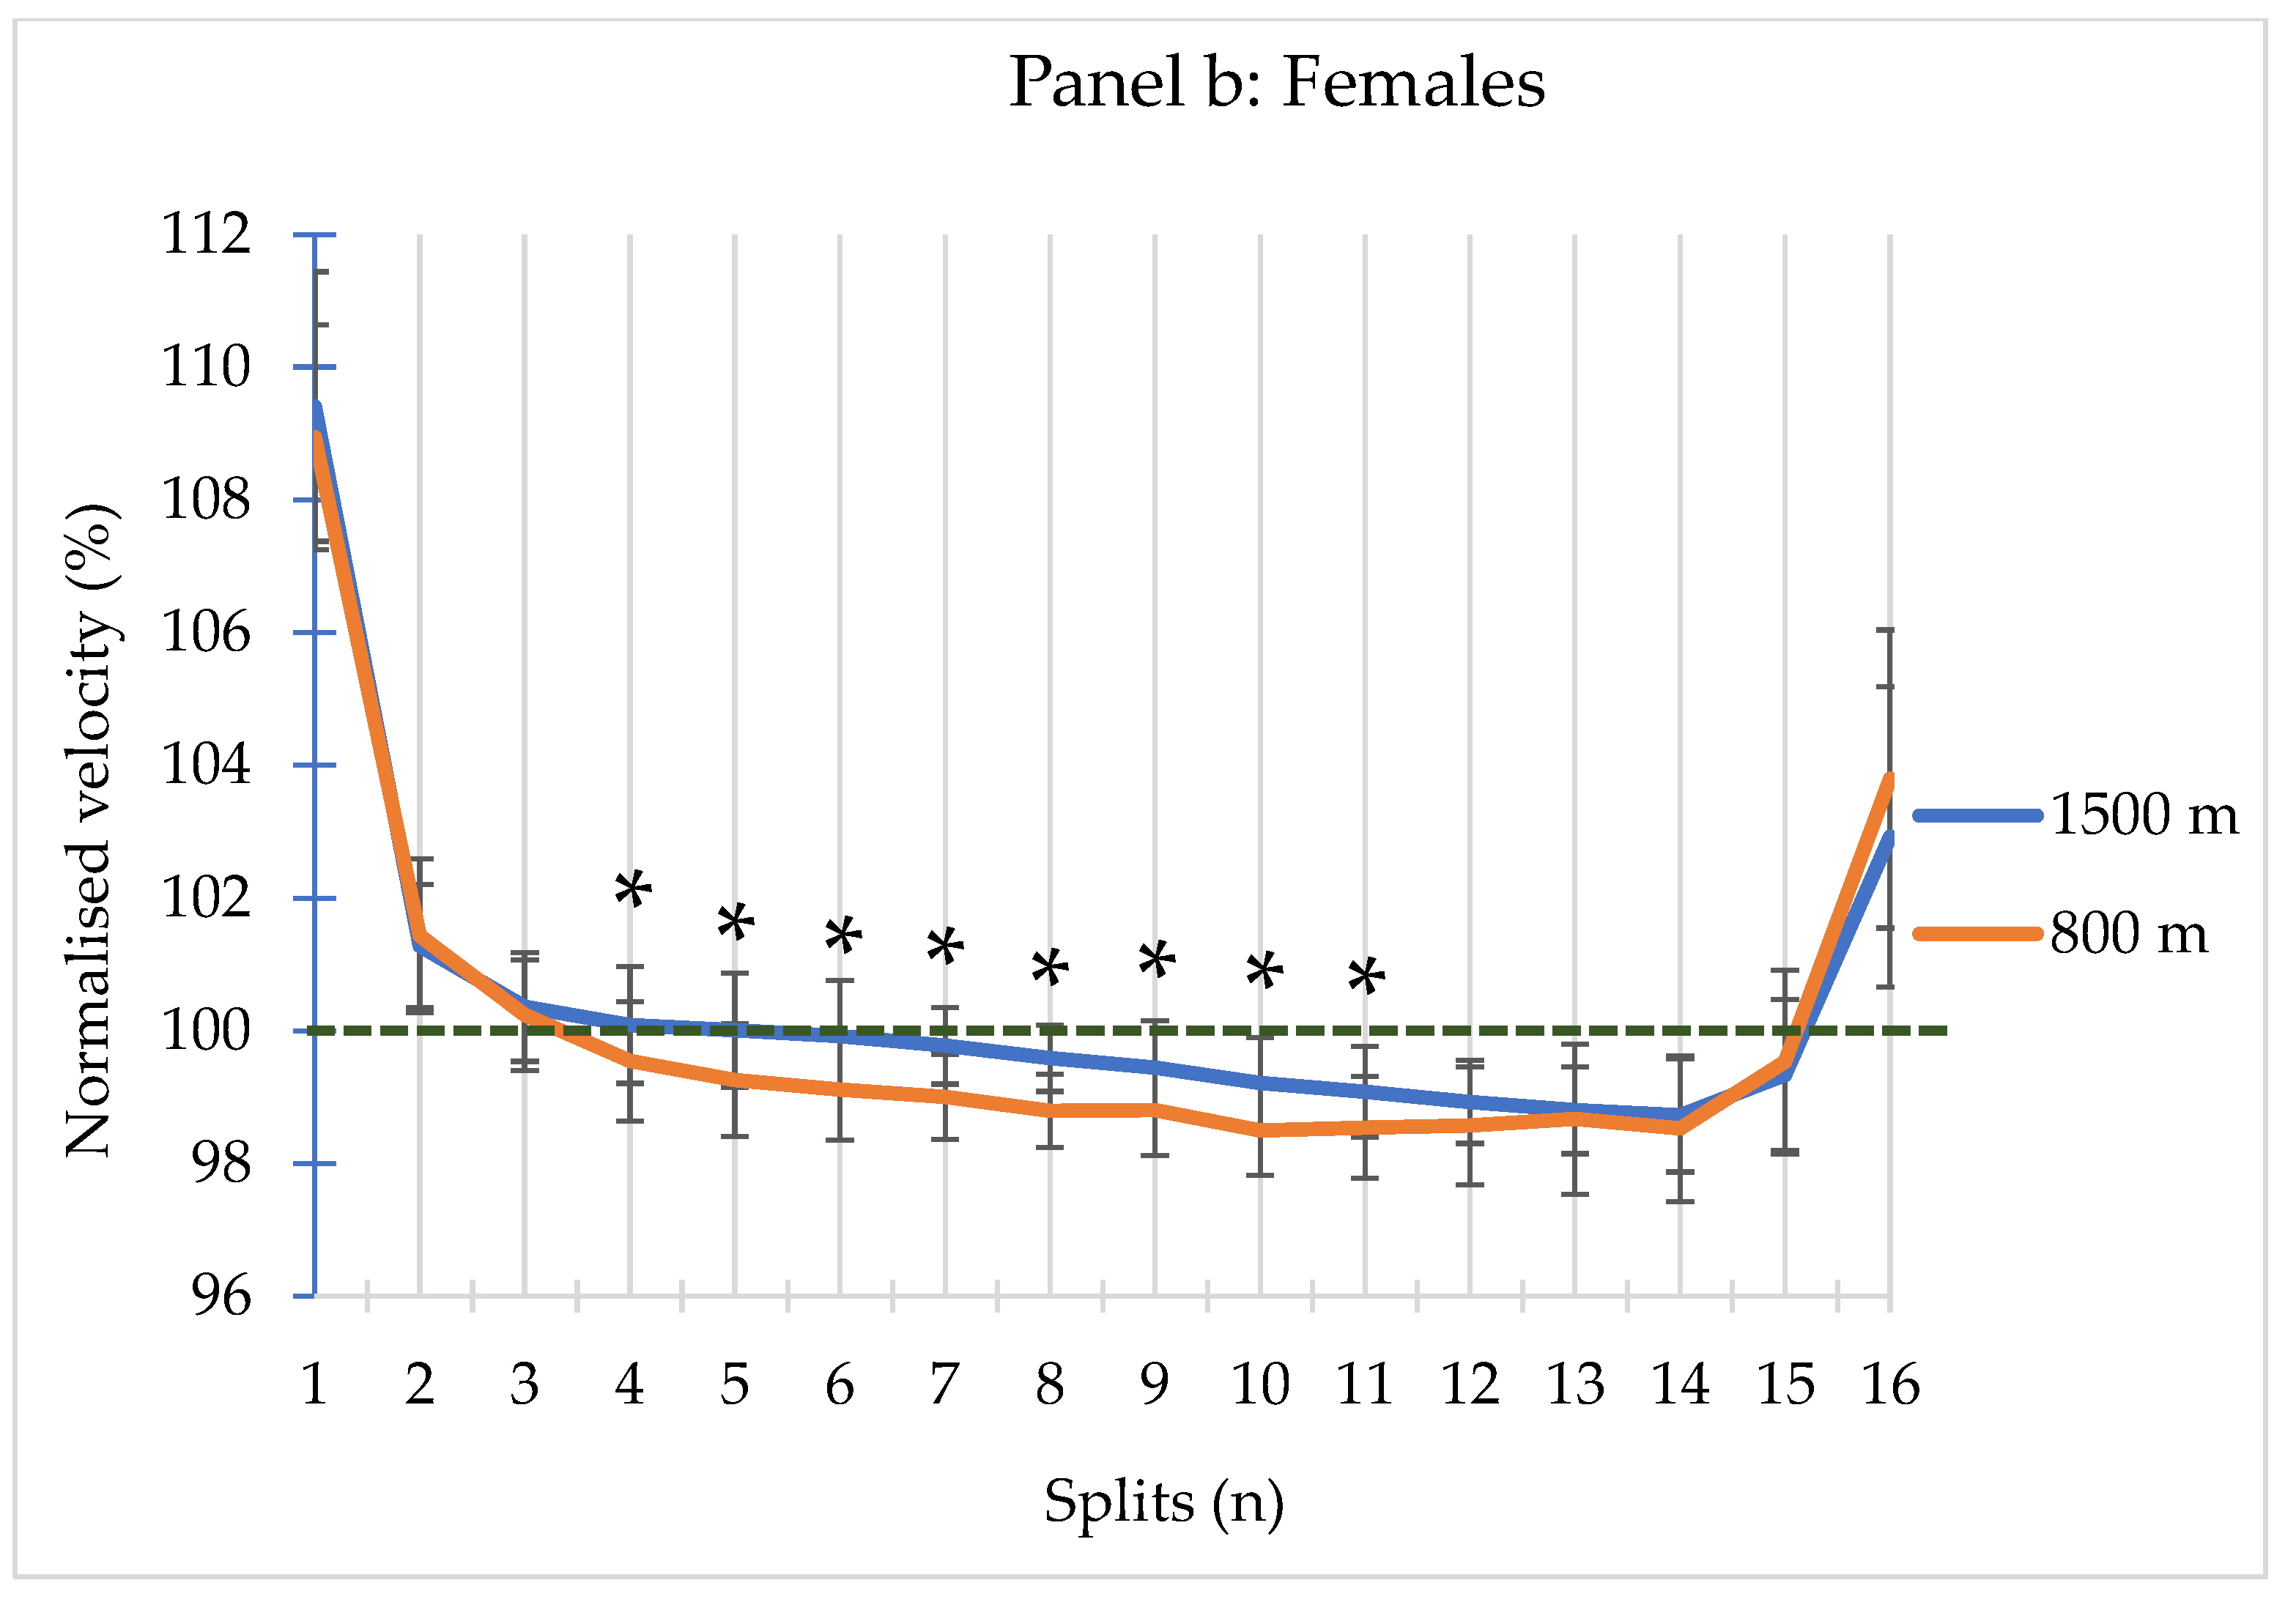
Figures 2a and
2b represent how the male swimmer’s normalised velocity was significantly lower in the 2nd and 3rd and higher from the 6th to the 12th spilt in the 1500-meter than in the 800-meter competitions. Female’s normalised velocity resulted significantly higher in the 1500-meter than in the 800-meter competitions from the 4th to the 11th split.
Female swimmers presented significantly lower normalised velocity with respect to men in the 10th (P= 0.035) and 15th (P= 0.004) split of the 1500-meter competition and in the 8th (P= 0.018), 9th (P= 0.004), 12th (P= 0.037), 15th (P= 0.014) and last (P= 0.000) splits of the 800-meter competition. Their 1st splits velocity of the 800-meter competition was significantly higher than male’s (P= 0.023).
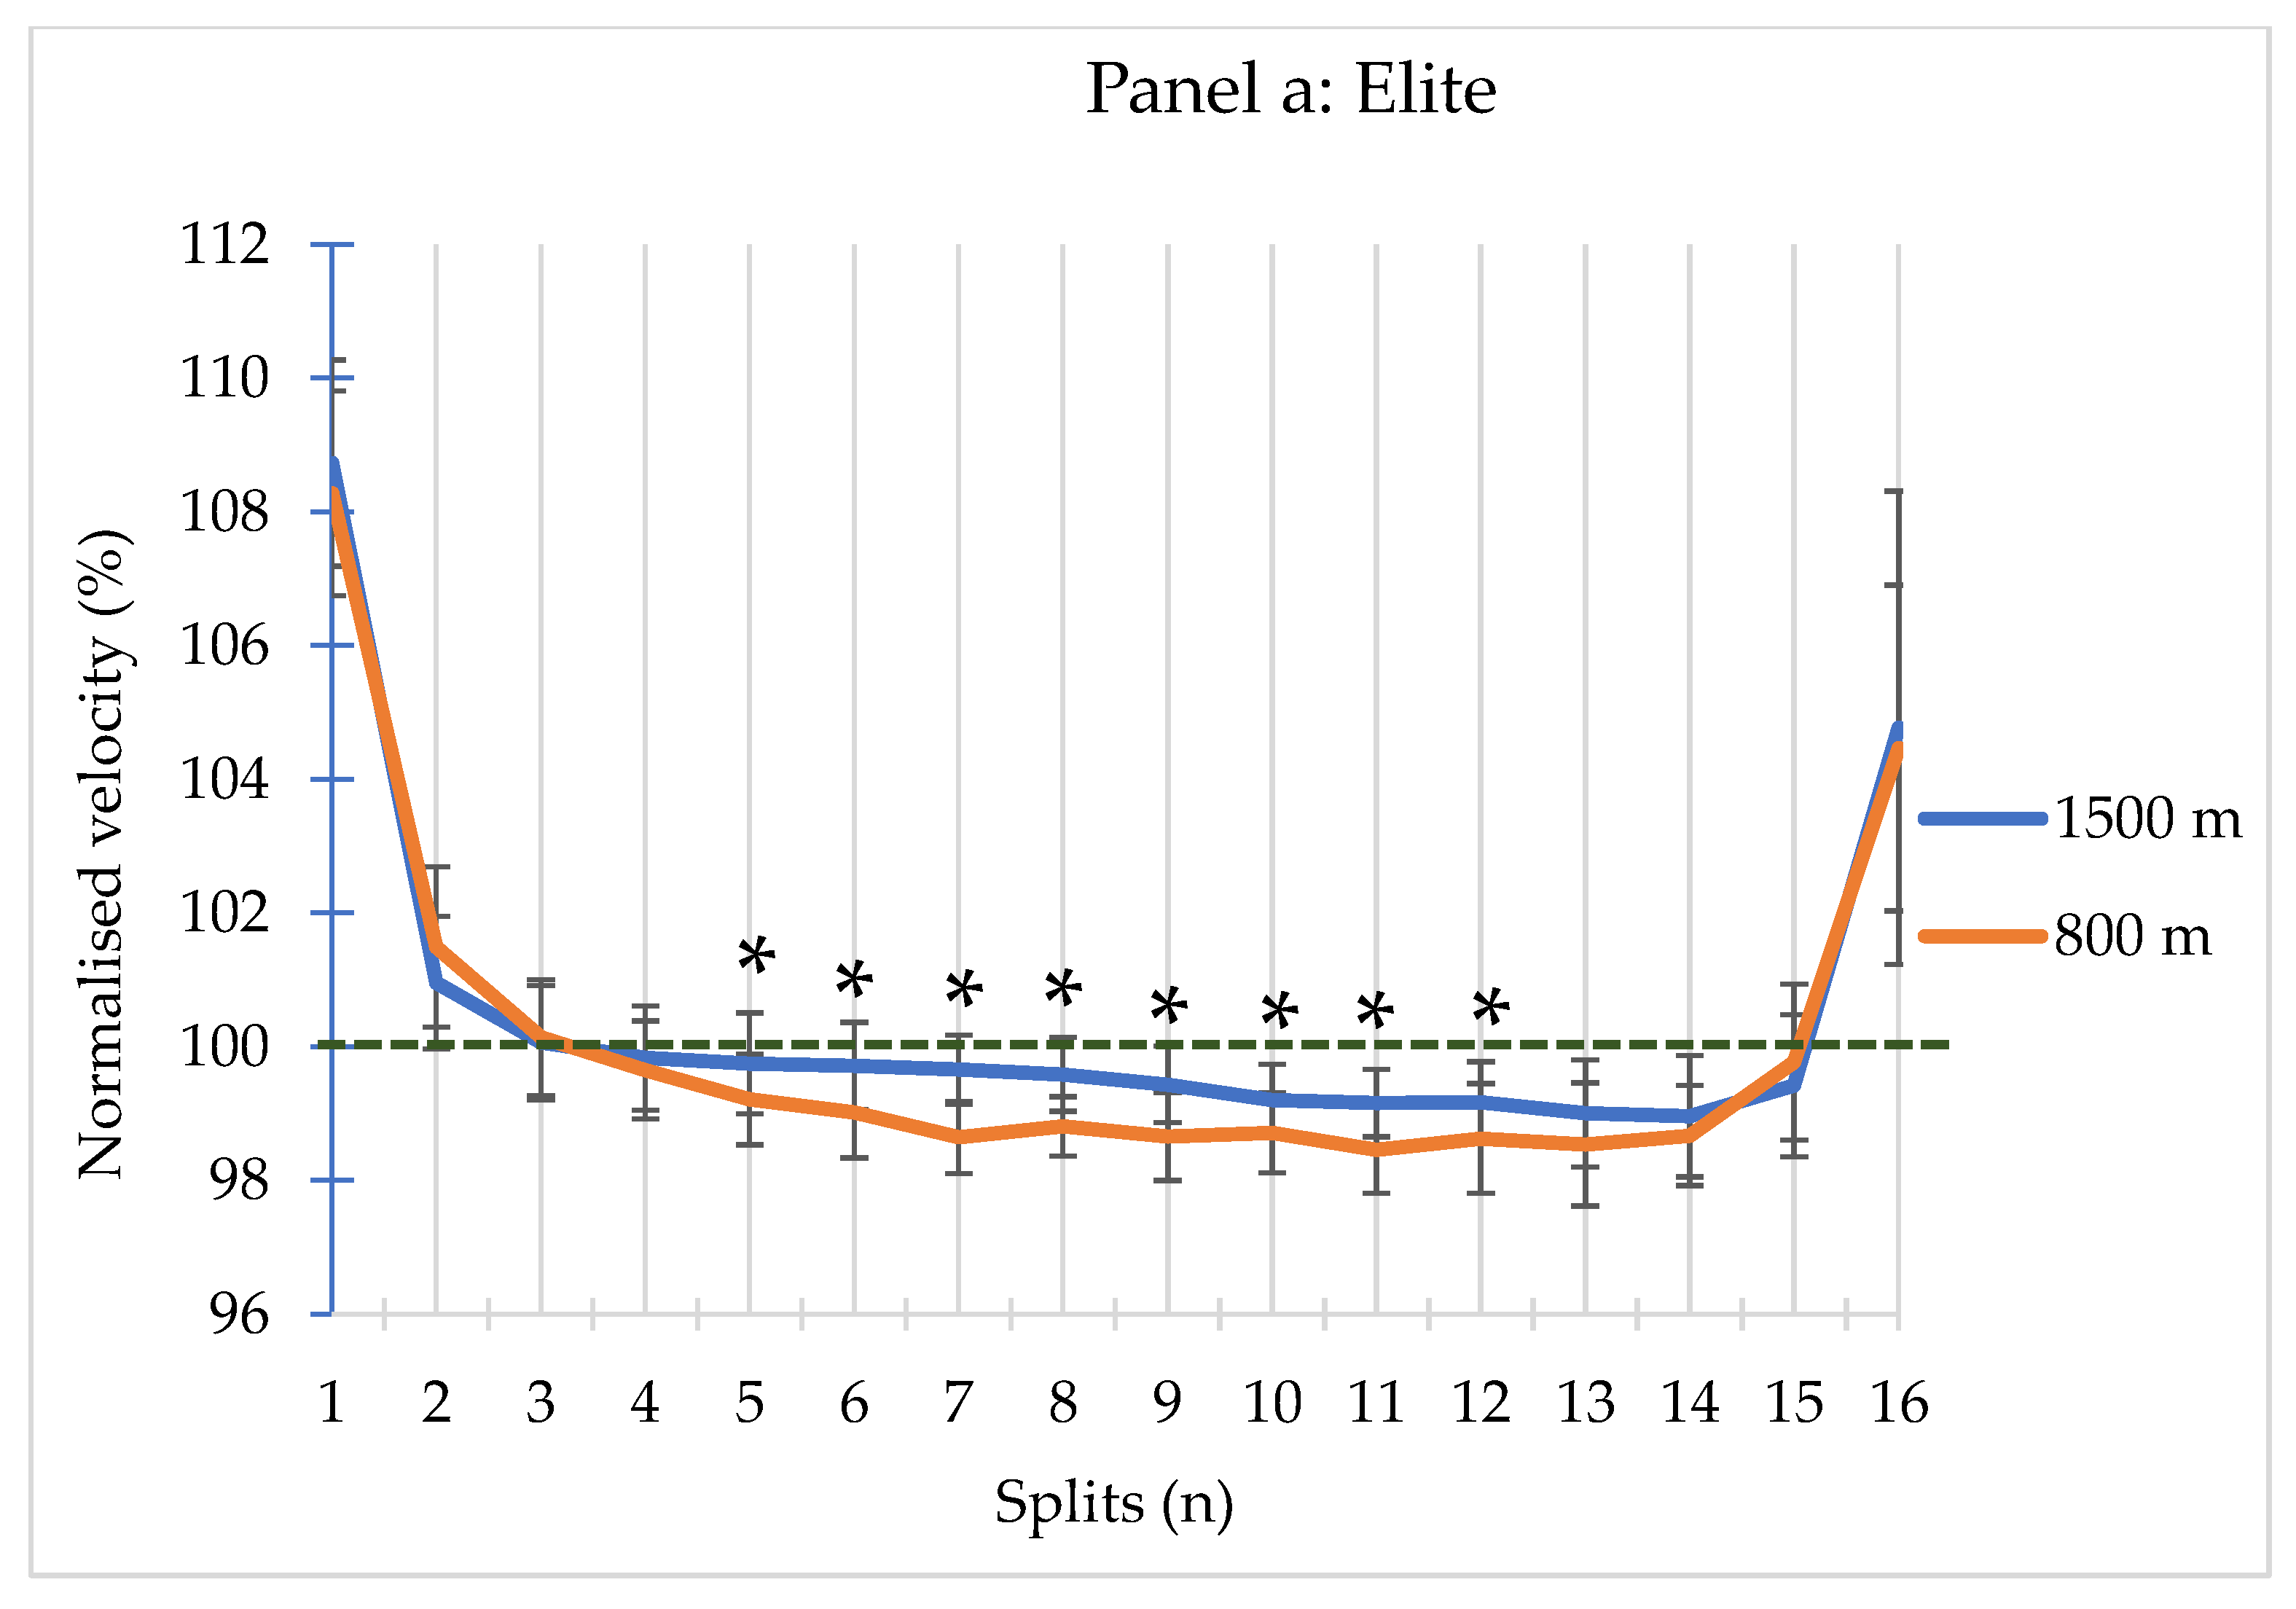
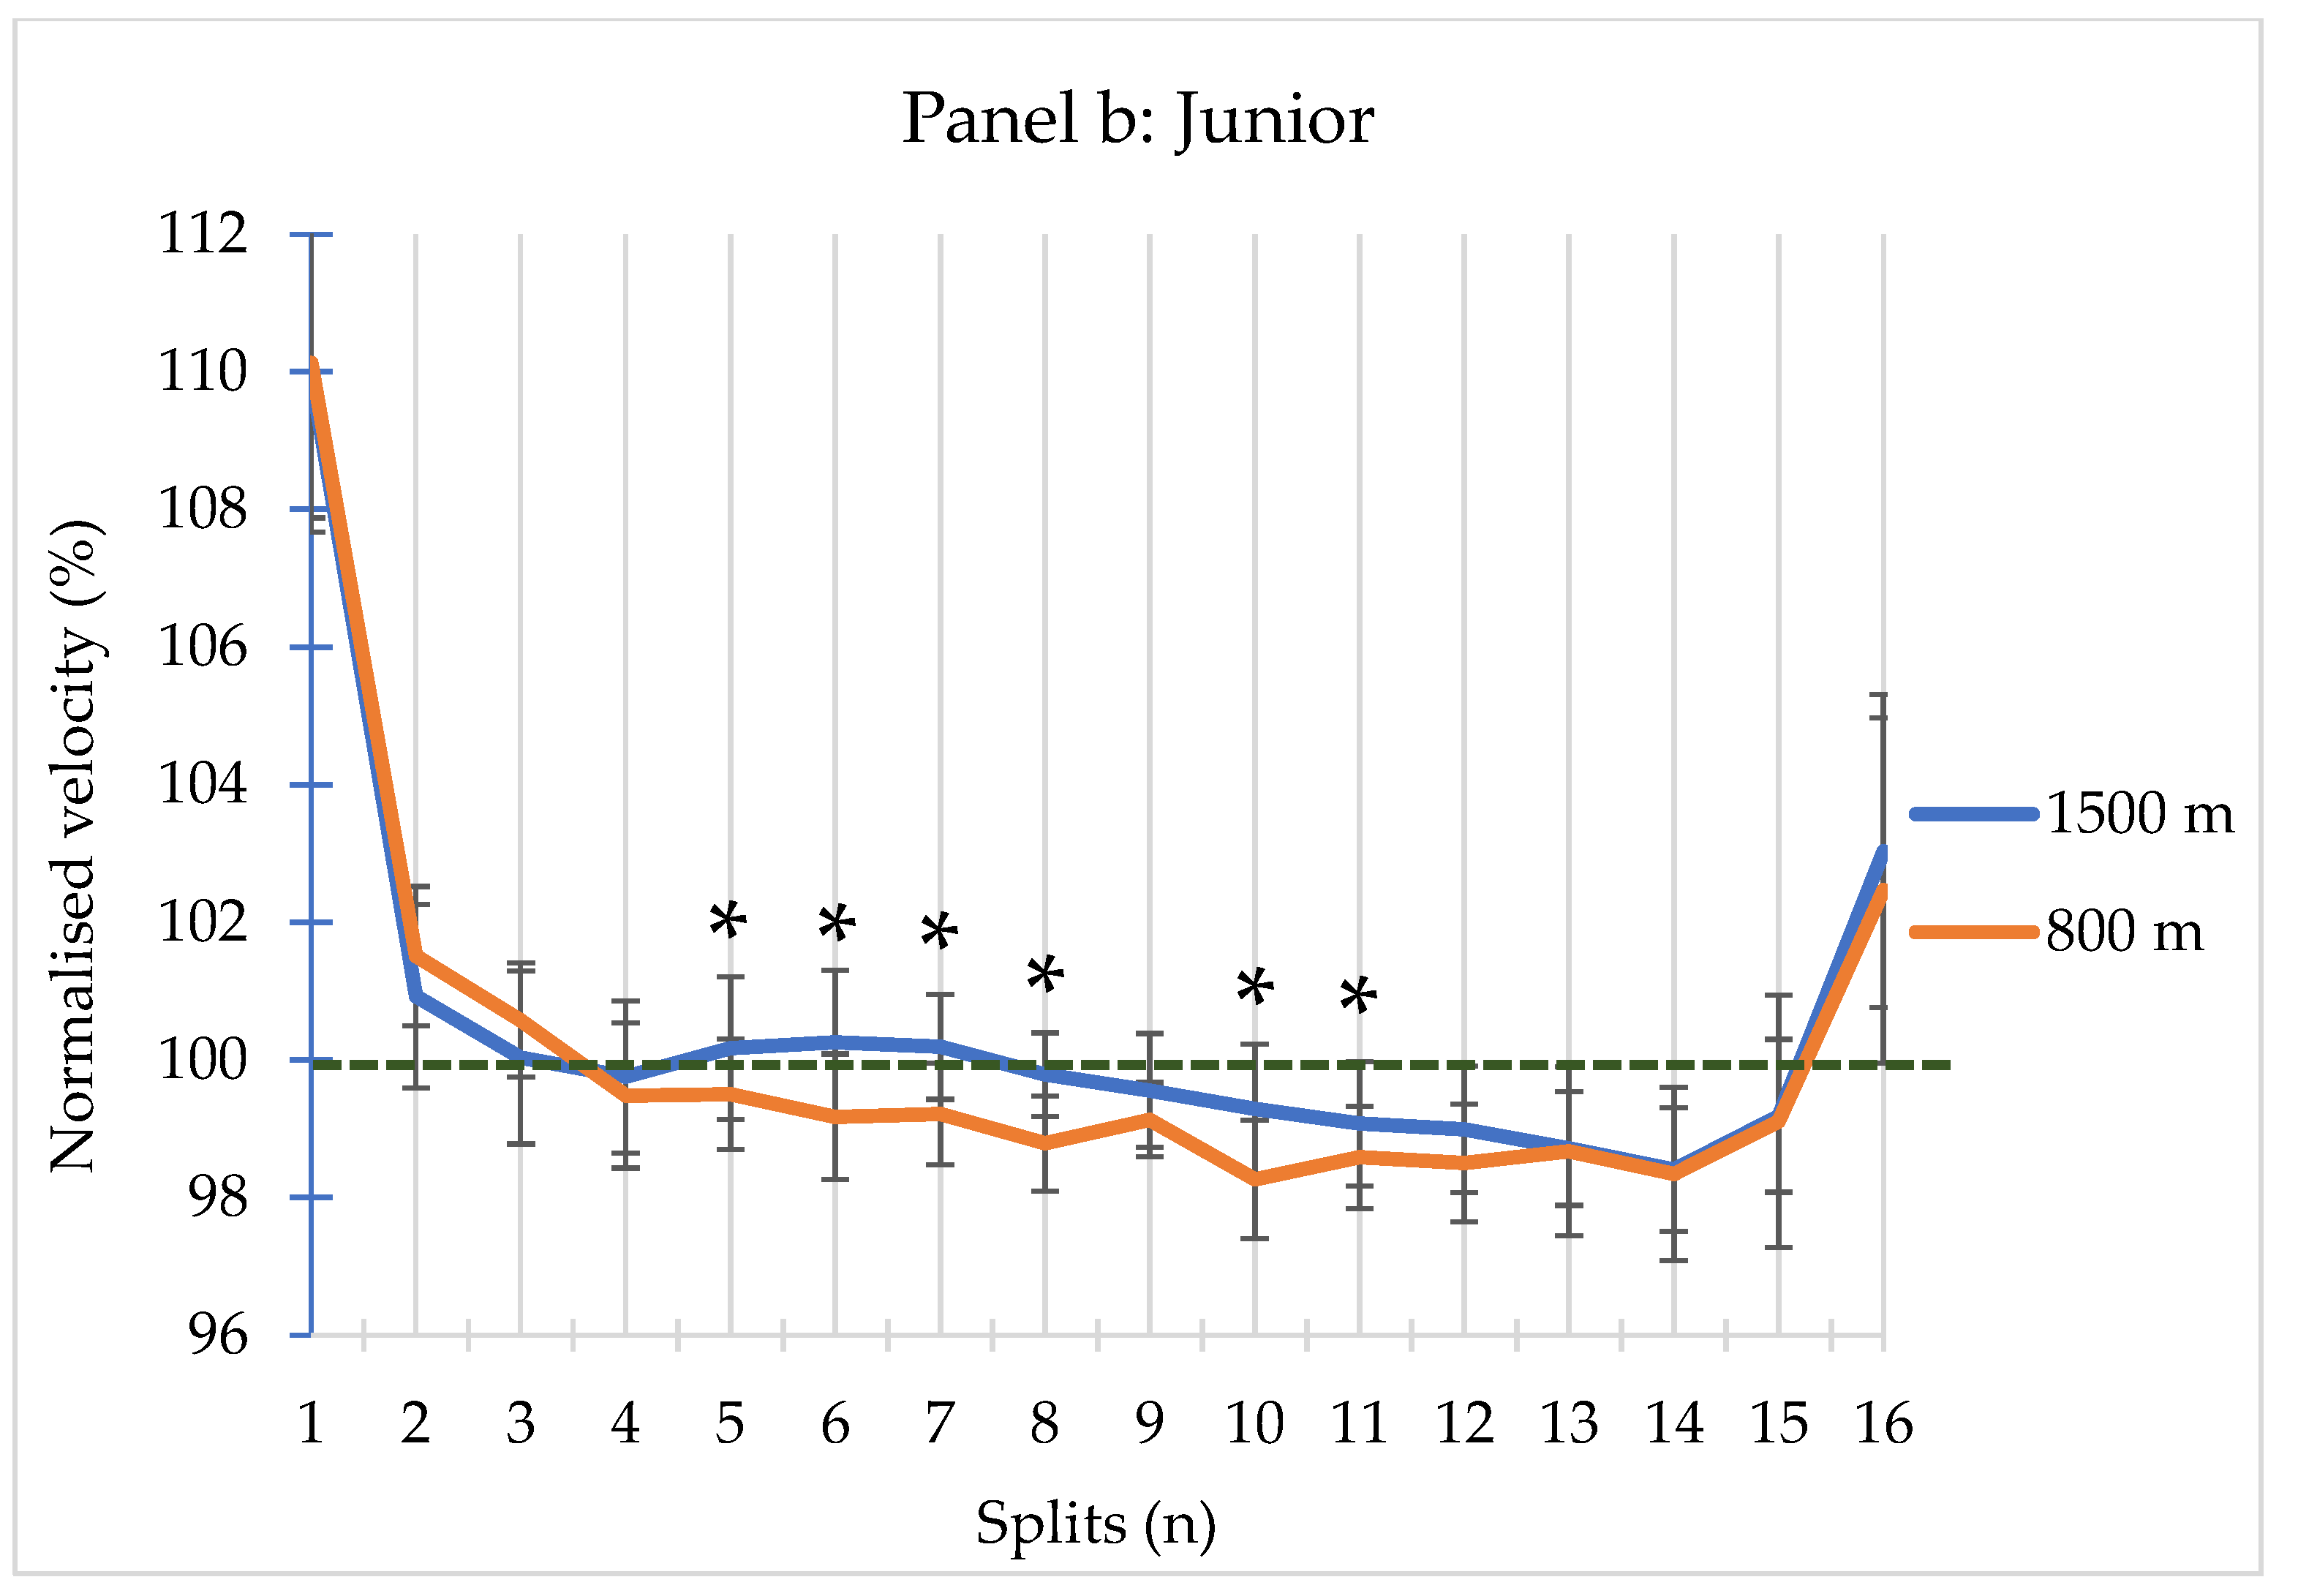
As depicted in
Figures 3a and
3b, elite swimmers’ normalised velocity was significantly higher in the 1500-meter than in the 800-meter competitions from the 5th to the 12th spilt. Juniors’ normalised velocity resulted significantly higher in the 1500-meter than in the 800-meter competitions from the 5th to the 11th split, except for split 9 that presented no significant differences.
In the 1500-meter competitions junior swimmers performed the 2nd and 3rd split at a significantly slower normalised velocity (P= 0.010 and 0.005, respectively) than the elites. In the 800-meter competitions junior swimmers’ normalised velocity was significantly slower in 2nd split (P= 0.002) and significantly faster in 8th (P= 0.023) than the elites.
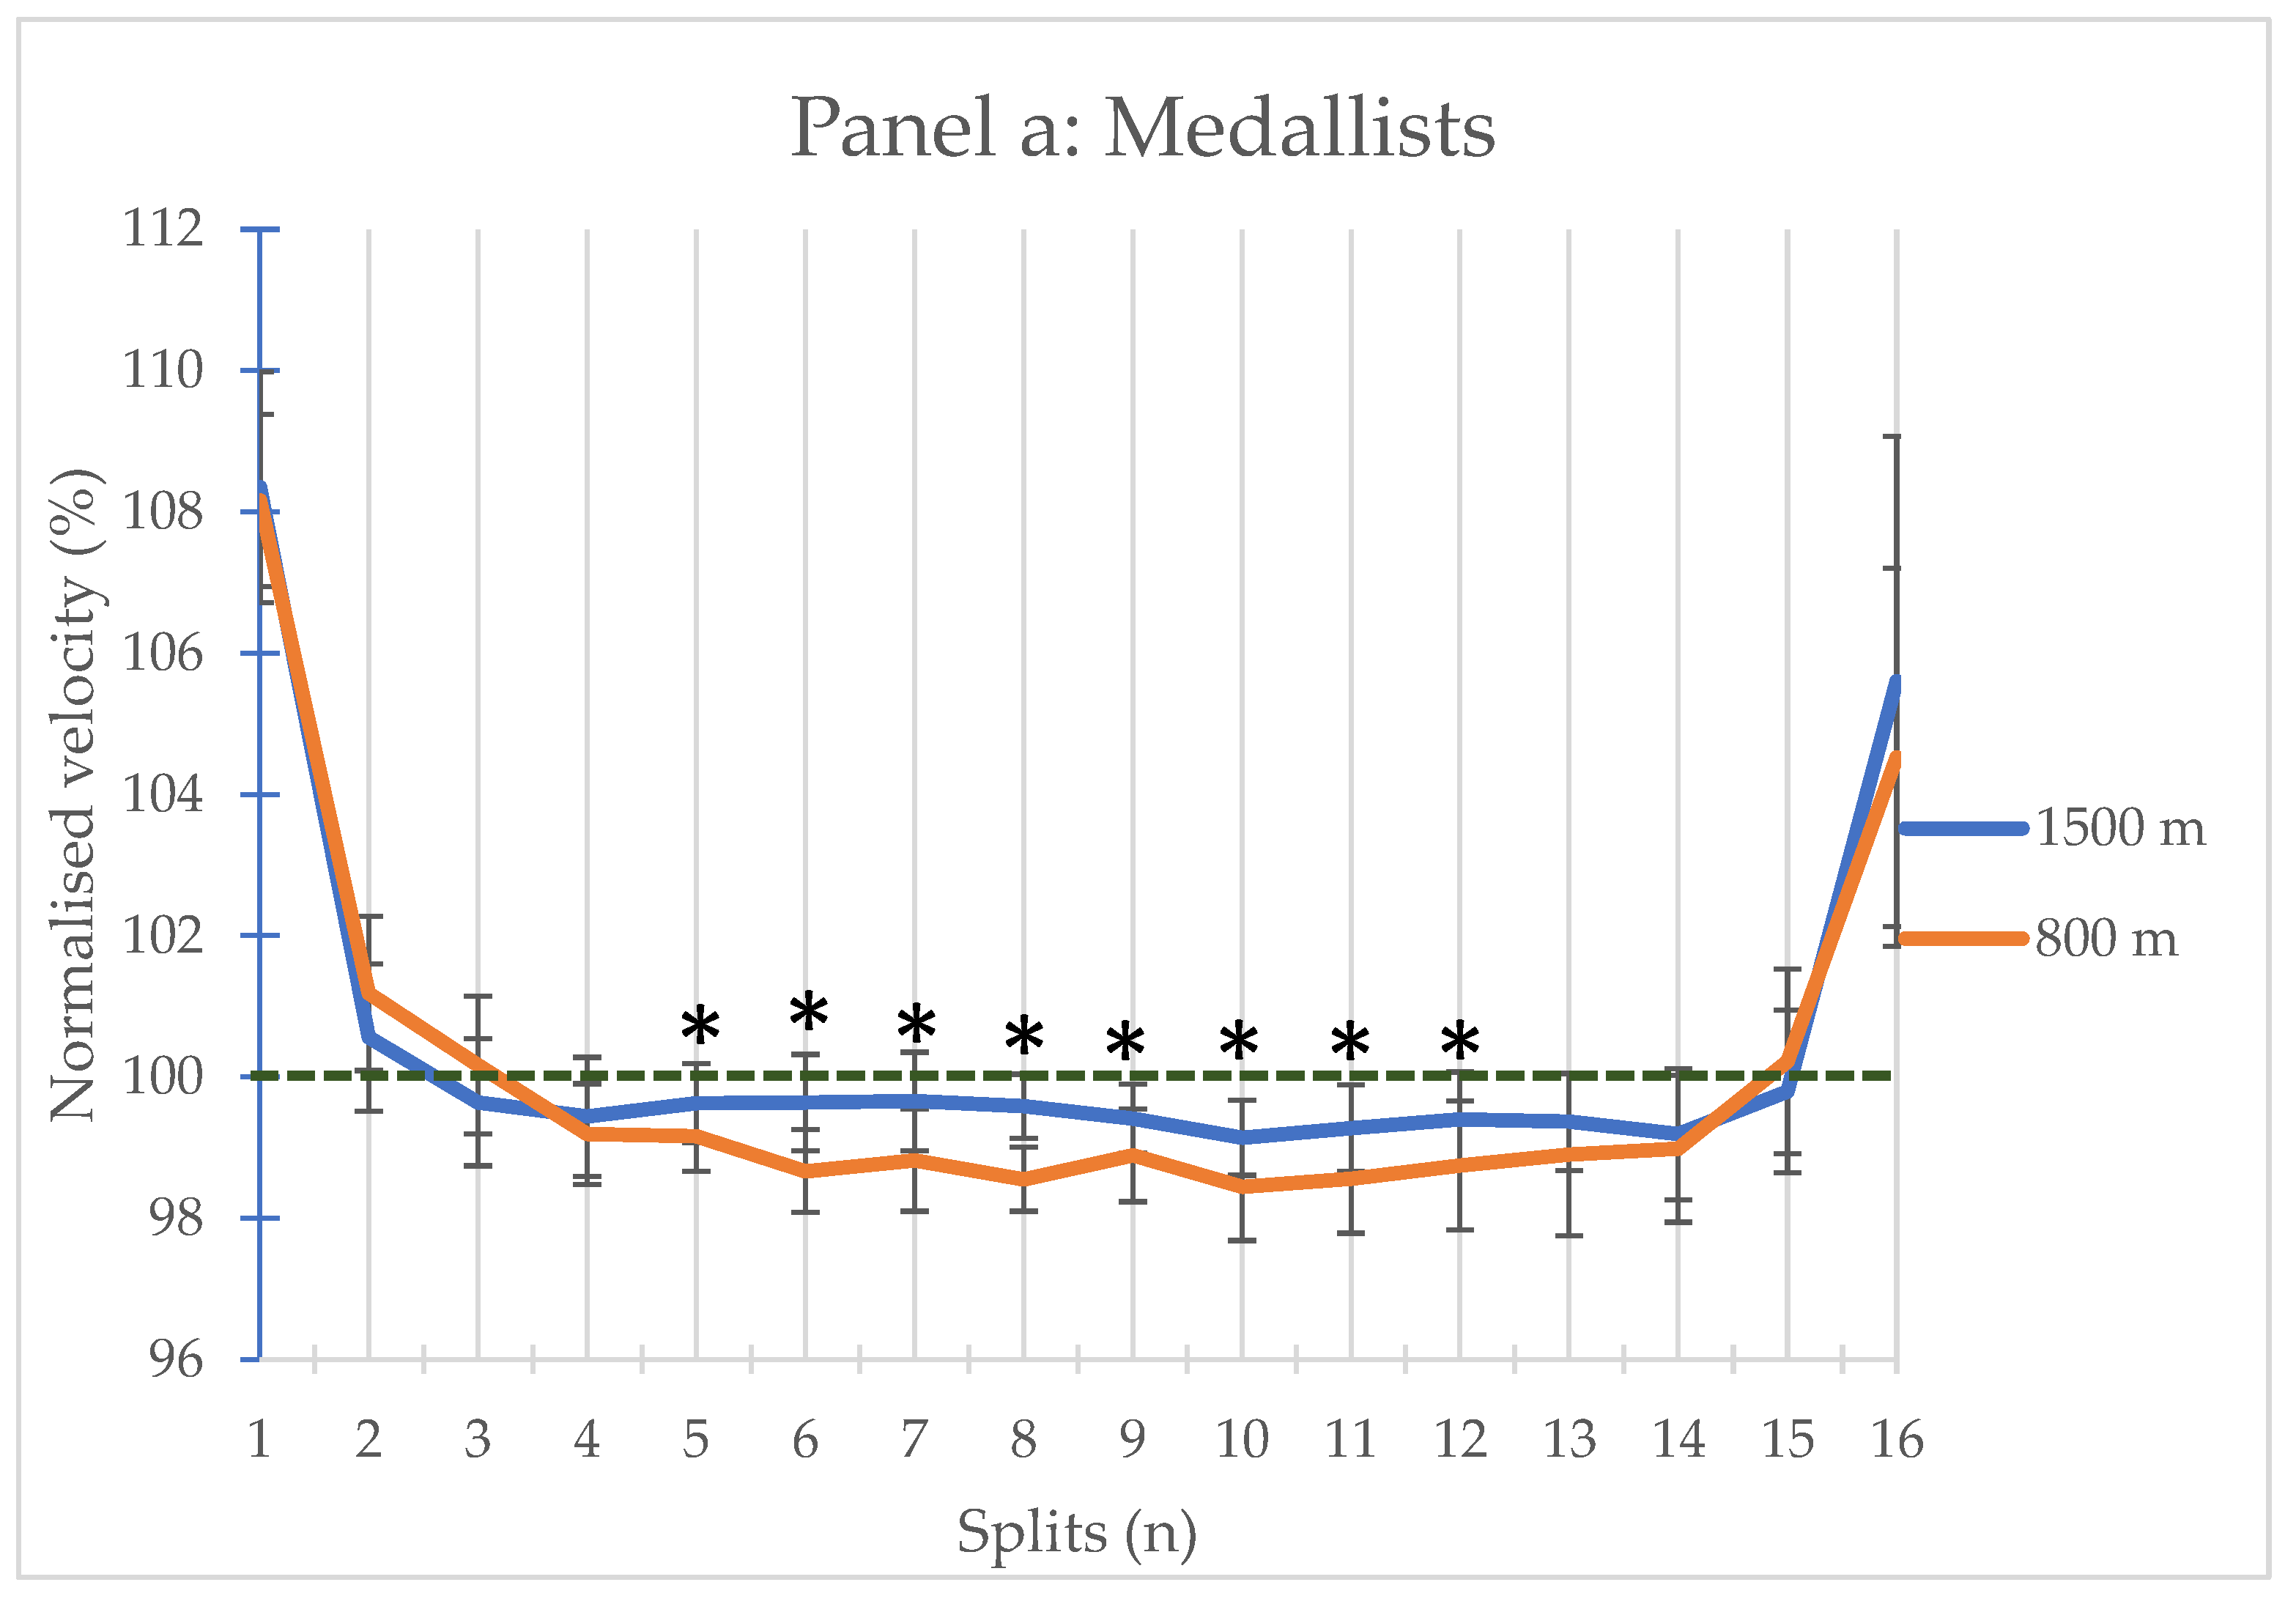
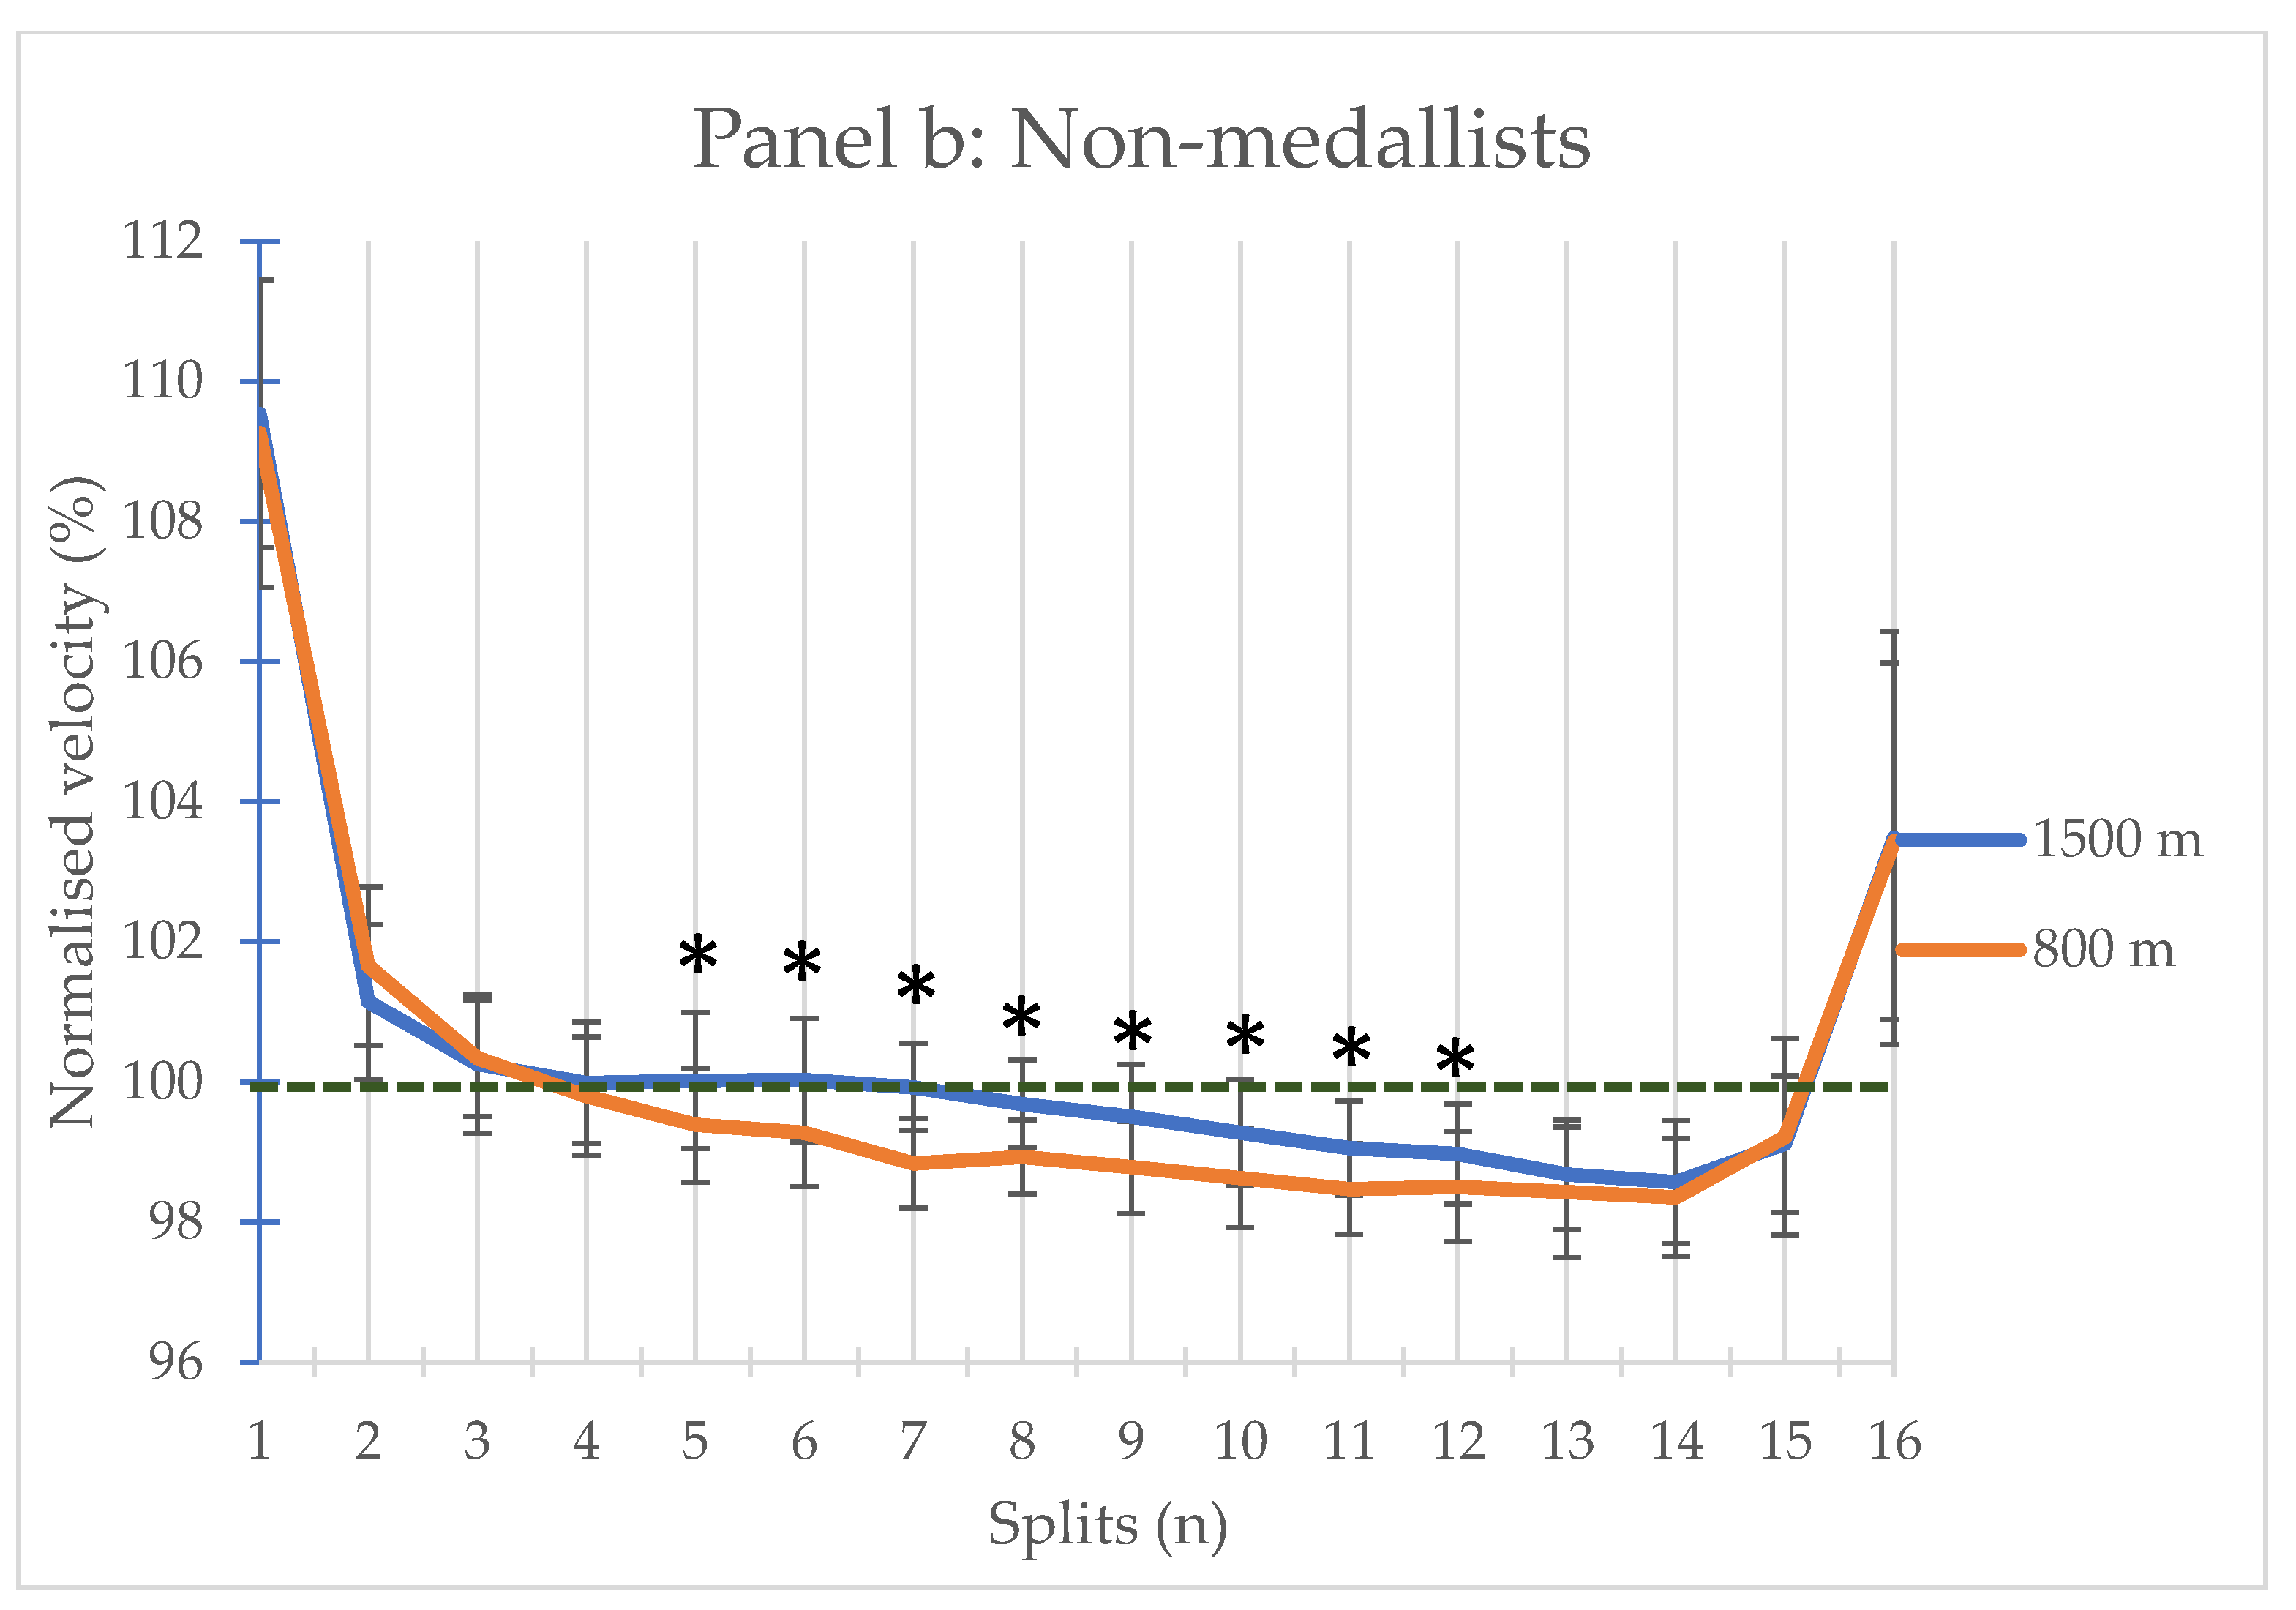
Figures 4a and
4b show that both medallists’ and non-medallists’ normalised velocity was significantly higher in the 1500-meter than in the 800-meter competitions from the 5th to the 12th spilt.
No significant differences have been found between the normalised velocity of the medallists and non-medallists in the 1500-meter freestyle. In the 800-meter the normalised velocity of the non-medallists was significantly faster than the non-medallists in the 7th split (P= 0.008) and significantly slower in the 11th split (P= 0.022).
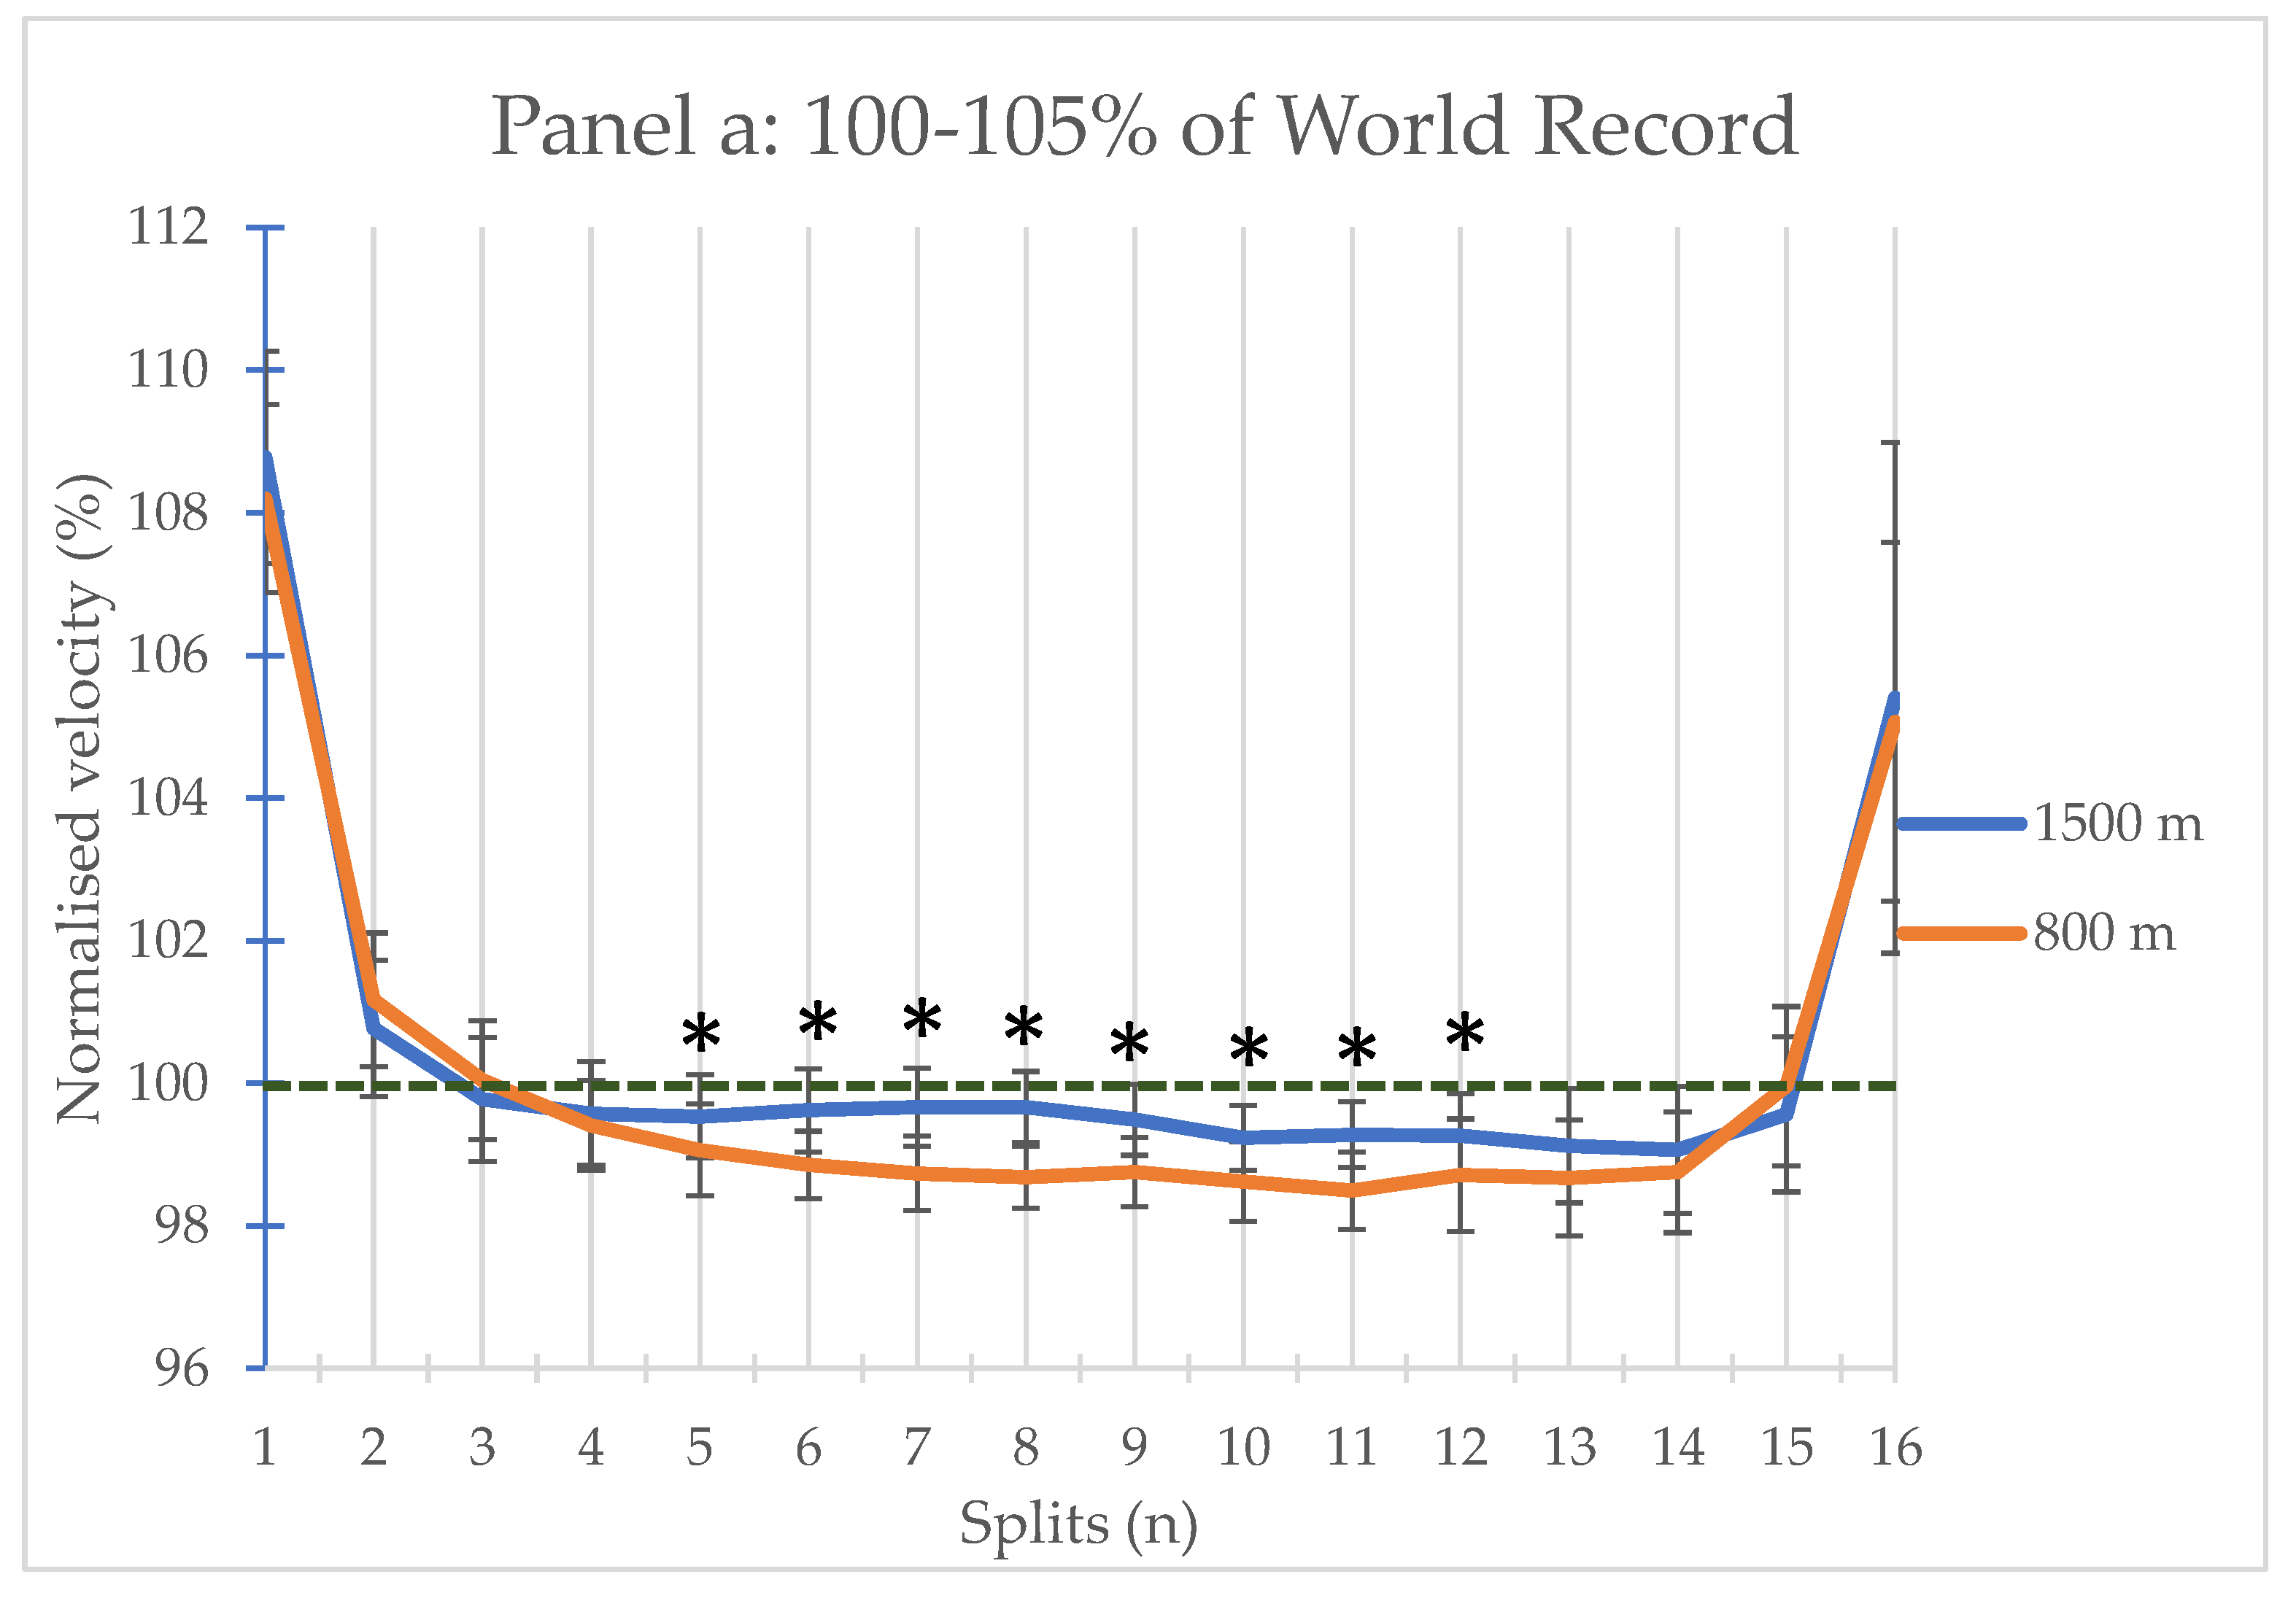
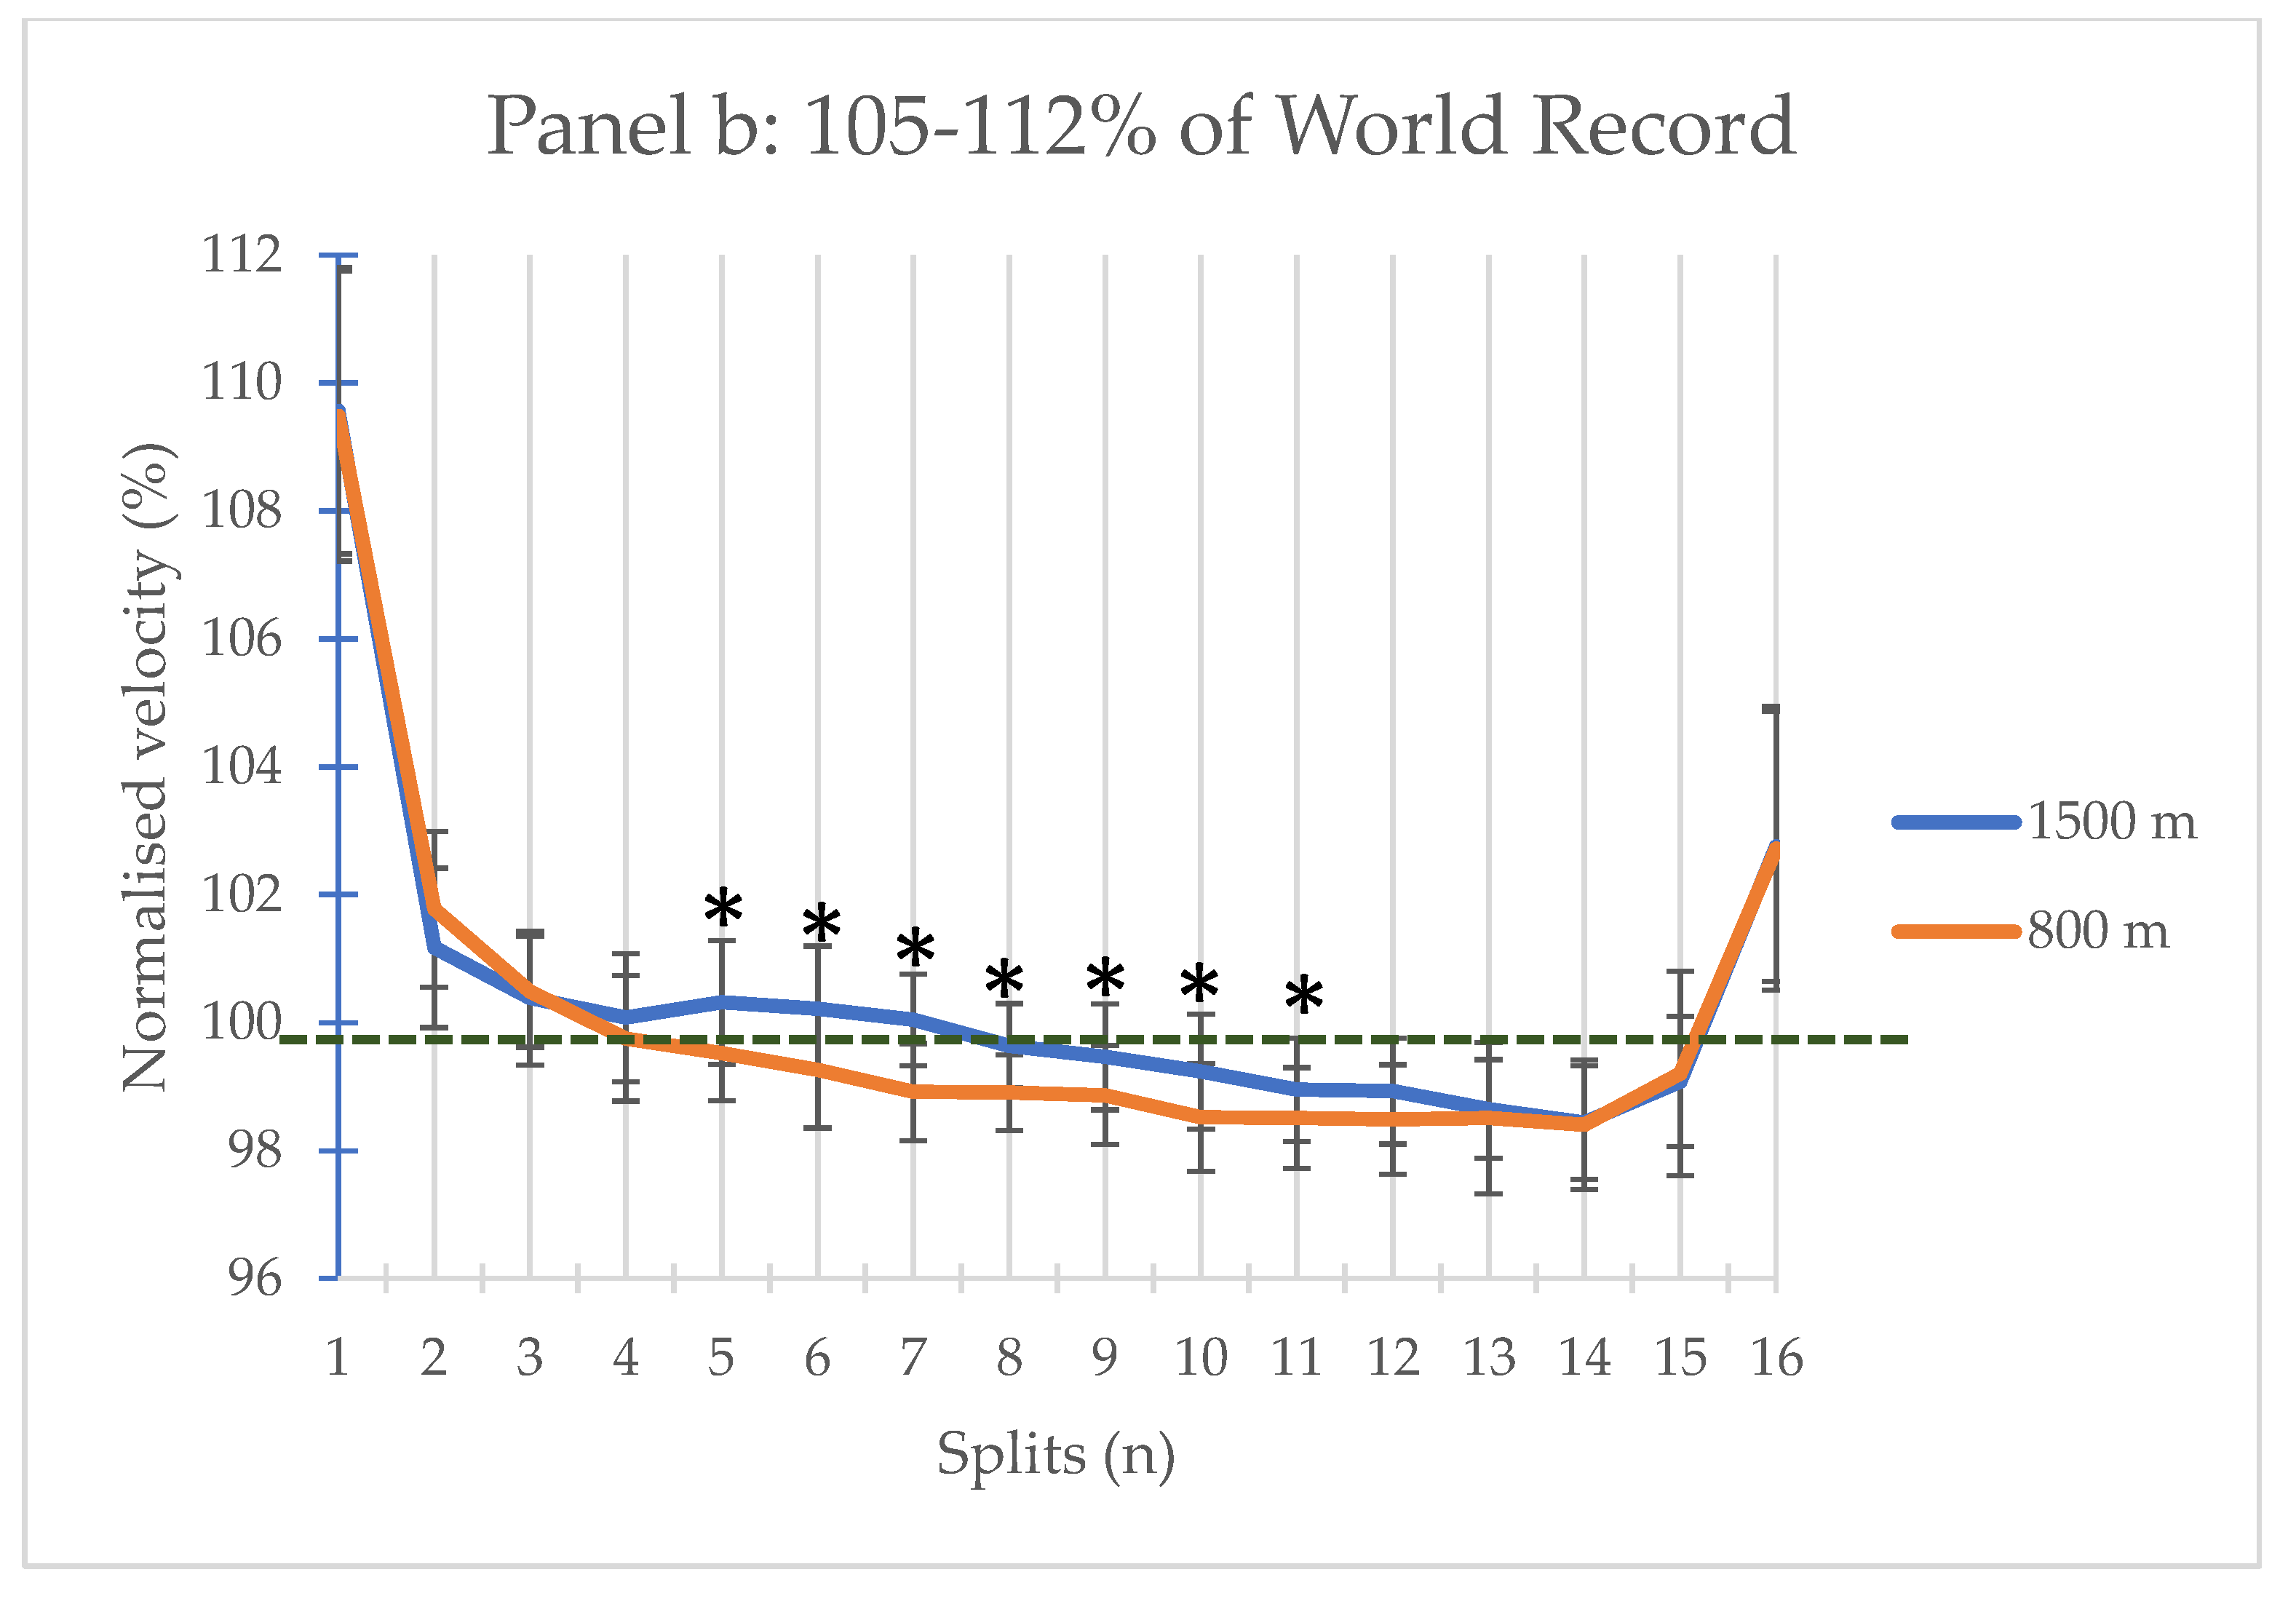
As represented in
Figures 5a,b, better performers’ (100-105%) normalised velocity was significantly higher in the 1500-meter than in the 800-meter competitions from the 5th to the 12th spilt. The 105-112% swimmers’ normalised velocity resulted significantly higher in the 1500-meter than in the 800-meter competitions from the 5th to the 11th split.
In the 1500-meter competitions the normalised velocity of the non-medallist swimmers resulted significantly faster in the 6th split (P= 0.025) and significantly slower in the 14th split (P=0.003) than that of the medallists. In the 800-meter competitions the normalised velocity of the non-medallist swimmers resulted significantly slower than the medallists in the 11th split (P= 0.004).
4. Discussion
The aim of the study was to conduct an updated parallel analysis of endurance freestyle swimming events of different durations to inquire whether decision-making on pacing strategy in swimming is dependent on the length of the competition despite their comparable energy properties. To this purpose, all the elite and junior 2022-2023 world championships finalists in the 1500 and 800-meter freestyle competitions were analysed as a whole and differed by sex, age, and performance level. To assess performance level the final time of each athlete, was calculated in percentage of the respective record time so that swimmers were divided as lower level, those closest to their record time (100-105% of WR), and higher level those farther from their record time (105-112% of WR).
Performance Level and Records - No significant differences were found in the performance level with respect to world records between the two distances except for males, elite and 100-105% swimmers that reached times significantly closer to the respective records in the 1500-meter than in the 800-meter competition. Neither in the 800-meter nor in the 1500-meter competitions of all world championships considered in the study the swimmers equated or overtook the respective world record. All final times resulted within 101% and 112% of world records. These results are consistent with previous analysis of the world records trend. The progression of world records exhibits an exponential decaying pattern, according to an epidemiological analysis of sporting events published in 2008. For the following 20 years, half of all world records will not be improved by more than 0.05% [
30,
31]. However, a study inspecting ways to enhance front crawl performance concluded that even at the very elite level, a fine-tuning of each aspect of performance in the different phases of the race could elevate an elite swimmer to podium-level performance. The swimming phase of the freestyle event, which lasts the longest, is the one with the greatest potential for improvement (60%), followed by the start (26%) and turn (14%) phases. The potential for improvement was estimated to be between 0.013 seconds for the start phase reaction time and 1.0 seconds by maximising mid-pool kicking [
32].
Pacing Strategy - Swimmers included in the present study followed the well-established parabolic U-shaped pace for the 800 and 1500-meter freestyle competitions. Their coefficient of variation in velocity (CV%) along the race presented no significant differences between the two distances. According to earlier studies, long-course pool endurance swimmers adopt a pace with the highest velocity at the beginning and on the last laps of the race, with a stable velocity in the middle of the race [
7,
8,
9,
12,
19,
21,
33,
34,
35,
36]. However, there were significant differences between the two distances in terms of the frequency and duration of speed changes.
Sequence Analysis - The number of sequences holding an acceleration of the same negative or positive sign (Sequences Number %) occurred significantly more frequently in the 800 than in the 1500-meter competitions for swimmers of all sex, age, and performance level. Also, the maximal length of sequences representing a positive or a negative variation of speed (Maximal length of sequences %) were significantly longer in the 800-meter competitions for the whole group of swimmers and for the junior, medallists and 105-112% groups. This suggests that shorter races involve more frequent adjustments in speed.
Time Series Analysis - All the 1500-meter competitions represented “true” time series as given by the value 1. On the contrary, all groups of the 800-meter competitions presented values higher than 1 meaning that at least one swimmer maintained a true time series only along half of the sequences (value 2) or that at least one swimmer completed the whole competition as a random series (value 3). The differences in time series between the two distances were statistically significant for the whole group and for the male and the elite groups. It could thus be claimed that in the shortest distance swimmers are induced to accelerate and decelerate from split to split more frequently and for a longer time, while in the longest distance, swimmers need to avoid abrupt changes of speed. The tele-anticipation model, whose goal is to conserve energy so that a final sprint can be performed afterward, is a likely explanation for athletes engaging in a slower rhythm in the second half of the 1500-meter and in the middle of the 800-meter race [
37]. Changes in stroke frequency and length that reflect the onset of local fatigue may be the cause of a decrease in velocity. Success seems to be associated with a more conservative pace that allows for increases in speed in the final laps, especially in long-distance pool swimming. The increase in speed at the last splits of the races has typically been observed in head-to-head competitions, where winning depends on outperforming rivals by a small margin. Winners of such competitions appear to have the energy reserves necessary for an end-spurt to possibly outsprint a rival in the final few metres [
8,
9]. The ability of the swimmer to generate propulsion in the most efficient way possible has been shown to be a crucial factor in determining swimming performance.
Sex and Age Differences - In the present study, difference between sexes have been found in the central part of both distances with a females’ significantly slower normalised velocity than males. In the 800-meter competition significant differences has been found also in the first and last splits with a faster females’ start and a faster males’ end spurt. The different mental and physical abilities required to implement these strategies could explain the different approaches taken by male and female competitors [
17]. Additionally, women typically expend 80% less energy than men do when swimming the crawl at any given speed and with equivalent technical ability. The anthropometric differences between the male and female body types account for this disparity between the sexes [
38]. Therefore, males and females may benefit from slightly different pacing behaviours [
4]. Junior swimmers showed a faster central part of the race in the 1500-meter than in the 800-meter competitions. Their first part of the race resulted slower than the elites in both distances. It is likely that pacing skill development needs to begin at a young age being a crucial step towards elite performance [
1,
4,
39].
Impact of Performance Level - Swimmers who were closer to world records (100-105% of WR) tended to have more consistent pacing patterns compared to those farther from records (105-112% of WR). The latter presented accelerations between the 5th and the 7th split followed by a strong deceleration afterwards. The ability to effectively allocate energy develops in relation to an individual's cognitive and physical characteristics and is dependent on the amount of prior specific experience [
40,
41,
42]. The ideal pacing technique can thus be acquired by a wealth of training and competition experience [
14,
20,
43,
44]. Since an ideal ratio between stroke rate and stroke length is necessary to maintain the pace throughout the race, key variables like stroke rate, stroke count, split times, and rating of perceived exertion are probably crucial training tools to optimise the development of pacing skills [
45,
46,
47,
48,
49,
50,
51,
52,
53].
Given that most swimmers compete in multiple events of varying distances and sometimes strokes, it can be difficult to balance the training programme to ensure that each swimmer's needs are met. Swimmers may race alternate events early in the season to gain race experience and become more specific in event selection as the season progresses. This approach may be beneficial in increasing the frequency of practise in each event and developing the ability to switch paces with ease [
43]. Trainers can provide feedback on split times during training sessions on a regular basis and, if possible, during races to assist athletes in developing their performance template. It is hypothesised that by doing so, athletes can learn to link bodily sensations (such as perceived exertion, heart rate frequency, breath frequency, fatigue, and pain) to their performance [
43].
5. Conclusions
In conclusion, both the 1500 and 800-meter competitions follow the parabolic U-shaped pacing strategy. However, the split-by-split analysis of the time series revealed significant difference between the two distances. The pacing strategy resulted also differentiated by sex, age, and performance level of swimmers. The research highlights the complex interplay between physiological and psychological factors that shape a swimmer's decision-making during a race. It could thus be suggested that training programs should be differentiated for each distance and for different swimmers’ groups to meet the needs of each swimmer for each event.
Author Contributions
Conceptualization, S.D. and V.B.; methodology, V.B and J-R.P.; formal analysis, S.D.; data curation, A.P.; writing—original draft preparation, S.D; writing—review and editing, S.D. and V.B.; supervision, S.D. and V.B. All authors have read and agreed to the published version of the manuscript.
Funding
This research received no external funding.
Institutional Review Board Statement
The study was conducted in accordance with the Declaration of Helsinki and approved by the Institutional Review Board of University of Rome Foro Italico (protocol code CAR 155/2023; date of approval 17 May 2023).
Informed Consent Statement
Patient consent was waived due to the use of only publicly available data. All data were gathered and retrospectively analysed anonymously.
Conflicts of Interest
The authors declare no conflict of interest.
References
- Menting, S.G.P.; Hendry, D.T.; Schiphof-Godart, L.; Elferink-Gemser, M.T.; Hettinga, F.J. Optimal Development of Youth Athletes Toward Elite Athletic Performance: How to Coach Their Motivation, Plan Exercise Training, and Pace the Race. Front. Sports Act. Living 2019, 1, 14. [Google Scholar] [CrossRef]
- McGibbon, K.E.; Shephard, M.E.; Osborne, M.A.; Thompson, K.G.; Pyne, D.B. Pacing and Performance in Swimming: Differences Between Individual and Relay Events. Int. J. Sports Physiol. Perform. 2020, 15, 1059–1066. [Google Scholar] [CrossRef] [PubMed]
- Menting, S.G.P.; Elferink-Gemser, M.T.; Huijgen, B.C.; Hettinga, F.J. Pacing in Lane-Based Head-to-Head Competitions: A Systematic Review on Swimming. J. Sports Sci. 2019, 37, 2287–2299. [Google Scholar] [CrossRef] [PubMed]
- Menting, S.G.P.; Post, A.K.; Nijenhuis, S.B.; Koning, R.H.; Visscher, C.; Hettinga, F.J.; Elferink-Gemser, M.T. Pacing Behavior Development in Adolescent Swimmers: A Large-Scale Longitudinal Data Analysis. Med. Sci. Sports Exerc. 2023, 55, 700–709. [Google Scholar] [CrossRef]
- McGibbon, K.E.; Pyne, D.B.; Shephard, M.E.; Thompson, K.G. Pacing in Swimming: A Systematic Review. Sports Med. 2018, 48, 1621–1633. [Google Scholar] [CrossRef]
- Gonjo, T.; Olstad, B.H. Race Analysis in Competitive Swimming: A Narrative Review. Int. J. Environ. Res. Public. Health 2020, 18, 69. [Google Scholar] [CrossRef] [PubMed]
- Oliveira, G.T.D.; Werneck, F.Z.; Coelho, E.F.; Simim, M.A.D.M.; Penna, E.M.; Ferreira, R.M. What Pacing Strategy 800m and 1500m Swimmers Use? Rev. Bras. Cineantropometria Desempenho Hum. 2019, 21, e59851. [Google Scholar] [CrossRef]
- Neuloh, J.E.; Skorski, S.; Mauger, L.; Hecksteden, A.; Meyer, T. Analysis of End-Spurt Behaviour in Elite 800-m and 1500-m Freestyle Swimming. Eur. J. Sport Sci. 2021, 21, 1628–1636. [Google Scholar] [CrossRef] [PubMed]
- Demarie, S.; Pycke, J.R.; Pizzuti, A.; Billat, V. Pacing of Human Locomotion on Land and in Water: 1500 m Swimming vs. 5000 m Running. Appl. Sci. 2023, 13, 6455. [Google Scholar] [CrossRef]
- Abbiss, C.R.; Laursen, P.B. Describing and Understanding Pacing Strategies during Athletic Competition. Sports Med. 2008, 38, 239–252. [Google Scholar] [CrossRef]
- Veiga, S.; Rodriguez, L.; González-Frutos, P.; Navandar, A. Race Strategies of Open Water Swimmers in the 5-Km, 10-Km, and 25-Km Races of the 2017 FINA World Swimming Championships. Front. Psychol. 2019, 10, 654. [Google Scholar] [CrossRef] [PubMed]
- Lipinska, P.; Allen, S.V.; Hopkins, W.G. Relationships Between Pacing Parameters and Performance of Elite Male 1500-m Swimmers. Int. J. Sports Physiol. Perform. 2016, 11, 159–163. [Google Scholar] [CrossRef] [PubMed]
- Tucker, R.; Noakes, T.D. The Physiological Regulation of Pacing Strategy during Exercise: A Critical Review. Br. J. Sports Med. 2009, 43, e1–e1. [Google Scholar] [CrossRef]
- Foster, C.; Hendrickson, K.J.; Peyer, K.; Reiner, B.; deKoning, J.J.; Lucia, A.; Battista, R.A.; Hettinga, F.J.; Porcari, J.P.; Wright, G. Pattern of Developing the Performance Template. Br. J. Sports Med. 2009, 43, 765–769. [Google Scholar] [CrossRef] [PubMed]
- Foster, C; deKoning, JJ; Hettinga, F; Lampen, J; Dodge, C; Bobbert, M; Porcari, JP. Effect of Competitive Distance on Energy Expenditure During Simulated Competition. Int. J. Sports Med. 2004, 25, 198–204. [Google Scholar] [CrossRef]
- Konings, M.J.; Hettinga, F.J. The Impact of Different Competitive Environments on Pacing and Performance. Int. J. Sports Physiol. Perform. 2018, 13, 701–708. [Google Scholar] [CrossRef]
- De Koning, J.J.; Foster, C.; Lucia, A.; Bobbert, M.F.; Hettinga, F.J.; Porcari, J.P. Using Modeling to Understand How Athletes in Different Disciplines Solve the Same Problem: Swimming Versus Running Versus Speed Skating. Int. J. Sports Physiol. Perform. 2011, 6, 276–280. [Google Scholar] [CrossRef]
- Mytton, G.J.; Archer, D.T.; Turner, L.; Skorski, S.; Renfree, A.; Thompson, K.G.; Gibson, A.S.C. Increased Variability of Lap Speeds: Differentiating Medalists and Nonmedalists in Middle-Distance Running and Swimming Events. Int. J. Sports Physiol. Perform. 2015, 10, 369–373. [Google Scholar] [CrossRef]
- Barroso, R.; Do Carmo, E.C.; Foster, C.; Skiba, P.; Barbosa, A.C. Longitudinal Analysis of the 800-m Performances of the World’s Best Female Long-Distance Pool Swimmer: A Case Study Using Critical Speed and D ′. Int. J. Sports Sci. Coach. 2023, 18, 1307–1312. [Google Scholar] [CrossRef]
- Barbosa, T.M.; Bragada, J.A.; Reis, V.M.; Marinho, D.A.; Carvalho, C.; Silva, A.J. Energetics and Biomechanics as Determining Factors of Swimming Performance: Updating the State of the Art. J. Sci. Med. Sport 2010, 13, 262–269. [Google Scholar] [CrossRef]
- López-Belmonte, Ó.; Gay, A.; Ruiz-Navarro, J.J.; Cuenca-Fernández, F.; González-Ponce, Á.; Arellano, R. Pacing Profiles, Variability and Progression in 400, 800 and 1500-m Freestyle Swimming Events at the 2021 European Championship. Int. J. Perform. Anal. Sport 2022, 22, 90–101. [Google Scholar] [CrossRef]
- Casado, A.; González-Mohíno, F.; Gonzalez-Ravé, J.M.; Boullosa, D. Pacing Profiles of Middle-Distance Running World Records in Men and Women. Int. J. Environ. Res. Public. Health 2021, 18, 12589. [Google Scholar] [CrossRef] [PubMed]
- Mujika, I.; Pyne, D.B.; Wu, P.P.-Y.; Ng, K.; Crowley, E.; Powell, C. Next-Generation Models for Predicting Winning Times in Elite Swimming Events: Updated Predictions for the Paris 2024 Olympic Games. Int. J. Sports Physiol. Perform. 2023, 1–6. [Google Scholar] [CrossRef] [PubMed]
- Davison, R.C.R.; Van Someren, K.A.; Jones, A.M. Physiological Monitoring of the Olympic Athlete. J. Sports Sci. 2009, 27, 1433–1442. [Google Scholar] [CrossRef]
- Wu, P.P.-Y.; Garufi, L.; Drovandi, C.; Mengersen, K.; Mitchell, L.J.G.; Osborne, M.A.; Pyne, D.B. Bayesian Prediction of Winning Times for Elite Swimming Events. J. Sports Sci. 2022, 40, 24–31. [Google Scholar] [CrossRef]
- Heazlewood, T. Prediction Versus Reality: Teh Use of Mathematical Models to Predict Elite Performance in Swimming and Athletics at the Olympic Games. J. Sports Sci. Med. 2006, 5, 541–547. [Google Scholar]
- Mujika, I.; Villanueva, L.; Welvaert, M.; Pyne, D.B. Swimming Fast When It Counts: A 7-Year Analysis of Olympic and World Championships Performance. Int. J. Sports Physiol. Perform. 2019, 14, 1132–1139. [Google Scholar] [CrossRef]
- Nikolaidis, P.T.; Knechtle, B. Pacing in Age-Group Freestyle Swimmers at The XV FINA World Masters Championships in Montreal 2014. J. Sports Sci. 2017, 35, 1165–1172. [Google Scholar] [CrossRef]
- Moser, C.; Sousa, C.V.; Olher, R.R.; Hill, L.; Nikolaidis, P.T.; Rosemann, T.; Knechtle, B. Pacing in World-Class Age Group Swimmers in 200 and 400 m Individual Medley. Front. Physiol. 2021, 11, 629738. [Google Scholar] [CrossRef]
- Berthelot, G.; Thibault, V.; Tafflet, M.; Escolano, S.; El Helou, N.; Jouven, X.; Hermine, O.; Toussaint, J.-F. The Citius End: World Records Progression Announces the Completion of a Brief Ultra-Physiological Quest. PLoS ONE 2008, 3, e1552. [Google Scholar] [CrossRef]
- Nevill, A.; Whyte, G.; Holder, R.; Peyrebrune, M. Are There Limits to Swimming World Records? Int. J. Sports Med. 2007, 28, 1012–1017. [Google Scholar] [CrossRef]
- Sanders, R.H.; Takagi, H.; Vilas-Boas, J.P. How Technique Modifications in Elite 100m Swimmers Might Improve Front Crawl Performances to Podium Levels: Swimming ‘Chariots of Fire.’. Sports Biomech 2021, 1–20. [Google Scholar] [CrossRef] [PubMed]
- Lipińska, P.; Allen, S.V.; Hopkins, W.G. Modeling Parameters That Characterize Pacing of Elite Female 800-m Freestyle Swimmers. Eur. J. Sport Sci. 2016, 16, 287–292. [Google Scholar] [CrossRef] [PubMed]
- Lara, B.; Del Coso, J. Pacing Strategies of 1500 m Freestyle Swimmers in the World Championships According to Their Final Position. Int. J. Environ. Res. Public. Health 2021, 18, 7559. [Google Scholar] [CrossRef]
- McGibbon, K.E.; Pyne, D.B.; Heidenreich, L.E.; Pla, R. A Novel Method to Characterize the Pacing Profile of Elite Male 1500-m Freestyle Swimmers. Int. J. Sports Physiol. Perform. 2021, 16, 818–824. [Google Scholar] [CrossRef] [PubMed]
- Morais, J.E.; Barbosa, T.M.; Forte, P.; Bragada, J.A.; Castro, F.A.D.S.; Marinho, D.A. Stability Analysis and Prediction of Pacing in Elite 1500 m Freestyle Male Swimmers. Sports Biomech. 2020, 1–18. [Google Scholar] [CrossRef] [PubMed]
- Micklewright, D.; Kegerreis, S.; Raglin, J.; Hettinga, F. Will the Conscious–Subconscious Pacing Quagmire Help Elucidate the Mechanisms of Self-Paced Exercise? New Opportunities in Dual Process Theory and Process Tracing Methods. Sports Med. 2017, 47, 1231–1239. [Google Scholar] [CrossRef]
- di Prampero, P.E.; Osgnach, C. Energy Cost of Human Locomotion on Land and in Water. In Muscle and Exercise Physiology; Elsevier, 2019; pp. 183–213. ISBN 978-0-12-814593-7. [Google Scholar]
- Mauger, A.R.; Neuloh, J.; Castle, P.C. Analysis of Pacing Strategy Selection in Elite 400-m Freestyle Swimming. Med. Sci. Sports Exerc. 2012, 44, 2205–2212. [Google Scholar] [CrossRef]
- Jonker, L.; Elferink-Gemser, M.T.; Visscher, C. Differences in Self-Regulatory Skills among Talented Athletes: The Significance of Competitive Level and Type of Sport. J. Sports Sci. 2010, 28, 901–908. [Google Scholar] [CrossRef]
- Edwards, A.M.; Polman, R.C.J. Pacing and Awareness: Brain Regulation of Physical Activity. Sports Med. 2013, 43, 1057–1064. [Google Scholar] [CrossRef]
- Mauger, A.R.; Jones, A.M.; Williams, C.A. Influence of Feedback and Prior Experience on Pacing during a 4-Km Cycle Time Trial. Med. Sci. Sports Exerc. 2009, 41, 451–458. [Google Scholar] [CrossRef] [PubMed]
- McGibbon, K.; Pyne, D.; Shephard, M.; Osborne, M.; Thompson, K. Contemporary Practices of High-Performance Swimming Coaches on Pacing Skill Development and Competition Preparation. Int. J. Sports Sci. Coach. 2020, 15, 495–505. [Google Scholar] [CrossRef]
- Skorski, S.; Faude, O.; Caviezel, S.; Meyer, T. Reproducibility of Pacing Profiles in Elite Swimmers. Int. J. Sports Physiol. Perform. 2014, 9, 217–225. [Google Scholar] [CrossRef] [PubMed]
- Demarie, S.; Chirico, E.; Bratta, C.; Cortis, C. Energy Consumption of Water Running and Cycling at Four Exercise Intensities. Sports 2022, 10, 90. [Google Scholar] [CrossRef] [PubMed]
- Demarie, S.; Chirico, E.; Vannozzi, G. Swimmer’s evaluation: technical differences between sprint and middle distance analyzed by inertial sensors. Med. Sport (Roma) 2022, 75, 332–341. [Google Scholar] [CrossRef]
- Di Prampero, P.E.; Dekerle, J.; Capelli, C.; Zamparo, P. The Critical Velocity in Swimming. Eur. J. Appl. Physiol. 2008, 102, 165–171. [Google Scholar] [CrossRef]
- Zamparo, P.; Bonifazi, M.; Faina, M.; Milan, A.; Sardella, F.; Schena, F.; Capelli, C. Energy Cost of Swimming of Elite Long-Distance Swimmers. Eur. J. Appl. Physiol. 2005, 94, 697–704. [Google Scholar] [CrossRef]
- Zamparo, P.; Pendergast, D.R.; Mollendorf, J.; Termin, A.; Minetti, A.E. An Energy Balance of Front Crawl. Eur. J. Appl. Physiol. 2005, 94, 134–144. [Google Scholar] [CrossRef]
- Zamparo, P.; Cortesi, M.; Gatta, G. The Energy Cost of Swimming and Its Determinants. Eur. J. Appl. Physiol. 2020, 120, 41–66. [Google Scholar] [CrossRef]
- Almeida, T.A.F.; Espada, M.C.; Massini, D.A.; Macedo, A.G.; Castro, E.A.; Ferreira, C.C.; Reis, J.F.; Pessôa Filho, D.M. Stroke and Physiological Relationships during the Incremental Front Crawl Test: Outcomes for Planning and Pacing Aerobic Training. Front. Physiol. 2023, 14, 1241948. [Google Scholar] [CrossRef]
- Barbosa, T.M.; Fernandes, R.J.; Keskinen, K.L.; Vilas-Boas, J.P. The Influence of Stroke Mechanics into Energy Cost of Elite Swimmers. Eur. J. Appl. Physiol. 2008, 103, 139–149. [Google Scholar] [CrossRef] [PubMed]
- Pyne, D.B.; Sharp, R.L. Physical and Energy Requirements of Competitive Swimming Events. Int. J. Sport Nutr. Exerc. Metab. 2014, 24, 351–359. [Google Scholar] [CrossRef] [PubMed]
|
Disclaimer/Publisher’s Note: The statements, opinions and data contained in all publications are solely those of the individual author(s) and contributor(s) and not of MDPI and/or the editor(s). MDPI and/or the editor(s) disclaim responsibility for any injury to people or property resulting from any ideas, methods, instructions or products referred to in the content. |
© 2023 by the authors. Licensee MDPI, Basel, Switzerland. This article is an open access article distributed under the terms and conditions of the Creative Commons Attribution (CC BY) license (https://creativecommons.org/licenses/by/4.0/).
