1. Introduction
Our ability to survive depends on agriculture. It is impossible for us to survive without agriculture. There are numerous different agricultural food varieties available in our country. These foods are essential to how we live and how our economy operates. However, many foods and crops are ruined or destroyed because of various diseases. Potatoes have also different types of diseases that diminished their products largely. Potato (Solanum tuberosum) is a staple food in our country. It has enormous economic importance in our country. Many people are depending on potato cultivation. Many Unemployed People are being self-employed to cultivate potatoes which has an auspicious effect on developing our economy. Most of the poor people are depended on this potato cultivation for their income source and they fulfill their nutrition demand by eating this inexpensive food. It is enriched in different types of vitamins and proteins that help to prevent many diseases in our body. Even after being cooked, potatoes still retain vital nutrients that have several positive effects on human health. Potatoes are also used as a side dish composing about one-fourth of our whole plates which are very healthy as well as inexpensive. Potato is also used as mixed vegetables with other foods.
Different types of diseases are a significant problem for potato cultivation. Early blight and late blight are the two main diseases caused by potato leaves. These diseases are affected the potato plants and a huge economic loss is happening in potato cultivation. Now it is a prominent work to decrease these diseases. But first, we have to recognize the types of diseases for proper treatment. If we don’t have to know the actual types of diseases in potato plants, we will not take proper steps to decrease the diseases. Plant diseases must be identified and classified as soon as possible since they can harm a species’ ability to grow and thrive. For the economic and nutritional importance of potatoes, we select this field of research. Potatoes have an important role in developing our economy and fulfilling our food demand. So, nowadays potato disease recognition has been a prominent job to save our economy.
Machine learning uses millions of photos to train the computer to identify different disease types. To recognize, find, and classify plant diseases, a variety of machine learning and deep learning techniques are applied. CNN is a common method for the identification and classification of different types of disease. Any machine learning system e.g. SVM, RF, DT, KNN, LR, ANN, etc. may classify the potato leaf disease but separately extract the feature by using another feature extraction process. All machine learning algorithms are needed to extract the right features for classification. The classifier won’t be able to accurately categorize the photos if we feed it raw images, and its accuracy will be less. CNN (Convolution Neural Network) handles the problem easily by directly extracting the features from the photos assuring the best accuracy. There is no separate feature extraction process that is not required in CNN. In a typical CNN design, the starting layers extract the image’s low-level features, while the end layers extract the image’s high-level features. Without CNN, we would have to spend time deciding which attributes to use to classify the image. Although there are many handcrafted features (local and global) accessible, choosing the right features for a solution (picture classification) and the right classification model will take a lot of effort. All of these issues are fairly handled by CNN, which also has a higher accuracy rate than a typical classifier. We employed CNN to find the disease on potato leaves for the incredible performance of the disease detection technique of CNN. The main objectives of this research are:
To develop a deep learning model using CNN for potato leaf disease detection.
To use transfer learning technique for several pretrained models for achieving the most accurate classification.
To detect and recognize the potato leaf diseases e.g. Healthy, Early Blight, Late blight
To increase model robustness by using the normalization technique and data augmentation technique.
To mitigate the test loss of potato leaf disease detection.
To remove overfitting problems by using data augmentation technique and dropout layer.
To Compare the classification accuracy among different Pretrained models and our Proposed CNN Model.
To recognize and visualize the potato leaf disease using the best-performed model that is our Proposed CNN Model.
2. Literature Review
KUMAR SANJEEV et al.[
1] used an ANN classifier for the early prediction of potato diseases from leaf images. FFNN Model is used for this purpose and accuracy is 96.5%. Dr. Tejashree T. Moharekar et al.[
2] used a CNN Model for potato leaf disease detection and achieved an accuracy of 94.6%. Rabbia Mahuma et al.[
3] used the pre-trained DenseNet for potato leaf disease detection with an accuracy of 97.2%. Mosleh Hmoud Al-Adhaileh et al.[
4] used a CNN architecture for detecting potato late blight disease and the model accuracy is 99%. Tahira Nazir et al.[
5] used a deep learning method to classify potato leaf disease with an accuracy of 98.12%. Deep Kothari et al.[
6] created a CNN model to detect potato leaf disease and compared accuracy with the pretrained models VGG, ResNet, and GoogleNet on the same dataset and achieved 97% accuracy for the first 40 CNN epochs. Anushka Bangal et al.[
7] used a CNN model for the detection of potato leaf diseases with an accuracy of 91.41%. Dr N.ANANTHI et al.[
8] used image preprocessing, and image enhancement (CLAHE, Gaussian blur) for potato leaf disease identification. The classification is performed by CNN and the accuracy is 98.54%. A. Singh and H. Kaur[
9] used SVM for the classification of potato leaf disease detection and the accuracy is 95.99%. N. Tilahun and B. Gizachew[
10] detect two types of potato diseases named Early Blight and Late Blight using pre-trained CNN models MobileNet and EfficientNet. The EfficientNet acquired better accuracy at 98%. Birhanu Gardie et al.[
11] identify potato disease from leaf images using the transfer learning method. The comparison of different model accuracies is shown in this work using the same dataset where InceptionV3 acquired the best accuracy at 98.7%.
Md. A. Iqbal and K. H. Talukder [
12] use image processing and machine learning methods to detect potato leaf diseases where RF obtained a higher accuracy of 97%. Abdul Jalil Rozaqi and Andi Sunyoto [
13] use a customized CNN model with 4 convolution layers and 4 MaxPooling layers for the detection of diseases from potato leaves. The accuracy is obtained at 97% for training data and 92% for validation data using 20 batches at 10 epochs. Md. K. R. Asif et al.[
14] build a customized CNN model named sequential model and data augmentation technique for potato leaf disease detection. The customized model achieved the best result with an accuracy of 97% compared to pretrained models. R. A. Sholihati1 et al.[
15] use the deep learning CNN model VGG16, and VGG19 to classify the potato leaf disease and the average accuracy is 91%. Chaojun Hou et al.[
16] used the machine learning method for this process and the SVM achieved the best result with the highest accuracy of 97.4%. Md. Nabobi Hasan et al.[
17] used a deep learning-based technique to identify the potato leaf disease and an overall accuracy of 97%.
Junzhe Feng et al.[
18] used ShuffleNetV2 to detect potato late blight disease. Feilong Kang et al.[
19] used the machine learning technique to identify potato blight diseases from leaf images. Javed Rashid et al.[
20] identify different types of potato leaf disease by using deep learning-based multi-level model. P. Enkvetchakul and O. Surinta [
21] used two deep CNN models MobileNetV2, and NasNetMobile with the data augmentation technique for potato leaf disease detection. E. CENGİL and A. ÇINAR[
22] used transfer learning with pretrained deep learning models for flower classification and the highest performance is achieved with the VGG16 model at 93.52%. Bin Liu et al. 2017[
23] used a deep learning CNN model named AlexNet for the detection of apple leaf disease with an overall accuracy of 97.62%. J. Arora et al.[
24] used a machine learning method named deep forest for the identification of disease from maize leaf and compared it with other methods and the highest accuracy is 96.25% achieved from the deep forest. XIHAI ZHANG et al. 2017 [
25] used improved deep CNN models e.g. GoogLeNet, and Cifar10 models for the identification of maize leaf disease. The obtained accuracy for GoogLeNet is 98.9% and for Cifar10 is 98.8%. Md. Rasel Howlader et al. 2019[
26] proposed an eleven-layer deep CNN model to automatically recognize the guava leaf disease and the achieved average accuracy is 98.74%.
K.R Aravind & P. Raja[
27] used transfer learning for the automated disease classification of crops in the field of agriculture. Diseases are classified using some pretrained models with data augmentation techniques. Sk Mahmudul Hassan et al. 2021[
28] used the CNN model with transfer learning techniques for the identification of many types of plant diseases from leaf images and the EfficientNetB0 model has acquired the highest accuracy with 99.56% through four different models. V. Shrivastava & M. K. Pradhan 2020[
29] used the transfer learning method for the identification of diseases from rice plants. AlexNet is used for finding the features and SVM is used for disease identification and the accuracy is 91.37% in which 80% images are used for training and 20% images are used for testing. J. Eunice et al. [
30] used a model based on deep learning for the identification of crop leaf disease. The work related to potato leaf disease detection is summarized in
Table 1.
3. Process of Potato Leaf Disease Classification
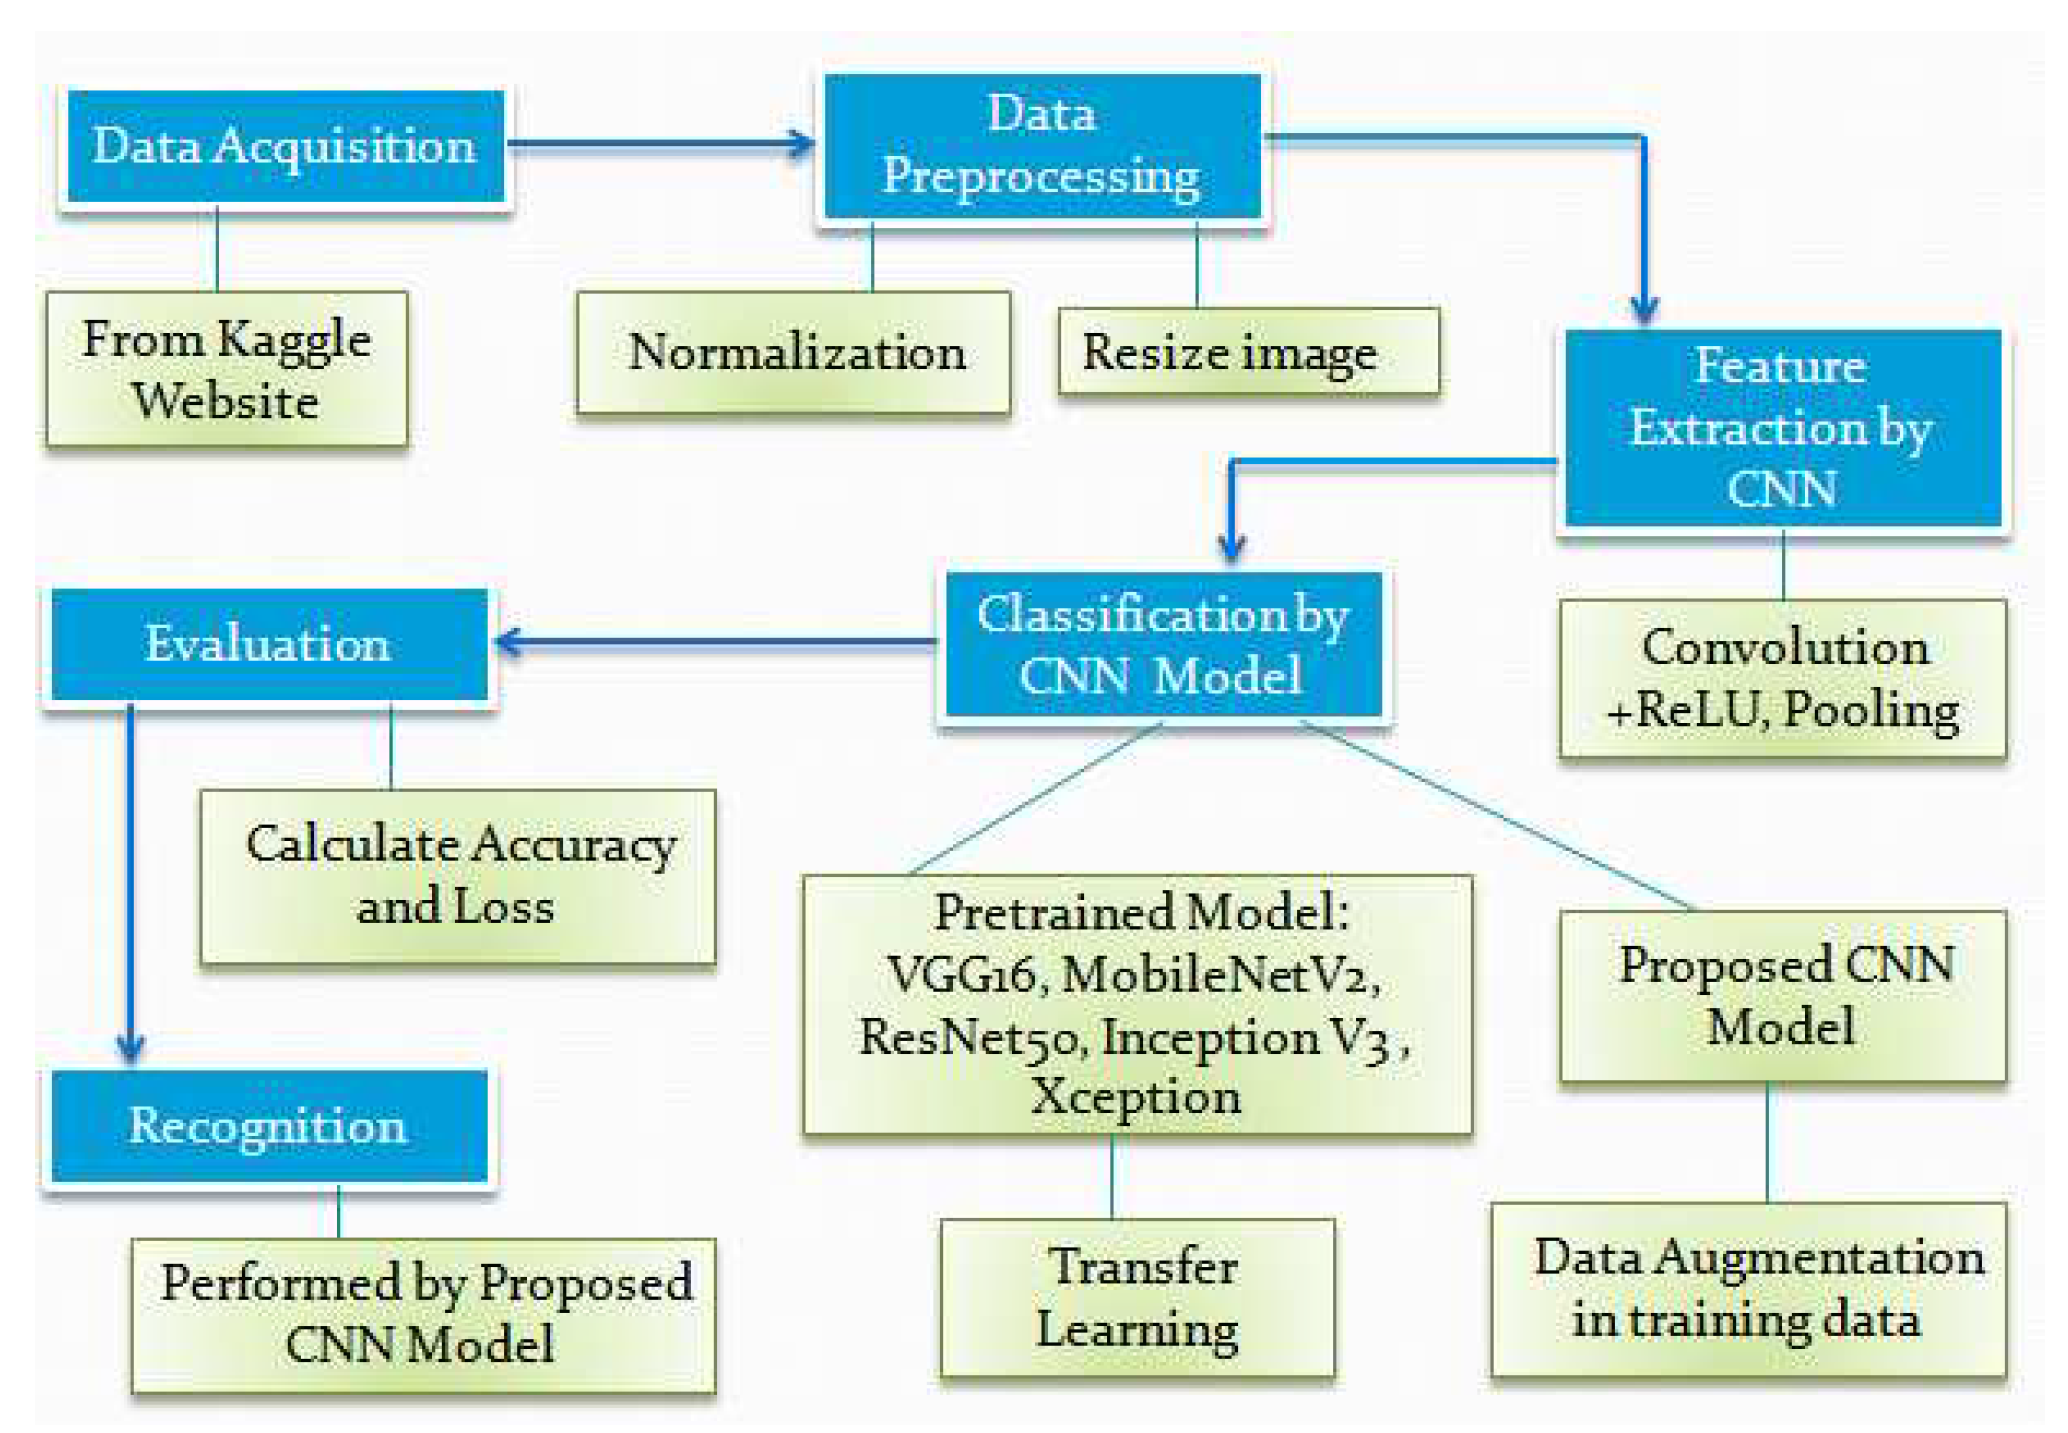
Some techniques are used for potato leaf disease classification e.g. image acquisition, image preprocessing, image augmentation, feature extraction, and classification. Feature extraction and classification are performed using CNN. The steps of potato leaf disease classification are presented in
Figure 1.
3.1. Image Acquisition
The dataset is the most important thing for the recognition of potato leaf diseases. At first, we have to collect a proper image dataset for this process. The dataset is collected in three ways. Firstly, we can use ready-made data from a third-party vendor or get it from Kaggle or any online prepared dataset. The second option is to manually collect the image data by taking photographs from different fields using the camera. But this process will be time-consuming. The third option is collecting data from different websites which has potato images and collecting those images. We have used a ready-made dataset from Kaggle
(https://www.kaggle.com/datasets/muhammadardiputra/potato-leaf-disease-dataset) for our work. Kaggle is a collection of many types of image datasets online. It is a popular source for many types of image collections. The dataset is split into a training dataset, a validation dataset, and a test dataset. The dataset has a total of 1500 images of which 900 are for training, 300 for validation and 300 for testing are shown in
Table 2.
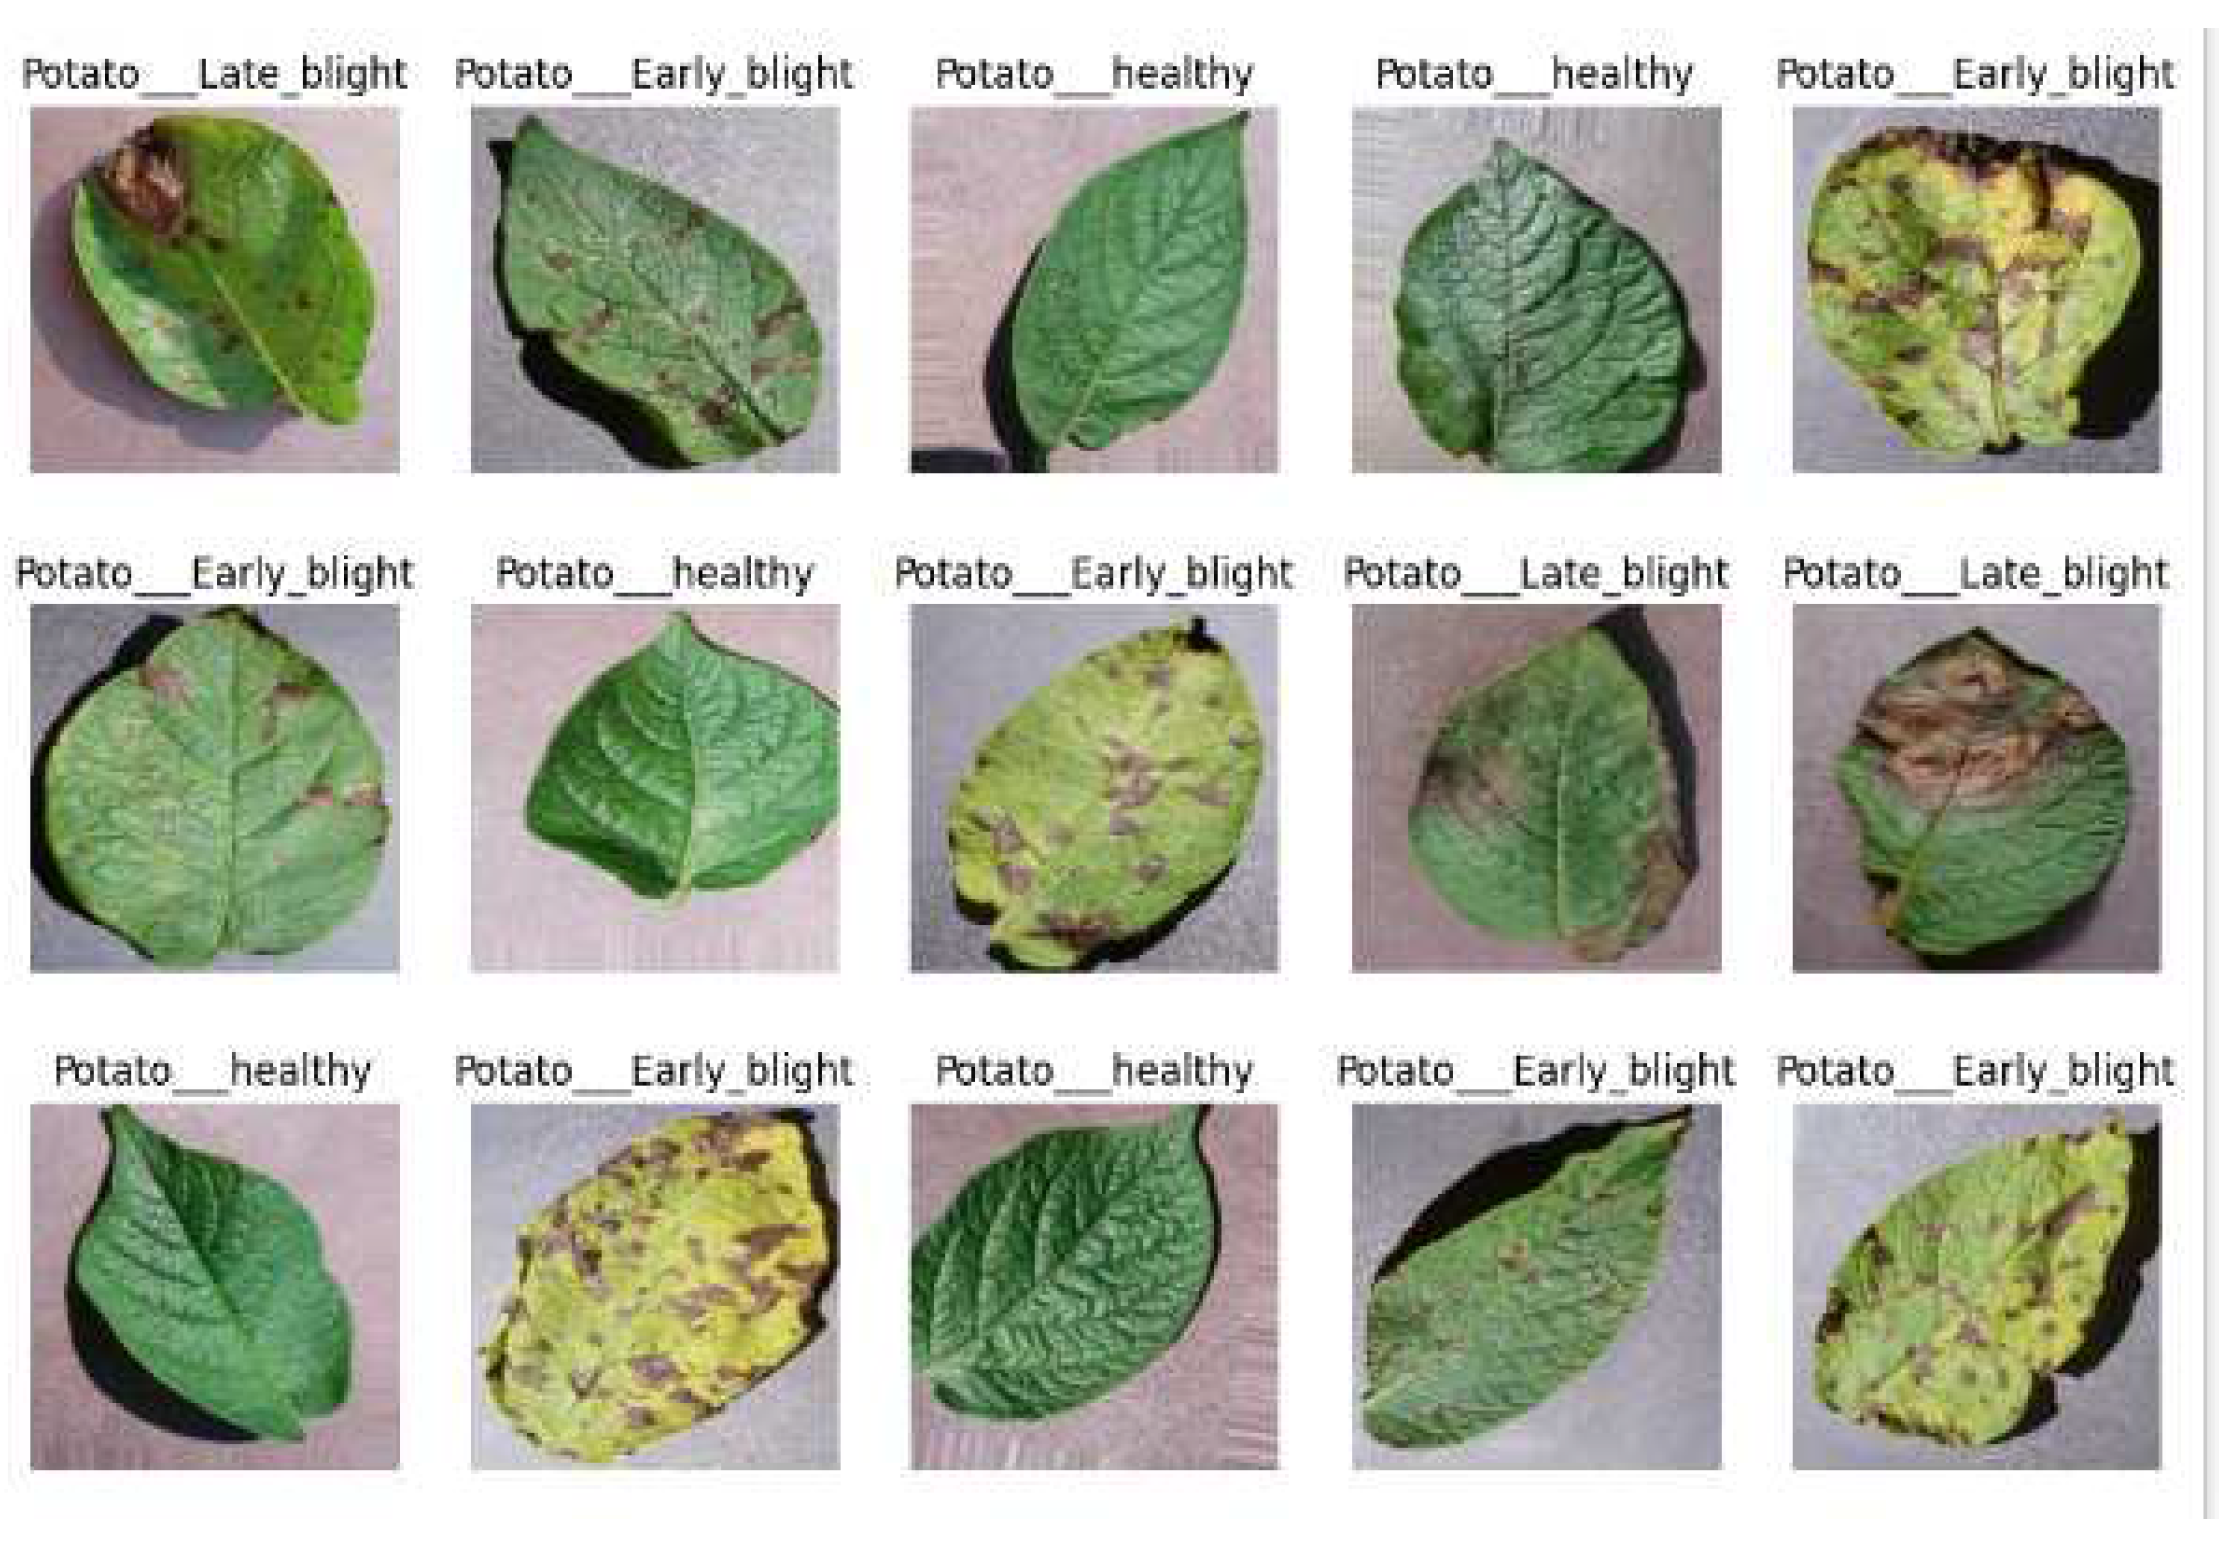
There are three types of potato leaf datasets in our dataset e.g. healthy, early blight, and late blight. . Alternaria solani is the root cause of early blight. Both hills and lowlands contain it. Concentric rings define the angular, oval shape of this brown to black necrotic patch. On the leaf, several dots combine and disperse. Phytopthora infestans is the cause of late blight in potatoes. It affects tubers, leaves, and stems. Leaf spots become larger, more numerous, and eventually turn purple-brown before becoming completely black. Under the leaves’ surface, white growth appears. The sample image from our potato leaf disease dataset is presented in
Figure 2.
3.2. Image Preprocessing
Various image preprocessing techniques are employed before feature extraction of an image to improve performance, such as resizing the image, filtering the images, removing the noise, changing the color, data augmentation, normalization, and image segmentation. After being captured, plant leaf photos are typically noisy. These noisy images are very tough to recognize. So we should remove the noise from the initially collected noisy image dataset for proper recognition of those images. It also gives high training accuracy. Then we have to resize the image to get the same sized image. An error is likely to occur if the image is not the same size as the model is built-in code using a library like TensorFlow. To make it simpler for algorithms to learn from the data, scale pixel values to a common range, often between 0 and 1 is performed by using normalization. Image preprocessing can speed up model inference while reducing the need for model training.
3.3. Image Augmentation
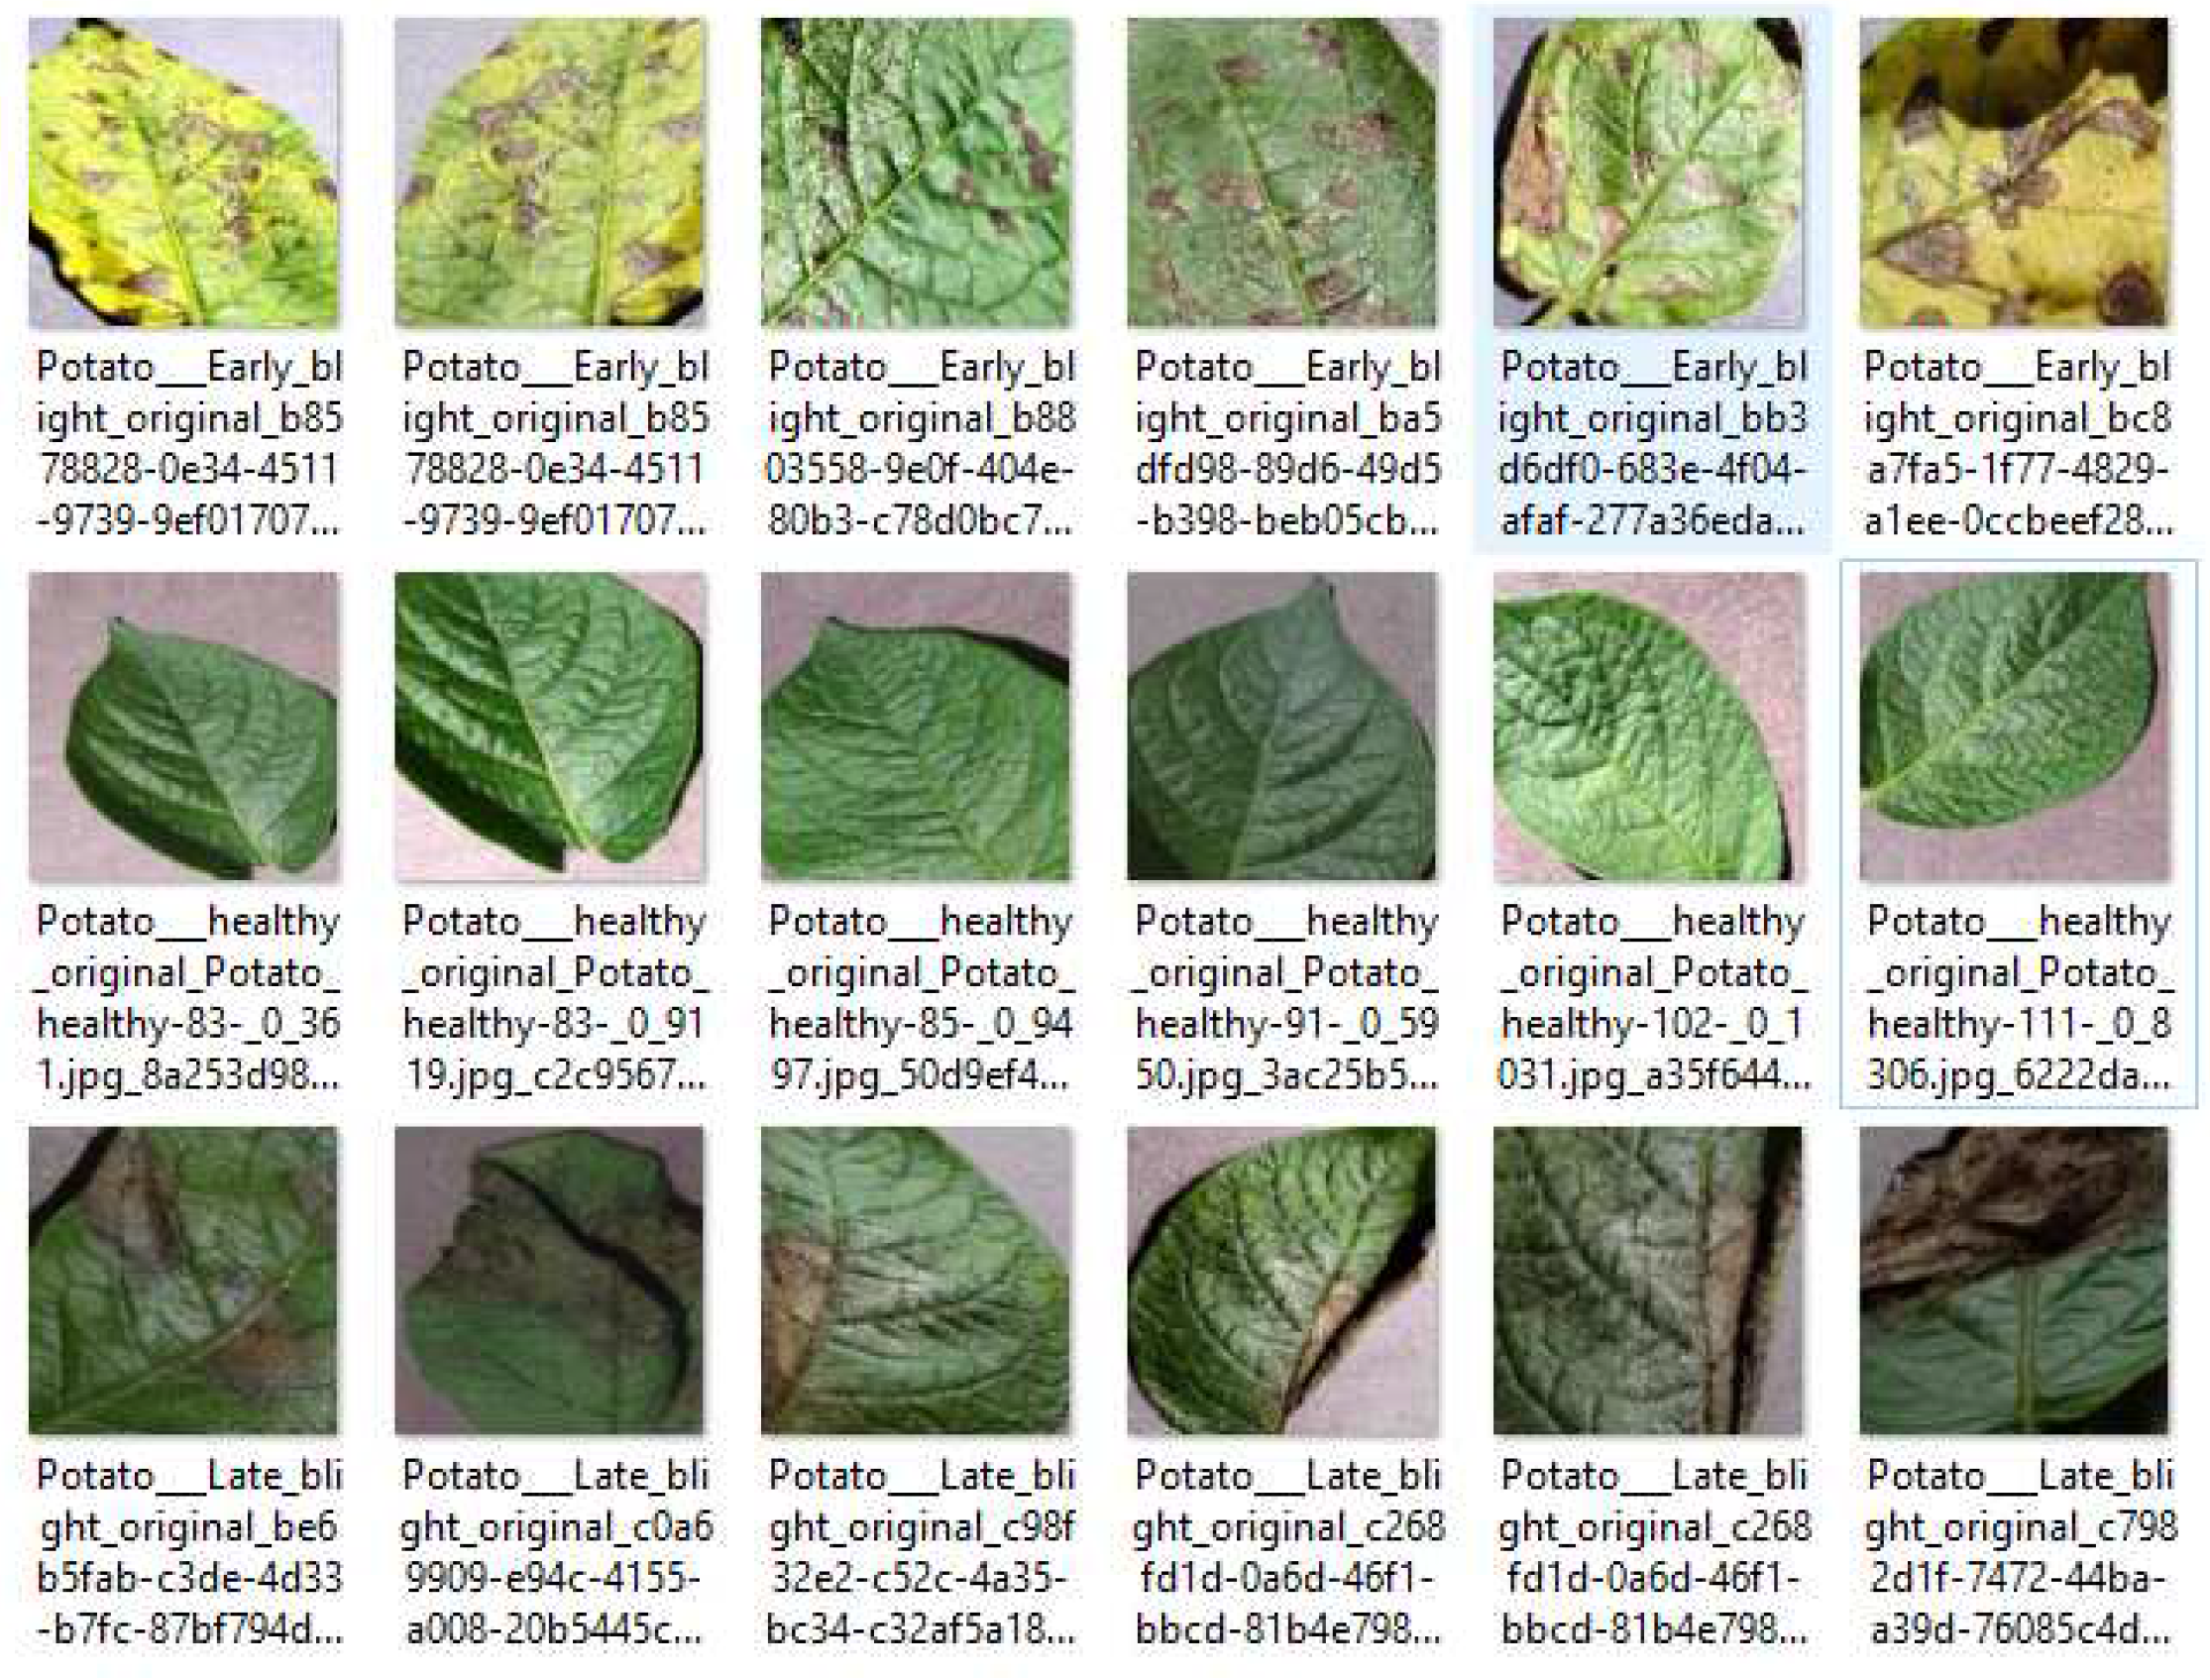
Augmentation involves expanding the dataset by employing various techniques. In disease classification, the number of images or data is increased by using rotation, flipping, shifting, randomly changing the brightness, zooming, etc. However, a significant differentiation exists between image augmentation and image preprocessing. While image preprocessing techniques are used on both training and test sets, image augmentation is exclusively employed on the training data. It is not feasible to fully capture an image that takes into account every possible real-world event for a model. We can expand the sample size of our training data and include new situations that might be challenging to uncover in the actual world by enhancing the photographs. The model can learn from a larger range of events by enhancing the training data to generalize to different scenarios. Image augmentation is an important issue for addressing the over-fitting problem in deep learning. It is used to avoid over-fitting problems and also improves classification accuracy. Several data augmentation samples are shown in
Figure 3.
This augmentation technique is only used for training data not for test data because the more training data, the better the model learns. we can use a data augmentation technique to increase the number of datasets that employs the improvement of model accuracy. If we have a small dataset then we can use this data augmentation technique to increase the number of images. The augmented dataset is represented in
Table 3.
3.4. Feature Extraction
It is used for finding patterns from images that are useful for disease identification from the image. The convolution layers and pooling layers are combined to create the feature extraction process, which is then followed by fully linked layers and softmax classification layers. Based on the provided inputs, the softmax classifier identifies the outputs. It reduces the dimension and also eliminates redundant data. There is no loss of relevant and significant features of image data when it reduces the dimension and the number of resources needed for processing. A feature vector is formed based on a similar feature that is used for the recognition and categorization of an object. The features are directly extracted by CNN from the source image. The images are classified using another neural network, such as SVM, DT, RF, etc., but they do not extract the features from the images directly like CNN. The input image is used for extracting the feature. The extracted features are utilized by the neural network for classification. It also helps to increase the learning speed and generalize the machine-learning process. We used CNN for feature extraction. The feature extraction process by CNN is shown in the first portion of the CNN working process represented in
Figure 4.
3.5. Classification
Image classification is the process of recognizing three types of image diseases. CNN is used in our work for image classification.CNN has been the most common technique for classification because of its strong feature extraction capabilities used in the CNN process for potato leaf disease classification. The common classification process is shown in the second portion of the CNN working process represented in
Figure 4.
3.6. Evaluation and Recognition
We used some performance metrics for measuring the performance of potato leaf disease classification problems or any classification problems in machine learning and deep learning. Confusion matrix is used for this purpose. It is a popular benchmark for accuracy or error calculations in classification problems. The performance metrics are accuracy, precision, and recall are calculated by using a confusion matrix[
14,
20]. The confusion matrix displays a summary of actual versus predicted values, encompassing True Positives (TP), False Positives (FP), True Negatives (TN), and False Negatives (FN) within a matrix structure.[
9]. It is highly crucial for evaluating a model’s performance as it reveals the model’s accuracy and its rate of errors. Different evaluation metrics e.g. accuracy, precision, and recall are available for testing a model’s performance[
14]. We evaluate our model by using accuracy metrics with test accuracy and test loss. Finally, potato leaf disease is also recognized with our Proposed CNN Model.
4. Materials And Methods
We developed a deep learning model using CNN for potato leaf disease detection with fewer parameters and layers to lessen the time complexity. The CNN has different layers and uses different activation functions that are described in this section. We also used these Pretrained Models e.g.VGG16, MobileNetV2, ResNet50, InceptionV3, and Xception for potato leaf disease classification that is performed by using a transfer learning process.
4.1. CNN
There are three main layers in Convolutional Neural Networks e.g. Convolutional layer, Polling layer, and Fully Connected(FC) or dense layer. Besides these layers, stride, padding, and Activation function are also some important terms in the field of Convolutional neural networks.
4.1.1. Convolutional Layer
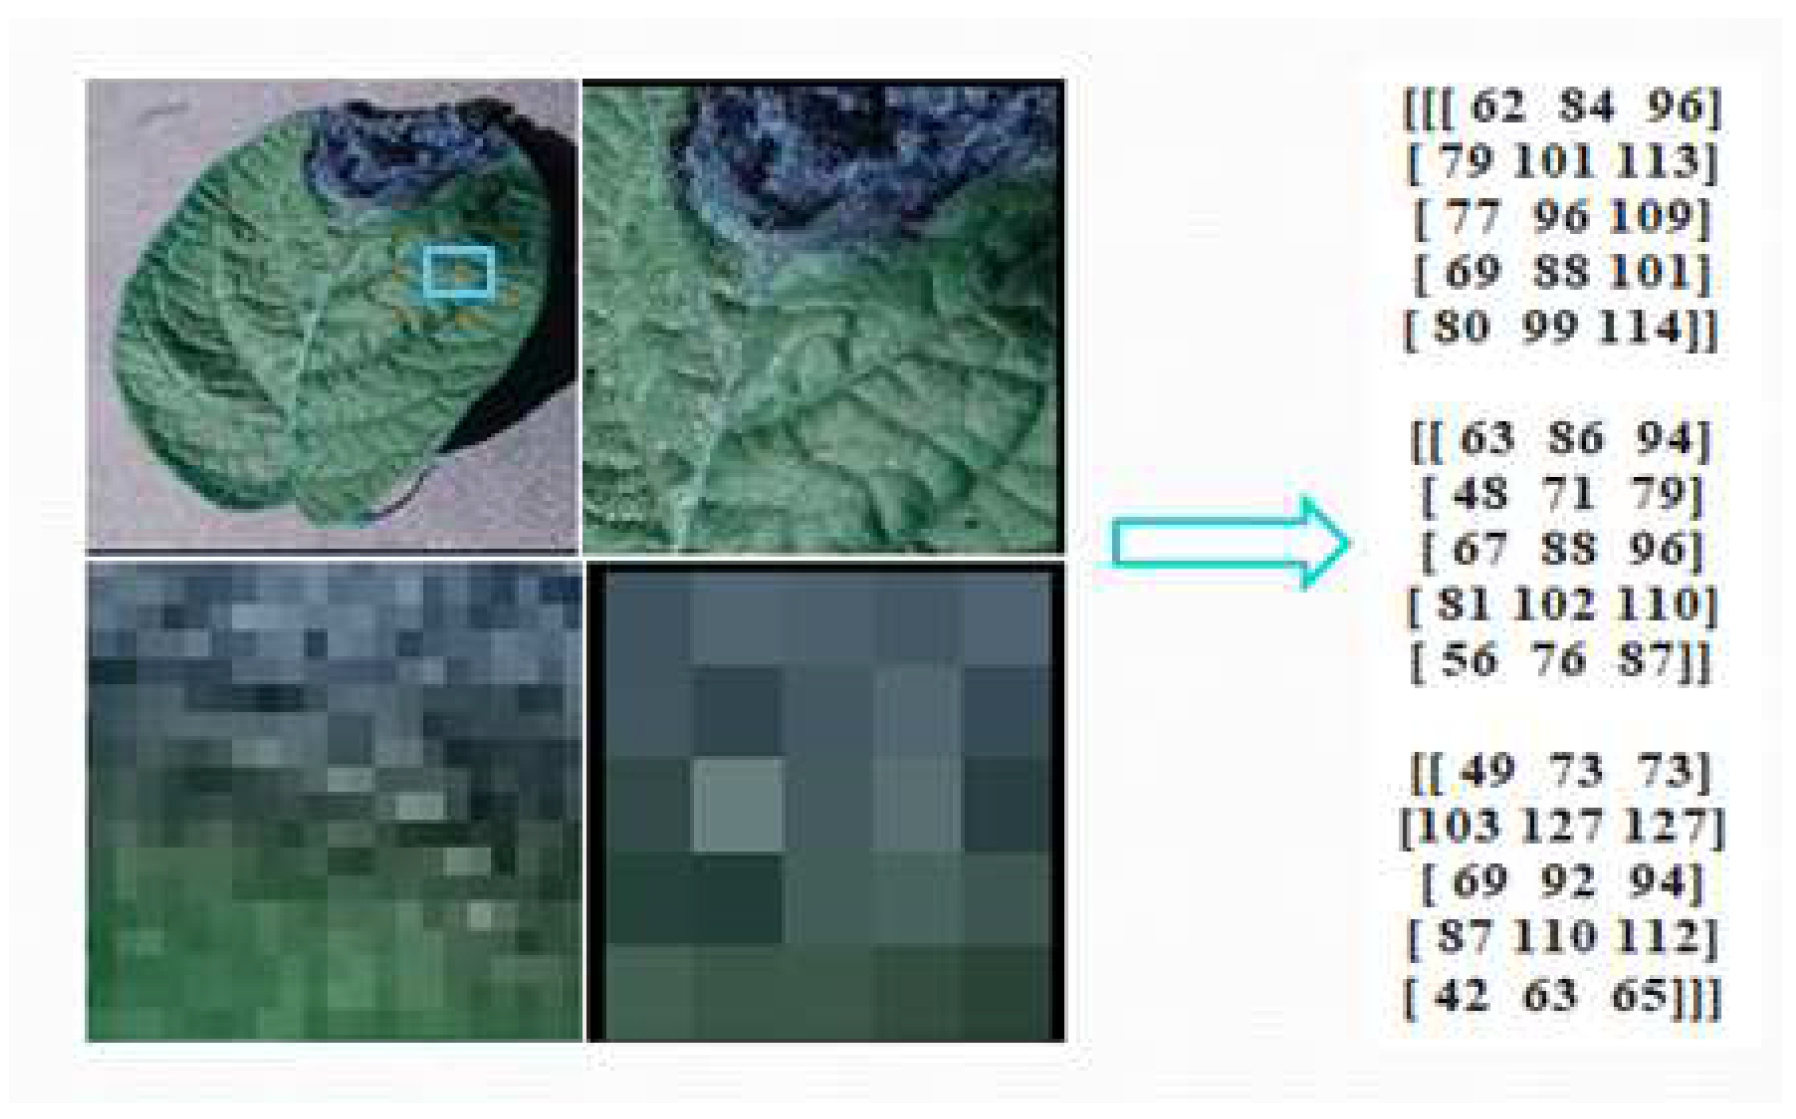
Convolution is the process of combining a kernel or filter with a picture (sum of multiplications of corresponding pixels in the kernel and image). The pixels array is found from our real potato leaf dataset to easily understand the convolution process by Python code. The array pixels are shown in
Figure 5.
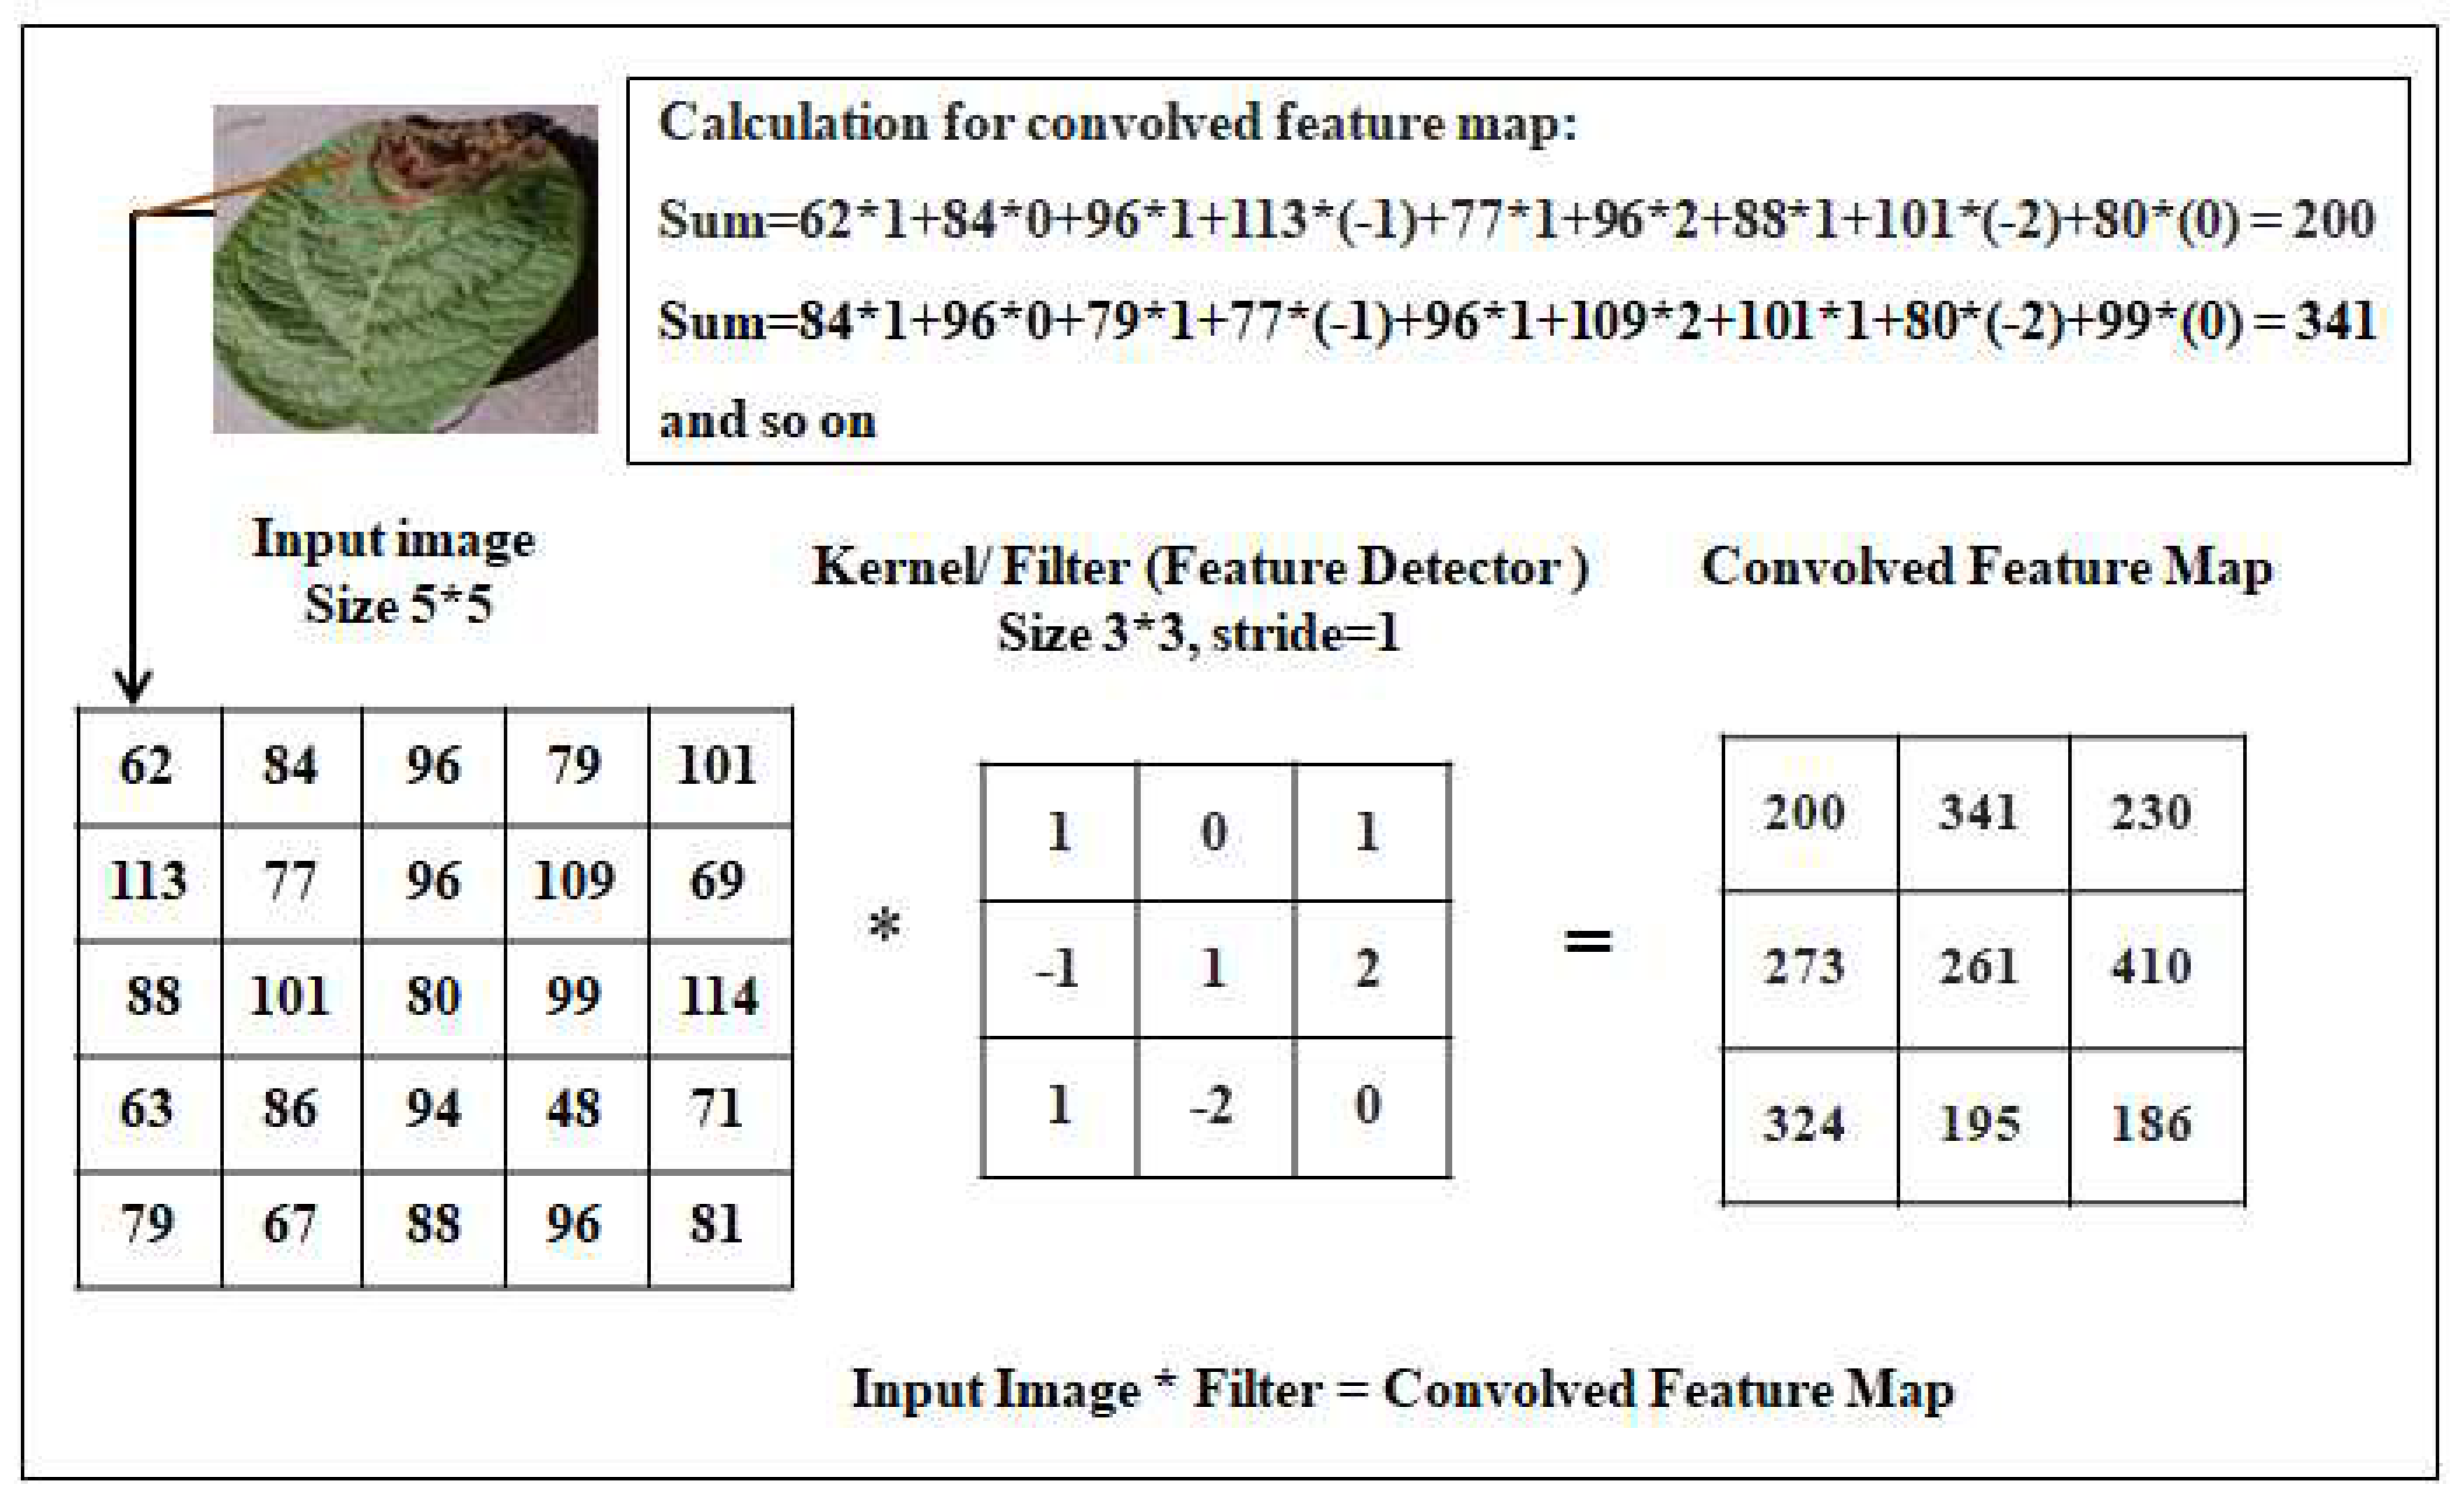
The kernel is running across the full picture. Extraction of features has been performed from the source images using this convolution process taking with a filter. Convolution learns image properties from a small square of input data while maintaining the spatial relationships between pixels. Look at a 5 by 5 image as an example of how every image is seen as a matrix of pixel values. Each input neuron in a typical neural network is connected to the following hidden layer. The convolution Process is shown in
Figure 6.
4.1.2. Pooling layer
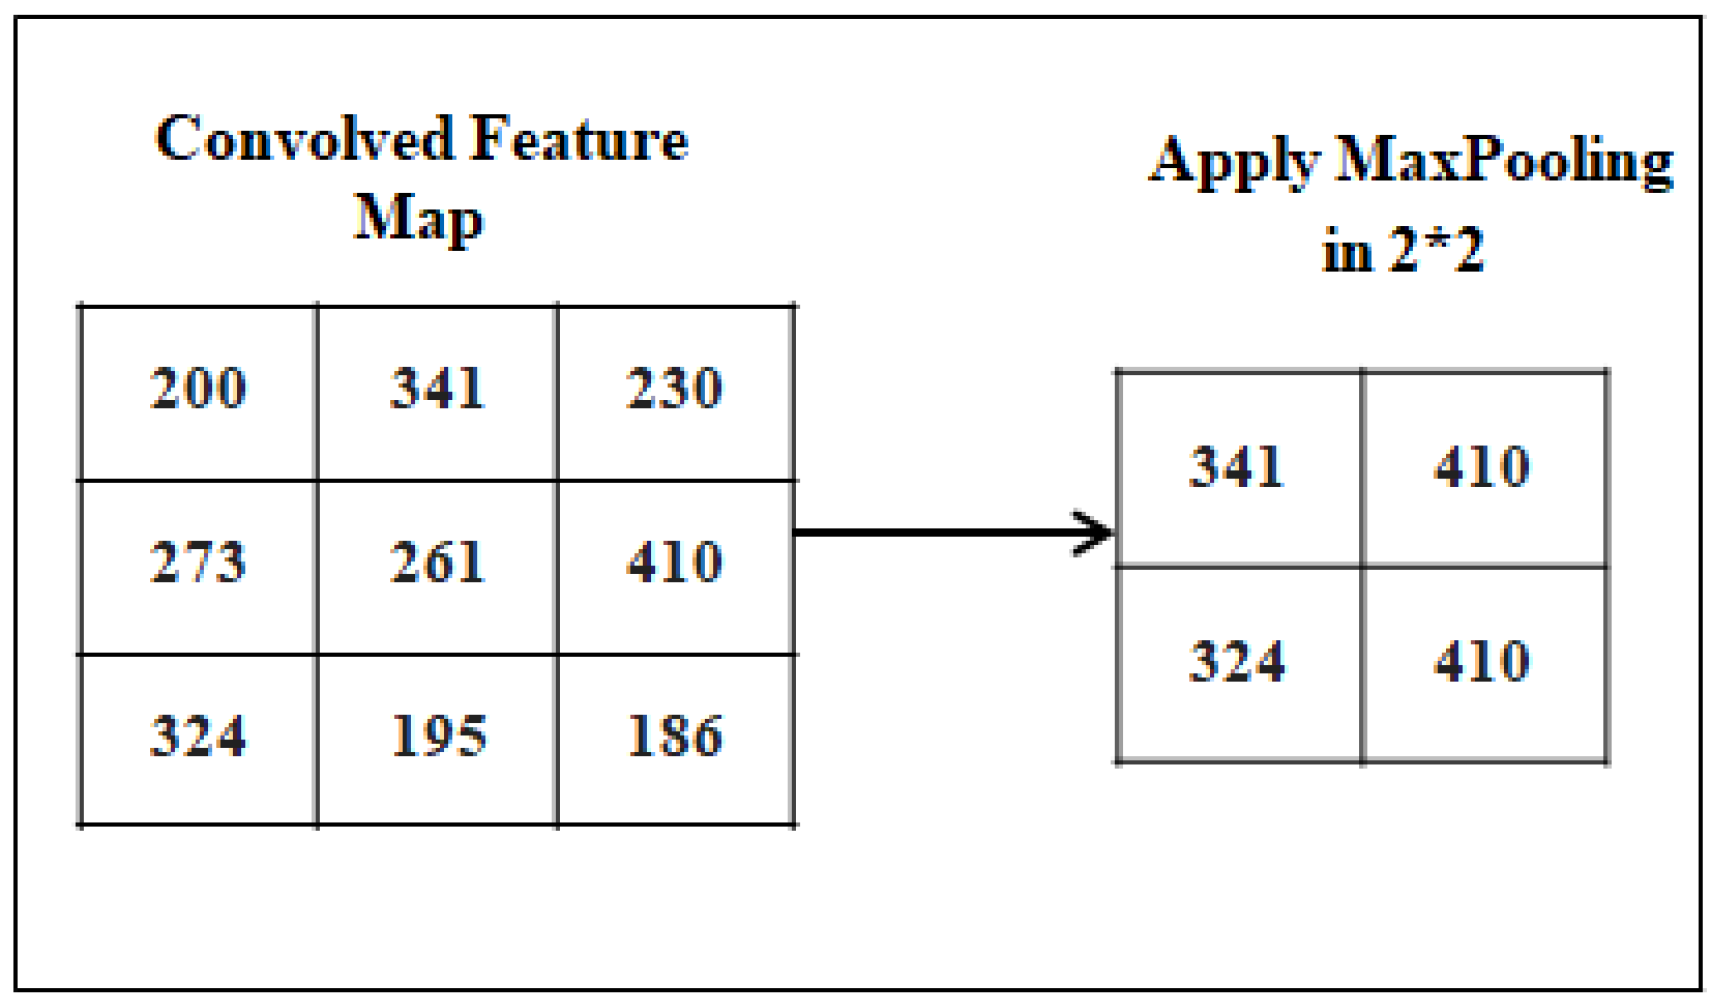
It is applied to decrease the dimensionality of the feature map, reducing the spatial size, reducing the number of parameters, and avoiding the over-fitting problem. It is contained inside the CNN’s hidden layer. Different types of pooling are used in CNN including max, average, and sum pooling. We used the MaxPooling process. The MaxPolling Process is shown in
Figure 7.
4.1.3. Fully Connected layer
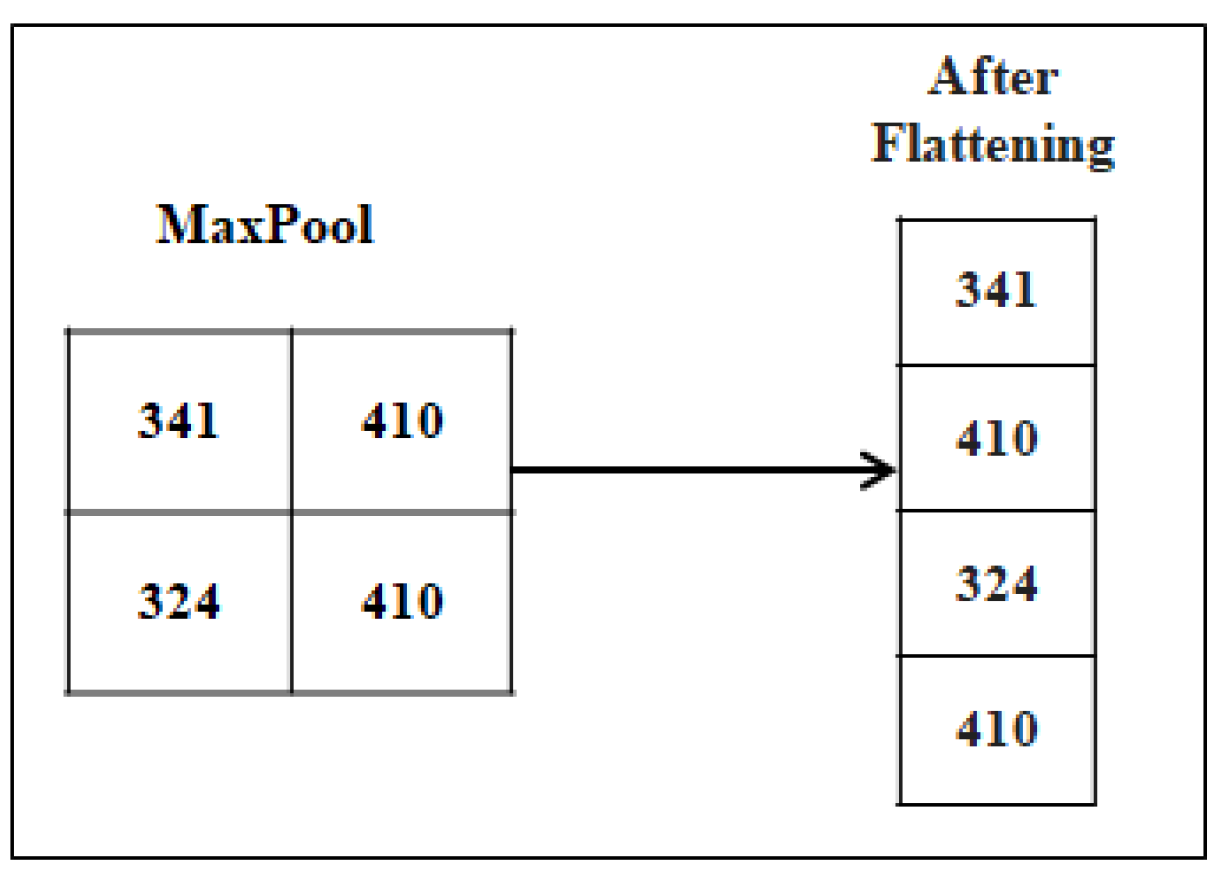
The last few layers of the network are formed by using the Fully Connected Layers also known as dense layers. It takes data from the convolution layer after the convolution process to generate output using a classifier like Softmax, Sigmoid, etc. The fully connected layer receives the output from the last Convolutional layer or pooling layer, where it is flattened before being applied. "Fully Connected" signifies that each neuron in the lower layer is connected to every neuron in the upper layer. This process is shown in
Figure 8.
4.1.4. Stride and Padding
The "stride" is the distance that our filter matrix travels across the input matrix. The filters move one pixel at a time when the stride is 1, the filters move at a rate of 2 pixels each movement when the stride is 2. Smaller feature maps are the result of a longer stride. To ensure that the size of the input image and the output image are the same, padding is used. Padding is added to an image for more accurate analysis by CNN. In zero padding, add layers of zeros to our input images.
4.1.5. Activation Function
A variety of activation functions are employed in deep learning for classification like Sigmoid, TANH, ReLU, Softmax, etc. We have used ReLU and the softmax activation function for our work.
Sigmoid is used for binary classification. If we have to identify two types of class then we use the sigmoid function It uses a probabilistic approach to make decisions with values ranging from 0 and 1. It works only for positive values. It is represented as the following equation
TANH is the another activation function.The range of TanH is -1 to +1, unlike sigmoid. Using TanH, we can deal with negative values. It is the advantage of TanH over the sigmoid activation function. It works for both positive and negative values. It is represented as the following equation
ReLU represented as Rectified Linear Unit. Every Convolution operation has been followed by a further procedure termed ReLU. It has been added after each Convolution procedure. A non-linear process is employed by ReLU. It replaces each pixel in the feature map with a value of zero to eliminate all negative pixel values. It is a linear function that, if the input is positive, outputs the input directly; however, if the input is negative, it outputs zero. It is utilized in the hidden layer to improve computation performance and prevent the Vanishing Gradient Problem. It is used in the convolutional layer in our work. It is represented in the following equation
Softmax is used in the last layer named the dense layer for detecting multi-class categories of image. If we want to identify multiple classes then we have to use the softmax activation function in the last layer to identify multiclass. It calculates the probability of being in each class. The real class will be chosen based on which class has the highest probability. If we have 3 classes of the image in a dataset e.g. healthy leaf, early blight, late blight then the softmax gives the probability of being each class e.g. healthy leaf - 1.5%, early blight - 96%, late blight - 2.5% then it will predict early blight. Finally, we can find the class of the image that has the highest probability using softmax. We used the softmax in the last layer of our model as a classifier in potato leaf disease detection. It can classify the image by selecting the class with the highest or maximum probability as the predicted class. If the potential classes or categories in a classification issue are denoted by yi and the input or features needed to make predictions are denoted by x, then it is represented with the following equation
4.1.6. Dropout Layer
Dropout layers are employed to increase test accuracy and aid in preventing overfitting issues. This is a development that is encouraging and shows how well the model performs in both training and testing. A training technique called dropout randomly ignores certain neurons. They are "dropped out" in an arbitrary way. This implies that during the forward pass, the neuron’s impact on activating downstream neurons is temporarily reset, and any adjustments to its weights are not transferred to the neuron during the backward pass. Both pooling layers (like MaxPooling2D) and convolutional layers (like Conv2D) can be followed by dropout. In our model, we employed a dropout of 0.5 in fully connected layers.
4.2. Transfer learning
To train a neural network effectively and accurately, a sizable million dataset is typically required. However, a larger dataset may not always be accessible, in which case transfer learning is very helpful and practical for improving accuracy. Transfer learning is a technique that makes use of a proven training model. It involves applying an existing paradigm to a fresh issue. Deep learning and machine learning are currently quite popular due to their capacity to train deep neural networks with relatively minimal data while acquiring greater accuracy. When we have a tiny dataset with a relevant model, it is very effective. On a very sizable dataset, this relevant model has previously been trained. When solving a different but related model, the expertise from one model that has already been trained using a very large dataset is used. Additionally, when a relevant model that was previously trained using a large dataset is reused, training time is reduced, there is less of a requirement for data, and neural networks perform better in most cases even with limited data. We used the transfer learning technique for potato disease classification in the pretrained models.
4.3. Pretrained Network Models
We used the pretrained models e.g. VGG16, MobileNetV2, ResNet50, InceptionV3, and Xception. All pretrained models e.g. VGG16, ResNet50, InceptionV3, MobileNetV2, and Xception perform the potato leaf disease detection by using transfer learning. Fine-tune the pre-trained model by removing its final classification layer(s) and adding our own classification layer(s) with the appropriate number of output units (in this case, three for our three potato leaf classes)
4.3.1. VGG16
The only 16 layers of VGG16 have weights, making it distinct from other methods that rely heavily on hyper-parameters. VGG16 consists of a configuration comprising 13 convolutional layers, 5 max-pooling layers, and 3 fully connected layers. 13 convolutional layers and 3 fully connected layers make up the 16 layers with configurable parameters. The network is distinguished by its simplicity, consisting merely of a stack of three convolutional layers on top of each other, with the max-pooling layers handling the increasing depth and volume size. Following that, there is a softmax layer, succeeded by two fully connected layers, each consisting of 4096 nodes. Five max-pooling layers come after a convolutional layer, where they carry out spatial pooling by considering a pixel window and using strides of 2.
4.3.2. MobileNetV2
A convolutional neural network of 53 layers deep is called MobileNet-v2. It is a more compact and lightweight network model. A crucial component of MobileNetV2 is the depthwise separable convolutions found inside the inverted residual blocks. They are made up of the procedures depthwise and pointwise convolution. These actions are effective and aid in lowering the network’s computational complexity while preserving performance. MobileNetV2 does not have the conventional completely linked layers at the network’s end like some other neural network architectures do. Instead, it does classification using a final fully linked softmax layer and global average pooling (GAP).
4.3.3. ResNet50
ResNet50 is a version of the ResNet model that holds 48 Convolution layers, 1 MaxPooling layer, and 1 Average Pooling layer. Its 50 layers are broken up into 5 blocks, each of which has a group of residual blocks. Each block combines a convolution block with an identity block. Each convolution and identity block consists of three convolution layers. To assist the network in developing better representations of the input data, the residual blocks enable the preservation of data from earlier layers. Although it is much deeper than VGG the model’s actual weights are smaller than those of the VGG family for using the global average pooling in lieu of the fully connected layer.
4.3.4. InceptionV3
There are 48 layers in InceptionV3. Convolutional layers, max-pooling layers, fully linked layers, and auxiliary classifiers are some of these layers. The widespread usage of inception modules, which are made up of several parallel convolutional filters with various kernel sizes, defines the architecture. It is distinguished by the usage of Inception modules, which let it capture a variety of features at various scales and levels of complexity. It uses auxiliary Classifiers as regularizers and is less computationally demanding. By performing 11, 33, and 55 convolutions in the same network module, this module will serve as a multi-level feature extractor.
4.3.5. Xception
A convolutional neural network with 71 layers is Xception. With the exception of the initial and final modules, the remaining 14 modules, each comprising 36 convolutional layers, are equipped with linear residual connections surrounding them. The architecture of the Xception model can be summed up as a linear stack of layers with residual convolutions that can be separated along depth. The architecture depicted below clearly shows that Xception is a sequential arrangement of depth-separable convolution layers interconnected with residual connections.. In place of conventional pooling layers like max-pooling or average-pooling layers, it uses depthwise separable convolutions. In the conventional sense, it does not have any fully connected layers. It uses a softmax layer and global average pooling for classification in lieu of a fully connected layer. All of the Model architectures are summarized in
Table 4.
==layoutwidth=297mm,layoutheight=210 mm, left=2.7cm,right=2.7cm,top=1.8cm,bottom=1.5cm, includehead,includefoot [LO,RE]0cm [RO,LE]0cm
==
4.4. Proposed Model
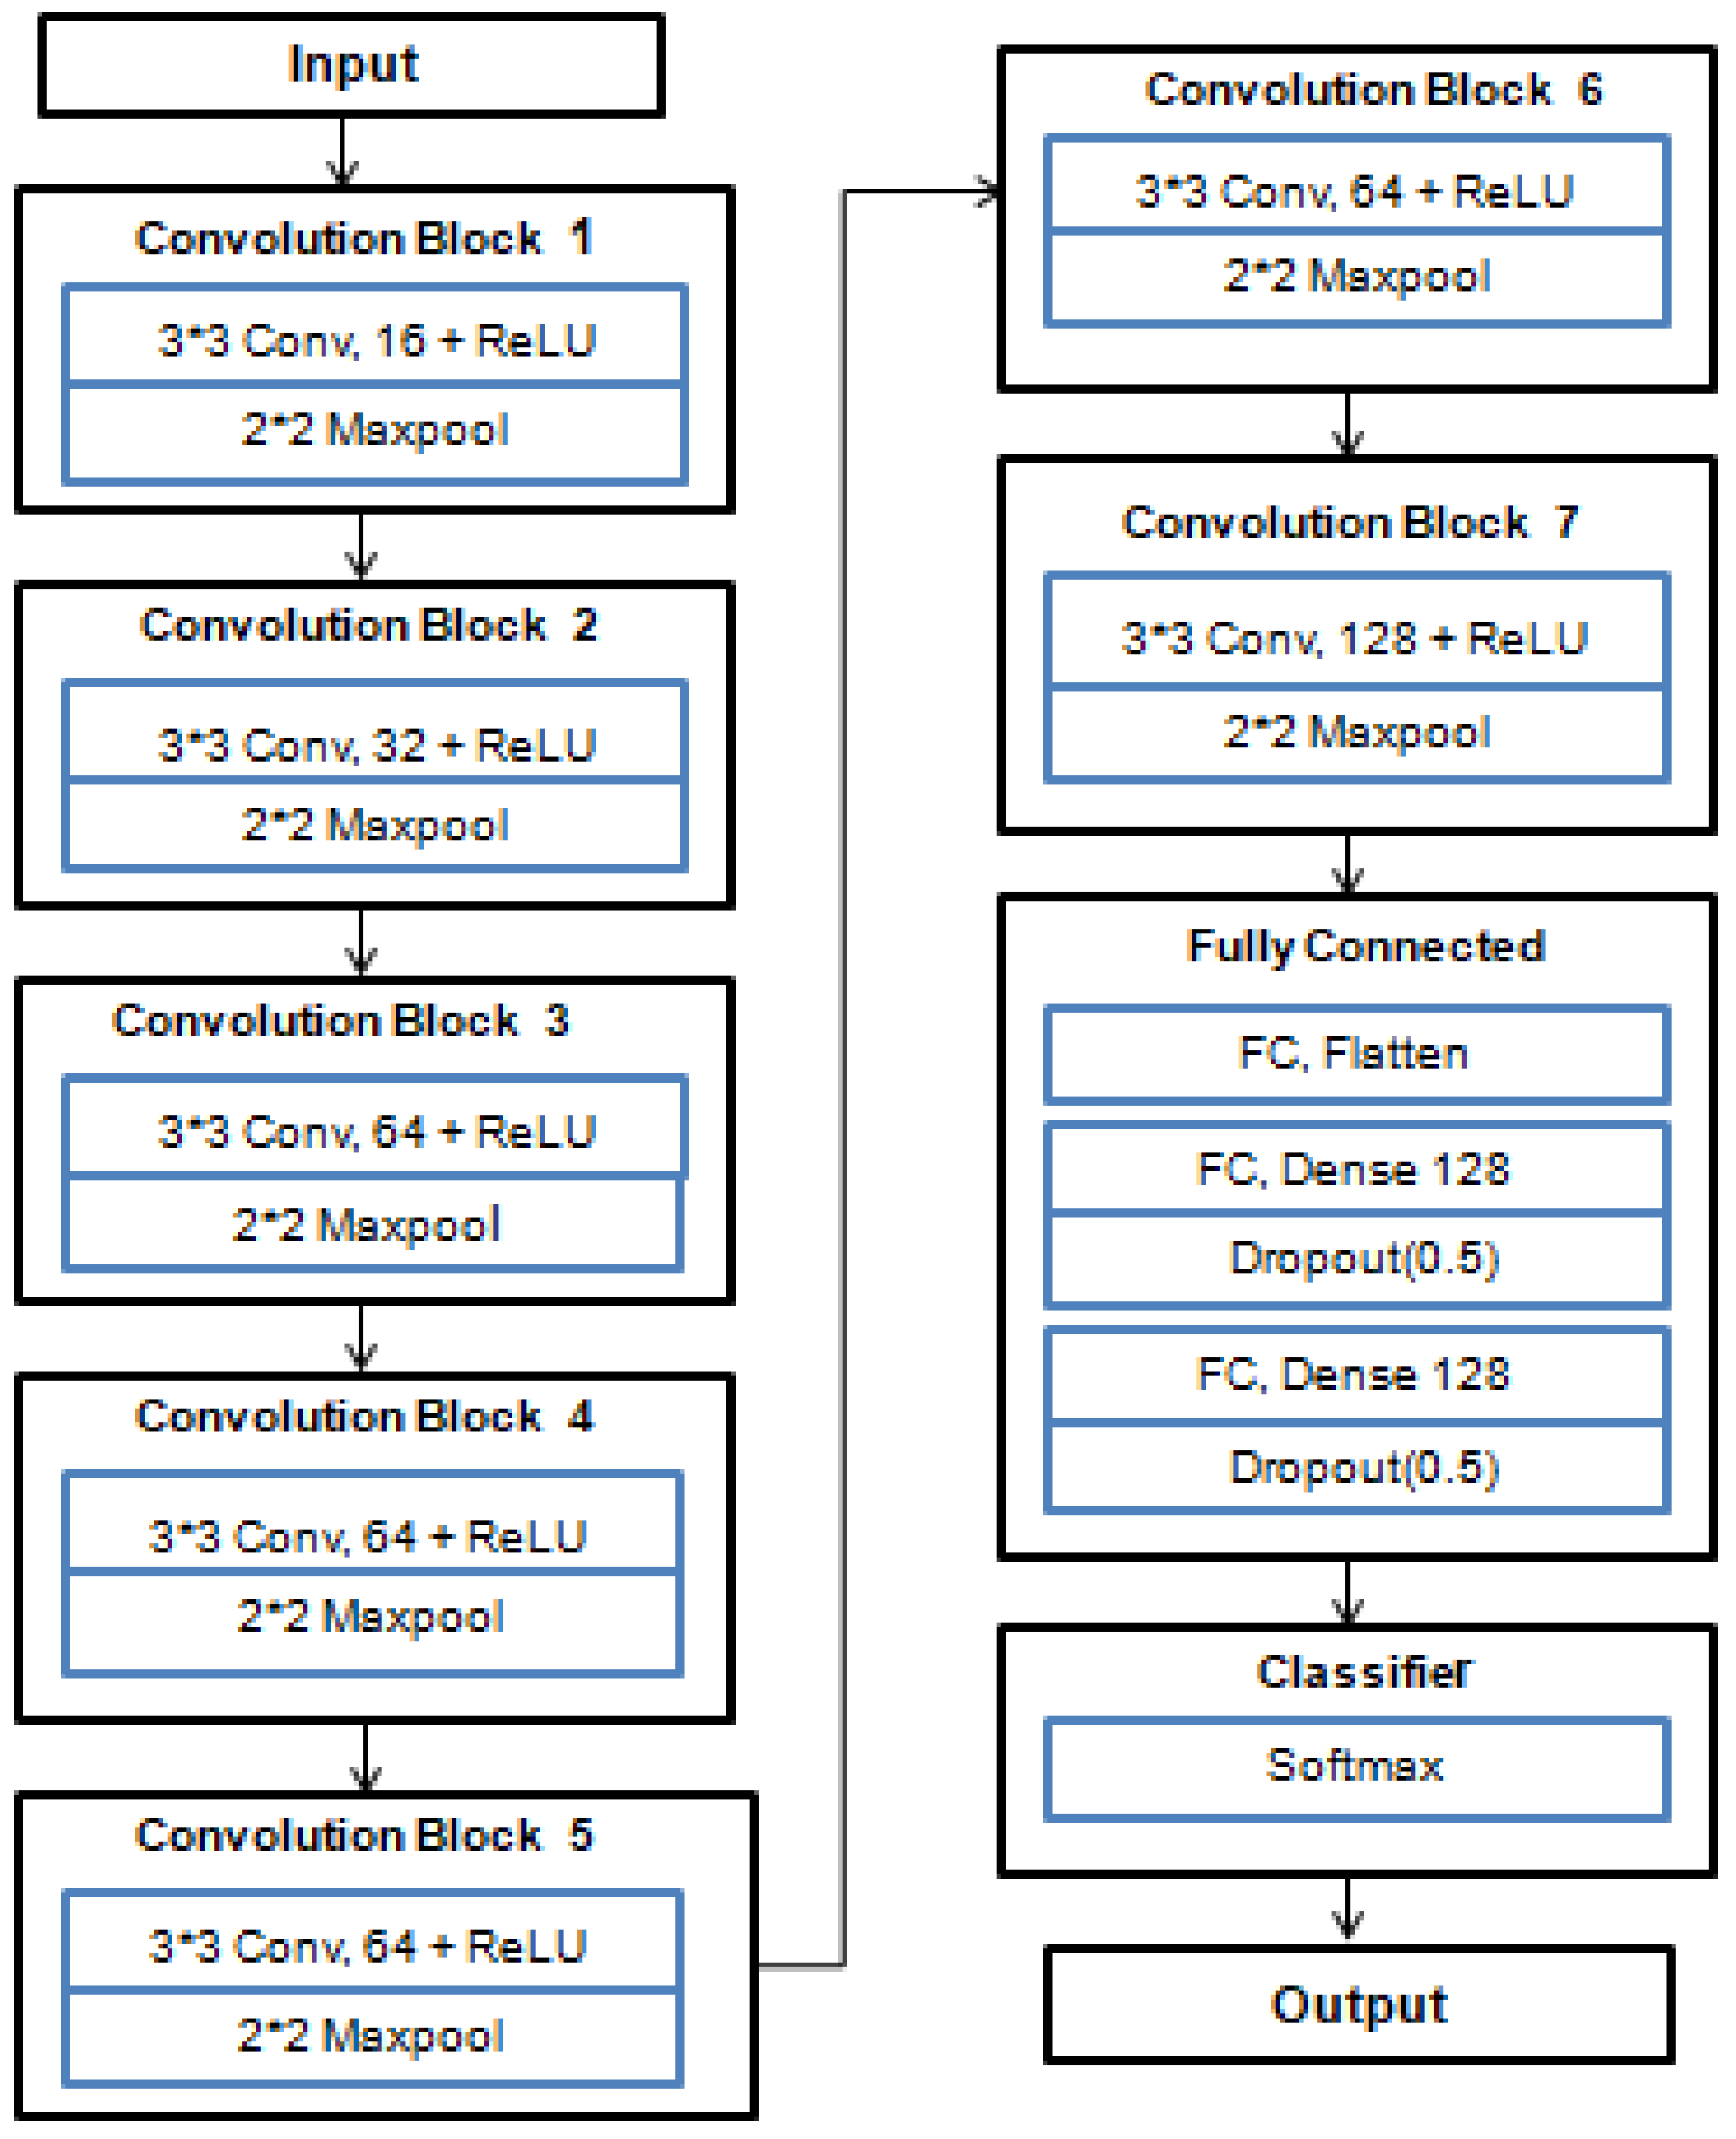
We proposed a deep-learning model using CNN. The Proposed cNN MOdel holds 7 convolutional layers and 3 dense layers. It used a softmax classifier in the last layer for leaf disease classification. Each convolutional layer used the ReLu nonlinear activation function, which diminished the likelihood of the vanishing gradients problem and converted the negative values into zero. In order to mitigate the computational expense and spatial size, a pooling layer is applied after each convolution. Max pooling is used to downsample the images, which decreases the overfitting problem and enhances the efficiency of the activation function, accelerating convergence. The fully connected or dense layer is used in the output layer that predicts a potato leaf image class by using a softmax classifier with 3 outputs. The details architecture of our Proposed CNN Model is represented in
Figure 9.
In the Proposed CNN Model architecture, input is taken directly by CNN for feature extraction. Convolution and pooling layer are used for extracting the unique feature. Then it is converted to one dimensional vector in fully connected layer.Finally it uses softmax classifier in output layer for the classification of potato leaf diseases. The summary of the Proposed CNN Model is described as below
1. Input Layer
2. Convolutional and Pooling Layers:
We employ three sets of Convolutional layers with ascending filter sizes (16,32, 64, and 128) and utilize ReLU activation functions to capture hierarchical features.
Subsequent to each Convolutional layer, MaxPooling layers are incorporated to diminish spatial dimensions.
3. Flatten Layer:
4. Fully Connected Layers:
We introduce two fully connected layers, comprising 128 and 64 neurons, and apply ReLU activation functions to facilitate more profound feature extraction.
Dropout layers with a rate of 0.5 are inserted after each fully connected layer to mitigate the overfitting problem.
5. Output Layer:
The concluding layer is comprised of three neurons, aligning with the three distinct disease classes e.g. potato healthy, early blight, late blight, and employs softmax activation for the purpose of classification.
6. Model Compilation:
To compile the model, we employ the Adam optimizer in conjunction with categorical cross-entropy loss, a suitable choice for tasks involving multi-class classification.
Throughout training, the accuracy metric is employed to oversee the model’s performance.
5. Results and Discussion
Some Pretrained Models and a Proposed deep-learning Model are used in this work for the identification and categorization of potato leaf disease.
Categorical Cross entropy is used as a loss function and the Adam is used as an optimizer in the classification for all models. The batch size used in the classification is 32 for all the models. All models are trained by using 80 epochs. The hyperparameter used in all models for potato leaf disease classification is represented as
Table 5.
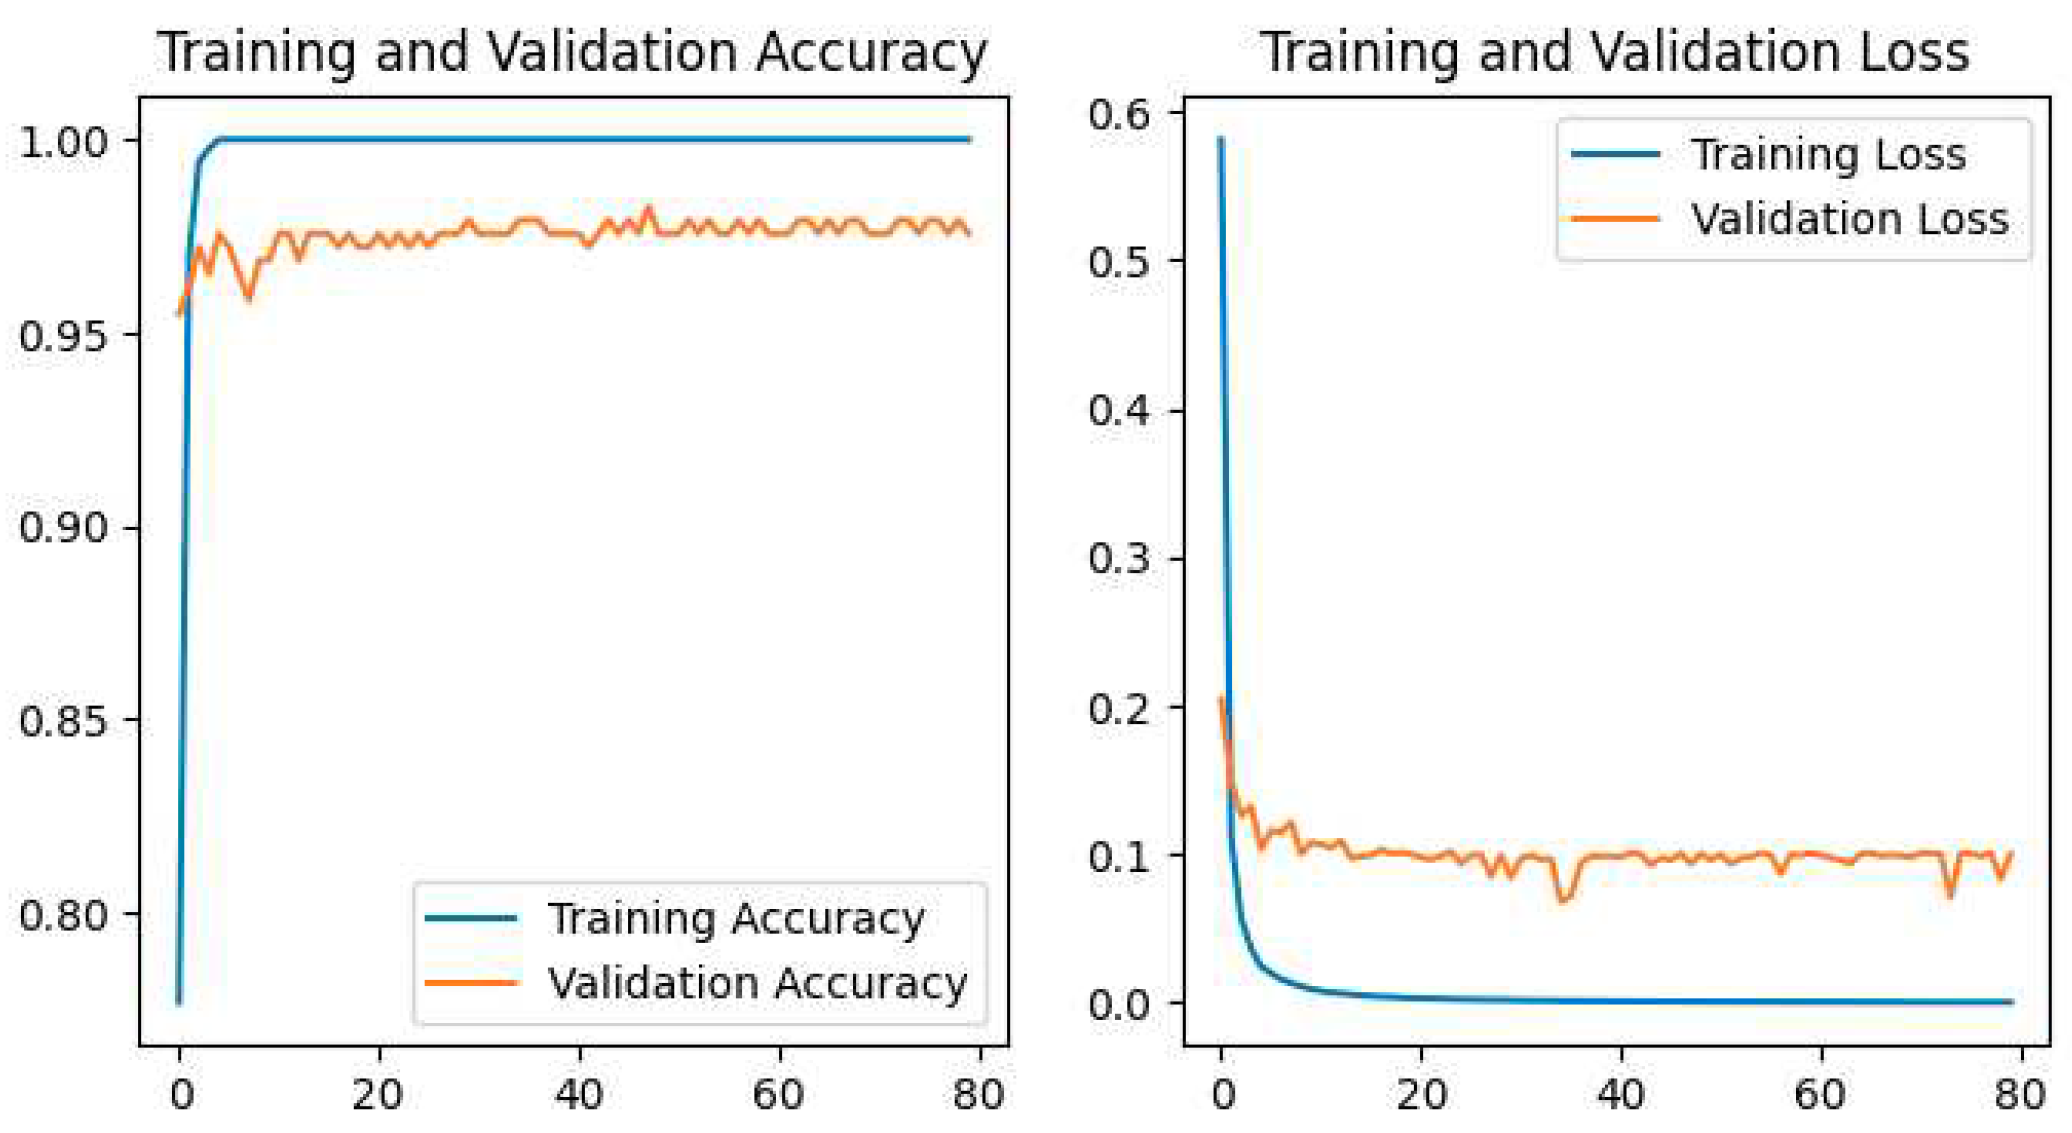
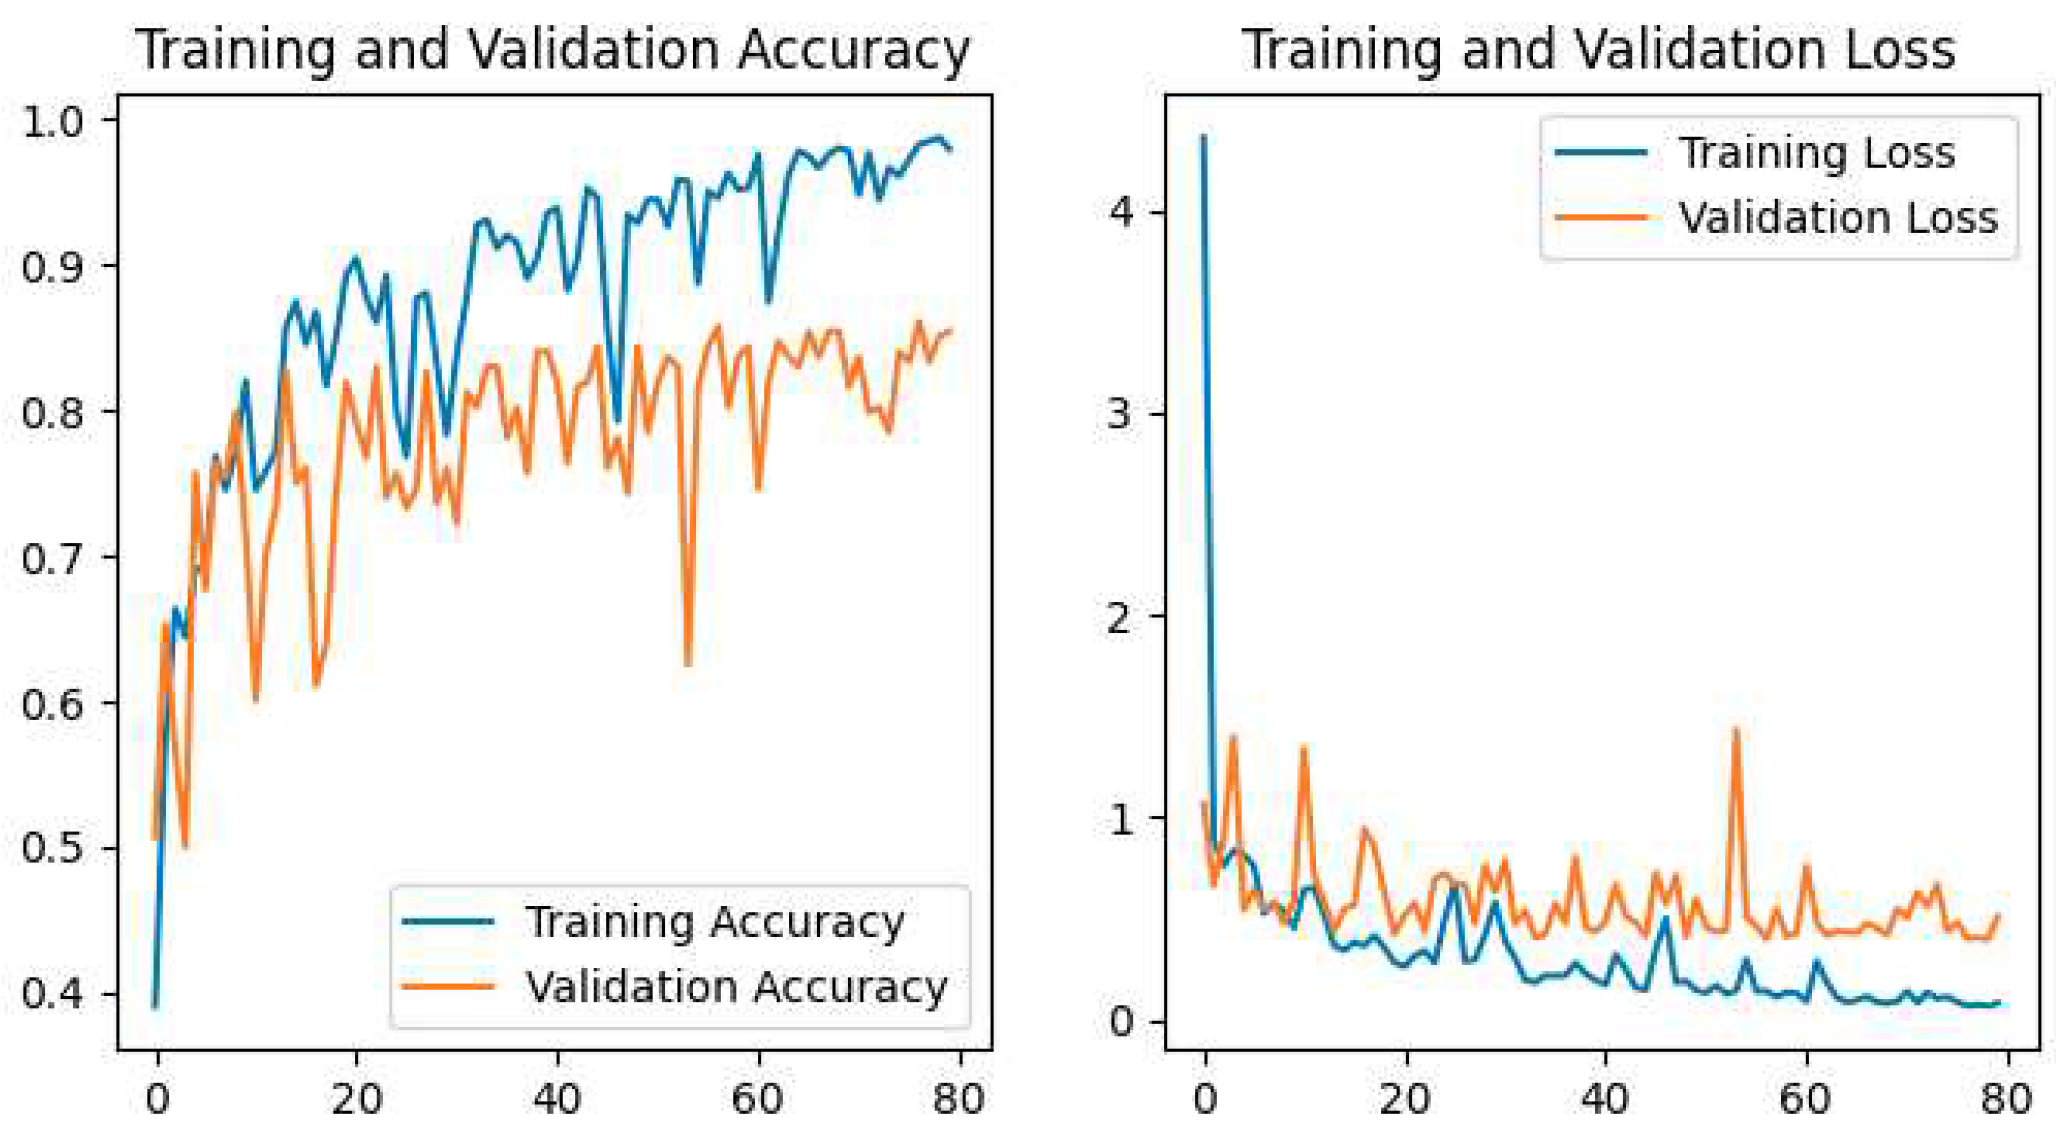
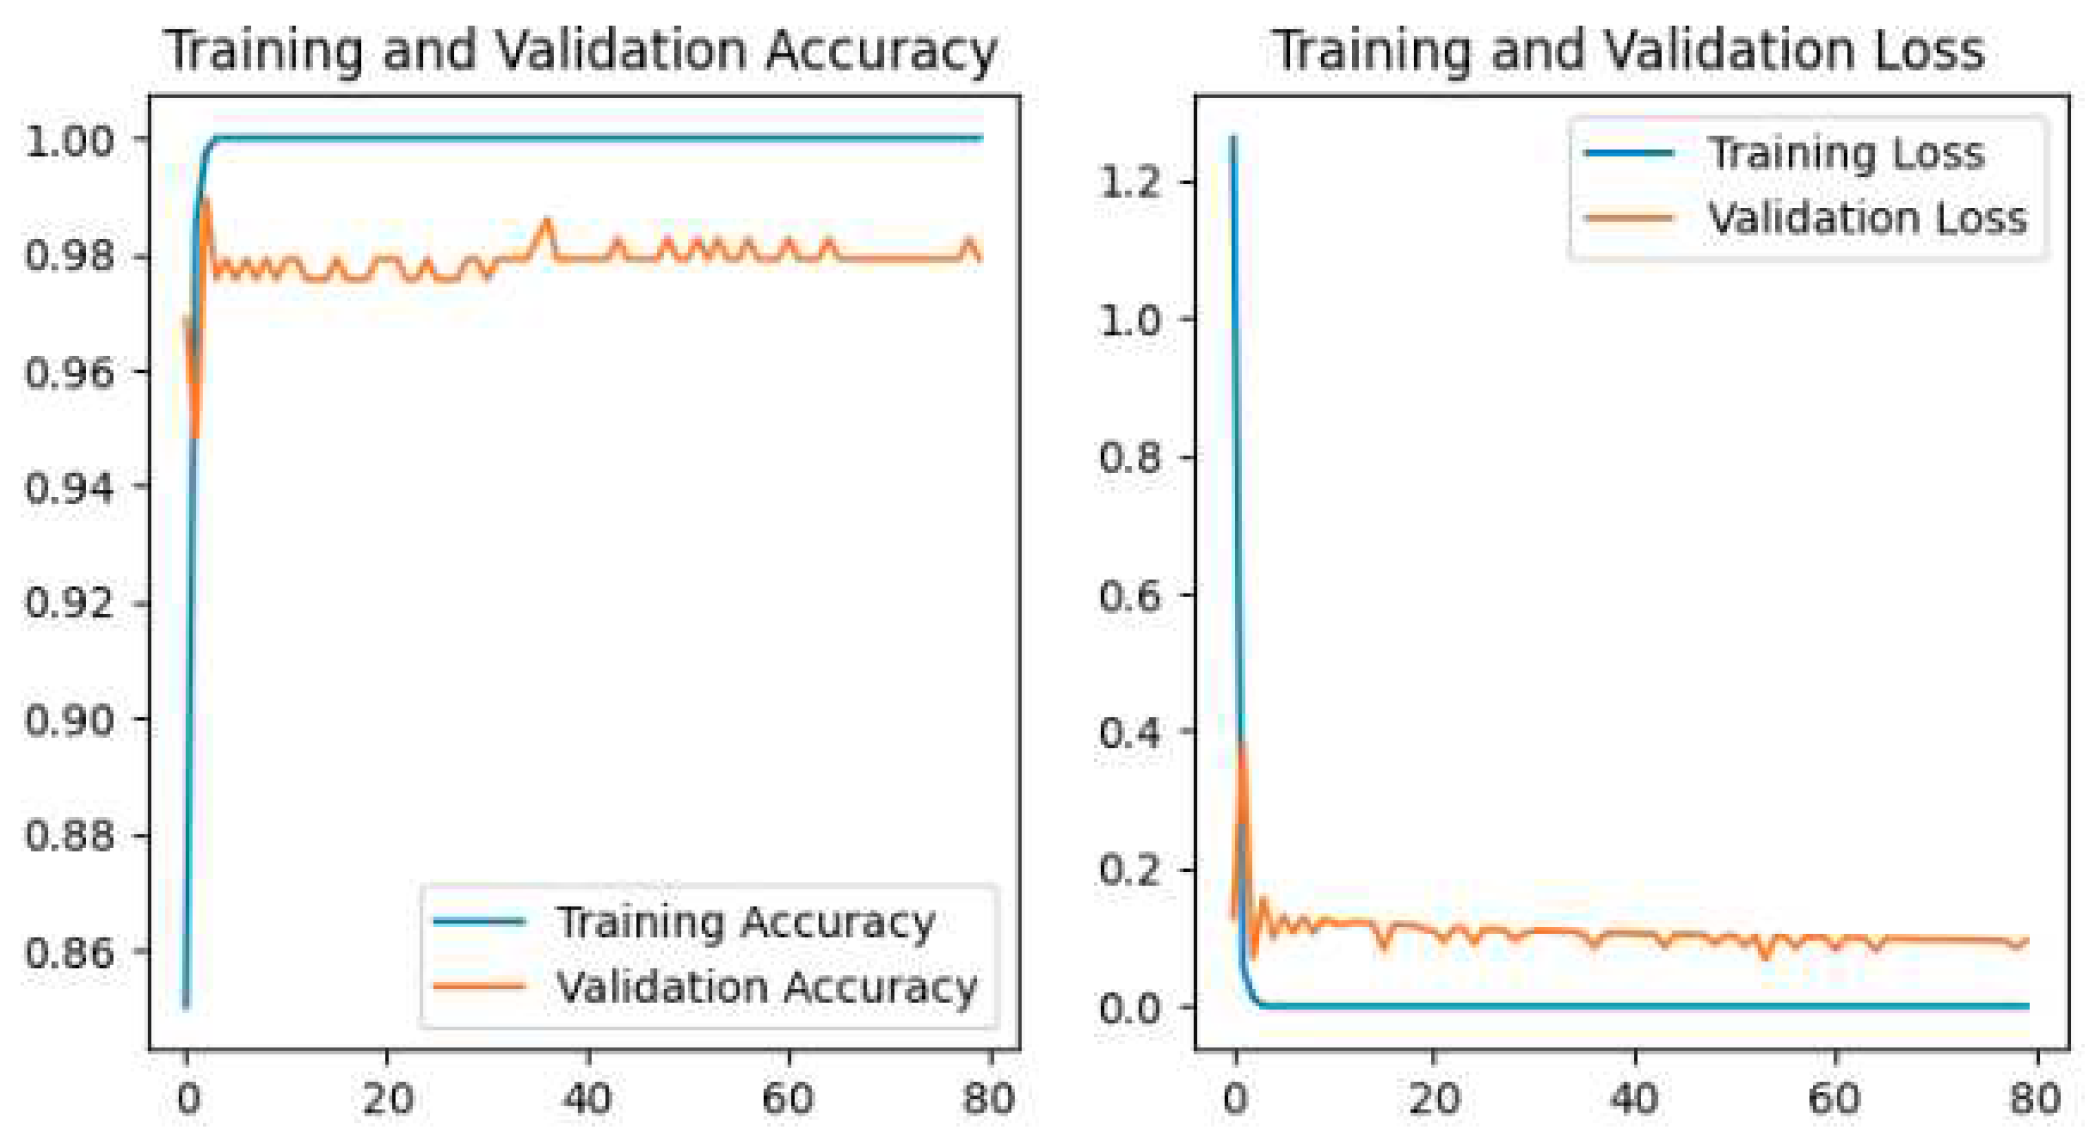
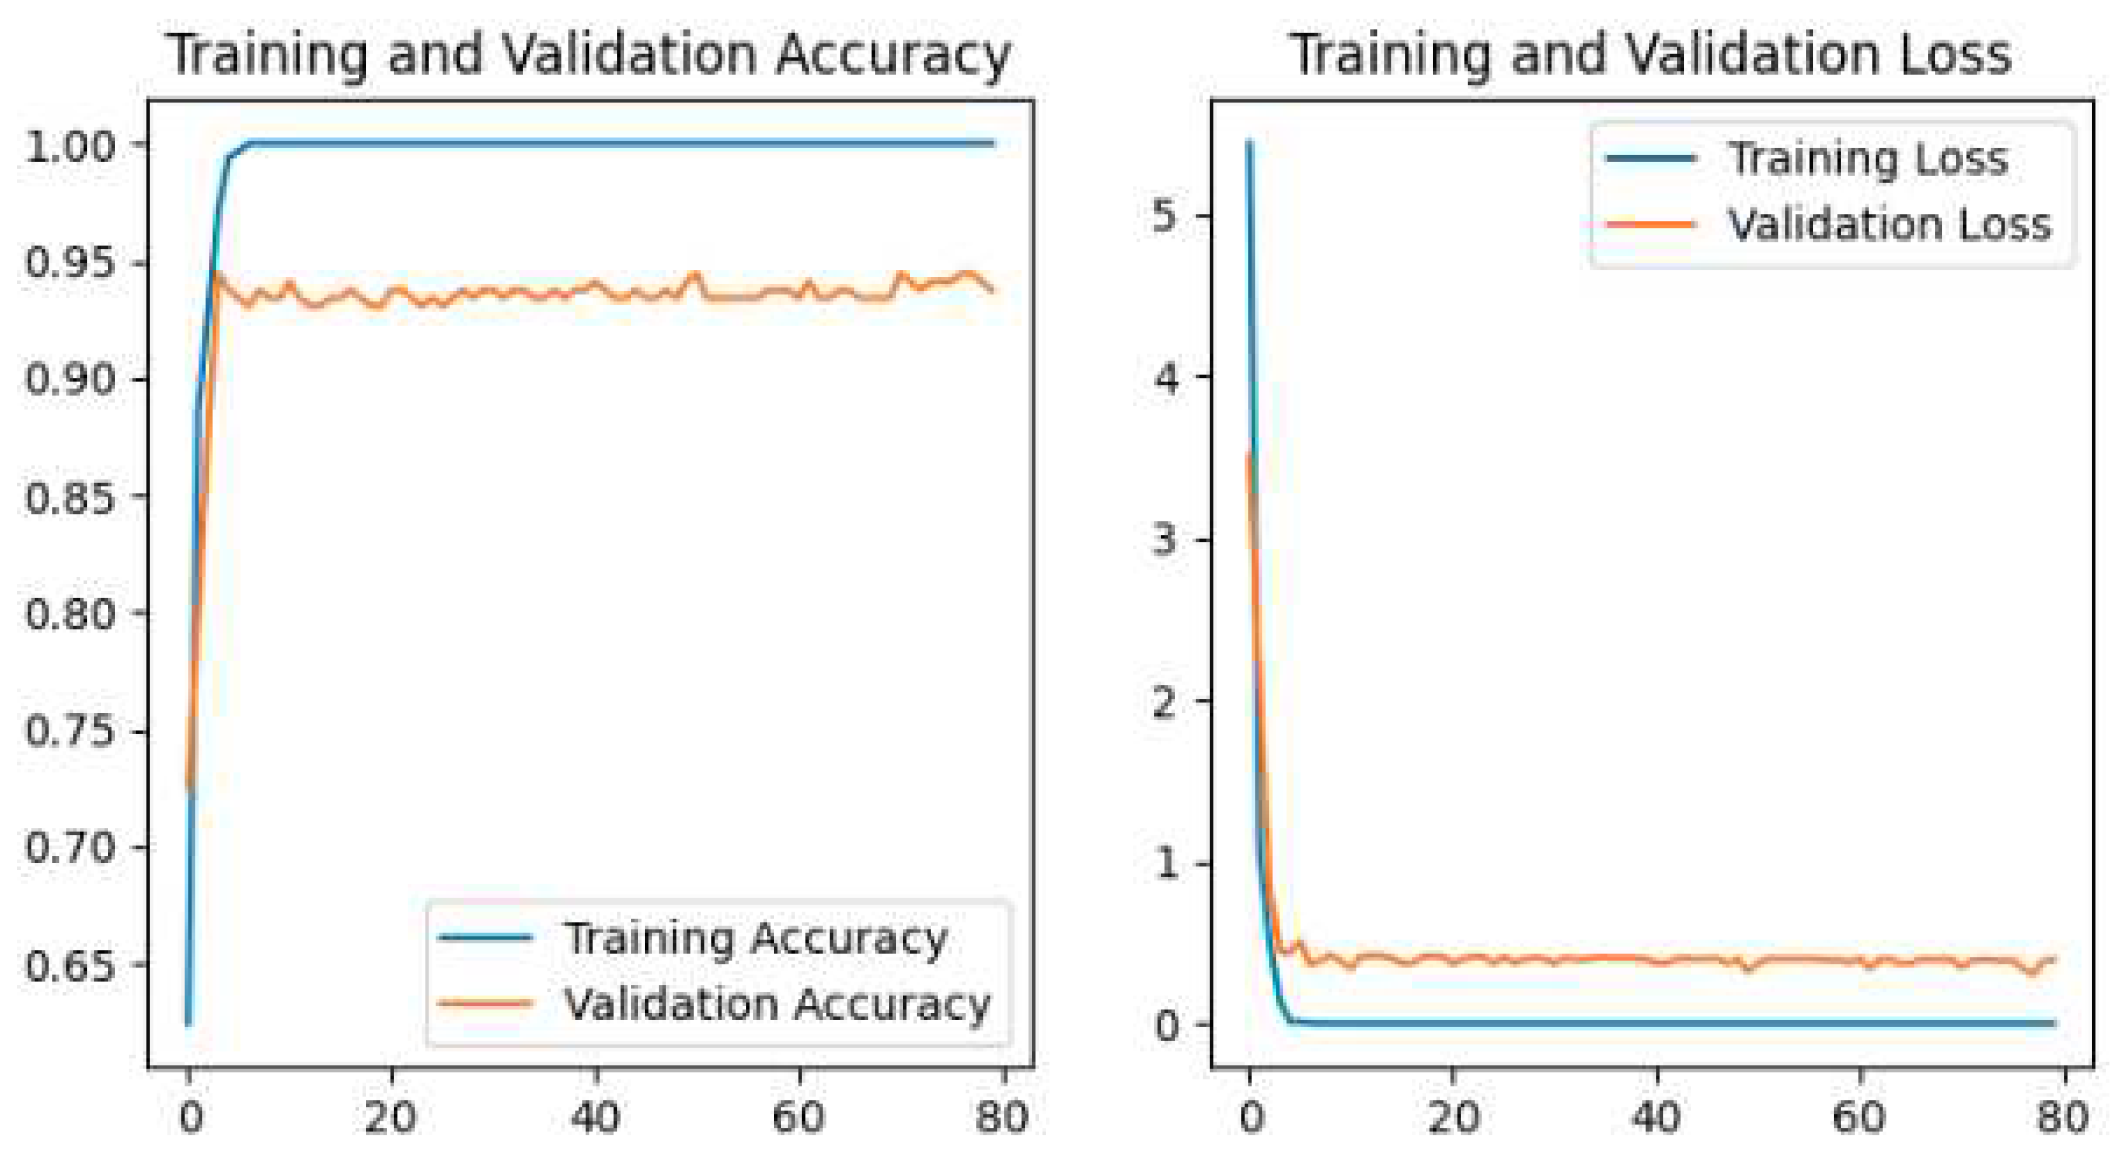
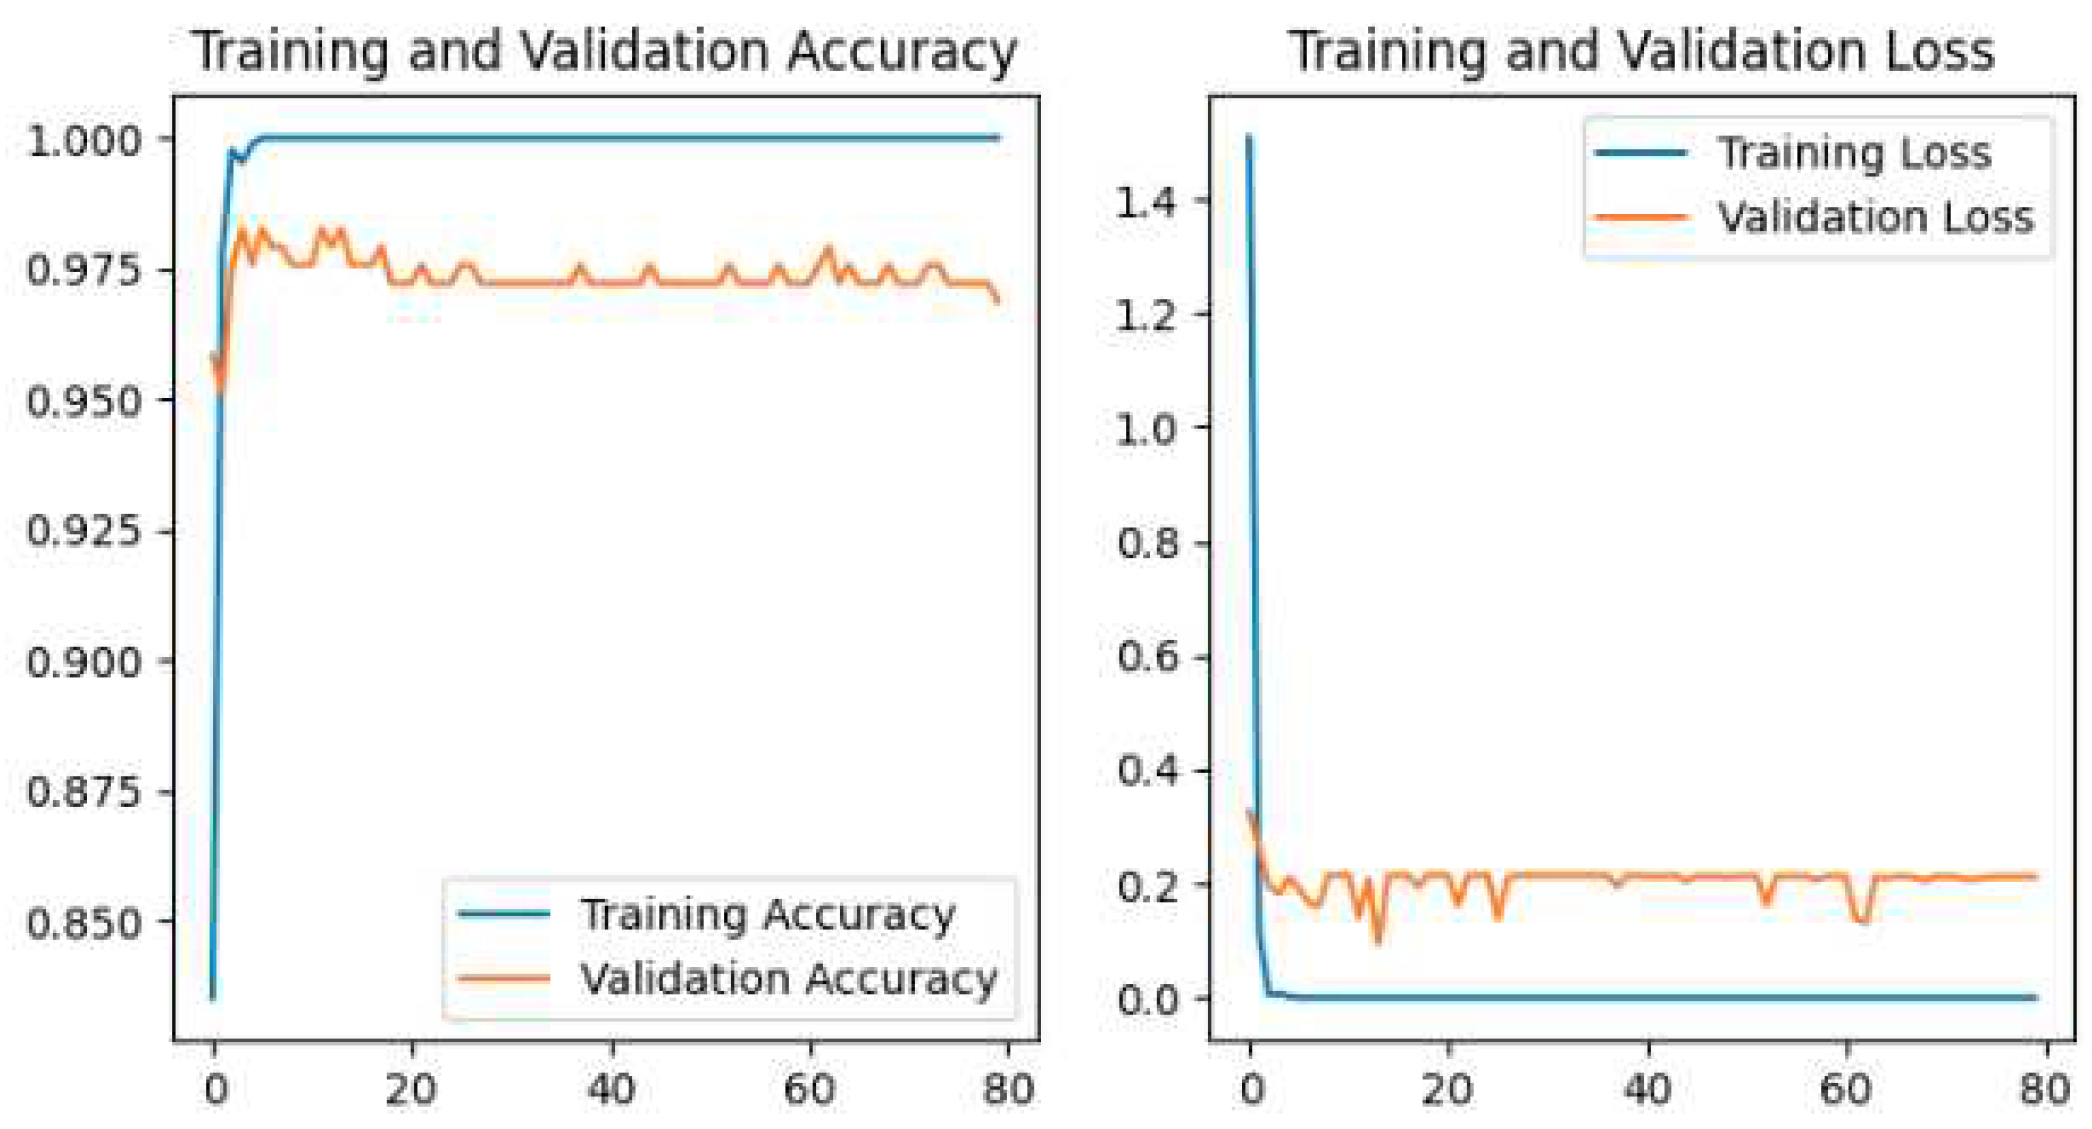
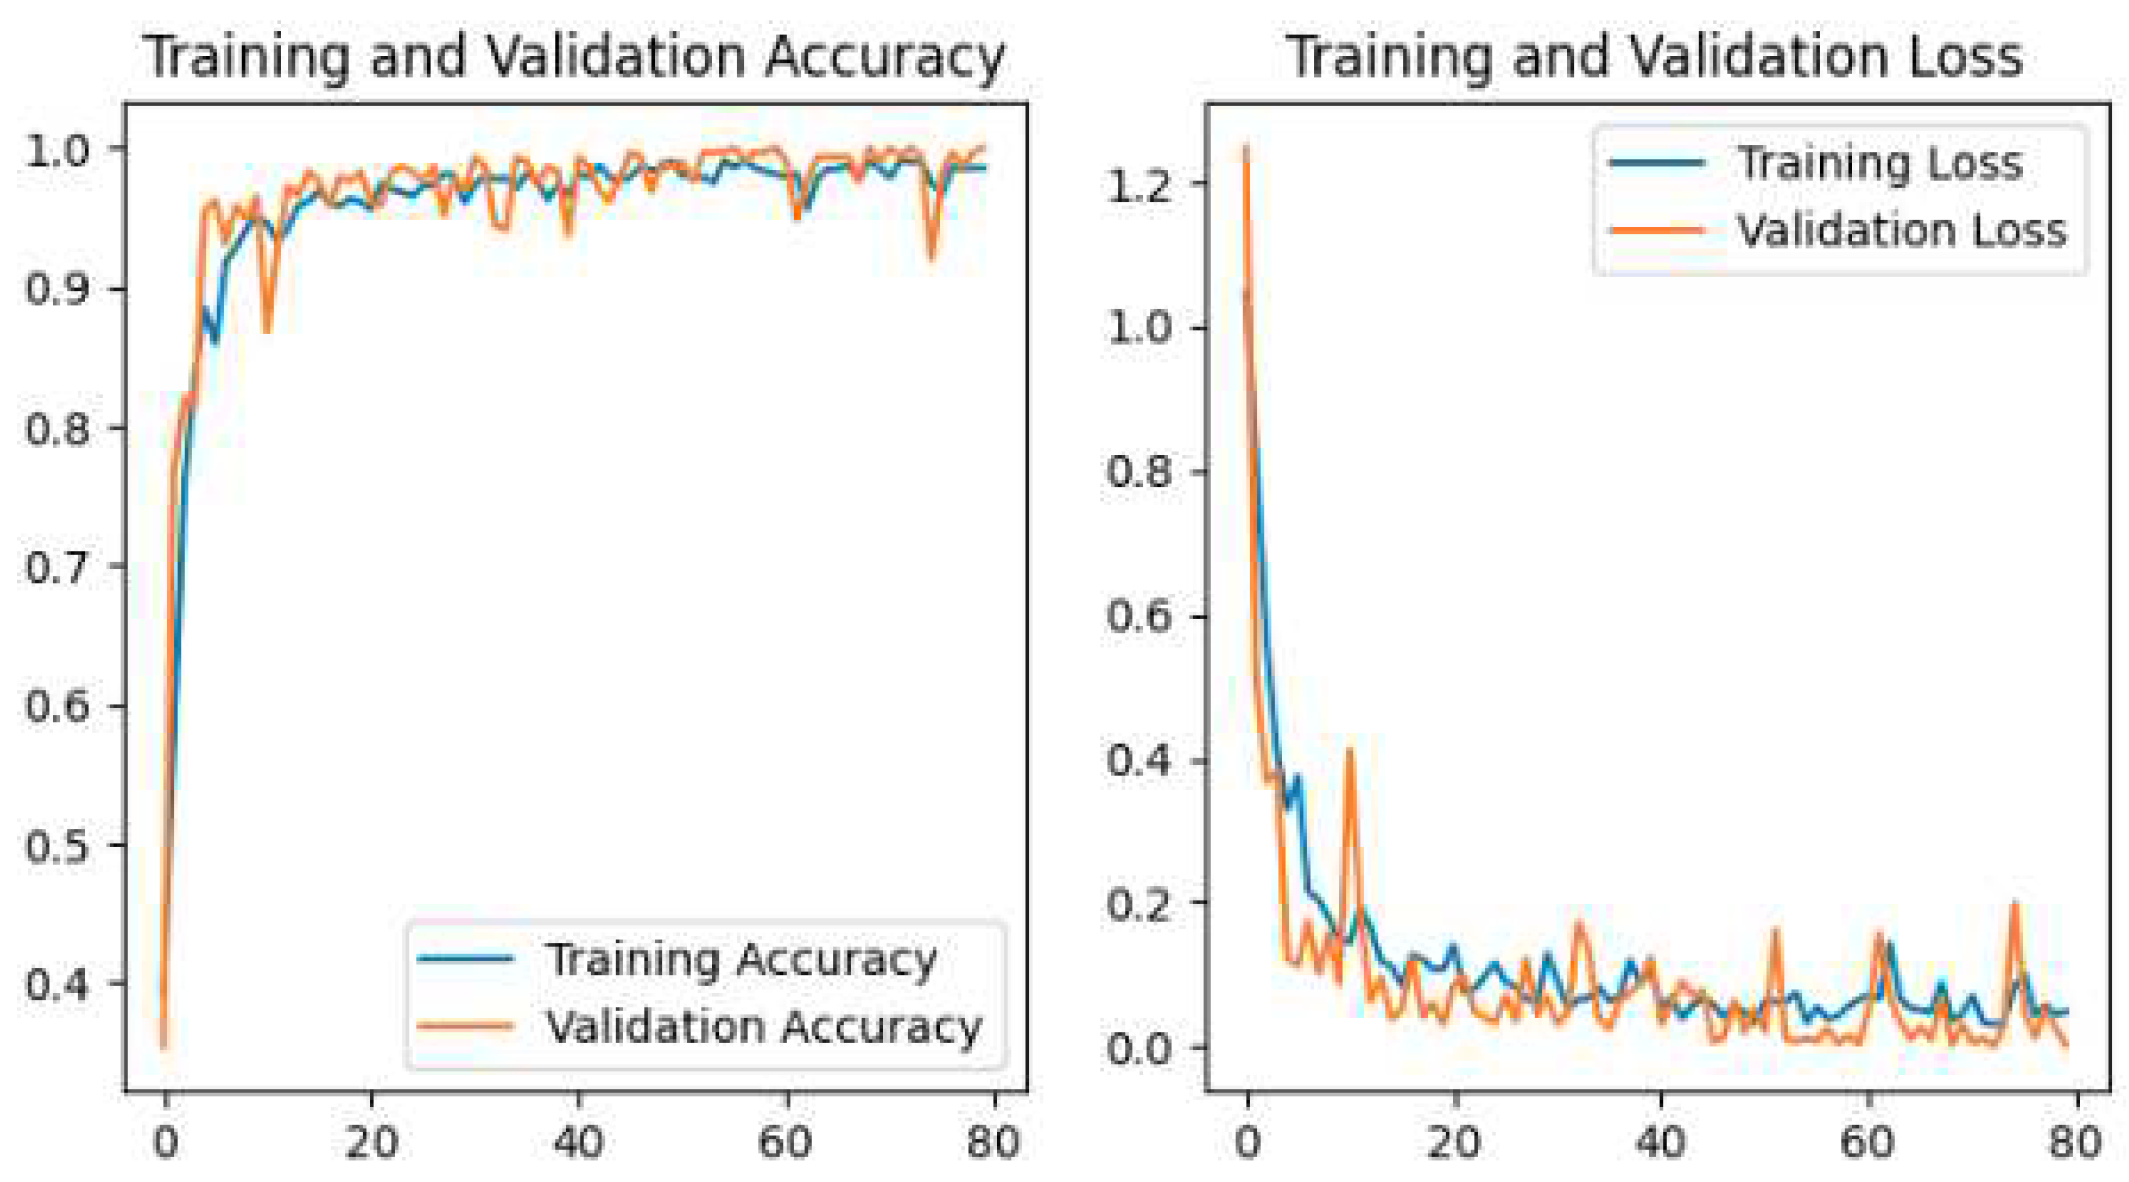
The training and validation accuracy and loss for all models are shown in our study. The plot of Accuracy and loss of VGG16 is shown in
Figure 10, ResNet50 is shown in
Figure 11, MobileNetV2 is shown in
Figure 12, InceptionV3 is shown in
Figure 13, Xception is shown in
Figure 14, and the Proposed CNN Model is shown in
Figure 15.
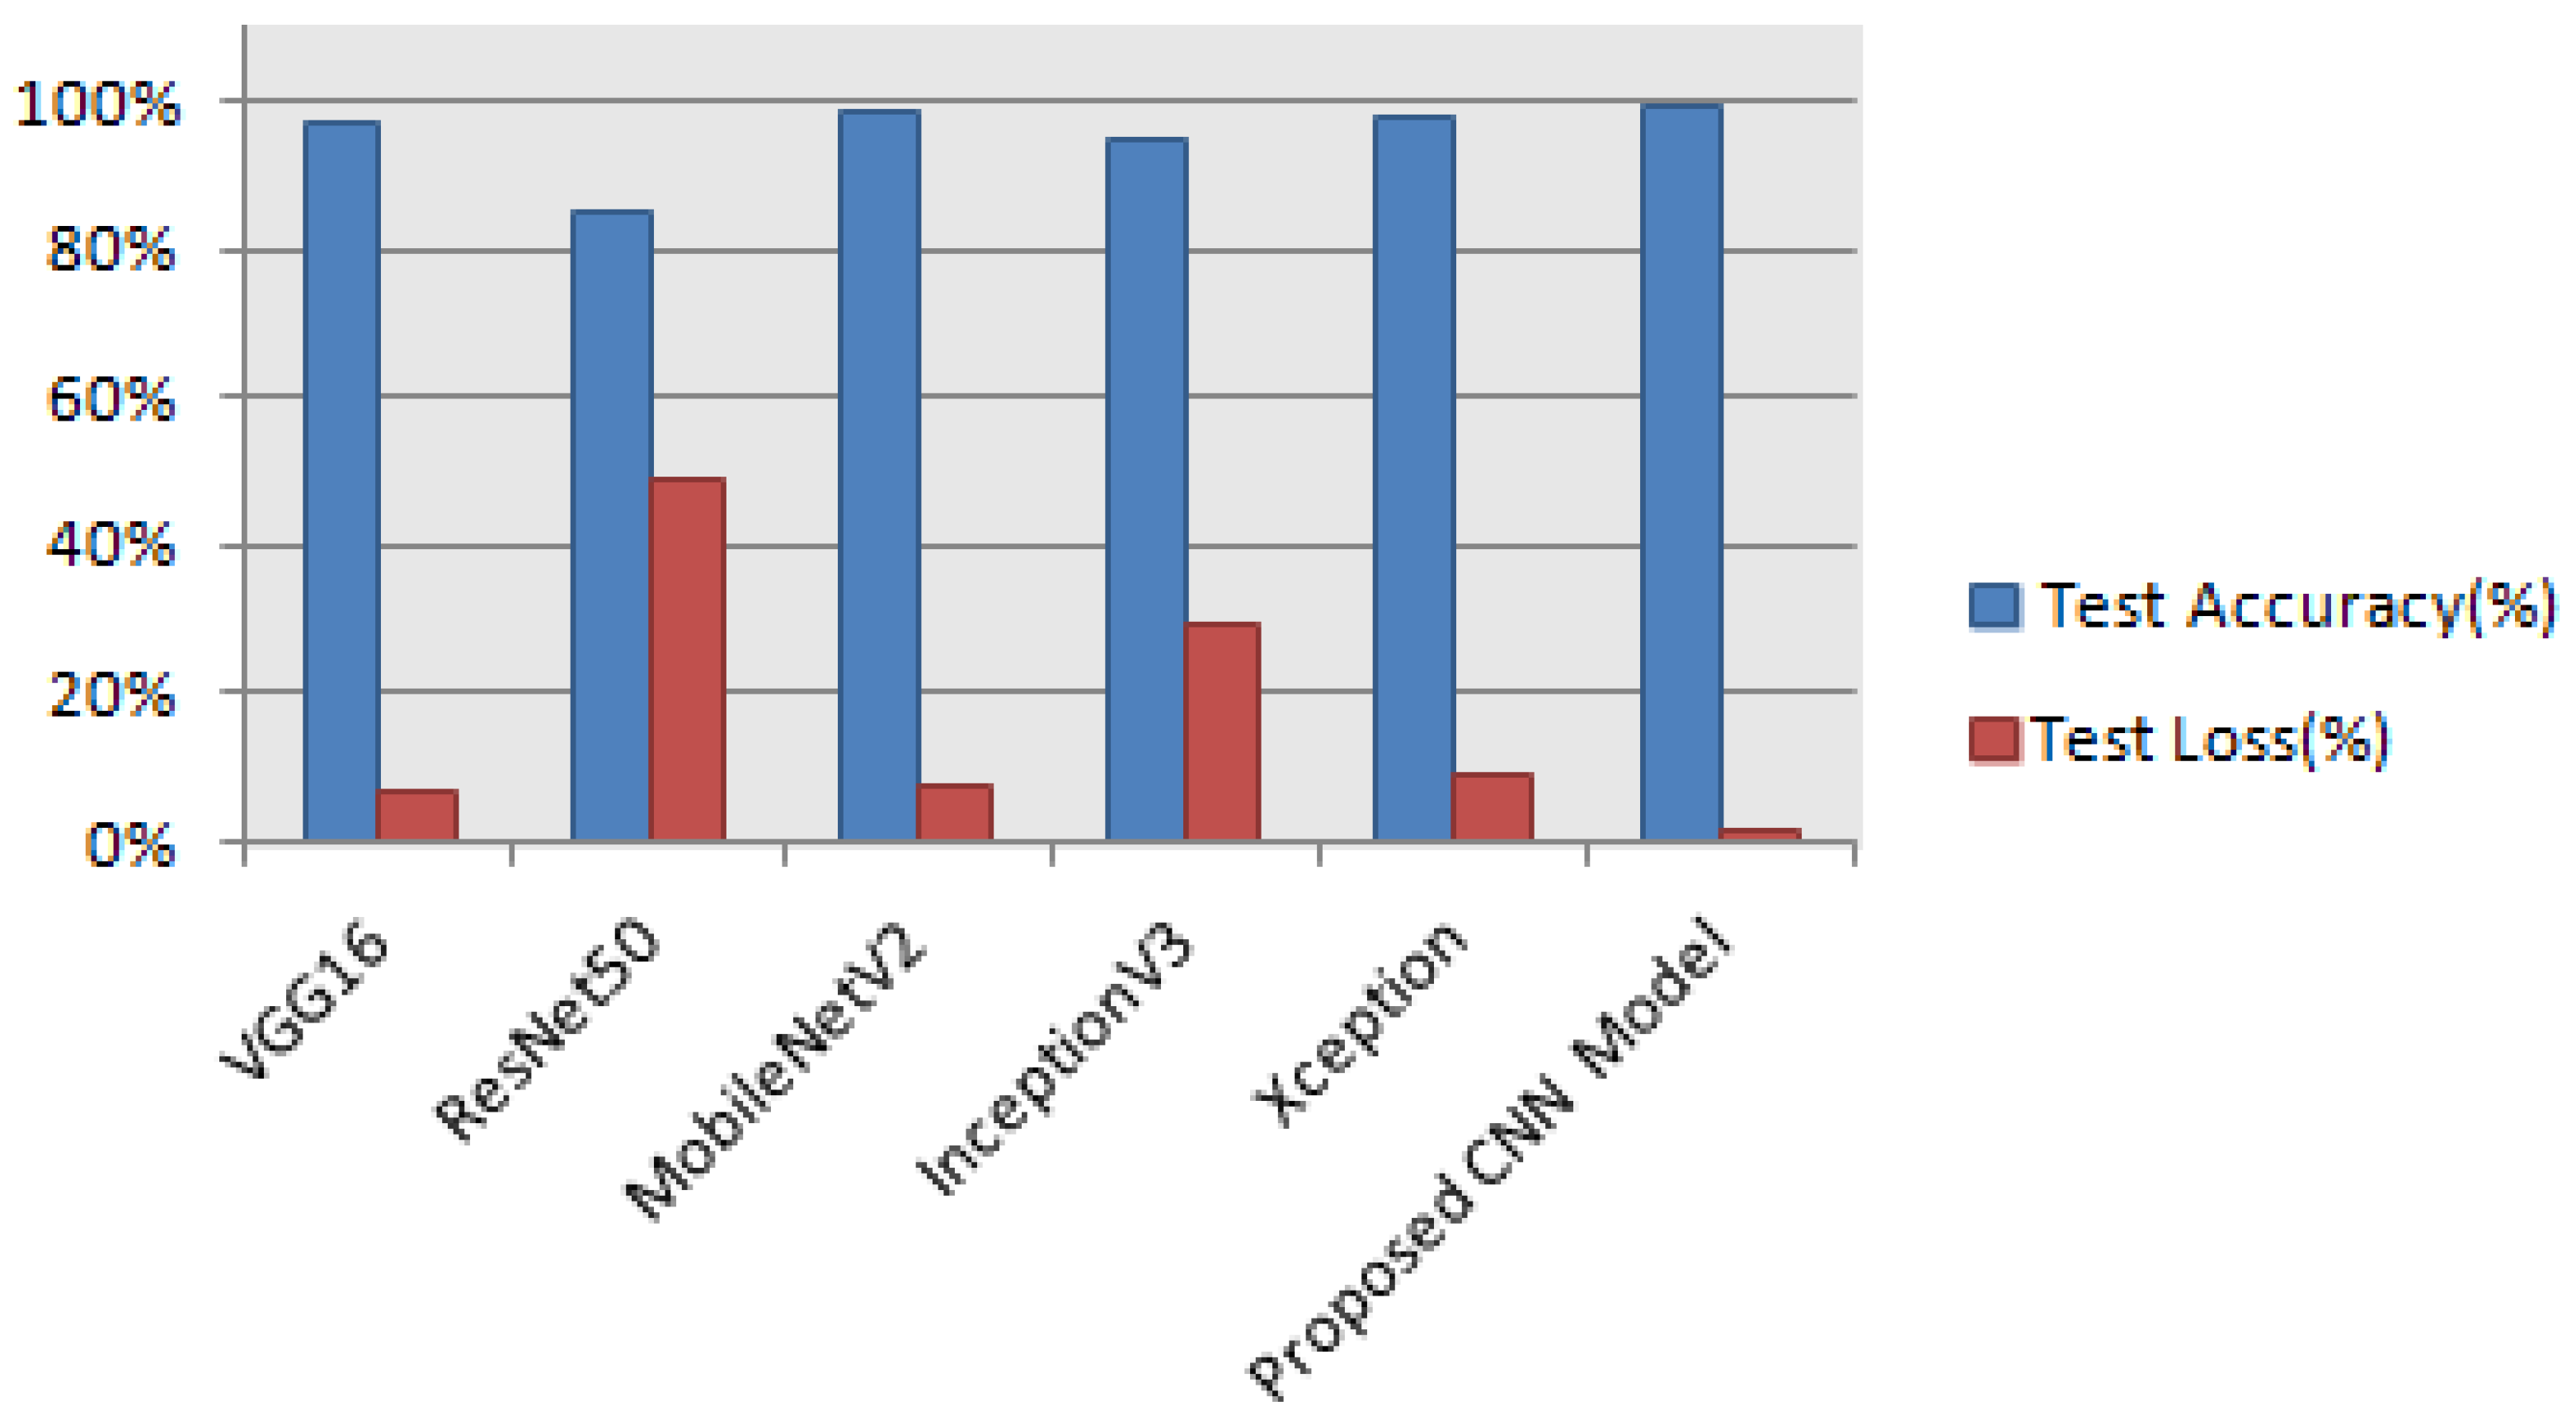
The Pretrained models perform the classification by using transfer learning. In the case of Pretrained models, all parameters are not trained because these models are trained with huge parameters on the ImageNet dataset. These huge parameters are not possible to train in a short time. The time complexity will be higher if we trained again all the parameters on our dataset. Transfer learning is the best technique for image classification in which all parameters are not needed to train. The proposed deep-learning CNN model with lower parameters used data augmentation techniques for the classification of potato leaf disease. The accuracy of potato leaf disease classification is compared in this study. The VGG16 with an accuracy of 97%, ResNet50 with an accuracy of 80% that shows the underfitting problem, InceptionV3 has an accuracy of 94.67%, MobileNetV2 has an accuracy of 98.67% with lower parameters than others, Xception has an accuracy of 96%, the Proposed CNN Model is with an accuracy of 99.33%. The accuracy, layer, and parameter are concluded in
Table 6.
The Pretained CNN models e.g. VGG16, ResNet50, MobileNetV2, InceptionV3, and Xception are applied to the same dataset for potato leaf disease detection using transfer learning. A customized model is developed using CNN for potato leaf disease classification. It is also applied to the same dataset using different augmentation techniques for potato leaf disease classification. The Proposed CNN Model achieves better accuracy than the pretrained CNN models in most cases. The amount of test loss is increased in the pretrained models but in the Proposed CNN model this amount is decreased which is 1.43%. It increases our Proposed CNN Model performance. The comparison of training accuracy and loss, the test accuracy and loss of the models is shown in
Table 7.
The training accuracy is highest in all pretrained models except ResNet50 but the testing accuracy is lower than our Proposed CNN Model. The highest test accuracy 99.33% and the lowest test loss 1.43% are achieved in our Proposed CNN model. The comparison of test accuracy and loss of all models are shown in
Figure 16.
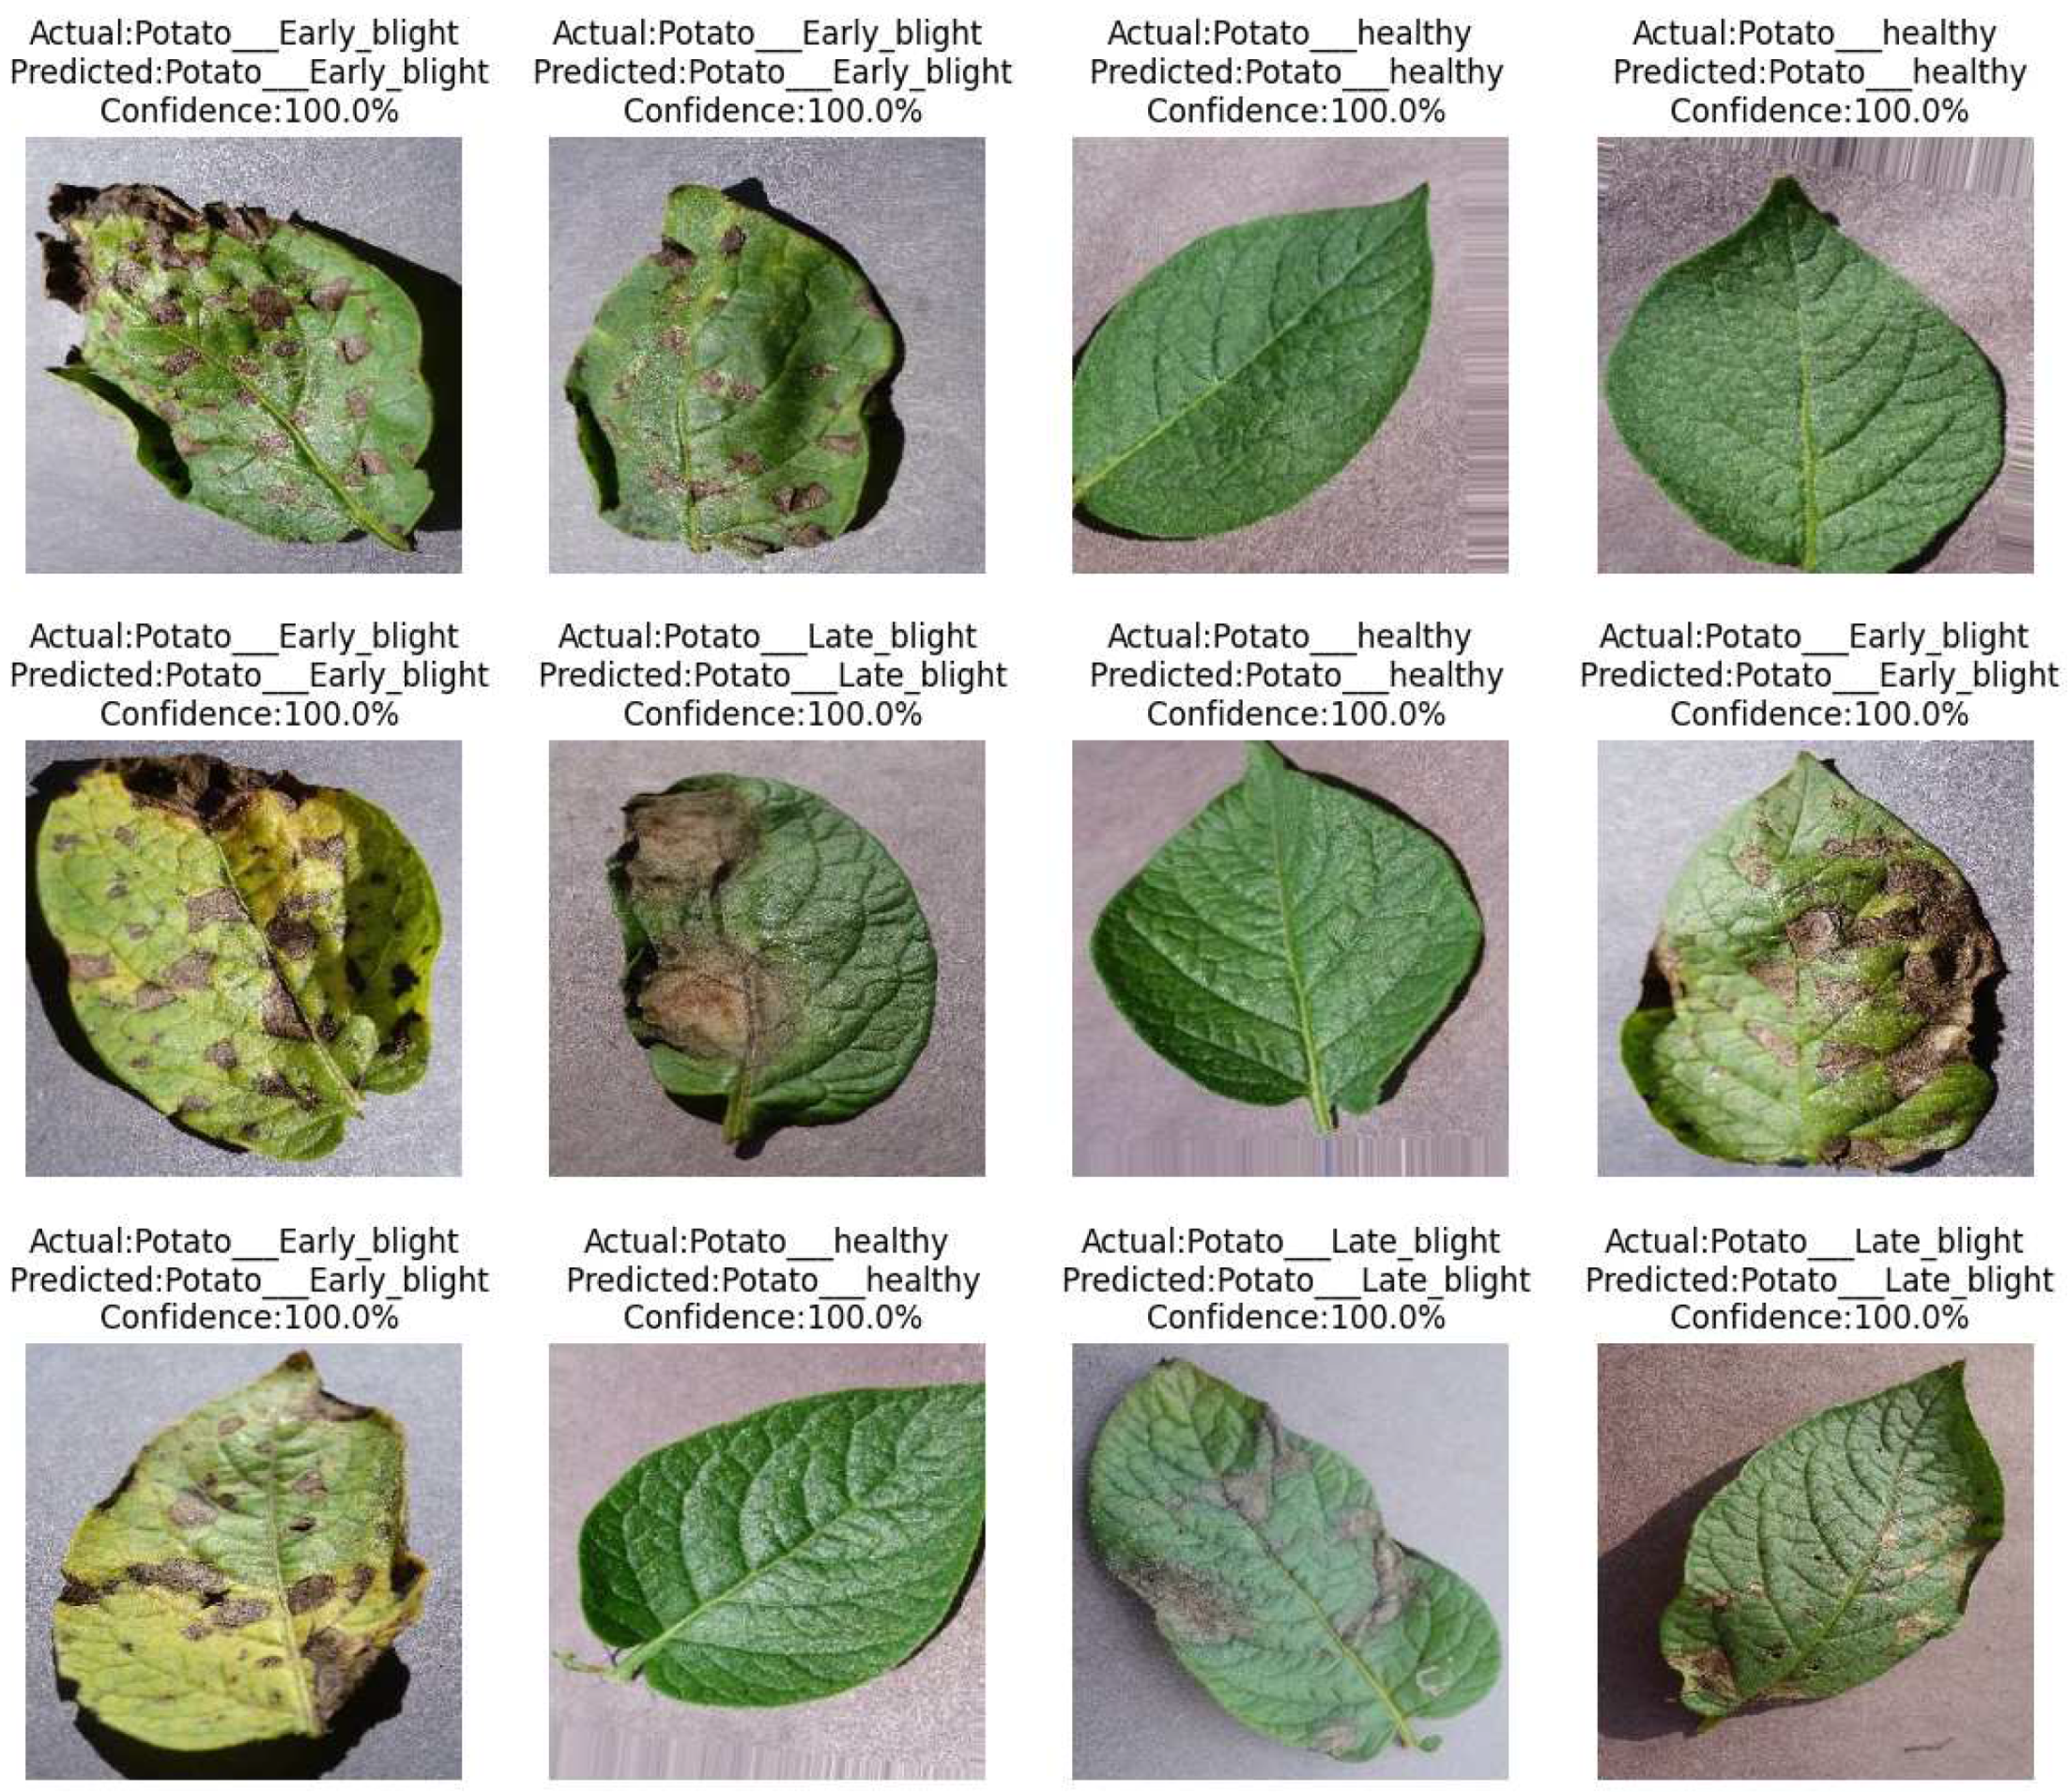
Our Proposed CNN Model achieved the best performance with the highest test accuracy of 99.33% and the lowest test loss compared to all other Pretrained models. It also issued an overfitting problem by using a dropout layer of 0.5 in Fully Connected layers and using a data augmentation technique. The MobileNetV2 gives the best result of 98.67% with fewer parameters compared to all other pertained CNN models. ResNet50 gives the lowest performance compared to other models on our dataset. The pretrained models are faced with overfitting and underfitting problems. Overfitting occurs when the training accuracy is high but the test accuracy is low and compared with training accuracy. Underfitting occurs when both the train and test accuracy is poor. Except for ResNet50, all Pretained models achieved the highest train accuracy but test accuracy is poor and test loss is high. The train accuracy is highest but their test accuracy is poor compared to their train accuracy. However, these problems are fairly recovered in our Proposed CNN Model with the best test accuracy and lowest test loss. Our Proposed CNN model gives the highest performance with an accuracy of 99.33% on the test dataset using by using data augmentation techniques with the lowest parameter and layer compared to other Pertained models. Since the highest test accuracy is achieved in our Proposed CNN Model, the potato leaf disease recognition is performed by using the Proposed CNN Model as shown in
Figure 17.
The main contribution is focused on our study :
The convolution process, max polling, and flattening process are shown by the mathematical calculation of real-time pixel data from our potato leaf dataset.
A deep learning model is proposed using CNN with fewer parameters and layers for the potato leaf disease classification.
Model robustness is increased by normalizing the pixel values with the range from 0 to 1 and augmenting the data (e.g., random flip, shift, zoom, increase brightness, rotate, shear)
The underfitting and overfitting problems are handled to increase the performance in our Proposed CNN Model.
Batch normalization, data augmentation, and dropout layers are used to improve convergence and reduce overfitting in our Proposed CNN Model.
Transfer learning is also used to detect potato leaf disease for the Pretrained models.
All the model is evaluated in terms of test accuracy and test loss.
The accuracy is compared among the Pretrained Models and the Proposed CNN Model.
The highest test accuracy 99.33% and the lowest test loss of 1.43% is achieved in the Proposed CNN Model compared to other Pretrained models by removing overfitting and underfitting problems.
The amount of test loss is significantly diminished in our Proposed CNN Model compared to others.
The potato leaf disease is recognized by the Proposed CNN Model and achieved good performance on our test dataset.
6. Conclusion
CNN is the best technique for potato disease classification compared with other machine learning algorithms e.g. SVM, RF, DT, KNN, LR, ANN, etc. Different pertained models are also developed by using CNN. These CNN models are currently the best algorithms we have for the automated processing of images. The performance of CNN can vary in different situations. The Performance depends on which powerful the GPU is used for the model classification and also depends on the dataset. The prominent development in disease classification accuracy is also notified using transfer learning in spite of having little data. Better accuracy is achieved in potato leaf disease detection by using transfer learning in the Pretrained models.VGG16 And MobileNetV2 provide a good result with fewer parameters than other Pretrained models. The Proposed CNN Model achieved the best performance with the highest test accuracy and lowest test loss using the data augmentation technique in potato leaf disease detection on the same dataset compared to the Pretrained models.
7. Future work
It is crucial and difficult to predict the presence of potato diseases from leaf images. We will put into practice a system that will determine if a leaf is healthy or unhealthy based on the results of our research. In order to get better and real-time output, we will therefore work with both software and hardware in the future. In the future, we want to work with other pertained models and want to develop a better model for better accuracy. We want to develop mobile applications so that uneducated farmers can identify diseases easily and take the proper steps to remove the diseases with proper treatment. The yielding of potatoes increased using our application for potato disease classification.
Author Contributions
The technical and theoretical framework, methodology, and original draft are prepared and written by S. Khatun. The conceptualization of this research is proposed by M. Halder and Y. Arafat. The technical support and guidance are provided by M.N.A. Sheikh and N. Adnan. The review and editing of the manuscript is done by Y. Arafat, M. Halder, M.N.A. Sheikh, N. Adnan, and S. Kabir. The supervision of this research is accomplished by Y. Arafat and M. Halder. The manuscript is reviewed and agreed upon by all authors.
Funding
There is no external funding in this research.
Data Availability Statement
Conflicts of Interest
The authors have no conflict of interest in this research.
Abbreviations
The following abbreviations are used in this manuscript:
| CNN |
Convolutional Neural Network |
| SVM |
Support Vector Machine |
| FFNN |
Feed Forward Neural Network |
| ReLU |
Rectified Linear Unit |
| KNN |
K-Nearest Neighbor |
| DT |
Decision Tree |
| LR |
Logistic Regression |
| RF |
Random Forest |
| ANN |
Artificial Neural Network |
| FC |
Fully Connected |
| GAP |
Global Average Pooling |
References
- Sanjeev, K.; Gupta, N.K.; Jeberson, W.; Paswan, S. Early prediction of potato leaf diseases using ANN classifier. Oriental Journal of Computer Science and Technology 2021, 13, 129–134. [Google Scholar] [CrossRef]
- Moharekar, T.T.; Pol, U.R.; Ombase, R.; Moharekar, T. ; others. DETECTION AND CLASSIFICATION OF PLANT LEAF DISEASES USING CONVOLUTION NEURAL NETWORKS AND STREAMLIT.
- Mahum, R.; Munir, H.; Mughal, Z.U.N.; Awais, M.; Sher Khan, F.; Saqlain, M.; Mahamad, S.; Tlili, I. A novel framework for potato leaf disease detection using an efficient deep learning model. Human and Ecological Risk Assessment: An International Journal 2023, 29, 303–326. [Google Scholar] [CrossRef]
- Al-Adhaileh, M.H.; Verma, A.; Aldhyani, T.H.; Koundal, D. Potato Blight Detection Using Fine-Tuned CNN Architecture. Mathematics 2023, 11, 1516. [Google Scholar] [CrossRef]
- Nazir, T.; Iqbal, M.M.; Jabbar, S.; Hussain, A.; Albathan, M. EfficientPNet—An Optimized and Efficient Deep Learning Approach for Classifying Disease of Potato Plant Leaves. Agriculture 2023, 13, 841. [Google Scholar] [CrossRef]
- Kothari, D.; Mishra, H.; Gharat, M.; Pandey, V.; Thakur, R. Potato Leaf Disease Detection using Deep Learning.
- Amaje, G.G. SWEET POTATO LEAF DISEASE DETECTION AND CLASSIFICATION USING CONVOLUTIONAL NEURAL NETWORK. PhD thesis, 2022.
- Bangari, S.; Rachana, P.; Gupta, N.; Sudi, P.S.; Baniya, K.K. A survey on disease detection of a potato leaf using cnn. 2022 Second International Conference on Artificial Intelligence and Smart Energy (ICAIS). IEEE, 2022, pp. 144–149.
- Singh, S.; Agrawal, V. Corrigendum: Development of ecosystem for effective supply chains in 3D printing industry–an ISM approach (2021 IOP Conf. Ser.: Mater Sci Eng. 1136 012049). IOP Conference Series: Materials Science and Engineering. IOP Publishing, 2021, Vol. 1136, p. 012078.
- Tilahun, N.; Gizachew, B. Artificial Intelligence Assisted Early Blight and Late Blight Potato Disease Detection Using Convolutional Neural Networks. Ethiopian Journal of Crop Science 2020, 8. [Google Scholar]
- Gardie, B.; Asemie, S.; Azezew, K.; Solomon, Z. Potato Plant Leaf Diseases Identification Using Transfer Learning. Indian Journal of Science and Technology 2022, 15, 158–165. [Google Scholar] [CrossRef]
- Iqbal, M.A.; Talukder, K.H. Detection of potato disease using image segmentation and machine learning. 2020 international conference on wireless communications signal processing and networking (WiSPNET). IEEE, 2020, pp. 43–47.
- Rozaqi, A.J.; Sunyoto, A. Identification of disease in potato leaves using Convolutional Neural Network (CNN) algorithm. 2020 3rd International Conference on Information and Communications Technology (ICOIACT). IEEE, 2020, pp. 72–76.
- Asif, M.K.R.; Rahman, M.A.; Hena, M.H. CNN based disease detection approach on potato leaves. 2020 3rd International Conference on Intelligent Sustainable Systems (ICISS). IEEE, 2020, pp. 428–432.
- Sholihati, R.A.; Sulistijono, I.A.; Risnumawan, A.; Kusumawati, E. Potato leaf disease classification using deep learning approach. 2020 international electronics symposium (IES). IEEE, 2020, pp. 392–397.
- Hou, C.; Zhuang, J.; Tang, Y.; He, Y.; Miao, A.; Huang, H.; Luo, S. Recognition of early blight and late blight diseases on potato leaves based on graph cut segmentation. Journal of Agriculture and Food Research 2021, 5, 100154. [Google Scholar] [CrossRef]
- Hasan, M.N.; Mustavi, M.; Jubaer, M.A.; Shahriar, M.T.; Ahmed, T. Plant Leaf Disease Detection Using Image Processing: A Comprehensive Review. Malaysian Journal of Science and Advanced Technology 2022, 174–182. [Google Scholar] [CrossRef]
- Feng, J.; Hou, B.; Yu, C.; Yang, H.; Wang, C.; Shi, X.; Hu, Y. Research and Validation of Potato Late Blight Detection Method Based on Deep Learning. Agronomy 2023, 13, 1659. [Google Scholar] [CrossRef]
- Kang, F.; Li, J.; Wang, C.; Wang, F. A Lightweight Neural Network-Based Method for Identifying Early-Blight and Late-Blight Leaves of Potato. Applied Sciences 2023, 13, 1487. [Google Scholar] [CrossRef]
- Rashid, J.; Khan, I.; Ali, G.; Almotiri, S.H.; AlGhamdi, M.A.; Masood, K. Multi-level deep learning model for potato leaf disease recognition. Electronics 2021, 10, 2064. [Google Scholar] [CrossRef]
- Enkvetchakul, P.; Surinta, O. Effective data augmentation and training techniques for improving deep learning in plant leaf disease recognition. Applied Science and Engineering Progress 2022, 15, 3810–3810. [Google Scholar] [CrossRef]
- Cengıl, E.; Çinar, A. Multiple classification of flower images using transfer learning. 2019 International Artificial Intelligence and Data Processing Symposium (IDAP). IEEE, 2019, pp. 1–6.
- Liu, B.; Zhang, Y.; He, D.; Li, Y. Identification of apple leaf diseases based on deep convolutional neural networks. Symmetry 2017, 10, 11. [Google Scholar] [CrossRef]
- Arora, J.; Agrawal, U.; others. Classification of Maize leaf diseases from healthy leaves using Deep Forest. Journal of Artificial Intelligence and Systems 2020, 2, 14–26. [Google Scholar] [CrossRef]
- Zhang, X.; Qiao, Y.; Meng, F.; Fan, C.; Zhang, M. Identification of maize leaf diseases using improved deep convolutional neural networks. Ieee Access 2018, 6, 30370–30377. [Google Scholar] [CrossRef]
- Howlader, M.R.; Habiba, U.; Faisal, R.H.; Rahman, M.M. Automatic recognition of guava leaf diseases using deep convolution neural network. 2019 international conference on electrical, computer and communication engineering (ECCE). IEEE, 2019, pp. 1–5.
- Rangarajan Aravind, K.; Raja, P. Automated disease classification in (Selected) agricultural crops using transfer learning. Automatika: časopis za automatiku, mjerenje, elektroniku, računarstvo i komunikacije 2020, 61, 260–272. [Google Scholar] [CrossRef]
- Hassan, S.M.; Maji, A.K.; Jasiński, M.; Leonowicz, Z.; Jasińska, E. Identification of plant-leaf diseases using CNN and transfer-learning approach. Electronics 2021, 10, 1388. [Google Scholar] [CrossRef]
- Shrivastava, V.K.; Pradhan, M.K.; Minz, S.; Thakur, M.P. Rice plant disease classification using transfer learning of deep convolution neural network. The International Archives of the Photogrammetry, Remote Sensing and Spatial Information Sciences 2019, 42, 631–635. [Google Scholar] [CrossRef]
- Eunice, J.; Popescu, D.E.; Chowdary, M.K.; Hemanth, J. Deep learning-based leaf disease detection in crops using images for agricultural applications. Agronomy 2022, 12, 2395. [Google Scholar]
Figure 1.
Flow diagram of all processes for potato leaf disease detection.
Figure 1.
Flow diagram of all processes for potato leaf disease detection.
Figure 2.
Potato leaf image samples e.g Healthy, Early Blight, Late blight.
Figure 2.
Potato leaf image samples e.g Healthy, Early Blight, Late blight.
Figure 3.
Potato leaf image samples after augmentation.
Figure 3.
Potato leaf image samples after augmentation.
Figure 4.
CNN Working Process.
Figure 4.
CNN Working Process.
Figure 5.
Array pixels from potato leaf .
Figure 5.
Array pixels from potato leaf .
Figure 6.
Convolution Process.
Figure 6.
Convolution Process.
Figure 7.
Applying MaxPolling 2*2 in Polling Process.
Figure 7.
Applying MaxPolling 2*2 in Polling Process.
Figure 8.
Flattening Process in Fully Connected Layer.
Figure 8.
Flattening Process in Fully Connected Layer.
Figure 9.
The Proposed CNN Model architecture.
Figure 9.
The Proposed CNN Model architecture.
Figure 10.
The Plot of Accuracy and Loss using VGG16.
Figure 10.
The Plot of Accuracy and Loss using VGG16.
Figure 11.
The Plot of Accuracy and Loss using ResNet50.
Figure 11.
The Plot of Accuracy and Loss using ResNet50.
Figure 12.
The Plot of Accuracy and Loss using MobileNetV2.
Figure 12.
The Plot of Accuracy and Loss using MobileNetV2.
Figure 13.
The Plot of Accuracy and Loss using InceptionV3.
Figure 13.
The Plot of Accuracy and Loss using InceptionV3.
Figure 14.
The Plot of Accuracy and Loss using Xception.
Figure 14.
The Plot of Accuracy and Loss using Xception.
Figure 15.
The Plot of Accuracy and Loss using Proposed CNN Model.
Figure 15.
The Plot of Accuracy and Loss using Proposed CNN Model.
Figure 16.
Comparison of Test Accuracy and Test Los of the Model.
Figure 16.
Comparison of Test Accuracy and Test Los of the Model.
Figure 17.
Recognition of potato diseases from the leaf using Proposed CNN Model.
Figure 17.
Recognition of potato diseases from the leaf using Proposed CNN Model.
Table 1.
Summary of related work for potato leaf disease detection .
Table 1.
Summary of related work for potato leaf disease detection .
| Journal Number |
Data Source |
Model |
Accuracy |
| [1] |
PlantVillage |
FFNN, Feature extraction
(Color, texture, shape) |
96.5% |
| [2] |
PlantVillage |
CNN, Deployment by Streamlit |
94.6% |
| [3] |
PlantVillage, and
captured by Camera |
DenseNet-201 |
97.2% |
| [4] |
PlantVillage |
CNN Model, Transfer learning |
99% |
| [5] |
PlantVillage |
EfficientPNet |
98.12% |
| [6] |
PlantVillage |
CNN Model |
97% |
| [7] |
PlantVillage |
CNN Model named
Sequential Model |
91.41% |
| [8] |
Captured by using
Camera |
Image enhancement (CLAHE,
Gaussian blur), Classification by CNN |
98.54% |
| [9] |
PlantVillage |
Classification by SVM, Feature extraction
(Gray Level Co-occurrence Matrix) |
95.99% |
| [10] |
PlantVillage |
MobileNet, EfficientNet |
98% |
| [11] |
PlantVillage |
Transfer learning, InceptionV3 |
98.7% |
| [12] |
PlantVillage, and
Database(450 images) |
KNN, Decision Tree, Naive Bayes,
Random Forest(RF), SVM |
RF-97% |
| [14] |
Kaggle, Dataquest,
and some manual images |
Customized CNN named
Sequential Model, Data Augmentation |
97% |
| [15] |
Potato plantation in Malang,
Indonesia, and Google images |
VGG16, VGG19 |
91% |
Table 2.
Number of leaf samples in training, validation, and testing set.
Table 2.
Number of leaf samples in training, validation, and testing set.
| Label |
Category of Leaf |
Number |
Training Sample |
Validation Sample |
Test Sample |
| 1 |
Healthy |
500 |
300 |
100 |
100 |
| 2 |
Early light |
500 |
300 |
100 |
100 |
| 3 |
Late Blight |
500 |
300 |
100 |
100 |
| Total |
|
1500 |
900 |
300 |
300 |
Table 3.
Number of leaf samples in training, validation, and testing set after augmentation.
Table 3.
Number of leaf samples in training, validation, and testing set after augmentation.
| Label |
Category of Leaf |
Number |
Training Sample |
Validation Sample |
Test Sample |
| 1 |
Healthy |
900 |
700 |
100 |
100 |
| 2 |
Early light |
1200 |
1000 |
100 |
100 |
| 3 |
Late Blight |
1200 |
1000 |
100 |
100 |
| Total |
|
3300 |
2700 |
300 |
300 |
Table 4.
Summary of the Model used in Potato Leaf Disease Detection
Table 4.
Summary of the Model used in Potato Leaf Disease Detection
| Model |
Parameter |
Layer |
Input Size |
Filter Size |
Polling |
Activation
Function |
Number of
Convolution
layer |
Number of
MaxPool
layer |
Number of
FC layer |
| VGG16 |
138.4M |
16 |
224*224 |
3*3 |
2*2 MaxPool |
ReLU |
13 |
5 |
3 |
| MobileNetV2 |
3.5M |
53 |
224*224 |
3*3, 1*1 |
GAP |
ReLU |
43 |
- |
- |
| ResNet50 |
25.6M |
50 |
224*224 |
3*3 |
3*3 Maxpool |
ReLU |
49 |
5 |
1 |
| InceptionV3 |
23.62 M |
48 |
299*299 |
3*3, 5*5,1*1 |
3*3 MaxPool |
ReLU |
47 |
4 |
2 |
| Xception |
22.85M |
71 |
299*299 |
3*3 |
GAP |
ReLU |
36 |
- |
- |
| Proposed CNN Model |
233K |
10 |
256*256 |
3*3 |
2*2 MaxPool |
ReLU |
7 |
7 |
3 |
Table 5.
The hyperparameter used to detect potato leaf disease.
Table 5.
The hyperparameter used to detect potato leaf disease.
| Batch Size |
32 |
| Epochs |
80 |
| Loss Function |
Categorical Cross Entropy |
| Optimizer for Model Training |
Adam |
| Dropout |
0.5 |
| Classifier in Output Layer |
Softmax |
Table 6.
Comparison among different model respect of Accuracy and Parameter.
Table 6.
Comparison among different model respect of Accuracy and Parameter.
| Model |
Accuracy |
Layer |
Parameter |
| Total Parameter |
Trainable Parameter |
Non-trainable Parameter |
| VGG16 |
97.00% |
16 |
14,789,955 |
75,267 |
14,714,688 |
| ResNet50 |
85.00% |
50 |
23,888,771 |
301,059 |
23,587,712 |
| MobileNetV2 |
98.67% |
53 |
2,503,747 |
245,763 |
2,257,984 |
| InceptionV3 |
94.67%, |
48 |
21,956,387 |
153,603 |
21,802,784 |
| Xception |
98.00% |
71 |
21,475,883 |
614,403 |
20,861,480 |
| Proposed CNN Model |
99.33% |
10 |
233,187 |
233,187 |
0 |
Table 7.
Training Accuracy and Loss, Test Accuracy and Loss Comparison.
Table 7.
Training Accuracy and Loss, Test Accuracy and Loss Comparison.
| Model |
Technique |
Training
Accuracy(%) |
Training
Loss(%) |
Test
Accuracy(%) |
Test
Loss(%) |
Model Fit |
| Transfer Learning |
Data Augmentation |
| VGG16 |
Yes |
No |
100.00 |
0.03087 |
97.00 |
6.85 |
Overfit |
| ResNet50 |
Yes |
No |
97.00 |
9.39516 |
85.00 |
48.82 |
Under fit |
| MobileNetV2 |
Yes |
No |
100.00 |
0.00006 |
98.67 |
7.44 |
Overfit |
| InceptionV3 |
Yes |
No |
100.00 |
0.00155 |
94.67 |
29.26 |
Overfit |
| Xception |
Yes |
No |
100.00 |
0.00018 |
98.00 |
9.12 |
Overfit |
| Proposed CNN Model |
No |
Yes |
98.71 |
3.35295 |
99.33 |
1.43 |
Good fit |
|
Disclaimer/Publisher’s Note: The statements, opinions and data contained in all publications are solely those of the individual author(s) and contributor(s) and not of MDPI and/or the editor(s). MDPI and/or the editor(s) disclaim responsibility for any injury to people or property resulting from any ideas, methods, instructions or products referred to in the content. |
© 2023 by the authors. Licensee MDPI, Basel, Switzerland. This article is an open access article distributed under the terms and conditions of the Creative Commons Attribution (CC BY) license (https://creativecommons.org/licenses/by/4.0/).
