1. Introduction
Recently developed continuous glucose monitors (CGMs) that are approved without the need of confirmatory blood glucose assessment made a revolution in the treatment and management of people with diabetes. CGM provides real-time alerts in the case of hypo- and hyperglycemia or even anticipated glycaemia including alerting based on fast glucose fluctuations enabling in general improved glycaemic management also during meal challenges and around physical activity and exercise. Due to the complexity of CGM systems, both individuals with T1D and healthcare professionals are challenged with the interpretation of rapidly changing glucose in unusual situations. This includes overcoming sensor delay (i.e., the inherent ~10-minute discrepancy between interstitially measured and actual plasma glucose values with goes up to around 12 min around moderate-intensity exercise) (1), and sensor malfunctions (i.e., compression hypoglycemia) (2), (3).
Machine learning and neural networks have been increasingly used to predict glucose fluctuations in people with diabetes when using a CGM. Blood glucose level prediction models use machine learning algorithms or mathematical models to forecast future blood sugar levels based on past data and/or physiological parameters. The most widely used data for machine learning and glucose prediction models are for glucose levels, insulin administration, carbohydrates, and physical acitivy/exercise. The prediction horizon, or the amount of time available to a diabetic patient before the predicted event occurs (hypoglycemia or hyperglycemia), should be long enough to allow a timely response to prevent hypoglycemia or hyperglycemia. Therefore, the aim of this study was to investigate the efficacy of three different glucose predictive models - an autoregressive integrated moving average model (ARIMA), logistic regression, and long short-term memory networks (LSTM), in predicting glucose levels after 15 minutes and one hour.
2. Materials and Methods
In this study we compared and evaluated the performance of these models in predicting hypoglycemia, euglycemia, and hyperglycemia state. Hypoglycemia state was defined as the level of glucose below 70 mg/dL while the hyperglycemia - above 180 mg/dL. By assessing metrics such as precision, recall, F1-score, and accuracy, the study goal was to determine which model provided the most accurate and reliable predictions for glucose levels..
2.1. Data Collection
The data used in this investigation came from two sources – from a cohort study in people with diabetes and from simulation results obtained using CGM Simulator (4). The clinical cohort CGM data were obtained within the “Immune response to COVID-19 Vaccination in people with Diabetes Mellitus - COVAC-DM'' study (EudraCT; Number 2021-001459-15), performed at the Interdisciplinary Metabolic Medicine Trials Unit at the Medical University of Graz, Austria. Within this study 11 particpants with type 1 diabetes used a CGM device prior to the first COVID-19 vaccination and data was collected through the second COVID-19 vaccination. Besides the sensor glucose readings, data on insulin dosing and carbohydrate intake was collected. Data were published previously (5).
The CGM Simulator is a system for in-silico testing of control algorithms that has three principal components: (1) a large cohort simulated "subjects'' based on real individuals' data and spanning the observed variability of key metabolic parameters in the general population of people with T1D; (2) a simulator of CGM sensor errors representative of three popular brands; and (3) a simulator of discrete s.c. insulin delivery via insulin pumps of two brands. In our research we used software Simglucose v0.2.1 by Jinyu Xie (4), which is a freely available Python implementation of UVA/Padova T1D Simulator 2008 version. The generated in-silico data covers ten virtual patients in each of three age groups {adults, adolescents, children} and spans 10 days. Each day three regular meals are consumed and up to three snacks can be taken extra. The meal and snack sizes are randomized around pivot values. Additionally, the actual snack consumption probability is set to be 50% so that on average 1.5 snacks a day are consumed. The meal and snack times are also randomized around a fixed schedule.
The original dataset contains the following fields: patient ID, timestamp, CGM measurement, insulin dosage and consumed carbohydrates. The raw real patient data is mostly of 15-minute time frequency, however some minor frequency variability is present in the series and data gaps do occur. We pre-processed the raw data and bring it to 15 minute frequency, taking care of gaps and any bad entries. The only pre-processing required for the in-silico data is re-sampling it for 15-minute frequency as the simulator generates it for each minute.
Figure 1 below shows the three-day data excerpts for real and virtual patients. To develop our forecasting system, we used both virtual and real patients’ data. The forecasting results that we report are based on the real patients’ data only.
2.2. Feature Engineering
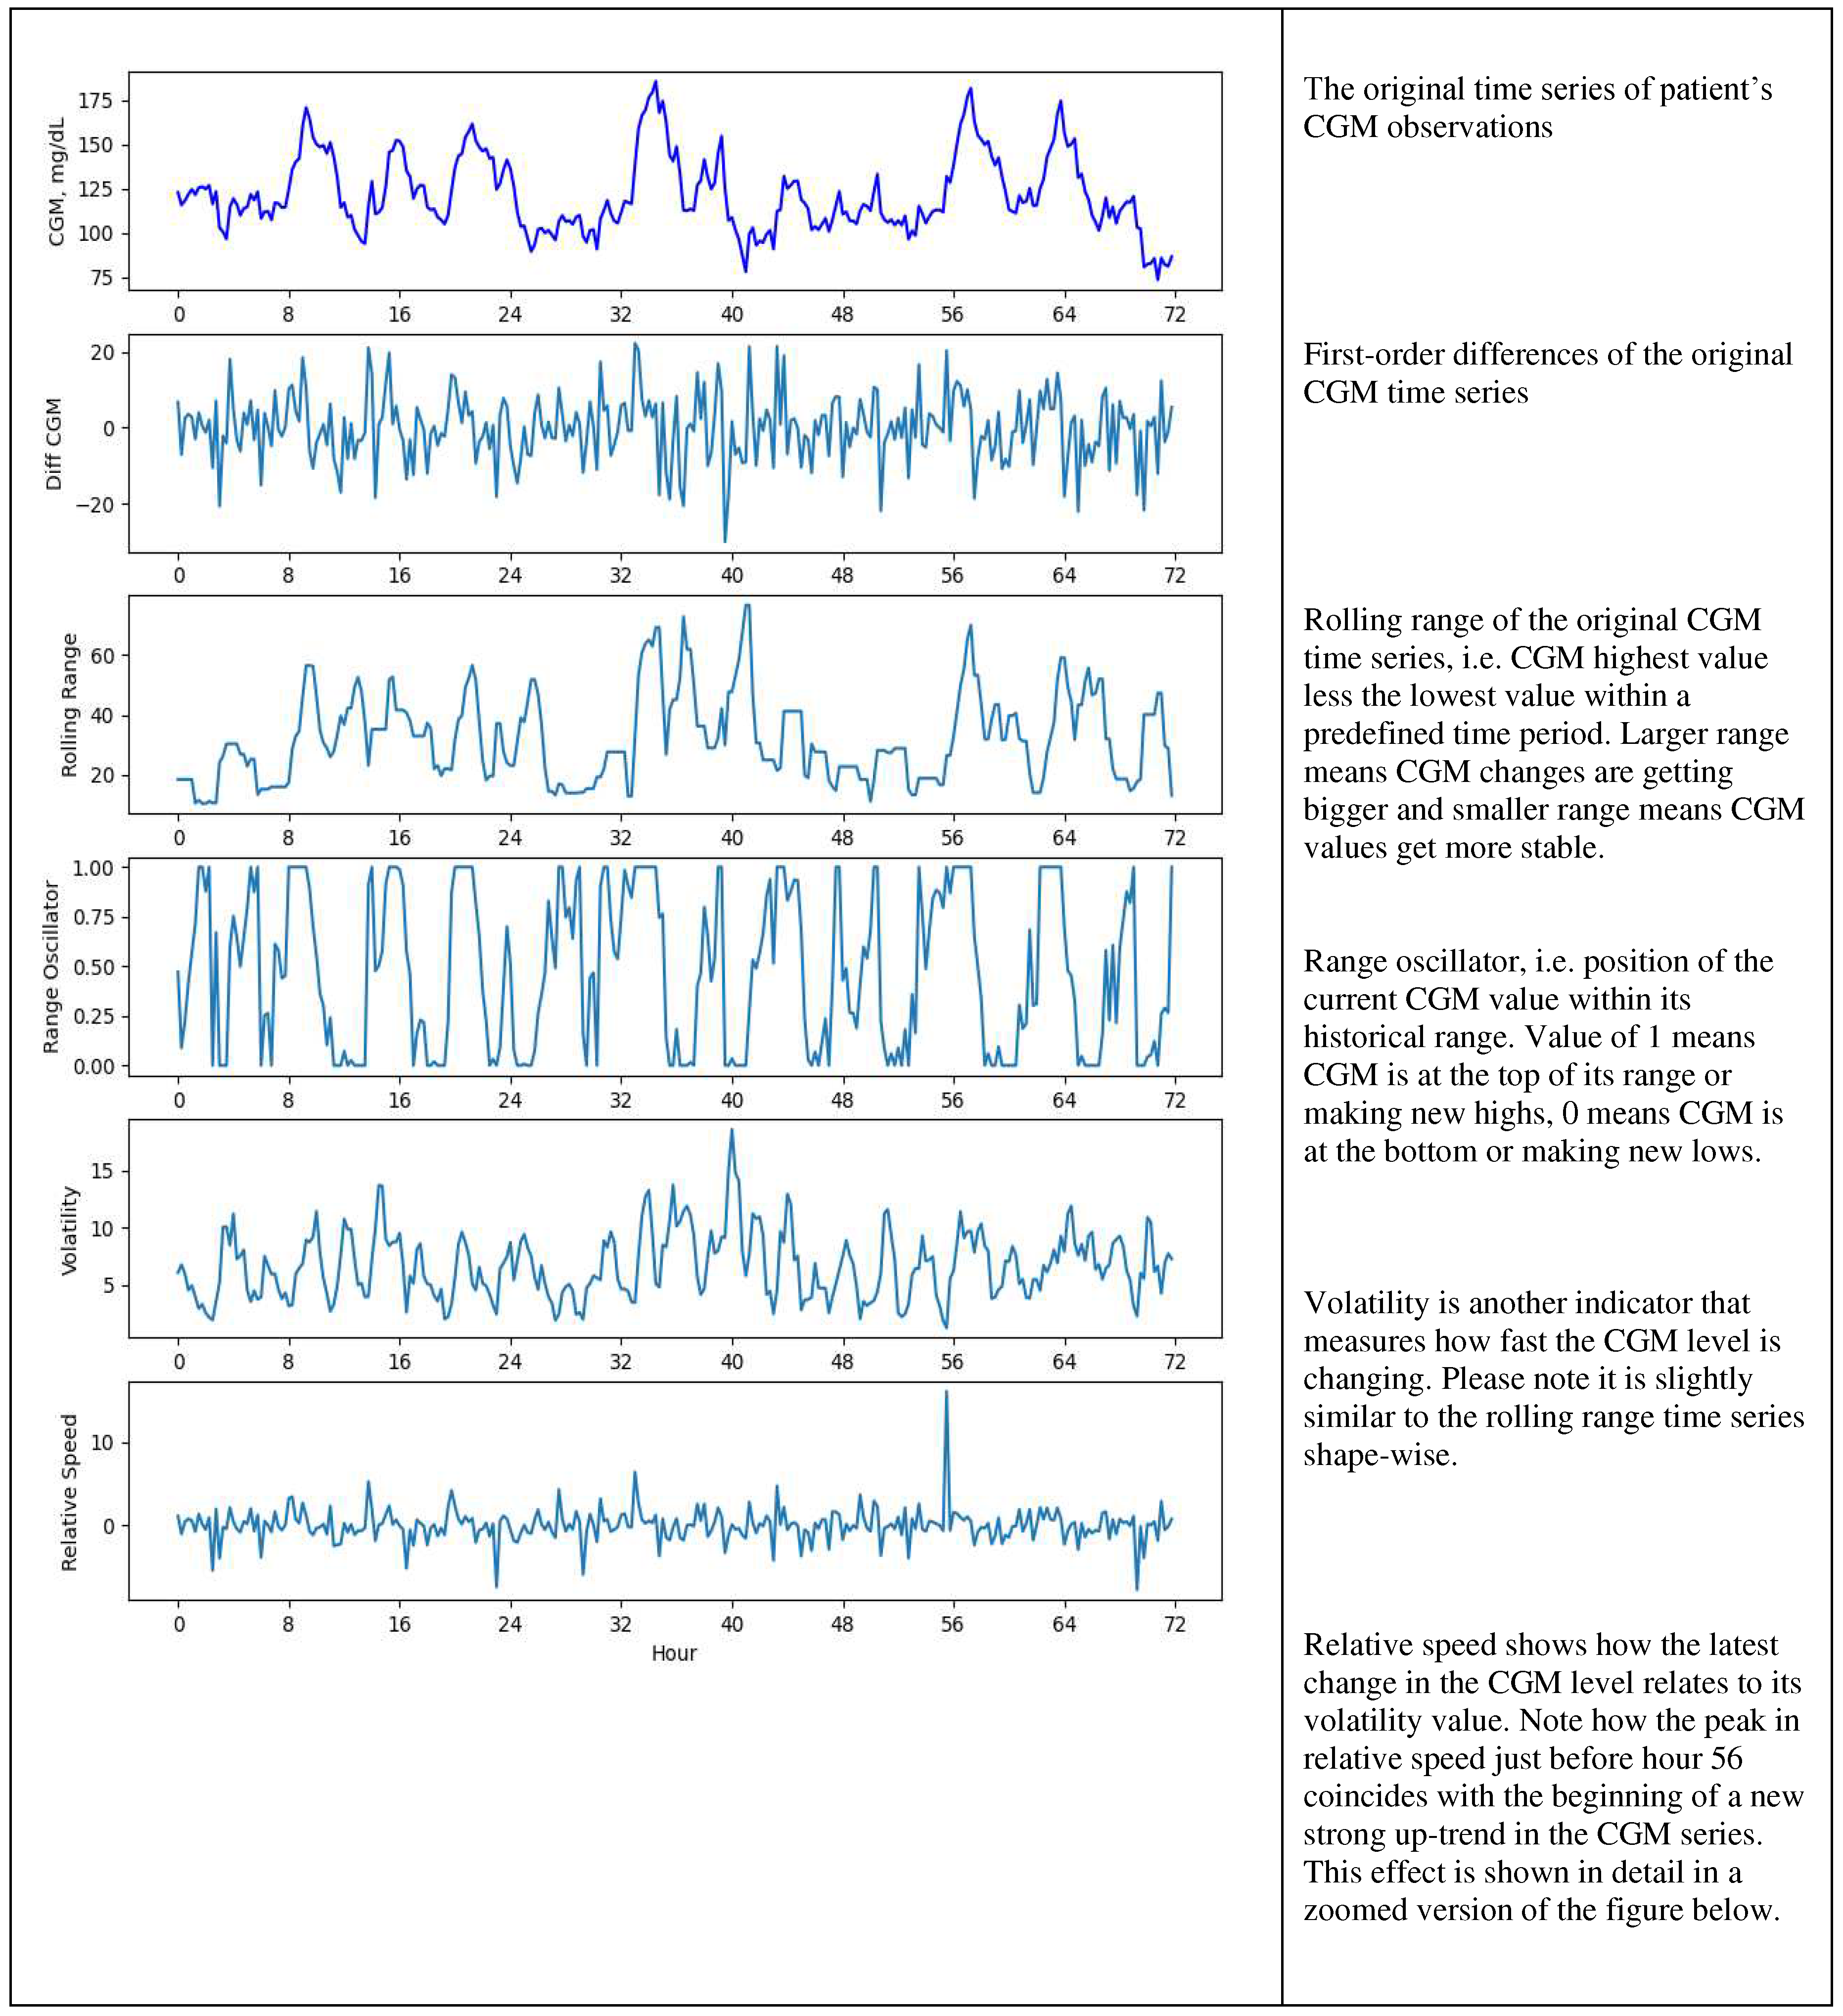
Feature engineering is at the core of our methodology and allows us to come up with factors which will be used in forecasting. Using the original CGM time series, we derived additional features that can be broadly classified into the groups listed in
Table 1 below.
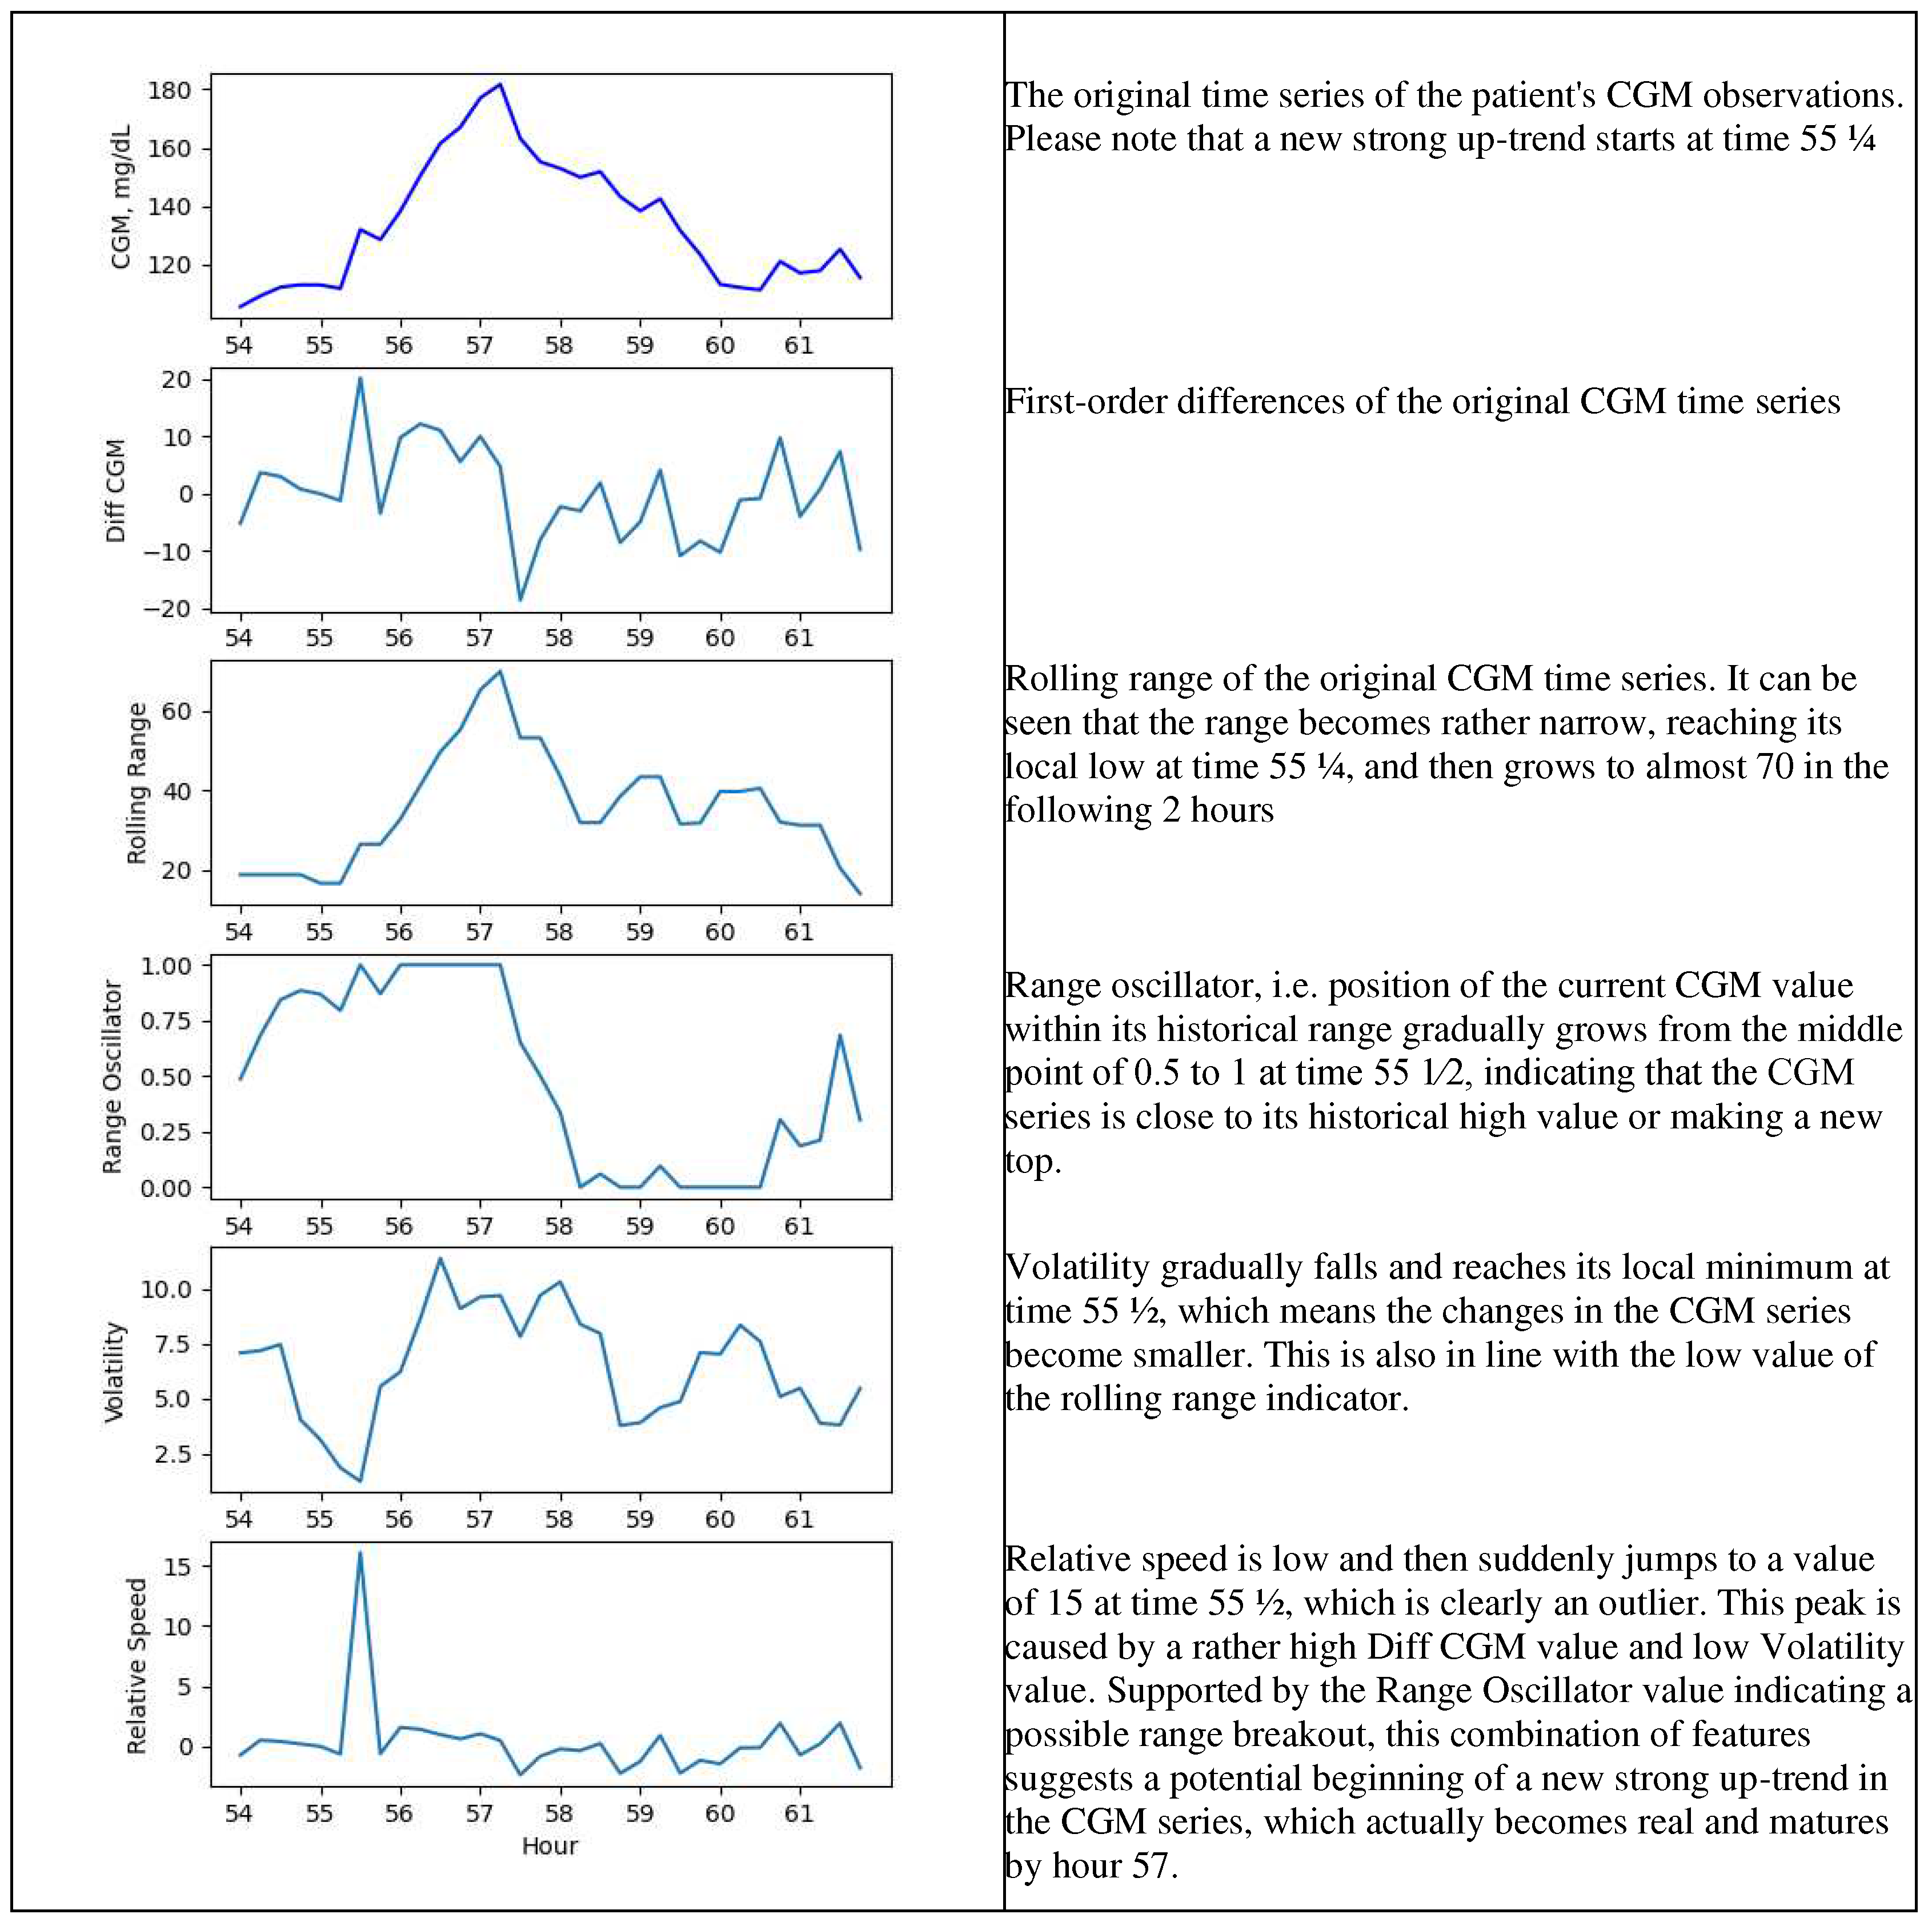
Examples of the original CGM time series and some of its derived features are shown in Figures 2a and 2b below.
2.3. Forecasting Methodology
We limited the maximum forecast horizon to be four steps, which effectively means 1 hour. We compared three approaches to forecasting – an autoregressive integrated moving average model (ARIMA), multinomial logistic regression and long short-term memory (LSTM) network. The ARIMA model uses CGM time series as input and produces forecasts of CGM differences over next 15 and 60 minutes, which are then converted to CGM level and then transformed into glycemia class using the formula shown in Formula 1 below. The logistic regression and LSTM models utilize our engineered features and their lagged values (with lags up to 12) as input and glycemia class 15 and 60 minutes ahead as target. For each patient, we split data into the in-sample and out-of-sample sets. For each forecast horizon the models are estimated in sample and then tested out of sample. To get the idea of how robust this approach is we calculate in- and out-of-sample errors and confusion matrices for each patient and then provide aggregated statistics over all patients.
Figure 2a.
Engineered features.
Figure 2a.
Engineered features.
Figure 2b.
Engineered features – a zoomed version for 54 – 62-hour range.
Figure 2b.
Engineered features – a zoomed version for 54 – 62-hour range.
The results of the glucose prediction system employing ARIMA, logistic regression and LSTM models, include out-of-sample aggregated confusion matrices and classification scores for two prediction horizons: 15 minutes and 1 hour. These metrics are based on real patients’ out-of-sample data and provide an assessment of the accuracy and effectiveness of each model in predicting glucose levels. The durations of 15 minutes and 1 hour were used for different tactics in management of hypoglycemia and hyperglycemia. Hypoglycemia can have immediate and severe consequences, including loss of consciousness and seizures. By predicting hypoglycemia 15 minutes in advance, individuals with diabetes or healthcare professionals can take proactive measures to prevent a further drop in blood sugar. This may involve consuming a fast-acting carbohydrate, while 1 hour prediction may involve adjustment of insulin dosage to prevent complications. Hyperglycemia can also have detrimental effects on health, particularly if sustained over an extended period. By predicting hyperglycemia 1 hour in advance, individuals with diabetes can adjust insulin, modifying diet, or increasing physical activity.
2.4. Population
The clinical cohort was part of the “Immune response to COVID-19 Vaccination in people with Diabetes Mellitus - COVAC-DM” study (EudraCT; Number 2021-001459-15), in which 11 subjects (5 males and 6 females) with type 1 diabetes used a CGM device prior to the first COVID-19 vaccination and data was collected through the second COVID-19 vaccination. The mean age of the participants was 47+/-11 years, mean HbA1c of 57 +/- 8 mmol/mol and a total daily insulin dose of 38 +/- 14 IU.
3. Results
The recall and accuracy scores for our three models for 15-minute and 1-hour forecast horizons are summarized in
Table 2 below. The confusion matrices are provided in subsections below for each of the models for each forecast horizon.
3.1. ARIMA
The reported scores for the ARIMA model, with a prediction horizon of 15 minutes and 1 hour, offer valuable insights into its performance in predicting glucose levels across different states.
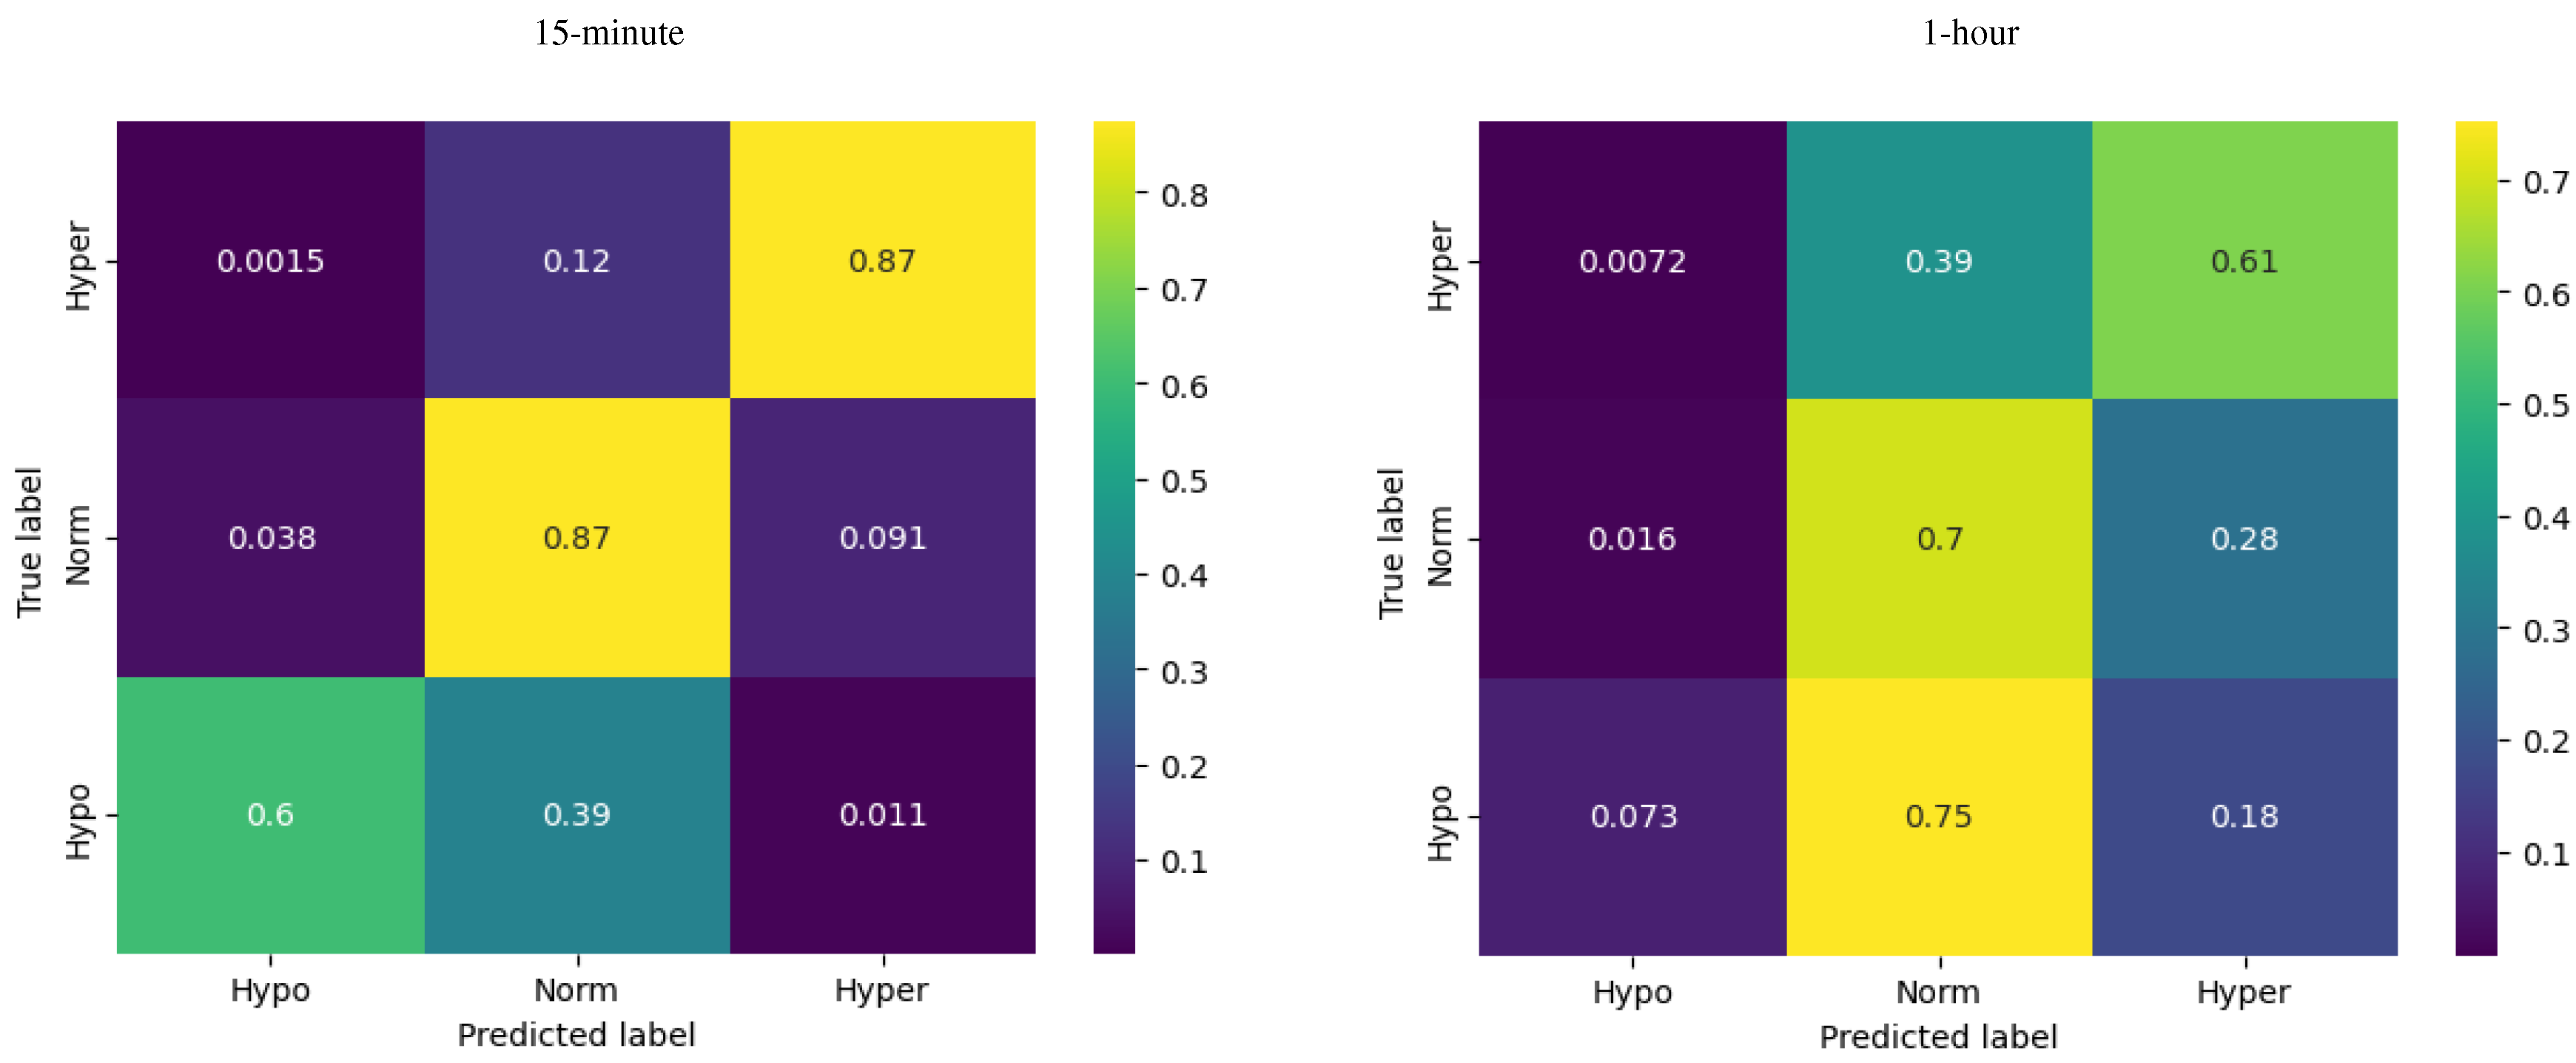
For a 15-minute forecast horizon, at hypoglycemia the ARIMA model demonstrated a recall of 0.60, indicating that the model successfully identified 60% of the actual cases of hypoglycemia. The recall for euglycemia was 0.87, indicating that the ARIMA model successfully captured 87% of the actual instances of euglycemia. At hyperglycemia the ARIMA model exhibited a recall of 0.87, indicating that the model successfully identified 87% of the actual instances of hyperglycemia. The overall accuracy of the ARIMA model for the 15-minute prediction horizon is reported as 0.86, indicating that it correctly predicts the glucose levels for approximately 86% of the instances.
One-hour forecasts were of lower quality, with a significant drop for hypoglycemia in particular (as clearly seen in
Figure 4, 1-hour) and the total accuracy of 0.63. This sort of reduction in forecast quality was rather expected given that for a longer forecast horizon the model resamples data at a lower frequency and the number of hypoglycemia observations was rather low compared to the other two classes.
Figure 3.
Confusion matrices for ARIMA model.
Figure 3.
Confusion matrices for ARIMA model.
3.2. Logistic Regression
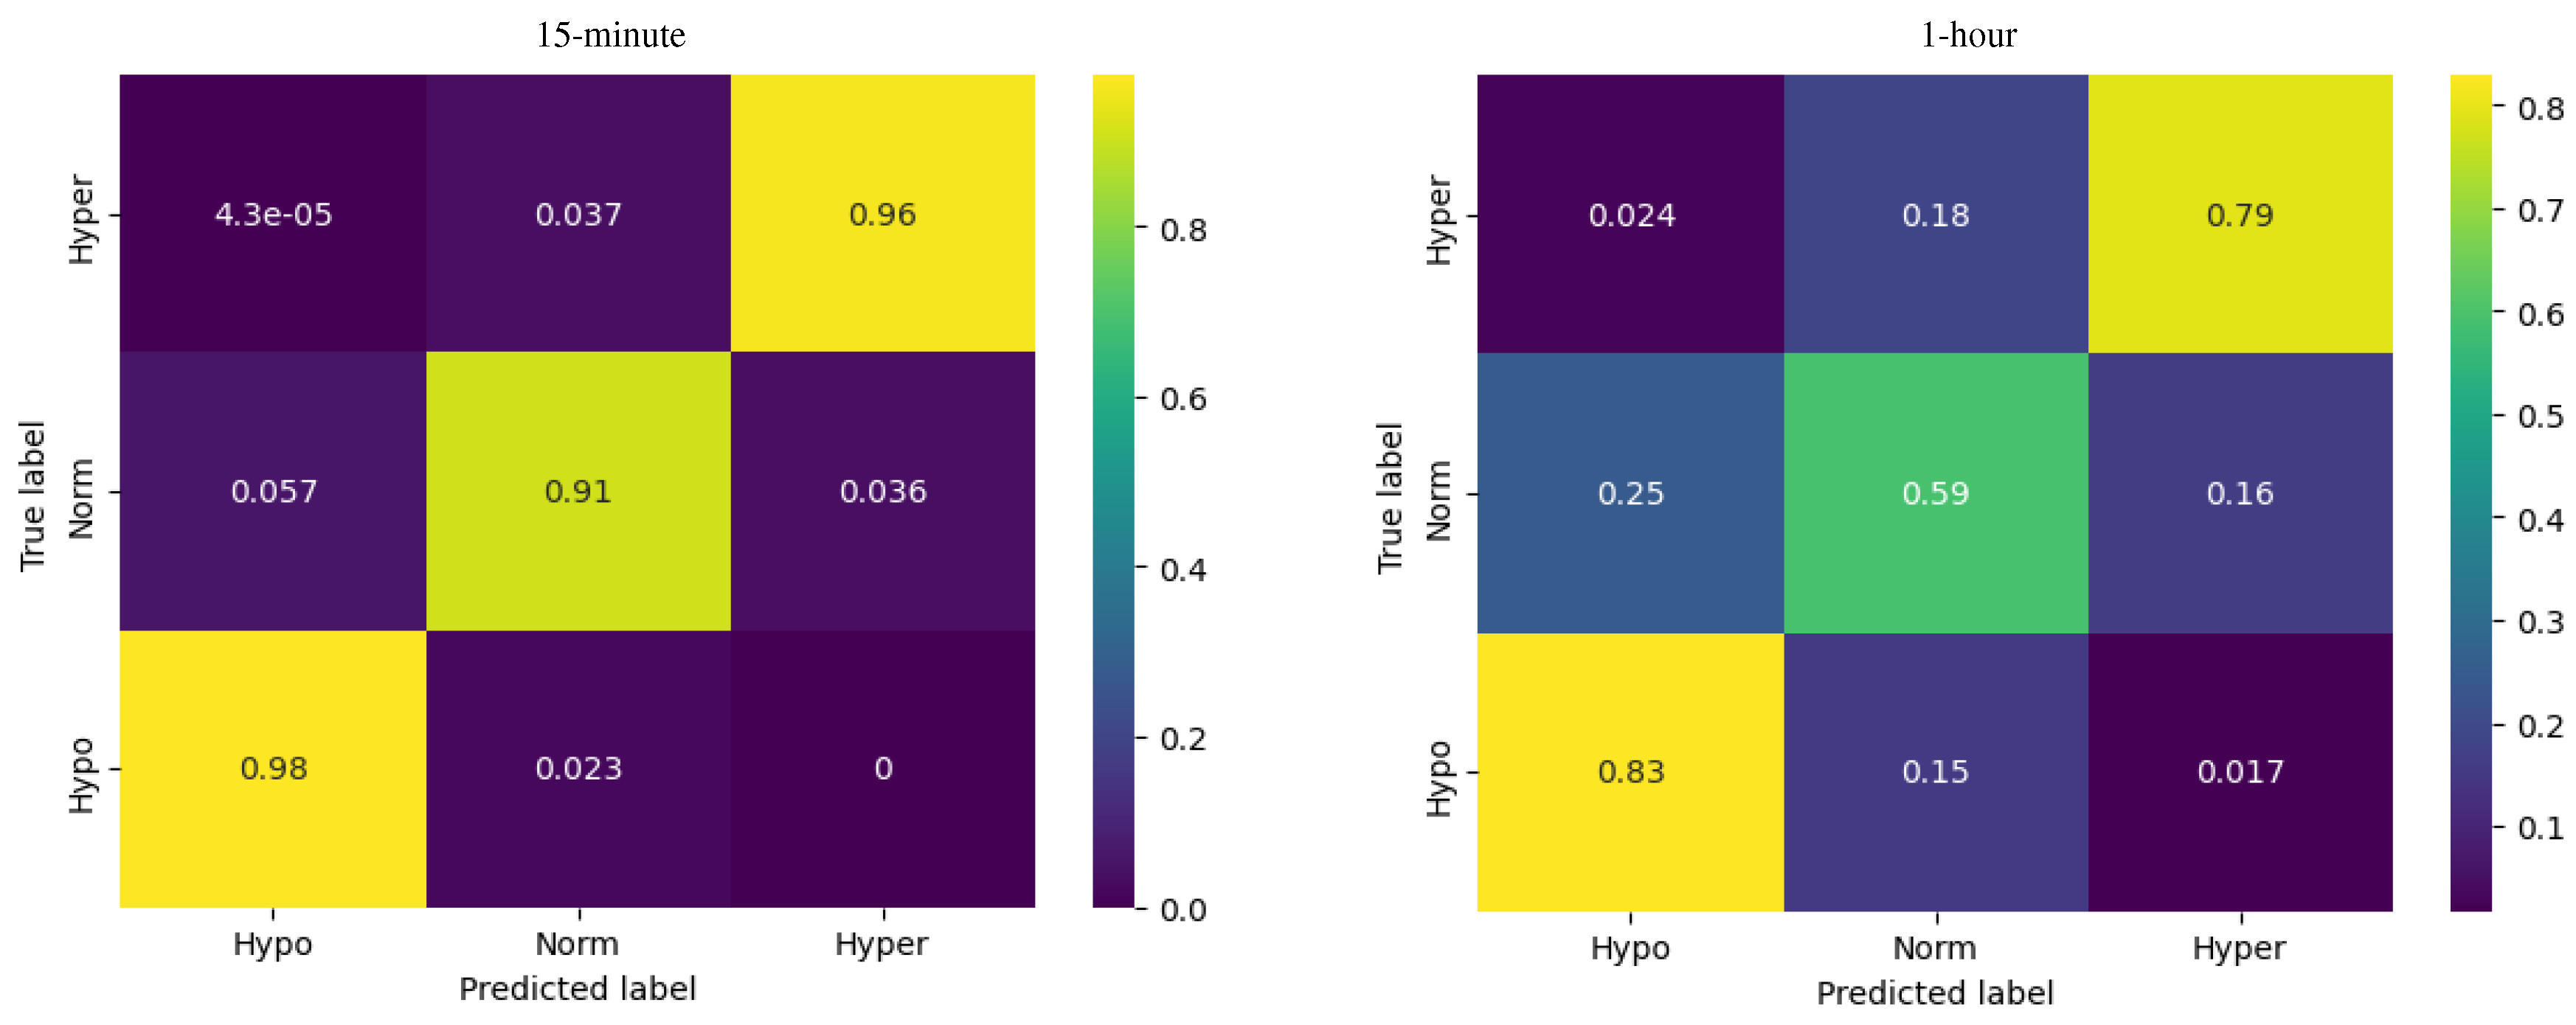
The multinomial logistic regression showed the best results (out of the three models) predicting the glycemic state for the first 15 minutes.
For hypoglycemia, the model demonstrated a recall of 0.98, meaning that the model successfully identified 98% of the actual instances of hypoglycemia. For euglycemia, the logistic regression model showed a recall of 0.91, indicating that the model successfully captured 91% of the actual instances of euglycemia. Regarding hyperglycemia, the logistic regression model exhibited a recall of 0.96, indicating that the model successfully identified 96% of the actual instances of hyperglycemia.
Figure 4.
Confusion matrices for logistic regression model.
Figure 4.
Confusion matrices for logistic regression model.
For the 1-hour horizon the accuracy of the logistic regression model was reported as 0.69, indicating that it correctly predicts the glucose levels for approximately 69% of the instances.
Compared to the ARIMA model, the logistic regression demonstrated more accurate prediction of the glycemia states effectiveness in distinguishing between different glucose levels.
3.3. LSTM
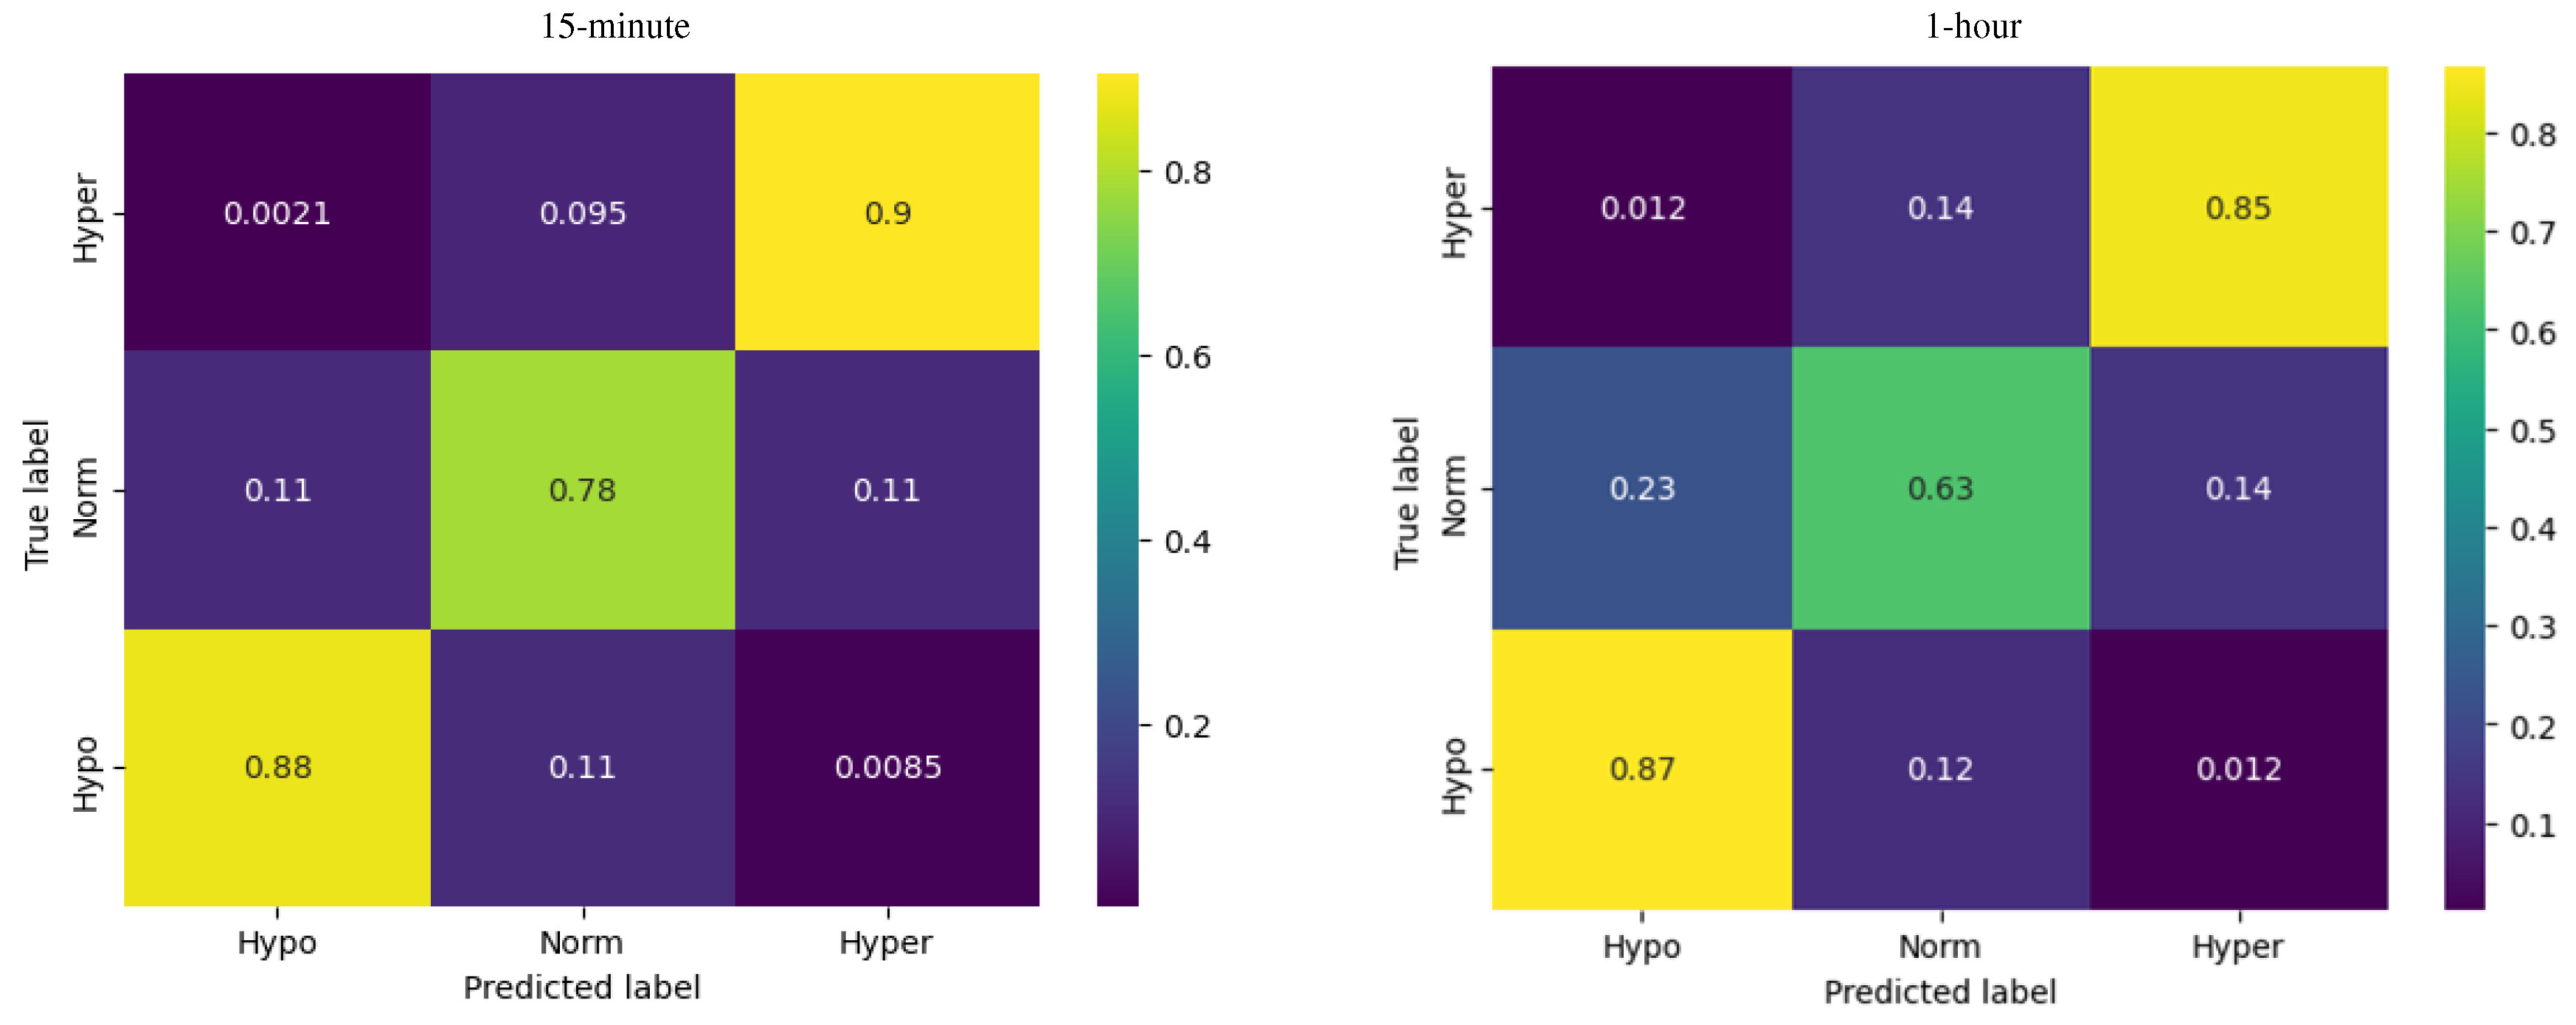
The LSTM showed the best results (out of the three models) predicting the glycemic state for one hour.
Figure 5.
Confusion matrices for LSTM network model.
Figure 5.
Confusion matrices for LSTM network model.
For hypoglycemia, the model demonstrates a recall of 0.87, meaning that the model successfully identified 87% of the actual instances of hypoglycemia. For euglycemia, the LSTM model shows a precision recall of 0.63, indicating that the model successfully captured 63% of the actual instances of euglycemia. The recall for hyperglycemia is 0.85, indicating that the LSTM model successfully identified 85% of the actual instances of hyperglycemia.
The accuracy of the LSTM model predictions for the 1-hour horizon is reported as 0.73, indicating that it correctly predicts the glucose levels for approximately 73% of the instances.
In summary, the LSTM model demonstrates reasonable precision, recall and accuracy scores for predicting hypoglycemia, euglycemia, and hyperglycemia states. While the model's performance after 15 minutes does not exceed the logistic regression model, it still shows an increased effectiveness in distinguishing between different glucose levels and predicting the corresponding states at 1-hour horizon compared to the logistic regression.
4. Discussion
The results of this study shed light on the performance of three different predictive models, ARIMA, logistic regression, and LSTM, in predicting glucose levels after 15 minutes and one hour in view of different glycaemic ranges.
Previously some studies compared the prediction accuracy of ARIMA, logistic regression, and LSTM for glucose level prediction. For example, a study by Sadegh Mirshekarian et al. (2019) (6) found that the LSTM model shows significantly better performance and results compared to ARIMA. In another study by Mohebbi, Ali et al. (2020) (7) also determined that the LSTM model was most effective for blood glucose prediction compared to ARIMA. In our study the logistic regression and LSTM models have also exhibited the highest precision, recall, F1-score, and accuracy values compared to the ARIMA. However, the logistic regression model was more effective in accurately predicting hypoglycemia, euglycemia, and hyperglycemia states during the first 15 min, while LSTM - after an hour. On the other hand, a potential future solution could involve a hybrid predictive approach using different models. For example, model created using two different approaches: logistic regression and random forest accurately predicted hypoglycemic episodes with high sensitivities of around 95% and 94% and specificities of approximately 97% and 95% for prediction horizons of 0 to 15 and 15 to 30 minutes, respectively (Darpit Dave et al. 2021) (8). In contrast, ARIMA provided a precision of 64% in hypoglycemia detection for prediction horizons of 30 minutes (Francesco Prendin et al 2021) (9).
The results of our study provide valuable insights into the applicability of different predictive models, for individuals with irregular or hard-to-predict glucose fluctuations according to the situation. Currently, the 30-minute interval is the most common in building a predictive model for glucose fluctuations (10). There are also models that predict the level of fluctuations in glucose with a time interval of 60 minutes and 15 minutes. However, the question of the time needed to make decisions to prevent hypoglycemia or hyperglycemia remains open depending on various factors (11). Blood glucose level prediction models have the potential to greatly improve the management and treatment of diabetes. By accurately forecasting future glucose levels, these models can help individuals with diabetes better adapt their insulin, diet, and physical activity to acutely avoid hypoglycemia and chronically improve the time in range (70-180 mg/dL). Among these models, the LSTM model, with its ability to capture complex patterns and dependencies in glucose readings, shows promise in identifying long term (1-hour) correlations between glucose levels and may potentially be used in the long-term prognosis of glucose excursions during exercising or consuming certain types of food. Furthermore, since future technologies are rising and we are getting closer to fully closed loop insulin delivery systems, it must be ensured that CGM systems are able to assess sensor glucose accurately with a minimum of lag time, to avoid CGM-induced (fatal) dysglycaemia.
For those who are running on regular insulin pump and insulin pen therapy, by leveraging CGM-based glucose prediction, individuals can make more informed decisions regarding their diabetes management, including adjusting insulin doses or prospectively treat hypoglycaemia. Additionally, the flexibility of neural networks allows them to incorporate various inputs, such as changes in diet or physical activity levels, to predict future glucose fluctuations. This versatility is particularly advantageous for individuals with unpredictable glucose patterns, as it enhances the accuracy and adaptability of the predictions. Maintaining blood glucose levels within euglycaemia (70-180 mg/dL) is crucial for the prevention of acute and chronic complications, including severe hypoglycemia and the risk of micro- and macrovascular complications (12), (13), (14). The inability to exactly determine the level of physical activity is contrasted by the broad recommendations to increase physical activity in the context of metabolic and chronic disease. This disconnect of reported and directly measured physical activity is well known (15).
For these purposes a better prediction model is needed to promote an optimized synergy between insulin dosing and the daily activities as well as to handle sensor delay and bridge periods of sensor malfunction. Generally, the amplitude of glycaemic excursions and risk of hypoglycemia strongly correlates with intensity and duration of exercise as well as duration of the fasting. Physical exercise is an important component in the management of type 1 (16) and type 2 diabetes due to its positive effects on diabetes management and prevention of progression of macrovascular and microvascular complications of diabetes,(17), improved quality of life and reduced prevalence of depression (18). However, high load exercise increases the risk of rapid deviations of plasma glucose level (19), including hypoglycaemia (20). Frequent and severe hypoglycaemia is associated with early mortality (21), increased cardiovascular risk (22), reduced quality of life and fear of hypoglycaemia (23), (24), and reduced exercise efficiency, which prevents people with diabetes from being physically active (25), (26). Risk of hypoglycaemia during and after exercise can be lowered if specific insulin-dose adjustments are made as well as by consuming additional carbohydrates (27). Accurate real-time blood glucose prediction based on a variety of inputs, including short-acting insulin injections, has clinical implications and great potential for quality and longevity in diabetes.
One of the benefits of using a neural network for this task is that it can handle a large amount of data and identify complex patterns that may be difficult for a human to discern. This can be especially useful for individuals who have irregular or hard-to-predict glucose fluctuations. However, it is important to recognize that neural networks are not perfect and there are some limitations to consider when using them to predict glucose fluctuations. For example, they can require a significant amount of data to make accurate predictions, which can be a challenge for people who do not consistently track their glucose levels or who have gaps in their data. In addition, there is always the potential for errors or biases in the data that is used to train the neural network, which could affect the accuracy of the predictions. The use of machine learning has yielded encouraging glucose prediction accuracy results in relatively small study populations or in silico studies (28), (29), (30). In some cases, the algorithm combined two state-of-the-art models that calculate nutrition absorption and glycaemia including evaluation of insulin. Research even tried to combine the model with a personalized genetic algorithm, Nelder–Mead method, natural biorhythm (31).
Despite these limitations, neural networks show great promise as a tool for predicting and managing glucose fluctuations. By analyzing patterns in blood glucose readings, insulin doses, and other relevant data, a neural network can learn to make accurate predictions about how a person's glucose levels will change over time.
5. Conclusion
The logistic regression model was more effective in accurately predicting hypoglycemia, euglycemia, and hyperglycemia states during the first 15 min. However, the LSTM model exceeded logistic regression prediction results during an hour prognosis. These findings suggest that different models may have varying strengths and weaknesses in predicting glucose levels, and the choice of model should be carefully considered based on the specific requirements and context of the application. Furthermore, future research could explore hybrid models or ensemble approaches that combine the strengths of multiple models to further improve the accuracy and reliability of glucose predictions. Additionally, the study could be extended by considering additional features or incorporating real-time data to enhance the predictive capabilities of the models.
Author Contributions
All authors contributed and reviewed the manuscript. DB, TM, SK, SL participated in a data analysis, HS, OM, participated in data curation and original draft preparation, OM, HS, TM, DS , VP triple checked all data and provided statistical support. All authors read and approved the final manuscript.
Funding
The research was funded by the State Research Program project in biomedical, medical technologies and pharmaceuticals (No. VPP-EM-BIOMEDICĪNA-2022/1-0001).
Ethical Approval
The clinical data curation was conducted in accordance with the declaration of Helsinki and approved by the Ethics Committee of the Medical University of Graz (EK 33-366 ex 20/21), study registration (EudraCT-Number 2021-001459-15).
Consent to participate
Informed consent was obtained from all subjects involved in the study.
Consent for publication
All authors approved the manuscript and gave their consent for publication.
Data availability
The datasets used and/or analyzed during the current study available from the corresponding author on reasonable request.
Competing Interests
The authors declare that the research was conducted in the absence of any commercial or financial relationships that could be construed as a potential conflict of interest.
References
- Zaharieva DP, Turksoy K, McGaugh SM, Pooni R, Vienneau T, Ly T, Riddell MC. Lag Time Remains with Newer Real-Time Continuous Glucose Monitoring Technology During Aerobic Exercise in Adults Living with Type 1 Diabetes. Diabetes Technol Ther. 2019, 21, 313–321. [Google Scholar] [CrossRef] [PubMed]
- Rodbard, D. Continuous Glucose Monitoring: A Review of Successes, Challenges, and Opportunities. Diabetes Technol Ther. 2016, 18 (Suppl. 2), S3–S13. [Google Scholar] [CrossRef] [PubMed]
- Blauw H, Keith-Hynes P, Koops R, DeVries JH. A Review of Safety and Design Requirements of the Artificial Pancreas. Ann Biomed Eng. 2016, 44, 3158–3172. [Google Scholar] [CrossRef]
- Available at https://github.com/jxx123/simglucose.
- Aberer F et al. Diabetes Care 2022.
- Mirshekarian Sadegh, Shen Hui, Bunescu Razvan, and Marling Cindy. Lstms and neural attention models for blood glucose prediction: Comparative experiments on real and synthetic data. In 2019 41st Annual International Conference of the IEEE Engineering in Medicine and Biology Society (EMBC), pages 706–712. IEEE, 2019.
- Mohebbi Ali, Johansen Alexander R, Hansen Nicklas, Christensen Peter E, Tarp Jens M, Jensen Morten L, Bengtsson Henrik, and Mørup Morten. Short term blood glucose prediction based on continuous glucose monitoring data. arXiv 2020, preprint. arXiv:2002.02805.
- Dave D, DeSalvo DJ, Haridas B, et al. Feature-Based Machine Learning Model for Real-Time Hypoglycemia Prediction [published correction appears in J Diabetes Sci Technol. 2021 Jun 16;:19322968211027985] [published correction appears in J Diabetes Sci Technol. 2021 Nov 19;:19322968211059154]. J Diabetes Sci Technol. 2021, 15, 842–855. [Google Scholar]
- Prendin F, Del Favero S, Vettoretti M, Sparacino G, Facchinetti A. Forecasting of Glucose Levels and Hypoglycemic Events: Head-to-Head Comparison of Linear and Nonlinear Data-Driven Algorithms Based on Continuous Glucose Monitoring Data Only. Sensors (Basel) 2021, 21, 1647. [Google Scholar] [CrossRef]
- Omer Mujahid,Ivan Contreras and Josep Vehi,Machine Learning Techniques for Hypoglycemia Prediction: Trends and Challenges. Sensors 2021, 21, 546. [CrossRef]
- William P. T., M. van Doorn,Yuri D. Foreman,Nicolaas C. Schaper,Hans H. C. M. Savelberg,Annemarie Koster,Carla J. H. van der Kallen,Anke Wesselius,Miranda T. Schram,Ronald M. A. Henry,Pieter C. Dagnelie,Bastiaan E. de Galan,Otto Bekers,Coen D. A. Stehouwer,Steven J. R. Meex,Martijn C. G. J. ,: Brouwers, Machine learning-based glucose prediction with use of continuous glucose and physical activity monitoring data: The Maastricht Study, Published, 24 June 2021. [Google Scholar]
- Forbes JM, Cooper ME. Mechanisms of diabetic complications. Physiol Rev. 2013, 93, 137–88. [Google Scholar] [CrossRef]
- American Diabetes, A. 6. Glycemic Targets: Standards of Medical Care in Diabetes-2019. Diabetes Care. 2019, 42 (Suppl. 1), S61–S70. [Google Scholar] [CrossRef]
- International Hypoglycaemia Study, G. Hypoglycaemia, cardiovascular disease, and mortality in diabetes: epidemiology, pathogenesis, and management. Lancet Diabetes Endocrinol. 2019, 7, 385–96. [Google Scholar]
- Prince SA, Adamo KB, Hamel ME, Hardt J, Connor Gorber S, Tremblay M. A comparison of direct versus self-report measures for assessing physical activity in adults: A systematic review. Int J Behav Nutr Phys Act. 2008, 5. [Google Scholar]
- Moser O, Riddell MC, Eckstein ML, Adolfsson P, Rabasa-Lhoret R, van den Boom L, Gillard P, Nørgaard K, Oliver NS, Zaharieva DP, Battelino T, de Beaufort C, Bergenstal RM, Buckingham B, Cengiz E, Deeb A, Heise T, Heller S, Kowalski AJ, Leelarathna L, Mathieu C, Stettler C, Tauschmann M, Thabit H, Wilmot EG, Sourij H, Smart CE, Jacobs PG, Bracken RM, Mader JK. Glucose management for exercise using continuous glucose monitoring (CGM) and intermittently scanned CGM (isCGM) systems in type 1 diabetes: position statement of the European Association for the Study of Diabetes (EASD) and of the International Society for Pediatric and Adolescent Diabetes (ISPAD) endorsed by JDRF and supported by the American Diabetes Association (ADA). Diabetologia 2020, 63, 2501–2520. [Google Scholar]
- Tikkanen-Dolenc, H., Wadén, J., Forsblom, C. et al. Frequent physical activity is associated with reduced risk of severe diabetic retinopathy in type 1 diabetes. Acta Diabetol 2020, 57, 527–534. [CrossRef] [PubMed]
- Tikkanen-Dolenc H, Wadén J, Forsblom C, Harjutsalo V, Thorn LM, Saraheimo M, Elonen N, Tikkanen HO, Groop PH; FinnDiane Study Group. Physical Activity Reduces Risk of Premature Mortality in Patients With Type 1 Diabetes With and Without Kidney Disease. Diabetes Care. 2017, 40, 1727–1732. [Google Scholar] [CrossRef] [PubMed]
- Moser O, Tschakert G, Mueller A, Groeschl W, Pieber TR, Obermayer-Pietsch B, Koehler G, Hofmann P. Effects of High-Intensity Interval Exercise versus Moderate Continuous Exercise on Glucose Homeostasis and Hormone Response in Patients with Type 1 Diabetes Mellitus Using Novel Ultra-Long-Acting Insulin. PLoS One 2015, 10, e0136489. [Google Scholar]
- Brazeau AS, Mircescu H, Desjardins K, Dube MC, Weisnagel SJ, Lavoie C, et al. . The barriers to physical activity in Type 1 diabetes (BAPAD-1) scale: predictive validity and reliability. Diab Metabol. 2012, 38, 164–70. [Google Scholar] [CrossRef]
- Moser O, Rafferty J, Eckstein ML, Aziz F, Bain SC, Bergenstal R, Sourij H, Thomas RL. Impact of severe hypoglycaemia requiring hospitalization on mortality in people with type 1 diabetes: A national retrospective observational cohort study. Diabetes Obes Metab. 2023, 25, 2243–2254. [Google Scholar] [CrossRef]
- Standards of medical care in diabetes 2022 https://diabetesjournals.
- Tikkanen-Dolenc, H. , Wadén, J., Forsblom, C. et al. Frequent and intensive physical activity reduces risk of cardiovascular events in type 1 diabetes. Diabetologia 2017, 60, 574–580. [Google Scholar] [CrossRef]
- Zhang L, Xu H, Liu L, Bi Y, Li X, Kan Y, Liu H, Li S, Zou Y, Yuan Y, Gong W, Zhang Y. Related factors associated with fear of hypoglycemia in parents of children and adolescents with type 1 diabetes - A systematic review. J Pediatr Nurs. 2022, 66, 125–135. [Google Scholar] [CrossRef]
- Finn, M. , Sherlock, M., Feehan, S. et al. Adherence to physical activity recommendations and barriers to physical activity participation among adults with type 1 diabetes. Ir J Med Sci 2022, 191, 1639–1646. [Google Scholar] [CrossRef]
- Ahola, A.J. , Tikkanen-Dolenc, H., Forsblom, C. et al. Symptoms of depression are associated with reduced leisure-time physical activity in adult individuals with type 1 diabetes. Acta Diabetol 2021, 58, 1373–1380. [Google Scholar] [CrossRef] [PubMed]
- Moser O, Riddell MC, Eckstein ML, Adolfsson P, Rabasa-Lhoret R, van den Boom L, Gillard P, Nørgaard K, Oliver NS, Zaharieva DP, Battelino T, de Beaufort C, Bergenstal RM, Buckingham B, Cengiz E, Deeb A, Heise T, Heller S, Kowalski AJ, Leelarathna L, Mathieu C, Stettler C, Tauschmann M, Thabit H, Wilmot EG, Sourij H, Smart CE, Jacobs PG, Bracken RM, Mader JK. Glucose management for exercise using continuous glucose monitoring (CGM) and intermittently scanned CGM (isCGM) systems in type 1 diabetes: position statement of the European Association for the Study of Diabetes (EASD) and of the International Society for Pediatric and Adolescent Diabetes (ISPAD) endorsed by JDRF and supported by the American Diabetes Association (ADA). Diabetologia 2020, 63, 2501–2520. [Google Scholar]
- Woldaregay AZ, Arsand E, Walderhaug S, Albers D, Mamykina L, Botsis T, et al. Data-driven modeling and prediction of blood glucose dynamics: Machine learning applications in type 1 diabetes. Artif Intell Med. 2019, 98, 109–34. [Google Scholar] [CrossRef] [PubMed]
- Gyuk P, Vassányi I, Kósa I. Blood Glucose Level Prediction for Diabetics Based on Nutrition and Insulin Administration Logs Using Personalized Mathematical Models. J Healthc Eng. 2019, 2019, 8605206. [Google Scholar]
- Mathioudakis NN, Everett E, Routh S, Pronovost PJ, Yeh HC, Golden SH, Saria S. Development and validation of a prediction model for insulin-associated hypoglycemia in non-critically ill hospitalized adults. BMJ Open Diabetes Res Care. 2018, 6, e000499. [Google Scholar] [CrossRef]
- Gyuk P, Vassányi I, Kósa I. Blood Glucose Level Prediction for Diabetics Based on Nutrition and Insulin Administration Logs Using Personalized Mathematical Models. J Healthc Eng. 2019, 2019, 8605206. [Google Scholar]
|
Disclaimer/Publisher’s Note: The statements, opinions and data contained in all publications are solely those of the individual author(s) and contributor(s) and not of MDPI and/or the editor(s). MDPI and/or the editor(s) disclaim responsibility for any injury to people or property resulting from any ideas, methods, instructions or products referred to in the content. |
© 2023 by the authors. Licensee MDPI, Basel, Switzerland. This article is an open access article distributed under the terms and conditions of the Creative Commons Attribution (CC BY) license (https://creativecommons.org/licenses/by/4.0/).
