1. Introduction
The growing population with changing consumption patterns in developing countries is causing significant challenges with regards to solid waste management. Each year, the world produces 2.01 billion tons of solid wastes, only 13.5 percent of which is recycled, and more than half is improperly managed [
1]. Among all solid wastes, about 12% or about 241.2 million tons per year are plastic wastes originated mainly from household uses, food packaging and water bottles [
2]. Plastic wastes are particularly problematic, with single-use plastics leaking into the environment, including the marine environment, at an unprecedented rate. A high rate of plasitic consumption with a significant portion of single-use plastics brings many challenges related to land-based plastic pollution to Thailand. Improper waste management system and infrastructure mainly contribute to these plastic pollution. About 428 kton/year of mismanaged plastic wastes enter the environment as a result of inadequate collection of plastic waste and operation of unsanitary disposal facilities [
3]. Due to low collection rate and improper waste disposal, most mismanaged plastic wastes from land-based sources could be transported to become river-based plastic pollution [
3]. These plastic wastes are litterd in aquatic environment zones (e.g. water body and sediment) [
3]. The large plastic wastes can be degradated and fragmented into small sizes called “ microplastics (MPs)” with sizes smaller than 5mm [
4]. The MPs can be distributed and travel along rivers, thus contaminating raw water resources used for producing water supply[
5,
6].
During the recent years, several studies have reported MPs contamination in river water resources and tap water in Thailand [
7,
8,
9,
10,
11,
12]. The study of Chanpiwat & Damrongsiri [
9] reported that about 0.40-2.40 and 0.62-0.68 particles/L MPs were detected in freshwater and tap water samples, respectively, in two water supply systems in Bangkok in which raw water sources are from the Chao Phraya River and Maeklong River. Similarly, about 609 particles/L of the MPs were observed in tap water samples from a conventional water treatment plant [
10]. The possible sources of MPs contamination in the tap water were aniticipated to be from a raw water source and contaminations within the water treatment processes [
10]. The abundance of MPs found in tap water sources can lead to the present of MPs in consumable water or drinking water produced from the tap water sources. An average MPs concentration of 56 particles/L was determined in consumable tap water samples in a university, central Thailand [
11]. Typically, Thai people mostly drink water from both public drinking fountains at public areas (e.g. academic institutions) and commercial bottled water. In addition, because sources of production of both public drinking and bottled water are from tap water, the MPs contamination in drinking water has become an emerging concern in Thailand. Kankanige, D., & Babel, S. [
12] reported that the MPs concentration of 140 ±19 particles/L was found in single-use PET-bottled water. These MPs contamination can pose adverse impacts on human health through consumption of MPs contaminated water.
Due to less efficiency of MPs removal by conventional water treatment systems, the abundance of MPs still present in the treated water at consumption points [
7,
8,
9,
10,
11,
12]. In Thailand, with the conventional water treatment proesses such as screening, coagulation, flocculation and sand filtration, the low MPs removal efficiencies of 27-62.4% were achieved [
7,
8]. However, the MPs removal efficiencies would be varied according to various operational factors and maintenance [
13]. Apart from raw water source monitoring and control including enhancement of removal efficiency of pretreatment or at water treatment plant, post-treatment (e.g. filtration systems) might be applied to minimize human exposure risks at consumption points. With respect to the above issues, this paper investigated MPs contamination of tap and drinking water in public areas (some academic institutions) in central Thailand and analyzed potential health risks, including recommendations for health impact minimization.
2. Materials and Methods
2.1. Sample collection
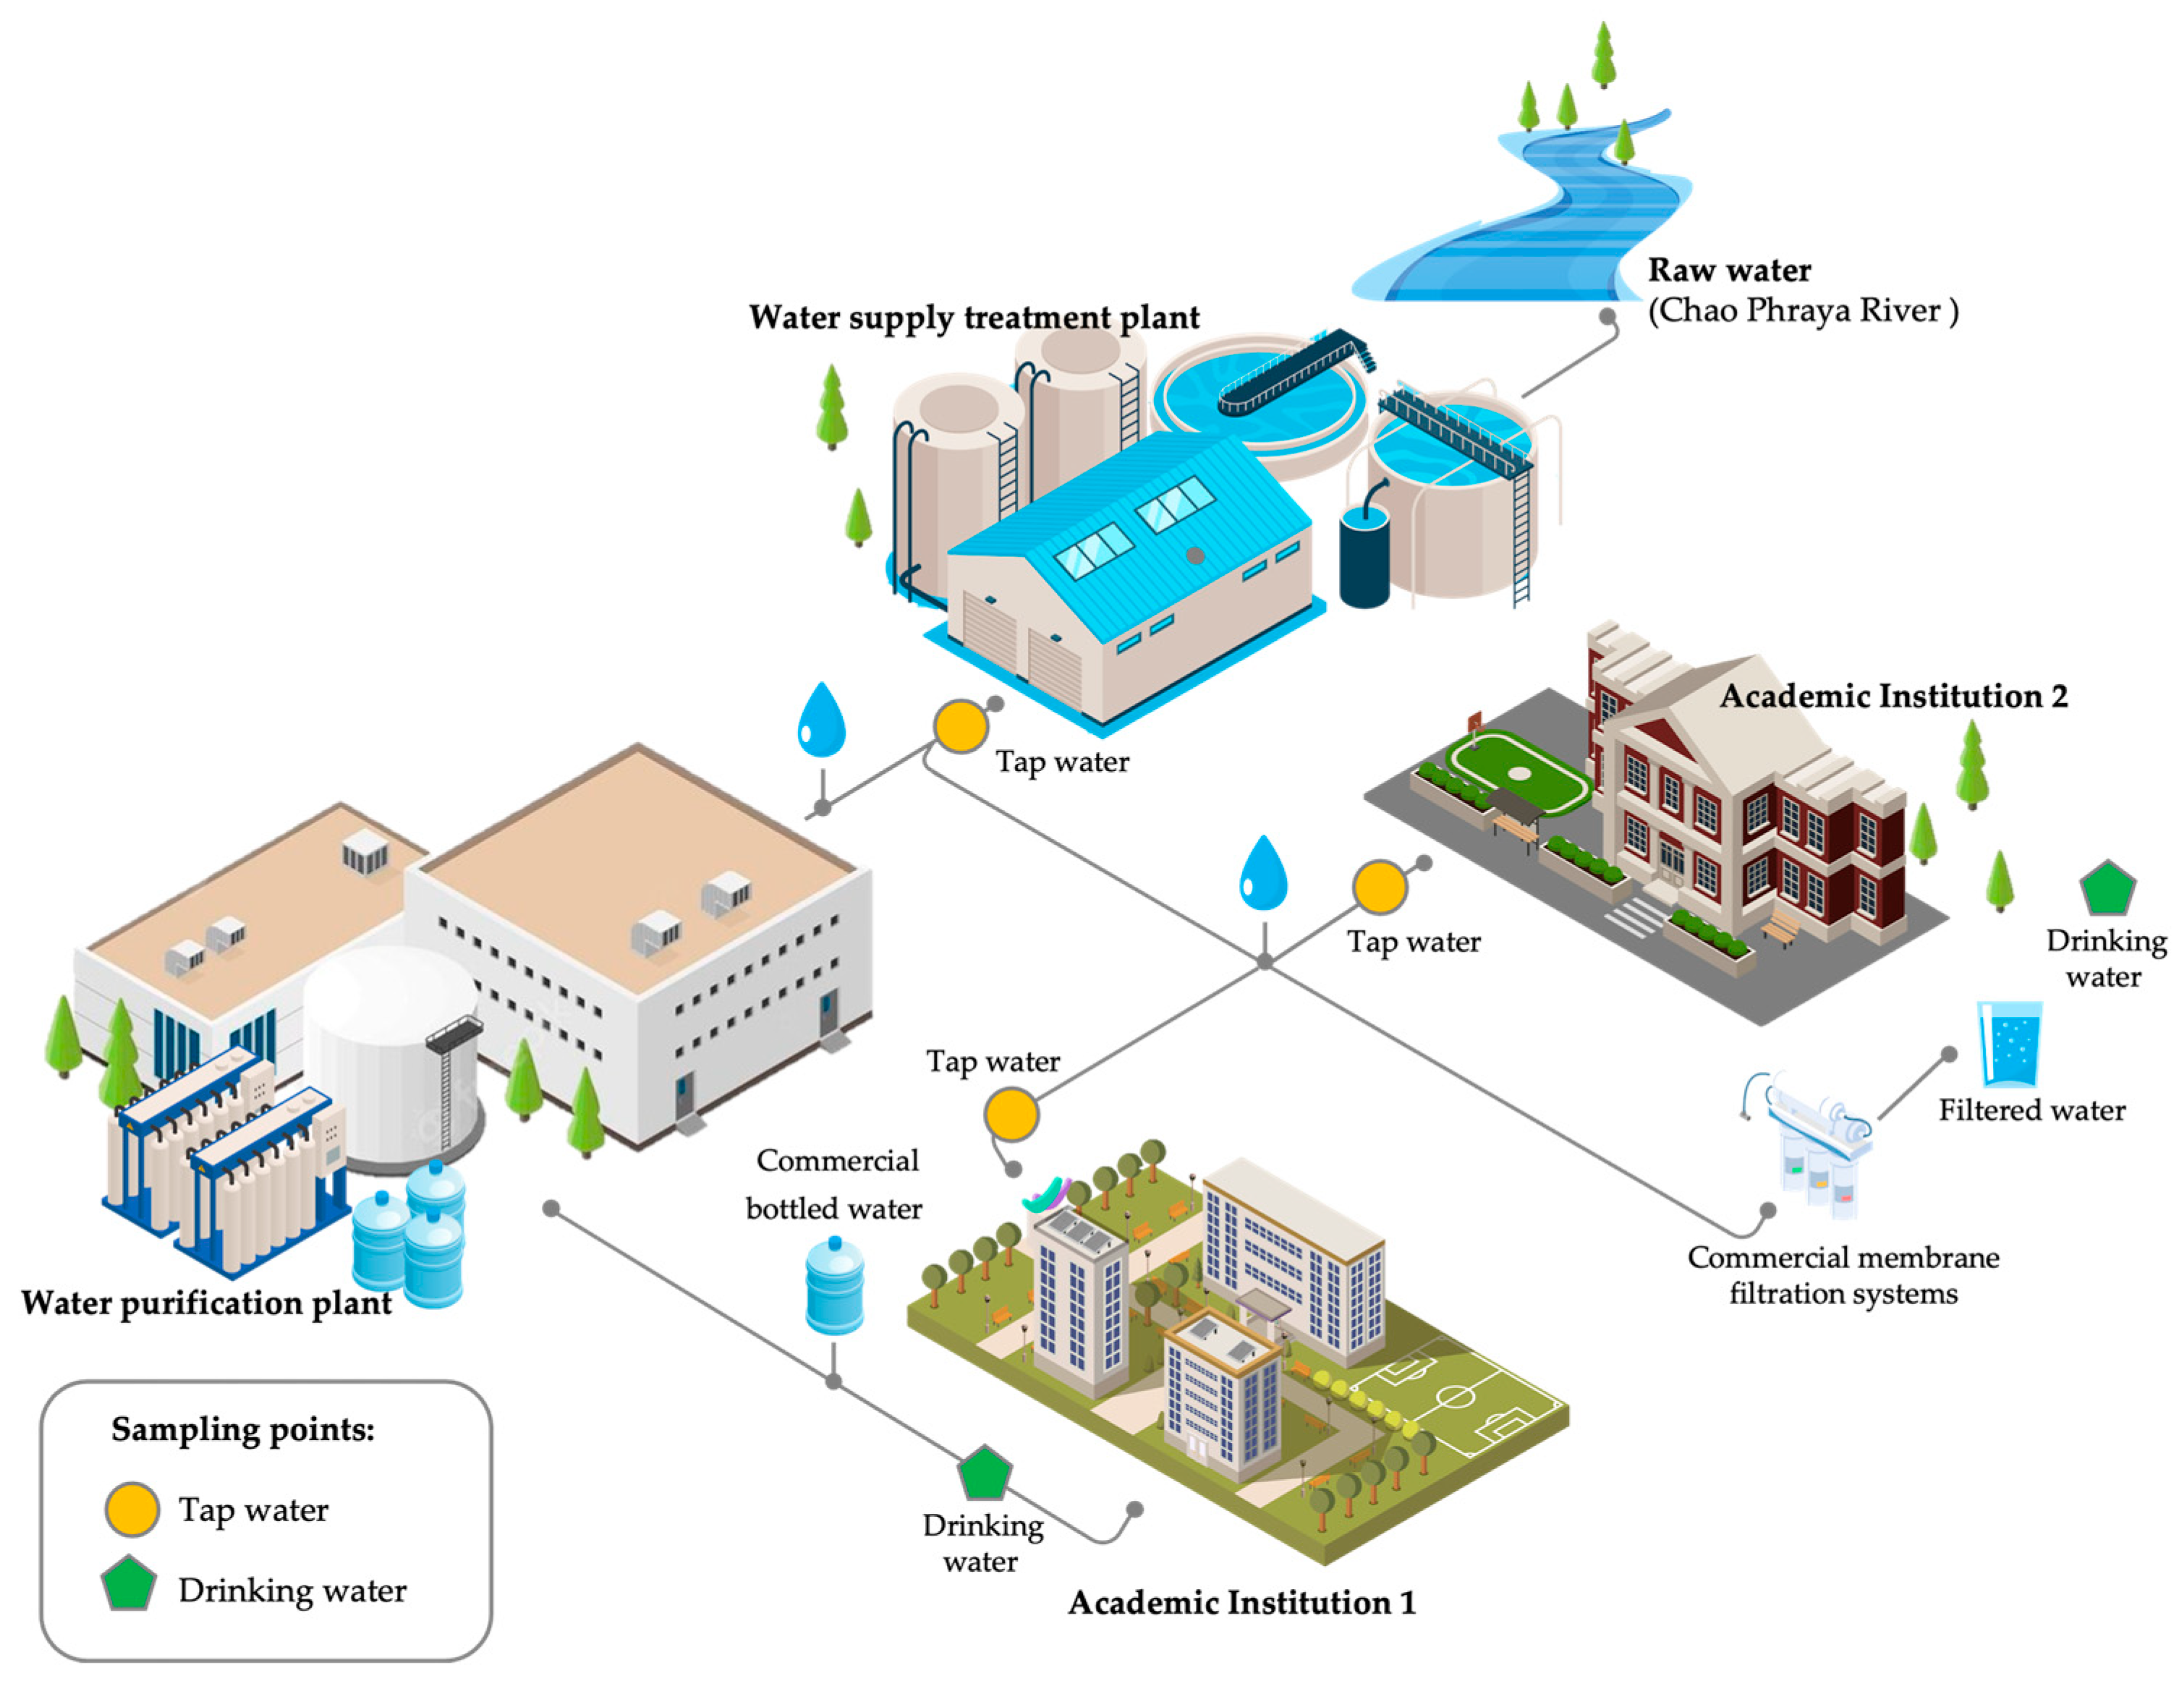
Tap water samples were collected from the water supply treatment plant where raw water was from the Chao Phraya River, and two adjacent academic institutions located in the Pathumthani province, near Bangkok, Thailand (
Figure A1 in
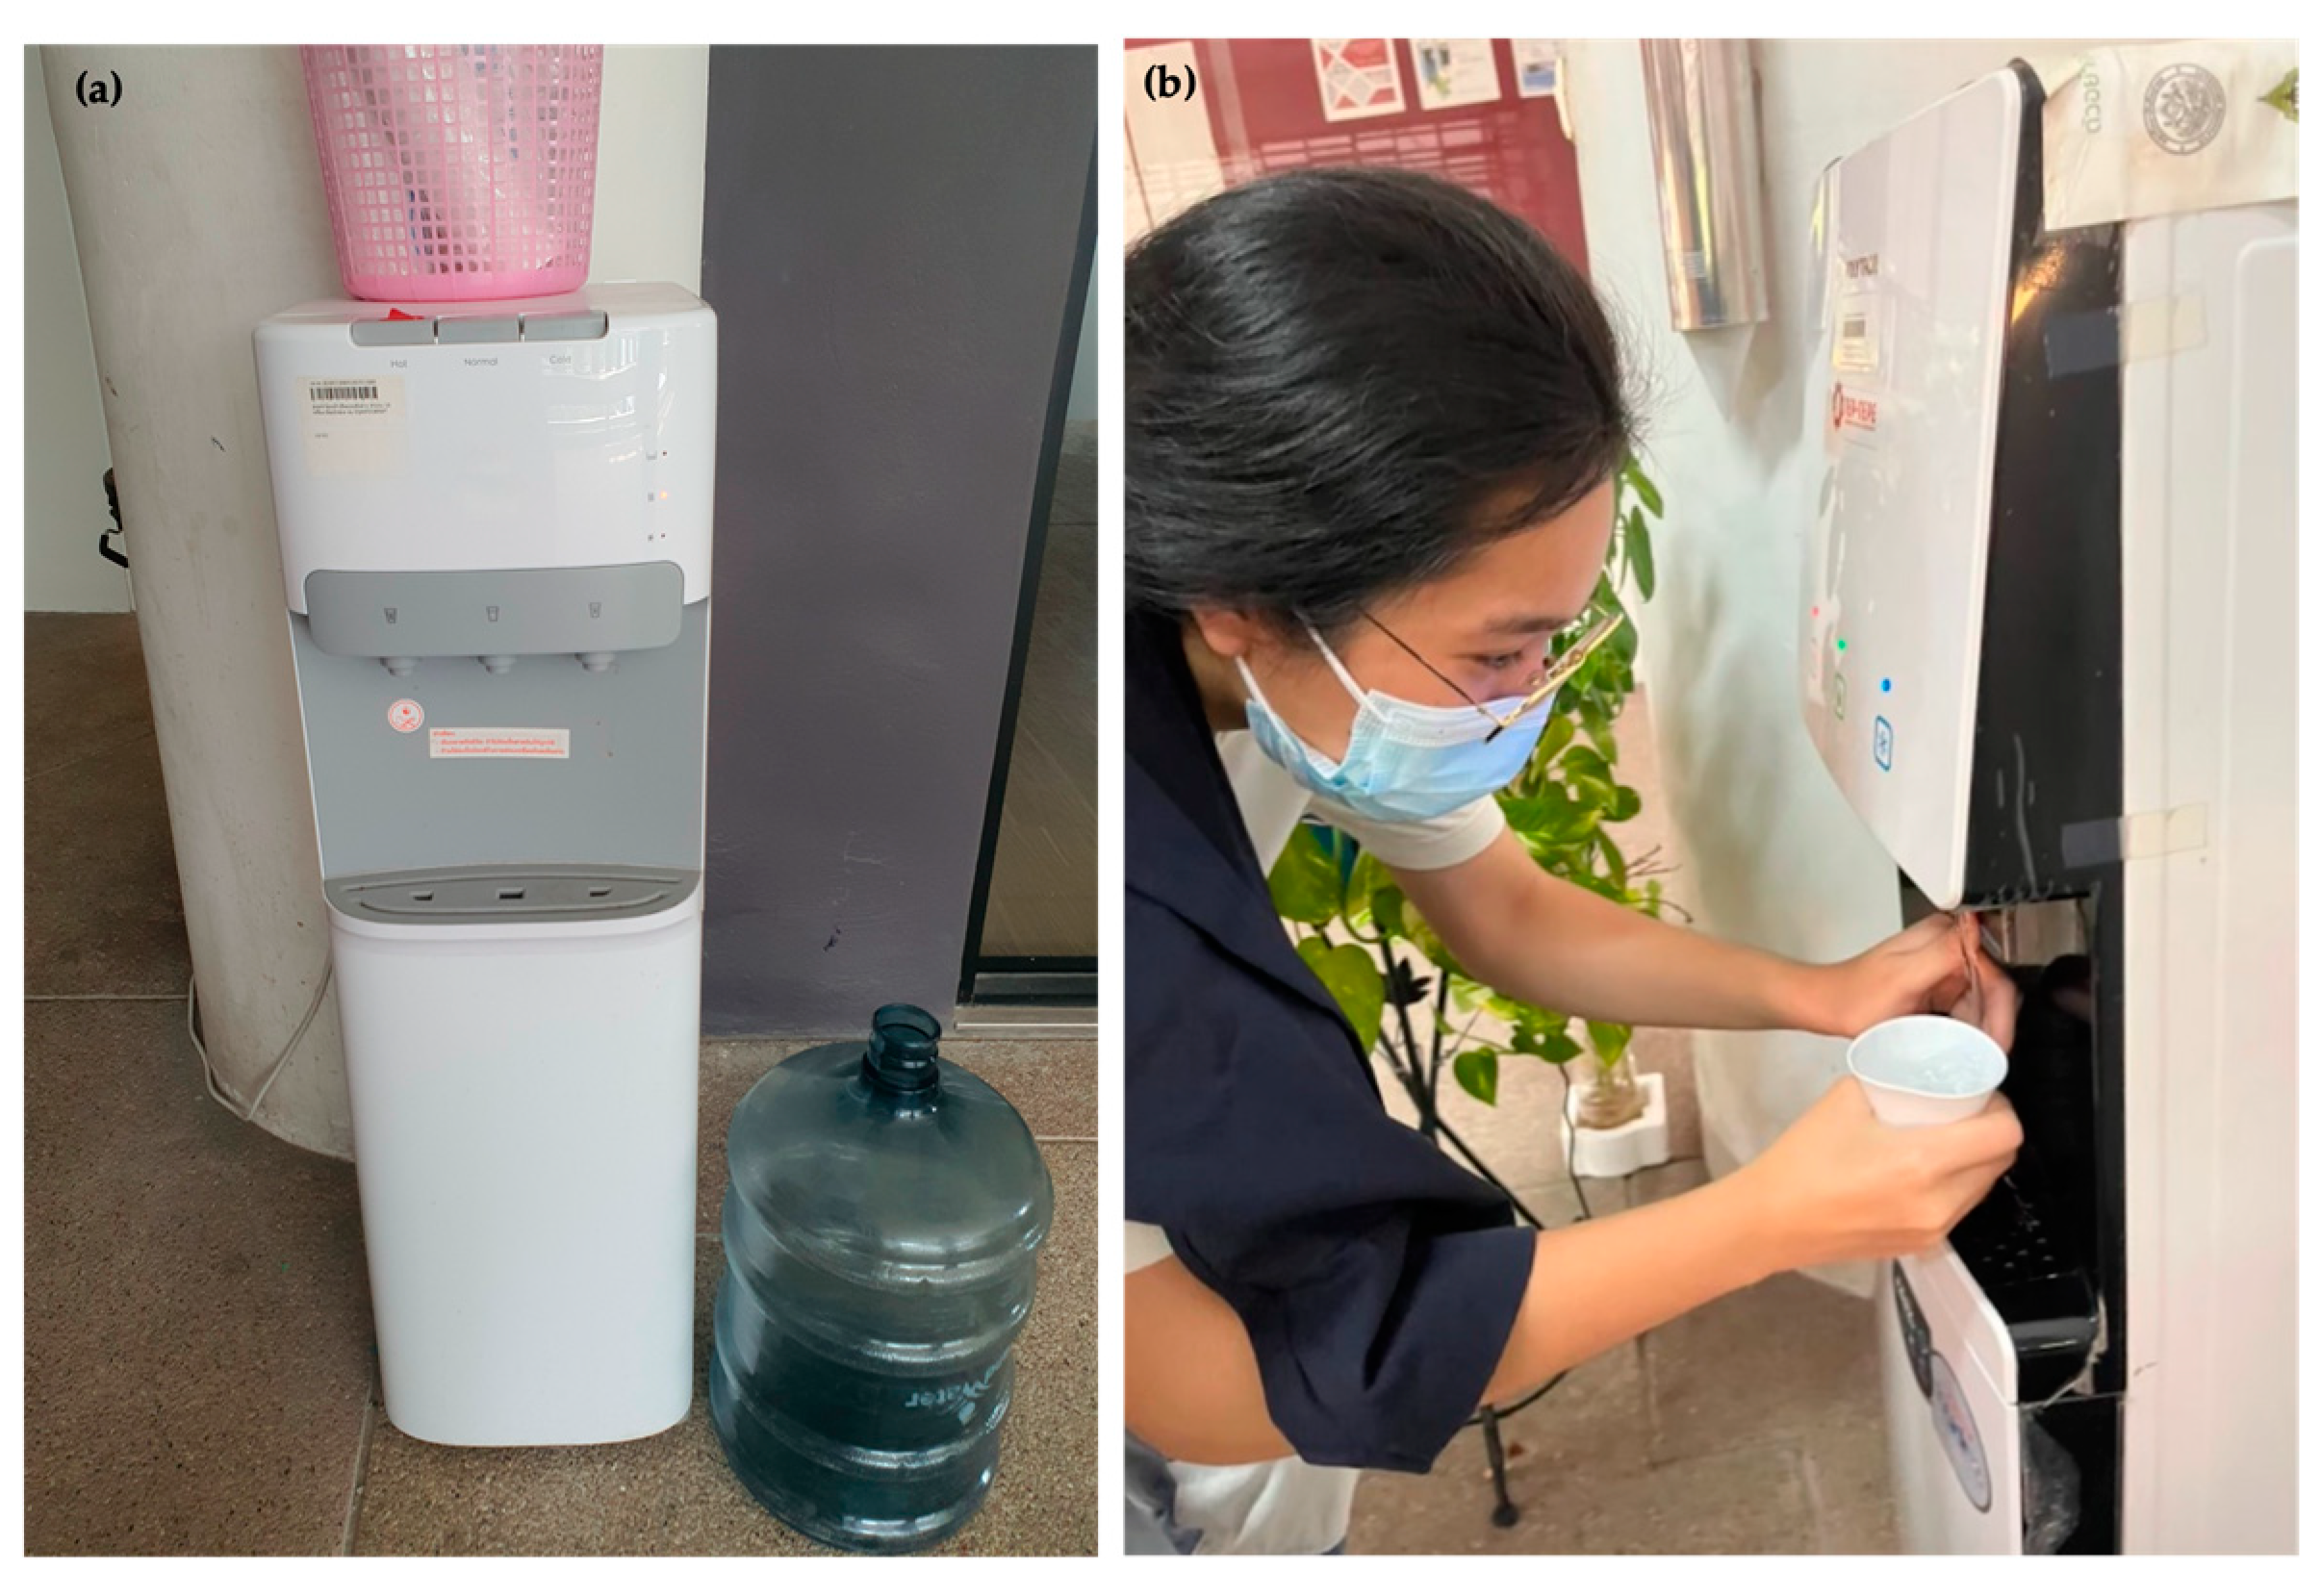
Appendix A). The distance between the water supply treatment plant and the academic institutions is about 10 kilometres. The tap water samples were collected from six and two public taps in Academic Institutions 1 and 2, respectively. In addition, in Academic Institutions 1, drinking water samples were collected from five commercial bottled waters ( each with a volume of 20 L) produced from a nearby water purification plant (
Figure A2a in
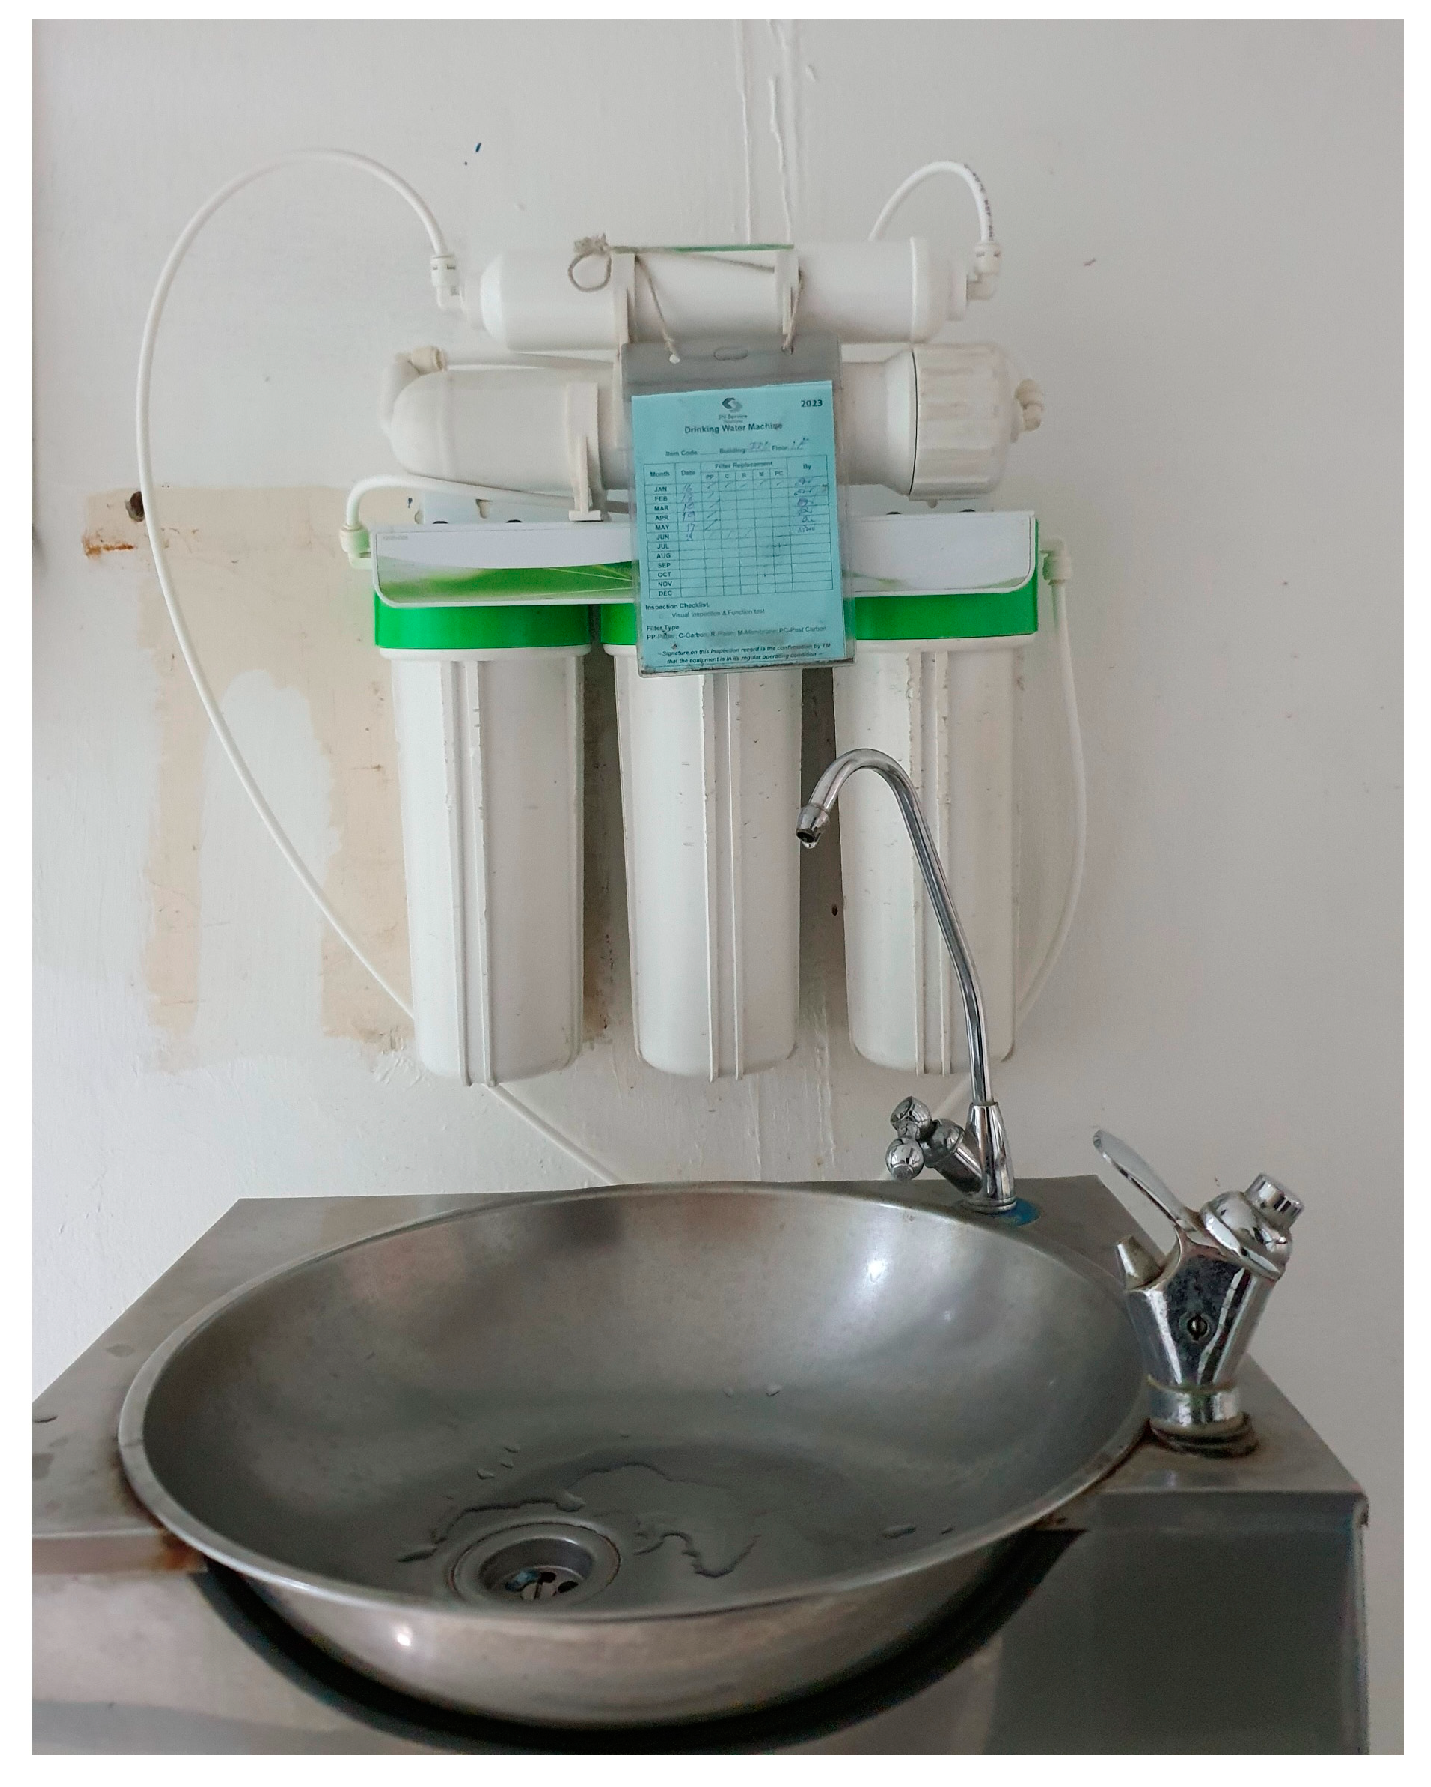
Appendix A). In Academic Institution 2, filtered water from two commercial membrane filtration systems (
Figure A3 in
Appendix A) were collected for MPs analysis. Composite sampling was conducted using a cleaned wide-mouth glass bottle (250 mL) covered with aluminium foil and a stainless steel cap prior to analysis in the laboratory. All sampling points are located in Pathumthani province, central Thailand and the water samplings were conducted during January - March 2022.
2.2. Pretreatment and analysis
The collected water samples were filtered with a 0.45 µm cellulose nitrate (CN) membrane by using a vacumn pump, then minimally rinsed with ultrapure water to ensure all residues were transferred. The filtered CN membranes were placed in clean petri dishes and pretreated by using nile red-fluorescence staining techniques. The nile red stock solotion of 1 mg/mL was prepared in methanol and applied to cover overall area of each CN membrane to a working concentration of 10 µg/mL [
9,
10,
14,
15]. Each membrane was incubated in oven at 30°C for 30 minutes and dried at room temperature for 24 hours prior to detection of MPs abundance (number and shape).
2.3. Analysis
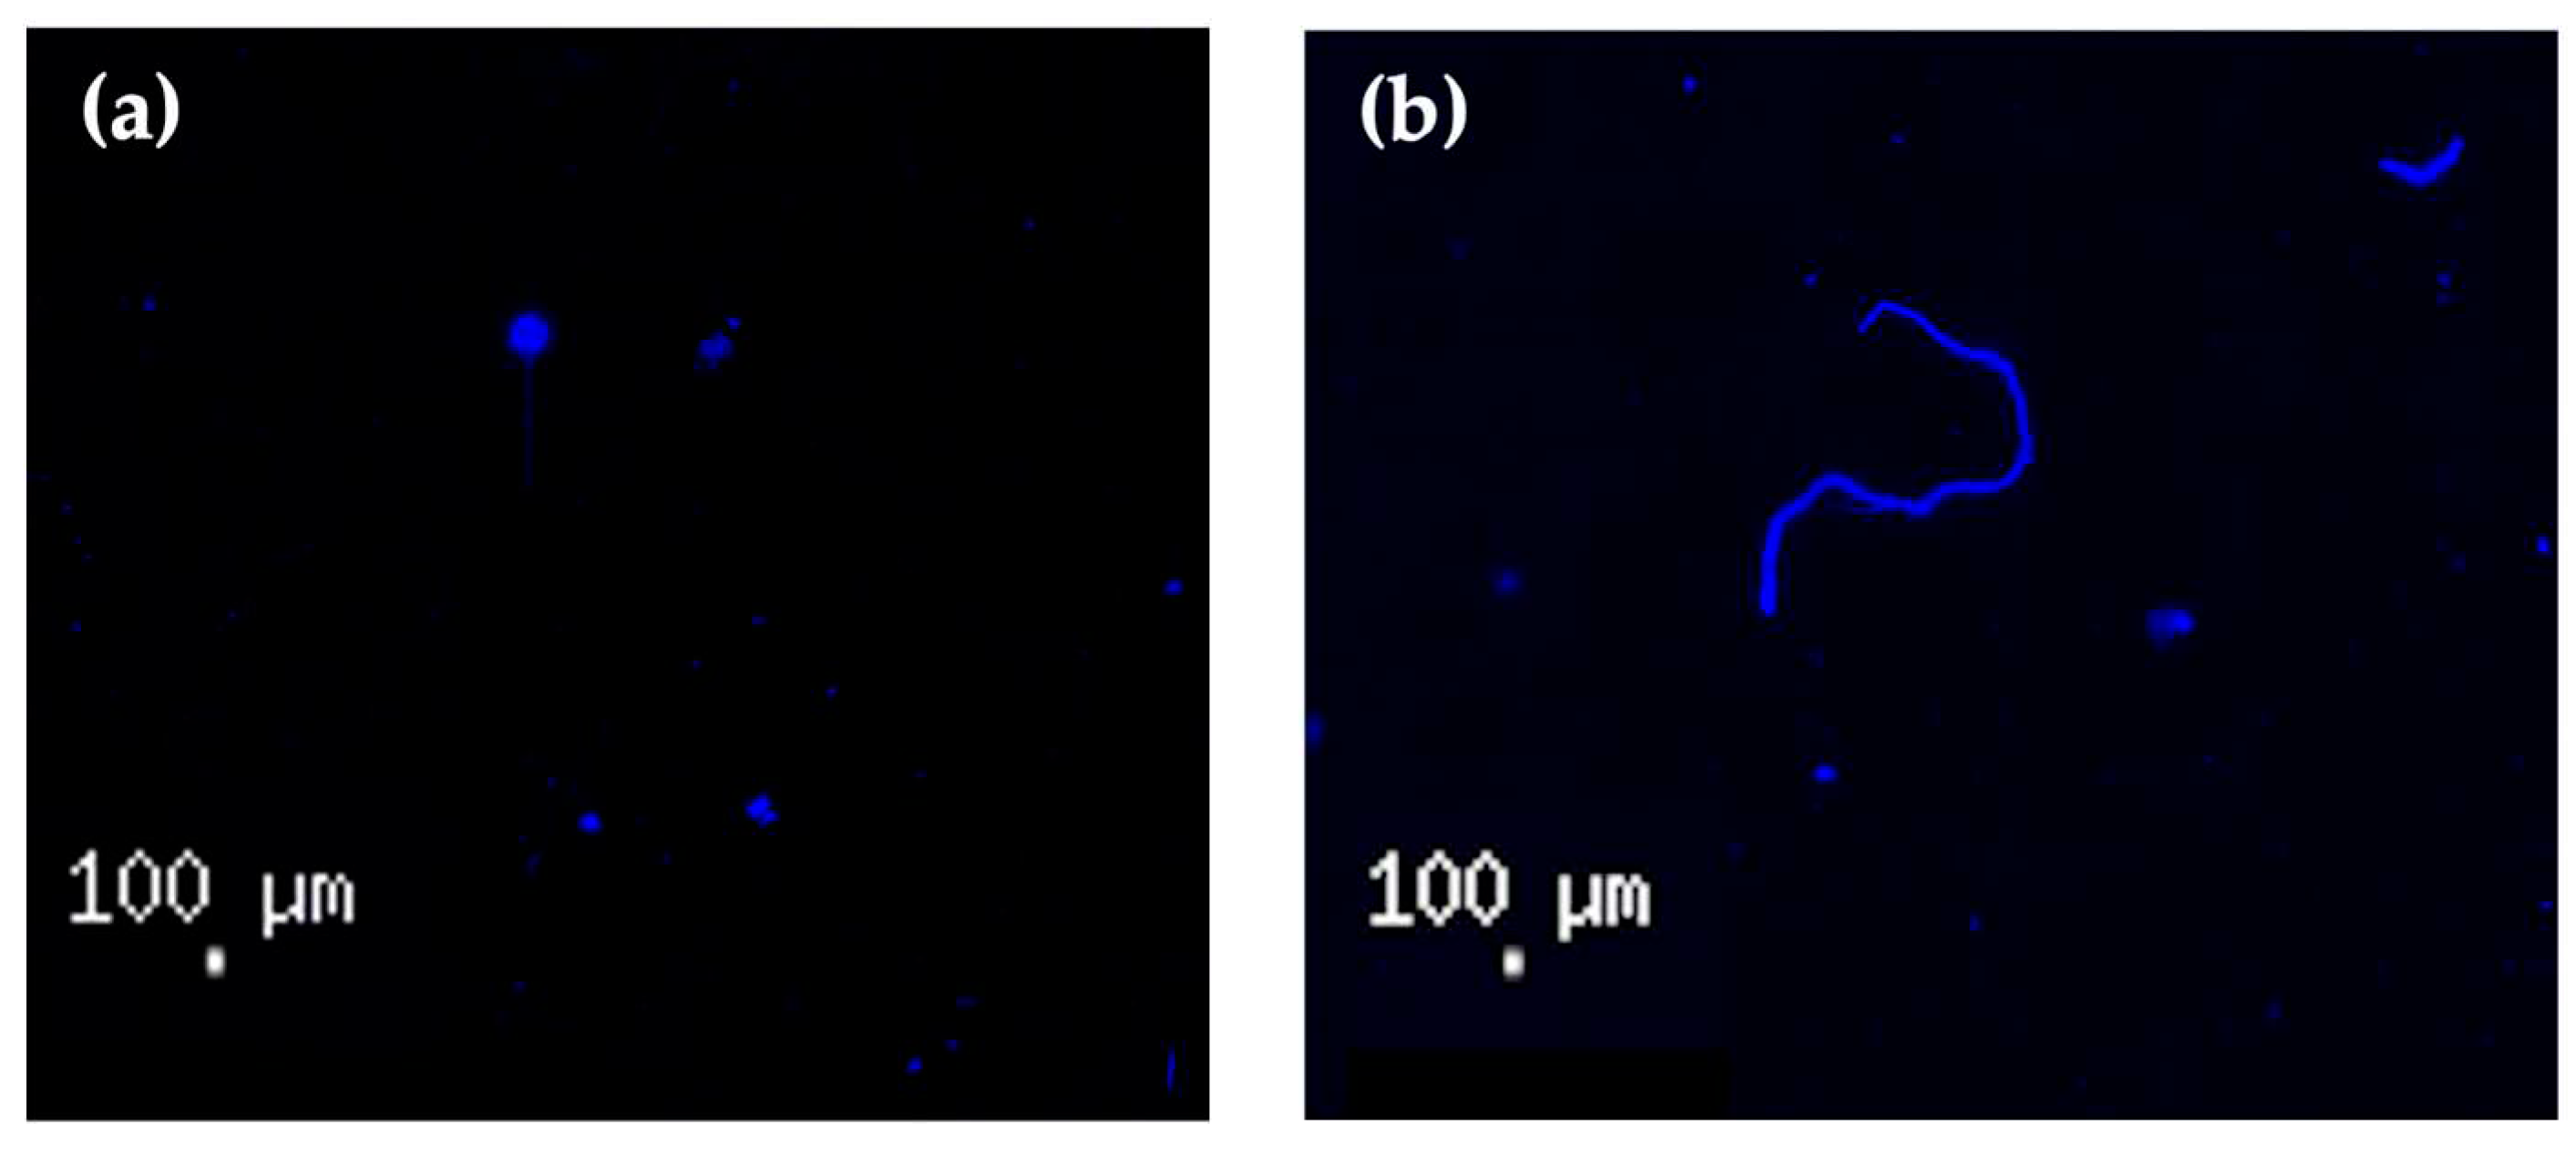
Each dried membrane was visually captured under a fluorescence microscope (DeltaVisionTM Elite cell Imaging System, 4X magnification, DV Elite, GE HEALTHCARE, USA) for determination of MPs abundance, shape and size. The strained MPs were performed as blue-fluorescence particles images. All of the observed MPs were visually counted for their abundance (particles per L of sample, part/L) and determined for their size and shape. The overall dimension of MPs was measured based on length according to five categories: <50 µm, 51-100 µm, 101-200 µm, 201-300 µm, >301 µm. In addition, MPs shapes were sorted to fragments (similar width and length) and fibers (length longer than width) (
Figure A4a,b in
Appendix A) [
11].
2.4. Contamination prevention
To minimiize cross contamination, all sample preparation and analysis steps were conducted in a clean and separated analytical room. The blank samples of the ultrapure water were proceeded in a similar step to correct contamination during sample preparation steps. In addition, clean and dried personal protective equipment such cotton lab coats and latex gloves were applied during the sample analysis. All equipment and glassware were rinsed in triplicates with ultrapure water before use.
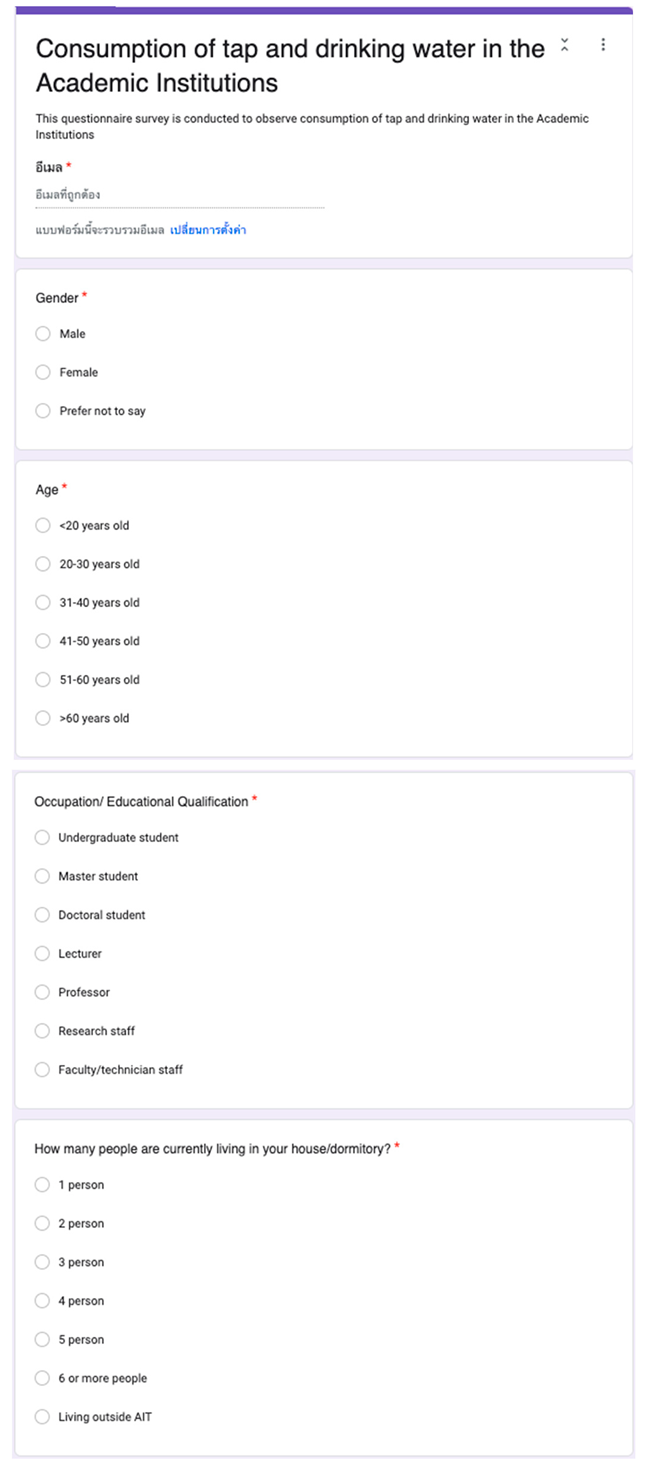
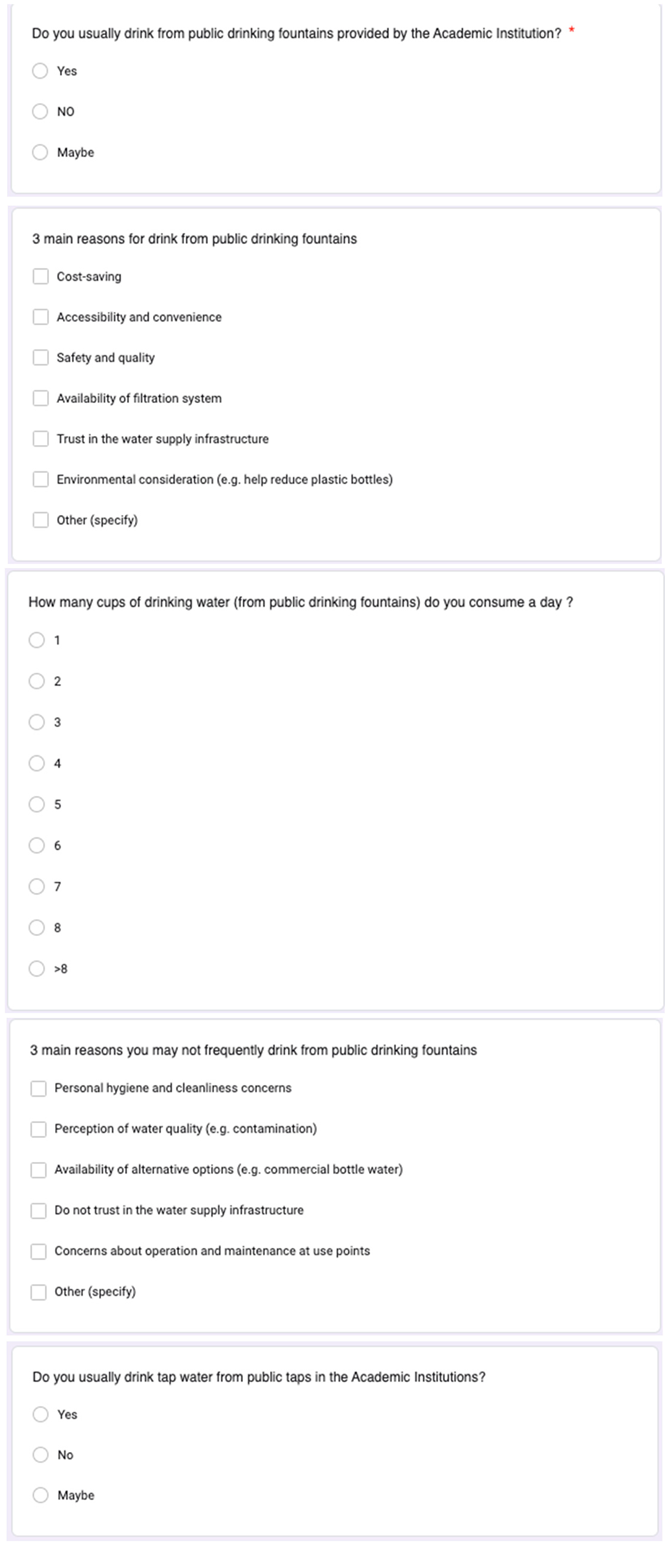
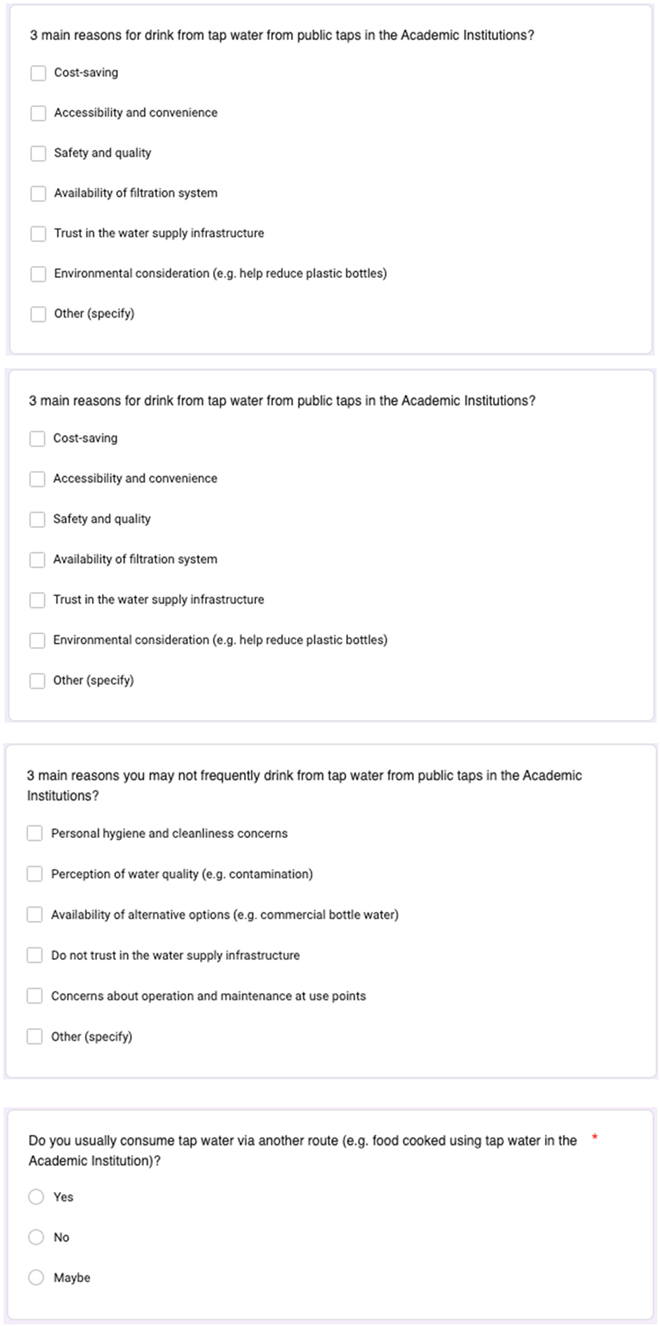
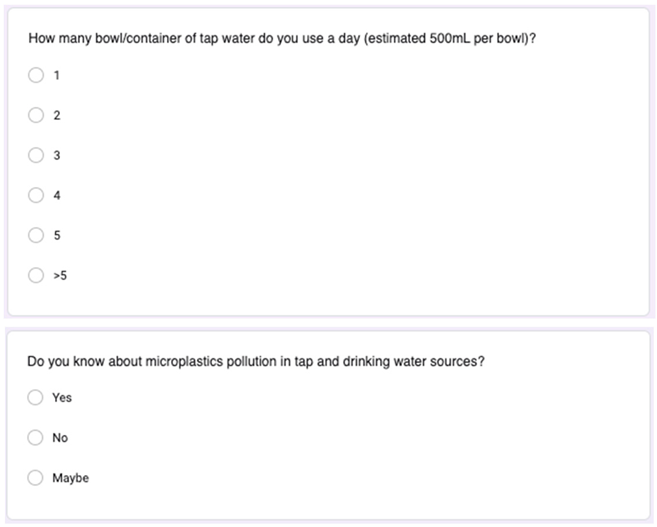
2.5. Questionaire suvey
A questionnaire survey was conducted to observe consumption behaviors of personnel who consumed tap and drinking water in the 2 Academic Institutions. An online questionnaire was completed by 143 users which covered 2 main aspects: 1) demographic data such as gender, age, and occupation or educational qualification and 2) consumption behaviors which involved five main questions: 1) Do you usually drink from public drinking fountains provided by the Academic Institutions?, 2) How many cups (size of 100mL each) of drinking water do you consume per day? (
Figure A1b in
Appendix A), 3) Do you usually drink tap water from public taps in the Academic Institutions?, 4) Do you usually consume tap water via other routes (e.g. food cooked using tap water in the Academic Institutions)?, and 5) How many bowls (size of 500mL each) of tap water do you use in cooking at dormitories per day? The results of the questionnaire survey were used to calculate MPs intakes and exposure loadings, as well as evaluating the potential health impacts of MPs.
2.6. MPs removal efficiency
The MPs removal efficiency (%) of the commercial membrane filtration systems of the Academic Institution 2 was calculated by Equation (1). The MPs concentrations (C
MPs) in the tap water (influent) and the drinking water (effluent) after the filtration processes were used in the calculation [
11,
12].
2.7. Estimated daily intake of MPs
The MPs daily intake was determined to evaluate the MPs ingestion loading for humans through drinking water and food prepared from drinking water. The estimated daily intake of MPs (EDI
MPs) was calculated using Equation (2) [
16,
17] according to the data of MPs abundance and daily drinking water and food consumption. MPs concentrations in drinking water (C
MPs, particles/L) detected in the Academic Institutions and the ingestion rate (IR, L/(person-d)) which was the daily consumption volume of drinking water or volume of water used in food preparation, summarised from the results of the questionnaire survey were used in calculating EDI
MPs.
3. Results and Discussion
3.1. MPs abundance, shapes and size distribution
Table 1 illustrates the MPs abundance observed in the tap water samples collectd from the water supply treatment plant and the Acadenic Instituttions 1 and 2. The average MPs concentrations of 274 ±71, 270 ±109 and 386 ±102 particles/L were found in the tap water samples collected from the water supply treatment plant, the Acadenic Instituttion 1 and 2, respectively. The presence of high MPs concentrations in the treated water (tap water) at the water supply treatment plant (274 ±71 particles/L) was due mainly to the MPs contamination in the river raw water source [
9,
10,
11,
13] and the inefficiency of the water supply treatment plant to remove MPs. Conventional water supply treatment plants in central Thailand were found to be less efficient in MPs removal (27-62.4%) from freshwater source [
9,
10]. During water supply distribution, these MPs could be partially trapped along the distribution pipes, resulting in the average MPs concentration of 270 ±109 particles/L remaining in the tap water samples collected from the Acadenic Instituttion 1. Due to the long operation period (more than 51 years) of the Academic Institution 2, there could be deterioration of the pipelines which contributed to the higher MPs concentration of 386 ±102 particles/L in the tap water samples. The commercial membrane filtration systems in the Academic Institution 2 were able to further reduce the MPs in the drinking water to be 122 ±60 particles/L (or, according to Equation (1), about 70% removal efficiency), more effective than the filtered tap water or drinking water of the Acadenic Instituttion 1 whose MPs concentrations were 211 ±70 particles/L (or, according to Equation (1), about 22% removal efficiency).
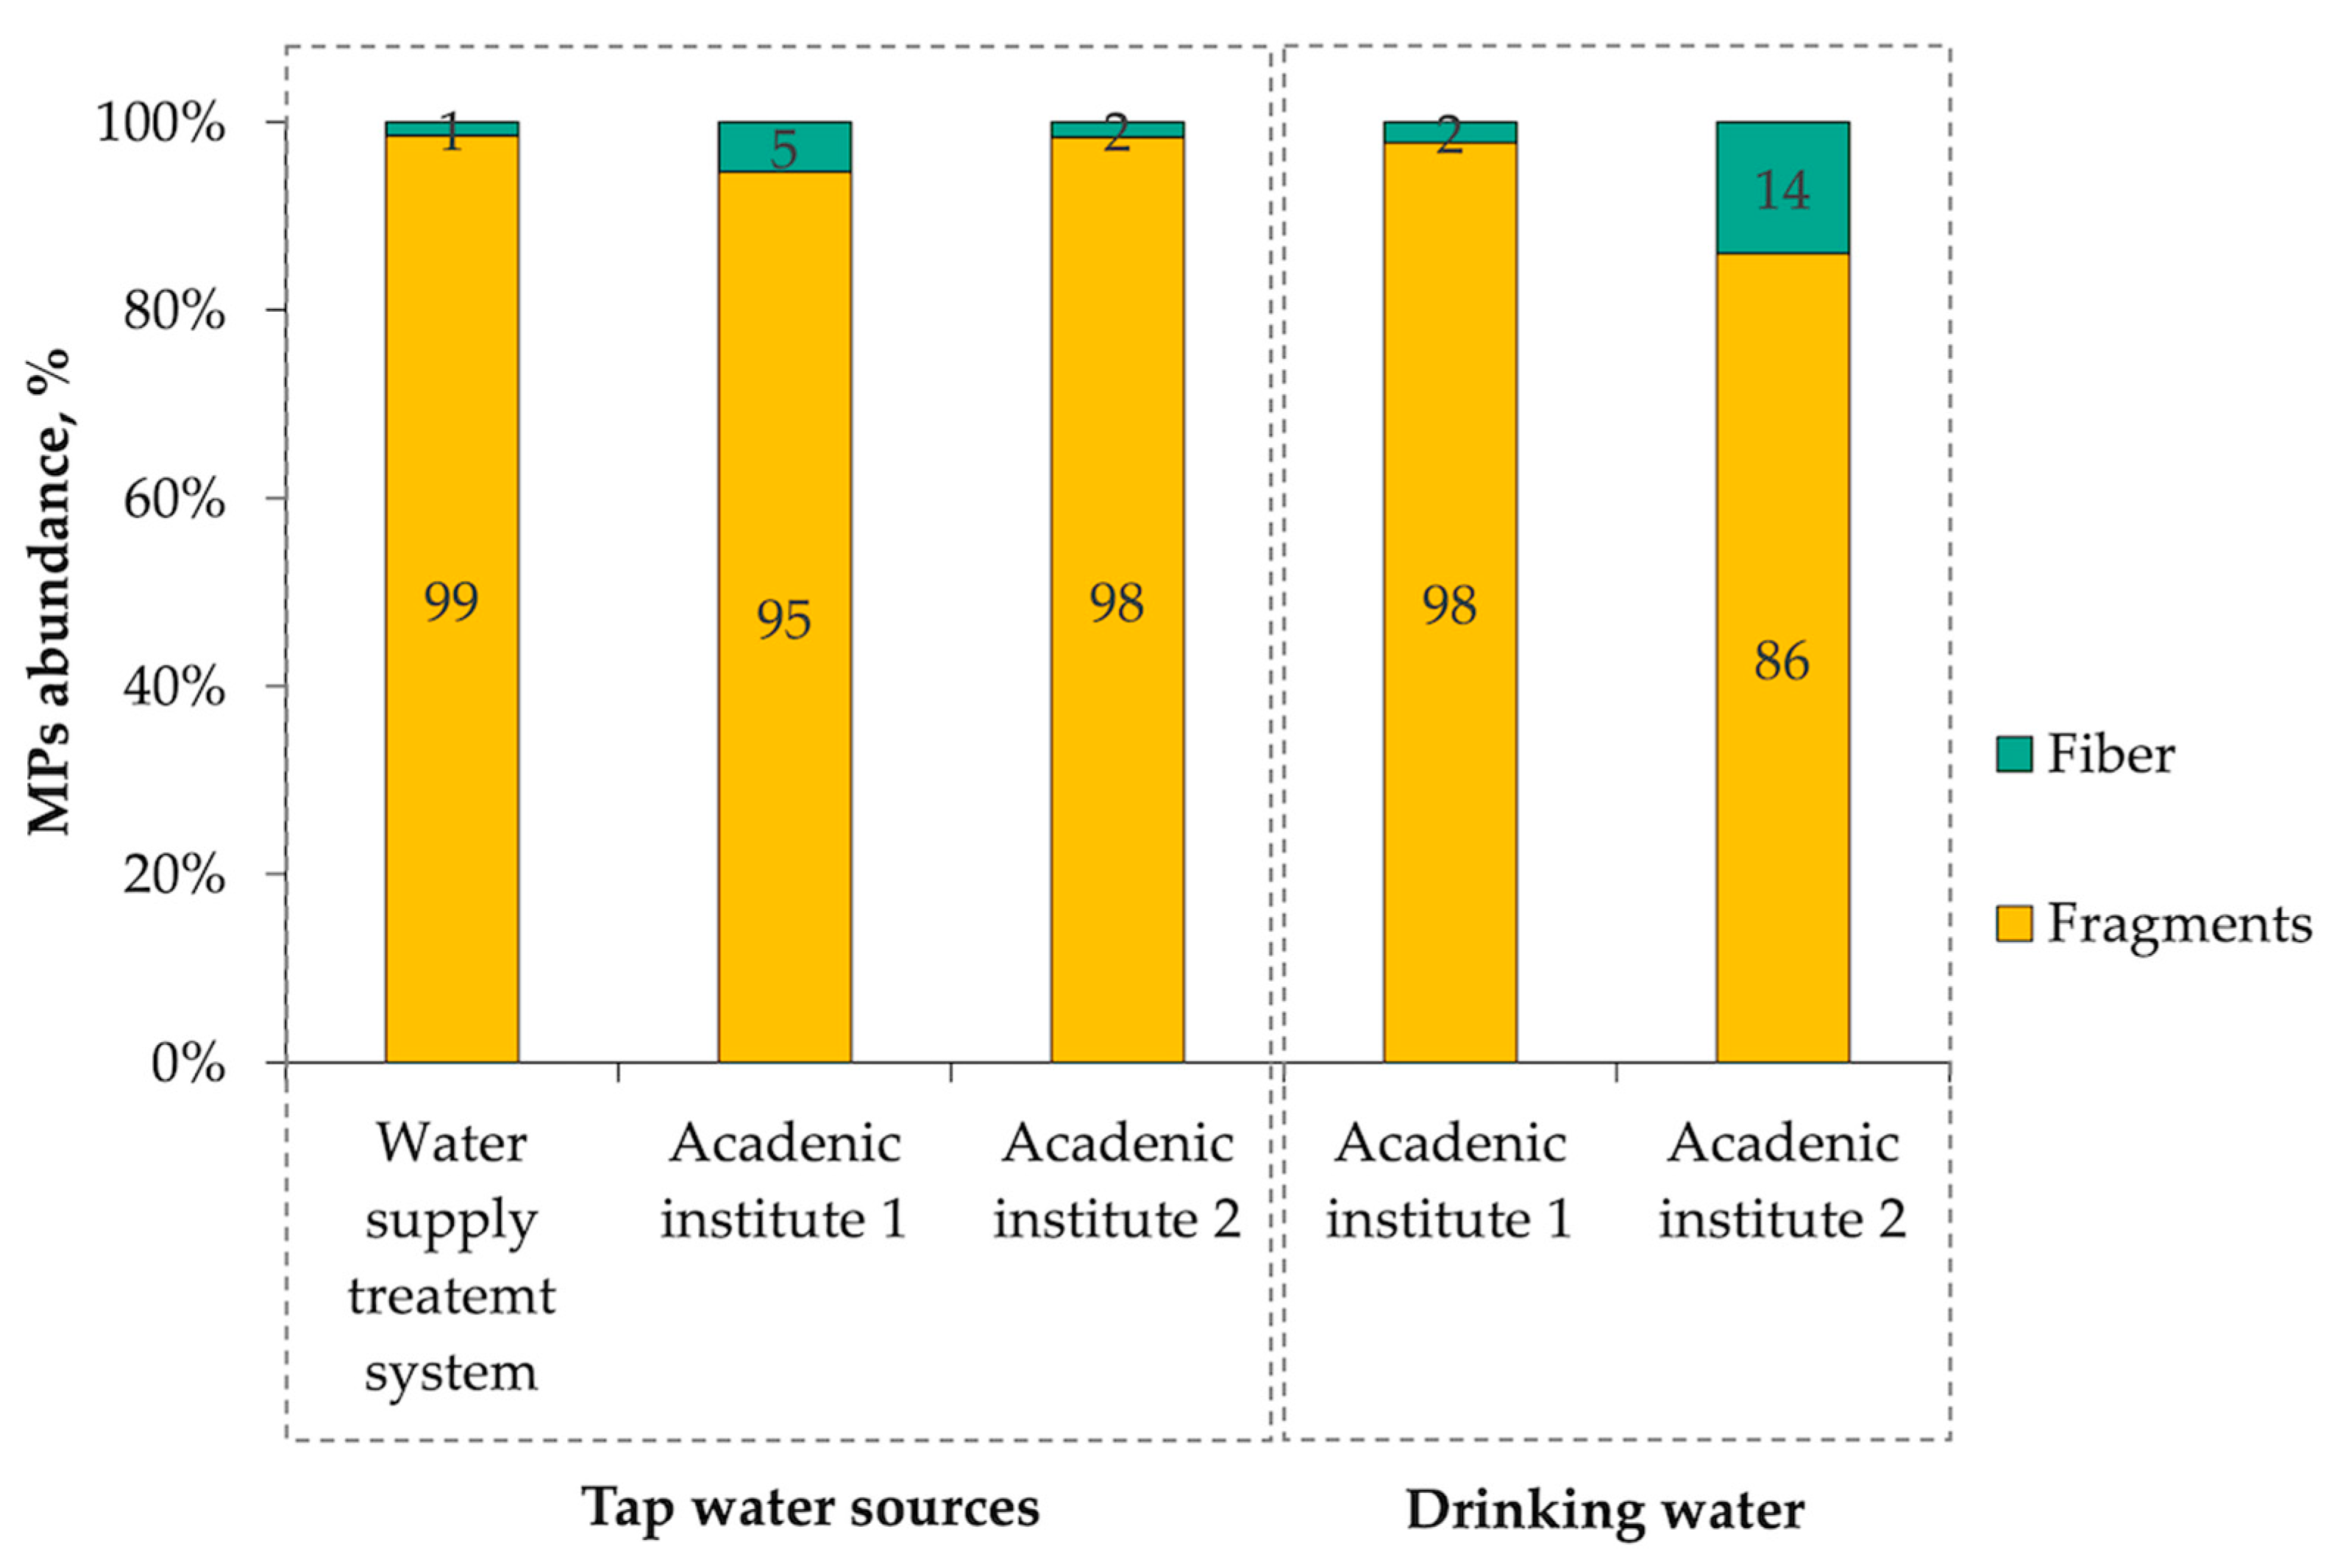
Figure 1 shows the shapes of MPs found in the tap and drinking water sources in which 86-99% were fragments (with sizes less than 200 µm,
Figure 2) and the remaining were fiber (sizes larger than 200 µm). These fragments MPs could originated from the raw water sources [9.] and some of them could result from fragmentation of fiber or larger MPs during water supply treatement processes and their inefficiency in MPs removal [
9,
10,
18].
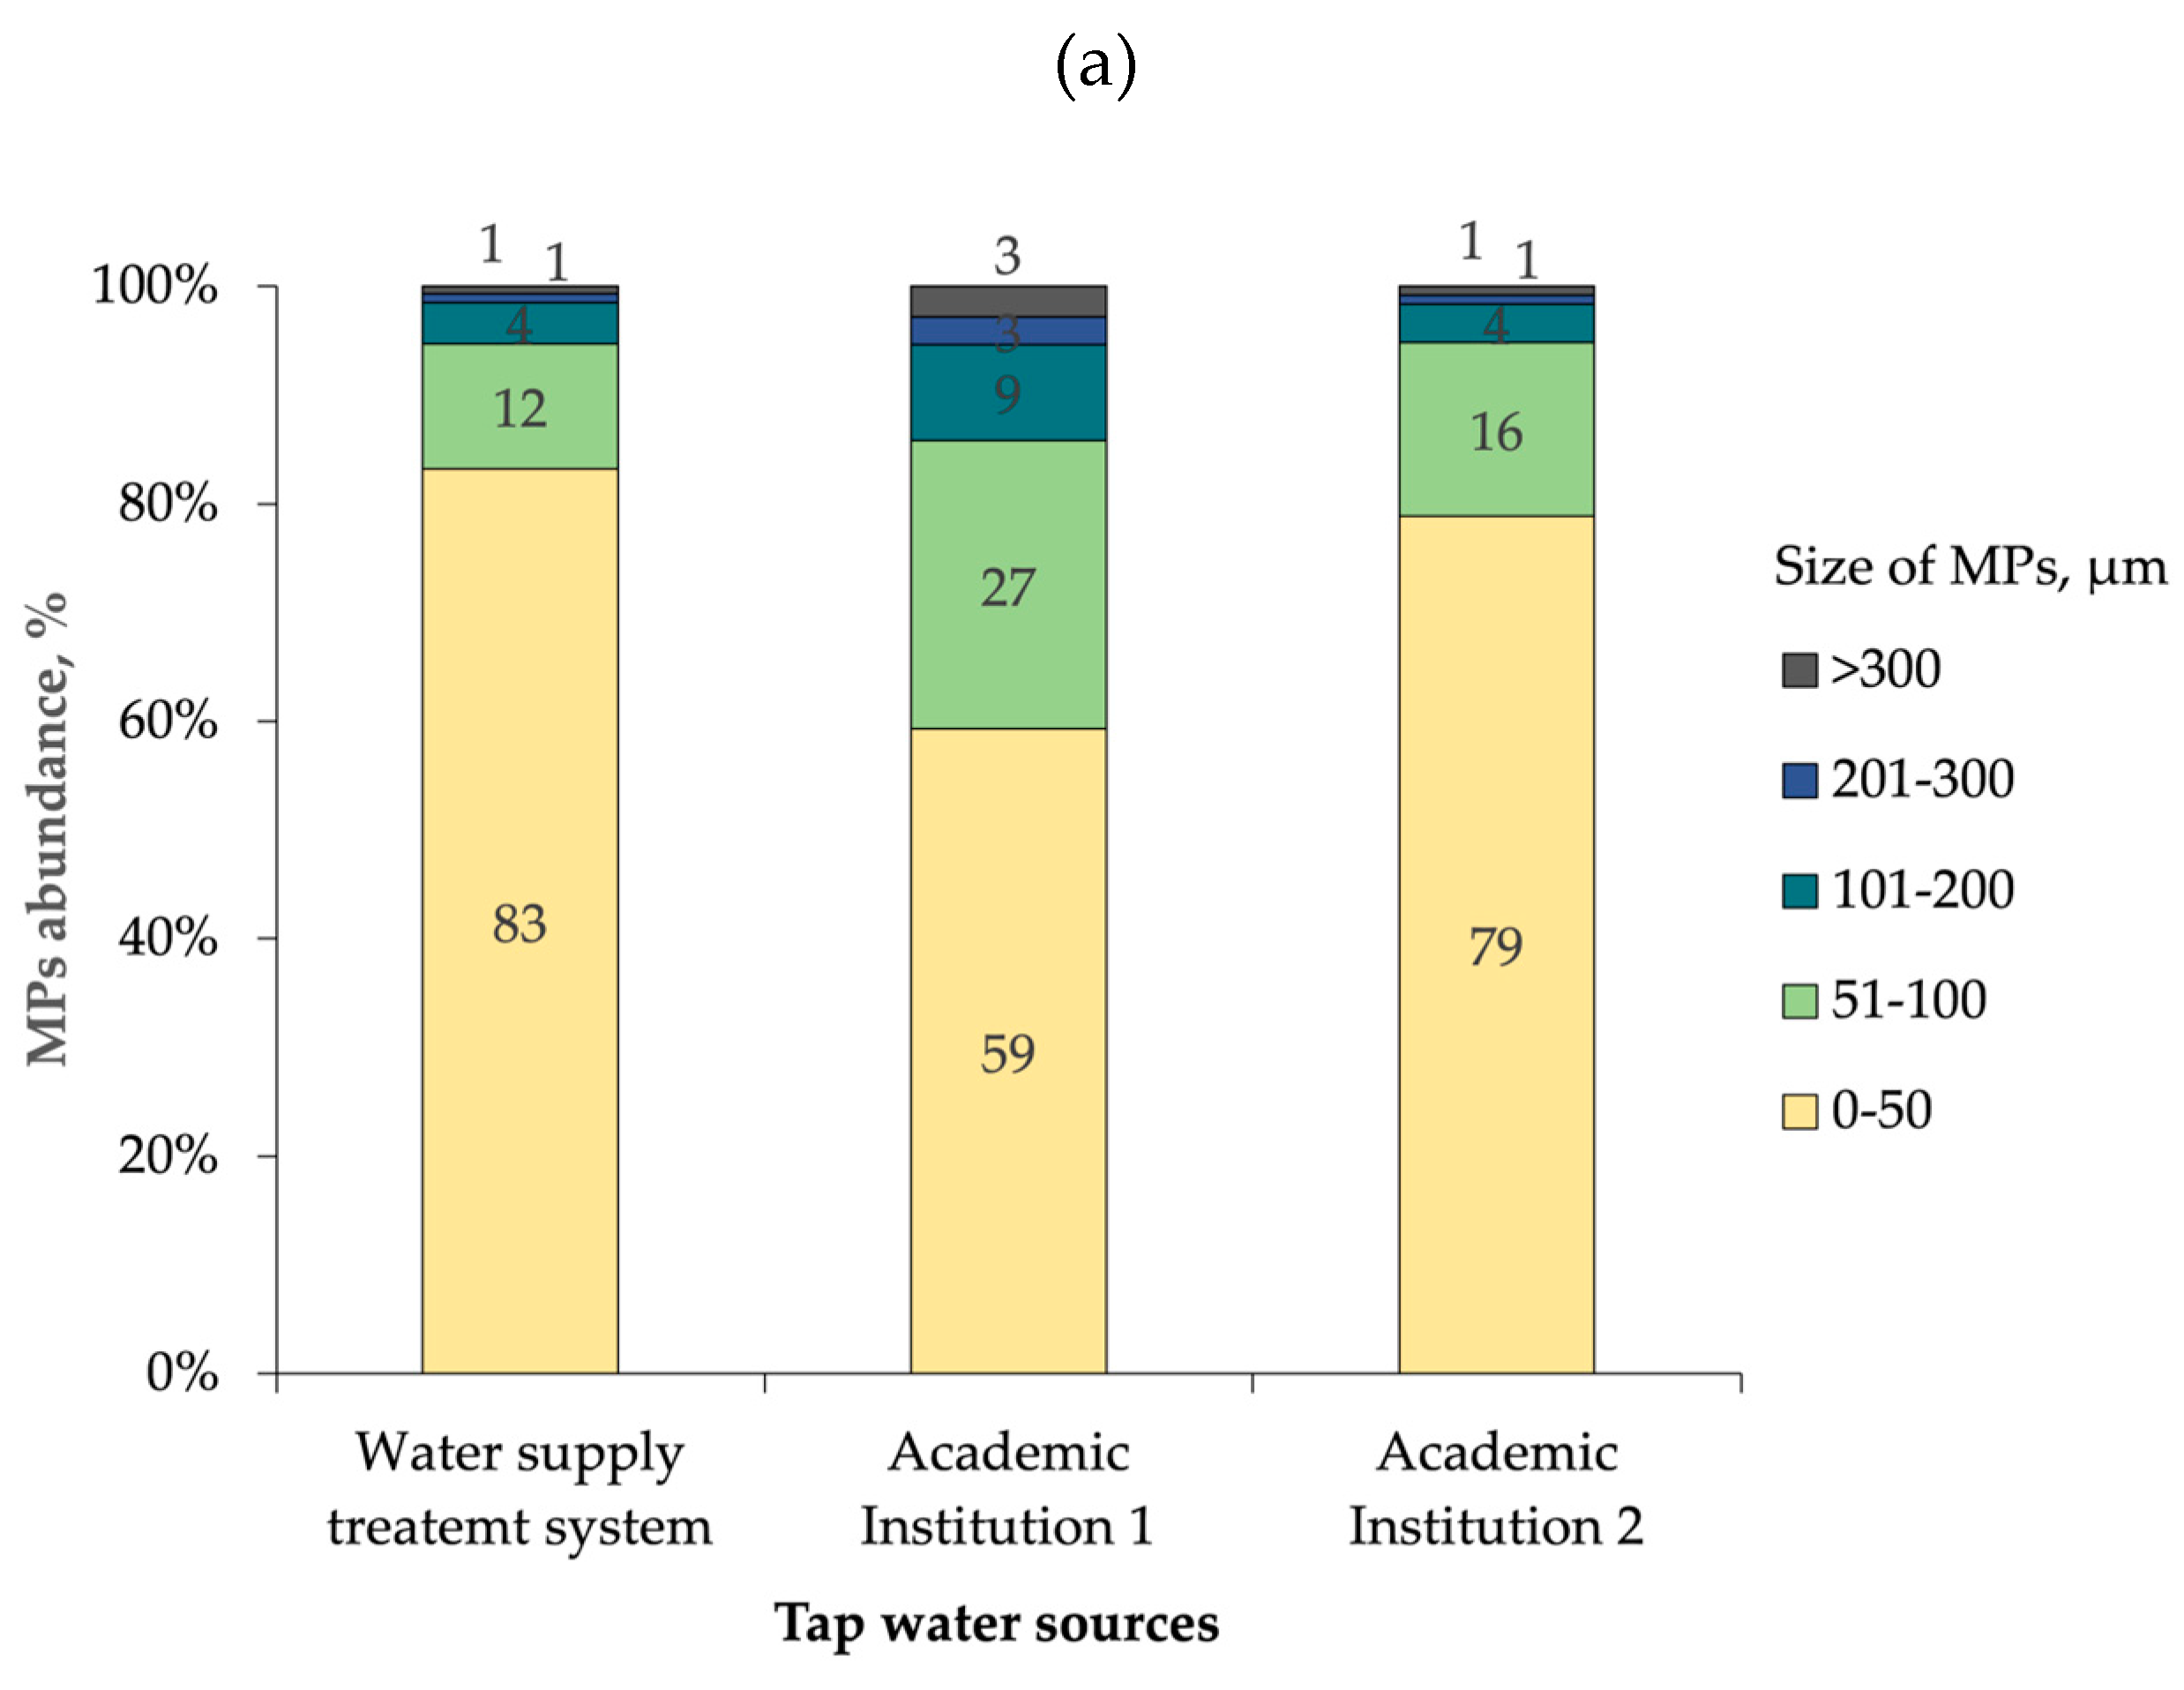
Figure 2a shows the MPs size distribution in the tap water samples collected at the water supply treatement system and the Academic Institutions 1 and 2. The MPs abundance was mainly in the sizes of 0-50 µm in all tap water samples, while larger sizes were present in less abundance. Similarly, the study by Kankanige and Babel [
10,
11] reported that the MP sizes ranged from 6.5-53 µm were found to be predominant in raw water, effluent of a water supply treatment plant and treated drinking water samples. These data indicated that conventional water treatment plant processes employing coagulation, flocculation and sand filtration being used at the water supply treatment plant were not effective in removing MPs containing in the raw water sources [
9,
18].
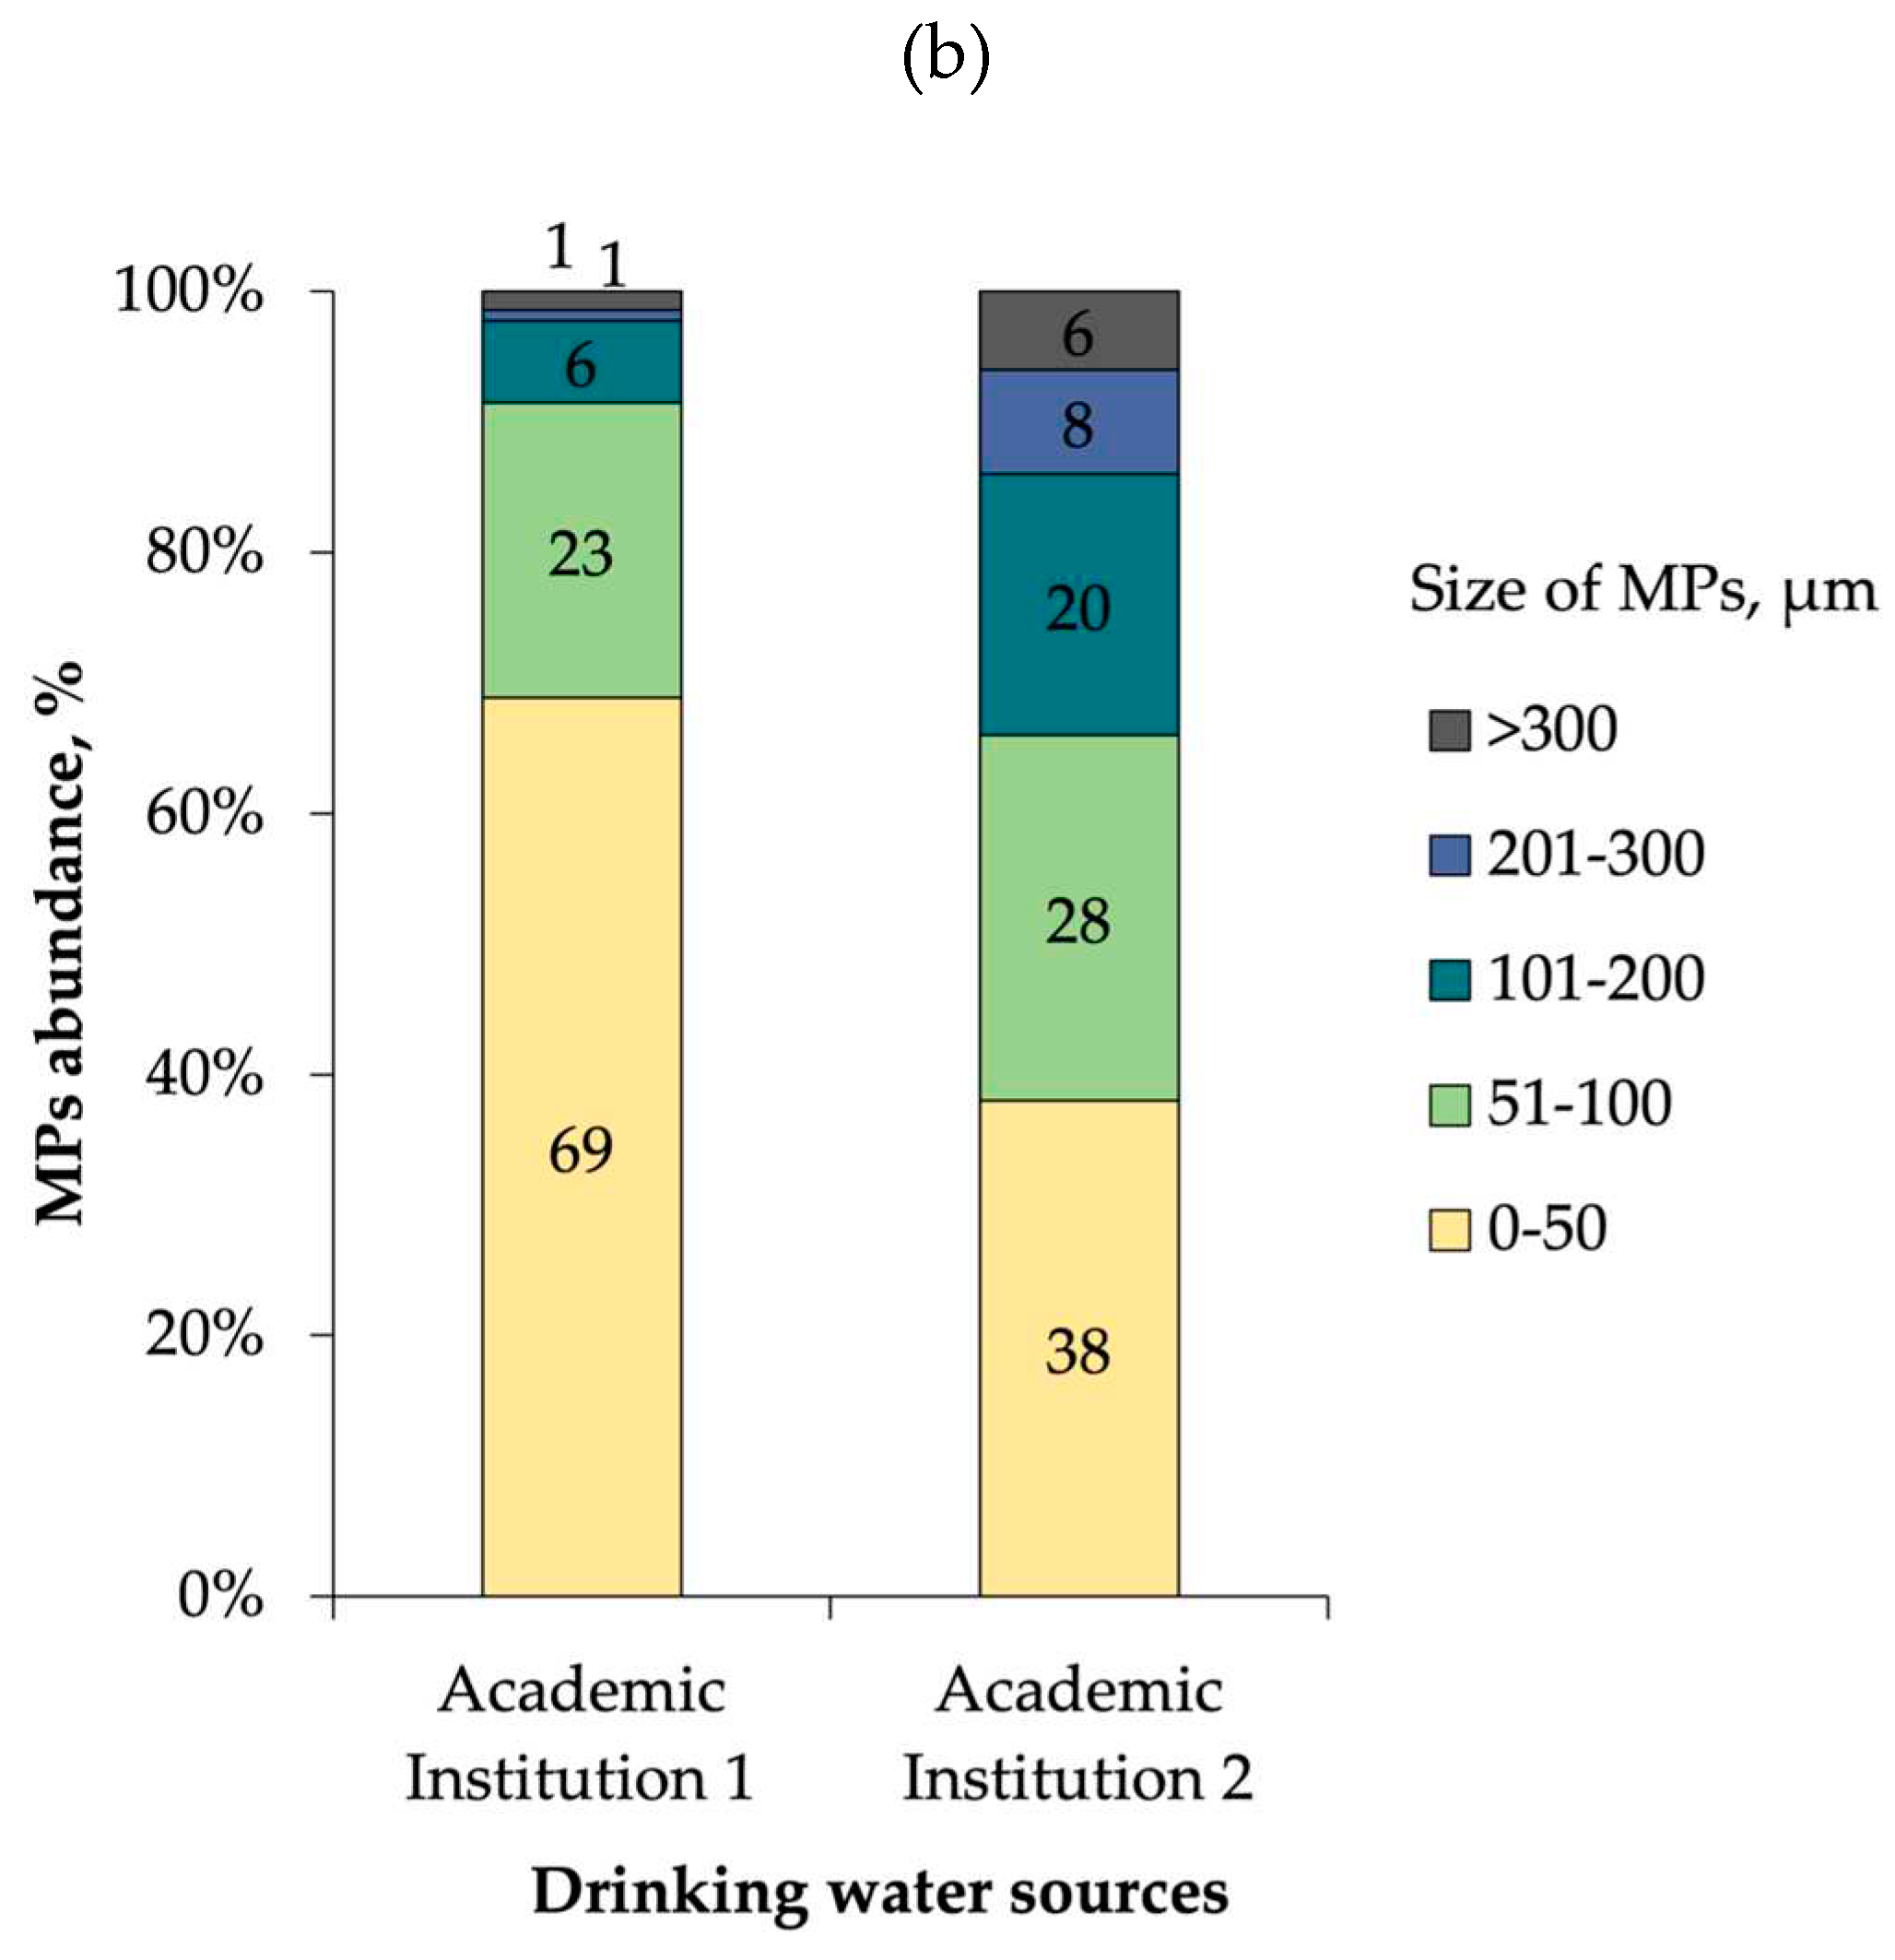
Figure 2b shows the drinking water of the Academic Institution 2 had MPs sizes of 0-50µm of 38% MPs abundance, less than those of the drinking water of the Academic Institution 1 of 69% MPs abundance, suggesting the high efficiency of the two commercial membrane filtration systems system installed at the Academic Institution 2 in removing MPs from the tap water samples. However, the remaining MPs in drinking water of Academic Institution 1 could be due to improper maintenance of the commercial membrane filtration system in which urgent actions to address this issue should be undertaken. The MPs abundance (0-50 µm) found in drinking water of the Academic Institution 1 could possibly emanate during filling of the commercial bottled water and releases of MPs from the plastic bottles [
12,
16].
3.2. Consumption behaviors of tap and drinking water
The questionnaire survey was conducted with 143 repondents for observing personel consumption of tap and drinking water. The demographic data showed that male was major respondents in this survey (57%), and 43% was female. Most of the respondents were 20-30 years old (86%) and about 14% of the respondents were 31-40 years old.
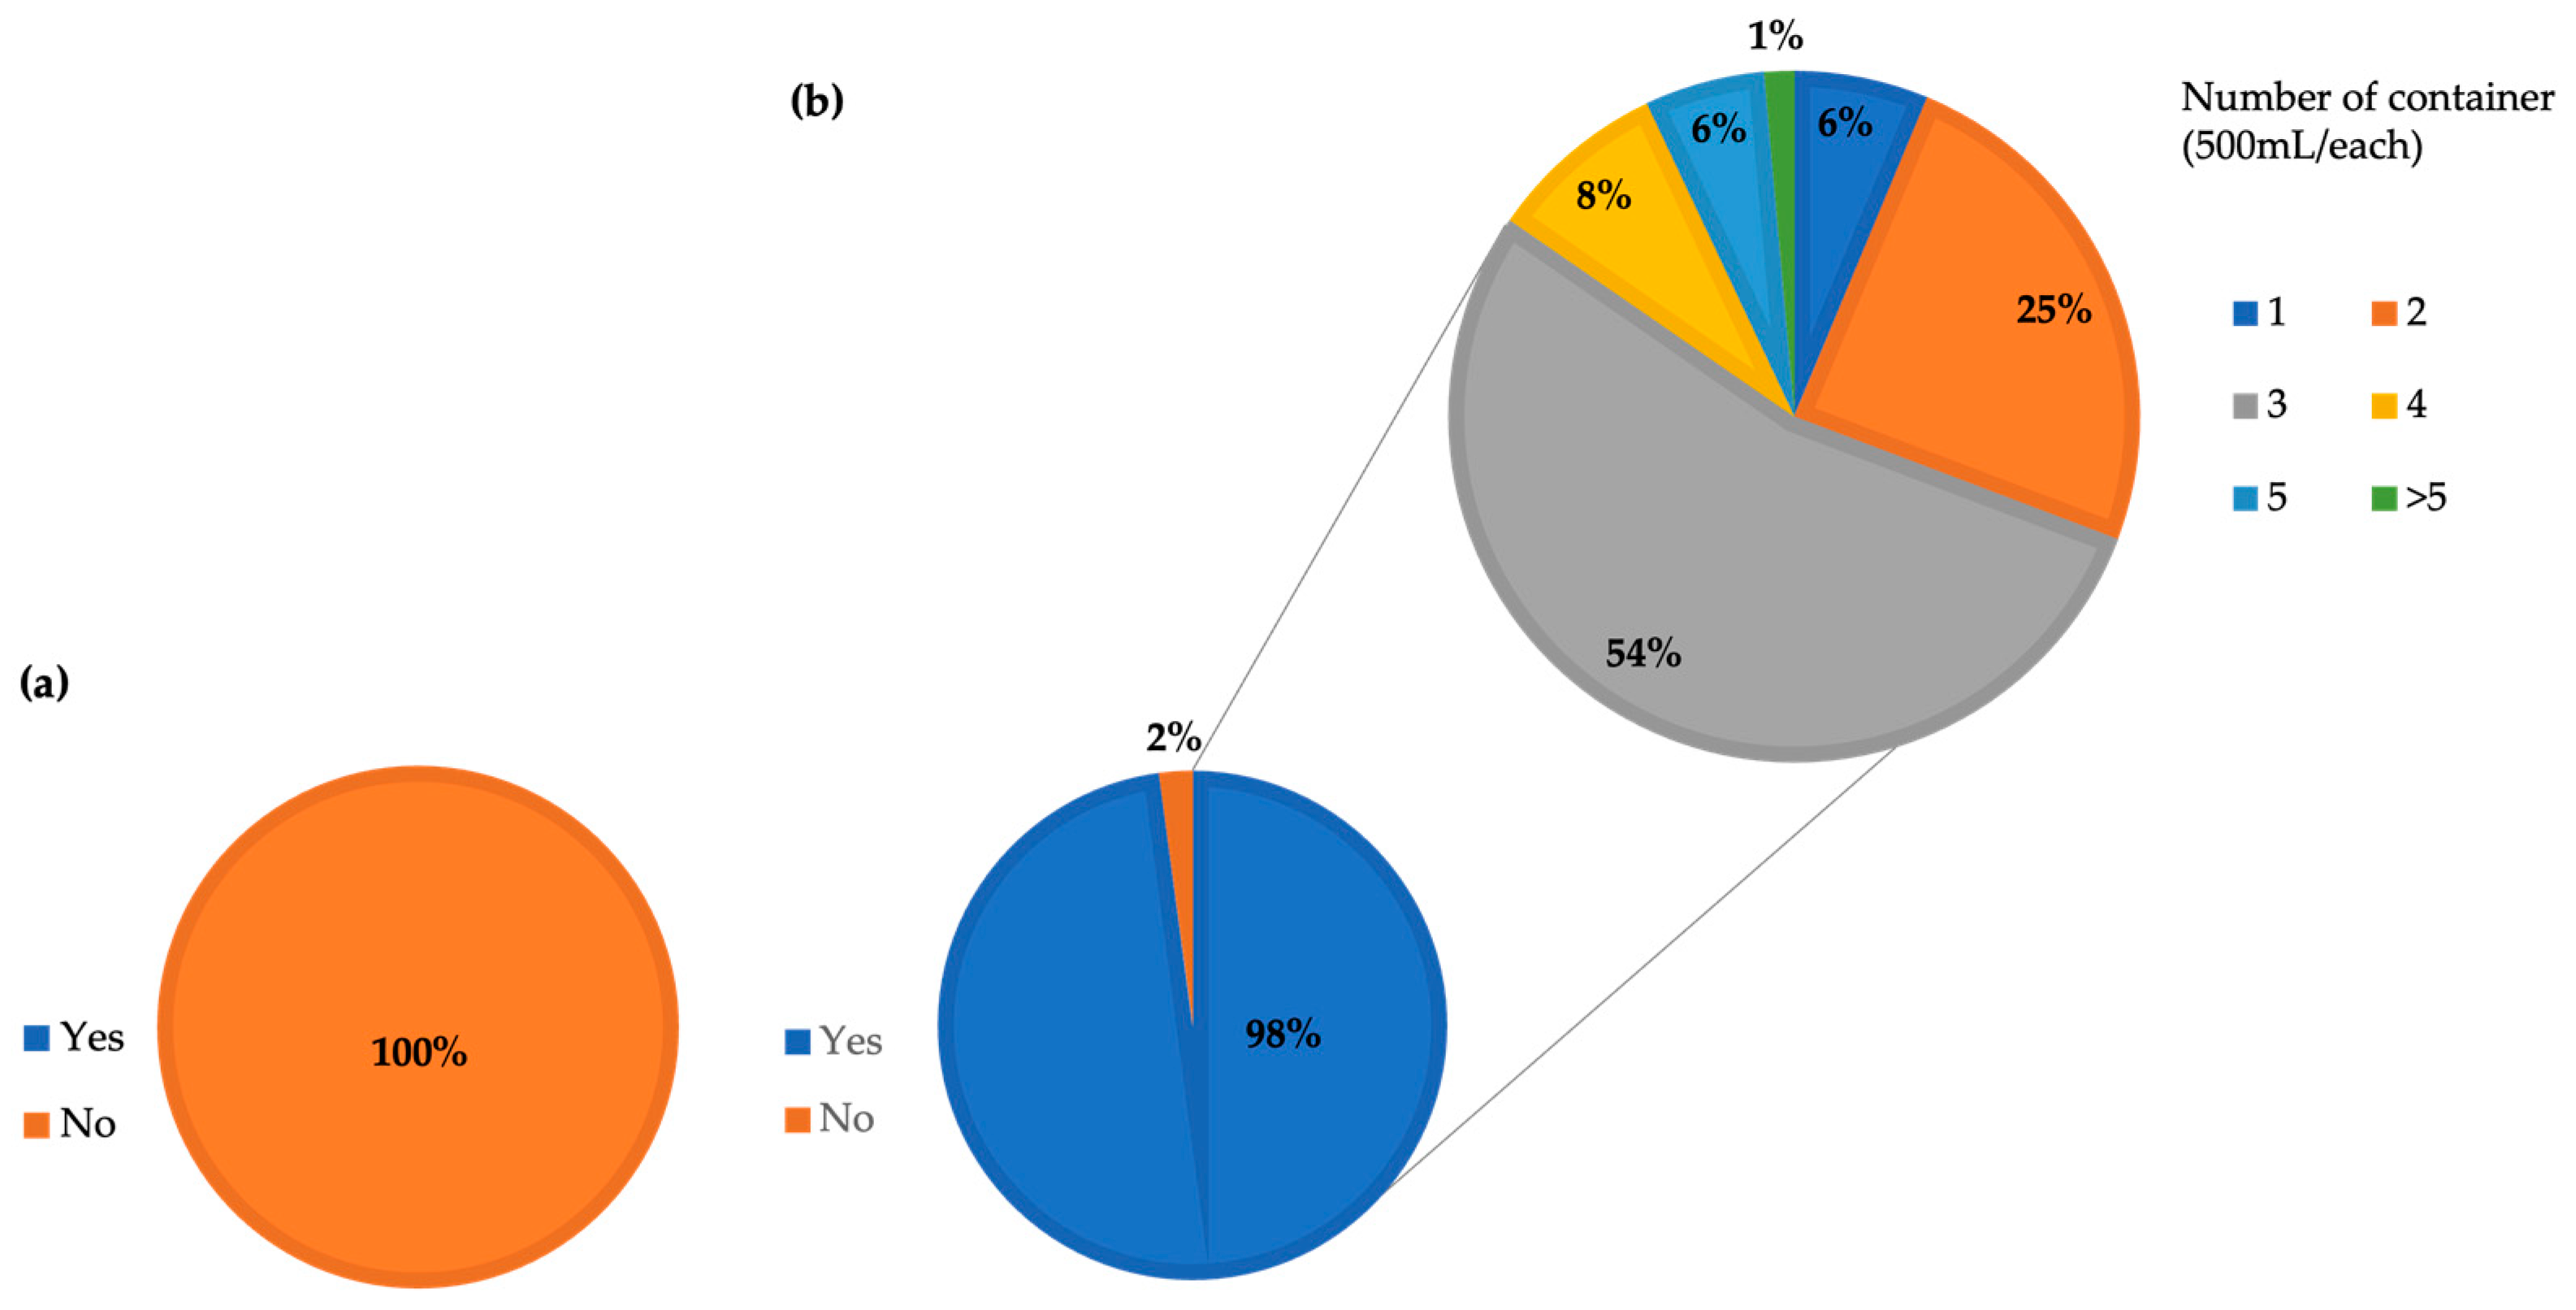
Figure 2 shows personel consumption of tap water. In which probably due to main concerns about water quality and safety as well as asthetic aspects e.g., odor, color, turbidity and taste, at tap points [
19], all respondents (100%) had no behaviors in directly drinking the tap water (
Figure 2a). However, most of respondents (98%) prefered to consume tap water after some pre-treatment processes such as filtration and boilling and food preparation (
Figure 2b) [
14]. The volume of tap water used in food preparation was ranged from 1,000-1,500 mL per household per day (averaged 4 members in a household). Accordingly, the maximum tap water used in household food preparation was estimated to be 0.4 L/(person-d).
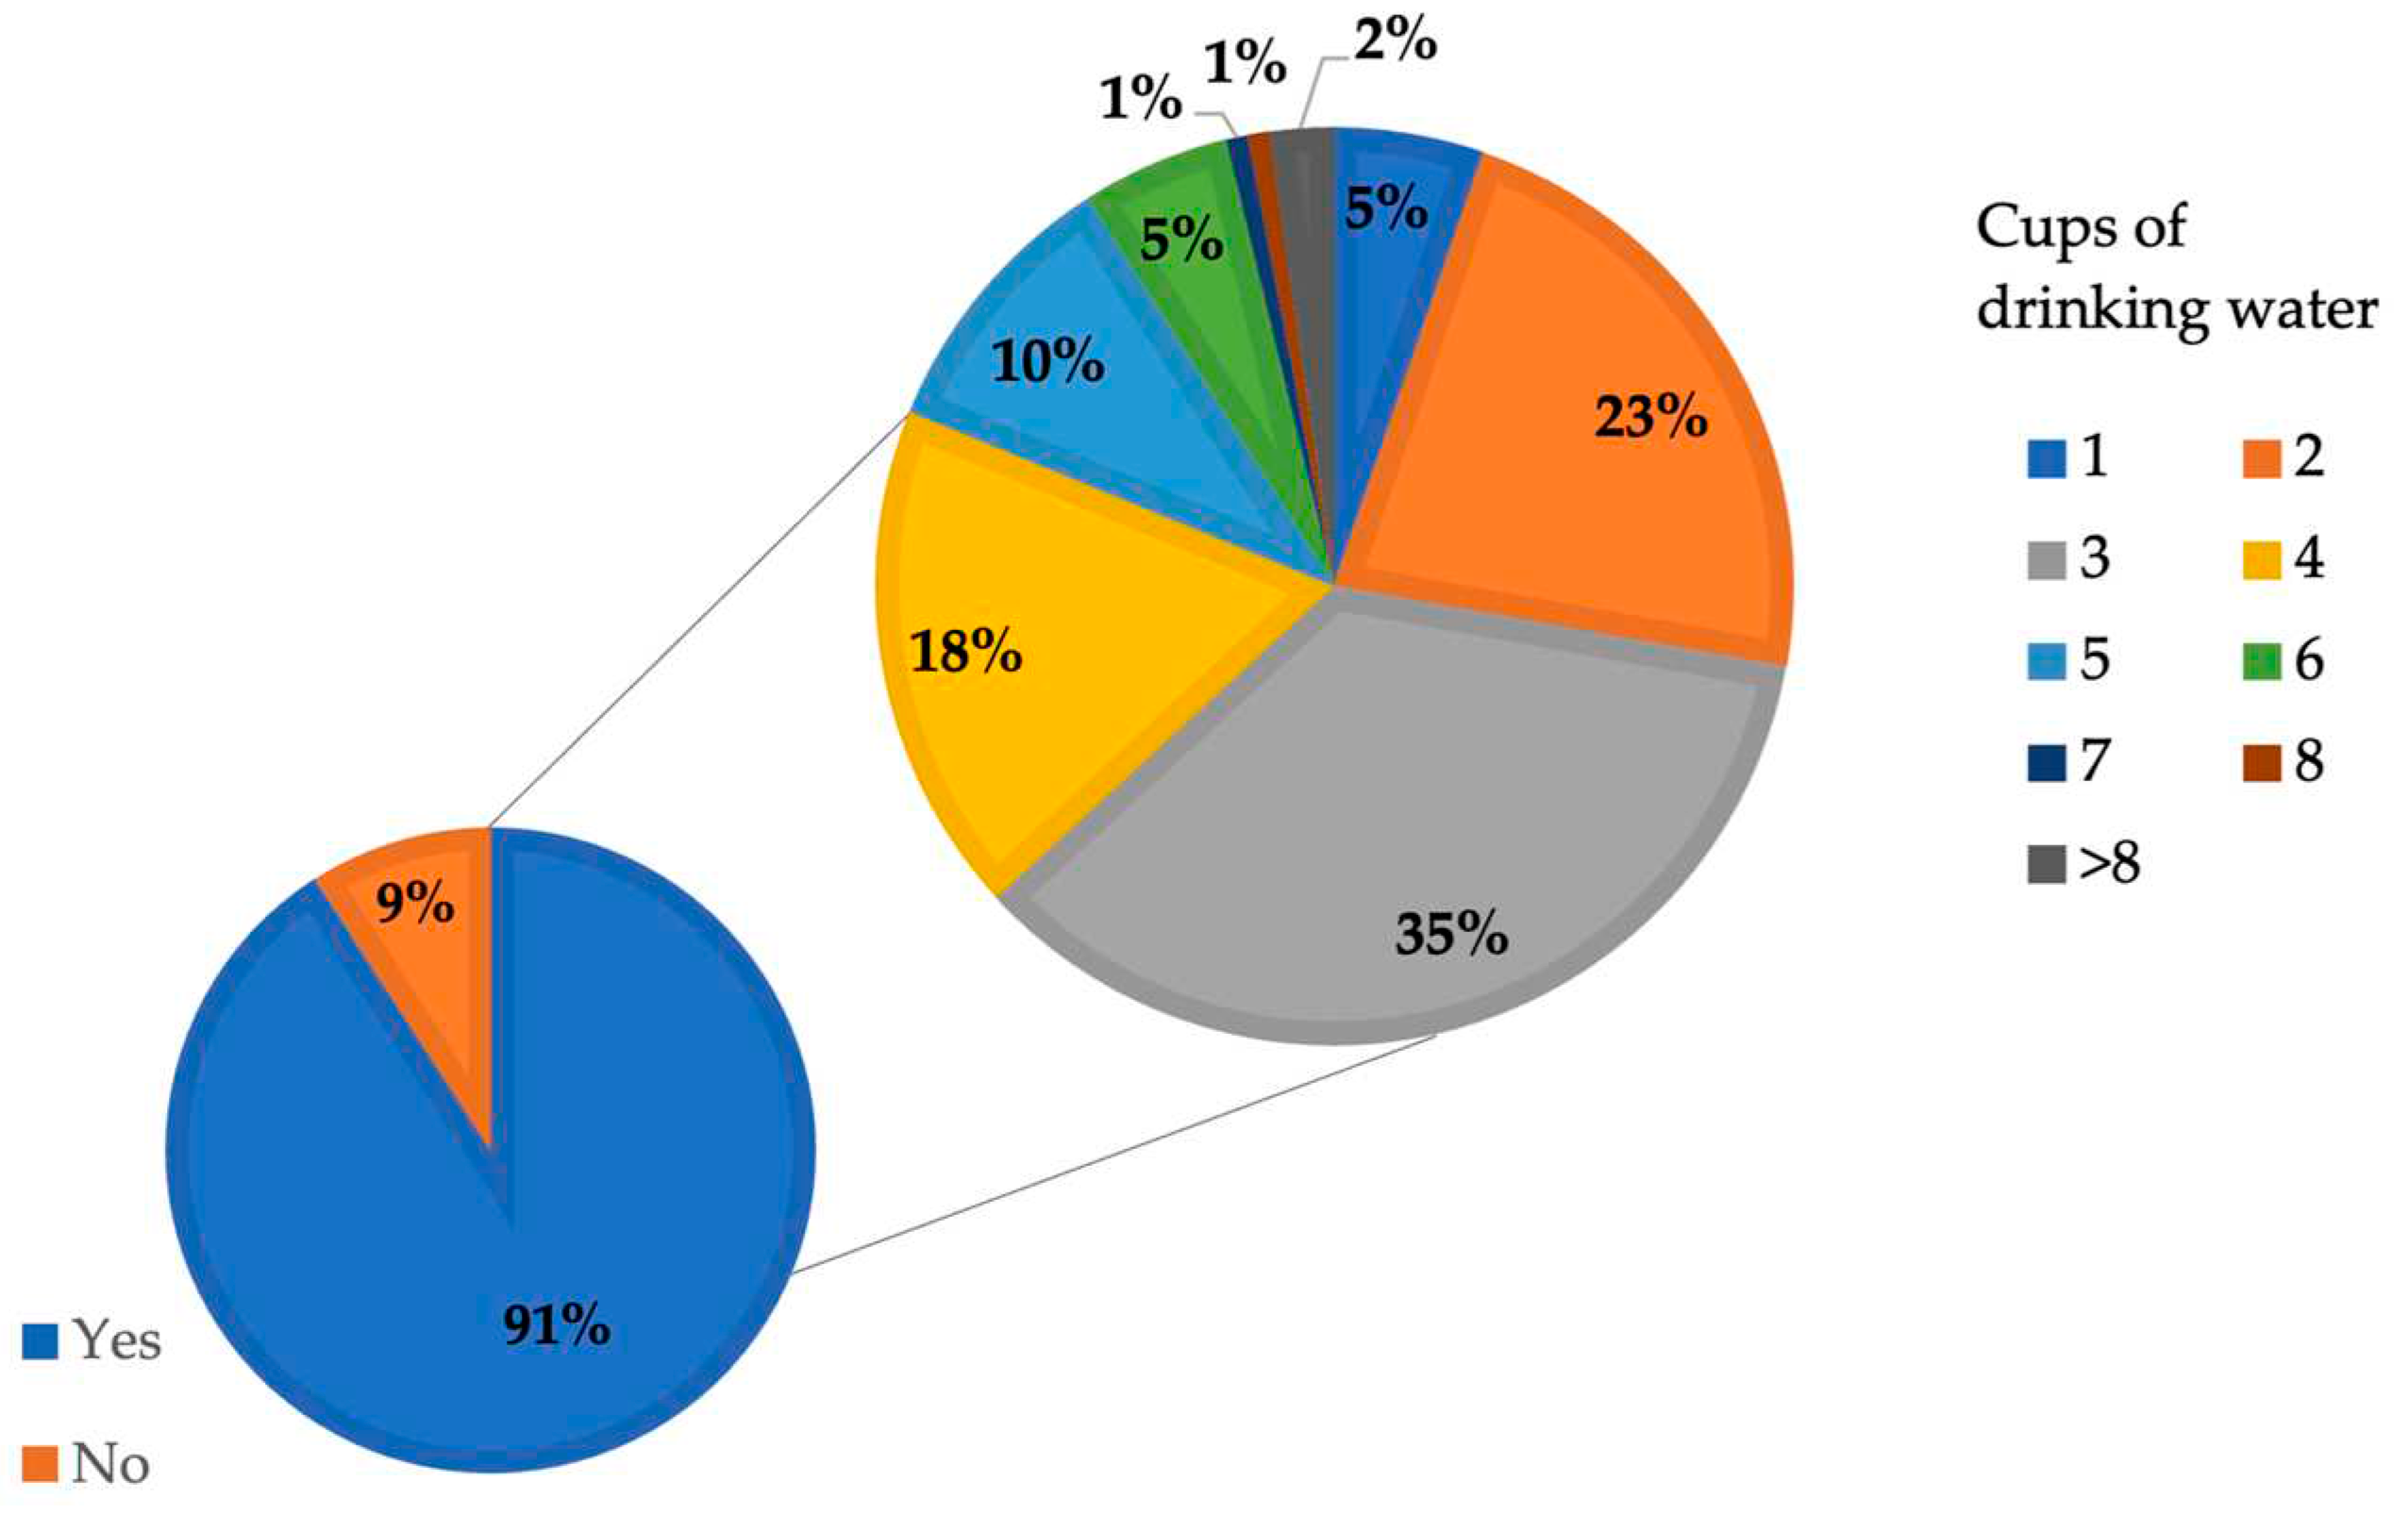
Figure 3 shows that about 91% of the respondents usually drank from public drinking fountains provided by the Academic Institutions. The majority of respondents (86%) comsumed about 2-5 cups (or 200-500 mL) of fountain water per day or consumed drinking water of about 0.5 L/(person-d) was estimated.
3.3. EDIMPs and potential health risks
The data of
Table 1 and the personnel consumed tap and drinking water in section 3.2 were used to calculated the EDI
MPs of the personnel at the Academic Institutions 1 and 2, according to Equation (2). From the questionnaire survey results, each personnel consumed drinking water about 0.5 L/(person-d) and the volume of tap water used in food preparation was about 0.4 L/(person-d). Therefore, the EDI
MPs of personnel of the Academic Institutions 1 and 2 were calculated to be 228 and 183 particles/(person-d), respectively. When the MPs are ingested into the the human digestive systems, they may cause some physical irritation to the gastrointestinal tract [
20]. Moreover, the MPs with the size of less than 2 μm were observed in human blood and organs [
21] as well as some of the MPs (50 μm) were reported to be transported from the gastrointestinal tract layer to lymph nodes in the liver and spleen [
22]. These MPs particles could then cause inflammations in surrounding tissues of the organs, resulting in many subsequent symptoms such as abdominal pain, bloating, and changes in bowel habits [
23]. To void these kinds of health impact from ingesting the MPs contained tap and drinking water, regular maintenance of the water supply treatment plants, water distribution pipelines and drinking water production processes are required.
3.4. Possible solutions and Recommendations
The data reported in sections 3.1 and 3.2 suggest potential health risks from MPs contamination to the people who consume either tap water or drinking water in Thailand or probably elsewhere. The sources of MPs contamination obviously originate from improper disposal of plastic wastes into the environment. These plastic wastes are degraded into small particles (less than 5 mm) and could be transported to nearby water sources, and becoming contaminants of raw water sources used for producing water supply. Therefore, actions to minimize MPs pollution should involve all stakeholders to avoid environmental pollution. In addition, proper maintenance of the water supply treatment plants and water distribution pipelines need to be regularly undertaken to enhance MPs removal and avoiding MPs leaching, respectively. Some advanced water treatment processes for MPs removal are also recommended for conventional water supply treatment plants.
4. Conclusions
Based on the results of this study, the following conclusions are made.
- 1)
The average MPs concentrations of tap water of the water supply treatment plant and the Academic Institutions 1 and 2 were found to be 304 ±90, 270 ±109 and 386 ±102 particles/L, respectively.
- 2)
The drinking water samples from commercial bottled water and filtered water from commercial membrane filtration systems were found to be 211 ±70 and 122 ±60 particles/L, respectively.
- 3)
The MPs sizes of 0-50µm were most abundant in both the tap and drinking water samples, whose shapes were mainly fragments and fiber.
- 4)
The questionnaire survey revealed the each person consumed about 0.5 L/(person-d) of drinking water and about 0.4 L/(person-d) of tap water used for food preparation.
- 5)
The EDIMPs of the personnel of the Academic Institutions 1 and 2 were calculated to be 228 and 183 particles/(person-d), respectively, suggesting possible health risks from MPs ingestion through consuming both tap and drinking water.
- 6)
Actions to minimize health risks include: reduction in plastics uses, proper management of plastic wastes and regular maintenance of water supply treatment plants and water distribution pipelines, additional suitable post-treatment processes for removing MPs in tap water from conventional water supply treatment plants.
Author Contributions
Conceptualization, KJ,TK and CP.; methodology, KJ,TK and CP; formal analysis, KJ,TK,WL,CC,TP,and CP.; investigation, KJ,TK,WL,CC,TP,and CP.; resources, KJ,TK, WL and CP; data curation, KJ,TK,WL,CC,TP,and CP.; writing—original draft preparation, KJ,TK,CC and CP.; writing—review and editing, KJ,TK,CC and CP.; visualization, KJ,TK,CC and CP supervision, TK and CP; funding acquisition, WL. All authors have read and agreed to the published version of the manuscript.
Data Availability Statement
We encourage all authors of articles published in MDPI journals to share their research data.
Acknowledgments
Special thanks are due to Pichamon Hongthong, Panjama Sukeiam and Krurkkiet Konkomba for their help in water sample collection and staff at the water supply treatment plant for their collaboration in water sampling and questionnaire survey.
Conflicts of Interest
The authors declare no conflict of interest.
Appendix A
Table A1.
Questionnaire survey.
Table A1.
Questionnaire survey.
Figure A1.
Sampling points of tap and drinking water.
Figure A1.
Sampling points of tap and drinking water.
Figure A2.
Public drinking fountain (a) employing commercial bottled waters and (b) consumption of drinking water using 100mL-cup.
Figure A2.
Public drinking fountain (a) employing commercial bottled waters and (b) consumption of drinking water using 100mL-cup.
Figure A3.
Figure A3. Commercial membrane filtration system.
Figure A3.
Figure A3. Commercial membrane filtration system.
Figure A4.
Figure A4. Shapes of MPs (a) fragments and (b) fiber.
Figure A4.
Figure A4. Shapes of MPs (a) fragments and (b) fiber.
References
- World Bank. (2022). Plastic Waste Material Flow Analysis for Thailand: Summary Report. World Bank.
- Mihai, F.C., Gündoğdu, S., Markley, L.A., Olivelli, A., Khan, F.R., Gwinnett, C., ... & Molinos-Senante, M. Plastic pollution, waste management issues, and circular economy opportunities in rural communities. Sustainability 2022, 14, 20. [CrossRef]
- Isangedighi, I.A. , David, G.S., & Obot, O.I. (2020). Plastic waste in the aquatic environment: impacts and management. In Analysis of nanoplastics and microplastics in food (pp. 15-43). CRC Press.
- Ahmed, M.B., Rahman, M.S., Alom, J., Hasan, M.S., Johir, M.A. H., Mondal, M.I. H., ... & Yoon, M.H. Microplastic particles in the aquatic environment: A systematic review. Science of The Total Environment 2021, 775, 145793. [CrossRef]
- Storck, F.R., Kools, S.A., & Rinck-Pfeiffer, S. (2015). Microplastics in freshwater resources. Global Water Research Coalition, Stirling, South Australia, Australia.
- Radityaningrum, A.D., Trihadiningrum, Y., Soedjono, E.S., & Herumurti, W. Microplastic contamination in water supply and the removal efficiencies of the treatment plants: A case of Surabaya City, Indonesia. Journal of Water Process Engineering 2021, 43, 102195. [CrossRef]
- Ta, A.T., & Babel, S. Microplastic contamination on the lower Chao Phraya: Abundance, characteristic and interaction with heavy metals. Chemofragments 2020, 257, 127234.
- Ounjai, K., Boontanon, S.K., Piyaviriyakul, P., Tanaka, S., & Fujii, S. Assessment of microplastic contamination in the urban lower Chao Phraya River of Bangkok city, Thailand. Journal of Water and Health 2022, 20, 1243–1254. [CrossRef]
- Chanpiwat, P., & Damrongsiri, S. Abundance and characteristics of microplastics in freshwater and treated tap water in Bangkok, Thailand. Environmental Monitoring and Assessment 2021, 193, 1–15. [CrossRef]
- Kankanige, D., & Babel, S. Contamination by≥ 6.5 μm-sized microplastics and their removability in a conventional water treatment plant (WTP) in Thailand. Journal of Water Process Engineering 2021, 40, 101765.
- Kankanige, D., & Babe, S. Identification of Micro-plastics (MPs) in Conventional Tap Water Sourced from Thailand. Journal of Engineering & Technological Sciences 2020, 52.
- Kankanige, D., & Babel, S. Smaller-sized micro-plastics (MPs) contamination in single-use PET-bottled water in Thailand. Science of the total environment 2020, 717, 137232. [CrossRef]
- Tang, K.H. D., & Hadibarata, T. Microplastics removal through water treatment plants: Its feasibility, efficiency, future prospects and enhancement by proper waste management. Environmental Challenges 2021, 5, 100264. [CrossRef]
- Meyers, N., Catarino, A.I., Declercq, A.M., Brenan, A., Devriese, L., Vandegehuchte, M., ... & Everaert, G. Microplastic detection and identification by Nile red staining: Towards a semi-automated, cost-and time-effective technique. Science of the Total Environment 2022, 823, 153441. [CrossRef]
- Shruti, V.C., Pérez-Guevara, F., Roy, P.D., & Kutralam-Muniasamy, G. Analyzing microplastics with Nile Red: Emerging trends, challenges, and prospects. Journal of Hazardous Materials 2022, 423, 127171. [CrossRef]
- Makhdoumi, P., Amin, A.A., Karimi, H., Pirsaheb, M., Kim, H., & Hossini, H. Occurrence of microplastic particles in the most popular Iranian bottled mineral water brands and an assessment of human exposure. Journal of water process engineering 2021, 39, 101708. [CrossRef]
- Huan, L.I., Long, Z.H. U., Mindong, M.A., Haiwen, W.U., Lihui, A.N., & Zhanhong, Y.A. N. G. Occurrence of microplastics in commercially sold bottled water. Science of The Total Environment 2023, 867, 161553.
- Wu, J., Zhang, Y., & Tang, Y. Fragmentation of microplastics in the drinking water treatment process-A case study in Yangtze River region, China. Science of The Total Environment 2022, 806, 150545. [CrossRef]
- Karujit, W., Kuldilok, P., & Sakulna, C. The Study of Perception, Attitude and Behavior of Water Users in the Service Areas of the Metropolitan Waterworks Authority to Design an Innovative Communication Cam-paign to Promote Perception Regarding the Quality of Tap Water. Journal of Communication Arts and Management 2022, 26, 8–20.
- Bouwmeester, H., Hollman, P.C., Peters, R.J.J.E.s., technology. Potential health impact of environmentally released micro-and nanoplastics in the human food production chain: experiences from nanotoxicolog. 2015, 49, 8932–8947. [CrossRef]
- Lithner, D., Larsson, Å., Dave, G.J.S.o.t.t.e. Environmental and health hazard ranking and assessment of plastic polymers based on chemical composition. 2011, 409, 3309–3324. [CrossRef]
- Revel, M., Châtel, A., Mouneyrac, C.J.C.O.i.E.S., Health. Micro (nano) plastics: A threat to human health? 2018, 1, 17–23. [CrossRef]
- Yuan, Z. , Nag, R., Cummins, E.J.S.o.T.T.E. 2022. Human health concerns regarding microplastics in the aquatic environment-From marine to food systems. 153730. [CrossRef]
|
Disclaimer/Publisher’s Note: The statements, opinions and data contained in all publications are solely those of the individual author(s) and contributor(s) and not of MDPI and/or the editor(s). MDPI and/or the editor(s) disclaim responsibility for any injury to people or property resulting from any ideas, methods, instructions or products referred to in the content. |
© 2023 by the authors. Licensee MDPI, Basel, Switzerland. This article is an open access article distributed under the terms and conditions of the Creative Commons Attribution (CC BY) license (https://creativecommons.org/licenses/by/4.0/).
