Preprint
Article

Injection Flow Rate Threshold Preventing Atypical In-Cavity Pressure during Low-Pressure Powder Injection Molding

Altmetrics

Downloads

98

Views

23

Comments

0

A peer-reviewed article of this preprint also exists.

Submitted:

12 September 2023

Posted:

13 September 2023

You are already at the latest version

Alerts
Abstract
Controlling injection parameters is paramount when it comes to producing high-quality green parts using powder injection molding. This work combines experimental and numerical approaches to study the impact of injection parameters on mold in-cavity pressure and on the overall quality of green parts produced by low-pressure powder injection molding. The properties of two low-viscosity feedstocks (formulated from a water-atomized stainless-steel powder and wax-based binder system) were measured and implemented in an Autodesk Moldflow numerical model to quantify the molding pressures, which were finally validated using experimental real-scale injections. The results confirmed that an increase in mold temperature, an increase in feedstock temperature, and a decrease in solid loading decrease the mold in-cavity pressure, which was correlated with the feedstock viscosity. As a key result, real-scale injections confirmed that a minimum flow rate was required to avoid atypical high in-cavity pressure leading in several visual defects such as weld lines, flow marks, cracks, sinks, and incomplete filling. Due to differences in its thermal transfer properties, this flow rate threshold value decreases as the feedstock solid loading increases. For injection speeds higher than this value, the injection pressure measured experimentally was linearly correlated with the injection flow rate.
Keywords: 
Subject: Chemistry and Materials Science  -   Metals, Alloys and Metallurgy

1. Introduction

Metal injection molding (MIM) is a manufacturing process suitable for producing complex shape and small metallic parts within reasonable dimensional tolerances, especially when other conventional processes have reached their technical limits or become too expensive [1]. The MIM process can be divided into four steps, namely, feedstock preparation, injection molding, debinding, and sintering [2]. Although each of these steps must be properly executed, the injection molding parameters must be controlled in order to produce high-quality green parts [3]. Depending on the binder formulation driving the final feedstock viscosity, the injection stage can be performed using either a High-Pressure Injection Molding (HPIM) or a Low-Pressure Injection Molding (LPIM) approach [4]. One of the main differences between these two techniques lies in the size of the injection molding equipment used. In HPIM, the injection unit is composed of a reciprocating screw mechanism rotating in a heated barrel to transport a high-viscosity feedstock (e.g., > 100 Pa·s, at a temperature above 160°C) that is injected into a cooled mold cavity using a translation movement of the same screw to produce an injection pressure generally higher than 50 MPa [5]. In LPIM, on the other hand, the injection unit consists of an air-pressurized container [6] or a plunger system [7] used to transport a low-viscosity feedstock (e.g., < 20 Pa·s, at a temperature below 100°C) that is injected into an air-cooled mold cavity using an injection pressure generally lower than 1 MPa [8]. While the latter injection approach is still in its infancy, it is a promising manufacturing technology for producing metallic parts cost-effectively either in low- or in high-production volumes thanks to the simplicity of its underlying principle and the reduction of the size of the machines and mold shells involved.
As ceramic-based LPIM feedstock development pioneers, Mangels and Williams [9] were among the first to demonstrate the high moldability of such low-viscosity feedstocks. Approximately ten years later, the same research team confirmed that the pressurized container principle developed by Peltzman Corp. [10] was able to produce ceramic green parts exhibiting a very high level of shape complexity, using high solid loading feedstocks [11]. In the early 2000s, Gonçalves [12] showed that this injection approach could even be used for conventional high-viscosity metallic-based feedstocks. However, the study concluded that a process needed to be developed specifically to better understand the interaction between injection variables and to mitigate problems appearing during debinding. Almost simultaneously, Quevedo Nogueira et al. [13] demonstrated that carnauba wax could be successfully used as an organic vehicle in the formulation of low-viscosity ceramic-based feedstock and injected at a pressure as low as 0.6 MPa when blended with low-density polyethylene and stearic acid. Ten years later, in a very comprehensive study, Piotter et al. [14] confirmed the ability of the LPIM process to produce microscopic parts (also known as micro-PIM) from ceramic- as well as metallic-based feedstocks. Using a ceramic-based feedstock, Çetinel et al. [15] studied material- and process-related factors in a bid to improve shape retention and bending strength after the debinding/sintering stages. More recently, Medvedovski and Peltsman [16] and Sardarian et al. [17] independently demonstrated the importance of optimizing process parameters, such as the feedstock temperature and injection pressure, to produce ceramic parts exhibiting high mechanical properties.
Over the past few years, the injection flow rate (also known as the injection speed) has been studied mainly in the context of the HPIM process. With the aid of numerical simulation, Atre et al. [18] observed that a high feedstock flow rate induced segregation caused by high shear rate gradient regions. Subsequently, Muangwaeng et al. [19] experimentally confirmed this segregation phenomenon induced by a high injection speed. SEM observations of their samples showed phase separation near the outer skin as well as black streaks near the gate (sign of thermal decomposition resulting from high friction) as the injection speed and pressure increased. Studying the influence of process parameters on the quality of MIM parts, Walcher et al. [20] showed that an increase in the injection speed led to a decrease in the surface roughness, along with an increase in the occurrence of parting lines. Huang and Hsu [21] demonstrated that dimensional stability was difficult to control for parts molded at high injection speed. The authors explained that the shear rate increase inevitably arising from an increase in the injection speed in turn leads to an increase in in the shrinkage rate, which promotes the deformation of green parts. They also observed that a higher injection speed results in a higher green density and higher sintered properties, mainly caused by an increase in injection pressure forcing more powder into the mold cavity. During the injection optimization phase, Amin et al. [22] concluded, contradicting prior research results, that the effect of the injection flow rate on the green density was too low and could be neglected for their experiment. Askari and Momeni [23] recently demonstrated that the injection speed has a greater more impact on green properties than the other process parameters (injection temperature, mold temperature and holding pressure). They confirmed the results obtained by Huang and Hsu, in which an increase in the injection flow rate led to an increase in both the green density and in the flexural green strength. Using a X-ray tomography approach, Yang et al. [24] observed that an increase in the injection speed and pressure, which in fact inhibits the solidification of the feedstock during injection in the mold cavity, led to a decrease in the amount and size of porosities. They also confirmed that small cracks and large pores originating from the jetting phenomenon appeared respectively at too low and too high injection speeds. Using the LPIM process, Sardarian et al. [25] observed a low variation of the green density and flexural green strength for specimens injected at different velocities. However, a significant change in these two metrics was observed at high temperature and high speed due to the presence of voids caused by jetting.
The influence of injection parameters on the overall quality of green parts is relatively well documented for high-viscosity feedstocks used in the HPIM process. However, to the best of the authors’ knowledge, the impact of the injection speed on the injection pressure has never been studied for low-viscosity powder-binder mixtures used in the LPIM process. This work aims to quantify the influence of different injection parameters (including the injection flow rate) on the quality of green parts, based on the in-cavity pressure developed during the LPIM process, the visual aspect of the green parts, and local powder concentration.

2. Materials and Methods

2.1. Feedstock formulation

A water-atomized 17-4PH stainless steel powder (Epson Atmix Corporation, Japan) was mixed with a wax-based binder to formulate two feedstocks. A scanning electron microscope (Hitachi 3600, secondary electrons detector) and a laser diffraction particle analyzer (LS 13320 XR, Beckman Coulter) were used to observe the particle shape and measure the particle size distribution reported in Figure 1. This MIM powder exhibits a near-spherical shape (Figure 1a) with a D10, D50, and D90 of about 3, 11, and 28 μm, respectively (Figure 1b). The powder was mixed with a blend of paraffin wax, carnauba wax, stearic acid, and ethylene-vinyl acetate in the proportion listed in Table 1. Two feedstocks (F60 and F65) were formulated at 60 and 65 vol. % of powder by changing the paraffin wax proportion. The paraffin wax was used as the main constituent for its low viscosity, constant rheological properties, and low cost. The carnauba wax, stearic acid, and ethylene-vinyl acetate were added to increase the green strength, to facilitate parts demolding, to promote the chemical bridge between the powder and binder, and to control the segregation and homogeneity of the feedstocks.

2.2. Feedstock characterization

The density of the powder, of the single binder constituents, and of the feedstock was measured using a helium gas pycnometer (AccuPyc II 1340) according to the ASTM B923 standard [26]. The melting point of each binder constituent was measured using a differential scanning calorimeter (Perkin Elmer Pyris 1 DSC) according to the ASTM D3418 standard [27]. The physical properties of each feedstock constituent are presented in Table 2. The feedstock viscosity presented in Figure 2a was measured at three different temperatures (80, 90, and 100°C) and different shear rates (0.5 to 3,500 s-1) using a rotational rheometer (Anton Paar, MCR 302) equipped with and a concentric cylinder cell (CC-17) and a Peltier temperature-controlled measuring system (C-PTD 200). The shear thinning behavior of the feedstocks as well as the influence of temperature on viscosity was captured using the second-order viscosity model by:
ln η = A + B ln γ ˙ + C T C + D ( ln γ ˙ ) 2 + E ln γ ˙ + F T C 2
where η is the feedstock melt viscosity, γ ˙ is the shear deformation rate, Tc is the corresponding relative temperature in Celsius, and A, B, C, D, E, and F are data-fitted coefficients of the second-order model, reported in Table 3. The viscosity curves were fitted using Eq. (1) and the resulting curves are superimposed in Figure 2a for each test condition. The DSC thermograms presented in Figure 2b were used to determine the feedstocks’ transition temperature (extracted from the cooling stage as identified by black arrows) and specific heat (Cp) according to the standard test method ASTM-E1269 [28], as presented in Figure 2c. The thermal conductivity (k) of the feedstocks reported in Figure 2d was measured according to the transient line-source technique described in the standard test method ASTM- D5930 [29].

2.3. Real-scale injection

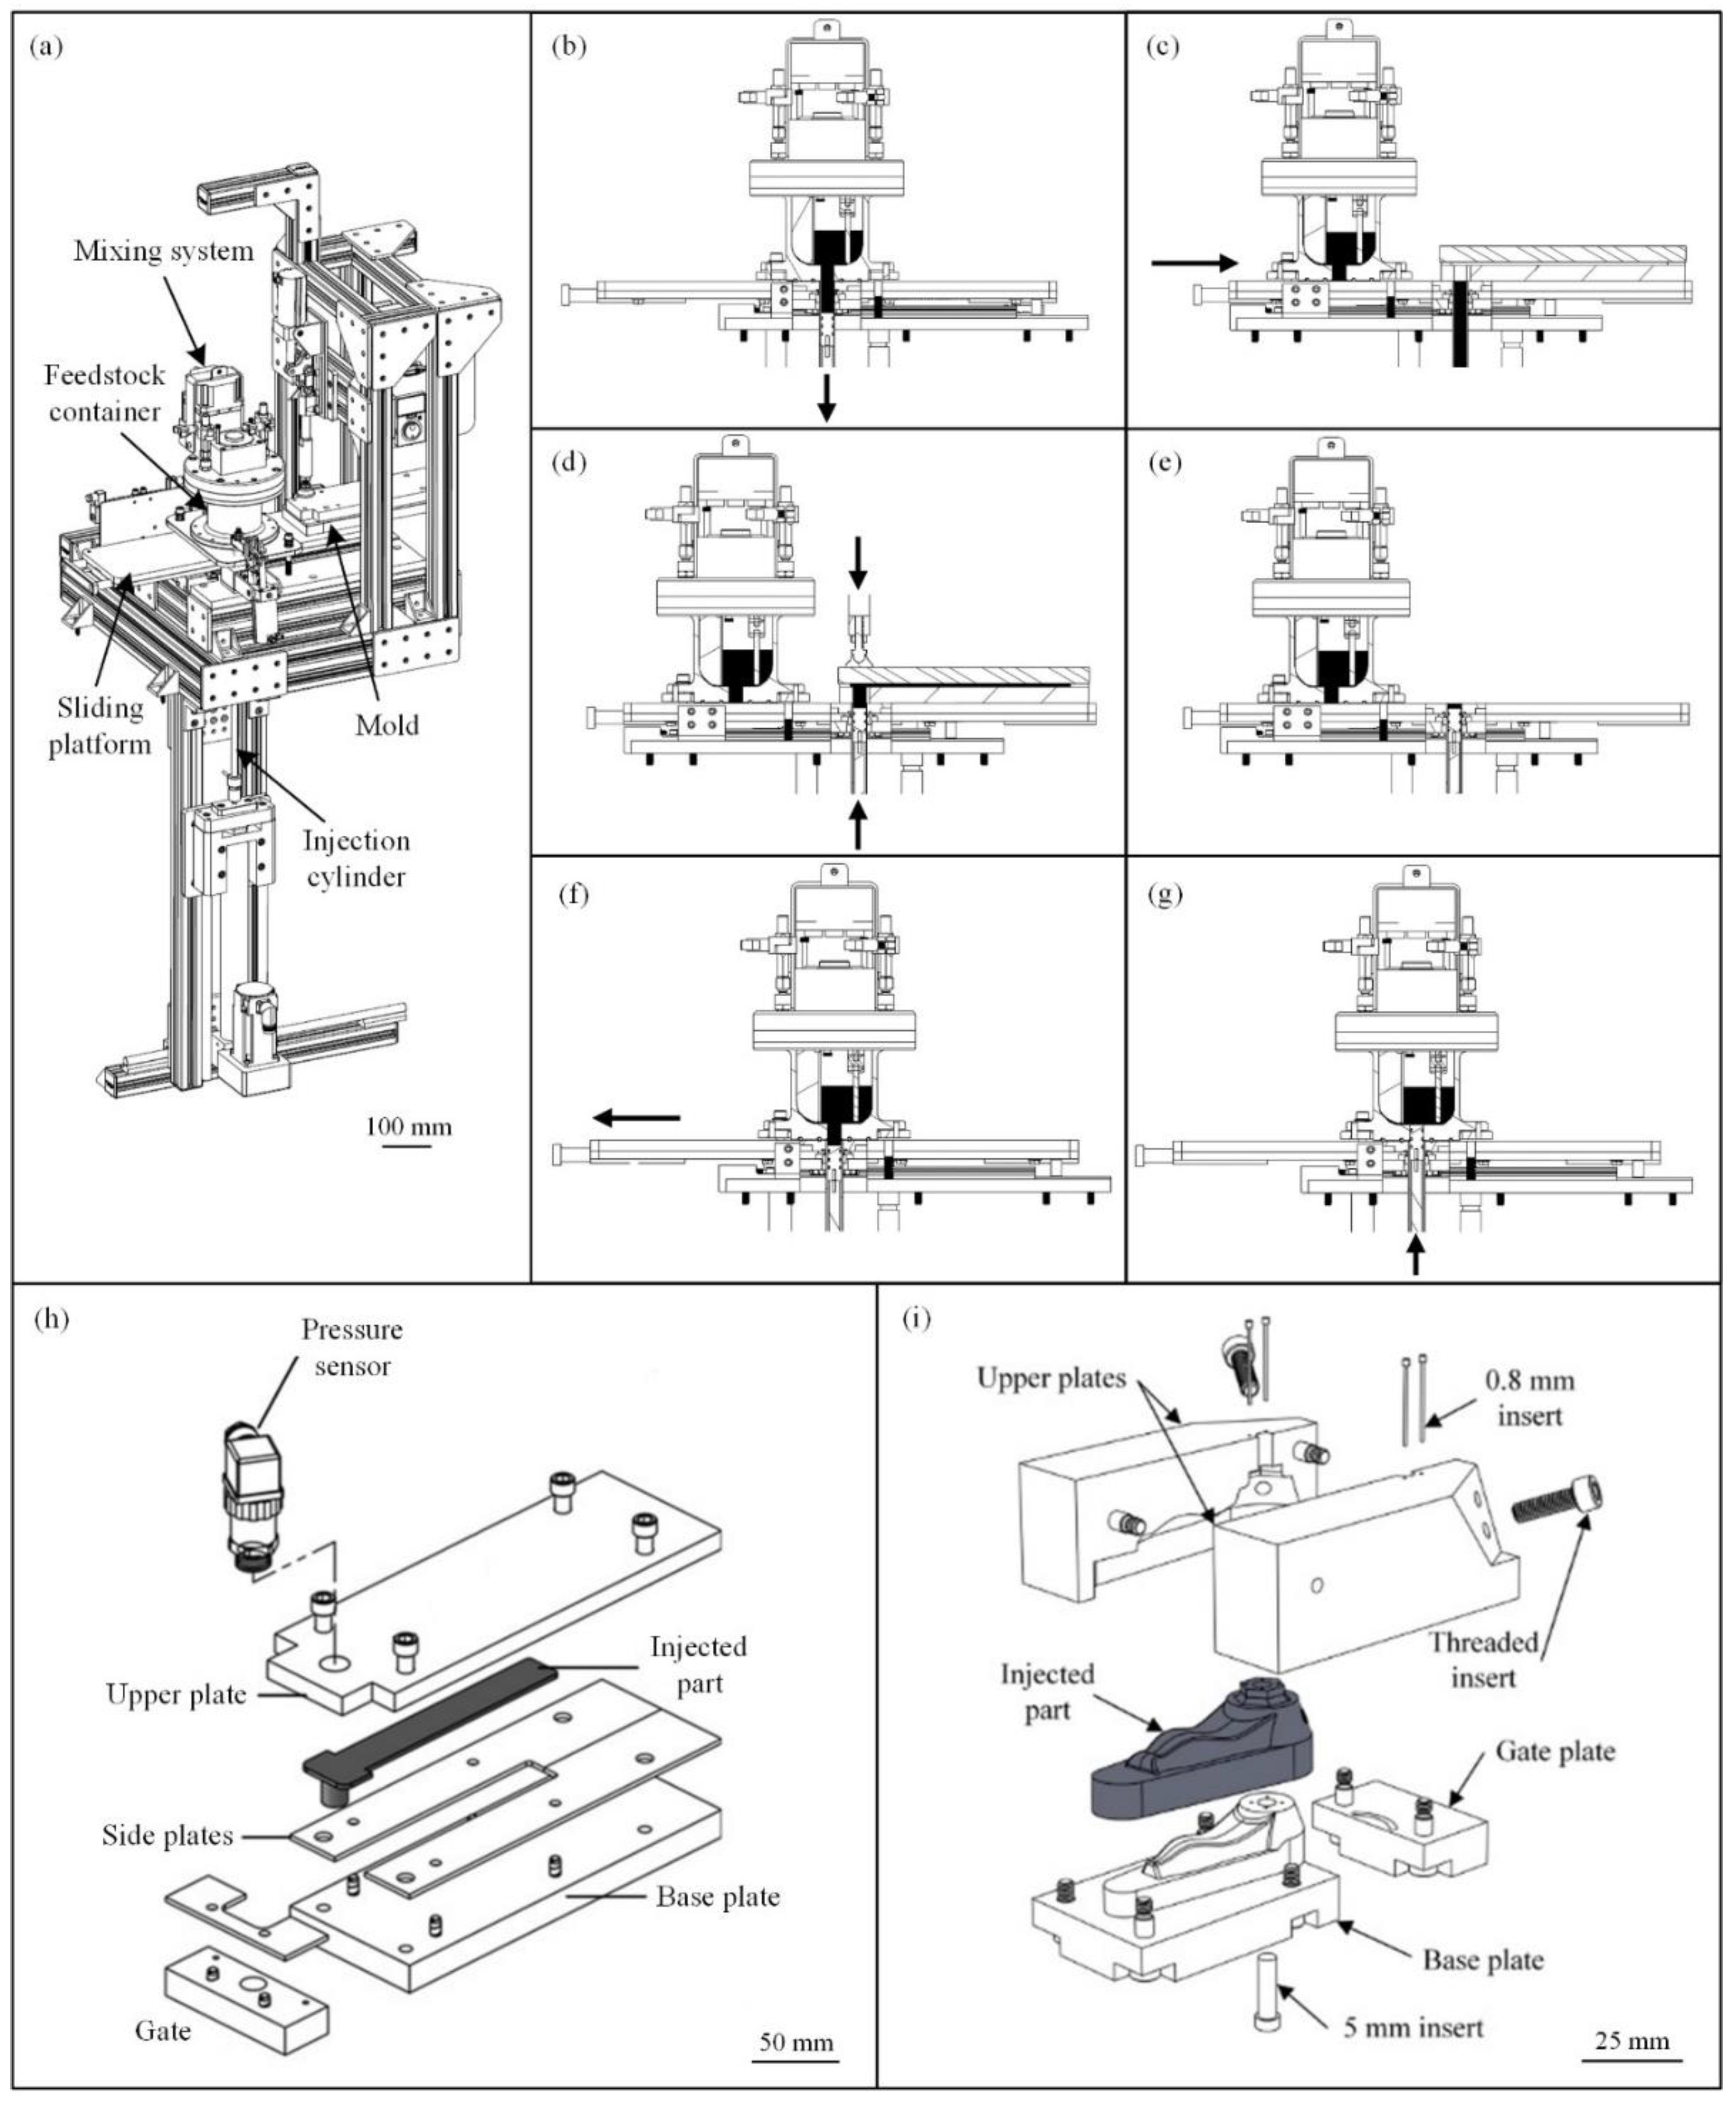
Real-scale injections were performed using a laboratory injection press schematized in Figure 3a, which is the new version of the injection principle developed by Lamarre et al. [30,31]. Powder and binder were mixed at 90°C using a planetary blender under vacuum to produce homogeneous and bubble-free molten feedstock. The prepared feedstock was directly pulled from the mixing system by the action of a heated cylinder/piston system acting as a syringe (Figure 3b). The filled cylinder attached to the injection table was slid before being aligned and clamped with the mold (Figure 3c), and the feedstock was injected into the mold cavity at a constant flow rate (Figure 3d). After the feedstock was completely solidified, the clamping pressure was released, the mold removed (Figure 3e), and the sliding platform moved back and aligned with the mixing system (Figure 3f) before the remaining molten feedstock was pushed back inside the container for the next injection (Figure 3g). The simple rectangular mold geometry (3.1 x 12.7 x 164 mm) presented in Figure 3h was used to quantify the effect of injection process parameters on the in-cavity pressure. This mold was instrumented with a piezoresistive pressure sensor (Keller Y25 series) positioned above the gate, while the mold temperature was monitored by a thermocouple located inside and close to the cavity. Data were recorded by an acquisition card (NI USB-6212) using LabVIEW. The complex shape part presented in Figure 3i was finally used to demonstrate the ability of the LPIM process to produce intricate parts with different features, such as threaded holes, small holes, and complex contoured surfaces.
The process parameters for the real-scale injections and numerical simulations are reported in Table 4 for each injection sequence. These process parameters was grouped into four sequences to capture the influence of the mold temperature, feedstock temperature, and injection flow rate on the injection pressure, visual aspects, and segregation. During sequence #1, the pressure was experimentally determined using the rectangular mold maintained at a temperature of 30, 40, and 50°C (other conditions were kept constant). During sequence #2, a similar approach was used by changing the feedstock temperature from 80 to 100°C and keeping the mold temperature constant at 40°C. During sequences #3-4, an injection flow rate ranging from 1 to 30 cm3/s was used with the two molds presented in Figure 3h-i to obtain the injection pressure and flow behavior, while keeping the mold and feedstock temperatures constant at 40 and 90°C, respectively. The mold and feedstock temperature ranges represent typical values for wax-based feedstocks, while the minimum and maximum flow rates (i.e., 1 and 30 cm3/s) correspond to the minimum and maximum injection speeds (i.e., 0.5 and 15 cm/s of the linear piston) possible with the laboratory injection press described above. Note that the molds were not equipped with heating/cooling channels to control the surface cavity temperature during the injections. Therefore, the mold temperature corresponds to the initial temperature of the mold before injections.

2.4. Numerical simulations

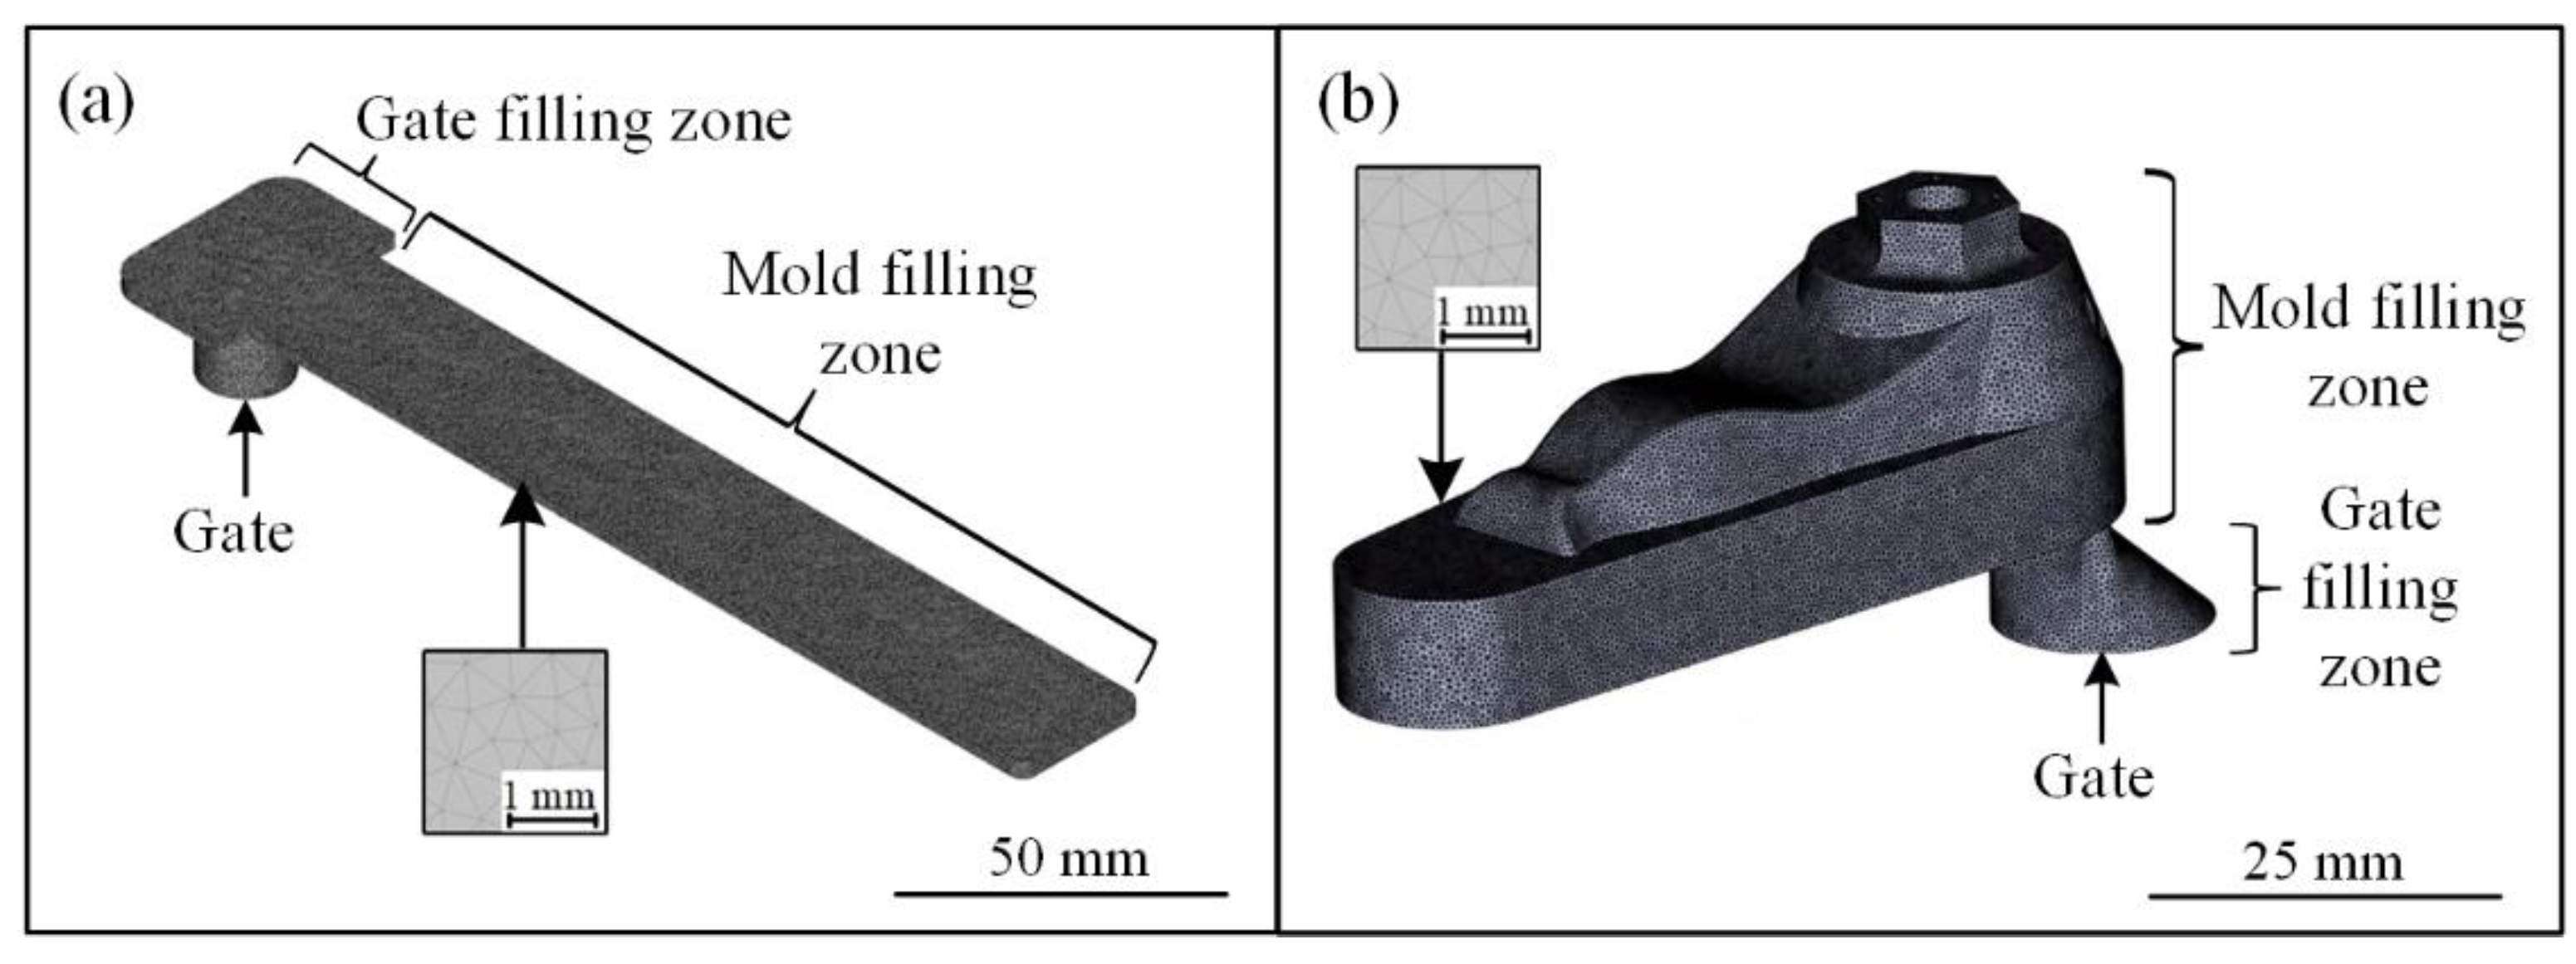
The influence of the injection parameters on mold in-cavity pressure was also numerically simulated using Moldflow Insight 2019 (Autodesk inc.). The powder injection molding (PIM) module and the filling analysis sequence were selected as they allow to predict the powder concentration variation during the filling phase of the injection. The physical, rheological and thermal properties, as well as the solid loading presented in Figure 2, were implemented as material properties. The melt-to-solid transition temperature of the two feedstocks was set at 62°C, which corresponds to the transition temperature of the paraffin wax highlighted in Figure 2b. The value of the heat transfer coefficient (HTC) between the mold and the feedstock was set at 100 kW/(m2·°C) according to previous works done by Ilinca et al. [32]. This coefficient accounts for any heat transfer resistance at the cavity’s surface. Accelerating and decelerating speed ramps were used to replicate the experimental injection speeds. The CAD models of the two parts were both meshed using 3D tetrahedral elements with an edge length of 0.5 mm. The rectangular and complex geometries illustrated in Figure 4 were meshed using 1.8 and 2.4 million of elements, respectively. The pressure obtained numerically was extracted from the nodes included in the corresponding area in contact with the experimental sensor (∅17 mm located at the top of the gate, see Figure 3h) and averaged using a Python script developed.

2.5. Powder segregation measurements

Powder segregation was characterized using a PerkinElmer STA8000 thermogravimetric analyzer (TGA) according to the method developed in a previous study [33]. Segregation, also known as inhomogeneous powder distribution over an injected part, was investigated because the phenomenon may lead to distortions, cracks, voids, warping, and heterogeneous shrinkage during sintering. Segregation usually results from an improper mixing method during feedstock preparation, from gravity when the feedstock is idle during process dead times, or from the presence of high shear deformation rate gradients during the molding process. Specimens measuring about 1 mm3 were extracted from each part injected during sequence #4 presented in Table 4 according to the position locations A to E presented in Figure 5a. The specimens were placed in a standard ceramic pan and then heated from 30 to 550°C at a heating rate of 20°C/min under nitrogen purge gas, with a flow rate of 60 ml/min. The weight fraction of the remaining powder after binder burnout was determined from the TGA profiles, as illustrated in Figure 5b, and converted in terms of volume fraction of powder according to Eq. (2):
v o l .     % p o w d e r = 1 + ρ p o w d e r ρ b i n d e r · 1 w t .     % p o w d e r 1 1

3. Results and discussion

3.1. Influence of the mold and feedstock temperature on injection pressure

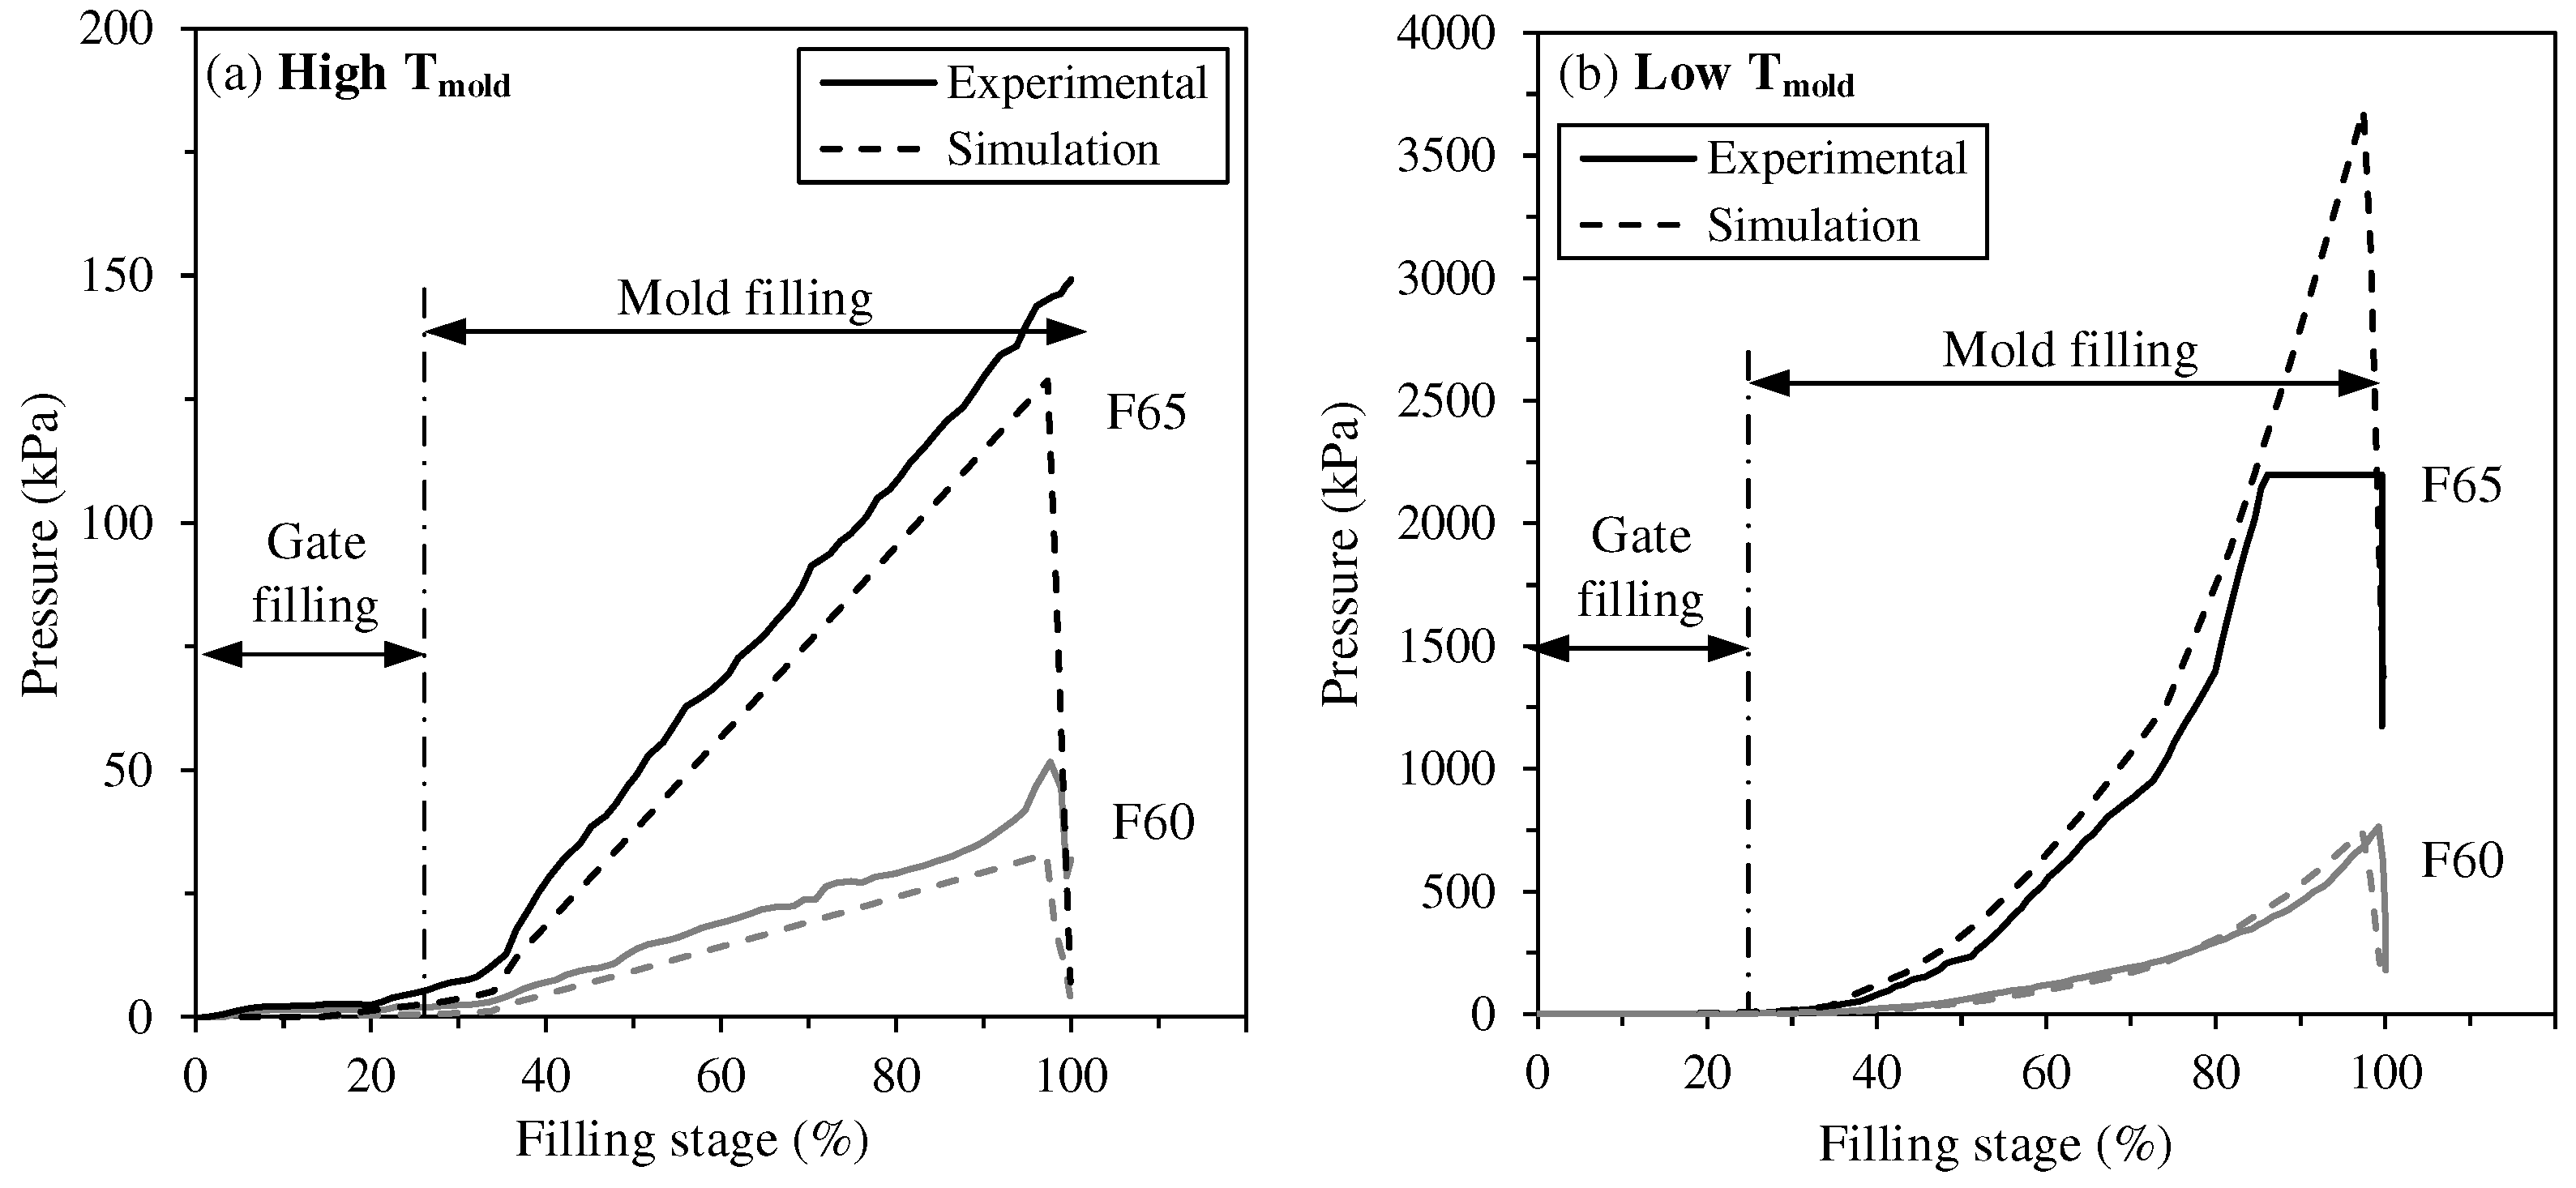
Figure 6 presents the pressure profiles measured in the rectangular mold cavity at different mold temperatures (sequence #1 in Table 4) and feedstock temperatures (sequence #2 in Table 4) for feedstocks F60 and F65. The pressure profiles are divided into two zones: the gate filling zone (vertical cylinder and its adjacent wide rectangular section) and the mold filling zone (constant width rectangular cavity), both described in Figure 3h. The pressure value recorded during the gate filling zone remains at zero since the sensor (located at the top of the gate) is not in contact with the molten feedstock during this phase. As the feedstock converges through the mold filling zone illustrated in Figure 4a, the feedstock is confined within the gate zone, and thus comes in contact with the pressure sensor to record the evolution of pressure according to the filling stage.
For a given mold temperature (Figure 6a-b) or feedstock temperature (Figure 6c-d), the pressure in the mold cavity increases almost linearly as the filling stage gets longer to overcome the higher friction, i.e., higher mold contact surface against the feedstock flow. During these injections performed at a constant volumetric flow rate, an increase in a mold or feedstock temperature results in a decrease in injection pressure for both feedstocks. This expected trend is certainly due to the decrease in feedstock viscosity observed in Figure 2a, when the mixture becomes hotter. Indeed, a decrease in the feedstock temperature from 100 to 80°C produces an increase in its viscosity respectively from 0.5 to 0.8 Pa·s or 2 to 4.1 Pa·s for feedstocks F60 and F65 (values extracted in a typical shear rate ranging from 100 to500 s-1 in Figure 2a). These relative increases of about 160% and 205% in feedstock viscosity are proportionally correlated with the additional pressure required to inject the feedstocks at 100 and 80°C. Similarly, the viscosity difference of about 5-7 times also roughly correlates with the pressure difference required for the two feedstocks F60 and F65.
With a relative difference varying from 0 to 35%, the injection pressures predicted by the numerical model were close to those obtained experimentally. This first validation phase confirmed that the input parameters are appropriate for assessing the magnitude of the pressure experienced by the feedstock in the mold. Interestingly, the pressure values predicted in the extreme condition of the thermal transfer between the feedstock and the mold were in very good agreement with the experimental observations, with relative differences below 10%. This extreme condition consists in promoting the solidification by decreasing the mold or feedstock temperature. In Figure 6a-d, this state can be obtained (or tended to be attained) with the mold at 30°C and the feedstock at 80°C. The more accurate results obtained in this state could be explained by the fact that this specific experimental injection was performed more in line with the thermal transfer conditions implemented in the numerical model. Indeed, in the current version of Moldflow Insight 2019, the PIM module uses a constant wall temperature, and the rest of the mold shell is able to maintain this temperature low and constant, as seen in a conventional HPIM. However, and as used in the present work, LPIM molds are rarely provided with conformal cooling channels exhibiting a high capacity to quickly extract large amounts of heat. Therefore, the increase in the relative differentials between simulations and experiments as the mold or feedstock temperature increase can simply be explained by the fact that the experimental setup includes more of a slow and natural thermal transfer approach that is not taken into account by the model. In line with this assumption, the feedstock formulated at a higher solid loading exhibits a lower relative difference between experimental and numerical pressures, probably due to its higher thermal conductivity.
To reinforce this hypothesis, additional injections were performed to promote the solidification extreme condition discussed above, as well as to test a second but opposite extreme condition. On the one hand, experimental and numerical pressure values were obtained in Figure 7a in a quasi-adiabatic condition by injecting a feedstock at 90°C into a mold at 80°C to minimize significantly heat transfer at the mold/feedstock interface and avoid fast solidification during injection. On the other hand, an experimental mimic of the thermal transfer simulated by Moldflow was done by decreasing the mold temperature to 25°C and the feedstock temperature to 75°C, and is presented in Figure 7b. Note that these latter conditions represent the lowest temperatures that can be practically used at a high injection flow rate in this project to avoid early solidification. The similar results between experiments and simulations for these two extreme thermal transfer conditions presented in Figure 7 confirm that experiments that are not performed close to these conditions cannot be used to accurately validate the simulations. In other words, the slow and typical thermal transfer conditions occurring in LPIM seem to significantly drive the in-cavity pressure, which is, in fact, not properly captured by the numerical model.

3.2. Influence of injection flow rate on pressure

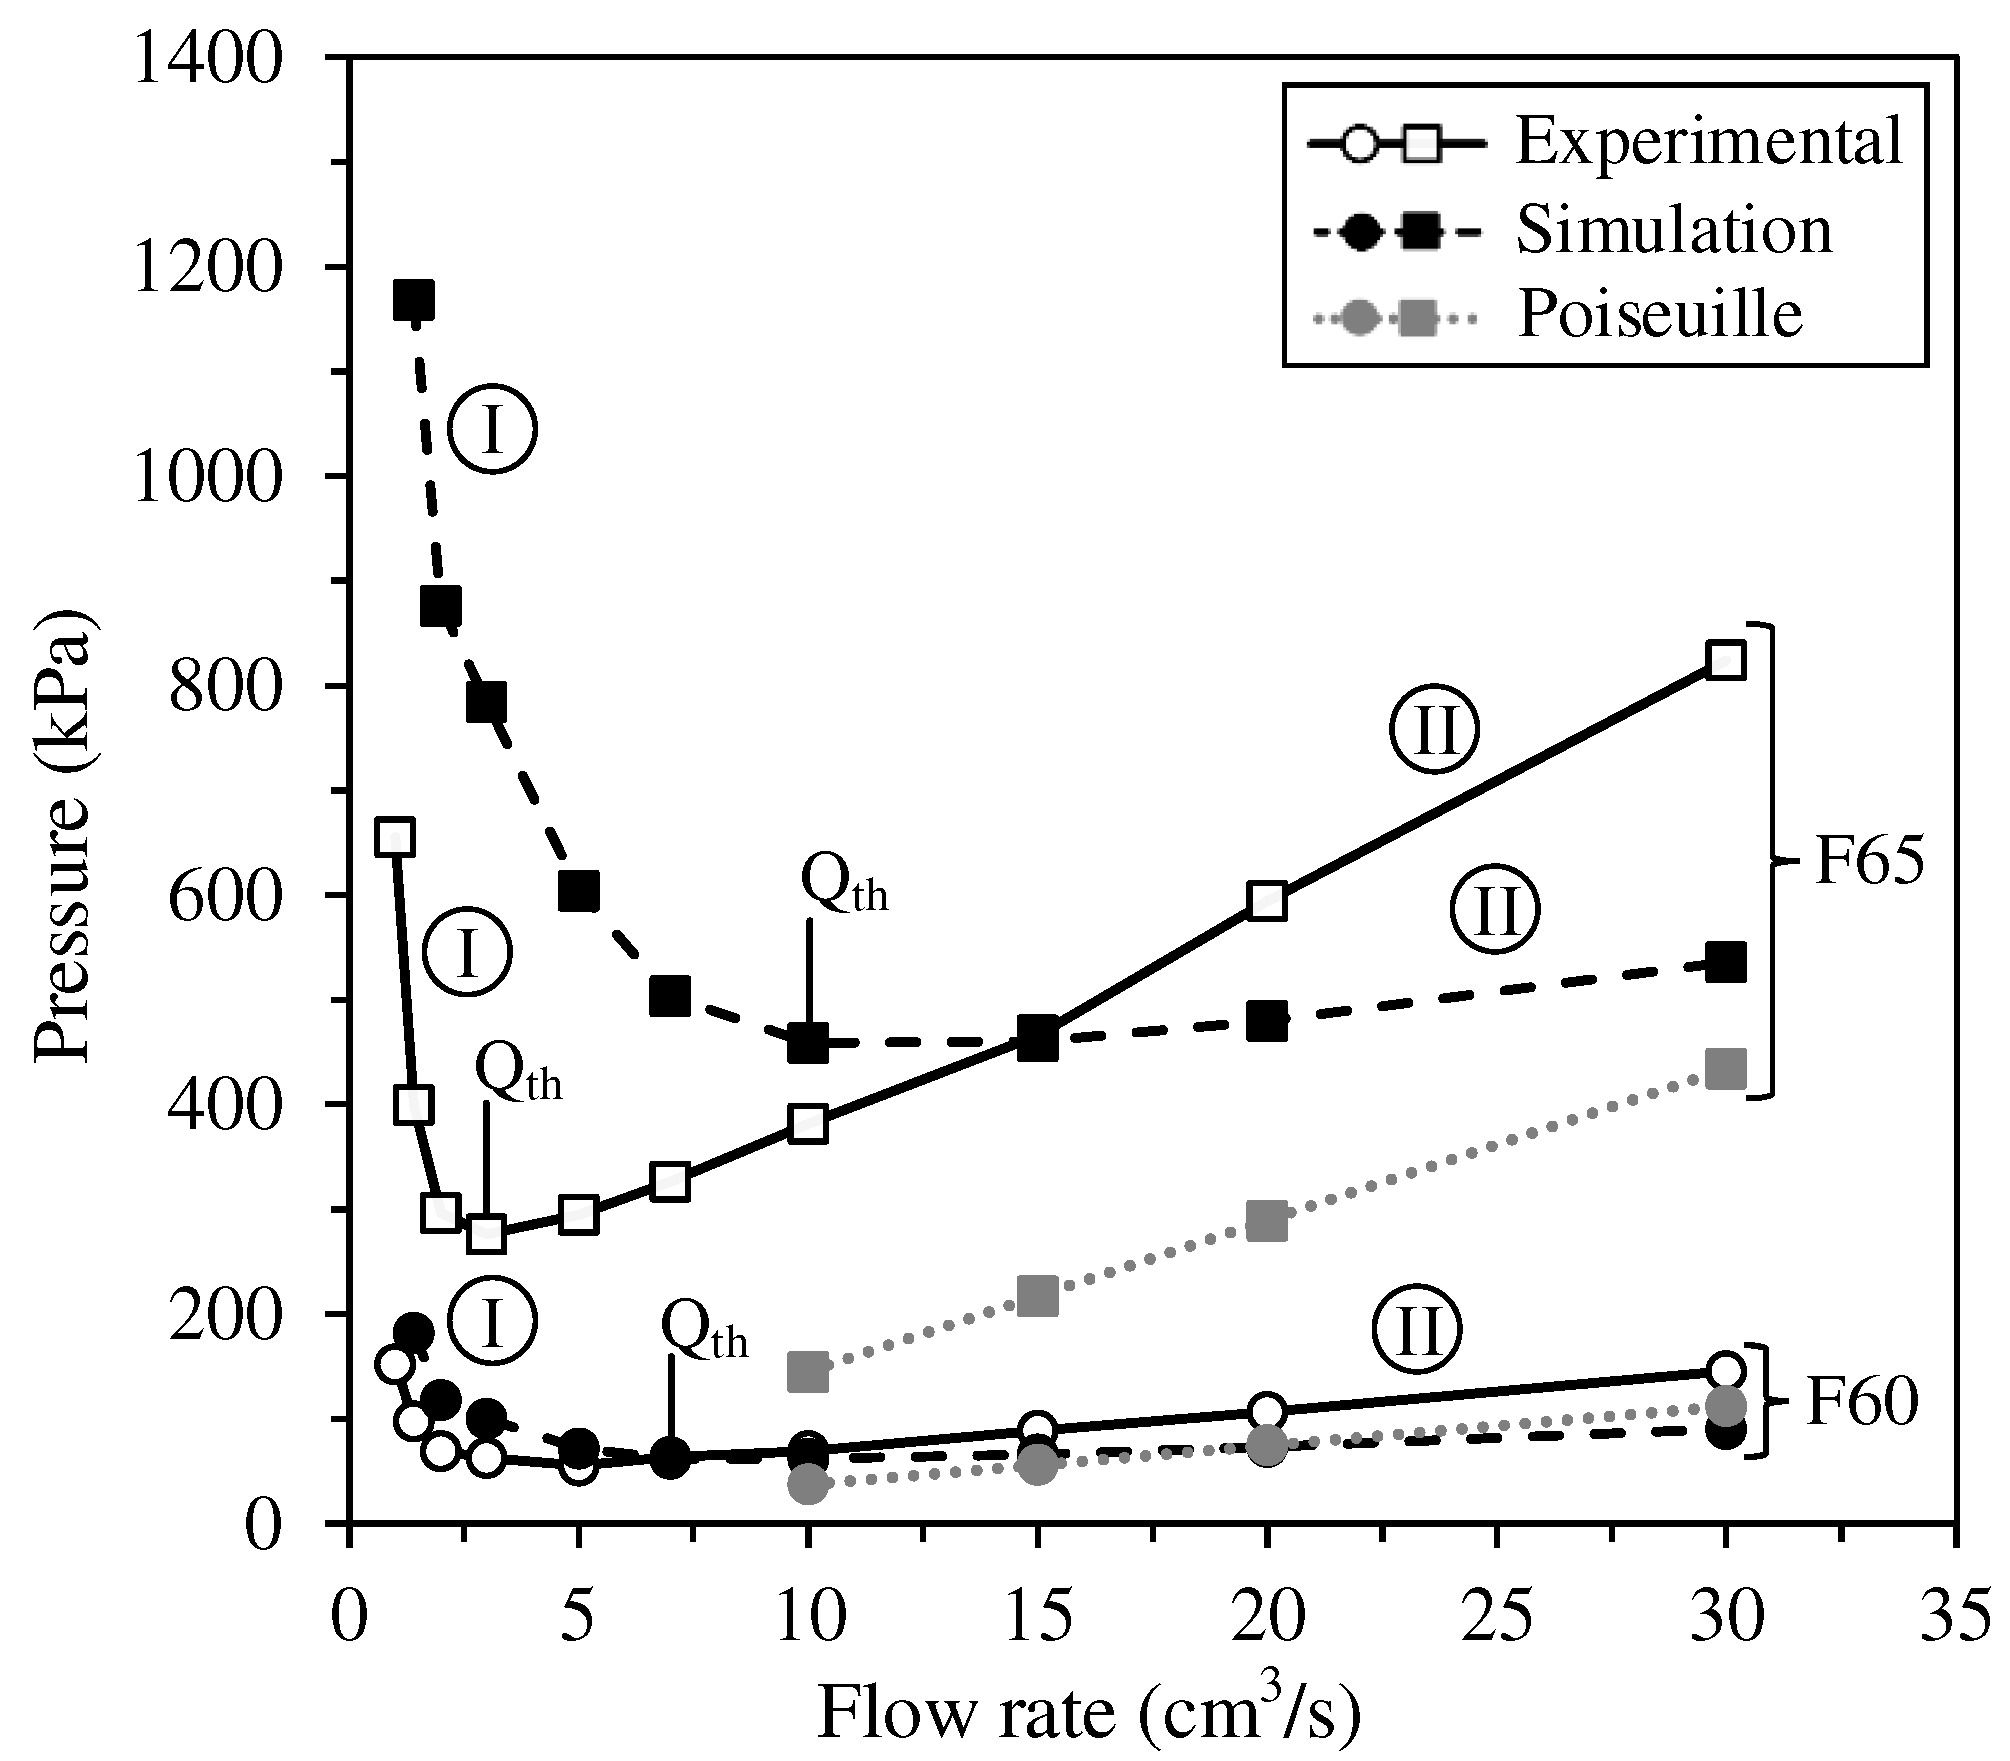
Figure 8 presents the evolution of the in-cavity pressure obtained experimentally and numerically at different injection flow rates (sequence #3 in Table 4). To that end, pressure values were extracted from pressure profiles at a mold filling stage of 85% (real-scale or simulated injections profiles similar to those presented in Figure 6). In addition to confirming the impact of solid loading on the injection pressure, these curves present an unexpected trend, which can be divided into two distinctive segments, identified as segments “I” and “II” in Figure 8. In segment I, the injection pressure obtained experimentally as well as numerically decreases as the flow rate increases, regardless of the powder volume fraction. Visual inspections on parts fabricated with these low injection flow rates confirm that this high cavity pressure originates from early feedstock solidification or partial solidification, which may lead to an increase in the feedstock viscosity, as well as in friction with the mold walls (note that the visual inspection of parts is addressed below in this work). An increase in the flow rate naturally decreases the total injection time, which reduces the volume of feedstock susceptible to solidification during the injection process, and finally, reduces the overall injection pressures.
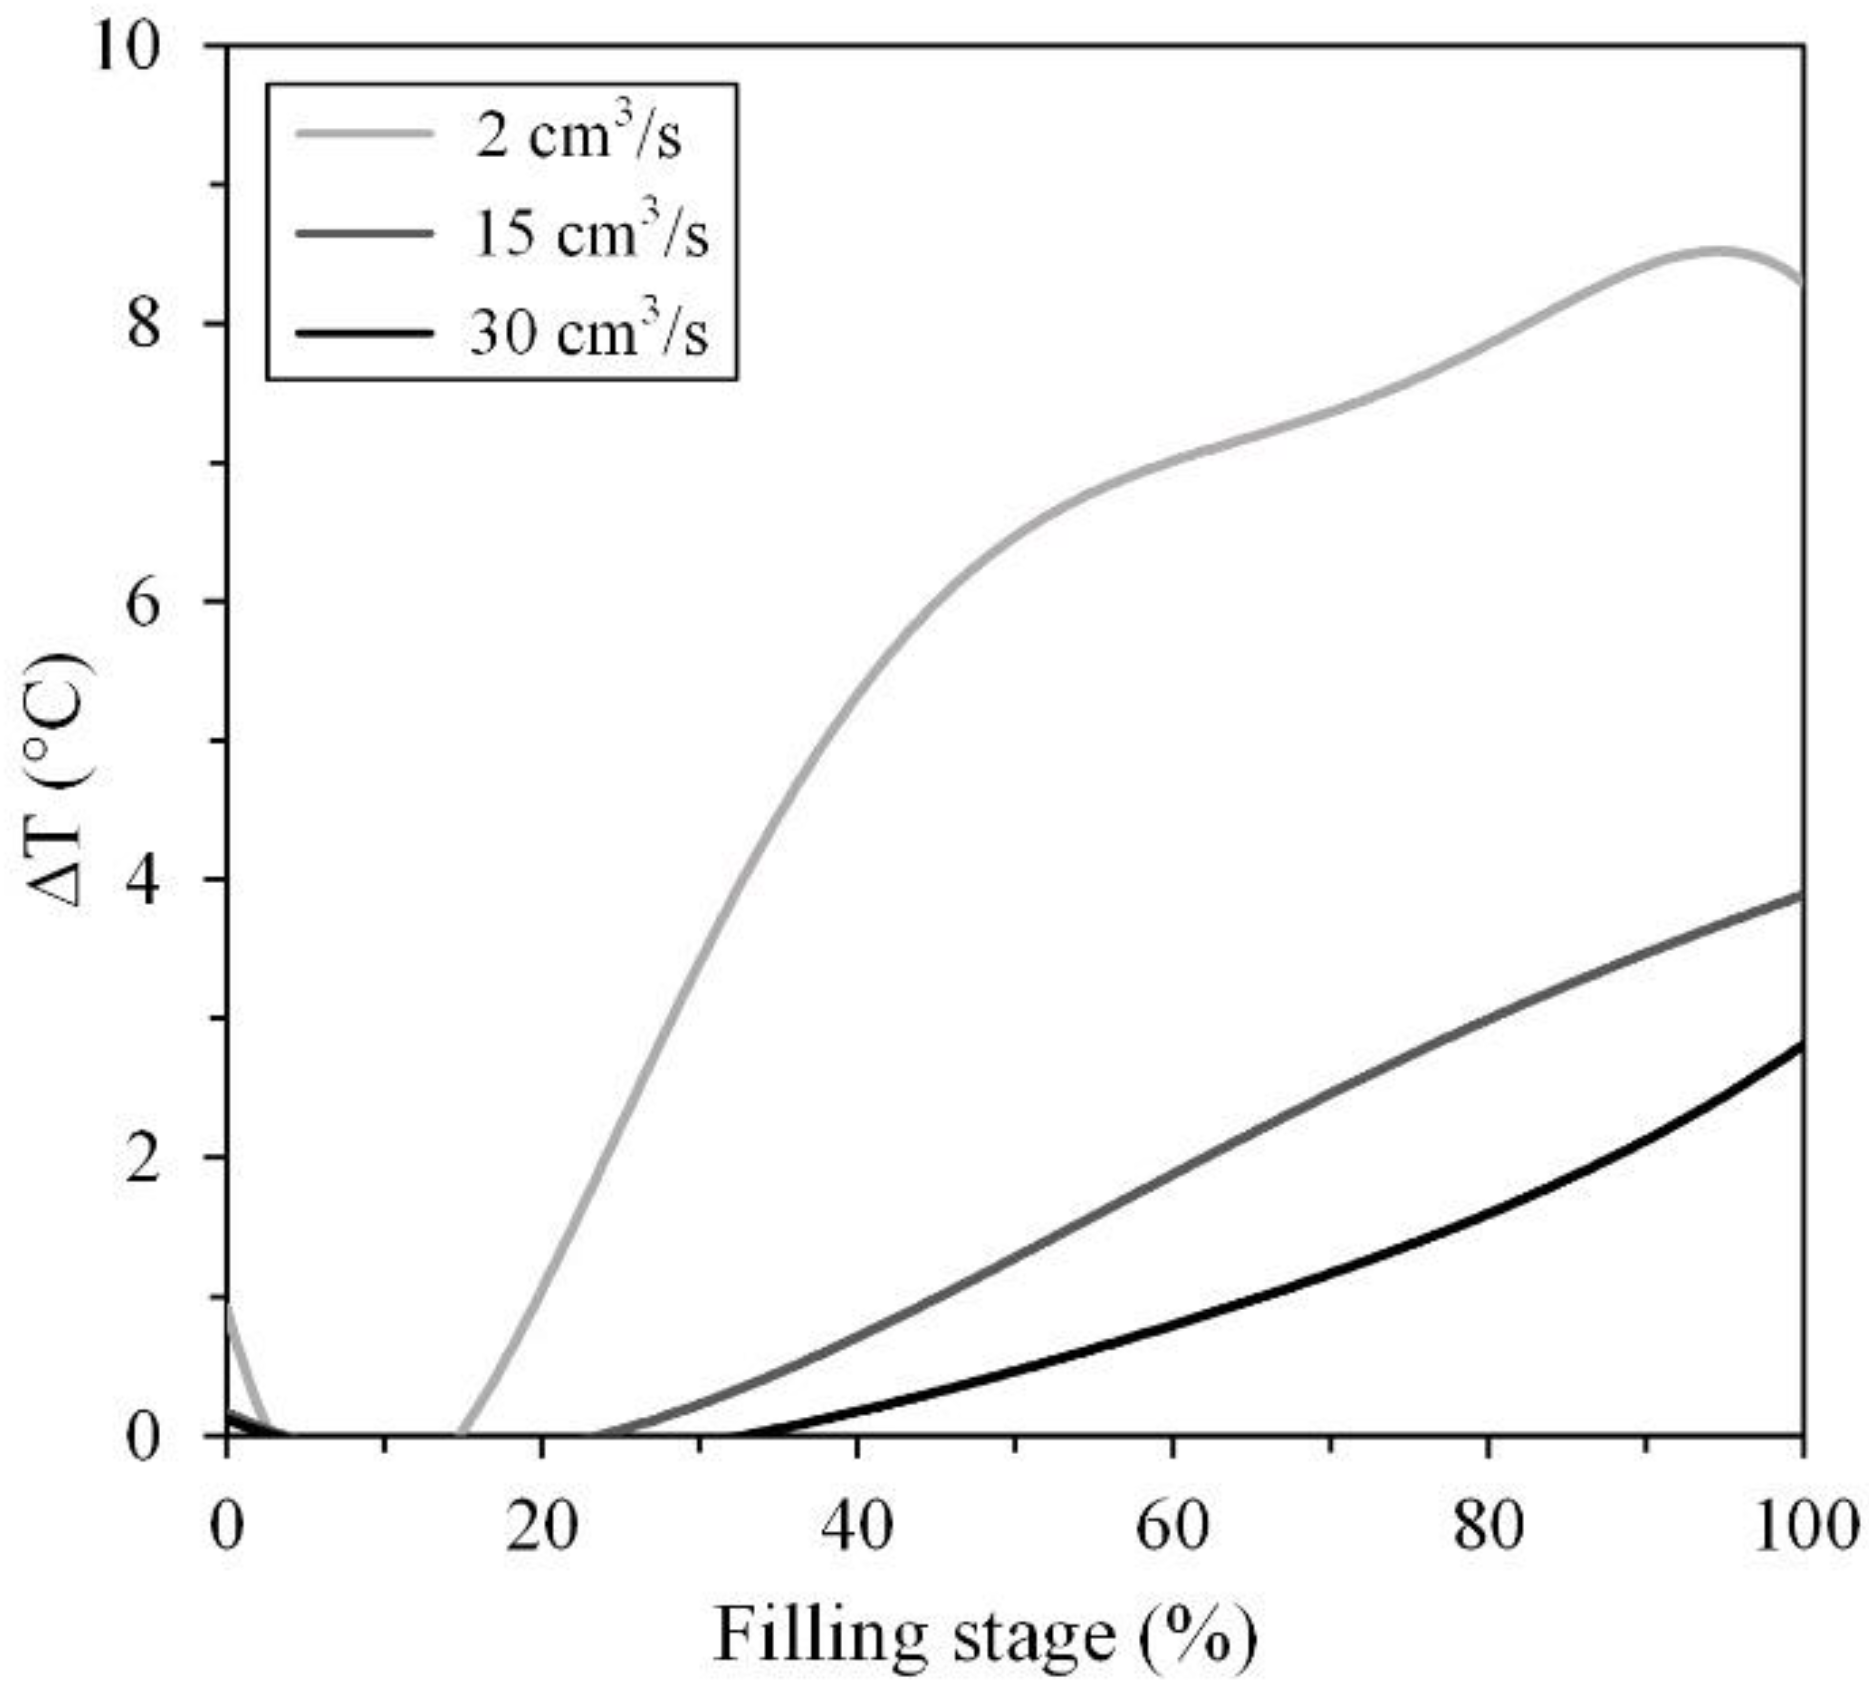
At a certain flow rate threshold (identified as Qth in Figure 8), the slope of each curve changes to exhibit a proportional increase of the pressure with the flow rate (identified as segment II in Figure 8). Such a linear trend can be also anticipated by the Poiseuille’s law P = 12 Q η L w t 3 [34], taking into account the volumetric flow Q, the cross-section dimensions of the mold w and t, the feedstock viscosity η that was extracted from Figure 2a at 100 s-1 and considered constant, and the length of the mold cavity L. Considering that all applicability conditions for such an analytic model are not gathered (e.g., Newtonian fluid), this latter equation was only used to confirm the trend and the order of magnitude for the anticipated pressure obtained for the two feedstocks. For feedstock F60, the Qth occurs with around the same flow rate of 7 cm3/s and the predictions obtained by the numerical simulations as well as those calculated by the Poiseuille’s law are in good agreement with experimental pressures. On the left-hand side of the Qth value, the model slightly overestimates the in-cavity pressure, while the opposite trend is seen on the right-hand side of the curve, where the simulations underestimate the experimental values. For feedstock F65, the same over- and underestimation trend is clearly visible. However, the curves exhibit significant discrepancies, particularly at low and high injection flow rates. Interestingly, the different Qth values obtained experimentally (Qth = 3 cm3/s) and numerically (Qth = 10 cm3/s) reinforced the assumption that the numerical model does not take into account a few parameters particularly linked with the thermal transfer conditions seen in the LPIM process. Indeed, low flow rates (e.g., 2 cm3/s) may produce injection times as long as 15 s that may heat the mold and maintain experimentally the feedstock viscosity lower than the value used in the simulations for this specific rectangular geometry. This variation of the mold temperature was experimentally recorded in Figure 9 by replacing the pressure sensor with a thermocouple holder used to introduce a thermocouple at 1 mm above the feedstock/mold interface. At the end of the injection stage, an increase of about 8-9°C was measured for a low flow rate of 2 cm3/s, but an interface heating of only 2-3°C occurring later in the process was reported for higher injection flow rates comprised between 15 and 30 cm3/s. During the same injection performed at a low flow rate (Figure 8), the numerical model imposed a significantly lower feedstock/mold interface temperature (i.e., Tmold = 40°C), which necessarily decreased the feedstock viscosity; this action created a frozen layer, or even partially solidified the feedstock, contributing to an overestimation of the pressure values in segment I of the simulated curve. For feedstock F65, the slopes of segment II obtained experimentally and numerically were also significantly different. During experiments, a change from 5 to 30 cm3/s almost tripled the pressure required for the injections. This trend, which is also clearly anticipated by the Poiseuille’s law was not captured by the simulation model, where an increase from 10 to 30 cm3/s had only a minor impact on the injection pressure. This difference in trends between the curves means that the simulated pressure is underestimated after the intersection point is exceeded, which is similar to what is observed for feedstock F60 at high flow rates. In addition to the thermal transfer conditions highlighted above, the results suggest that other experimental conditions, such as the mold surface finish, slight mold dimension variations, or minor temperature changes, were not considered by the numerical model. The influence of the flow rate on the injection pressure of low-viscosity feedstocks, quantified experimentally for the first time in the framework of this study, thus continues to be a challenge when it comes to numerically simulating since the LPIM conditions (far from those used in conventional HPIM) do not appear to be adequately implemented in the numerical model. Although the overall pressure magnitude was fairly well predicted by the simulations, future works are needed to adapt the numerical model to the specific thermal and physical conditions seen in the LPIM process.

3.3. Influence of injection flow rate on green part quality

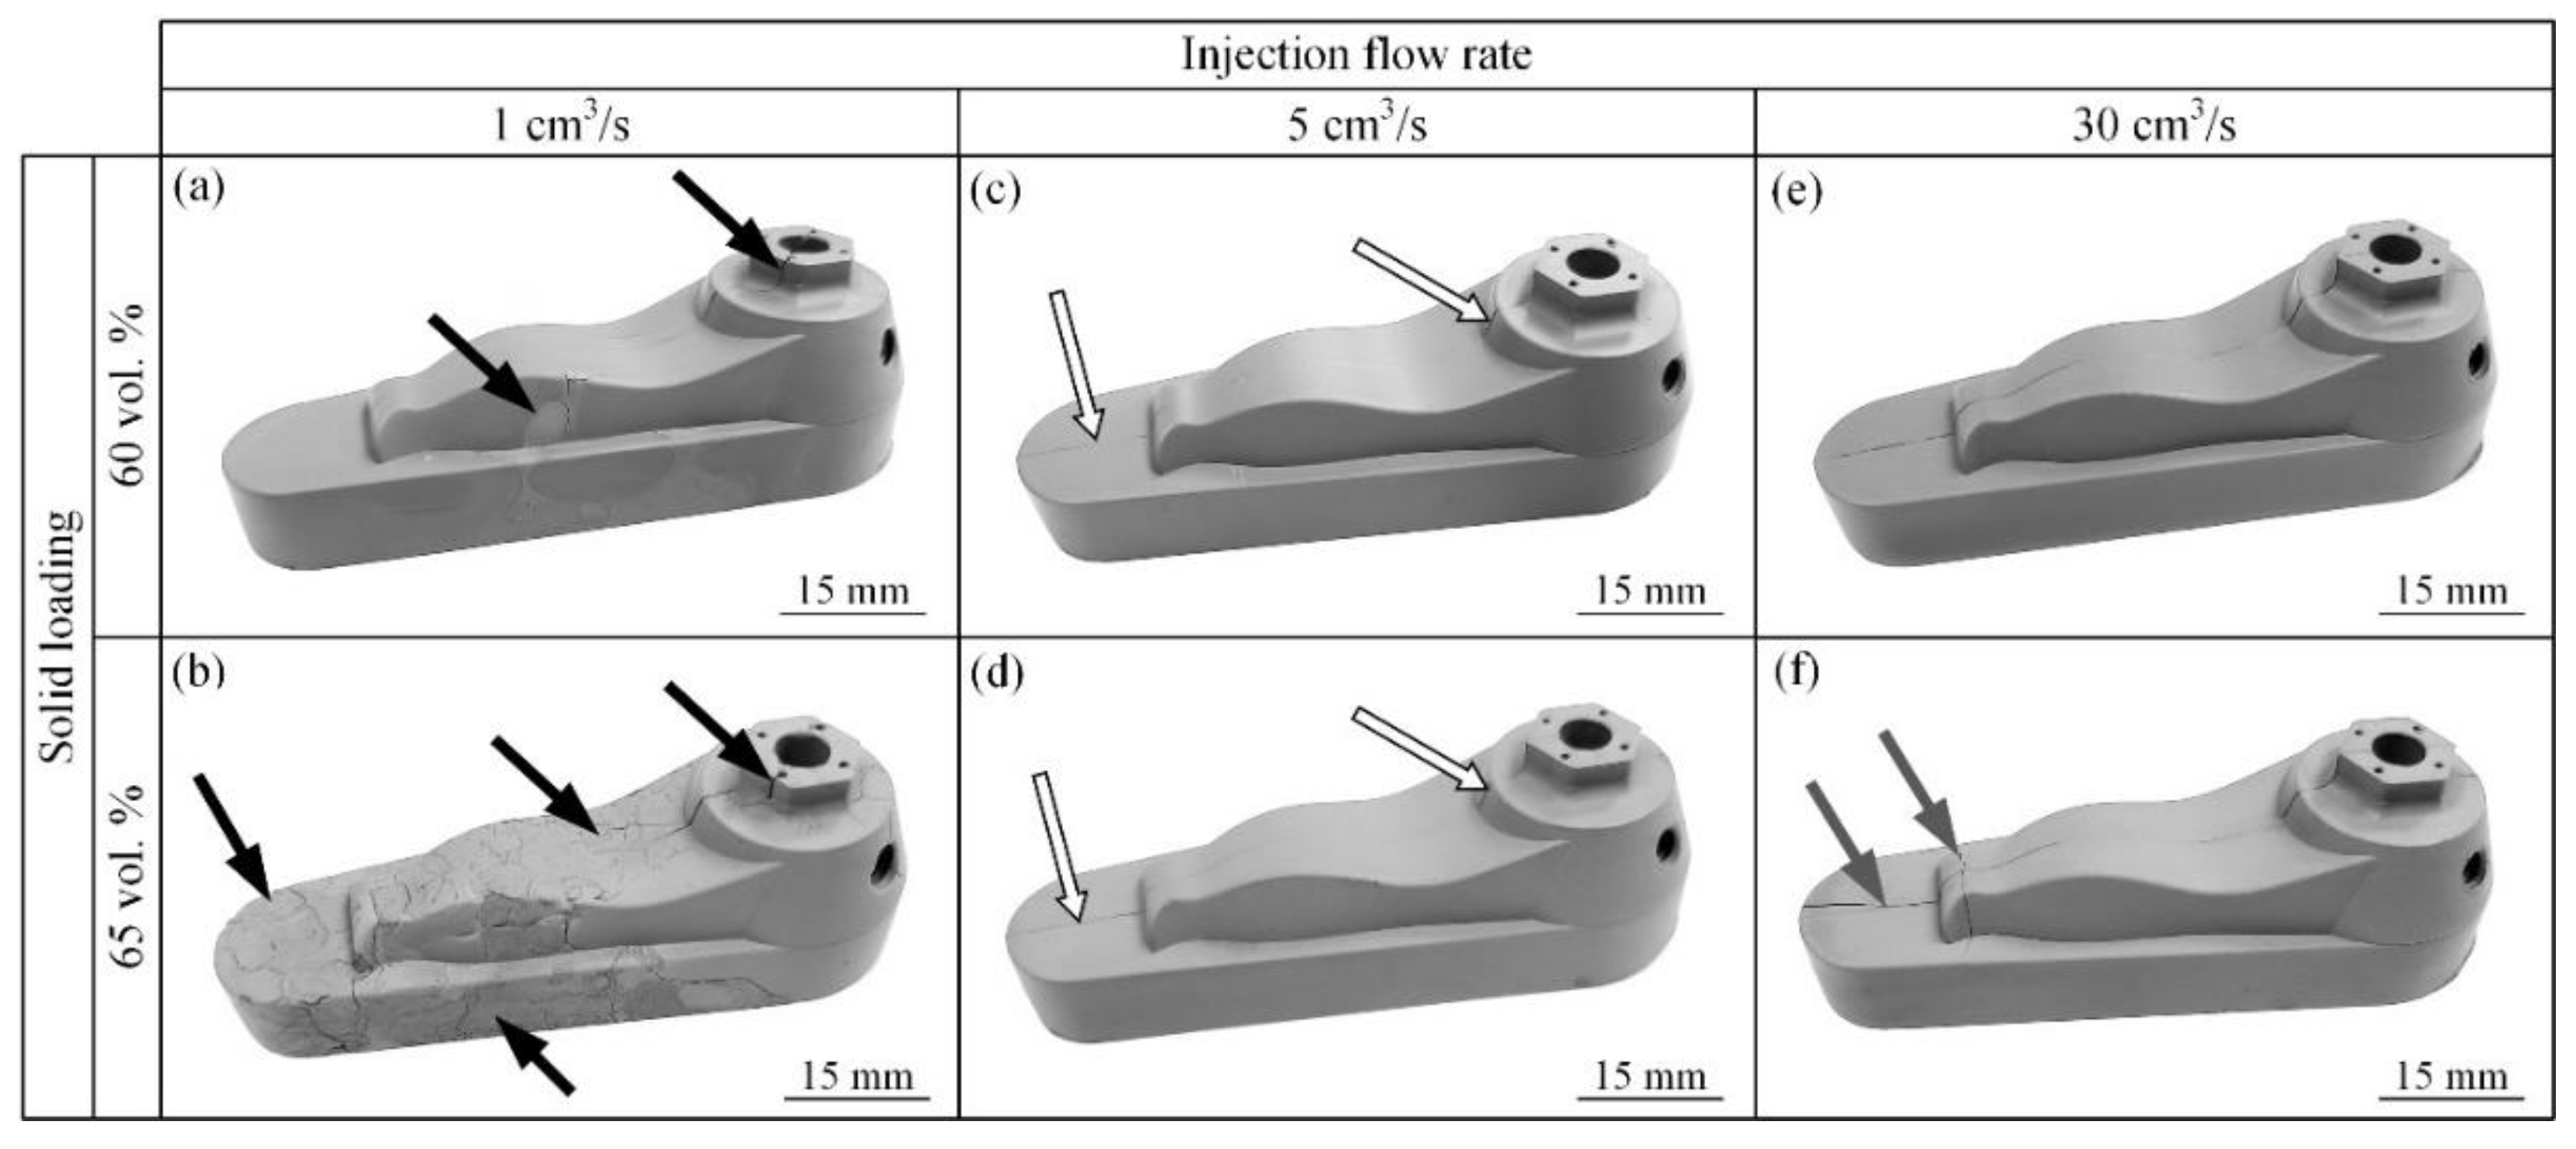
In this work, the part quality was assessed by visual inspections and quantifications of the occurrence of segregation. The complex shape parts presented in Figure 10 were injected with the two feedstocks, using three different flow rates. At a low injection flow rate of 1 cm3/s, several visual defects were revealed at the surface of the parts, as indicated by the black arrows in Figure 10a-b. At a low solid loading (feedstock F60), witness of weld lines and flow marks were scattered at the top and side of the injected parts. Similar defects were visible on the parts injected with the high solid loading feedstock (feedstock F65), in addition to clear cracks, incomplete filling, and sinks. As noted above, a too low injection flow rate seems to produce early feedstock solidification, which occurs in the presence of an increase in the powder volume fraction thanks to its higher thermal conductivity. At a moderate flow rate of 5 cm3/s, no visual surface defect was seen for the two feedstocks in Figure 10c-d. The parts were smooth, and features such as small holes, thin walls, and threaded holes were well-defined. Since this mold was opened laterally (see Figure 3i), only a small and continuous flashing, indicated by a white arrow, was visible along the parting line of parts injected under this condition. At a high flow rate of 30 cm3/s, the presence of external defects depends on the solid loading. Feedstock F60 produced the same part quality as the one obtained at a moderate flow rate (Figure 10e), but surprisingly, for feedstock F65, cracks were observed in the front area of the injected part (indicated by grey arrows in Figure 10f). Such unexpected defects may be caused by residual stress, or any local intricate pressure/shear rate pattern induced by the higher mold pressure required for this specific feedstock at high injection flow rates (see Figure 8).
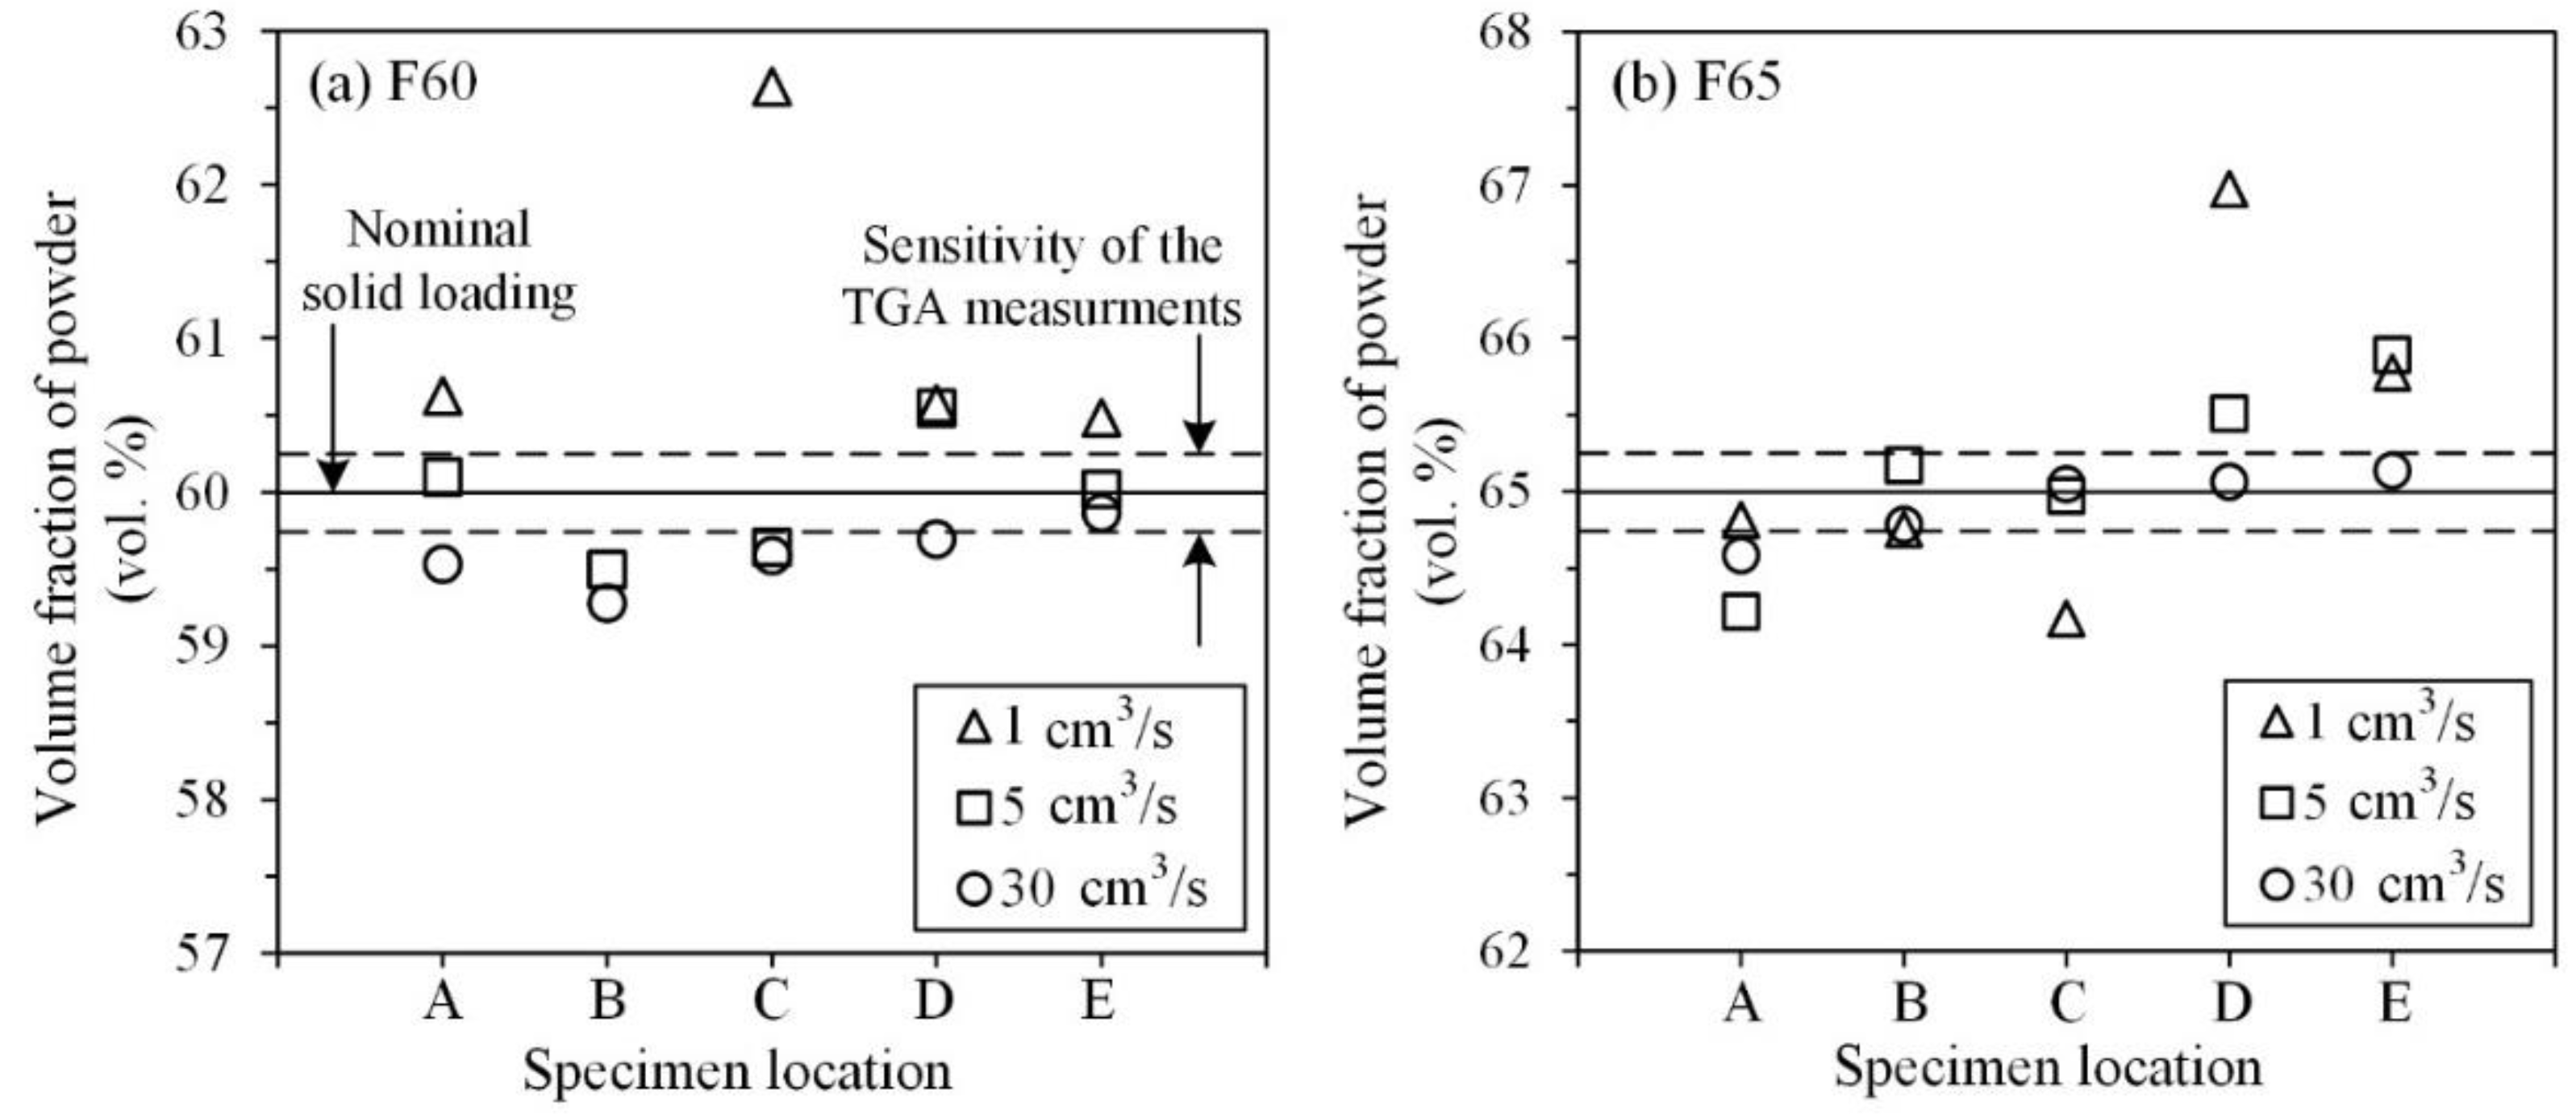
Figure 11 reports the local volume fraction of powder measured at different locations of the complex shape part presented in Figure 5. The solid lines represent the nominal solid loading of feedstocks F60 and F65, while the dashed lines denote the sensitivity limit of the TGA technique when it comes to detecting a real change in local solid loading. This detection range of ±0.25 vol. % of powder was defined in our previous work [33] and confirmed by [35]. The results obtained for feedstock F60 (Figure 11a) are within or just slightly outside the detection limit of the measurement technique. This confirms that the injection flow rate has almost no effect on variations of the powder volume fraction for this feedstock, except on the side of the part (specimen location C) injected at 1 cm3/s. This local increase of about 2.6 vol. % of powder could be caused by the early solidification clearly visible on Figure 10a., which may produce a non-uniform filing, leading to unexpected/intricate shear rate gradients, which drag more powder in this zone.
For feedstock F65 (Figure 11b), the powder volume fraction seems to be slightly lower near the gate (specimen location A) and slightly higher at the front of the part (specimen location E). This can be explained by the higher pressure required to inject such high solid loading feedstock (Figure 8) combined with an abrupt change in the injection channel within this gate/part region that was identified as a potential powder-binder separation zone by Thornagel et al. [36]. In this respect, the binder-rich zone created in the gate may finally lead to a powder-rich zone uniformly transported up the front of the injected part, i.e., the last region to be filled by the molten feedstock. Similarly to the previous feedstock, a too low flow rate of 1 cm3/s produces premature solidification zones, as shown in Figure 10b by weld lines and cracks; these zones may also contribute to locally changing the shear rate gradient, leading to the significant segregation seen on the side (specimen location C) and the front of the part (specimen locations D-E). At high solid loading and high injection flow rates, no real segregation was measured.

5. Conclusions

A laboratory injection press was developed and used to measure the mold in-cavity pressure during the low-pressure powder injection molding process (LPIM). An experimental characterization and real-scale injections were performed with two feedstocks formulated from a water-atomized 17-4PH stainless steel powder mixed with a wax-based binder system at a solid loading of 60 and 65 vol. % of powder. The feedstock properties, such as the viscosity, melting point, transition temperature, thermal conductivity, density, and specific heat capacity, were experimentally characterized and implemented as material properties in a Moldflow numerical model. The numerically obtained injection pressures were compared with experimental results using different injection parameters, such as the mold temperature, the feedstock temperature, and the injection flow rate. The influence of injection flow rates on green component quality and local segregation was experimentally studied. The investigation allowed to reach a few conclusions, which are summarized as follows:
  • An increase in mold temperature, feedstock temperature and/or a decrease in powder volume fraction produce a significant decrease in the in-cavity pressure, pointing to a strong correlation with the feedstock viscosity.
  • The unexpected decrease in injection pressure observed during an increase in flow rate from 1 cm3/s to a flow rate threshold, Qth (7 and 3 cm3/s for the 60 and 65 vol. % of powder feedstocks, respectively), was in fact due to early solidification of the feedstock and not feedstock flow behavior. Using injection flow rates > Qth, the expected linear relationship between the pressure and feedstock flow was observed.
  • The presence of visual defects was significantly reduced for injections at moderate flow rates, but an absence of the segregation phenomenon throughout green parts was seen when using high injection flow rates.
  • The simulation model was able to capture the injection pressure only when the injection flow rate was maintained constant or when thermal transfer conditions were extreme (where solidification was promoted or avoided by decreasing or increasing the mold temperature). This suggests that the thermal behavior observed in the LPIM process (which is significantly different from the one seen in conventional HPIM) could not properly be taken into account in the model. Since this work represents, to the best of authors’ knowledge, the first experimental validation of the simulated pressure in LPIM, future works addressing this issue are thus needed to accuratly predict the numerical mold cavity pressure for LPIM feedstocks when different injection flow rates are used.

Author Contributions

Francis Arès: Methodology, Numerical Simulations, Validation, Writing - Original Draft, Visualization. Dorian Delbergue: Methodology, Writing - Original Draft, Visualization. Vincent Demers: Supervision, Conceptualization, Project administration, Writing - Review & Editing.

Funding

This work was carried out with the financial support of the Natural Science and Engineering Research Council (NSERC, RDCPJ 531851 - 18).

Data Availability Statement

The datasets generated during the current study are available from the corresponding author on reasonable request.

Conflicts of Interest

The authors declare no conflict of interest.

References

  1. González-Gutiérrez, J.; Stringari, G.B.; Emri, I. Powder injection molding of metal and ceramic parts, IntechOpen 2012; pp. 65-88. [CrossRef]
  2. Heaney, D.F. Handbook of metal injection molding, 2nd ed., Woodhead Publishing, 2019; pp. 1-656.
  3. Sulong, A.B.; Muhamad, N.; Arifin, A.; Yong, K.B. Optimizing injection parameter of metal injection molding processes using the feedstock of 16 μm stainless steel powder (SS316L), PEG, PMMA and stearic acid, J. Appl. Sci. Res., 2012, 8, 2998-3003.
  4. Demers, V. Low-pressure powder injection moulding review: enabling cost effective low and high volume PIM production, Powder Inject. Mould. Int., 2019, 13, 53-63.
  5. German, R.; Bose, A. Injection molding of metals ceramics, Metal Powder Industries Federation, Princeton, New Jersey, 1997; pp. 1-413.
  6. Costa, C.A.; Pasquali, F.M. Application of rapid tooling and rapid prototyping in low pressure injection molding process of ceramic parts, International Conference on Polymers and Moulds Innovations – PMI2014, Guimaraes, Portugal, 2014.
  7. Pompe, R.; Brandt, J. Goceram's MEDPIMOULD technology offers cost-effective PIM production, Met. Powder Rep., 2001, 56, 14-17.
  8. Zampieron, J.V.; Soares, J.P.; Mathias, F.; Rossi, J.L.; Ambrozio Filho, F. Low Pressure Powder Injection Moulding of Stainless Steel Powders, Key Eng. Mater., 2001, 189-191, 610-615. [CrossRef]
  9. Mangels, J.A.; Williams, R.M. Injection Molding Ceramics to High Green Densities, Am. Ceram. Soc. Bull., 1983, 62, 601-606.
  10. Peltsman, M.I.; Peltsman, I.D. Low pressure hot molding machine, Patent US 4416603, 1983.
  11. Mangels John, A. Low-pressure injection molding, Am. Ceram. Soc. Bull., 1994, 73, 37-41.
  12. Goncalves, A.C. Metallic powder injection molding using low pressure, J. Mater. Process. Technol., 2001, 118, 193-198. [CrossRef]
  13. Quevedo Nogueira, R.E.F.; Bezerra, A.C.; dos Santos, F.C.; Sousa, M.R.d.; Acchar, W. Low-Pressure Injection Molding of Alumina Ceramics Using a Carnauba Wax Binder: Preliminary Results, Key Eng. Mater., 2001, 189-191, 67-72. [CrossRef]
  14. Piotter, V.; Bauer, W.; Knitter, R.; Mueller, M.; Mueller, T.; Plewa, K .Powder injection moulding of metallic and ceramic micro parts, Microsyst. Technol., 2011, 17, 251-263. [CrossRef]
  15. Çetinel, F.A.; Bauer, W.; Knitter, R.; Haußelt, J. Factors affecting strength and shape retention of zirconia micro bending bars during thermal debinding, Ceram. Int., 2011, 37, 2809-2820. [CrossRef]
  16. Medvedovski, E.; Peltsman, M. Low pressure injection moulding mass production technology of complex shape advanced ceramic components, Adv. Appl. Ceram., 2013,111, 333-344. [CrossRef]
  17. Sardarian, M.; Mirzaee, O.; Habibolahzadeh, A. Influence of injection temperature and pressure on the properties of alumina parts fabricated by low pressure injection molding (LPIM), Ceram. Int., 2017, 43, 4785-4793. [CrossRef]
  18. Atre, S.V.; Park, S.J.; Zauner, R.; German, R.M. Process simulation of powder injection moulding: identification of significant parameters during mould filling phase, Powder Metall., 2007, 50, 76-85. [CrossRef]
  19. Muangwaeng, B.; Rojananan, S.; Rojananan, S. The Effect of Injection Parameters on Morphology in Metal Injection Moulding, Adv. Mater. Res., 2013, 802, 174-178.
  20. Walcher, H.; Knöpfle, C.; Maetzig, M. Influence of Process Parameter on the Quality of MIM Parts, European Congress and Exhibition on Powder Metallurgy, The European Powder Metallurgy Association, Shrewsbury, England, 2016.
  21. Huang, M.S.; Hsu, H.C. Influence of injection moulding and sintering parameters on properties of 316L MIM compact, Powder Metall., 2011, 54, 299-307. [CrossRef]
  22. Amin, S.Y. M.; Muhamad, N.; Jamaludin, K.R. Optimization of Injection Molding Parameters for WC-Co Feedstocks, J. Teknol., 2013, 63, 51-54. [CrossRef]
  23. Askari, A.; Momeni, V. Rheological investigation and injection optimization of Fe–2Ni–2Cu feedstock for metal injection molding process, Mater. Chem. Phys., 2021, 271, 1-10. [CrossRef]
  24. Yang, S.; Zhang, R.; Qu, X. Optimization and evaluation of metal injection molding by using X-ray tomography, Mater. Charact., 2015,104, 107-115. [CrossRef]
  25. Sardarian, M.; Mirzaee, O. Habibolahzadeh, A. Numerical simulation and experimental investigation on jetting phenomenon in low pressure injection molding (LPIM) of alumina, J. Mater. Process. Technol., 2017, 243, 374-380. [CrossRef]
  26. ASTM, B923–16: Standard Test Method for Metal Powder Skeletal Density by Helium or Nitrogen Pycnometry, ASTM International, West Conshohocken, PA, 2016.
  27. ASTM, D3418–15: Standard Test Method for Transition Temperatures and Enthalpies of Fusion and Crystallization of Polymers by Differential Scanning Calorimetry, ASTM International, West Conshohocken, PA, 2015.
  28. ASTM, E1269-11: Standard Test Method for Determining Specific Heat Capacity by Differential Scanning Calorimetry, ASTM International, West Conshohocken, PA, 2011.
  29. ASTM, D5930-17: Standard Test Method for Thermal Conductivity of Plastics by Means of a Transient Line-Source Technique, ASTM International, West Conshohocken, PA, 2017.
  30. Lamarre, S.G.; Demers, V.; Chatelain, J.-F. Low-pressure powder injection molding using an innovative injection press concept, Int. J. Adv. Manuf. Technol., 2017, 91, 2595-2605. [CrossRef]
  31. Lamarre, S.G.; Demers, V.; Chatelain, J.-F. A low-pressure powder injection molding machine and method, USA Patent (Patent No. 10,919,092), 2021.
  32. Ilinca, F.; Hétu, J.-F.; Derdoufu, A.; Stevenson, J. Metal injection molding: 3D modeling of nonisothermal filling, Polymer Eng. & Sci., 2002,42, 760-770. [CrossRef]
  33. Demers, V.; Fareh, F.; Turenne, S.; Demarquette, N.R.; Scalzo, O. Experimental study on moldability and segregation of Inconel 718 feedstocks used in low-pressure powder injection molding, Adv. Powder. Technol., 2018, 29, 180-190. [CrossRef]
  34. Malkin, A.I.; Isayev, A.I. Rheology: concepts, methods, and applications, Fourth ed., ChemTec Publishing 2022.
  35. Poh, L.; Della, C.; Ying, S.; Goh, C.; Li, Y. Powder distribution on powder injection moulding of ceramic green compacts using thermogravimetric analysis and differential scanning calorimetry, Powder Technol., 2018,328, 256-263. [CrossRef]
  36. Thornagel, M.; Schwittay, V.; Hartmann, G. Powder-binder segregation: PIM-simulation at breakthrough, Euro PM 2014 International Conference and Exhibition, European Powder Metallurgy Association (EPMA), Salzburg, Austria, 2014.
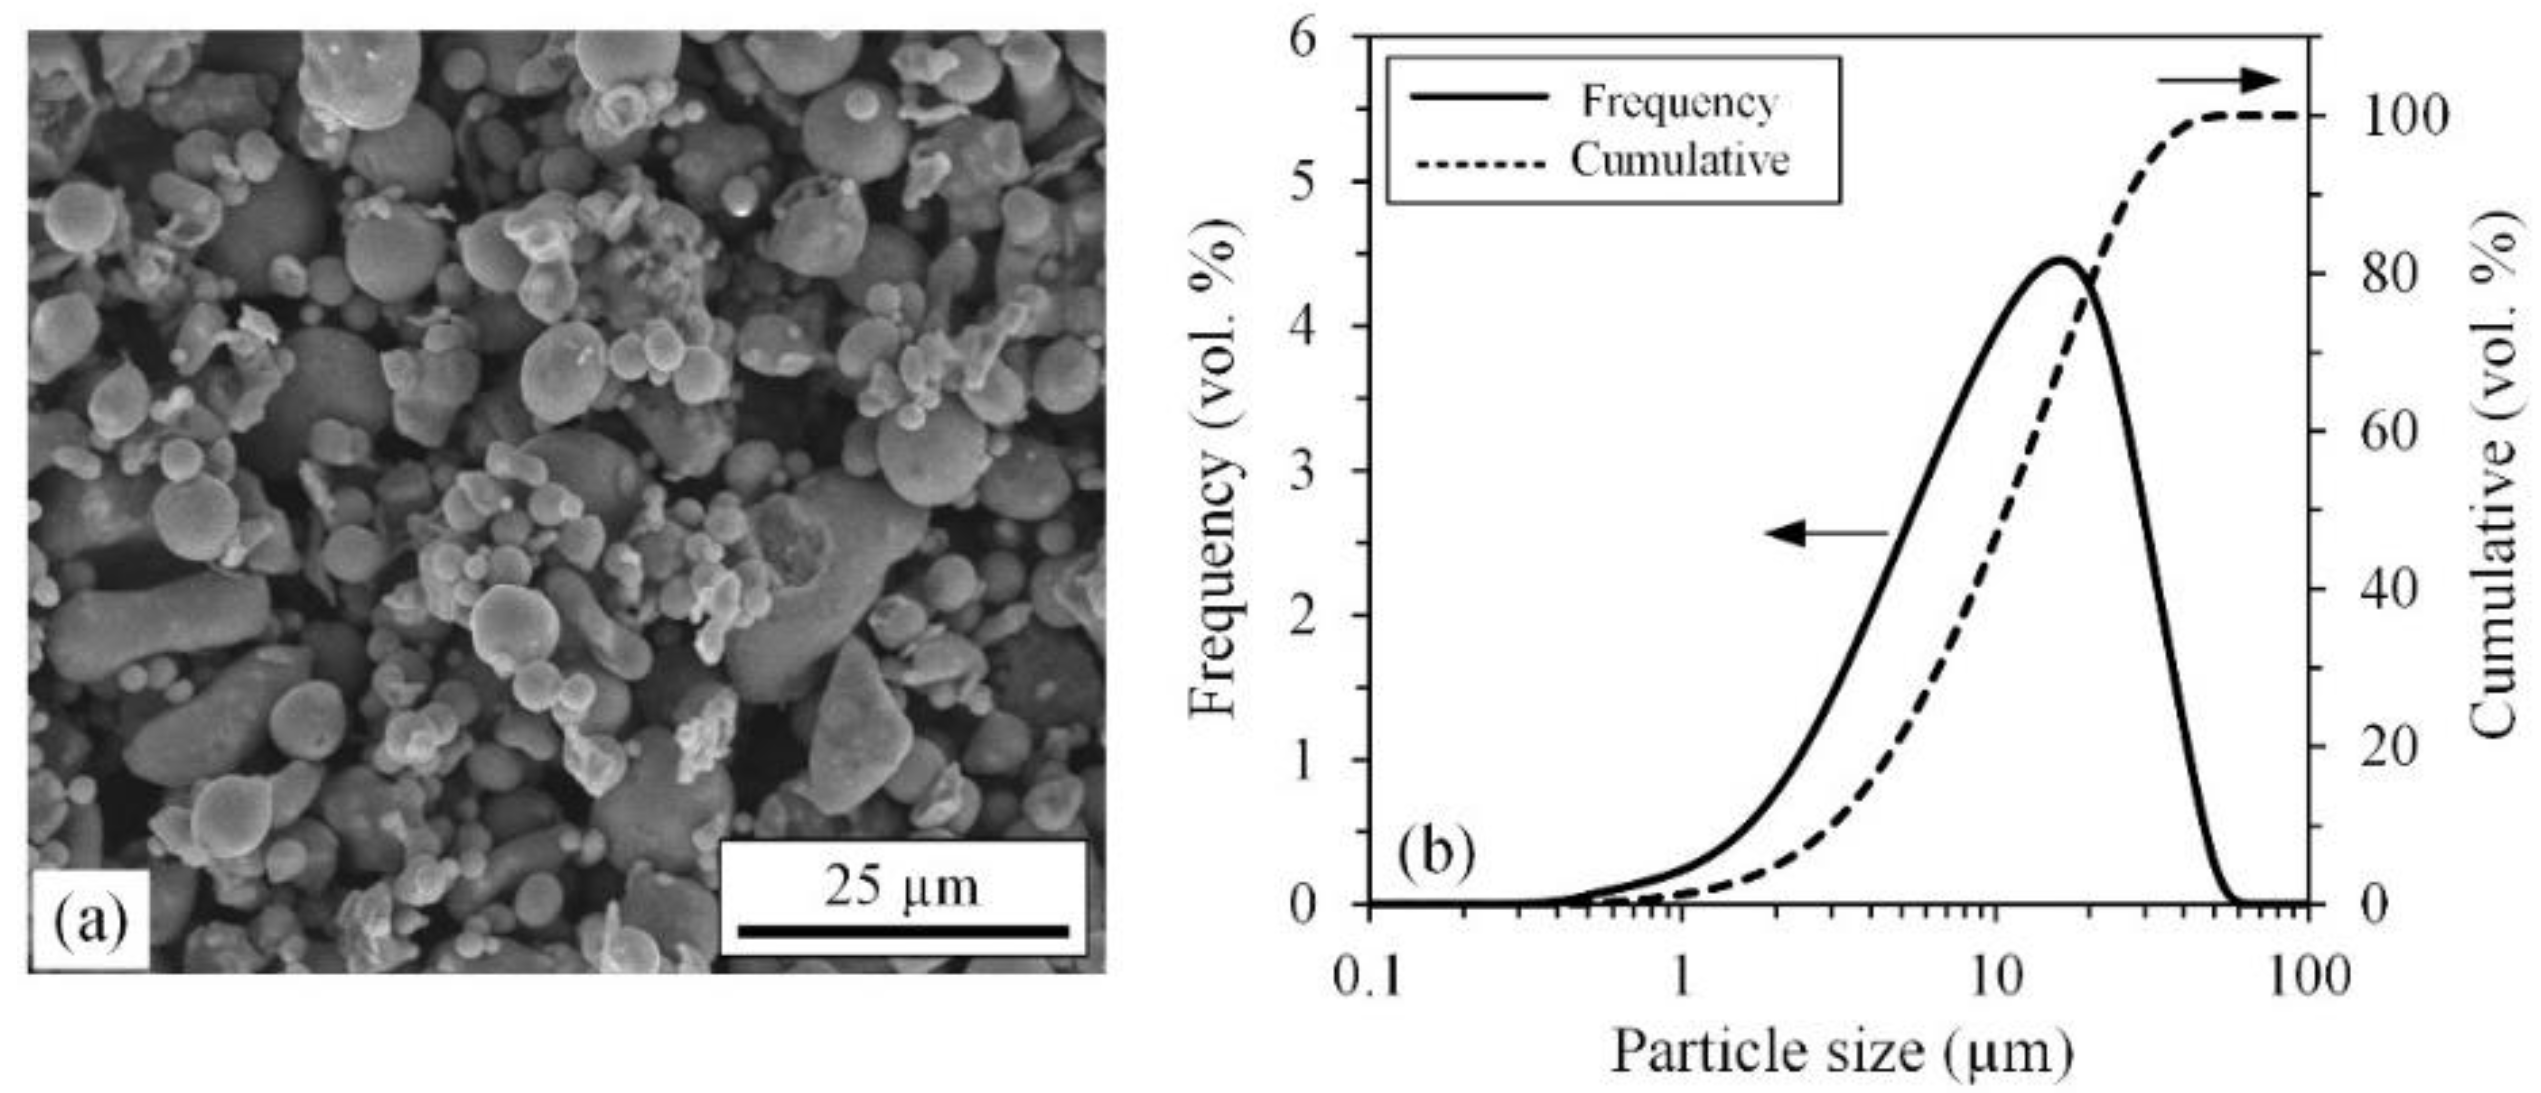
Figure 1. (a) SEM observation; (b) particle size distribution of the 17-4 PH powder.
Preprints 84966 g001
Figure 2. Rheological and thermal properties of feedstocks F60 and F65(a) viscosity profiles, (b) DSC thermograms, (c) specific heat, and (d) thermal conductivity measured at different temperatures.
Preprints 84966 g002
Figure 3. (a) General view of the injection system in mixing position, (b-g) partial cross-section views of the injection system detailing the injection sequence, (h) rectangular mold, and (i) complex shape mold.
Preprints 84966 g003
Figure 4. Representation of the (a) rectangular part, and (b) complex shape part with the superimposed finite element meshing.
Preprints 84966 g004
Figure 5. (a) Rear, side, front, and top views of a typical complex shape green part showing the positions (A to E) of the extracted specimens for TGA tests, and (b) typical TGA curve used for quantification of powder concentration within an injected specimen.
Preprints 84966 g005
Figure 6. Influence of mold (a-b) and feedstock temperatures (c-d) on experimental and numerical in-cavity pressure for the feedstocks F60 and F65 (constant flow rate of 15 cm3/s), and (e-f) extreme injection conditions obtained experimentally and numerically.
Preprints 84966 g006
Figure 7. Extreme injection conditions (high and low Tmold) obtained experimentally and numerically.
Preprints 84966 g007
Figure 8. Comparison of experimental and simulated in-cavity pressures obtained at different injection flow rates (values extracted from the pressure profiles at a mold filling stage of 85%).
Preprints 84966 g008
Figure 9. Mold temperature variation during injection.
Preprints 84966 g009
Figure 10. Influence of the feedstocks and flow rates on visual part quality.
Preprints 84966 g010
Figure 11. Powder volume fraction (vol. %) measured at different specimen location on complex shape parts injected at flow rate using the feedstocks (a) F60, and (b) F65.
Preprints 84966 g011
Table 1. Volume fraction of the powder and polymeric constituents used for feedstock formulations.
Vol. %
Feedstock Powder Paraffin wax Carnauba wax Stearic acid Ethylene- vinyl acetate
F60 60 30 7 2 1
F65 65 25 7 2 1
Table 2. Physical properties of the constituents used for feedstock formulation.
Constituents Melting point (°C) Density (g/cm³) Supplier
17-4PH powder ˃ 1404 7.69 Epson Atmix Corp.
Paraffin wax 59.0 0.90 Sigma-Aldrich
Carnauba wax 84.5 1.00 Sigma-Aldrich
Stearic acid 75.0 0.90 Sigma-Aldrich
Ethylene vinyl acetate 49.0 0.98 Dupont
Table 3. Second-order data-fitted coefficients for feedstocks F60 and F65.
Fitted Coefficient F60 F65
A 5.574 7.819
B -3.987 E-1 -5.569 E-1
C -4.136 E-2 -7.336 E-2
D 5.850 E-2 6.149 E-2
E -5.047 E-1 -1.967 E-1
F 1.169 E-4 2.645 E-4
Table 4. Process parameters used for numerical simulations and real-scale injections.
Sequence Mold
temperature (°C)
Feedstock temperature (°C) Flow rate (cm3/s) Solid loading(vol. %) Mold type
1 30 90 15 60/65 Rectangular
40
50
2 40 80 15 60/65 Rectangular
90
100
3 40 90 1 60/65 Rectangular
2
3
5
7
10
15
20
30
4 40 90 1 60/65 Complex shape
5
30
Disclaimer/Publisher’s Note: The statements, opinions and data contained in all publications are solely those of the individual author(s) and contributor(s) and not of MDPI and/or the editor(s). MDPI and/or the editor(s) disclaim responsibility for any injury to people or property resulting from any ideas, methods, instructions or products referred to in the content.
Copyright: This open access article is published under a Creative Commons CC BY 4.0 license, which permit the free download, distribution, and reuse, provided that the author and preprint are cited in any reuse.
Prerpints.org logo

Preprints.org is a free preprint server supported by MDPI in Basel, Switzerland.

Subscribe

© 2024 MDPI (Basel, Switzerland) unless otherwise stated