1. Introduction
Perilla frutescens has been widely used as an edible and medicinal plant for hundreds of years in Asian countries. In particular, folk medicine has used perilla leaves as an antidote, antibiotic, and antipyretic [
1]. Medicinal plants with antioxidant activity are still used as a source of medicines and nutraceuticals to reduce the action of free radicals and oxidative stress in the body [
2,
3,
4]. Besides, perilla contains polyphenols and other bioactive substances [
5,
6] and shows high antioxidant [
7], anti-inflammatory [
8] and amyloid-β (Aβ) aggregation inhibitiory activities [
9], and they are implicated in the progress of Alzheimer’s disease [
10,
11,
12,
13].
3-(3,4-Dihydroxyphenyl)-2-{[(2E)-3-(3,4-dihydroxyphenyl)-2-propenoyl]oxy}propanoic acid (rosmarinic acid, RA) is an attractive phytochemical among the polyphenols in perilla and other Lamiaceae plants. This natural phenolic acid has many attractive biological and pharmacological properties, including antioxidant, anti-inflammatory, antibacterial, antidepressant, and anti-carcinogenic effects [
14].
Previously, we screened over 500 natural resources and foods produced mainly in Hokkaido for Aβ aggregation inhibitory activity.
Perilla frutescens var.
crispa from Shiranuka-town, Hokkaido, showed a remarkably high Aβ aggregation inhibitory activity [
15]. The activity of perilla (EC
50 = 0.48 µg/mL) was about 40 times higher than spearmint (EC
50 = 18 µg/mL), the most active spice [
16,
17].
However, whereas the growth stage and environment influence the constituent of content and functionalities of perilla leaves and fluctuate daily [
18,
19,
20], the major methods for measuring plant constituent content and functionality are cumbersome and cannot be readily estimated on-site.
On-site measurement methods for constituents reported thus far include imaging techniques, which have recently been used to indirectly estimate the contents of components such as chlorophyll from hyperspectral satellite images; however, they require complex and expensive hardware and time-consuming data processing [
21,
22,
23]. Various handheld optical systems (e.g., GreensekkerTM, atleaf+, SPAD502) have also been developed [
24,
25,
26], but can only estimate chlorophyll levels in small areas of 3×2 mm² and are expensive.Many of the studies that have been reported to estimate component amounts from spectra obtained with small instruments have obtained high correlations by using leaves obtained from the same individual on the same collection date [
27,
28]. Therefore, it is necessary to verify whether the method of predicting the amount of plant components from these results can be applied to estimating the amount of components that vary depending on the environment and time of year, and whether the optimal harvest time can be determined from these results.
Thus, in this study, to develop a convenient on-site measurement method for simultaneously estimating the contents of constituents, and functionalities from leaf fluorescence spectra without destroying the leaf itself, we analyzed the correlation between the fluorescence spectral data observed by irradiating leaves with UV and visible light [
29] and the contents of constituents and functional values obtained from leaf extracts. This allows convenient, simultaneous, and nondestructive monitoring of not only the constituents, but also the functionalities of perilla leaves and a simple harvest-time diagnosis.
2. Results
2.1. Fluorescence spectra of perilla leaves
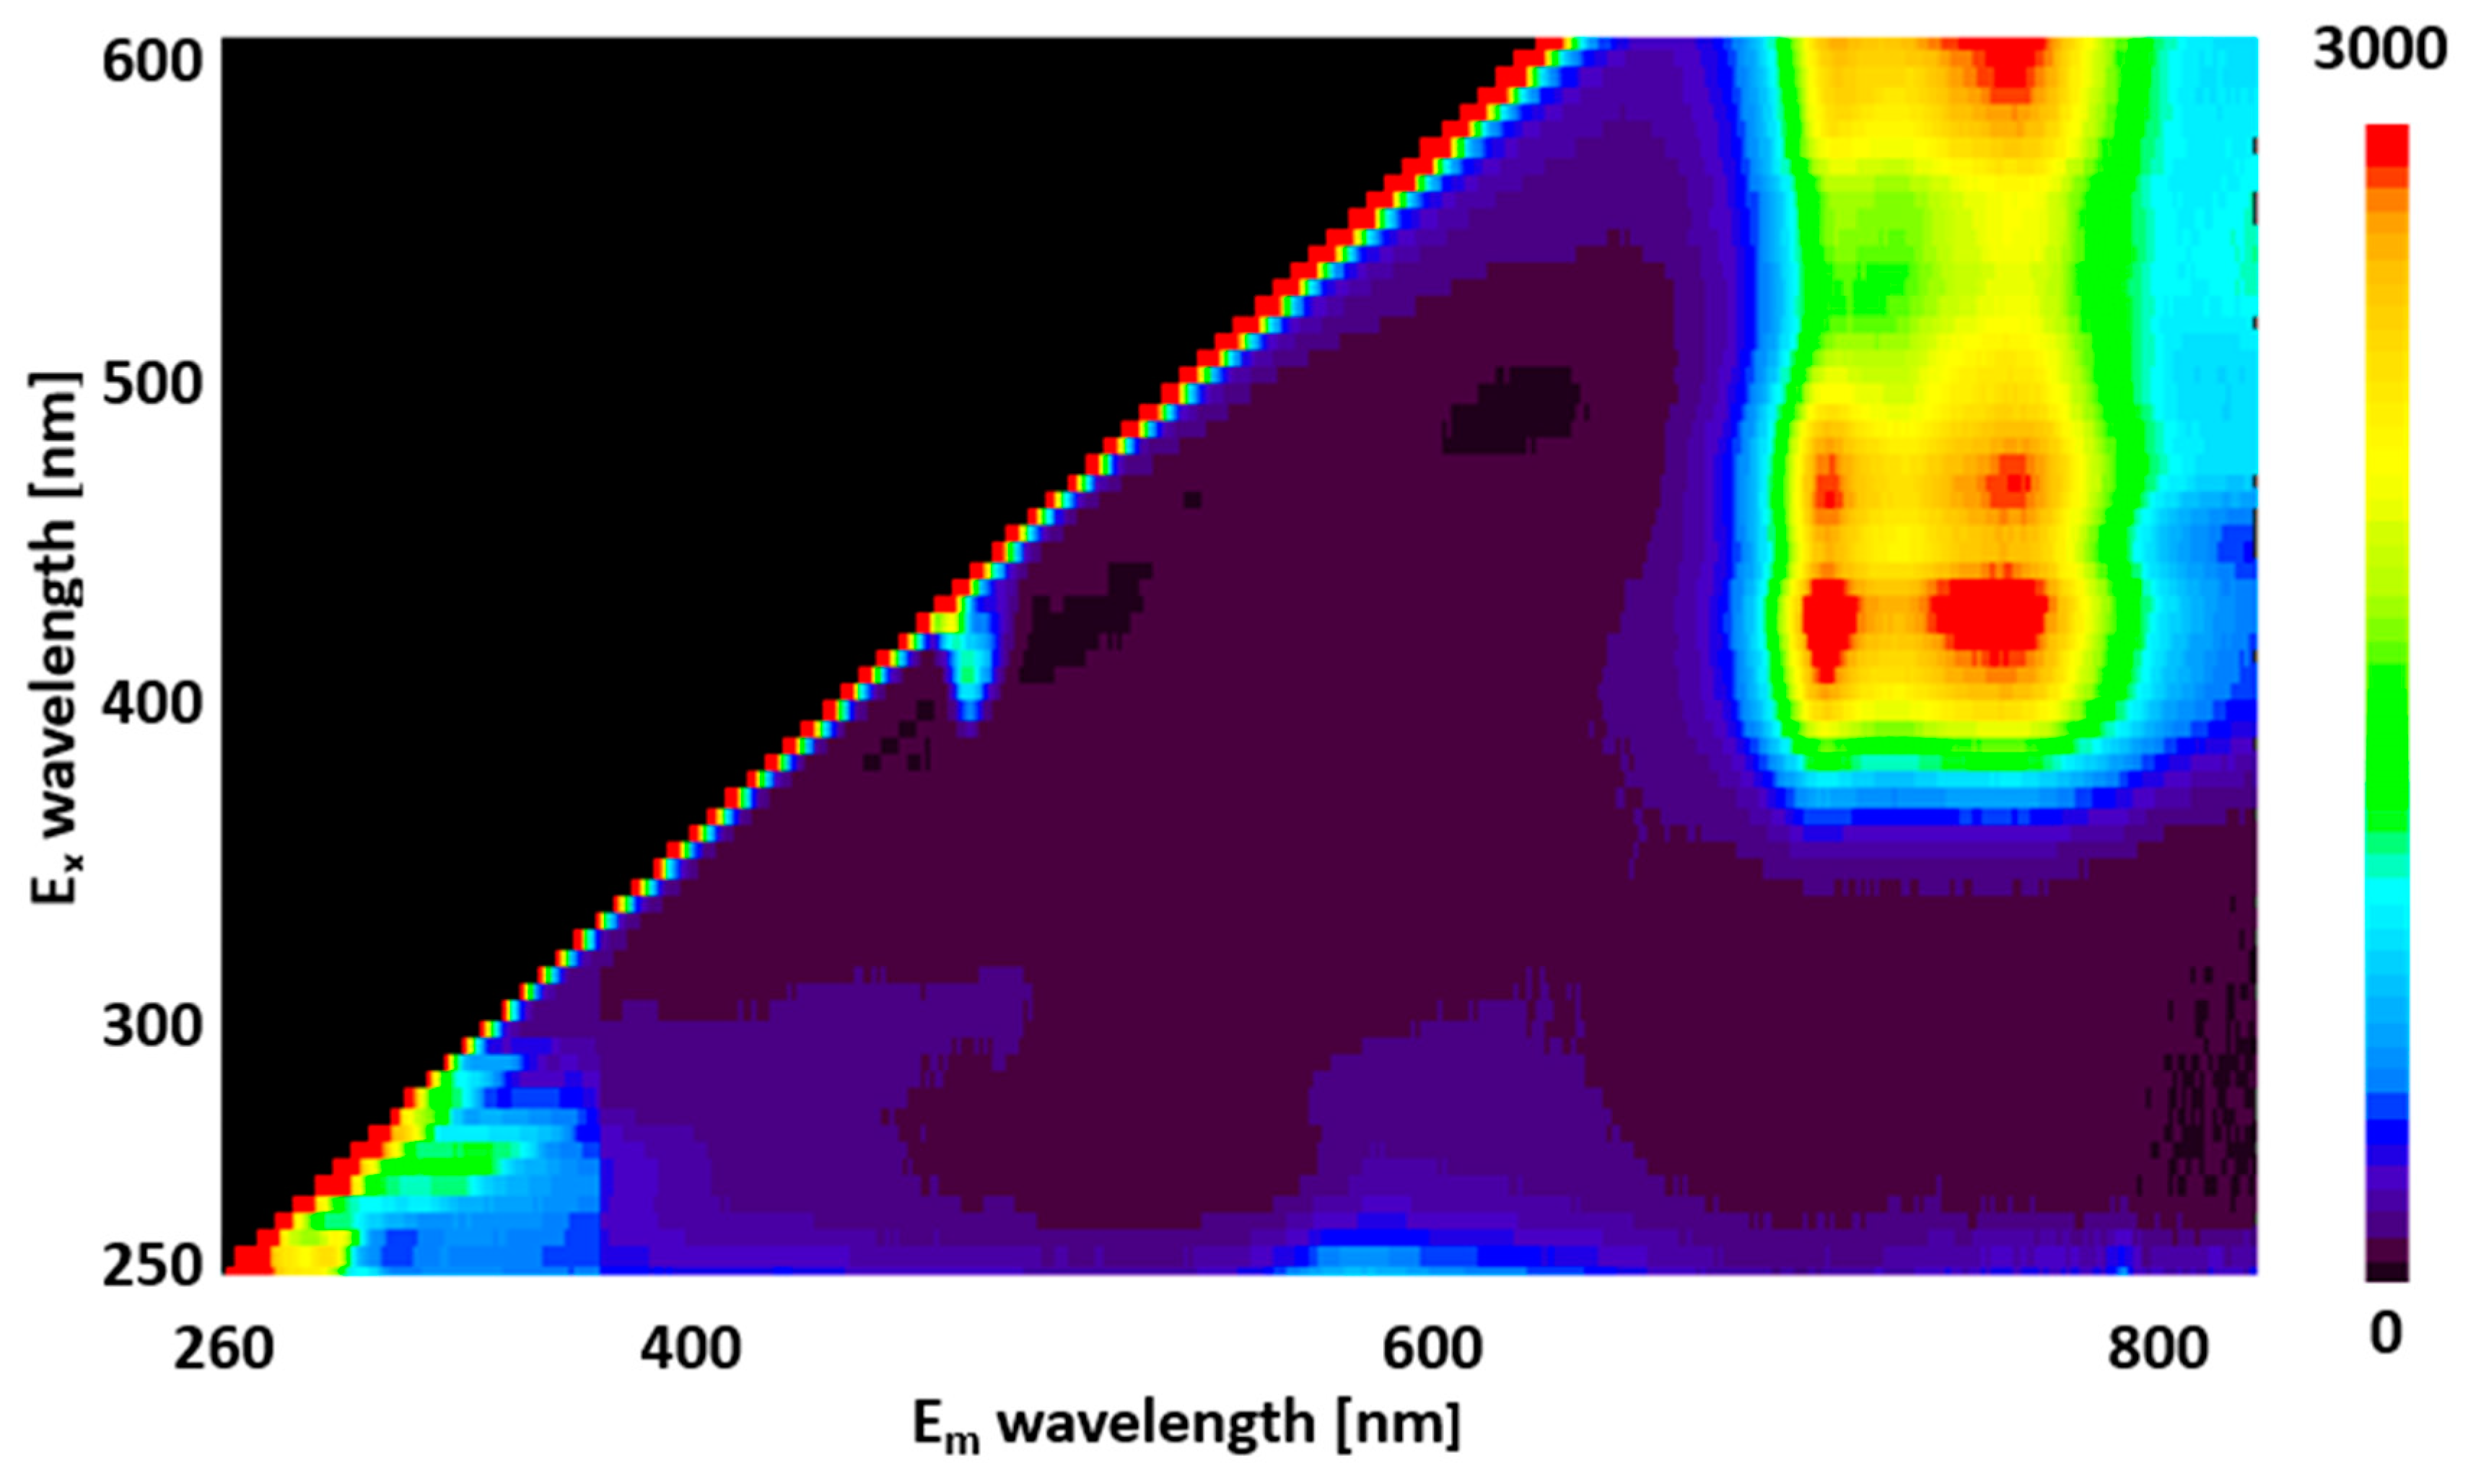
The two-dimensional fluorescence spectra obtained at an excitation wavelength of 250–600 nm and fluorescence wavelength of 260–800 nm are shown in
Figure 1. Weak fluorescence at approximately 260–450 nm and 550–650 nm was observed with excitation below 350 nm, and strong fluorescence at 650–800 nm was observed at excitation wavelengths above 350 nm.
2.2. Content of constituents and functionality of perilla
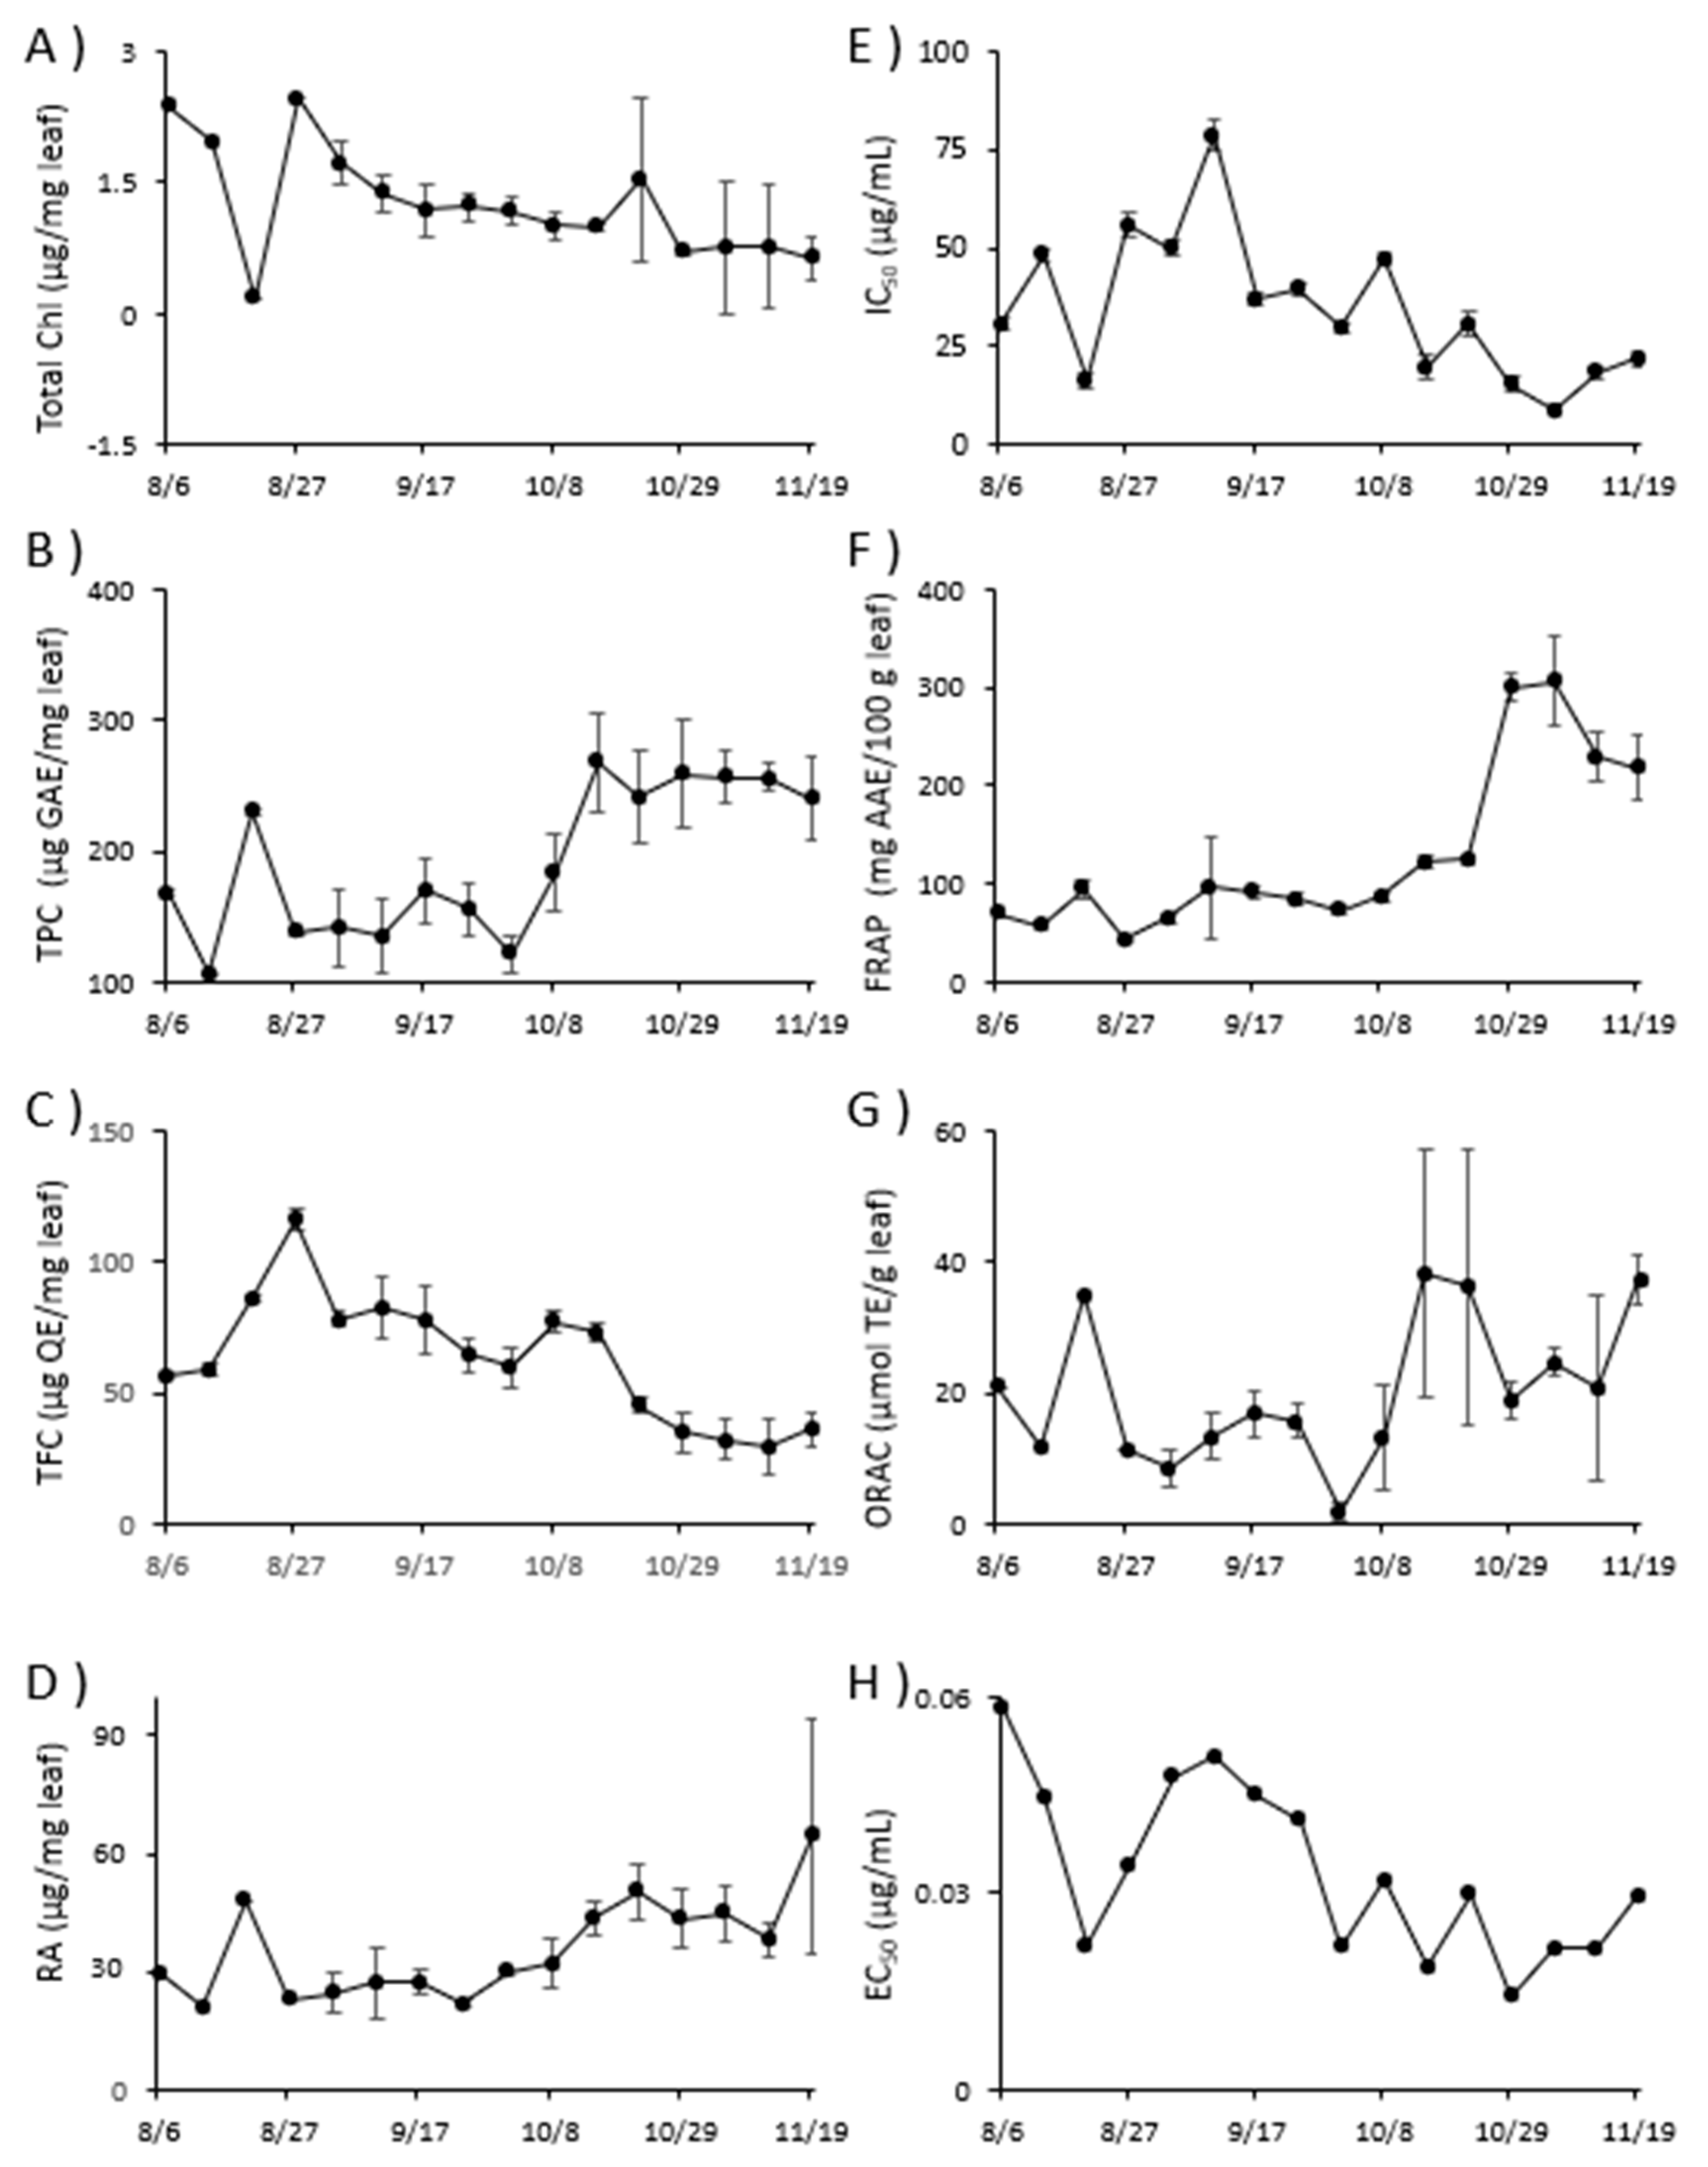
Figure 2 shows the variation in total Chl, TPC, TFC, RA, DPPH radical scavenging activity, FRAP, ORAC, and Aβ aggregation inhibitory activity during the weekly harvest of perilla from Aug 6 to Nov 19 in 2021. Total Chl and TFC decreased from Oct 1 – Nov 19. Detailed data for
Figure 2 are given in
Tables S1–S8 and
Figures S1–S34. in Supporting information
.
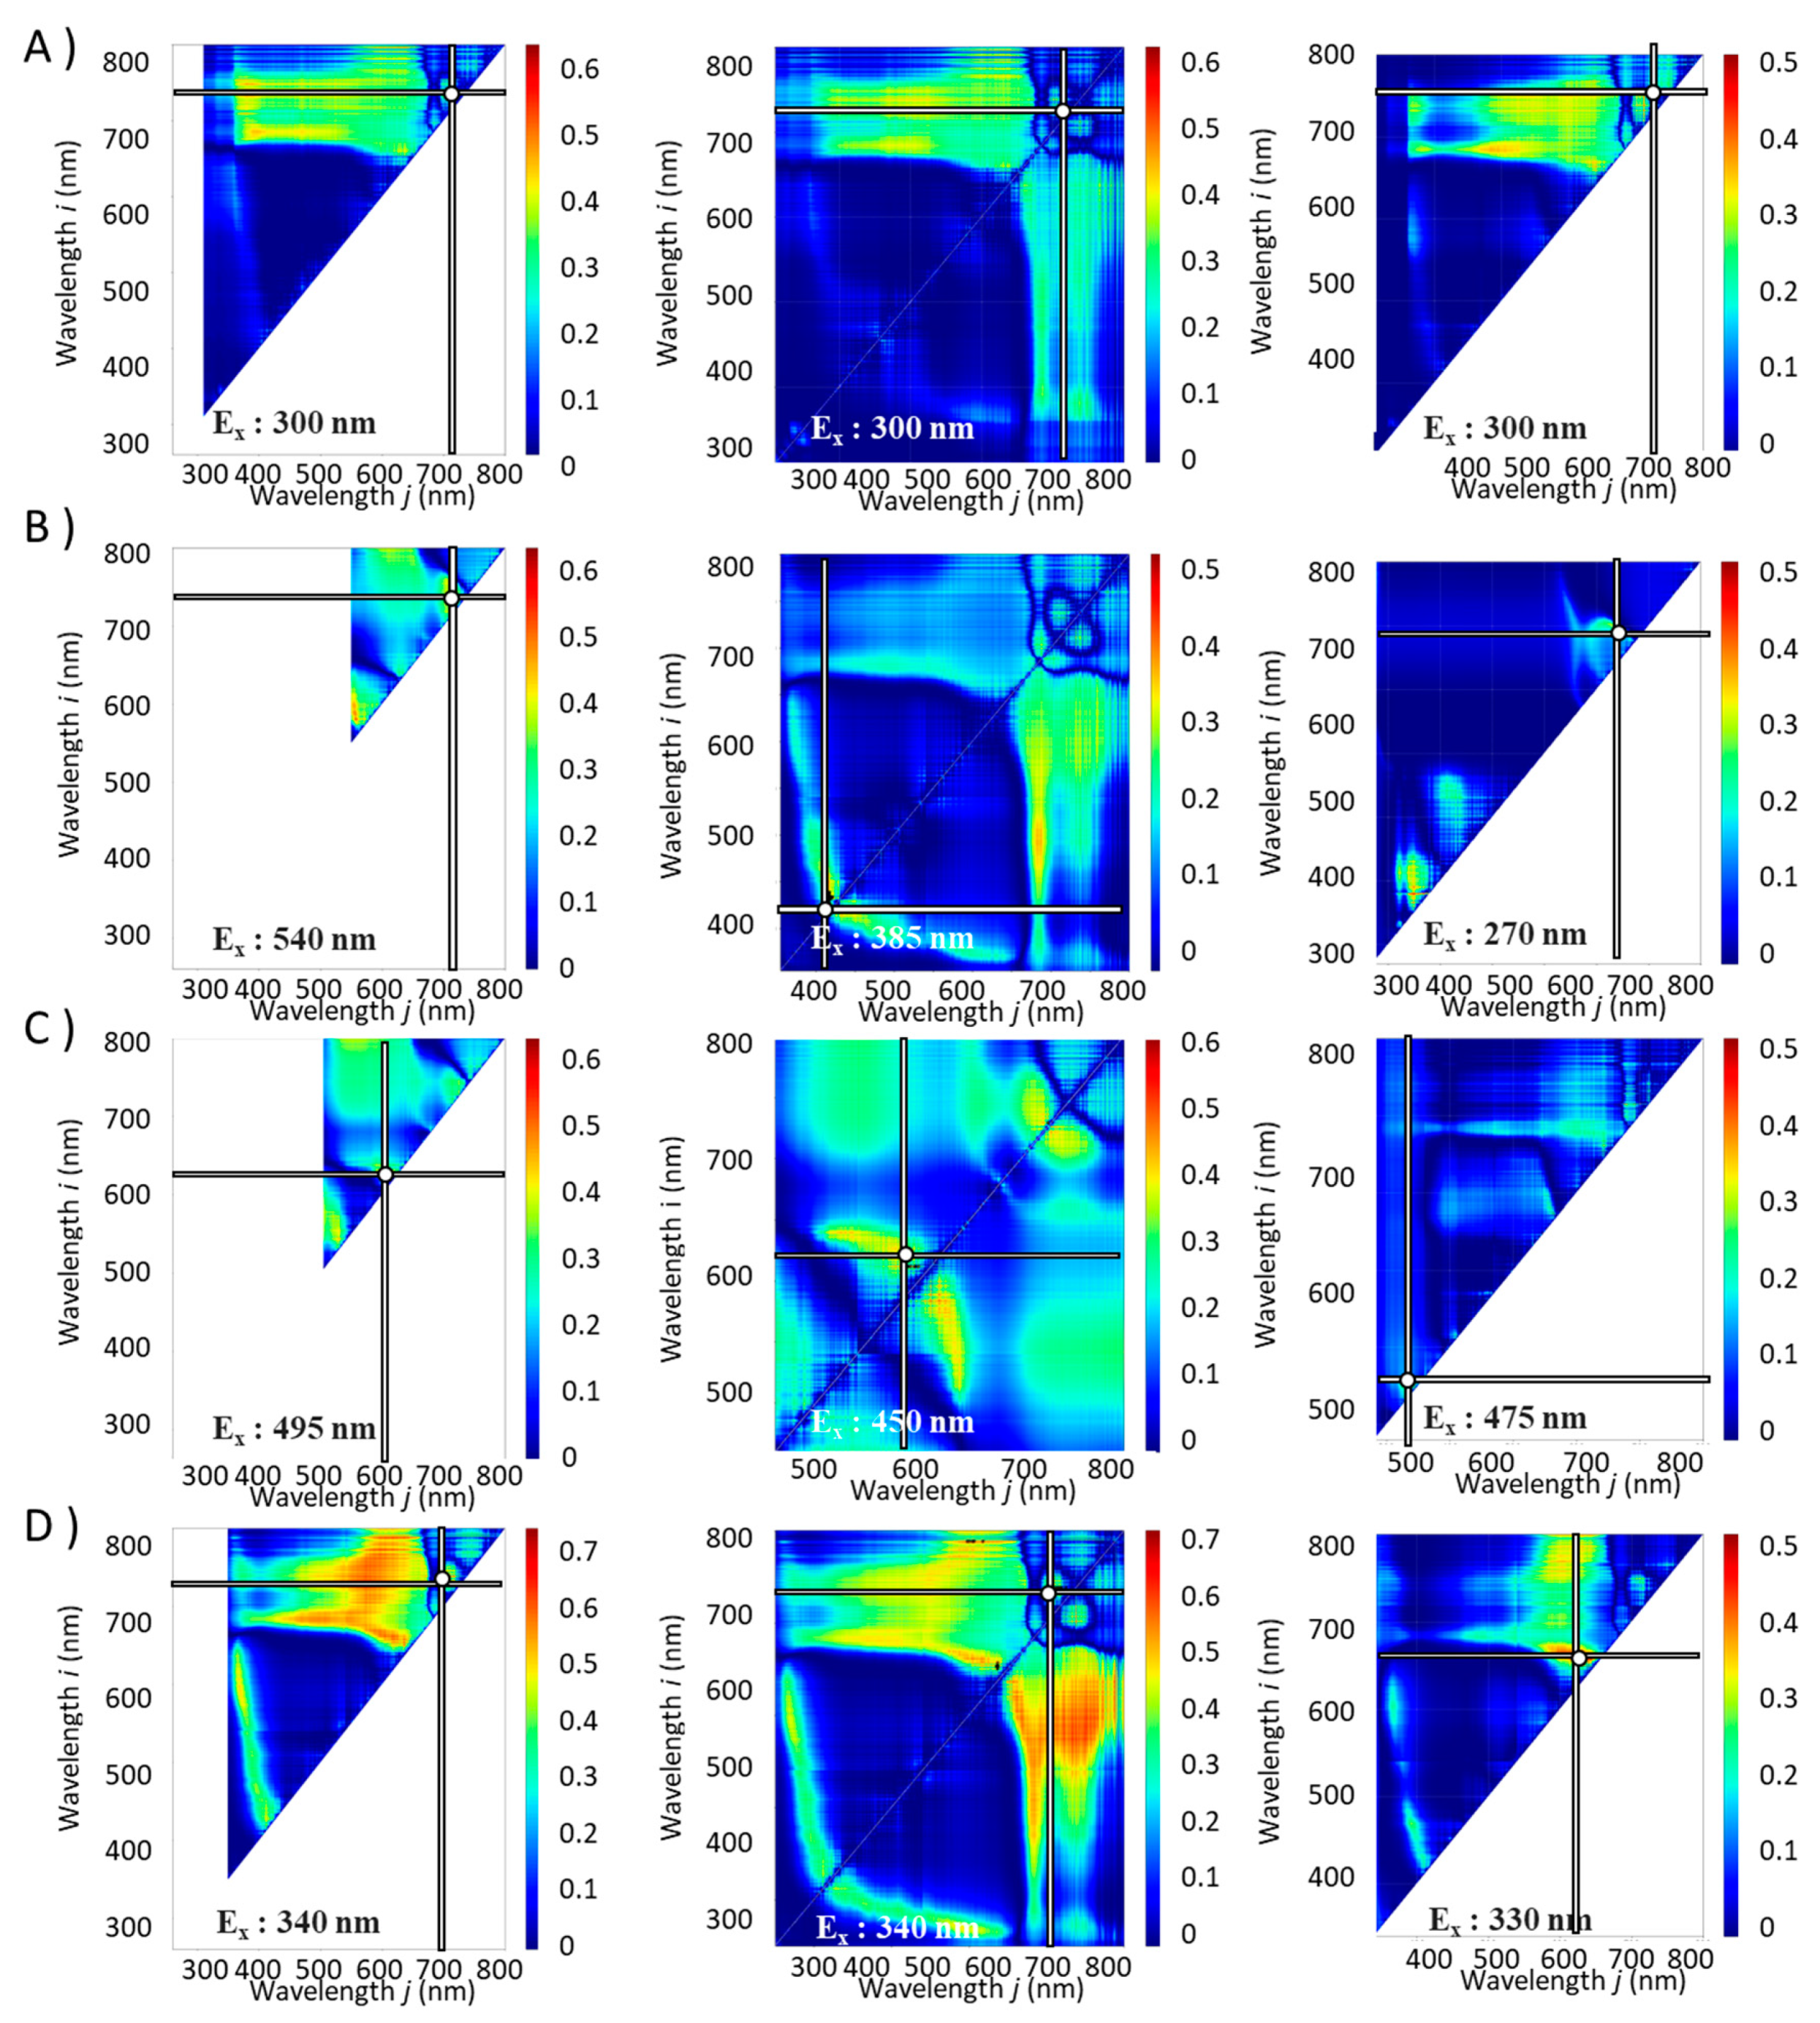
2.3. Full wavelength R2 contour maps for NDSI, RSI and DSI analysis of perilla
Contour maps were produced for each excitation light irradiation ranging from 250 to 600 nm × 5 nm wavelength range.
Figures S35–S58 in Supporting information are GIFs showing the
R² values between the component index and the spectral index calculated from the fluorescence spectrum obtained by scanning the excitation wavelengths as contour maps with the fluorescence wavelength. From these results, the excitation wavelength with the highest
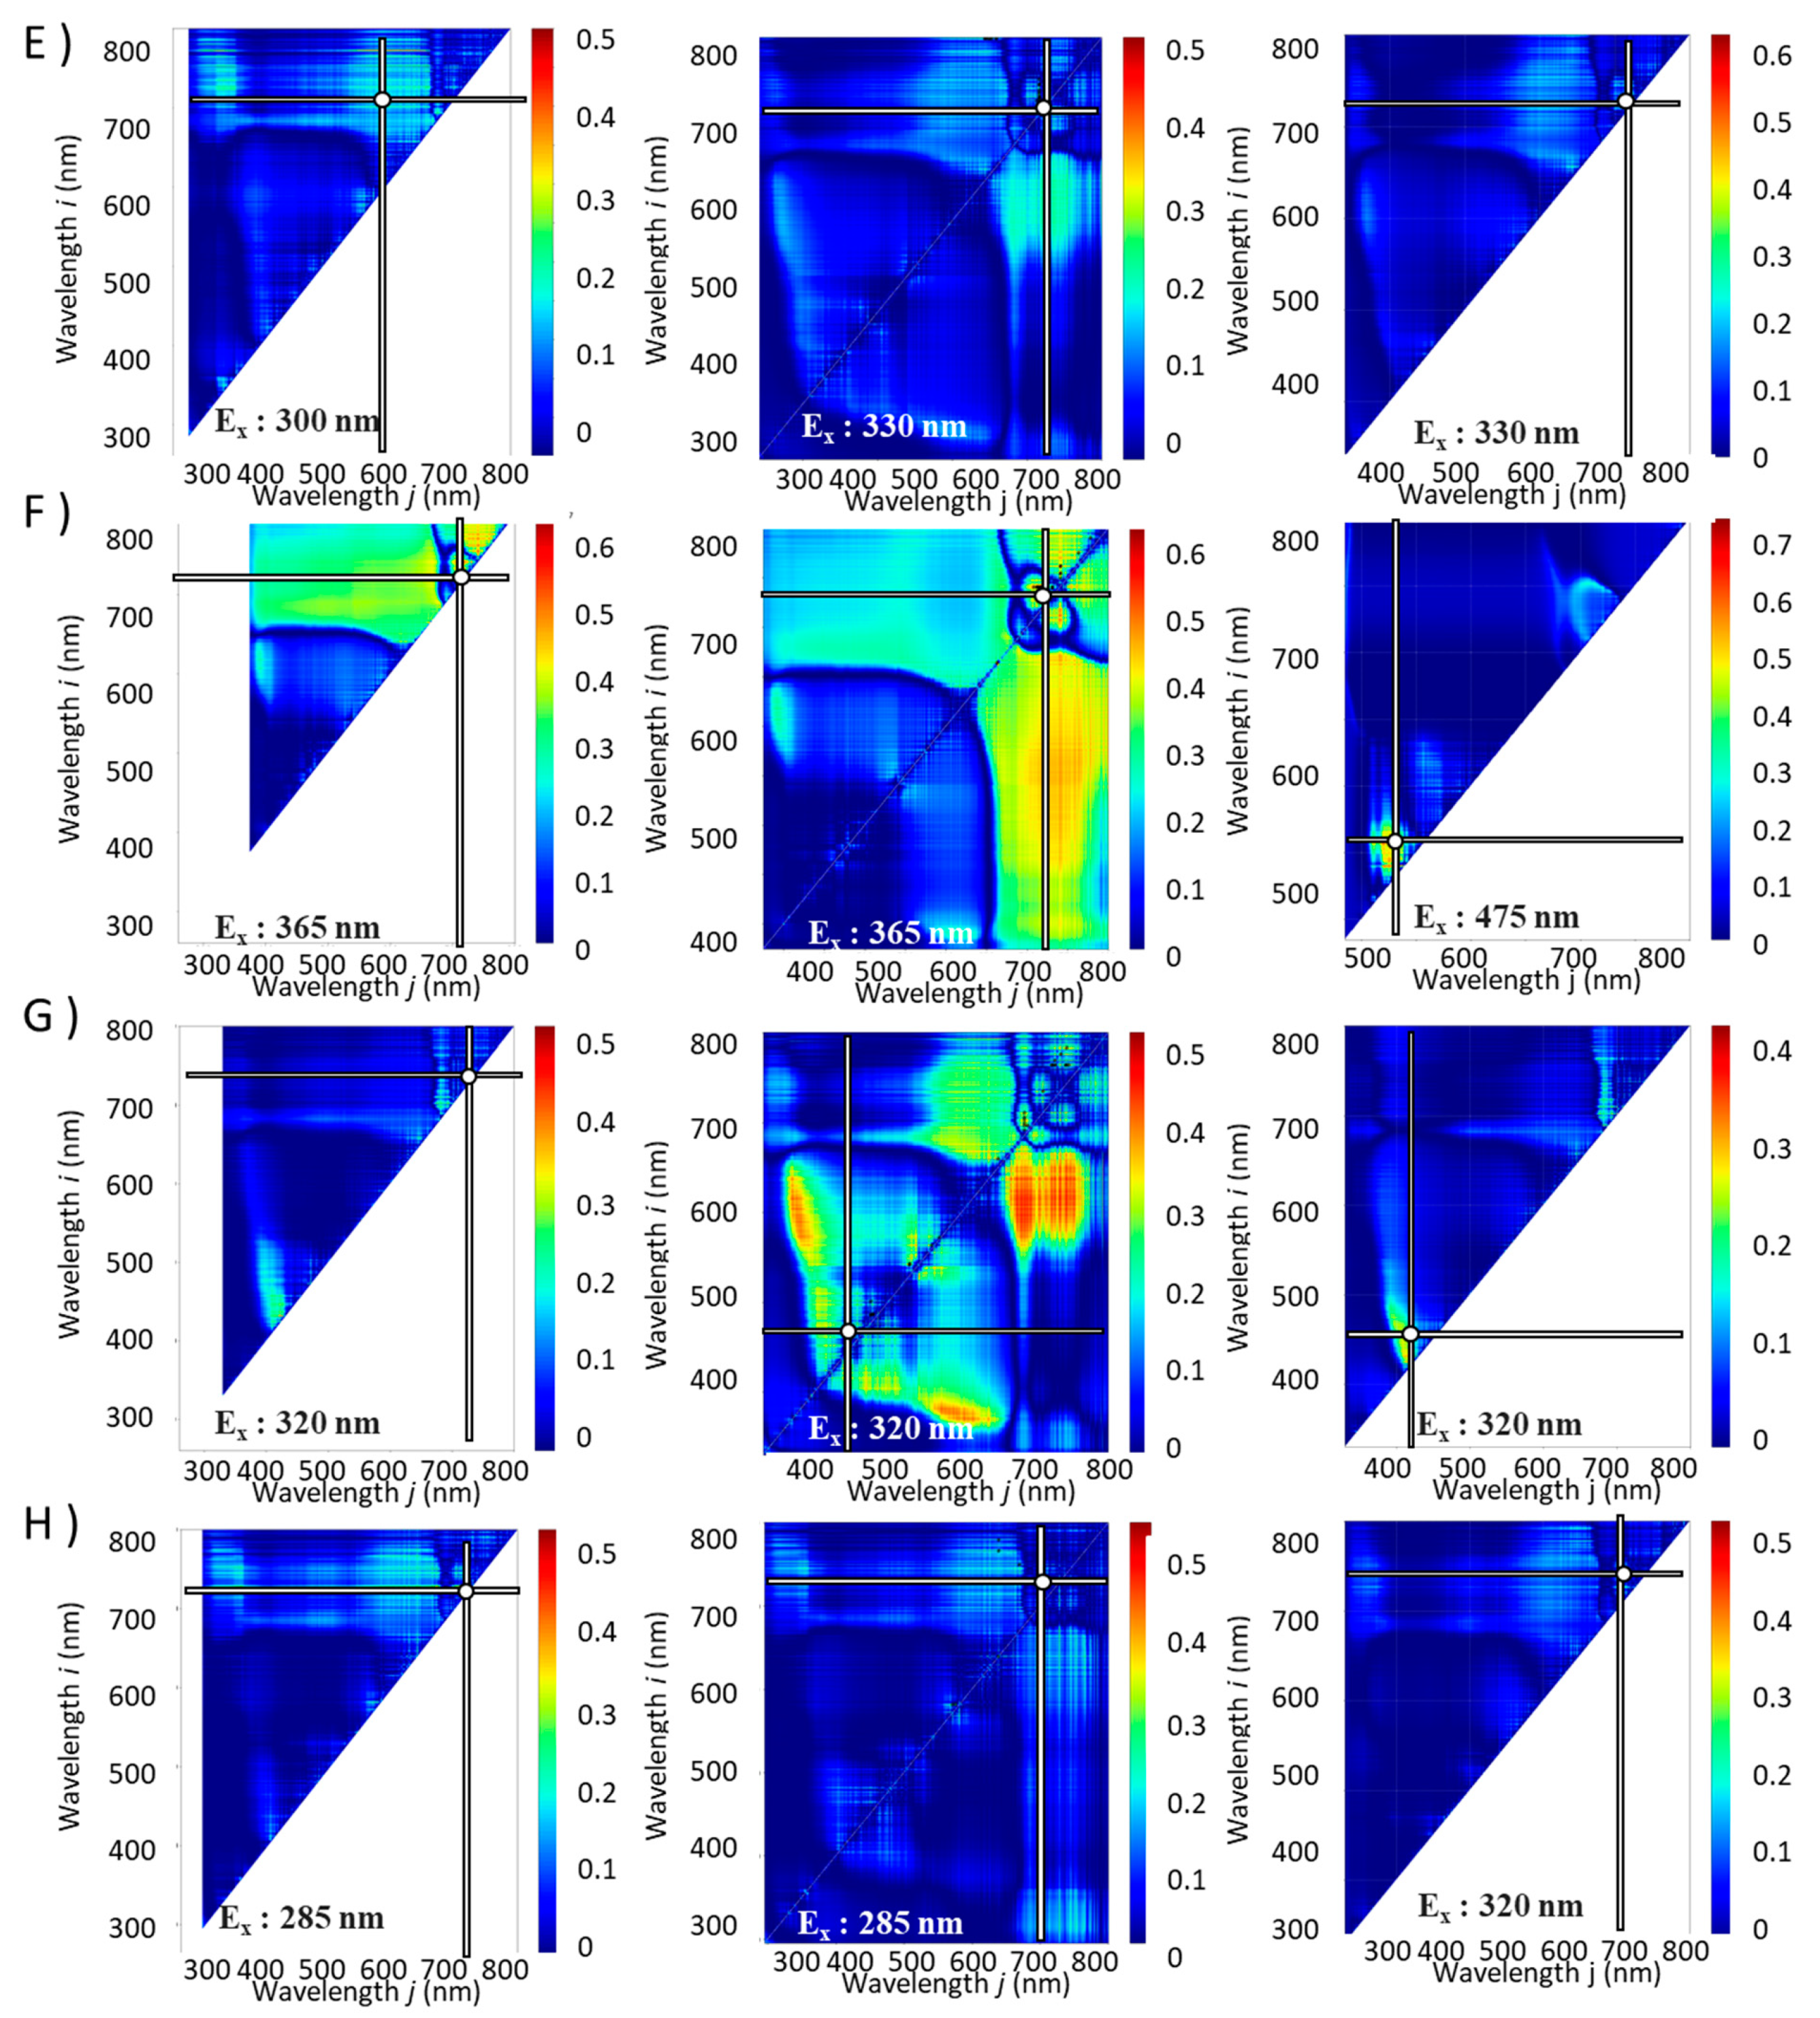
R² was found. The combinations of excitation and fluorescence wavelengths (
i,
j) with the highest
R2 (λ
, ρi,
ρj ) and coefficients of determination (
R2) are shown in
Table 1 and
Figure 3 and
Figure 4.
2.4. Correlation modeling of spectral index and component index in perilla.
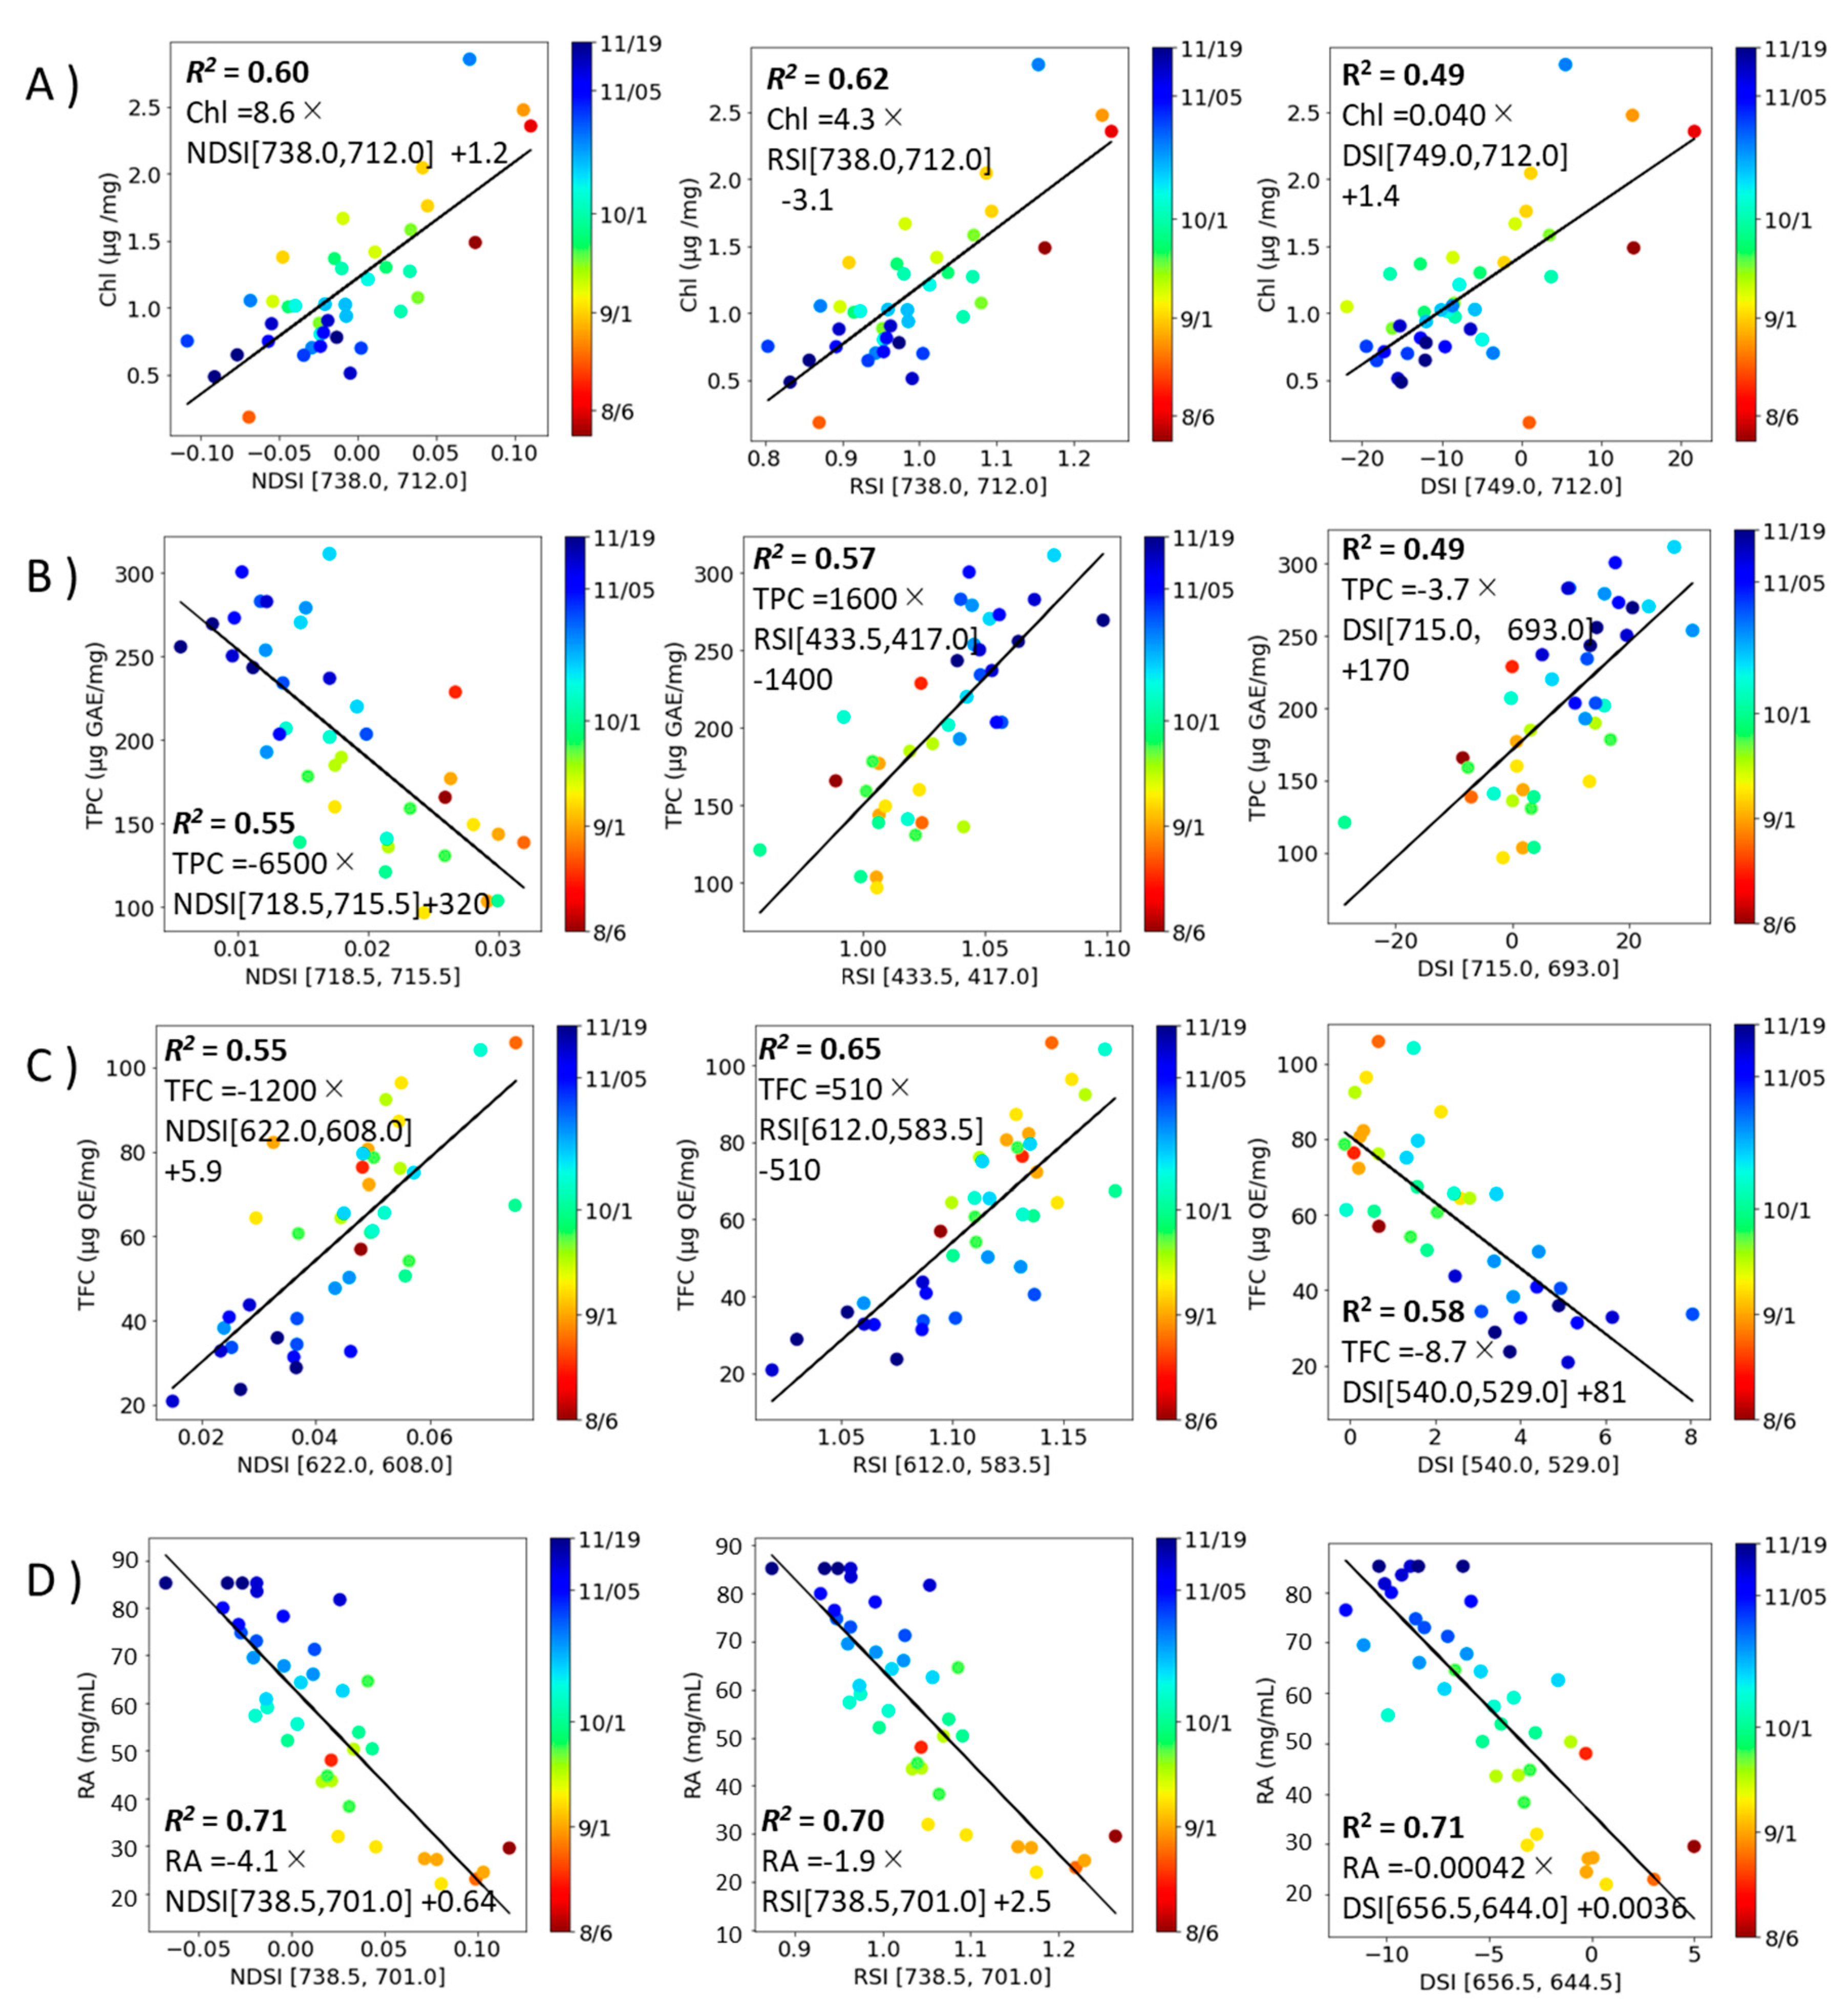
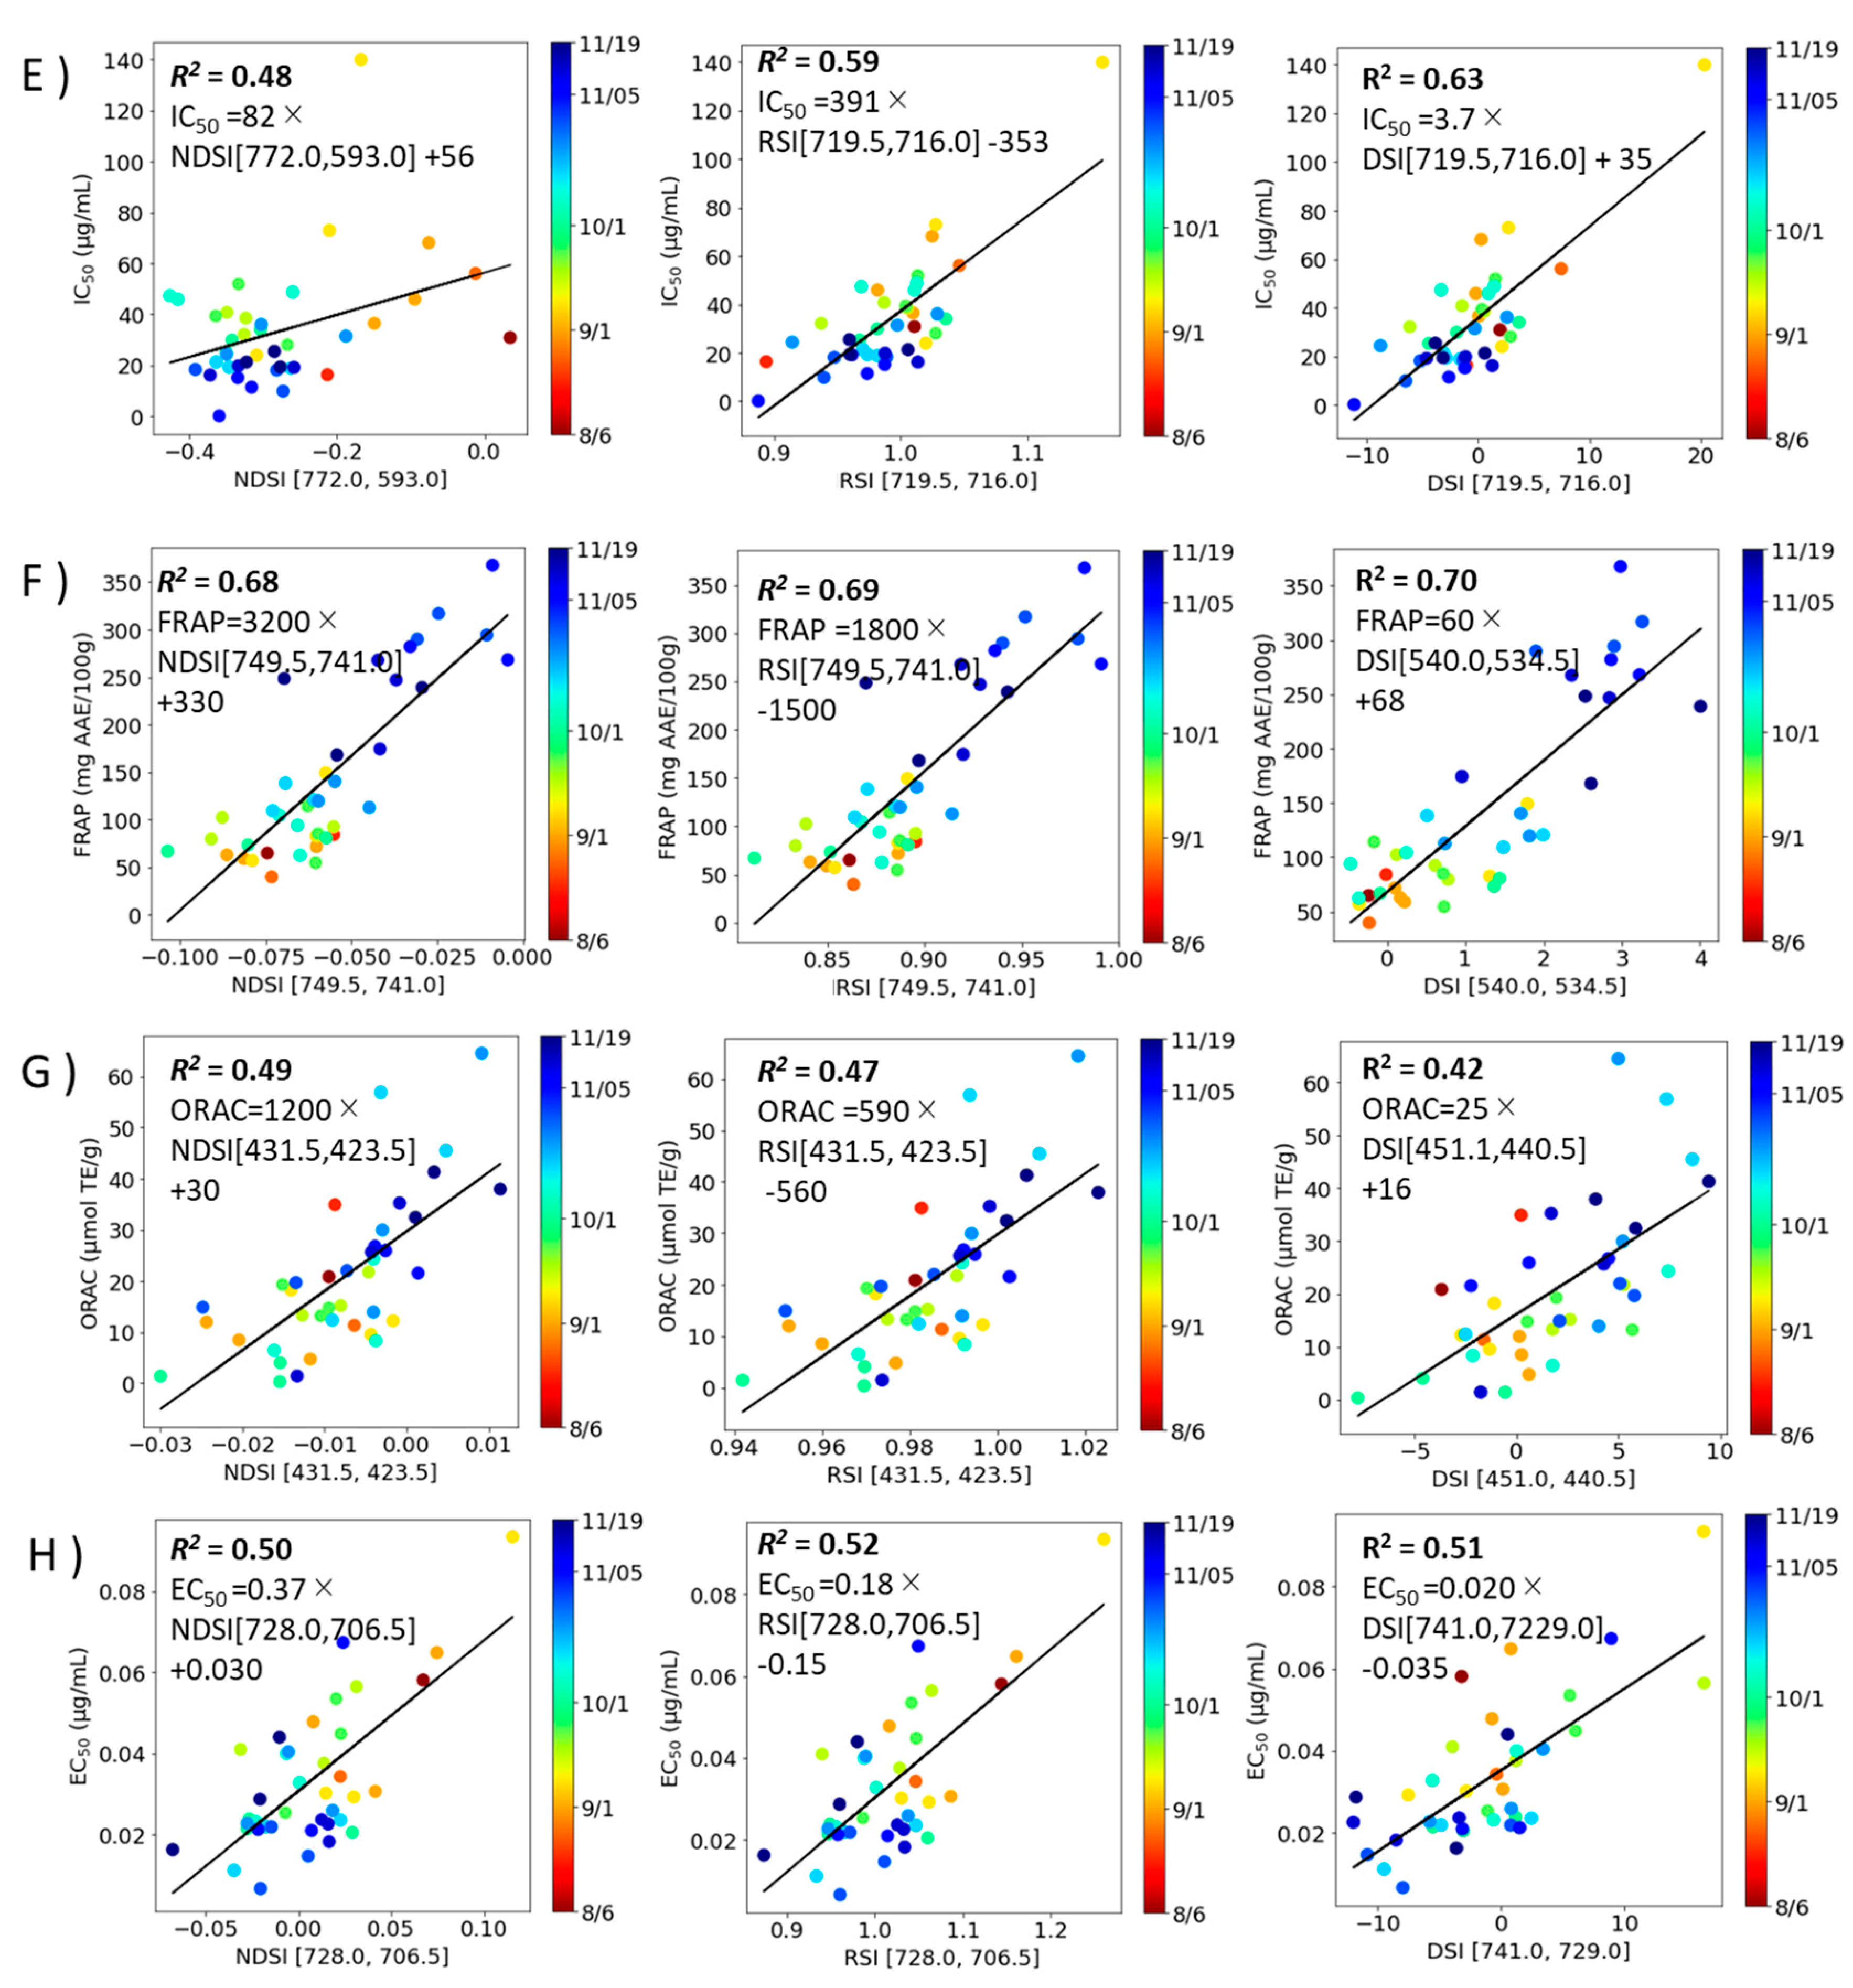
An estimation model for component indices (total Chl, TPC, TFC, RA, DPPH radical scavenging activity, FRAP, ORAC, and Aβ aggregation inhibitory activity) was constructed from the spectral indices (NDSI , RSI and DSI values) (
Figure 5 and
Figure 6) and linear regressed for each (
Table 2). The results showed that
R2 was higher in NDSI for RA and ORAC, in RSI for Total Chl, TPC, TFC, and Aβ aggregation inhibitory activity, and in DSI for DPPH radical scavenging activity, FRAP, respectively.
3. Discussion
Weak fluorescence at approximately 260–450 nm and 550–650 nm was observed with excitation below 350 nm (
Figure 1) is the fluorescence spectrum of polyphenols covalently bound to the cell wall [
30], whereas strong fluorescence at 650–800 nm was observed at excitation wavelengths above 350 nm. is ascribed to chlorophyll emission from the chloroplasts [
29].
In plant leaves, Chl has been reported to decrease in winter [
31], and flavonoids increase with the light the leaves receive [
32]. Therefore, it is possible that the results in this study (
Figure 2) also show a decrease in flavonoids due to reduced solar radiation in winter. The seasons may influence the changes in polyphenols, particularly rosmarinic acid, in perilla leaves, suggesting that these effects enhance the functional properties from Oct [
18,
20]. Interestingly, for Total Chl, RA, FRAP, ORAC and Aβ aggregation inhibitory activity, the same λ,
ρi, and
ρj were the optimal values for NDSI, RSI and DSI while for the other component indices,
R² was the maximum value at different wavelengths for NDSI , RSI and DSI (
Figure 3 and
Figure 4 and
Table 1).
The results in
Figure 5 and
Figure 6 indicate that the optimal SI differs depending on the object being measured, but the component indices with the best RSI analysis results predominate. Therefore, RSI analysis was considered suitable for the analysis of perilla leaves. The maximum
R² of ORAC was 0.49 (NDSI), which is the lowest value in these analyses; ORAC is a method that mainly measures the effects of polyphenols, vitamins C and E [
33]. It is known that the ORAC of perilla seed oil is more strongly correlated with total tocopherols than with total polyphenols [
34], which may explain the low value of
R² between SI and ORAC based on fluorescence of polyphenols and chlorophyll.
Previously reported measurements of the content of constituents using fluorescence spectra have been limited to simple measurements of chlorophyll increase or decrease, determination of abnormal values, and increase or decrease in leaf water content [
23,
24,
25,
26]. N indices (leaf N concentration (LNC), plant N concentration (PNC), plant N uptake (PNU), and N nutrition index (NNI)) were also evaluated and a strong relationship between fluorescence intensity ratio and N indices was reported (
R2 =0.40 to 0.78 range, 40 samples) [
35]. There are also methods to measure polyphenols and other substances by absorbing carbon dots from the roots; however, there are labor and safety issues [
36]. Experiments have also been conducted to confirm the variation in leaf and fruit composition over time from collection to shipping using fluorescence imaging [
29,
37,
38]. However, to the best of our knowledge, there are no known methods for predicting both contents of constituents and functionality using fluorescence spectra, as in this study.
Other methods using spectra measured the chlorophyll content of peanut leaves over the whole field using hyperspectra in a single-photon avalanche diode (SPAD) equivalent and
R² = 0.69 when the correlation with hyperspectra was examined [
23], which means that the actual amount of chlorophyll in a single leaf is not known and only one component can be evaluated. The results are limited because a single leaf's chlorophyll content is unknown, and only one component can be assessed. In addition, NDSI analysis of carnosic acid in rosemary, measured using the near-infrared spectrum, yielded a correlation coefficient of
r = 0.81 [
27], which, when converted to
R², was 0.6561, which is lower than the coefficient of determination for RA in the present study. In addition to that, although the number of samples is larger than in the present experiment (n=79), it is only samples harvested on the same day, so there is no certainty that it can be used to observe the optimum timing as in the present study. In a study of antioxidant activity, the correlation coefficients
r = 0.86 and
r = 0.85 were obtained for DPPH radical scavenging activity and FRAP using the near-infrared spectra of bamboo leaf extracts [
39], and our model had a lower correlation than this. However, the present study is superior in allowing a nondestructive evaluation of leaf constituent content and functionality, especially antioxidant activity and Aβ aggregation inhibitory activity which is more versatile than ever.
These results show that a linear model can achieve good prediction accuracy. We identified a predictive model with a high coefficient of determination R² ≥ 0.57 for content of the components, and a predictive model with a high coefficient of determination R² ≥ 0.49 for functional properties. From the coefficients of determination obtained , the best single variable estimation model for each index was obtained.
4. Materials and Methods
4.1. General
Methanol (HPLC grade), acetone (reagent grade), ethanol (99.5%, reagent grade), acetic acid (reagent grade), potassium hexacyanoferrate (III), potassium hydrogen phosphate, sodium hydrogen phosphate, dimethyl sulfoxide were purchased from Kanto Chemical Co. Inc. (Tokyo, Japan). 2,2'-Azobis-2-methyl-propanimidamide, dihydrochloride (AAPH), 1,1-diphenyl-2-picrylhydrazine free radical (DPPH), 2-(3,4-dihydroxyphenyl)-3,5,7-trihydroxychromen-4-one (quercetin), and 3,4,5-trihydroxybenzoic acid (gallic acid) were purchased from Tokyo Chemical Industry Co. Ltd. (Tokyo, Japan). Formic acid, aluminum (III) chloride hexahydrate, sodium dodecyl sulfate, and L(+)-ascorbic acid were purchased from Fujifilm Wako Pure Chemical Co. Ltd. (Osaka, Japan). RA, Trolox, and Folin-Ciocalteu phenol Reagent (2N) were purchased from Sigma-Aldrich (St. Louis, MO, USA). Sodium bicarbonate was purchased from Junsei Chemical Co. Ltd. (Tokyo, Japan).
Photoluminescence spectra were recorded using a spectrofluorophotometer FP-8500 (JASCO Corp., Tokyo, Japan). UV-visible absorbance and fluorescence measurements were performed in 96-well plates using SH-9000Lab (Corona Electric Co. Ltd., Hitachinaka, Japan). LC-MS analyses were performed using a Shimadzu LCMS-8045 equipped with an LC-2060C UV detector, electrospray ionization (ESI), and a triple quadrupole (Shimadzu, Kyoto, Japan).
4.2. Perilla samples
Perilla frutescens var. crispa (seedlings grown at AW Farm Chitose (Chitose, Japan)) was grown in a field at our university in 2021, and three leaves from the fourth node were harvested each week (n=40). Part of the leaves was used for fluorescence spectra and chlorophyll measurements. At the same time, the rest was extracted with 99.5% ethanol (ethanol with a volume of five times the material weight) for three weeks and stored in a refrigerator at 4 ℃ until measurements of constituents and functionality.
4.3. Fluorescence spectrum measurement
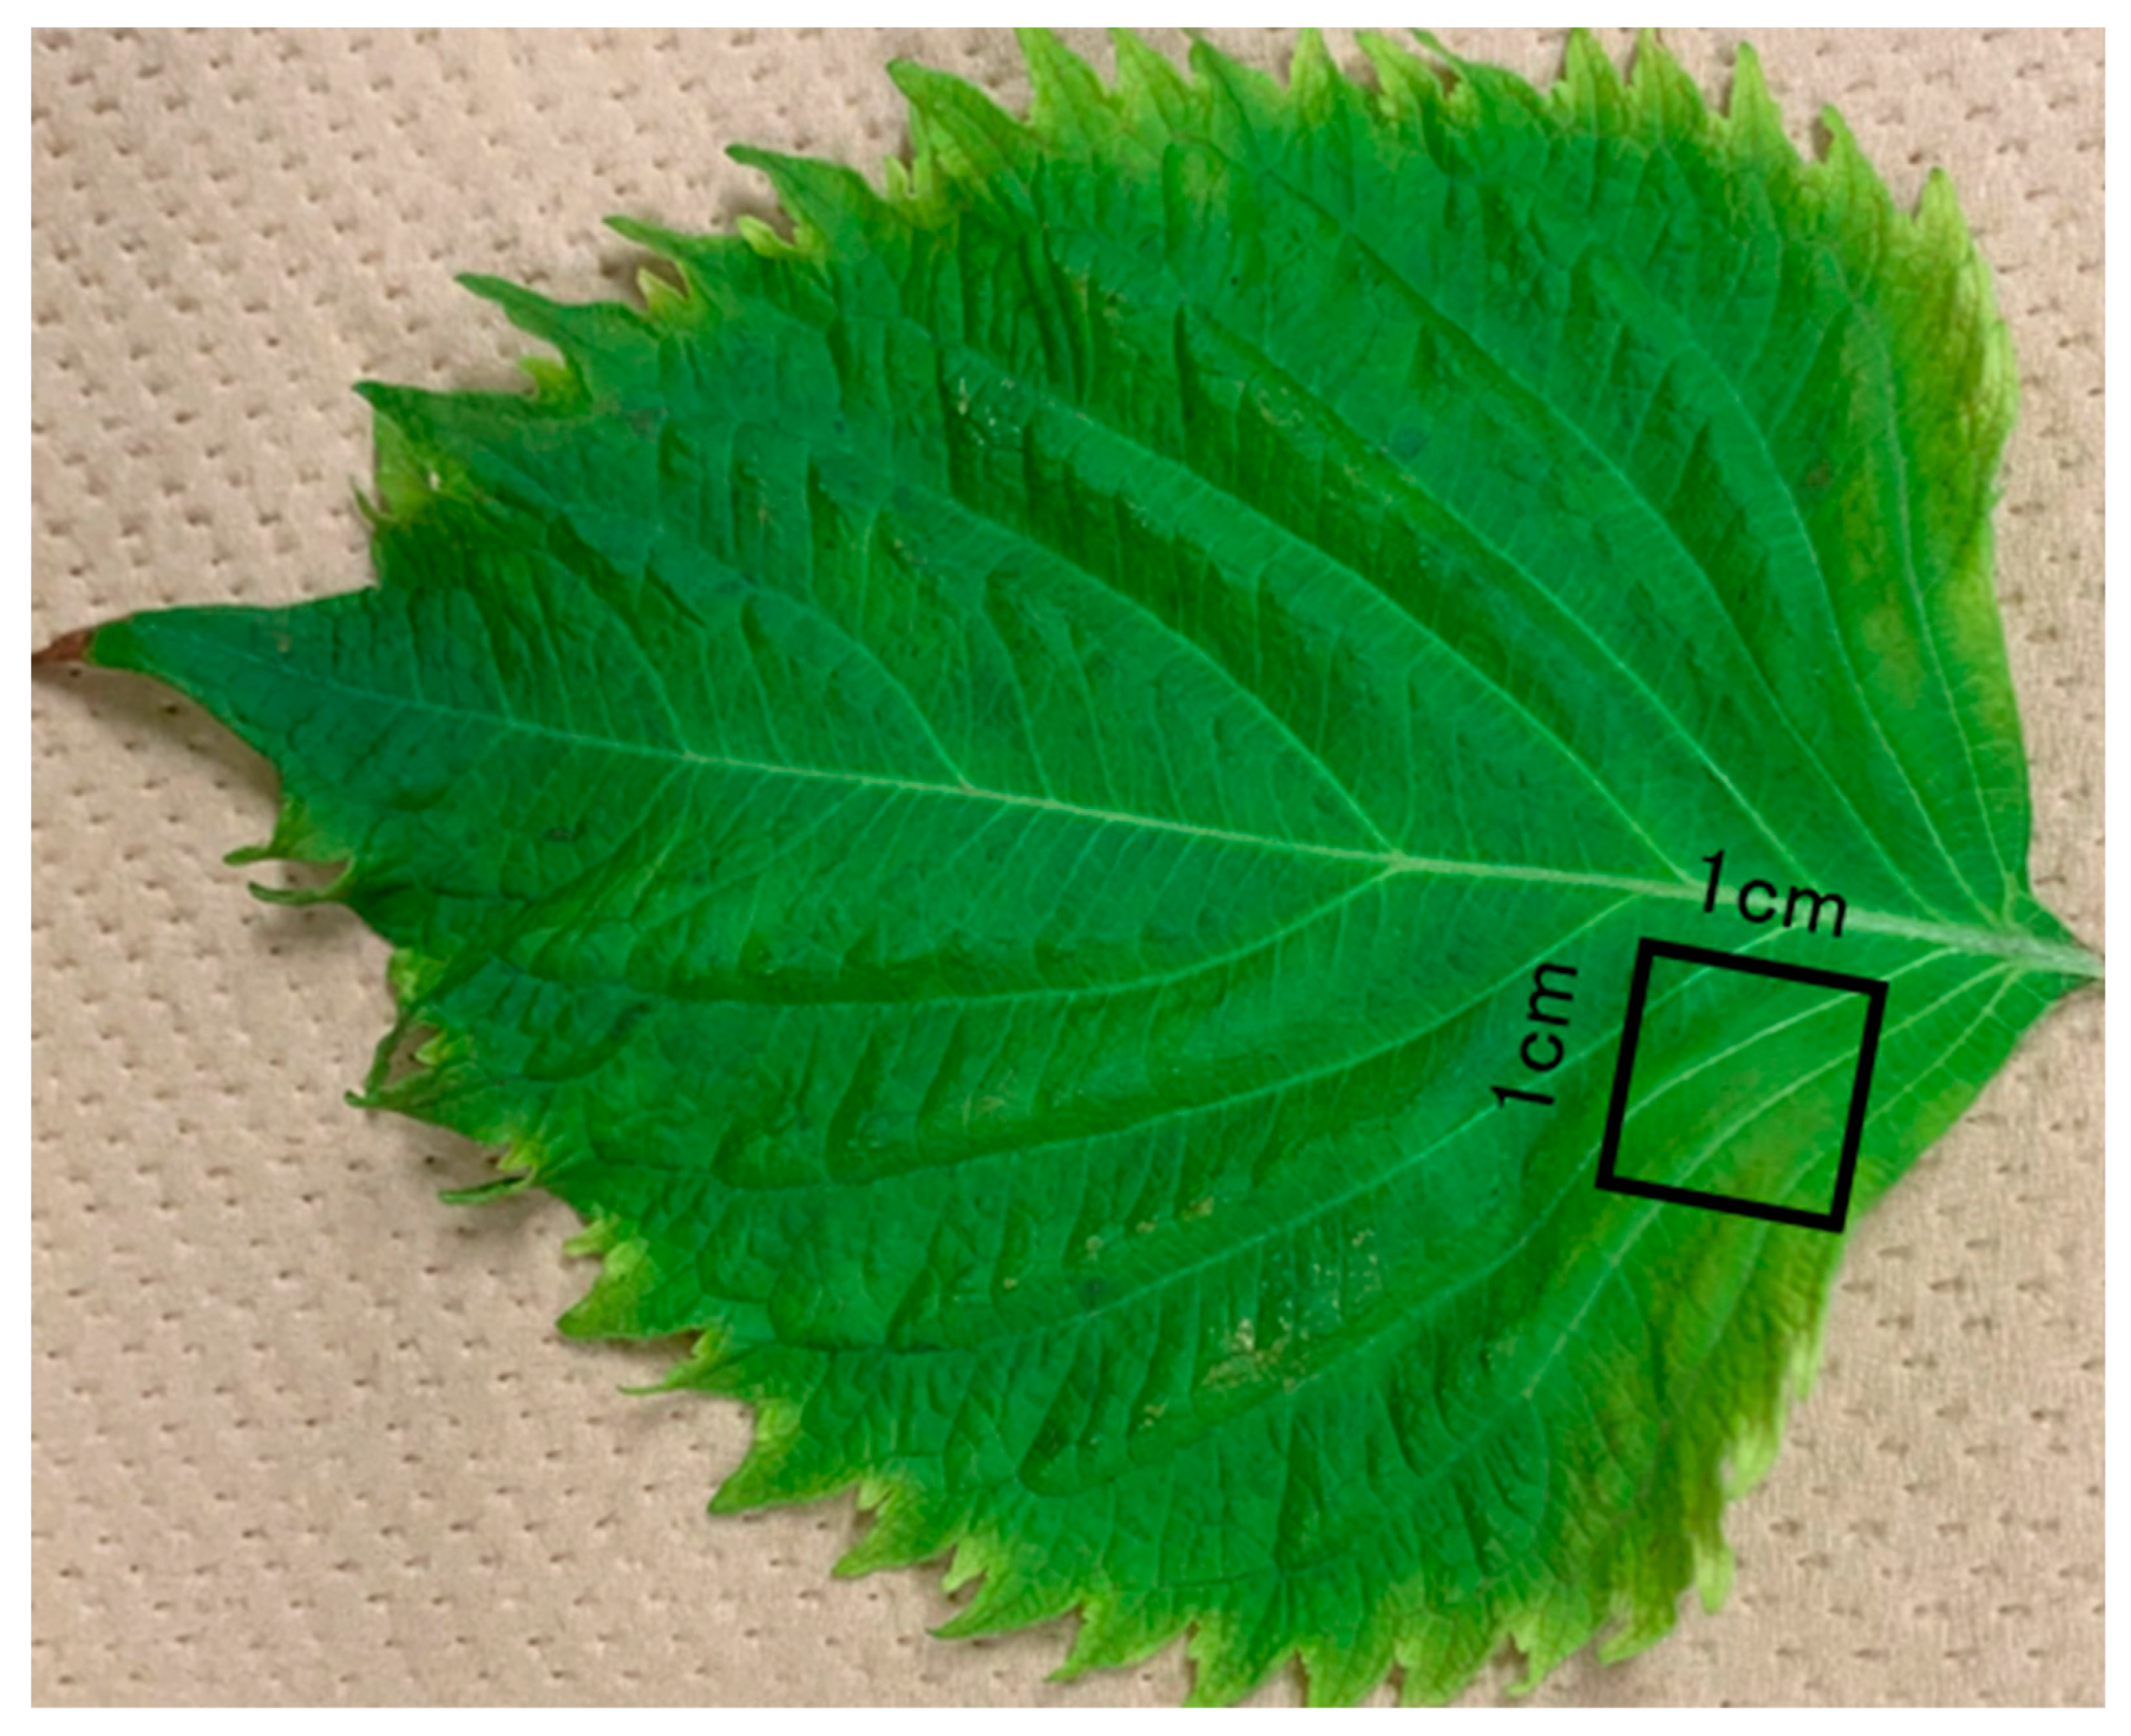
The posterior end of the leaf was cut into 1 cm squares in Figure 7. The excitation light’s incident angle on the cut leaves’ surface was 30°. The excitation light wavelength was varied in the range 260–800 nm [
29]. The fluorescence spectra were corrected concerning variations in the sensitivity of the spectrofluorophotometer light detector at different wavelengths.
4.4. Chlorophyll (Chl) quantification
Chl was measured using the Porra method [
40]. The leaves used in the fluorescence spectrum measurements were crushed using a homogenizer with acetone. The suspension was centrifuged for 5 min, and the supernatant was transferred to another PCR tube. This process was repeated until the green color of the precipitate completely disappeared. Ultrapure water was added to the extract to adjust the acetone concentration to 80%. The absorbance of the conditioned solution was measured at wavelengths 663.6, 646.6, and 750 nm, and the Chl concentration was calculated using Eq. (1) – Eq. (3).
4.5. Total polyphenol content (TPC)
Each extract's total polyphenol content was determined using the Folin-Ciocalteu method [
41]. Samples of perilla extract extracted with 99.5% ethanol were evaporated under the reduced pressure and dissolved in 70% methanol (1,000, 500, and 250 µg/mL). A dilute solution of 80 µL of each extract was mixed with Folin-Ciocalteu reagent (0.2 N, 400 µL) and allowed to stand at room temperature for 5 min. Sodium bicarbonate solution (7.5%, 320 µL) was added, and after 2 h of incubation at 30 ℃, the absorbance at a wavelength of 760 nm was measured. A calibration curve was prepared using gallic acid as the standard, and the concentration of polyphenols was calculated as gallic acid equivalents (GAE).
4.6. Total flavonoid content (TFC)
The total flavonoids of each extract were assessed using the AlCl
3 colorimetric method [
42]. Samples of perilla extract extracted with 99.5% ethanol were evaporated under the reduced pressure and dissolved in methanol (1,000, 500, and 250 µg/mL). Each extract (400 µL) and AlCl₃ solution (2%, 400 µL) were mixed well, and after 10 min incubation at 30 ℃, the absorbance at a wavelength of 415 nm was measured. A calibration curve was prepared using quercetin as the standard, and the concentration of flavonoid was calculated as quercetin equivalents (QE).
4.7. RA quantification by LCMS.
LCMS-8045 and LC-2060C (Shimadzu, Kyoto, Japan) equipped with Kinetex® C18 (2.1 × 150 mm, 5 µm, Phenomenex) column (40 ℃) were used for LC-MS analysis. Peaks were detected at a wavelength of 254 nm, and 0.1% formic acid in 10% methanol/water (A), and 0.1% formic acid in methanol (B) were used as mobile phases. The injection volume was 5 µL, and the gradient at this time was as follows (A to B): 0 min; 100:0, 4 min; 80:20, 9 min; 75:25, 14 min; 62:38, 17 min; 50:50, 21 min; 30:70, 22min; 25:75, 35 min; 0:100, 45min; 100:0.
MS conditions are as follows: nebulizer gas flow 3 L/min, heating gas flow 10 L/min, interface temperature 300 °C, DL temperature 250 °C, heat block temperature 400 °C, draining gas flow 10 L/min, precursor ion 359 m/z, product ion 161 and 197 m/z.
Calibration curves were prepared by triplicate measurement of RA standard solutions.
4.8. DPPH radical scavenging activity [43]
Perilla extracted with 99.5% ethanol was evaporated under reduced pressure and dissolved in ethanol (1,000,500,250,125,62.5,31.25,15.625, and 7.8125 µg/mL). Each sample (400 µL) was mixed with 0.01 mM DPPH in 99.5% ethanol (400 µL), and 200 µL each was transferred to a 96-well microplate reader and incubated at 30 ℃ for 2 h. The absorbance at a wavelength of 517 nm was measured, and the data obtained were substituted into the following equation (Eq. (4)) to calculate the inhibition rate of DPPH oxidation. The IC
50 values were calculated from the inhibition curve by plotting the inhibition rate against the concentration of the sample.
4.9. Ferric reducing antioxidant power (FRAP)
FRAP was measured using the Oyaizu method [
44] with some modifications [
45]. Samples of perilla extract extracted with 99.5% ethanol were evaporated under reduced pressure, and dissolved in ethanol to 1 mg/mL, then diluted to 500, 250, and 125 µg/mL. To an 8 µL of each dilution, 99.5% ethanol (72 µL), ultrapure water (400 µL), 1 M HCl (120 µL), 1% K₃[Fe(CN)₆] (120 µL), 1% SDS (40 µL), and 2% FeCl₂ (40 µL) were added. The mixture was placed in a water bath at 50 ℃ for 20 min, and the mixture was cooled to room temperature and mixed well. The reducing power of each extract was determined by measuring the increase in the absorbance at 750 nm. Ascorbic acid was used as the positive control and FRAP was calculated as ascorbic acid equivalents (AAE).
4.10. Oxygen radical absorbance capacity (ORAC) [46]
500 µL of the ethanol extract was evaporated under reduced pressure. The residue was dissolved in an AWA solution (acetone, ultrapure water, and acetic acid (70:29.5:0.5)) to a 12.5 µg/mL concentration. The samples were diluted with assay buffer (75 mM K
2HPO
4 solution and 75 mM KH
2PO
4 solution adjusted to pH 7.4) to 12.5, 6.25, 3.125, and 1.5625 µg/mL. To the sample (20 µL) or assay buffer (control, 20 µL) was added the fluorescein (FL) working solution (36 ng/mL of FL in assay buffer, 200 µL), placed in a 96-well microplate reader, and after shaking and stirring at 37 ℃, the fluorescence intensity (Em: 520 nm) was measured at Ex: 485 nm and, which were defined as f0min. After incubating at 37 ℃ for 10 min, 2,2′-azobis(2-methylpropionamidine) dihydrochloride (AAPH) solution (8.6 mg/mL of AAPH in assay buffer, 75 µL) was added, and Em: 520 nm was measured every 2 min for 90 min (f2min to f90min). The standard solutions were 12.5, 6.25, 3.125, and 1.5625 µg/mL samples (20 µL) of Trolox.
A quadratic regression equation (y=ax²+bx+c) was calculated using the concentration of each Trolox solution on the x-axis and the net AUCTrolox of each Trolox solution on the y-axis.
From the regression equation, the ORAC value was calculated from Eq. (8).
TE: Trolox equivalents; a, b, c: a, b, c in the quadratic regression equation; V: volume of sample stock solution; D: dilution factor of sample stock solution; W: sample weight.
4.11. Evaluation of amyloid-beta aggregation inhibitory activity using the automated microliter-scale high-throughput screening (MSHTS) system [16,47]
For MSHTS, human Aβ42 was purchased from a commercial source (4349-v; Peptide Institute Inc., Osaka, Japan). The quantum-dot (QD) Aβ nanoprobe was prepared using QD-PEG-NH2 (QdotTM 605 ITKTM Amino (PEG) Quantum dot; Q21501MP, Waltham, MA, USA, Thermo Fisher Scientific) and Cys-conjugated Aβ40 (23519, Anaspec Inc., Fremont, CA, USA). The half maximal effective concentration (EC50) values of all plant extracts were determined by a modified automated MSHTS system. Specifically, mixed solutions were prepared with six concentrations of extracts, 25 nM QDAβ, and 25 μM Aβ42 in PBS containing 5% ethanol and 2.5% dimethyl sulfoxide and incubated in a 1536-well plate (782096, Greiner, Kremsmünster, Austria) at 37 °C for 24 h. Images of each well were captured before and after incubation using an inverted fluorescence microscope (ECLIPSE Ti-E; Nikon) equipped with a color CMOS camera (DS-Ri2; Nikon). QD fluorescence was imaged using a 4× objective lens (Plan Apo λ 4×/0.2, Nikon) and a TRITC filter set (TRITC-A-Basic-NTE, Semrock, NY, USA). The standard deviation (SD) values of the central images of the region of interest (432 × 432 pixels) in each well were measured using the General Analysis program NIS-Elements (Nikon). Images with the highest extract concentrations, including insoluble substances, were eliminated because they affected the SD values and disrupted accurate evaluation. The EC50 was estimated from the SD values using Prism software (GraphPad Software, San Diego, CA, USA) with an EC50 shift by global fitting (asymmetric sigmoidal, five-parameter logistic)
4.12. Spectrum analysis
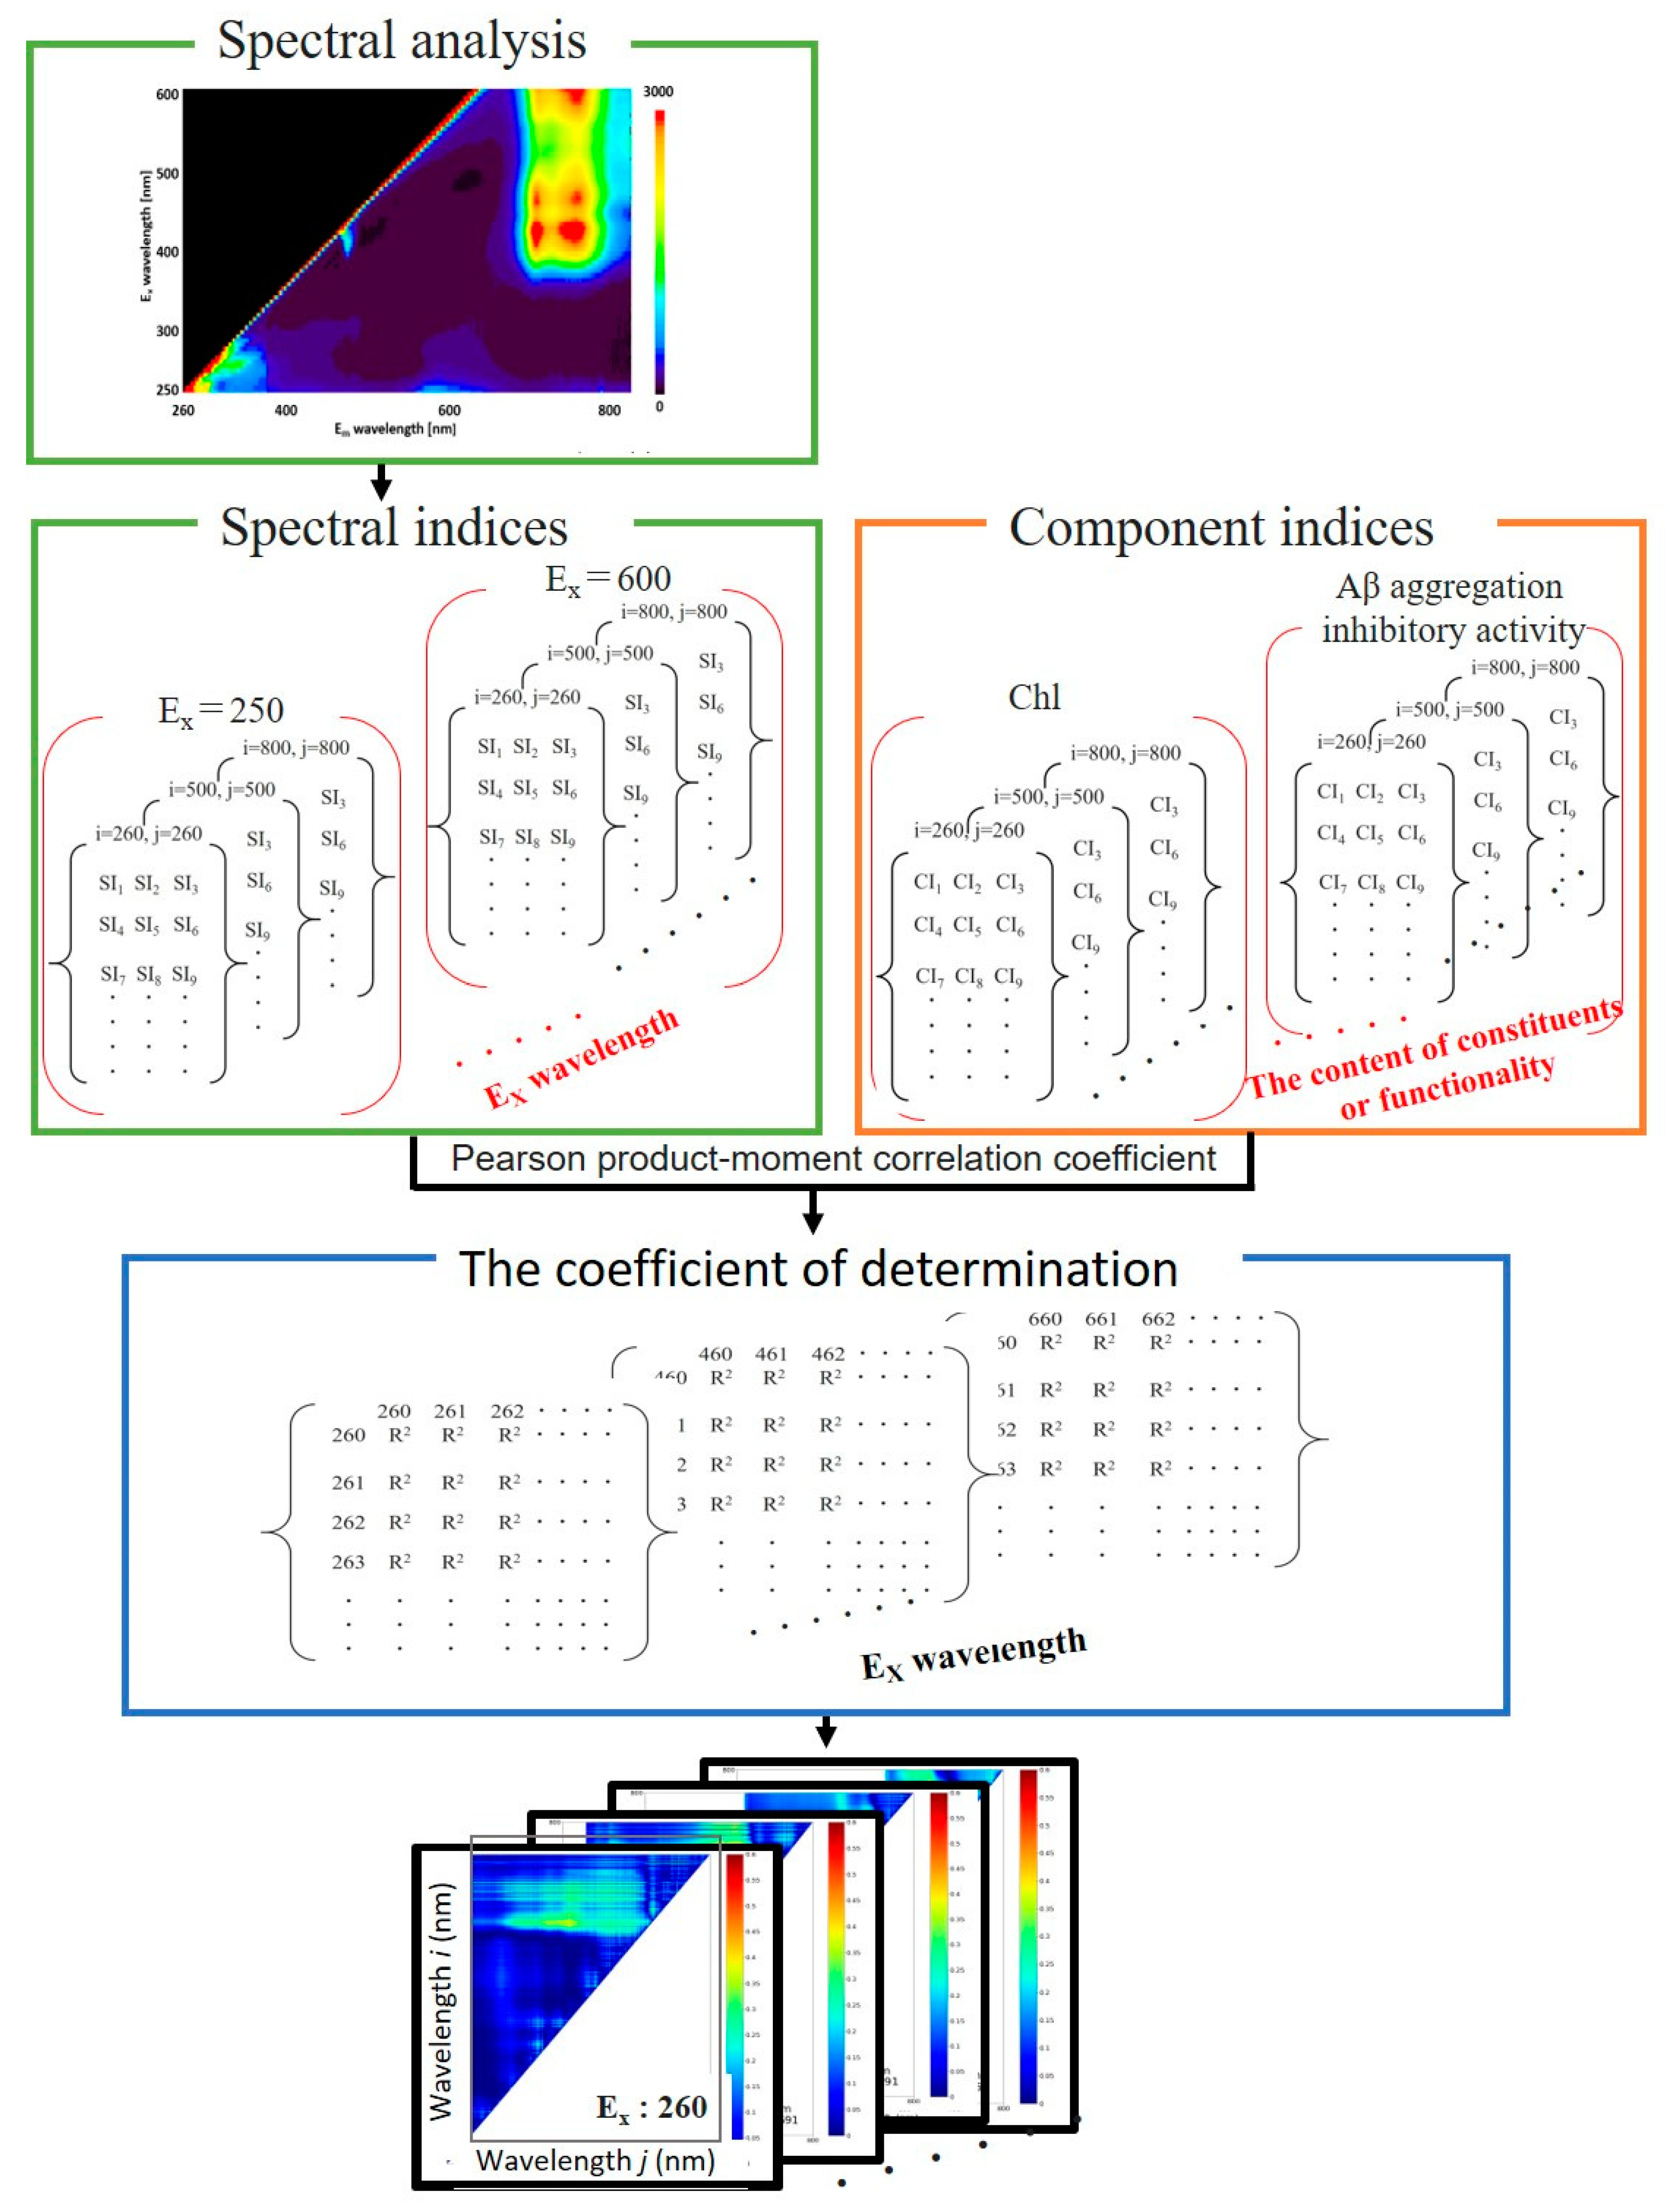
Figure 8 shows the schematic diagram of the spectrum analysis. The normalized difference spectral index (NDSI) and ratio spectral index (RSI), difference spectral index (DSI) are calculated from the 3D map of fluorescence spectra for each samples of perilla leaves at each excitation wavelength to find the optimal spectra for the contents of constituents and functionality [
21,
22]. The NDSI, RSI and DSI are defined as
where i and j denote the fluorescence wavelength (260 – 800 nm), and
ρi denotes the fluorescence intensity of i at the excitation wavelength λ ranging from 250 to 600 nm. The NDSI, RSI and DSI for all combinations of fluorescence intensities at excitation wavelengths measured in this work were calculated.
The correlation between the spectral indices (NDSI, RSI and DSI values), SI, and component indices (the content of constituents and functionality), CI, was investigated using the square of the Pearson product-moment correlation coefficient, R
2. The value of R
2 is calculated by
where SI
k and CI
k denote the value of SI and CI obtained from the
kth leave sample, and the
N denotes the total number of the leave samples. These averages are denoted as
and
. SI were calculated from the combination of any two wavelengths of the fluorescence spectrum between 260 and 800 nm obtained from the excitation light of a specific wavelength, and the correlation between these and CI was investigated. The Pearson product-moment correlation coefficient was applied between the numerical groups resulting from calculating the spectral index of all fluorescence wavelength intensity combinations for each collected leaf and the component index groups for each leaf to obtain
R2, representing the spectral index-component index correlation. These can be integrated and represented as a contour map with the spectral index obtained from the fluorescence intensity at wavelength
i on the vertical axis (
ρi) and at wavelength
j on the horizontal axis (
ρj). The magnitude of the coefficient of determination of the component index (
R2) is shown in color in
Figure 8. The magnitude of the correlation coefficient increases from blue to red, that is, the redder the color, the higher the correlation between the spectral index and the component index obtained from the combination of fluorescence intensities at that wavelength.
5. Conclusions
In this study, two fluorescence spectra-based indices that predict both of the content of the constituents and functionalities of perilla were identified with regression models (R² ≥ 0.49). This allows convenient, simultaneous, and nondestructive monitoring of the constituents and functionalities of perilla leaves and a simple harvest-time diagnosis.
The model established using this method is simple and practical, suggesting that it can simultaneously infer both of the constituents and functionalities of perilla leaves. However, because this study was conducted in a laboratory, it will be necessary to develop a portable and low-cost sensor for the on-site application of this technology shortly. Additionally, because this study was conducted in a limited region, further experiments in other regions or different geographical and climatic regions would be required if this method were to be put into practical use.
Supplementary Materials
The following supporting information can be downloaded at the website of this paper posted on Preprints.org. The detailed data in Figure 2 are given in Tables S1–S8 and Figures S1–S34. in Supporting information. The detailed data in Table 1 and Figures 3 and 4 are given in Figures A. 35. to A. 58 in Supporting information.
Author Contributions
H. S.: Methodology, Data curation, Formal analysis, Investigation, Visualization, Validation, Writing – original draft, Writing – review & editing. S. K.: Formal analysis, Software, Writing – review & editing. T. I.: Methodology, Writing – review & editing. M. K.: Evaluation of amyloid-beta aggregation inhibitory activity, Writing – review & editing. K. T.: Evaluation of amyloid-beta aggregation inhibitory activity, Funding acquisition, Writing – review & editing. K. U.: Conceptualization, Project administration, Resources, Supervision, Writing – review & editing.
Funding
This work was supported by JST Grant Number JPMJPF2213.
Institutional Review Board Statement
Not applicable.
Informed Consent Statement
Not applicable.
Data Availability Statement
Not applicable.
Acknowledgments
This work was supported by JST Grant Number JPMJPF2213.
Conflicts of Interest
The authors declare no conflict of interest. The funders had no role in the design of the study; in the collection, analyses, or interpretation of data; in the writing of the manuscript; or in the decision to publish the results.
Sample Availability
Samples of the compounds are available from the authors.
References
- Nakazawa, T.; Ohsawa, K. Metabolites of Orally administered Perilla frutescens extract in rats and humans. Biol. Pharm. Bull. 2000, 23, 122–127. [Google Scholar] [CrossRef] [PubMed]
- Hassan, W.; Noreen, W.; Rehman, H.; Gul, S.; Kamal, S.; Kamdem, M.; Zaman, J.; Rocha, J.B.T.B. Oxidative stress and antioxidant potential of one hundred medicinal plants. Curr. Top. Med. Chem. 2017, 17, 1336–1370. [Google Scholar] [CrossRef]
- Sharma, S.; Singh, S.; Singh, L. A review on medicinal plants having antioxidant potential. Indian J. Res. Pharm. Biotechnol. 2013, 1, 404–409. [Google Scholar]
- Chanda, D.; Dave, R. In vitro models for antioxidant activity evaluation and some medicinal plants possessing antioxidant properties: an overview. Afr. J. Microbiol. Res. 2009, 3, 981–996. [Google Scholar]
- Kagawa, N.; Iguchi, H.; Henzan, M.; Hanaoka, M. Drying the leaves of Perilla frutescens increases their content of anticancer nutraceuticals. Food Sci. Nutr. 2019, 18, 1494–1501. [Google Scholar] [CrossRef] [PubMed]
- Ghimire, B.; Yoo, Y.; Yu, C.; Kim, S.; Chung, I. Profiling volatile and phenoilic compound composition and characterization of the morphological and biological activities of Perilla frutescens Britton var. Japonica accessions. Acta Physiol. Plant. 2019, 41, 1–16. [Google Scholar] [CrossRef]
- Fujimoto, A.; Masuda, T. Antioxidation mechanism of rosmarinic acid, identification of an unstable quinone derivative by the addition of odourless thiol. Food Chem. 2012, 132, 901–906. [Google Scholar] [CrossRef]
- Englberger, W.; Hadding, U.; Etschenberg, E.; Graf, E.; Leyck, S.; Winkelmann, J.; Parnham, M. J. Rosmarinic acid: A new inhibitor of complement C3-convertase with anti-inflammatory activity. Int. J. Immunopharmacol. 1998, 10, 729–737. [Google Scholar] [CrossRef]
- Hamaguchi, T.; Ono, K.; Murase, A.; Yamada, M. Phenolic compounds prevent Alzheimer’s pathology through different effects on the Amyloid-β aggregation pathway. Am. J. Pathol. 2009, 175, 2557–2565. [Google Scholar] [CrossRef]
- Gaggelli, E.; Kozlowski, H.; Valensin, D.; Valensin, G. Copper homeostasis and neurodegenerative disorders (Alzheimer's, prion, and Parkinson's diseases and amyotrophic lateral sclerosis). Chem. Rev. 2006, 106, 1995–2044. [Google Scholar] [CrossRef] [PubMed]
- Cheignon, C.; Tomas, M.; Bonnefont-Rousselot, D.; Faller, P.; Hureau, C.; Collin, F. Oxidative stress and the amyloid beta peptide in Alzheimer’s disease. Redox Biol. 2018, 14, 450–464. [Google Scholar] [CrossRef] [PubMed]
- Rajasekhar, K.; Chakrabarti, M.; Govindaraju, T. Function and toxicity of amyloid beta and recent therapeutic interventions targeting amyloid beta in Alzheimer's disease. Chem. Comm. 2015, 51, 3434–13450. [Google Scholar] [CrossRef] [PubMed]
- Sanabria-Castro, A.; Alvarado-Echeverría, I.; Monge-Bonilla, C. Molecular pathogenesis of Alzheimer's disease: an update. Ann. Neurosci. 2017, 24, 46–54. [Google Scholar] [CrossRef]
- Hu, N.; Chen, L.; Li, Y.; Yao, N.; Li, H.; Zhang, Z. Foam fractionation of rosmarinic acid from perilla leaves using surface-modified Al2O3 nanoparticle as frother and collector. Indust. Crop. Prod. 2023, 197, 116633. [Google Scholar] [CrossRef]
- Tokuraku, K.; Uwai, K. Aggregation-inhibitting composition for amyloid β protein. 2015, JP2016124865A.
- Ishigaki, Y.; Tanaka, H.; Akama, H.; Ogara, T.; Uwai, K.; Tokuraku, K. A microliter-scale high-throughput screening system with quantum-dot nanoprobes for amyloid-β aggregation inhibitors. Plos One. 2013, 8, e72992. [Google Scholar] [CrossRef]
- Asif, M. Phytochemical study of polyphenols in Perilla Frutescens as an antioxidant. Avicenna J. Phytomed. 2012, 2, 169–178. [Google Scholar]
- Bano, M.; Lorente, J.; Castillo, J.; Benaventegarciaa, O.; Riao, J.; Ortuno, A.; Quirin, K.; Gerard, D. Phenolic diterpenes, flavones, and rosmarinic acid distribution during the development of leaves, flowers, stems, and roots of Rosmarinus officinalis. Antioxidant activity. J. Agric. Food Chem. 2003, 51, 4247–4253. [Google Scholar] [CrossRef] [PubMed]
- Horibata, A.; Matsukawa, T.; Itoh, T.; Watanabe, T.; Matsumoto, T.A. Novel cropping method for production of high functioning crops by utilizing on-site solar energy. Energy Procedia 2014, 57, 1502–1507. [Google Scholar] [CrossRef]
- Iwai, M.; Ohta, M.; Tsuchiya, H.; Suzuki, T. Enhanced accumulation of caffeic acid, rosmarinic acid and luteolin-glucoside in red perilla cultivated under red diode laser and blue LED illumination followed by UV-A irradiation. J. Funct. Foods 2010, 2, 66–70. [Google Scholar] [CrossRef]
- Zarco-Tejada, P.J.; Miller, J.R.; Morales, A.; Berjon, A.; Aguera, J. Hyperspectral indices and model simulation for chlorophyll estimation in open-canopy tree crops. J. Remote Sens. Environ. 2004, 90, 463–476. [Google Scholar] [CrossRef]
- Inoue, Y.; Sakaiya, E.; Zhu, Y.; Takahashi, W. Diagnostic mapping of canopy nitrogen content in rice based on hyperspectral measurements. Remote Sens. Environ. 2012, 126, 210–221. [Google Scholar] [CrossRef]
- Qi, H.; Zhu, B.; Kong, L.; Yang, W.; Zou, J.; Lan, Y.; Zhang, L. Hyperspectral inversion model of chlorophyll content in peanut leaves. Appl. Sci. 2020, 10, 1–14. [Google Scholar] [CrossRef]
- Pinter, F.G.; Barnes, P.J.; Lamorte, E.M.; Wall, R.L.; Leavitt, G.; Kimball, S.W. Measuring wheat senescence with a digital camera. B. A. Crop Sci. 1999, 39, 719–724. [Google Scholar]
- Use of optical sensors to monitor plant nitrogen status in horticultural plants. Available online: http://pods.dasnr.okstate.edu/docushare/dsweb/Get/Document-9045/HLA-6719web.pdf (accessed on 10 April 2023).
- Lightweight handheld meter for leaves without causing damage to plants. Available online: https://www.konicaminolta.com/instruments/download/catalog/color/pdf/spad502plus_catalog_eng.pdf (accessed on 17 January 2023).
- Sahoo, M.M.; Perach, O.; Shachter, A.; Gonda, I.; Porwal, A.; Dudai, N.; Herrmann, I. Spectral estimation of carnosic acid content in in vivo rosemary plants. Indust. Crop. Prod. 2022, 187, 115292–115297. [Google Scholar] [CrossRef]
- Kothari, S.; Beauchamp, R.; Laliberté, E.; Cavender-Bares, j. Reflectance spectroscopy allows rapid, accurate and non-destructive estimates of functional traits from pressed leaves. Methods Ecol. Evol. 2023, 14, 385–401. [Google Scholar] [CrossRef]
- Lichtenthaler, H.K. Multi-colour fluorescence imaging of photosyntetic activityand plant stress. Photosynthetica 2021, 59, 364–380. [Google Scholar] [CrossRef]
- Lichtenthaler, H.K.; Schweinger, J. Cell wall bound ferulic acid, the major substance of the blue-green fluorescence emission of plants. J. Plant Physiology 1997, 152, 272–282. [Google Scholar] [CrossRef]
- Zhao, Y.; Han, Q.; Ding, C.; Huang, Y.; Liao, J.; Chen, T.; Feng, S.; Zhou, L.; Zhang, Z.; Chen, Y.; Yuan, S.; Yuanin, M. Effect of low temperature on chlorophyll biosynthesis and chloroplast biogenesis of rice seedlings during greening. Int. J. Mol. Sci. 2020, 19, 1390. [Google Scholar] [CrossRef]
- Lu, N.; Takagaki, M.; Yamori, W.; Kagawa, N. Flavonoid productivity optimized for green and red forms of Perilla frutescens via environmental control technologies in plant factory. J. Food Quality 2018, 2, 1–9. [Google Scholar] [CrossRef]
- Wu, X.; Beecher, G.; Joanne, H.; Haytowitz, D.; Gebhardt, S.; Ronald, P. Lipophilic and Hydrophilic Antioxidant Capacities of Common Foods in the United States. Food Chem. 2004, 52, 4026–4037. [Google Scholar] [CrossRef]
- Pan, F.; Wen, B.; Luo, X.; Wang, C.; Wang, X.; Guan, X.; Xu, Y.; Dang, W.; Zhang, M. Influence of refining processes on the bioactive composition, in vitro antioxidant capacity, and their correlation of perilla seed oil. J. Food Sci. 2020, 85, 1160–1166. [Google Scholar] [CrossRef] [PubMed]
- Huang, S.; Miao, O.; Yuan, F.; Cao, O.; Ye, O.; Victoria, O.; Bareth, G. In-Season Diagnosis of Rice Nitrogen Status Using Proximal Fluorescence Canopy Sensor at Different Growth Stages. Remote Sens. 2019, 11, 1–21. [Google Scholar] [CrossRef]
- Mediavilla, M.; Parra, M.R.; Sánchez, C.; Apaolaza, L.H.; Pariente, F.; Lorenzo, E. Fluorescent enzymatic assay for direct total polyphenol determination in food-related samples. Talanta 2022, 247, 123576–123585. [Google Scholar] [CrossRef] [PubMed]
- Hunt, L.; Klem, K.; Lhotáková, Z.; Vosolsob, S.; Oravec, M.; Urban, O.; Špunda, V.; Albrechtová, J. Light and CO2 Modulate the Accumulation and Localization of Phenolic Compounds in Barley Leaves. Antioxidants 2021, 10, 385. [Google Scholar] [CrossRef] [PubMed]
- Vidot, K.; Guyot, S.; Maury, C.; Siret, R.; Lahaye, M. Data set on hydroxycinnamic acid ester analysis from the cell walls of apples and grapes. Data in brief. 2020, 28, 104870. [Google Scholar] [CrossRef] [PubMed]
- Wua, D.; Chena, J.; Lua, B.; Xionga, L.; Hea, Y.; Zhanga, Y. Application of near infrared spectroscopy for the rapid determination of antioxidant activity of bamboo leaf extract. Food Chem. 2012, 135, 2147–2156. [Google Scholar] [CrossRef]
- Pora, R.; Thompsonand, W.; Kriedemann, P. Determination of accurate extinction coefficients and simultaneous equations for assaying chlorophylls a and b extracted with four different solvents: verification of the concentration of chlorophyll standards by atomic absorption spectroscopy. Biochim. Biophys. Acta. 1989, 975, 384–394. [Google Scholar] [CrossRef]
- Singleton, V.L.; Orthofer, R.; Lamuela-Raventos, R.M. Analysis of total phenols and other oxidationn substrates and antioxidants by means of Folin-Ciocalteu reagent. Polyphenols and Flavonoids 1999, 299, 152–178. [Google Scholar]
- Ricardo, G.W.; Antonio, S. Analysis of propolis: some parameters and procedures for chemical quality control. J. Apicult. Res. 1998, 37, 99–105. [Google Scholar]
- Shimada, K.; Fujikawa, K.; Yahara, K.; Nakamura, T. Antioxidative properties of xanthan on the autoxidation of soybean oil in cyclodextrin emulsion. J. Agric. Food Chem. 1992, 40, 945–948. [Google Scholar] [CrossRef]
- Oyaizu, M. Studies on the product of browning reaction prepared from glucose amine. Jpn. J. Nutr. 1986, 44, 307–315. [Google Scholar] [CrossRef]
- Dasgupta S, Pandya M and Patel N, Study on antioxidant activities of some less utilized edible fruits. Techno. Innov. Pharm. Res. 2001, 5, 24–32.
- Ou, B.; Hampsch-Woodill, M.; Prior, R.L. Information development and validation of an improved oxygen radical absorbance capacity assay using fluorescein as the fluorescent probe. J. Agric. Food Chem. 2001, 10, 4619–4626. [Google Scholar] [CrossRef] [PubMed]
- Sasaki, R.; Tainaka, R.; Ando, Y.; Hashi, Y.; Deepak, H.V.; Suga, Y.; Murai, Y.; Anetai, M.; Monde, K.; Ohta, K.; et al. An Automated Microliter-Scale High-Throughput Screening System (MSHTS) for Real-Time Monitoring of Protein Aggregation Using Quantum-Dot Nanoprobes. Sci. Rep. 2019, 9, 2587. [Google Scholar] [CrossRef] [PubMed]
Figure 1.
3D map of fluorescence spectra (260–800 nm) obtained when perilla leaves are irradiated with excitation light (250–600 nm). The vertical axis shows the wavelength of the excitation light, and the horizontal axis shows the fluorescence wavelength. These colors indicate the fluorescence intensity, from red to blue.
Figure 2.
Variation in content of constituents and functional properties of Perilla frutescens leaves. A): Total Chl, B): TPC, C): TFC, D): RA, E): DPPH radical scavenging activity, F): FRAP, G): ORAC, H): Aβ aggregation inhibitory activity. Each value is the mean of triplicate measurements, and error bars represent the measurement’s standard err of mean (SEM).
Figure 3.
Contour maps for the contents of constituents with the combinations of excitation and fluorescence wavelengths (i, j) with the highest R2 (Ex, Emi, Emj) and coefficient of determination (R2). A): Total Chl, B): TPC, C): TFC, D): RA. Left column: NDSI, Middle column: RSI, Right column: DSI. The horizontal and vertical bars on the spectrum indicate the fluorescence wavelengths with the highest R2 values.
Figure 4.
Contour maps for the functionalities with the combinations of excitation and fluorescence wavelengths (i, j) with the highest R2 (Ex, Emi, Emj) and coefficient of determination (R2). E): DPPH radical scavenging activity, F): FRAP, G): ORAC, H): Aβ aggregation inhibitory activity. Left column: NDSI, Middle column: RSI, Right column: DSI. The horizontal and vertical bars on the spectrum indicate the fluorescence wavelengths with the highest R2 values.
Figure 5.
Correlation model for the contents of constituents with the combinations of excitation and fluorescence wavelengths (i, j) with the highest R2 (Ex, Emi, Emj) and coefficient of determination (R2). A): Total Chl, B): TPC, C): TFC, D): RA. Left column: NDSI, Middle column: RSI, Right column: DSI. Each value is the mean of triplicate measurements. The solid line depicts the regression line.
Figure 6.
Correlation model for the functionalities with the combinations of excitation and fluorescence wavelengths (i, j) with the highest R2 (Ex, Emi, Emj) and coefficient of determination (R2). A): DPPH radical scavenging activity, B): FRAP, C): ORAC, D): Aβ aggregation inhibitory activity. Left column: NDSI, Middle column: RSI, Right column: DSI. Each value is the mean of triplicate measurements The solid line depicts the regression line.
Figure 8.
Steps to calculate the coefficients of determination of the spectral and component indices and to produce the maps.
Figure 8.
Steps to calculate the coefficients of determination of the spectral and component indices and to produce the maps.
Table 1.
Excitation and fluorescence wavelengths (i, j) with the highest R2 (λ, ρi, ρj) and coefficient of determination (R2) for each component index.
Table 1.
Excitation and fluorescence wavelengths (i, j) with the highest R2 (λ, ρi, ρj) and coefficient of determination (R2) for each component index.
| Index |
NDSI |
|
RSI |
|
DSI |
| λ |
ρi
|
ρj |
R2
|
|
λ |
ρi |
ρj |
R2
|
|
λ |
ρi |
ρj |
R2
|
| (nm) |
(nm) |
(nm) |
(nm) |
(nm) |
(nm) |
(nm) |
(nm) |
(nm) |
| Constituents |
|
|
|
|
|
|
|
|
|
|
|
|
|
|
| Total Chl |
300 |
738 |
712 |
0.6 |
|
300 |
738 |
712 |
0.62 |
|
300 |
749 |
712 |
0.49 |
| TPC |
540 |
718.5 |
715.5 |
0.55 |
|
385 |
433.5 |
417 |
0.57 |
|
270 |
715 |
693 |
0.49 |
| TFC |
495 |
622 |
608 |
0.55 |
|
450 |
612 |
583.5 |
0.65 |
|
475 |
540 |
529 |
0.58 |
| RA |
340 |
738.5 |
701 |
0.71 |
|
340 |
738.5 |
701 |
0.7 |
|
330 |
656.5 |
644.5 |
0.71 |
| Functionality |
|
|
|
|
|
|
|
|
|
|
|
|
|
|
| DPPH |
300 |
772 |
593 |
0.48 |
|
330 |
719.5 |
716 |
0.59 |
|
330 |
719.5 |
716 |
0.63 |
| FRAP |
365 |
749.5 |
741 |
0.68 |
|
365 |
749.5 |
741 |
0.69 |
|
475 |
540 |
534.5 |
0.70 |
| ORAC |
320 |
772 |
593 |
0.48 |
|
320 |
486.5 |
476 |
0.47 |
|
255 |
451 |
440.5 |
0.42 |
| Aβ |
285 |
728 |
706.5 |
0.5 |
|
285 |
728 |
706.5 |
0.52 |
|
320 |
741 |
729 |
0.51 |
Table 2.
Regression line equation and coefficient of determination for correlation model.
Table 2.
Regression line equation and coefficient of determination for correlation model.
| |
NDSI |
|
RSI |
|
DSI |
| regression line |
R2
|
|
regression line |
R2
|
|
regression line |
R2
|
| Constituents |
|
|
|
|
|
|
|
|
Total Chl
(µg/mg)
|
Chl =8.6×
NDSI300[738.0, 712.0]+1.2 |
0.60 |
|
Chl=4.3×
RSI300[738.0, 712.0]–3.1 |
0.62 |
|
Chl=0.040×
DSI300[749.0, 712.0]+1.4 |
0.49 |
TPC
(µg GAE/mg)
|
TPC =–6500×
NDSI540[718.5, 715.5]+320 |
0.55 |
|
TPC =1600×
RSI385[433.5, 417.0]–1400 |
0.57 |
|
TPC =3.7×
DSI270[715.0, 693.0]+170 |
0.49 |
TFC
(µg QE/mg)
|
TFC =–1200×
NDSI495[622.0, 608.0]+5.9 |
0.55 |
|
TFC =510×
RSI450[612.0, 583.5]–510 |
0.65 |
|
TFC =–8.7×
DSI475[540.0, 529.0]+81 |
0.58 |
| RA (µg/mg) |
RA =–4.1×
NDSI340[738.5, 701.0]+0.64 |
0.71 |
|
RA=–1.9×
RSI340[738.0, 701.0]+2.5 |
0.70 |
|
RA=–0.042×
DSI330[656.5, 644.0]+0.36 |
0.71 |
| Functionality |
|
|
|
|
|
|
|
|
DPPH
(µg/mL)
|
IC50 =82×
NDSI300[772.0, 593.0]+56 |
0.48 |
|
IC50=391×
RSI330[719.5, 716.0]–353 |
0.59 |
|
IC50=3.7×
DSI330[719.5, 716.0]+35 |
0.63 |
FRAP
(mg AEE/100 g)
|
FRAP=3200×
NDSI365[749.5, 741.0]+330 |
0.68 |
|
FRAP=1800×
RSI365[749.5, 741.0]–1500 |
0.69 |
|
FRAP=60×
DSI475[540.0, 534.5]+68 |
0.7 |
ORAC
(µmol TE/g)
|
ORAC=1200×
NDSI320[772.0, 593.0]+30 |
0.49 |
|
ORAC =590×
RSI320[486.5, 476.0]–560 |
0.47 |
|
ORAC =25×
DSI320[451.0, 440.5]+16 |
0.42 |
| Aβ (µg/mL) |
EC50=0.37×
NDSI285[728.0, 706.5] -0.030 |
0.50 |
|
EC50=0.18×
RSI285[728.0, 706.5]–0.15 |
0.52 |
|
EC50=0.020×
DSI320[741.0, 729.0]–0.035 |
0.51 |
|
Disclaimer/Publisher’s Note: The statements, opinions and data contained in all publications are solely those of the individual author(s) and contributor(s) and not of MDPI and/or the editor(s). MDPI and/or the editor(s) disclaim responsibility for any injury to people or property resulting from any ideas, methods, instructions or products referred to in the content. |
© 2023 by the authors. Licensee MDPI, Basel, Switzerland. This article is an open access article distributed under the terms and conditions of the Creative Commons Attribution (CC BY) license (http://creativecommons.org/licenses/by/4.0/).

