
Submitted:
11 September 2023
Posted:
13 September 2023
You are already at the latest version
Abstract
Buildings can play an important role in reducing GHG emissions through increased energy efficiency. The European Commission issued a proposal in 2021 suggesting that all new buildings should be “zero-emission Buildings” (ZEB), aiming at a zero GHG emission building stock by 2050.The extent to which ZEB can contribute to reduced GHG emissions, however, varies between countries, due to different energy systems. It is also important to consider other environmental effects to avoid that climate benefits come with unintended consequences.Here, we explore the life-cycle environmental performance for a ZEB in a case where electricity and heating is largely fossil-free. The assessment concentrates on i) environmental impact of the use stage in relation to the product stage, ii) the interrelation between different energy sources, with attention on household electricity, and iii) the performance for more impact categories than primary energy use and climate change. While our results generally support the use of ZEBs from an environmental perspective, they also show that the climate benefit in this setting is marginal. However, given that energy systems are connected and energy savings in one place can reduce the demand for fossil energy elsewhere, the climate benefit of ZEBs is likely underestimated. Besides methdological implications for future studies, this indicates that current EU policy is promising, as incentives for implementation of ZEBs is unaffected by domestic effects.
Keywords:
Zero-Emission Building
; Life cycle assessment
; Environmental sustainability
; Building materials
; Environmental engineering design
; Energy efficiency
Introduction
In 2015, the UN Paris agreement was formulated, to “strengthen the global response to the threat of climate change in the context of sustainable development and efforts to eradicate poverty” (United Nations, 2015). Consequently, on 11 December 2019, the EU Commission (EC) launched ‘A European green deal’ (EGD), as one of its prioritized strategies (European Commission, 2019). The EGD states that EU shall reduce its emissions of greenhouse gases with 55% (relative to 1990’s emissions) no later than 2030 and have no net emissions of greenhouse gases (GHG) by 2050. These goals are legally binding for the Member States through the ‘European Climate Law’ (European commission, 2021a) and represent increased ambitions from the previous goal of 40 % GHG reductions by 2030.
According to the current EU directive on the energy performance of buildings (DEPB) (European Parliament, Council of the European Union, 2018), buildings are responsible for 40% of the EU energy consumption and 36% of energy related greenhouse gas (GHG) emissions. Buildings can therefore play an important role in reducing GHG emissions in EU. The DEPB prescribes that Member States shall ensure that all new buildings are nearly zero energy buildings (NZEB). A NZEB is defined in DEPB as “a building that has a very high energy performance, where the very low amount of energy required should be covered to a very significant extent from renewable sources.” Moreover, each Member State shall establish a long-term renovation strategy facilitating the transformation of existing buildings to NZEBs.
To align the building sector with the Union´s enhanced climate ambitions in the EGD, the EC issued a proposal for a revision of the DEPB in 2021. The revision suggests that all new buildings should be ‘zero-emission Buildings’ (ZEB), and all renovated buildings should be NZEB, by 2030, aiming at a zero-emission building stock by 2050 (European Commission, 2021b). A ZEB is defined in short as “a building with a very high energy performance, where the very low amount of energy still required is fully covered by energy from renewable sources generated on-site, from a renewable energy community, or from a district heating and cooling system”. A ZEB shall not cause any on-site GHG emissions from fossil fuels. The proposal also provides region-specific thresholds for maximum primary energy use for ZEBs. Although the definition of NZEB does allow for a small amount of energy for heating from non-renewable sources, both the NZEB and ZEB definitions imply energy-efficient buildings heated with renewable energy sources. The latter indicates that the EC wants to address and limit total GHG emissions from a life cycle perspective.
A heated building will have an environmental impact during its entire lifetime, I.e., product stage, construction process stage, use stage, and end of life stage. The product stage includes raw materials supply, transport, and manufacturing of materials. The construction process stage covers the processes from the factory gate of the different construction products to the practical completion of the construction work. The use stage covers the period from the practical completion of the construction work to the point of time when the building is deconstructed/demolished. The end-of-life stage of a building starts when the building is decommissioned.
Life Cycle Assessment (LCA) has been increasingly applied in building research in the last decades, when analyzing the environmental performance of buildings (Anand & Amor, 2017; Chastas, et al., 2016; Hollberg, et al., 2021; Nwodo & Anumba, 2019). The life cycle approach gives extra ‘credits’ in different certification tools, such as LEED and BREEAM (Sartori, et al., 2021), and is also emerging in national building regulations, e.g., the Swedish regulation on climate declaration for buildings (Swedish Ministry of Finance, 2021). The regulation is based on calculated values of greenhouse gas emissions of the product stage and the construction process stage of new residential buildings. Several LCA studies on low energy buildings show that the global warming potential (GWP) and primary energy use are greater in the product stage and the use stage than in the construction process stage and end of life stage, and that GWP in the product stage can be as large as, or even larger than, GWP from energy use during the use stage over the lifetime of the building (Blengini & Di Carlo, 2010; Liljenström, et al., 2014; Erlandsson, et al., 2018; Dodoo & Gustavsson, 2013). Consequently, the relative importance of material choices for the overall environmental impact has increased. Furthermore, a significant variation has been reported concerning GHG emissions in the use stage for low energy buildings, depending on whether heat and electricity comes from external sources (i.e., district heating and electricity grids) or internal (i.e., using solar energy solutions for heat and power) (Vares, et al., 2019). Overall, it makes sense to focus on reducing the energy demand in the use stage, promote the use of renewable energy sources, and reduce the use of PE and fossil fuels.
The effects of energy savings in the use stage on GHG emissions largely depends on the energy source. Although passive houses have been shown to have a generally lower climate impact than conventional buildings, a passive house heated with electricity from non-fossil energy sources is not necessarily performing better than a conventional building (Brunklaus, et al., 2010). The choice of end-use heating system can be equally important for the climate performance as passive house construction technologies (Dodoo & Gustavsson, 2013). Using energy use as a proxy for climate performance for NZEB and ZEB can thus be problematic, especially if the heating source has low emissions of GHG; if energy savings (to reduce GHG emissions) is achieved by using more materials (i.e., insulation), total GHG emissions may then increase. Furthermore, household electricity, an important heat source in low energy houses, has been shown to account for the greatest share of operational GHG emissions in the use stage, especially in a passive house heated with a renewable energy source (Dodoo & Gustavsson, 2013). Still, household electricity is often left out when evaluating a building’s environmental impact, even in the DEPB. Furthermore, although energy use and GWP are important issues from an environmental perspective and high up on the policy agenda, focusing environmental assessments on only one, or a few, impact categories provides an incomplete picture of the total environmental performance. For example, bioenergy is considered a renewable energy source in the EU directive, but combustion of biomass emits, e.g., nitrogen oxides (NOx), particles, sulfur dioxide (SO2), carbon oxide (CO), and hydrocarbons (HC) (Strömberg & Herstad Svärd, 2012), with effects on climate, human and environmental toxicity, acidification, and eutrophication (Swedish Environmental Protection Agency, 2019).
Here, we explore the life-cycle environmental performance for a ZEB in the specific case where the energy source for space heating has very low GWP. The assessment concentrates on i) environmental impact of the use stage in relation to the product stage over a 50-year period, ii) the interrelation between different energy sources, with attention on the role of household electricity, and iii) the effect of using passive techniques to achieve high-energy performance of buildings for more impact categories than primary energy use and climate change.
Methodology
The article is based on a single-case LCA study consisting of one functional unit of analysis, a wooden framed ZEB in Östersund, Sweden (lat. 63°N), built to Swedish passive house standard 2010 (FEBY, 2012; Svensson, 2013; Danielski et al.,2013) The environmental impact of the ZEB is then compared to a modelled conventional building at the same location.
Functional unit
The house in the study is a semidetached house for two families. Each apartment has an area of 160 m2, divided into two floors (Figure 1).
The high-energy performance is achieved by passive techniques, i.e., a well-insulated, airtight thermal envelope, and Heat Recovery Ventilation, HRV. The foundation is a slab on ground construction with 400 mm insulation of cellular plastic sheets. The walls are constructed with a primary bearing framework with vertical lightweight wood and Masonite studs, to reduce thermal bridging, and cellulose fiber insulation between the studs. A second vertical and third horizontal framework, with wooden studs and glass wool insulation, is mounted on each side of the primary framework, resulting in a 513 mm wall with a total of 415 mm insulation. The roof is insulated with 582 mm cellulose fiber and pitched both externally and internally. The external roofing is made of steel sheets. The calculated average thermal transmission coefficient (Um) equals to 0,172 (W m-2 K-1). For further details regarding the ZEB, see Svensson (2013) and Danielski, et al., (2013).
The main source of space heating is district heating from the local biomass-based CHP. The space heating is supplied by floor heating in the bathrooms and by water heating coils in the HRV unit. A wood stove is installed in the living room for peak heating demand and for convenience of the residents (Svensson, 2013)
Study boundaries
An assessment was conducted of the product stage and the use stage, with focus on the latter, for the ZEB. The measured final energy demand and household electricity during one year (2012-2013) (Danielski, et al., 2013) was used as the yearly average over the lifetime of 50 years.
Extensively used materials and materials crucial for achieving passive house standard were included in the study, as specified in Table 1. The selection was based on Svensson (2013) but including ‘Assembly materials, nails and screws’ and excluding ‘Construction process stage’.
The environmental impact of the construction process stage was assumed not to be specifically dependent on passive house techniques. Both the construction process stage and the end of life stage have a very small relative impact, compared to the product stage and the use stage (see e.g. Erlandsson et al., 2018). The construction process stage and the end-of-life stage were therefore not included.
Allocation
The study has an attributional approach using yearly-average data to assess lifecycle environmental impacts. The allocation ‘cut-off by classification model’ was applied for the environmental impact of co-products based on product prices, i.e., economic allocation. The environmental burden was allocated to the primary producer. For a detailed description of the model we refer to Ecoinvent, (2020).
Impact Categories and Characterization models
The studied environmental impact categories are (a) climate change, and (b) primary energy use (PE), based on the EU directive (European Parliament, 2018). To provide a more complete picture of the total environmental performance, (c) ecotoxicity, (d) human carcinogenic toxicity, (e) human non-carcinogenic toxicity, (f) eutrophication, and (g) acidification were also included. The impact was calculated using lifecycle impact assessment (LCIA) data from the Ecoinvent database v3.3, a widely used database in LCA studies, for such characterization (Wernet, et al., 2016). The characterization models for this assessment were:
-Climate change: IPCC 2013 Baseline model of 100 years (IPCC, 1994)
Characterized as Global Warming Potential (GWP).
-Primary energy use (PE): Cumulative energy demand (CED).
The goal of the CED is to calculate the total primary energy input for the generation of a product (Röhrlich, et al., 2000) The value is determined by the amount of energy (MJ eq) withdrawn from nature. (Hischier & Weidema, 2010)
-Toxicity: USEtox characterization model (Rosenbaum, et al., 2008)
Labeled best practice for evaluation of toxicity in the International Reference Life Cycle Data System (ILCD) (Hauschild, et al., 2013), and designed to describe the fate, exposure, and effects of chemicals. The characterization factors (CFs) in the USEtox model are labeled recommended and interim, reflecting the level of reliability of the calculations in a qualitative way, where the reliability of the interim factors are lower than the recommended factors (Rosenbaum, et al., 2008). The USEtox team recommends that the interim and recommended CFs should always be used together, and that a sensibility analysis should be performed by applying only the recommended CFs to see if and how the results change. In a case, where the evaluation results are dominated by interim characterization factors, the results have to be interpreted as having a lower level of confidence (USEtox, 2019).
-Eutrophication: CML IA characterization model.
Characterized as Eutrophication Potential
-Acidification: CML IA characterization model.
Characterized as Acidification Potential
Data collection and assumptions
The Ecoinvent database offers datasets that are, to some extent, regionally adapted. In this study, LCIA datasets adapted to Swedish conditions were chosen when available (e.g. energy data for the use stage). If such data were not available, European data were used. Global data were used when necessary. For the amount of building materials (based on blueprints and interviews) and annual energy consumption see Svensson (2013) and Danielski et. al. (2013).
Product stage: materials
As the actual amount of materials delivered to the building differs from the blueprints, adjustments were made to the amount of materials reported by (Svensson, 2013)

Table 1.
Included and excluded items, modified from (Svensson, 2013). The modification being that ‘Assembly materials, nails and screws’ were added in the ‘Included’ column, and ‘Construction process stage’ was added in the ‘Excluded’ column. Also, minor terminology changes were made.
Table 1.
Included and excluded items, modified from (Svensson, 2013). The modification being that ‘Assembly materials, nails and screws’ were added in the ‘Included’ column, and ‘Construction process stage’ was added in the ‘Excluded’ column. Also, minor terminology changes were made.
| Included | Excluded |
| Framework | Transports from factories for building materials |
| Foundation | Construction energy |
| Outer and inner walls | Waste in the construction |
| Ceiling/roof | Garage and garbage room |
| Middle floor structure | Terrace |
| Floor coverings | Balcony |
| Doors | Garden |
| Windows | Fences |
| Interior staircase and banister | Downpipes and rain gutters |
| HRV- Heat Recovery ventilation | Snow railings |
| Wood stove | District heating central with heat exchanger |
| Assembly materials, nails and screws | Appliances |
| Energy used in the use stage calculated on a 50 years period. | Permanent fixtures like closets, shelves and drawers |
| Electrical installations | |
| Underfloor heating pipes | |
| Other plumbing material such as drainage pipes, sewers, water pipes etc. | |
| Toilets, bathtubs, showers, wash basins, sinks etc. | |
| Paint and wallpaper | |
| Sealing strips for the windows | |
| Argon gas between the glasses in the windows | |
| Fittings for windows and doors | |
| Locks, keys and handles for the doors | |
| Renovations | |
| Construction process stage and End of life stage |
Because of e.g. product standardization of dimensions, products often need to be cut to measure on the building site. The extra material, henceforth called ´spills´, have to be taken into consideration when assessing the product stage environmental impact. Examples of spills are waste from cutting gypsum boards, studs, flooring, etc. The amount of spills is different for different materials and building techniques. Josephson and Saukkoriipi (2005) estimated the amount of spill to vary between 2-10%. Since no records of the spills are available for the ZEB, an overall average of 8% increase of the volume of materials from the foreground inventory was assumed.
Assembly methods of, e.g., plastic foils or roofing plates, where function requires overlap, requires a greater amount of material than what can be measured from blueprints. To correct for this, overlap values from the respective manufacturers were used.
Assembly material made from metal e.g. nails, nailing plates, brackets and fixings was added.
Cellulose insulation is applied with different densities in walls and roof structures. The manufacturer´s recommended values were used to calculate absolute amounts.
Use stage
Space heating energy for the ZEB consists of two parts, (a) the active space heating from the CHP power plant and the stove, and (b) the passive space heating from persons, sunlight, and appliances. Around 40% of the heat demand in the ZEB is covered by household electricity (Danielski, 2016). Electricity thus plays an important role in heating this building, as household appliances, powered by electricity, become heat sources.
The Swedish electricity mix was used for the evaluation of the impacts from household and operational electricity, based on LCIA data from the Ecoinvent database.
Comparison to a conventional building
To assess the effect of passive techniques, a calculation of the environmental impact for a conventional building was made as a reference. The conventional building was assumed to be located at the same site as the ZEB with the same source for space heating.
Table 2.
Thermal properties of the thermal envelope and air leakage for the conventional building and the ZEB. BBR16 refers to legal requirements. Values from b) interpolated to 2010.
Table 2.
Thermal properties of the thermal envelope and air leakage for the conventional building and the ZEB. BBR16 refers to legal requirements. Values from b) interpolated to 2010.
| U- values [W m-2 K-1] | Air leakage q50 [l sm-2 Aom-1] |
||||||
| Foundation | Walls | Roof | Windows | Doors | Um | ||
| BBR16 a) | 0.15 | 0.5 | |||||
| Conventional | 0.15 a) | 0.18 b) | 0.11 b) | 1.7 b) | 1.5 a) | 0.344 | 0,6 l/sm2Aom c) |
| ZEB | 0.11 d) | 0.093 d) | 0.078 d) | 0.75 d) | 0.8 d) | 0.172 d) | 0,3 l/sm2Aom e) |
| a) (The Swedish Board of Housing, Building and Planning, 2008) b) (The Swedish Board of Housing, Building and Planning 2009) c) (Svensson & Hägered Engman, 2009) d) (Danielski, et al., 2013) e) (FEBY, 2012) | |||||||
The differences between using passive techniques (as in the studied ZEB) versus conventional techniques are in the thermal performance, including airtightness, of the thermal envelope, and in heat recovery from exhaust air by a heat recovery ventilation unit (HRV) (Passive House Institute, 2015).
A ZEB has a higher thermal performance and therefore a lower energy demand in the use stage than a conventional building. On the other hand, a ZEB uses more material in the product stage. Passive techniques thus affect both the product stage and the use stage.
The thermal properties of the thermal envelope for the ZEB and the modelled conventional building are listed in Table 2.
A building erected in 2010 had to fulfil the legal demands regarding maximum specific energy use at 150 kWh/m2 and maximum average heat transfer coefficient, Um at 0,5 W/m2K (The Swedish National Board of Housing Building and Planning, 2008). However, a survey of the Swedish building stock until 2005, made by the Swedish National board of Housing, Building and Planning (2009) of 1800 buildings in 30 Swedish municipalities, showed average U values for outer walls 1996-2005 at 0,18 W/m2K, roofs at 0,12 W/m2K and windows at 1,90 W/m2K. (Swedish Board of Housing Building and Planning, 2009). These values were interpolated to 2010 levels, based on the trend over time. U-values of the foundation and the doors was chosen from the building code for small buildings (The Swedish board of Housing Building and Planning, 2008). Based on the U-values and dimensions above, a more realistic Um value for the conventional building was calculated (Table 2). The dimensions of the construction and the amount of materials were adjusted accordingly.
The conventional roof was modeled by reducing the thickness of the insulation compared to the ZEB and adjusting the dimension of the glulam roof beams based on structural load. The walls in the conventional building were modelled by replacing lightweight beams in walls with wooden studs and reducing the thickness of the insulation. The foundation was modelled by reducing the thickness of the underlying insulation.
Passive techniques include improved air tightness. Air leakage through the thermal envelope is commonly assessed by measuring the leakage at a 50 Pa pressure difference between the interior and exterior (q50). For this ZEB, no measured data for the air leakage is registered. The air leakage value for the ZEB (Table 2) is therefore represented by the Swedish passive house criteria for maximum air leakage 2012 (FEBY, 2012).
Airtightness was also included in the building code but as a functional parameter without a value. A study of 100 air leakage measurements by Svensson and Hägerhed-Engman (2009) showed that the majority of conventional buildings have a q50 value between 0,3 and 0,8 l/sm2Aom. A value of 0,6 l/sm2Aom was thereby assumed in the modeling of the conventional building.
Um includes the effect of thermal bridges. The impact of thermal bridges on Um varies from 5-20%, depending on the insulation-grade and design of the building (Pettersson, 2018). Here, we assume an 8.5% increase of Um for the ZEB (Danielski, et al., 2013) and a 15% increase for the conventional building (Pettersson, 2018).
HRV was uncommon in new Swedish buildings in the first decade of 2000. A conventional building would most likely have had an exhaust air ventilation without heat recovery (The Swedish National Board of Housing, Building and Planning, 2009). Less ducts are needed for an exhaust air only system, and the appliance is simpler, so exhaust air ventilation uses less material in the product stage. On the other hand, the heat demand is higher in the use stage. Based on this, the conventional building is modelled assuming a decrease in product stage impact, corresponding to half of the material from the HRV-unit and the ventilation ducts, and an increase in the heat demand, corresponding to the recovered heat in the ZEB. The benefit of recovery of heat and the operational energy use from the HRV-unit are estimated based on data from the Swedish energy agency (Swedish Energy Agency, 2014).
The roofing material only affects the product stage and has no effect on the thermal performance of the building. The studied ZEB has a steel sheet roofing, which was uncommon for Swedish buildings at the time. For the conventional building model, we assume concrete tile roofing, corresponding to the overwhelming majority of buildings from that time with roof inclination equal to or larger than 14 degrees (The Swedish National Board of Housing, Building and Planning, 2009).
The relative difference in impact between the conventional building model and the
ZEB, ΔI, is calculated as ΔI = (Iconventional – IZEB)/ IZEB for the thermal envelope (te), HRV, and the roofing (r), respectively, for both the product stage and the use stage. Changes in the thermal envelope, roofing, and HRV are independent, so the difference in impact based on such changes can be added or subtracted individually.
Based on the above, four different scenarios were evaluated (Table 3).
Results
Zero Energy Building
The product stage (raw materials supply, transport, and manufacturing of products) and the use stage (operation and maintenance), are close to equal for the Climate change, Eutrophication and Acidification categories. The use stage has a larger relative impact in CED, ecotoxicity, and non- carcinogenic toxicity categories. (Figure 2)
The product stage has a clearly larger relative impact only in the human carcinogenic toxicity category, where metals constitute 50% of the product stage impact (Figure 2; Table 4; Figure 4d). Metals contribute to almost 18% of the product stage impact in the climate change category, 33-50% in the toxicity categories and 21-27% in the acidification and eutrophication categories (Table 4; Figure 3; Figure 4b, d, f).
Insulation is another overall large contributor, as expected in a well-insulated building. Wood fiberboards and glued laminated timber (GLT) are also among the ‘top five’ contributors to the product stage impact in all the studied categories. Concrete/cement represent roughly the same amount in m3 as GLT, but only reaches “‘top five’” in one category, climate change. The large impact of metal in climate change, eutrophication, and acidification, is apparent. The metal sheet roofing is a substantial impact contributor in the metal category in the product stage. (Table 4; Figure 3).
Figure 3.
Environmental impacts attributed to product stage material categories and use stage energy categories. Metal has been subcategorized into “Sheet metal roofing”, “ventilation ducts+HRV”, and “Metal other”
Figure 3.
Environmental impacts attributed to product stage material categories and use stage energy categories. Metal has been subcategorized into “Sheet metal roofing”, “ventilation ducts+HRV”, and “Metal other”
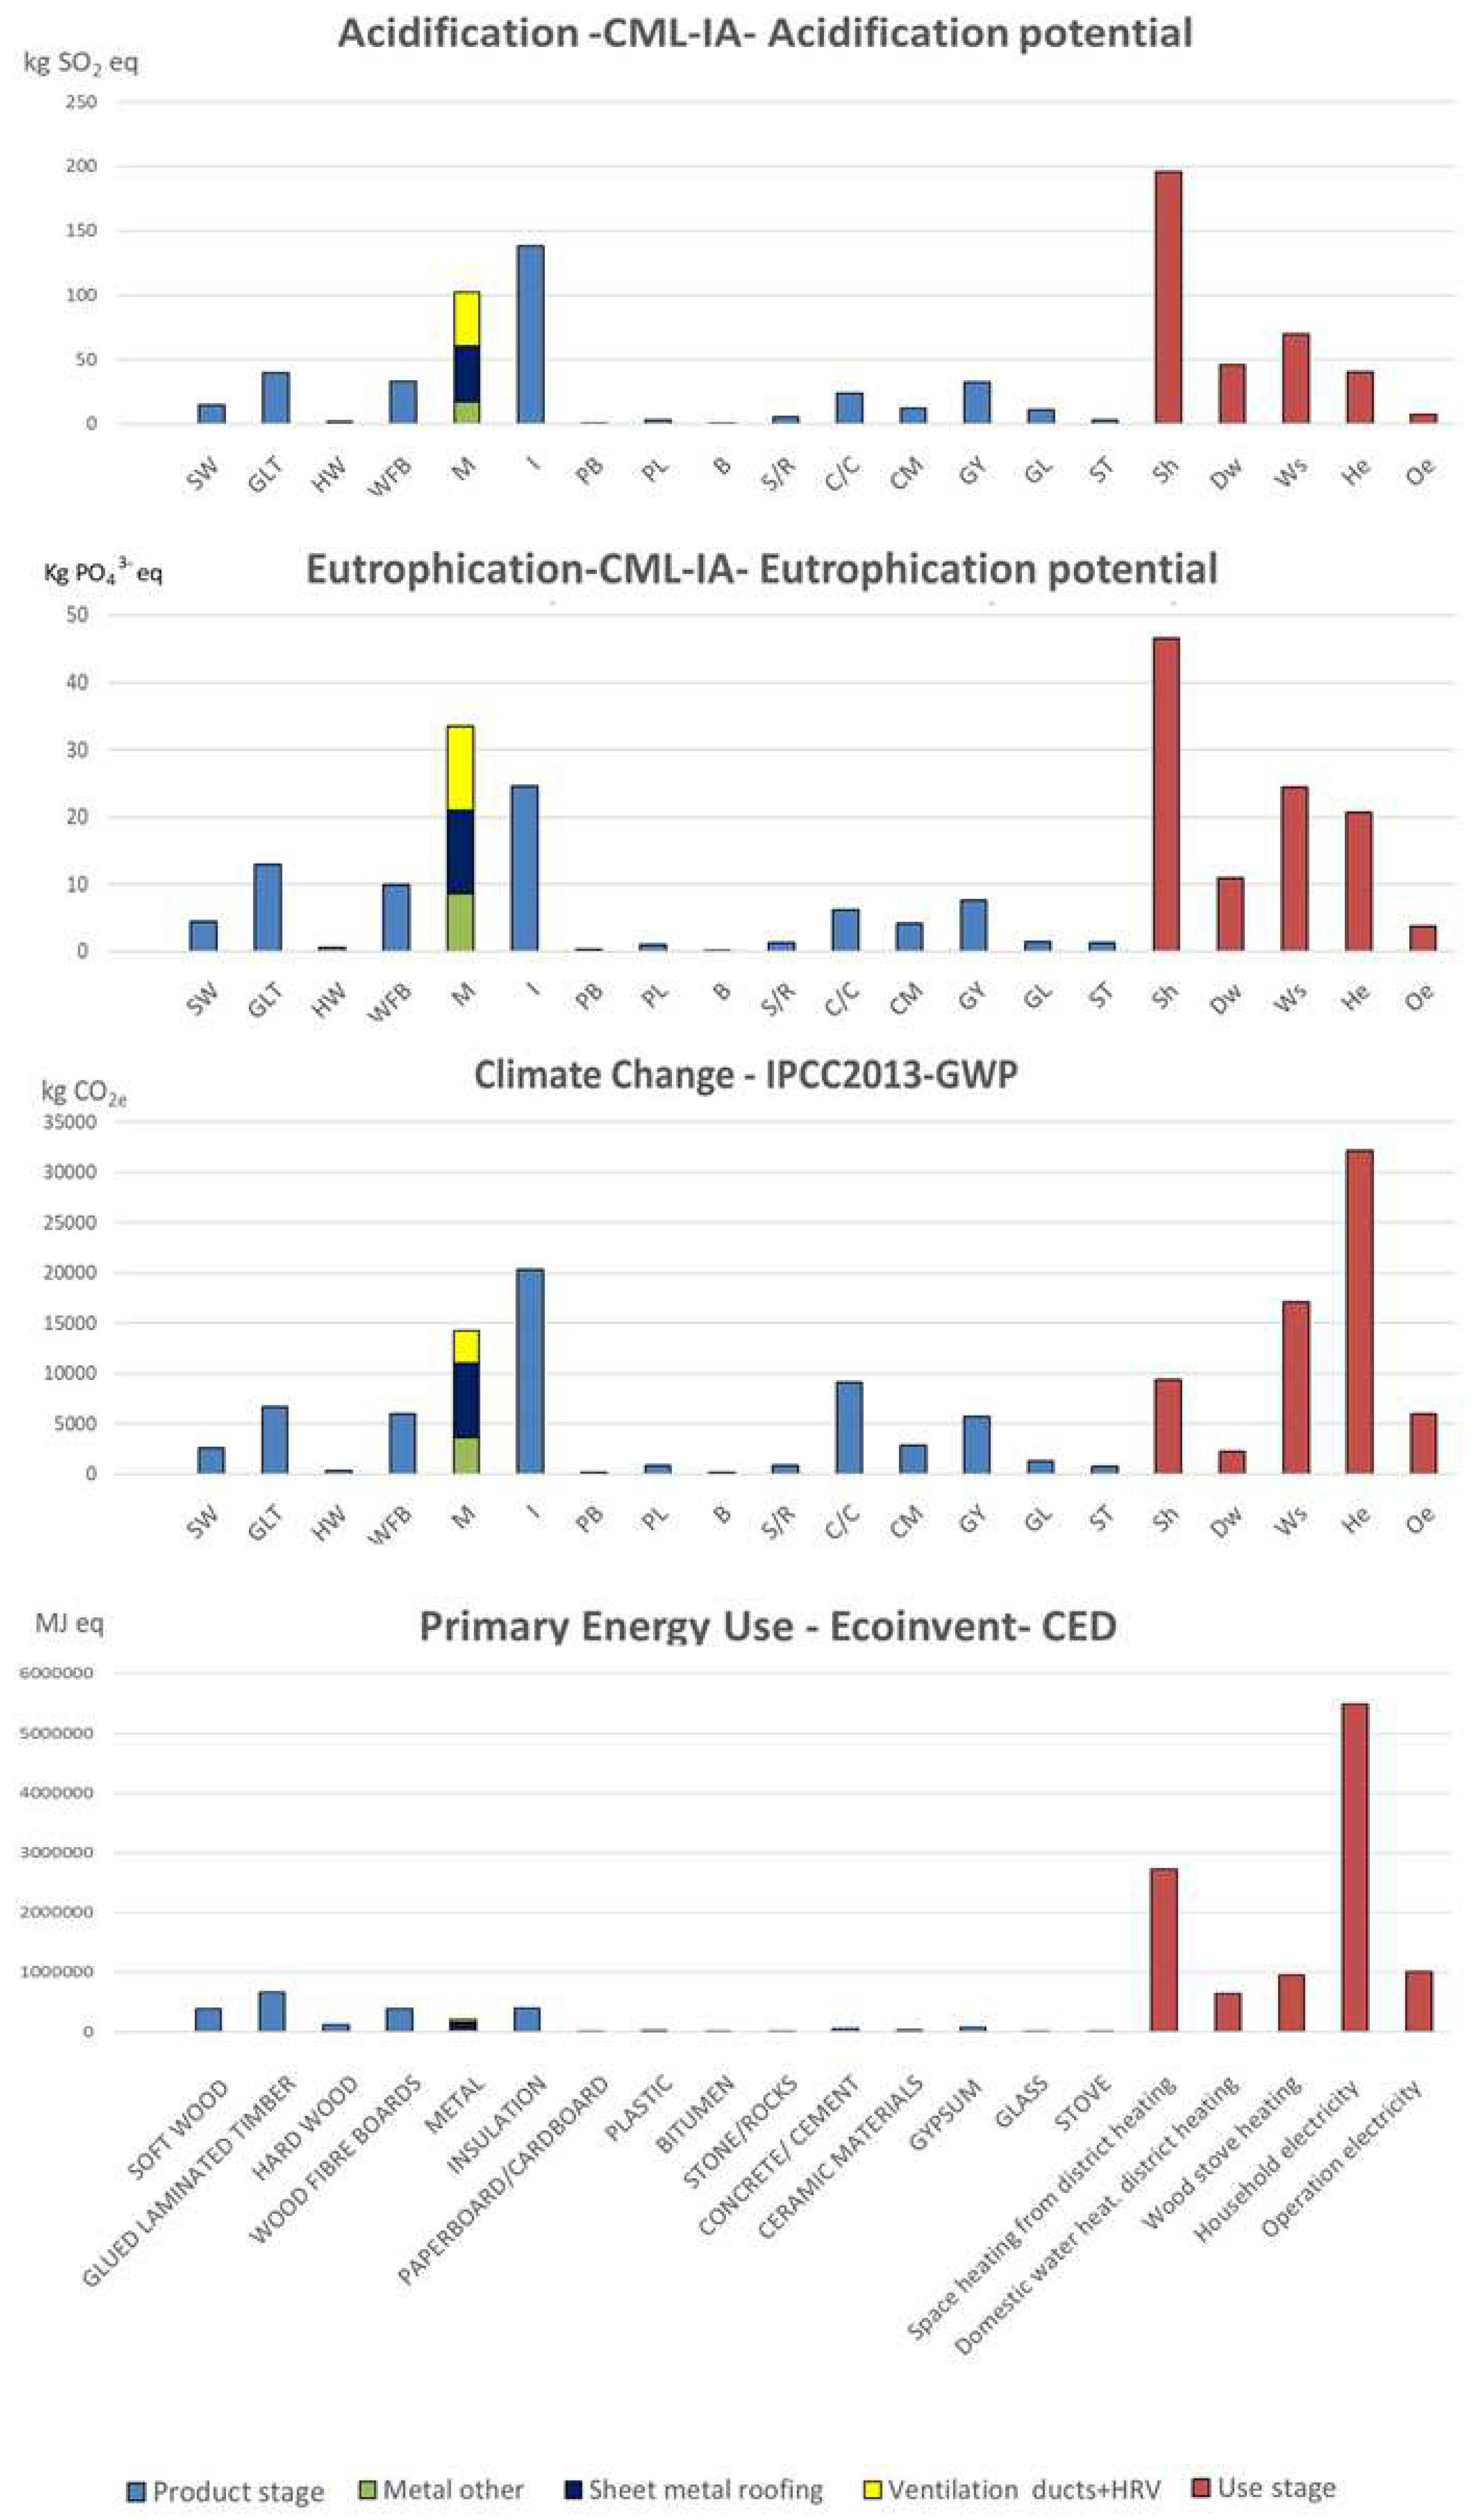
The relatively large impact of the primary energy and eco-toxicity categories in the use stage is mainly attributed to household and operational electricity (Figure 2; Figure 3; Table 5). As for human non-carcinogenic toxicity, half of the use stage impact is due to space and water heating from the CHP plant, and a third from electricity (Table 5; Figure 4f). Electricity is the biggest contributor in the climate change and primary energy categories (Figure 3), while space heating is the biggest contributor in the eutrophication and acidification categories.
Energy use from space heating and household electricity is of the same magnitude (Table 5). The major source of environmental impact in the use stage varies between environmental categories.
Regarding energy from the wood stove, it has a higher impact per energy unit than the energy from district heating in all environmental impact categories. It also has a higher impact than electricity per energy unit in the climate change, human non-carcinogenic toxicity, eutrophication, and acidification categories (Table 5). While it supplies 20% of the energy for active space heating, the wood stove accounts for 65% of the associated GWP in the climate change category (Figure 3 and Table 5). Although the impact from the district heating is low in the climate change category, it is the biggest contributor to eutrophication and acidification in the use stage (Figure 3).
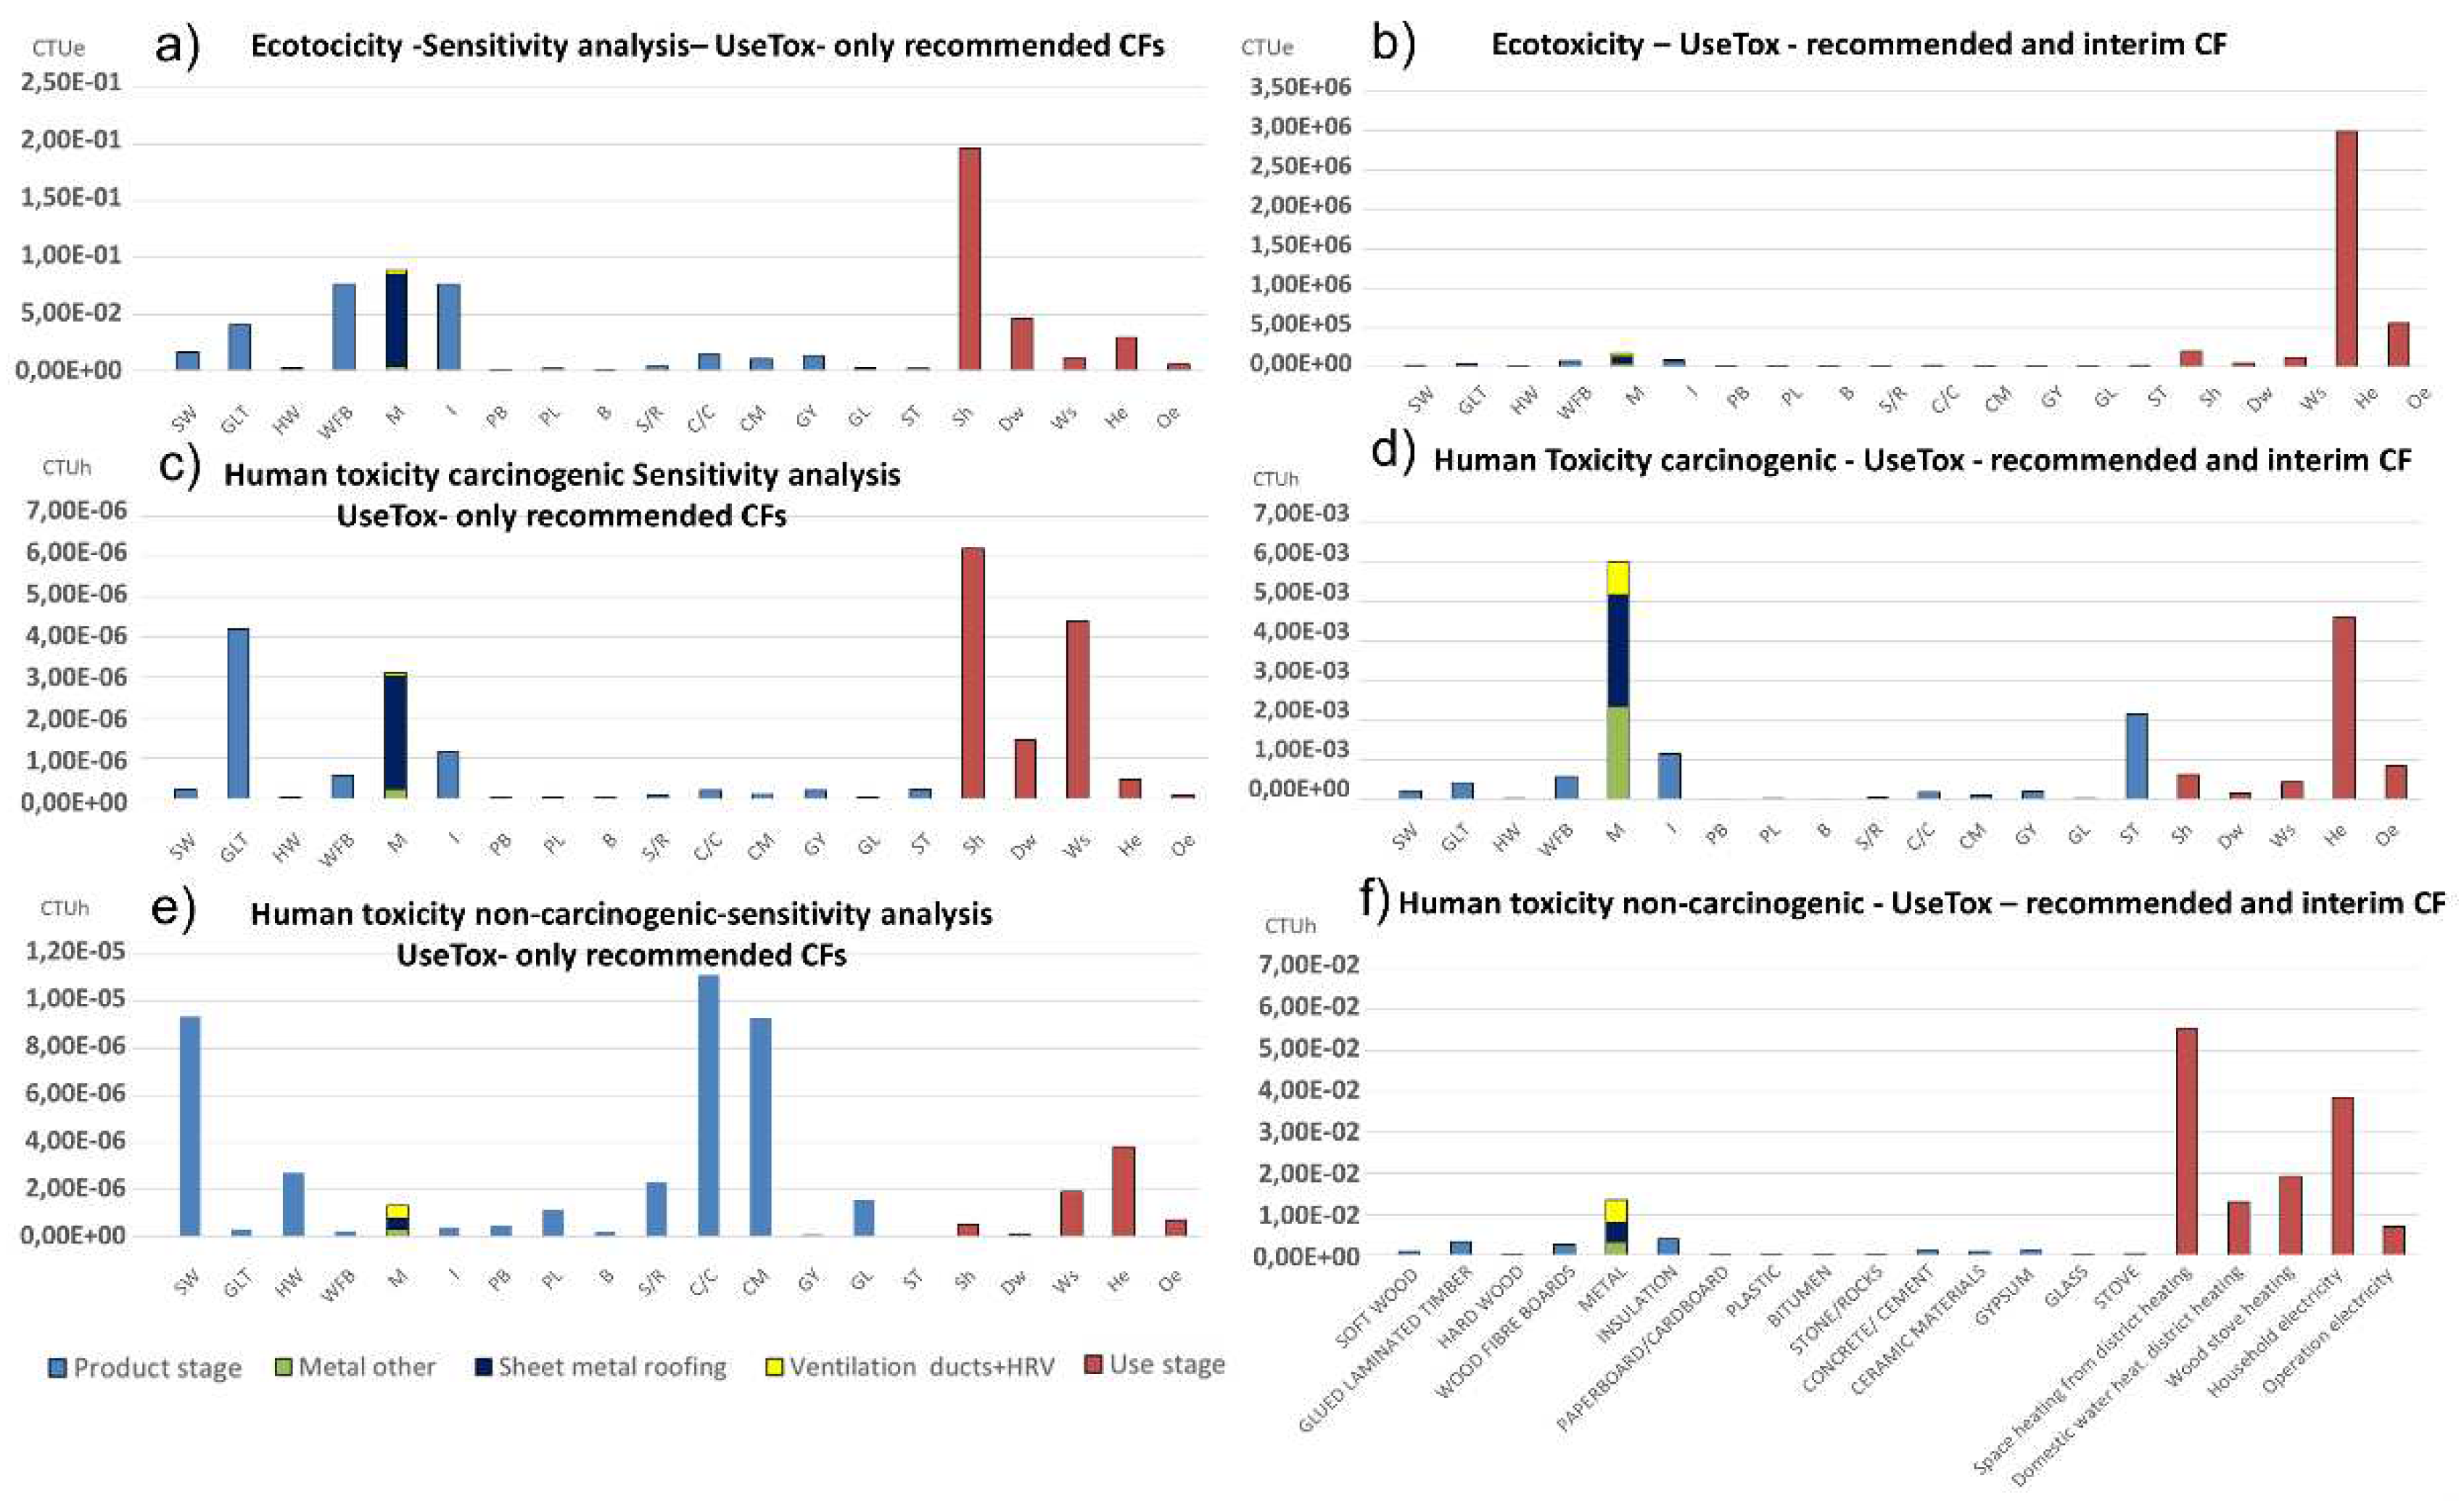
Toxicity
The toxicity results indicate that the toxicity impact is mainly associated with the use stage and that the household electricity is a large contributor in all assessed categories (Figure 4). The product stage impact is small with the exception of metals in the human toxicity carcinogenic category, where metals constitute 50% of the impact. The sensitivity analysis of the toxicity data reveal a notable difference in impact, both regarding magnitude and distribution, when interim CFs are disregarded (Figure 4). The magnitude is reduced with a factor of 102-105 for the human non-carcinogenic toxicity categories, 102-104 for the human carcinogenic toxicity, and 106-108 for the ecotoxicity category. The results from the toxicity impact calculations should, therefore, be interpreted with caution. The exception is for metals, contributing to a large proportion of the material impact in the toxicity categories, both with and without interim CFs.
Figure 4.
Categorized values for different toxicity impact categories distributed over product stage material- and use stage energy categoriesComparisons between the ZEB and the conventional building
Figure 4.
Categorized values for different toxicity impact categories distributed over product stage material- and use stage energy categoriesComparisons between the ZEB and the conventional building
The results indicate that the ZEB, in this particular setting, performs better than a conventional building in all the assessed impact categories and in all four scenarios in Table 4 (Table 6; Figure 5). The differences in the climate change category is, however, small. Toxicity was excluded from the comparison based on the outcome of the sensitivity test.
In general, across all four scenarios, the ZEB has similar GWP but substantially lower primary energy demand, eutrophication, and acidification, compared with the conventional house (Figure 5). The environmental benefits of the ZEB are generally greater in scenario 1 and 3 than in scenario 2 and 4. This is explained by greater impacts associated with metal roofing in scenario 3, which to some extent is counterbalanced by the benefits of using HRV in scenario 4.
The relative impact of the use stage compared to the product stage differs between the environmental impact categories (Figure 2). The product stage stands for about half of the total impact in the climate change category and about 20% in the primary energy category, thus in line with findings from other studies of low energy buildings in cold climate e.g. (Dodoo & Gustavsson, 2013; Liljenström, et al., 2014; Erlandsson, et al., 2018). This was, however, unexpected. Given the low GWP of the energy source used for active space heating and the subarctic climate (requiring relatively more insulation), the product stage was expected to be responsible for a greater climate change impact relative to the use phase. One reason is that household electricity was included in the assessment. Even though the ZEB is not actively heated with electricity, passive heating from household electricity accounts for 40% of the heating demand. Household electricity use is not affected by the thermal properties of the building envelope and thus sets a “lower limit” for the level of environmental impact in the use stage, when passive techniques are used. In the ZEB, more than 45% of the use stage GWP and 60% of the use stage CED would remain, even if the energy for space heating and hot water would be generated on-site, with zero GWP and zero CED. Dodoo and Gustavsson (2013) showed that household electricity accounts for the greatest share of the operational primary energy use and CO2e emissions in the use stage, and that the share was largest (about 75%) in a passive house heated with a renewable energy source. The heat from electrical appliances is indeed a significant source for space heating in low energy houses. Still, household electricity is often left out when evaluating a building´s environmental impact. According to the DEPB (European Parliament Council of the European Union, 2018), this electricity is also not mandatory to include in final energy use accounting. However, as shown here, leaving the household electricity out of an environmental impact calculation could mask the actual environmental impact of the use stage. Another reason why the use-share has a relatively high climate change impact is that the wood stove produces heat with a disproportionally large impact, especially in the climate change category. The total GWP impact from the stove is almost double the impact of space heating using district heating.
Passive techniques imply a larger amount of material in a building´s thermal envelope compared to a conventional building, which results in greater (absolute) environmental impacts from the product stage. For ZEB to be an environmentally beneficial alternative, the increased environmental impacts from the product stage need to be compensated by lower environmental impacts from the use stage. The most obvious example is the use of insulation, i.e., cellular plastic sheets (foundation) and cellulose fiber and glass wool insulation (walls and ceiling), which has substantial environmental impacts (Pelsmakers & Halliday, 2015; Hurtado, et al., 2016; Reynolds, 1993). The environmental impacts of using additional insulation thereby need to be counterbalanced by the reduced impacts of using less energy. The extent to which reductions in energy use results in GHG emissions savings depends largely on the heating system (Dodoo & Gustavsson, 2013).
As passive techniques only reduce active space heating, a ZEB and a conventional building will differ most in categories where the active space heating has a high environmental impact. Compared to electricity, active space heating has a relatively high impact in the acidification and eutrophication impact categories, and a relatively low impact in the climate change and primary energy categories (Figure 3, Table 5). Furthermore, although the energy use for active space heating in the conventional building is three times larger than in the ZEB in this study, the reduction of GWP by passive techniques can just barely compensate for the increased GWP from the product stage after 50 years of service life. However, passive techniques reduce primary energy, acidification, and eutrophication impact by about a third (Fig 5, Table 6). This shows that, although a ZEB in this setting does not necessarily perform better than a conventional building regarding climate change mitigation, it can potentially have a substantial effect on reducing other environmental impacts.
Passive houses can contribute to meeting climate change mitigation targets by increased energy efficiency (Wang et al.,2019). By reducing the overall energy demand in the system and thereby reducing the demand for fossil energy, they can also contribute to increasing national and regional energy security. However, while our results generally support the use of ZEBs from an environmental perspective, they also indicate that the climate benefits in a country with a renewable energy system are limited. Electricity grids are, however, connected and a surplus of (cheap) renewable energy in one country is generally used to replace (more expensive) fossil fuels elsewhere. This suggests that the estimated climate benefits of ZEB, in this setting, are underestimated. From a methodological perspective, an alternative could be to use the European electricity mix, or even coal as this is typically used on the margin. This would result in substantially greater GHG emissions savings (Mosterio-Romeo, et al., 2014). This highlights that ambitions to reach domestic mitigation targets require a focus on measures that provide domestic benefits, which is not necessarily the same as the actual benefits. Such a focus thus risks targeting suboptimal solutions. From this perspective, the current EU policy direction is promising, as incentives for implementation of ZEBs are unaffected by domestic climate benefits. Finally, it should be noted that this study concerns new buildings. There is also a notable potential for climate change mitigation by increased energy efficiency due to retrofitting of existing buildings (Drouilles, et al., 2019; Piccardo et al., 2020) The environmental performance of such measures should be subject to further studies, similar to this.
References
- Anand, C. K. & Amor, B., 2017. Recent developments, future challenges and new research directions in LCA of buildings: A critical review. s.l.:s.n. [CrossRef]
- Blengini, G. A. & Di Carlo, T., 2010. The changing role of life cycle phases, subsystems and materials in the LCA of low energy buildings. Energy and Buildings, 42(6), pp. 869-880. [CrossRef]
- Brunklaus, B. , Thormark, C. & Baumann, H., 2010. Illustrating limitations of energy studies of buildings with LCA and actor analysis. Building Research & Information, 38(3). [CrossRef]
- Chastas, P. , Bikas, D. & Theodosiou, T., 2016. Embodied enegy in residential buildings- towards the nearly zero energy building: A literature review. Building and Environment, Volume 105, pp. 267-282.
- Danielski, I. , 2016. Energy performance of residential buildings: projecting, monitoring and evaluating, Östersund, Sweden: Mid Sweden University.
- Danielski, I. , Svensson, M. & Fröling, M., 2013. Adaption of the passive house concept in northern Sweden-a case sudy of performance. Göteborg, s.n.
- Dodoo, A. & Gustavsson, L., 2013. Life cycle primary energy use and carbon footprint of wood-frame conventional and passive houses with biomass-based energy supply. Applied Energy, Volume 112, pp. 834-842. [CrossRef]
- Drouilles, J. , Aguacil, S., Hoxha, E., Jusselme, T., Lufkin, S. & Rey, E., 2019. Environmental impact assessment of Swiss residential archetypes: a comparison of construction and mobility scenarios. Energy Efficency, Volym 12, pp. 1661-1689. [CrossRef]
- Ecoinvent, 2020. Allocation cut-off by classification. [Online] Available at: https://www.ecoinvent.org/database/system-models-in-ecoinvent-3/cut-off-system-model/allocation-cut-off-by-classification.html/[Accessed 11 3 2020].
- Erlandsson, M. , Tove, M., Francart, N. & Johnny, K., 2018. Minskad Klimatpåverkan från nybyggda flerbostadshus (Eng: Reduced climate impact from newly built apartment buildings), Stockholm: IVL.
- European Commission, 2019. Communication from the commission. The European Green Deal. [Online] Available at: https://eur-lex.europa.eu/legal-content/EN/TXT/HTML/?uri=CELEX:52019DC0640&from=ET[Accessed 21 10 2022].
- European commission, 2021a. Regulation (EU) 2021/1119.’European Climate Law’ s.l.:European Commission.
- European Commission, 2021b. Proposal for a DIRECTIVE OF THE EUROPEAN PARLIAMENT AND OF THE COUNCIL on the energy performance of buildings (recast), Brussels: s.n.
- European Parliament, Council of the European Union, 2018. Directive 2010/31/EU (amended Directive (EU) 2018/844 and 2018/1999, Strasbourg: European Union.
- FEBY, 2012. Kravspecifikation för nollenergihus, passivhus och minienergihus (Eng: Requirements specification for zero energy houses, Passive houses and Minienergy Houses). [Online] Available at: https://www.feby.se/files/rapporter/kravspecifikation-feby12-bostader-jan.pdf[Accessed 15 03 2020].
- Hauschild, M. Z. , Goedkoop, M., Guinée, J.,Heijungs, R., Huijbregts, M., Jolliet, O., Margni, M., De Schryver, An., Humbert, S., Laurent, A., Sala, S. & Pant, R., 2013. Identifying best existing practice for characterization modeling in life cycle impact assessment. International Journal of Life Cycle Assessment, 18(6), pp. 683-697. [CrossRef]
- Hischier, R. & Weidema, B., 2010. Implementation of Life Cycle Impact Assessmnet Methodes, St. Gallen: Ecoinvent Centre.
- Hollberg, A. , Kiss, B., Röck, M., Soust-Verdaguer, B., Houlihan Wiberg, A., Lasvaux, S., Galimshina, A. & Habert, G., 2021. Review of visualising LCA results in the design process of buildings. Building and Environment.
- Hurtado, P. L. , Rouilly, A., Vandenbossche, V. & Raynaud, C., 2016. A review on the properties of cellulose fibre insulation. Building and Environment, Volume 96, pp. 170-177. [CrossRef]
- International Passive House Association, 2018. Active for more comfort:Passive House Infromation for property developers, contractors and clients Third edition. [Online] Available at: https://www.passivehouse-international.org/upload/download_complete_PH_Brochure2018_EN_online.pdf[Accessed 09 02 2020].
- IPCC 1994. Climate Change 1994. Radiative Forcing of Climate Change and An Evaluation of the IPCC IS92 Emission Scenarios, Cambridge: Press Syndicate of the University of Cambridge.
- Josephson, P.-E. & Saukkoriipi, L., 2005. Slöseri i byggprojekt- Behov av förändrat synsätt (Eng: Waste in building projects-A need for a changed approach), Göteborg: Swedish Building Industry FoU-Väst.
- Liljenström, C. , Malmqvist, T., Erlandsson,M., Fredén J., Adolfsson, I., Larsson, G., 2014. Byggproduktionens miljöpåverkan i förhållande till driften (Eng: Environmental impact of building production relative to use stage energy use), Stockholm: IVL.
- Meijan, S. , 2014. The new Frontrunners: Passreg Regions and Cities take on the Energy Revolution. s.l., s.n.
- Mosterio-Romeo, M. et al., 2014. Relative importance of electricity sources and construction practices in residential buildings: A Swiss-US comparison of energy related life-cycle impacts. Energy and Buildings, Volume 68, Part A, pp. 620-631.
- Nwodo, N. M. & Anumba, C. J., 2019. A review of life cycle assessment of buildings using a systematic approach. Building and Environment, Volume 162.
- Passive House Institute, 2015. Passive House Requirements. [Online] Available at: https://passivehouse.com/02_informations/02_passive-house-requirements/02_passive-house-requirements.htm[Accessed 06 05 2020].
- Pelsmakers, S. , Alatmirano, H. & Halliday, S., 2015. Should the Passivhaus standard include the environmental impact of materials in its standard? Proceedings of the 2015 International Passive House Conference.
- Pettersson, B.-Å. , 2018. Applied Building Physics (Swedish). Lund, Sweden: Studentlitteratur.
- Piccardo, C. , Dodoo, A. & Gustavsson, L., 2020. Retrofitting a building to passive house level: A life cycle carbon balance. Energy and Buildings, Volume 223, 110135. [CrossRef]
- Reynolds, M. E. , 1993. Earthship Volume 2, Systems and components. s.l.:Solar Survival Press.
- Rosenbaum, R. K. et al., 2008. USEtox—the UNEP-SETAC toxicity model: recommended characterisation factors for human toxicity and freshwater ecotoxicity in life cycle impact assessment. The International Journal of Life Cycle Assessment, 13(7), p. 532. [CrossRef]
- Röhrlich, M. et al., 2000. A method to calculate the cumulative energy damand (CED) of lignite extraction. The International Journal of Life Cykle Assessment, Volume 5, pp. 369-373.
- Sartori, T. , Drogemuller, R., Omrani, S. & Lamari, F., 2021. A schematic framework for Life Cycle Assessment (LCA) and Green Building Rating System (GBRS). Journal of Building Engineering, Volume 38. [CrossRef]
- Strömberg, B. & Herstad Svärd, S., 2012. The Fuel Handbook, Stockholm, Sweden: Värmeforsk Serviceaktiebolag.
- Svensson, O. & Hägered Engman, L., 2009. Förbättringsmöjligheter av lufttätheten i byggnader – erfarenheter och exempel från lufttäthetsmätningar (Eng:Possible Improvements of airtightness in buildings- experiences and examples from measuring airtightness). s.l., s.n.
- Svensson, M. , 2013. Life cycle assessment of the semidetached passive house "Röda Lyktan" in northern Sweden. Östersund, Sweden: Mid Sweden University.
- Swedish Energy Agency -, 2014. FTX-aggregat hus med 130 m² boyta (Eng: HRV-units, buildings with a floorarea of 130 sqm). [Online] Available at: https://www.energimyndigheten.se/tester/tester-a-o/ftx-aggregat/ftx-aggregat-hus-med-130-m-boyta/[Accessed 31 01 2017].
- Swedish Environmental Protection Agency, 2019. Miljöavgift på utsläpp av kväveoxider från energiproduktion år 2018- resultat och statistik (Eng: Environmental tax on nitrous oxide emissions from energyproduction 2018 -results and statistics), Stockholm: Swedish Environmental Protection Agency.
- Swedish Ministry of Finance 2021. Lag (2021:787) om klimatdeklaration för byggnader. (Swedish).
- Swedish National Board of Housing Building and Planning, 2008. BFS 2008:20, BBR16. Karlskrona: Boverket.
- Swedish National Board of Housing, Building and Planning, 2009. Så mår våra hus-Redovisning av regeringsuppdrag beträffande byggnaders tekniska utformning m.m. (Eng: The state of our buildings-Presentation of the governmental assignment regarding the technical design of buildings), Karlskrona: Boverket.
- United Nations, 2015. Paris Agreement.:United Nations.
- USEtox, n.d. Usetox Frequently asked questions. [Online] Available at: https://usetox.org/faq#t23n120 [Accessed 19 03 2019].
- Vares, S. et al., 2019. Impact of renewable energy technologies on the embodied and operational GHG emissions of a nearly zero energy building. Journal of Building Engineering, Volume 22, pp. 439-450. [CrossRef]
- Wang, Y. , Du, J., Kuckelkorn, J.M., Kirschbaum, A., Gu, X. & Li, D. (2019) Identifying the feasibility of establishing a passive house school in central Europe: An energy performance and carbon emissions monitoring study in Germany. Renewable and Sustainable Energy Reviews, Volume 113, 109256. [CrossRef]
- Wernet, G. et al., 2016. The ecoinvent database version 3 (part I): overview and Methodology. The international Journal of Life Cycle Assessment, 21(9), pp. 1218-1230. [CrossRef]
Figure 1.
The assessed ZEB (Jonasson, 2023)
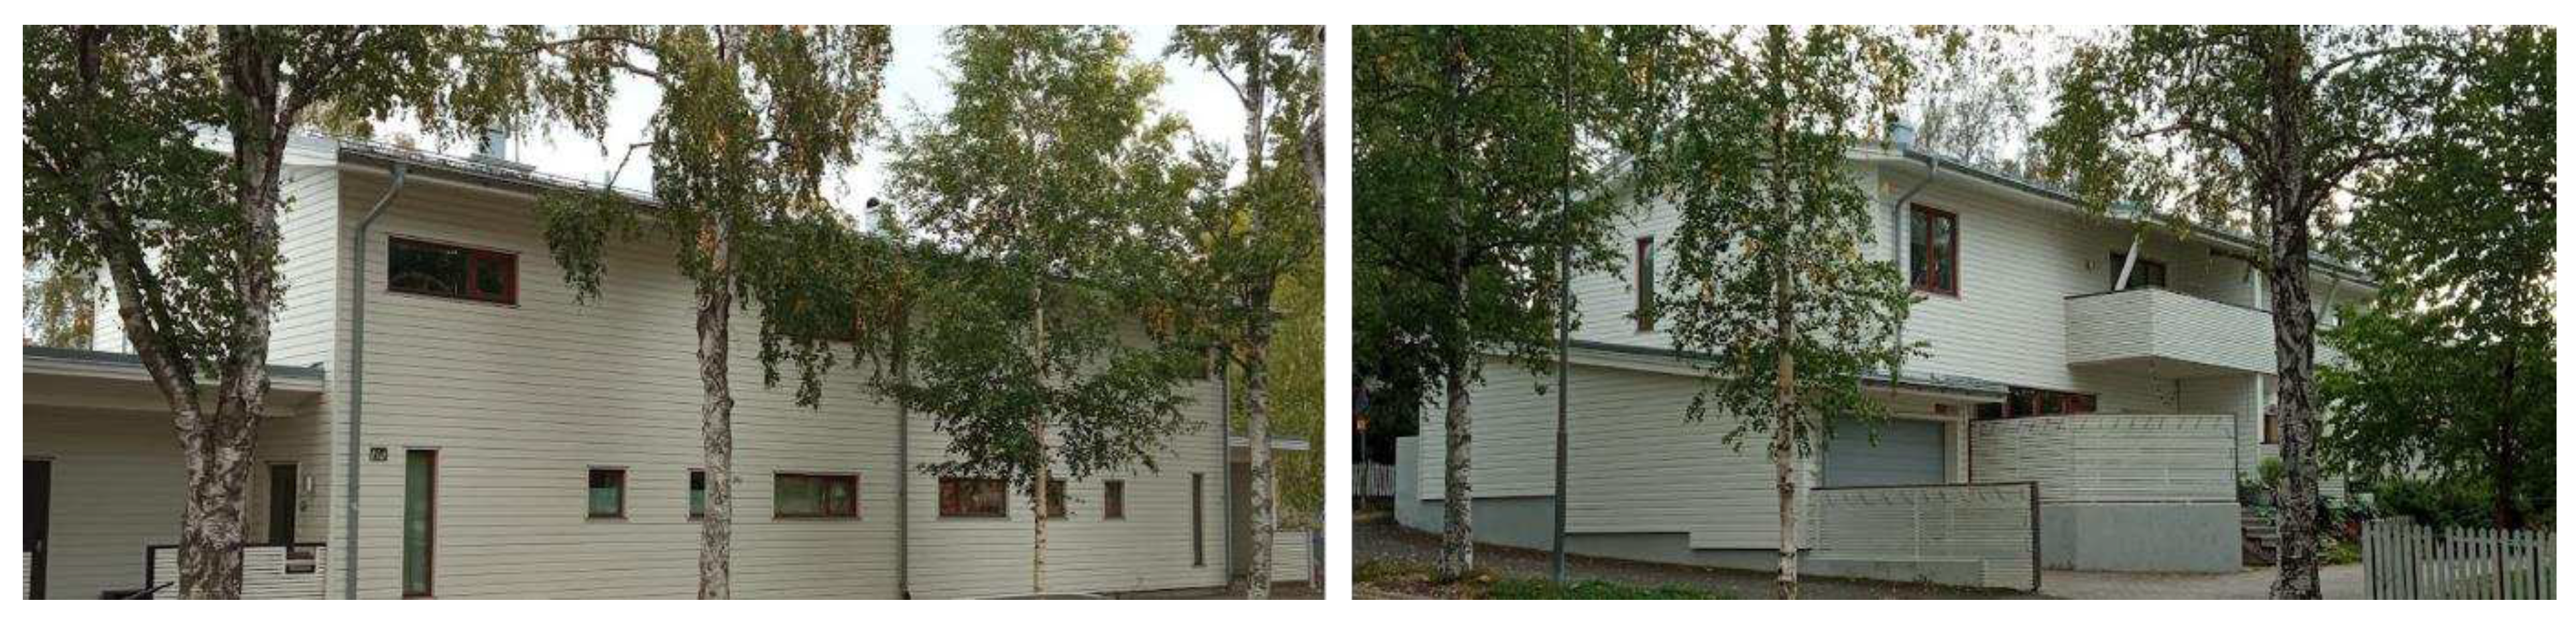
Figure 2.
Comparison of impact between the product stage (total material) and the use stage (50 years total use phase)for the ZEB
Figure 2.
Comparison of impact between the product stage (total material) and the use stage (50 years total use phase)for the ZEB
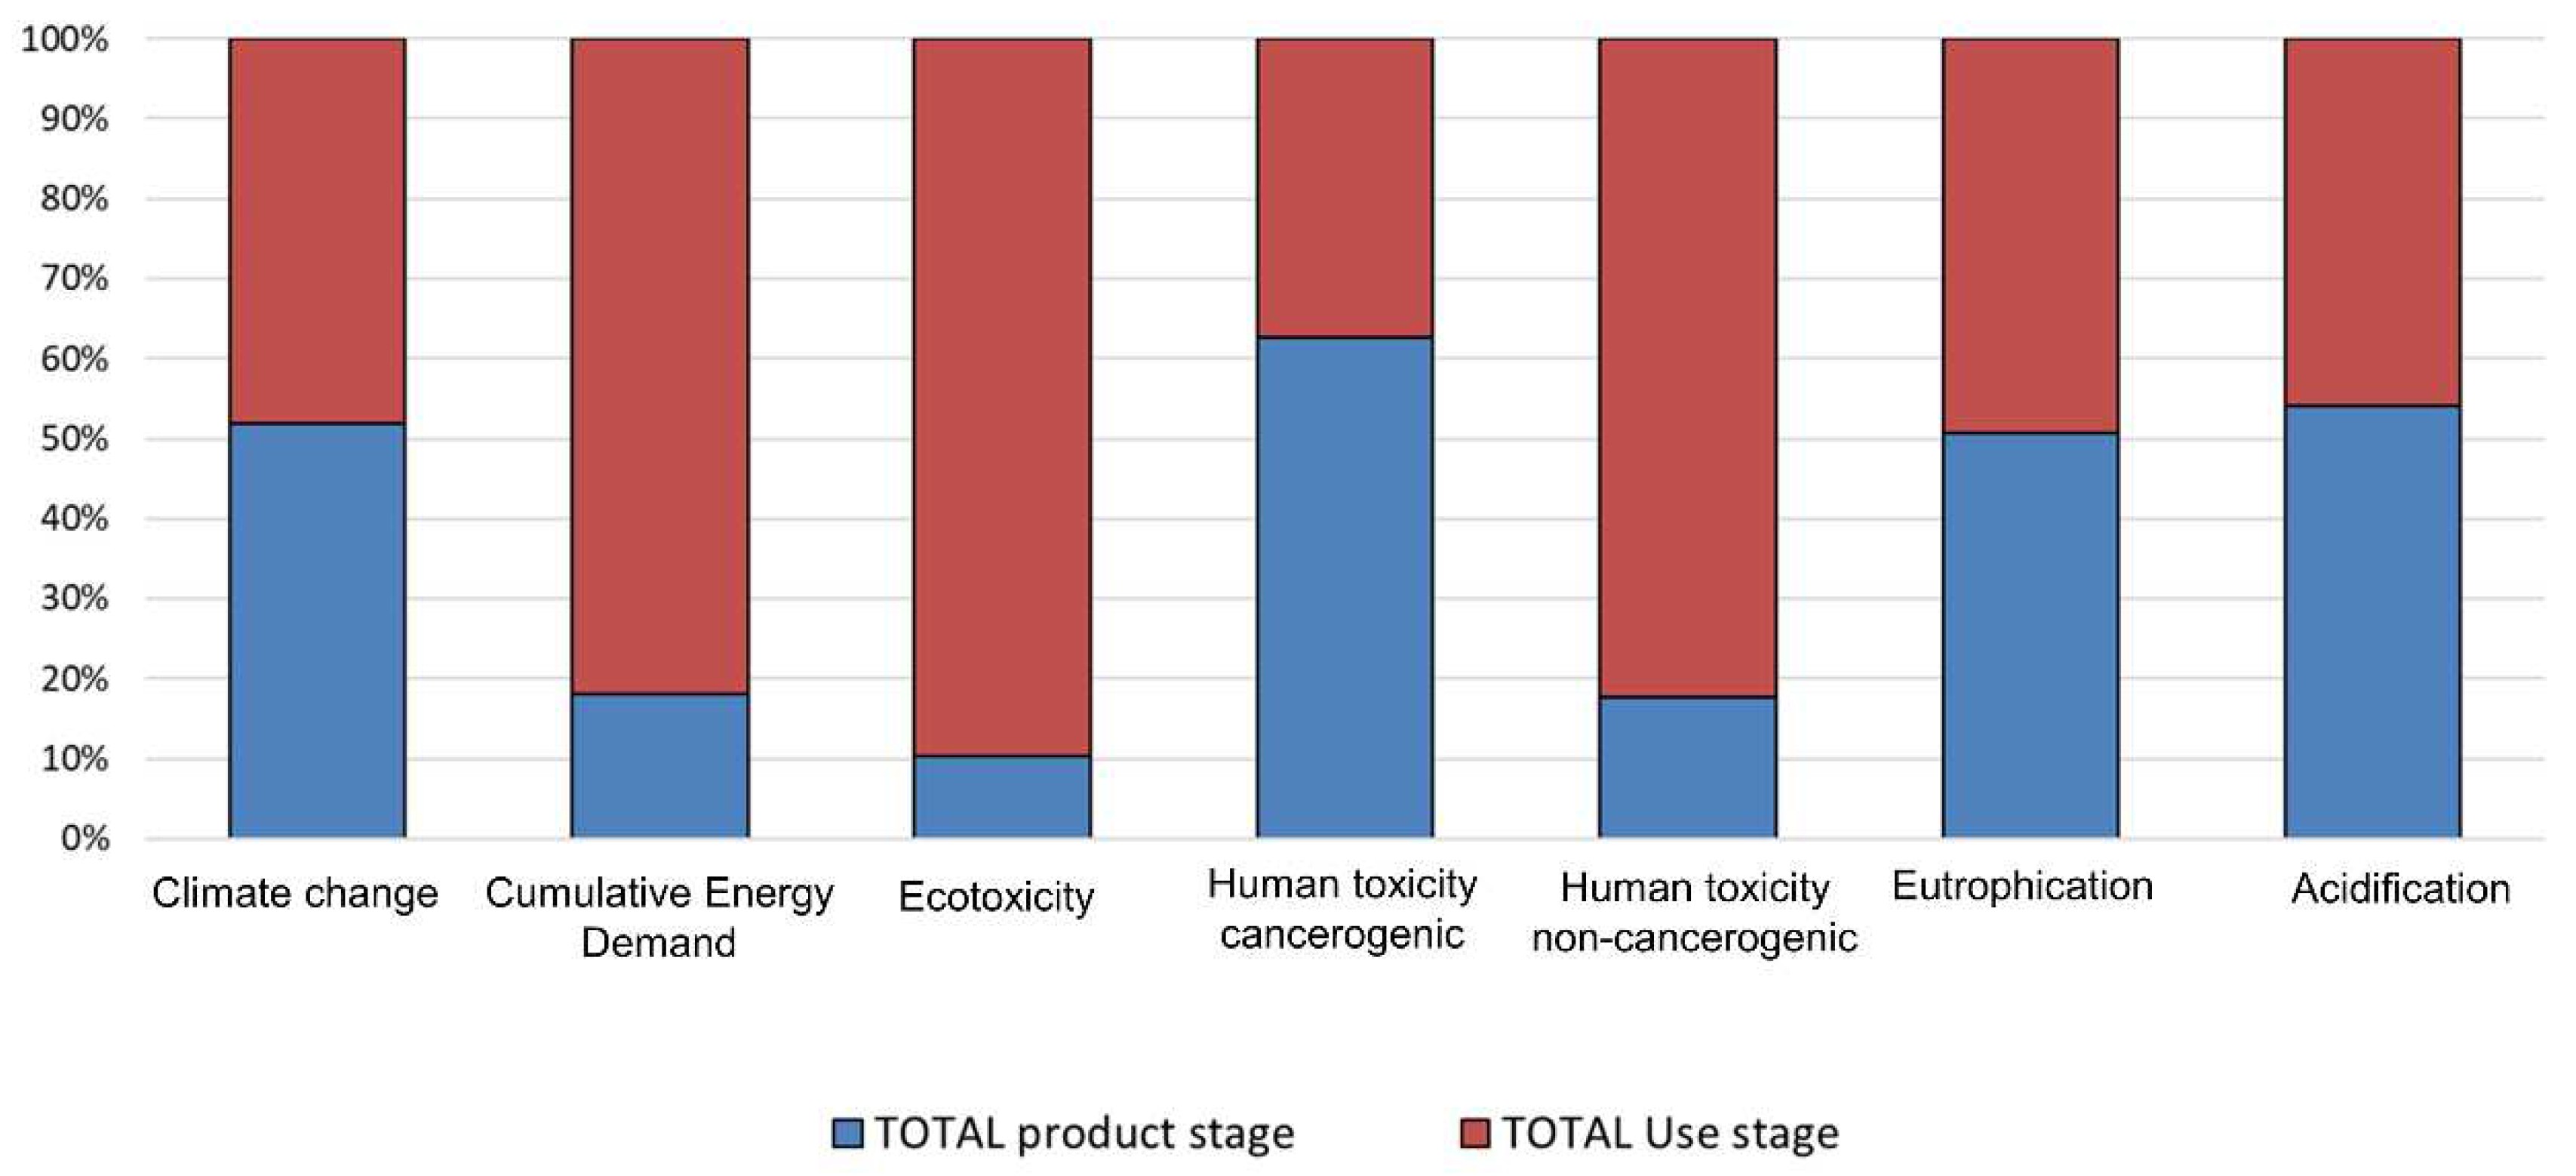
Figure 5.
LCIA results for the ZEB and the conventional building in four scenarios with different assumptions on the conventional building modelDiscussion.
Figure 5.
LCIA results for the ZEB and the conventional building in four scenarios with different assumptions on the conventional building modelDiscussion.
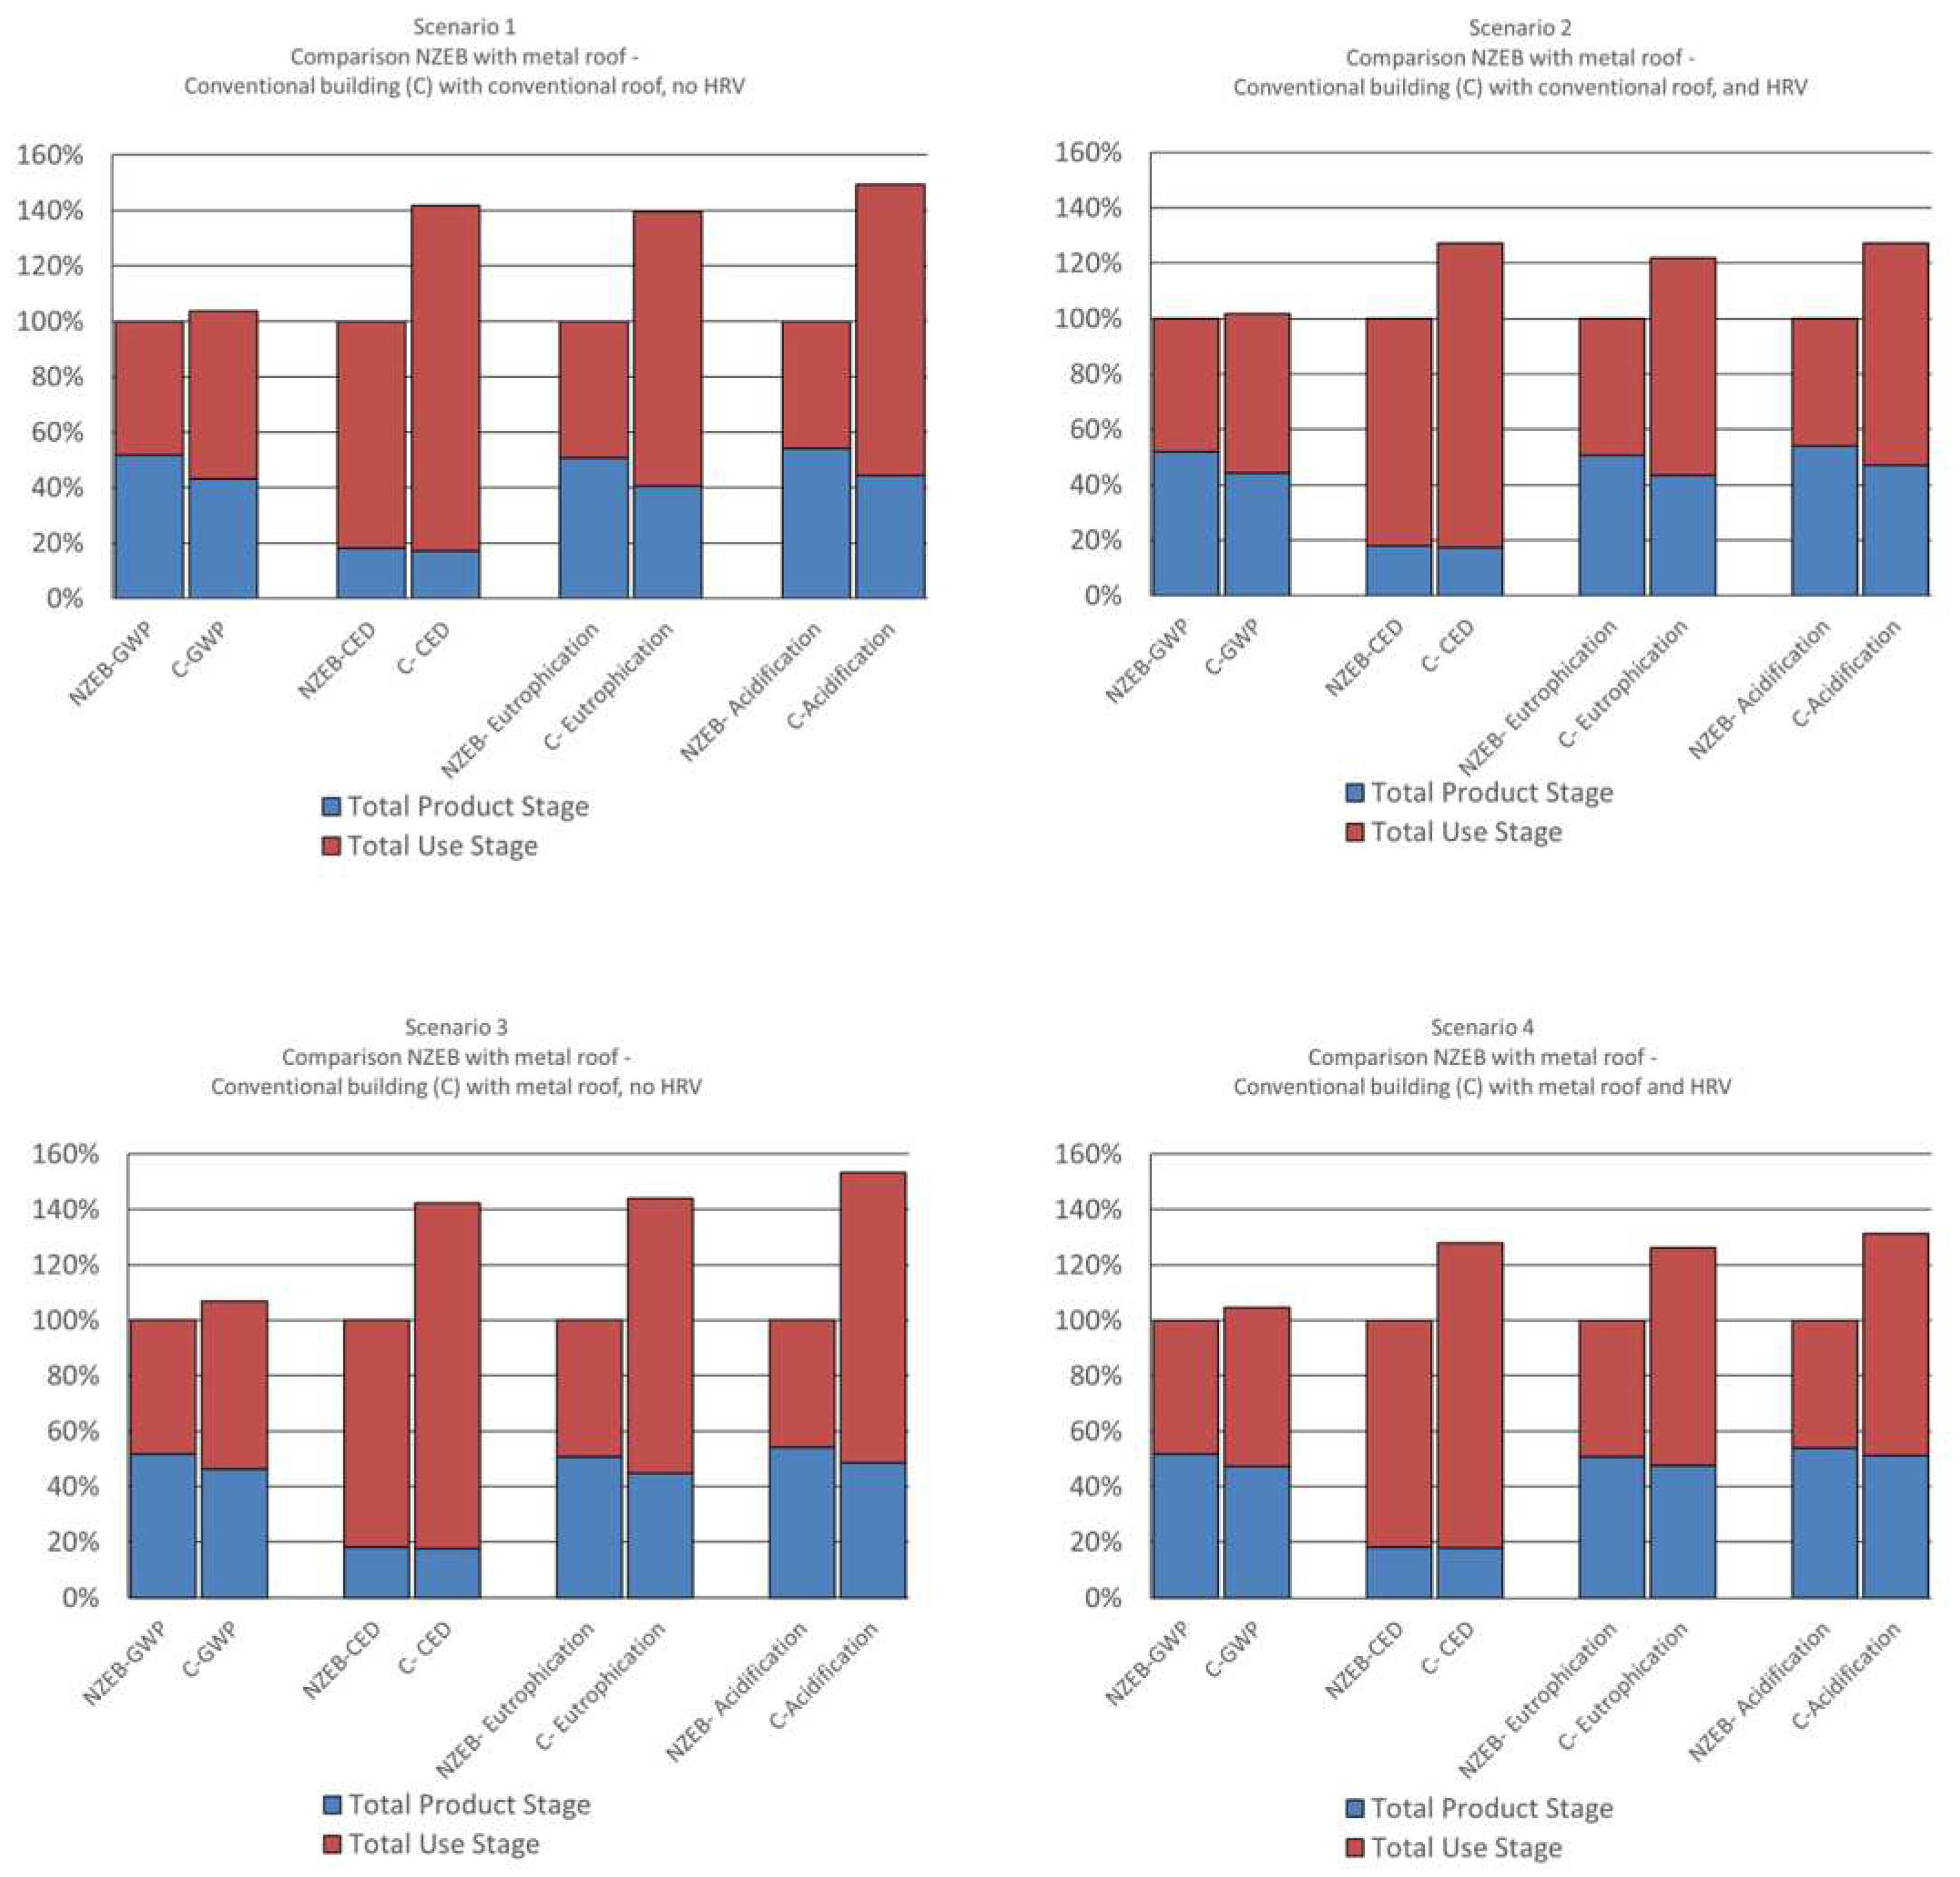
Table 3.
Four variations of the conventional building where modelled. Ic = Environmental impact of conventional building, IZEB= Environmental impact of ZEB, ΔIte , ΔImr, and ΔIHRV =Difference in environmental impact between conventional building and ZEB for thermal envelope, metal roofing and HRV respectively.
| Scenario | Roof | Ventilation | Impact conventional building (Ic) | Comment |
| 1 | Concrete tiles | Exhaust ventilation | Ic = IZEB +ΔIte + ΔIr + ΔIHRV | The most likely scenario for a conventional building built 2010 at the same location. |
| 2 | Concrete tiles | Heat recovery ventilation | Ic = IZEB +ΔIte + ΔIr | The difference in environmental impact between the two buildings is due to the thermal envelope and the metal roofing. |
| 3 | Metal sheets | Exhaust ventilation | Ic = IZEB +ΔIte + ΔIHRV | The difference between the two buildings is due to the thermal envelope and HRV. |
| 4 | Metal sheets | Heat recovery ventilation | Ic = IZEB +ΔIte | The only difference between the two buildings is the properties of the thermal envelope. |
Table 4.
LCIA results for the construction stage for the chosen environmental impact categories.
| PRODUCT STAGE | Total amount | Unit | Climate change GWP 100a (kg CO2-Eq) | Cumulative energy demand. (MJ-Eq) | Total Eco-toxicity (CTU) | Human toxicity Carcinogenic (CTU) | Human toxicity Non-carcinogenic (CTU) | Eutrophication (Kg PO4 3- eq | Acidification (kg SO2 eq) |
| SOFT WOOD | 21,91 | m3 | 2608 | 392013 | 16745 | 2,10E-04 | 9,35E-04 | 4,47 | 14,79 |
| GLUED LAMINATED TIMBER | 24,73 | m3 | 6658 | 667290 | 40553 | 4,21E-04 | 3,25E-03 | 12,93 | 39,57 |
| HARD WOOD | 5,26 | m3 | 338 | 127727 | 3014 | 3,02E-05 | 2,72E-04 | 0,63 | 1,90 |
| WOOD FIBRE BOARDS | 15,53 | m3 | 6003 | 386186 | 76842 | 5,72E-04 | 2,62E-03 | 9,86 | 33,03 |
| METAL | 3394,39 | kg | 12626 | 168193 | 150067 | 5,63E-03 | 1,16E-02 | 29,05 | 88,27 |
| INSULATION | 305,71 | m3 | 20293 | 397089 | 76687 | 1,15E-03 | 3,95E-03 | 24,63 | 138,34 |
| PAPER-/ CARD- BOARD | 0,73 | m3 | 180 | 2919 | 639 | 4,84E-06 | 4,41E-05 | 0,29 | 0,53 |
| PLASTIC | 194,67 | kg | 867 | 19548 | 2156 | 3,41E-05 | 1,12E-04 | 0,99 | 3,08 |
| BITUMEN | 80,00 | kg | 103 | 4302 | 417 | 3,95E-06 | 2,26E-05 | 0,11 | 0,55 |
| STONE/ROCKS | 65328,00 | kg | 867 | 13164 | 3784 | 5,36E-05 | 2,32E-04 | 1,28 | 5,31 |
| CONCRETE/ CEMENT | 24,87 | m3 | 9100 | 57988 | 14145 | 1,87E-04 | 1,11E-03 | 6,14 | 23,60 |
| CERAMIC MATERIALS | 1,32 | m3 | 2827 | 29549 | 10555 | 9,57E-05 | 9,29E-04 | 4,19 | 11,97 |
| GYPSUM | 18,07 | m3 | 5749 | 77632 | 14048 | 2,01E-04 | 1,17E-03 | 7,60 | 32,62 |
| GLASS | 0,48 | kg | 1308 | 16165 | 2527 | 2,61E-05 | 1,57E-04 | 1,39 | 11,23 |
| FTX-ventilation unit | 2 | unit | 1600 | 19000 | 18600 | 3,76E-04 | 1,82E-03 | 4,50 | 14 |
| Contura stove | 2 | unit | 794 | 9819 | 20894 | 2,164E-03 | 3,560E-04 | 1,31 | 3,12 |
| TOTAL product stage | 71920 | 2388582 | 451674 | 1,12E-02 | 2,86E-02 | 109,37 | 421,92 |
Table 5.
LCIA results for the use stage for the chosen environmental impact categories.
| USE STAGE | Energy use both households/ 50 years | Climate change GWP 100a (kg CO2-Eq) | Cumulative energy demand. (MJ-Eq) | USEtox Total Eco-toxicity (CTU) | Human toxicity Carcinogenic (CTU) | Human toxicity Non-carcinogenic (CTU) | Eutrophication (Kg PO4 3- eq | Acidification (kg SO2 eq) | |
| MJ | kWh | ||||||||
| Space heating (district heating) | 2077200 | 577000 | 9406 | 2736338 | 196324 | 6,20E-04 | 5,51E-02 | 46,53 | 195,88 |
| Domestic water heating (district heating,) | 486900 | 135250 | 2205 | 641403 | 46019 | 1,45E-04 | 1,29E-02 | 10,91 | 45,91 |
| Wood stove (fired with birch) | 479520 | 133200 | 17105 | 956930 | 117199 | 4,42E-04 | 1,93E-02 | 24,41 | 69,53 |
| Household electricity | 2234340 | 620650 | 32197 | 5502104 | 2988802 | 4,58E-03 | 3,84E-02 | 20,67 | 40,65 |
| Operation electricity | 412200 | 114500 | 5940 | 1015050 | 551386 | 8,45E-04 | 7,09E-03 | 3,81 | 7,50 |
| TOTAL Use stage | 5690160 | 1580600 | 66853 | 10851824 | 3899731 | 6,63,E-03 | 1,33,E-01 | 106,32 | 359,48 |
Table 6.
Environmental impact of the conventional building relative to the ZEB (%).
| Category Measure | GWP | CED | Eutrophication | Acidification |
| Thermal envelope (ΔIte) |
5 | 29 | 27 | 33 |
| Heat recovery ventilation (ΔIHRV) |
2 | 14 | 18 | 22 |
| Metal roofing (ΔIr) |
-3 | -1 | -4 | -4 |
Disclaimer/Publisher’s Note: The statements, opinions and data contained in all publications are solely those of the individual author(s) and contributor(s) and not of MDPI and/or the editor(s). MDPI and/or the editor(s) disclaim responsibility for any injury to people or property resulting from any ideas, methods, instructions or products referred to in the content. |
© 2023 by the authors. Licensee MDPI, Basel, Switzerland. This article is an open access article distributed under the terms and conditions of the Creative Commons Attribution (CC BY) license (http://creativecommons.org/licenses/by/4.0/).
Copyright: This open access article is published under a Creative Commons CC BY 4.0 license, which permit the free download, distribution, and reuse, provided that the author and preprint are cited in any reuse.


