Preprint
Article

High Proportion of Distributed PV Reliability Planning Meth-od based on Big Data

Altmetrics

Downloads

77

Views

15

Comments

0

A peer-reviewed article of this preprint also exists.

This version is not peer-reviewed

Submitted:

12 September 2023

Posted:

13 September 2023

You are already at the latest version

Alerts
Abstract
With a high proportion of distributed photovoltaic and lower fossil energy integrated into the distribution network, it is very difficult to ensure the reliability of power supply. The distributed photovoltaic planning model based on big data is proposed. According to the impact stochastic photovoltaics and loads on reliability planning, the static and dynamic capacity-load ratios are proposed. The big data analysis model of distributed photovoltaic planning is established. The big data multi-scenario generation and reduction algorithm of stochastic distributed photovoltaic and load planning is studied, and a source-load big data scenario matching model is proposed. Ac-cording to the source load big data scenario, the dynamic capacity-load ratio of the distribution network is obtained. The static capacity-load ratio calculation method in distribution network planning is studied to ensure the reliability of power supply. Finally, the IEEE 33-bus system is used as an example. The results show that distributed photovoltaic planning based on big data and multi-scenario methods can improve photovoltaic utilization and power supply reliability.
Keywords: 
Subject: Engineering  -   Electrical and Electronic Engineering

0. Introduction

With the development of carbon neutrality, various types of renewable new energy have grown rapidly, and the proportion of clean energy in the power grid has continued to increase. The renewable energy installed capacity has accounted for 47.3% of the total installed power generation capacity in China. In 2022, photovoltaic installed capacity continues to maintain rapid growth, and reaches 59.3% in new installed capacity, where distributed photovoltaics accounted for 58.5% of newly installed capacity. In 2024, distributed photovoltaics will account for nearly half of the global photovoltaic market. However, it is very difficult to consume distributed photovoltaic, for the existing power grid structure, power supply types, and market mechanisms. Distributed photovoltaic power generation is growing rapidly and costs are declining, blindness in the development of new energy will inevitably lead to waste and other problems without a scientific plan. It needs to be carried out at the source of planning to ensure the sustainability develop of distributed photovoltaic.
At present, there has been some research on the problems of photovoltaic power generation integration into the distribution network. Aiming at the problem of the gradual increase in the penetration rate of photovoltaic power generation in the distribution network, the comprehensive coordination and optimization configuration method of photovoltaic power generation and the capacitors is studied which provides active and reactive power in the distribution network. The planning principle of merit and demerit under the circumstances[1,2,3]. The opportunity constrained programming model for the limit capacity calculation of grid-connected photovoltaic power stations is studied, and solar radiation stochastic time series models and photovoltaic system models with different tracking forms are introduced by maximizing the capacity of grid-connected photovoltaic power stations as the planning goal[4,5]. The allowable access capacity range of distributed photovoltaic power that meets voltage requirements under the same distribution of load and distributed photovoltaic power capacity along the feeder is studied[6,7,8]. A large number of photovoltaic connections are also studied. Post-entry permeability issues. A method for optimizing the capacity allocation of photovoltaic power swap stations is proposed considering the cascade utilization of power batteries[9]. A comprehensive microgrid planning method that considers the efficient utilization of photovoltaics under complex envisioned scenarios is presented, which studied the dynamic planning of multiple distributed energy sources connected to the power grid based on Monte Carlo simulation methods, and the dynamic planning of multiple distributed energy sources taking into account distributed Multi-stage planning for energy access[10,11,12,13].
The above literature has some research on the determination and analysis methods of photovoltaic access capacity, but there is still little focus on the issue of reliable power supply after high proportion of distributed photovoltaic integration into distribution network. Small-scale distributed photovoltaics are connected to the distribution network and are generally consumed locally. The random fluctuations faced by the distribution network are more complex due to dually random of the distribution network terminal load and power source, and the fuzzy boundaries. According to these characteristics, the new planning method needs to consider the coordination of the source-network-load in a wide range, especially the interaction between the source and the load.
The idea of "big data + distributed photovoltaic planning" is proposed in this paper, which can overcome the double-blind situation between source and load in traditional planning based on big data interact between source and load. The planning framework for distributed photovoltaic integration into the power grid based on big data is built and its advantages are studied. An analysis model for distributed photovoltaic planning based on big data mode is established and its probabilistic nature is analyzed. The big data multi-scene algorithm of source and load is studied, and the scene matching between source and load is discussed. Finally, simulation calculations are performed to verify the feasibility and effectiveness of proposed method.

1. Big Data+Planning

1.1. Planning architecture based on big data

Conventional power grid planning is a deterministic plan, in which the capacity-load ratio is deterministic between the power supply and the load capacity. There is no information interaction between the power supply and the load. This kind of planning is relatively conservative, so the capacity-load ratio is very big in distribution network with the high proportion of distributed photovoltaic. Big data technology has been widely used in power systems. In the planning stage, big data of distributed photovoltaics and loads can be obtained, which can achieve accurate matching relation and interactive sensing between power source and load.
"Big data + distribution network planning" is not simply adding various types of energy and loads to the power grid, but deeply integrating the Internet into power grid planning based on big data technology and Internet platforms. Big data can optimize the configuration of distributed photovoltaics in the distribution network. Deeply integrating big data methods into distribution network planning may form a broad new planning platform.
Based on big data means, a large amount of source and load data can be obtained, which get the accurate spatiotemporal distribution and mutual relationships of source and load by interactively sensing. On the planning platform, the prior experience of power generation and user electricity consumption may be realized. According to the spatial and temporal distribution of photovoltaics and loads, the corresponding relationship between sources and loads, and the appropriate capacity-load ratio can be obtained, which can ensure the reliability of power supply. With the high proportion of distributed photovoltaic integrating into power grid, some new loads such as electric vehicles are also growing rapidly, which brings the randomness of source and loads in the distribution network. How to deal with this randomness, traditional deterministic planning methods may lead to waste of new energy or imbalance of power grid. Based on the big data interaction of source and load on the Internet planning platform, the source determines the load, and the load determines the source. The interaction between source and load can realize an intuitive and specific planning model.

1.2. Source-network-load big data correlation

In view of the randomness of source and load, the online dynamic interactive experience of source and load data is realized and mutual perception is achieved. Based on reciprocal interaction between source and load, the spatiotemporal distribution of load can be viewed from the perspective of the power supply, or the spatiotemporal distribution of the power supply can also be viewed from the load perspective. The dynamic capacity-load ratio can be determine during operation. In order to improve photovoltaic utilization, controllable loads such as electric vehicles have good flexibility in time and space. The spatiotemporal translation of the load can be obtained through big data analysis, which can better realize the dynamic connection of source and load in the planning stage.
Based on the big data planning platform, prior experience of source-load interaction can be achieved. This planning model is derived from actual source-load big data, which may guide power grid planning and obtain more practice results. It can overcome the limitations of previous statistical experience-based and theoretical planning, such as passivity, blindness and disorder, and can achieve sustainable dynamic planning. Big data planning can achieve the following advantages.
1)Accuracy, various massive data from the Internet across regions, borders, and industries are made full use, the characteristics of photovoltaics and user are explored, and these promote source-load complementarity.
2)Interactivity, the big data model realizes deep interaction between sources and loads during planning, and source-load simulation operation, which can avoid the blindness of energy planning due to information asymmetry.
3)Orderliness, the power generation and consumption behavior is intuitively evaluated by the source and load interaction. In a certain area, the source is determined by the load, and the load is determined by the source. These achieve orderliness in distributed photovoltaic planning.
4)Economical, through source-load interaction, the operation distribution information of source-load can be obtained in time, and the precise correspondence relation between source-load capacity can be determined with less waste and more high power supply reliability.

2. Analytical models for big data planning

The Materials and Methods should be described with sufficient details to allow others to replicate and build on the published results. Please note that the publication of your manuscript implicates that you must make all materials, data, computer code, and protocols associated with the publication available to readers. Please disclose at the submission stage any restrictions on the availability of materials or information. New methods and protocols should be described in detail while well-established methods can be briefly described and appropriately cited.
Based on the existing distribution network, random big data of multi-point distributed photovoltaic access is obtained, and big data of flexible controllable loads are mined, which form a "big data + photovoltaic + controllable load + distribution network" planning model. The goal of distributed photovoltaic planning is to maximize utilization while ensuring reliable power supply. The objective function is as follows:
max i = 1 n P S O , i ( i = 1 , 2 , n )
where PSO,i is the capacity value of each photovoltaic access point, and n is the number of access points.
In the distribution network the power flow constraints need to be met:
F ( X , Y ) = 0
where X is the variable in the existing distribution network, Y=(P,V) is the photovoltaic and controllable load power and voltage variables connected to the distribution network, photovoltaic power and load power P = ( P S O , 1 , P S O , 2 , P S O , n , P L , 1 , P L , 2 , , P L , m )
where P S O 0 is the total available photovoltaic capacity of the n initial access points, and P L 0 is the total capacity of m controllable loads.
P S O 0 = i = 1 n P S O , i 0 P L 0 = j = 1 m P L , j 0
In addition, due to their natural characteristics, photovoltaic output and load also need to meet the upper and lower bound inequality constraints:
{ P S O , i min P S O , i P S O , i max P L , i min P L , i P L , i max
The planning goal is to maximize the use of photovoltaics in the long term. Since photovoltaic output is uncontrollable, some loads are controllable. The load can be controlled according to the photovoltaic change curve to be consistent with the photovoltaic changes, that is, maximizing the use of photovoltaics. In the short term, large differences between PV and load may occur, which can be balanced by energy storage or other power sources.
The ratio of photovoltaic dynamic power generation capacity to controllable load dynamic capacity is called dynamic capacity-load ratio KD
K D = i = 1 n P S O , i ( t ) j = 1 m P L , j ( t )
According to the random changes of photovoltaic and load, the dynamic capacity-to-load ratio is optimized. The photovoltaic planning capacity is determined according to the practical situation of the distribution network and planning supporting measures. The static capacity-to-load ratio during planning can be obtained KS
K S = i = 1 n P S O , i j = 1 m P L , j
(1)Probabilistic analysis of photovoltaic output
The light intensity changes randomly, and its output power also fluctuates randomly. According to statistics, the light intensity within a certain period of time shows a Beta distribution[17], and its probability density is as follows:
f ( E ) = Γ ( α + β ) Γ ( α ) Γ ( β ) ( E E max ) α 1 ( 1 E E max ) β 1
where Γ is the Gamma function, E and Emax are the actual light intensity and maximum value during this period, α and β are the shape parameters of the Beta distribution.
The corresponding probability density function of photovoltaic output power is as follows:
f ( P S O ) = Γ ( α + β ) Γ ( α ) Γ ( β ) ( P S O P S O , max ) α 1 ( 1 P S O P S O , max ) β 1
(2)Probabilistic analysis of controllable loads
In order to make full use of randomly fluctuating photovoltaic power generation, controllable flexible loads are required. Distributed photovoltaics mainly come from homes or buildings. Controllable loads PCL include electric vehicles PEV, home loads Phome, and other loads PL0.
P C L = P E V + P hom e + P L 0
Electric vehicles are mobile energy storage devices that can be used as loads for charging or power sources for discharging. The proportions of these three types of loads are as follows:
k e v = P E V P C L
k h = P hom e P C L
k 0 = P L 0 P C L
Conventional load fluctuations have certain regularity and can be simulated by existing probability distributions. The random changing characteristics of controllable loads, especially the random spatio-temporal changes of electric vehicles, are difficult to simulate with an analytical probability distribution, where article the empirical probability distribution of big data is used to simulate.

3. Multi-scenario algorithm based on big data

This section may be divided by subheadings. It should provide a concise and precise description of the experimental results, their interpretation, as well as the experimental conclusions that can be drawn.
Probabilistic models of distributed photovoltaic and load stochastic fluctuations are generally difficult to use directly. Multiple scenarios can be generated based on the probability model, and each scenario is a possible planning solution. A large number of scenarios are generated through the probabilistic model. However, the huge number of scenarios results in a huge amount of optimization calculations, which need to be reduced to a few most likely scenarios, that is, "scenario reduction"[18,19]
The "forecast bin" to count the prediction error distribution of point predictions is applied[20]. By sorting the predicted values from large to small, and dividing the predicted values into some "numeric intervals", the corresponding data group [predicted value, measured value] are put into the corresponding numerical interval according to the size of the predicted value. The length of the numerical interval is 0.02 p.u., in 50 obtained numerical intervals in total, and all data groups within each numerical interval are "prediction boxes". The photovoltaic power output generates scenarios according to the probability distribution of equation (7), and the load probability generates scenarios according to the empirical distribution probability.

3.1. Scenario generation

The 50 dynamic scenarios of photovoltaics and loads were generated according to the following steps:
(1)By using historical data and calling the ecdf function in MATLAB statistical toolbox, the empirical probability distribution of the 50 prediction boxes are estimated.
(2)Based on the source and load power point prediction data, the range parameter ε is estimated, which is used to control the correlation strength of random variables with different ahead times[15,16]. The search range of parameter ε is [0, 400], and the scene scale of parameter estimation is 200.
(3)By Calculating the 48th-order covariance matrix of the multivariate standard normal random variable Z, and calling the mvnmd function of the MATLAB statistical toolbox, 50 random vector samples obeying Z~N(μ0,Σ) are generated.
(4) For each lead time t (t =1, 2, … 48), determine which prediction box the power point prediction pt of the lead time belongs to. In this way, 50 multivariate normal random vectors are transformed into 50 dynamic scenes.

3.2. Scenario reduction

Kantorovich distance[21] can be used to measure the approximation degree between the initial scene set S0 and the reduced scene set Sr. For dynamic scenario problems of photovoltaics or loads, the Kantorovich distance form is as follows:
c ( S 0 , S r ) = ω S 0 { p ( ω ) ω r S r [ p ( ω r ) ω ω r 2 ] }
where ω represents a certain dynamic scene, p(ω) is the probability of ω occurring, ║.║2 represents the Euclidean norm distance.
After generating multiple source-load dynamic scenarios, NS source and NL load scenarios with the highest probability are obtained through reduction, Sort by scene ω 2 value size.

3.3. Scene matching of source-load

After scene generation and reduction, the source and load scenes can be obtained respectively. The matching between the source and load scenes is further analyzed, which can obtain NS×NL combination. The largest and smallest source and load scenes are taken respectively to form four combinations: large source and large load, large source and small load, small source and large load, and small source and small load. These form boundary scenes, which can include all NS×NL scenarios. If the planning can meet these four boundary scenarios, all situations can be satisfied. But it can result in conservative conclusion, which ensures power supply reliability.
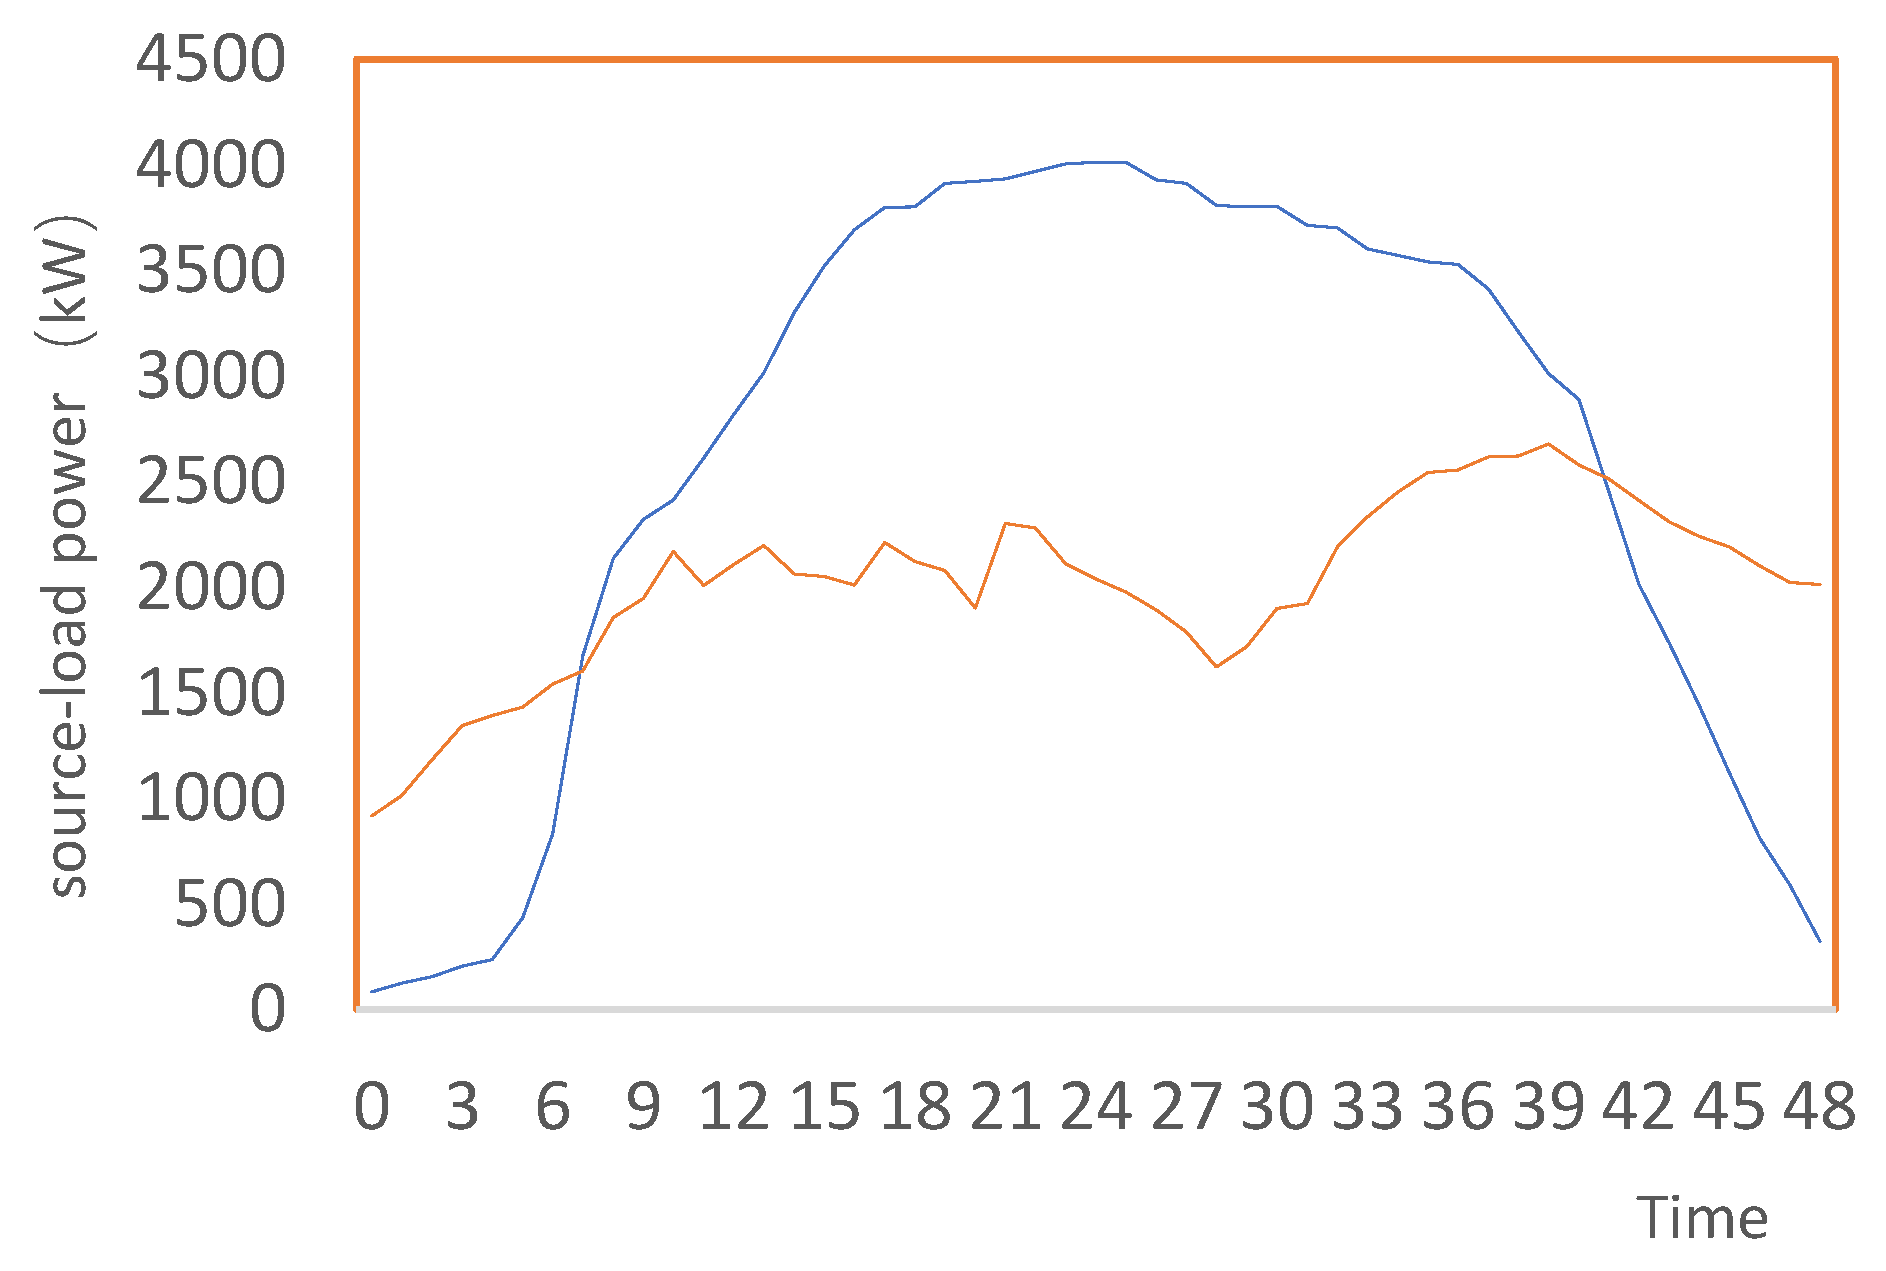
Figure 1 shows the source-load scene, with 48 points in 12 hours of daylight, one point every 15 minutes. When the source-load dynamic scene interacts, the source-charge KD at this time is calculated for the points on the source and load scene curves at the same time. The output of photovoltaic power generation is related to natural conditions, and its output power can reduce. However, the load can be controlled and be shifted.
The KD at different time points in the source-load scenario has the following situations:
(1) KD >1, at this time, the photovoltaic power capacity is greater than the load capacity. If there is excess photovoltaic power, the photovoltaic power may be abandoned. The power supply planning can be appropriately reduced, or the load can be controlled to shift the subsequent electricity load to the present.
(2)KD<1, at this time, the photovoltaic capacity is less than the load capacity, and the photovoltaic capacity planning can be increased, or the current electricity load can be shifted, or other power sources and energy storage can support it.
(3)KD=1, the photovoltaic supply capacity is equal to the load capacity, which is the most ideal situation, but it rarely occurs in practice.

4. Planning capacity and capacity-to-load ratio calculation

The planning platform based on big data guides each source and load to actively participate. Through scenario matching analysis, the source and load can interact each other. By optimizing their KD in a variety of scenarios, and the final planned KS is determined. Through dynamic source-load interaction scene analysis, the power supply can guide the planning of the load, and the load can also determine the power supply planning.
On the problem of solar abandonment, it is assumed that in general, the photovoltaic capacity is greater than the load capacity. The capacity-load ratio corresponding to the ordinates minimum difference between the power supply and load scenario is KD,min. If the source curve can be fully covered by shifting the source curve up and down, then this most conservative planning capacity is obtained.
P S O , max = P S O 0 K D , min
The static capacity ratio is as follows:
K S = P S O , max P L 0
The average planning capacity is as follows:
P ¯ S O = P S O 0 K ¯ D
K ¯ D is the average of KD.
The static capacity ratio is as follows:
K S = P ¯ S O P L 0
The weighted average planning capacity is as follows:
P ¯ ¯ S O = t = 0 47 i = 1 n P S O , i 0 ( t ) K D ( t ) / 48
At this time the static capacity ratio is as follows:
K S = P ¯ ¯ S O P L 0
Random dynamic matching analysis of source-load scenarios can determine the planning size of photovoltaic capacity based on the above three methods. In addition, four boundary scenarios can be considered to further quantify photovoltaic planning capacity and supporting measures. While determining other supporting measures in the plan, firstly support by load shifting is considered, secondly energy storage or other power supply support, and finally abandon light.

5. Case analysis

This section is not mandatory but can be added to the manuscript if the discussion is unusually long or complex.

6. Patents

5.1. Case

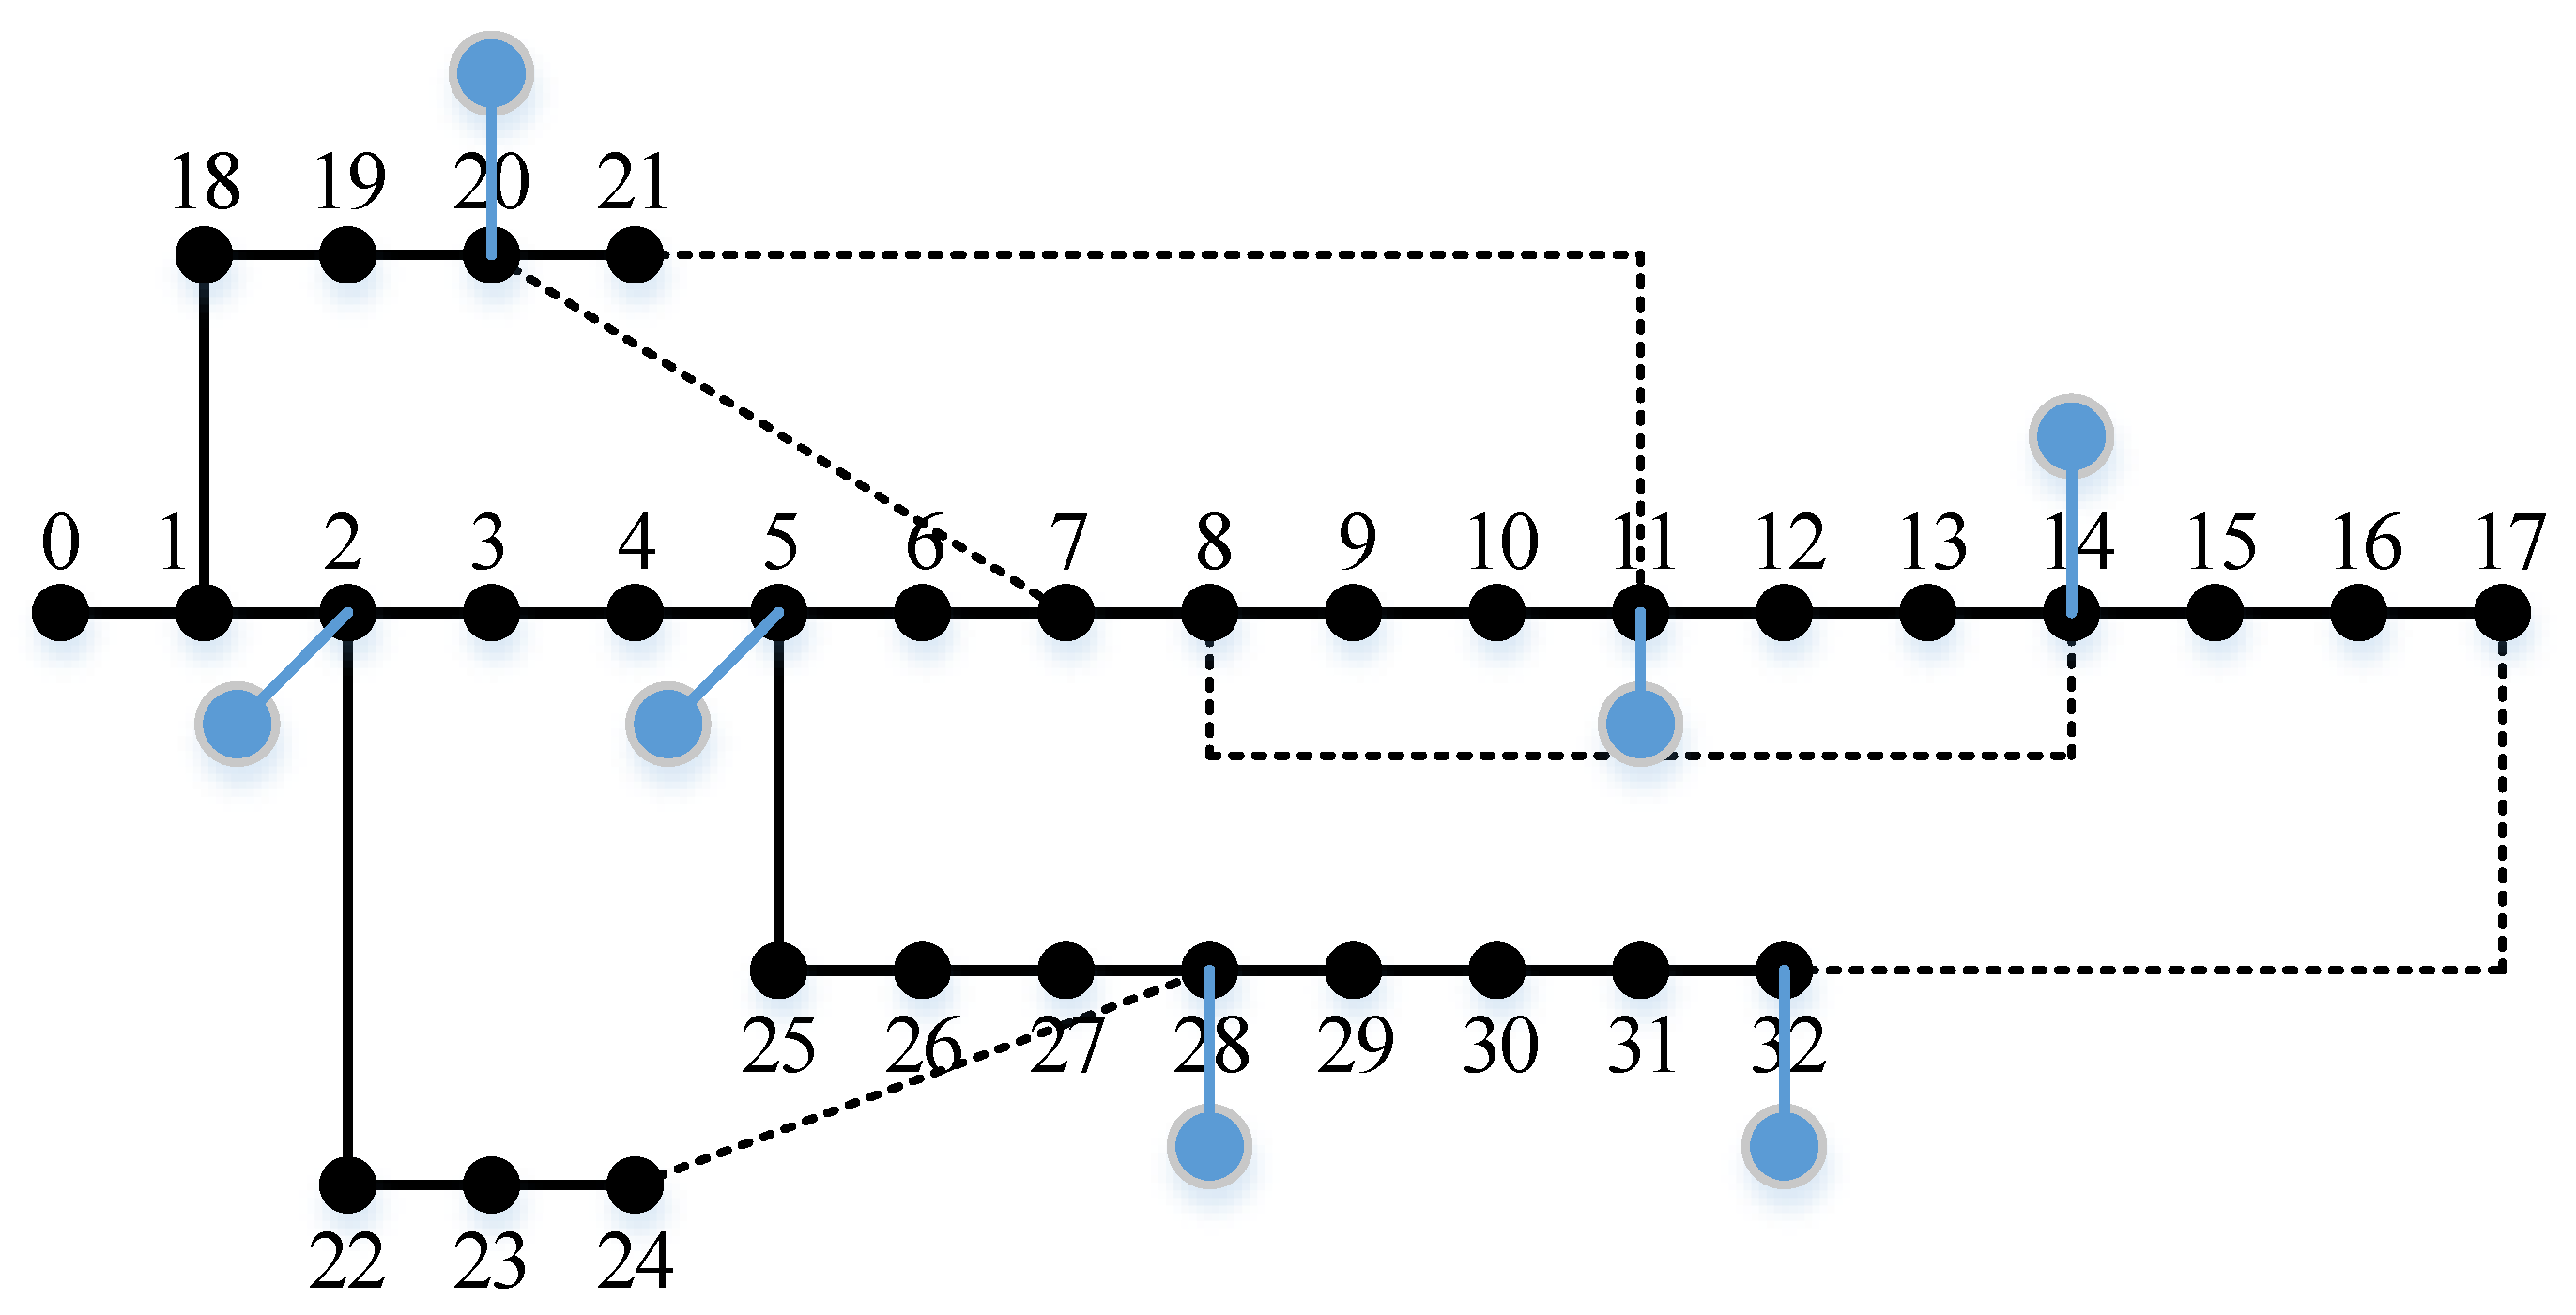
As shown in Figure 2, the IEEE 33-node distribution network system[22] is taken as an example, which includes 33 nodes, 32 branches and 5 tie-lines. It is assumed that the switches of 5 tie-lines are normally open to facilitate photovoltaic power transmission. The node 0 is the power supply node, which ensures the power supply of the base load. The rated voltage level is 12.66kV. The base annual load of each node is expanded to 15252.78+j7641.96kVA. Distributed photovoltaic power generation is connected to nodes 2, 5, 11, 14, 20, 28, and 32. The available planning capacity of photovoltaics is shown in Table 1.
Based on source-load big data interaction analysis, the survey statistics of photovoltaic and controllable loads in a certain area is applied. The scenarios can be generated based on these data. Since photovoltaics can only generate electricity during the day, the scenario period is 48 points in 12 hours, with one point every 15 minutes.

5.2. Simulation results

The new controllable load is join to each load node, and the proportion is 20% of the base load capacity. The loads nodes 1, 3, 6, 7, 13, 23, 24, 28, 29, 30, and 31 include charging piles. where kev=0.7, kh=0.2,k0=0.1, kev=0, kh=0.6,k0=0.4 in other nodes.
(1) Source load scene generation and reduction
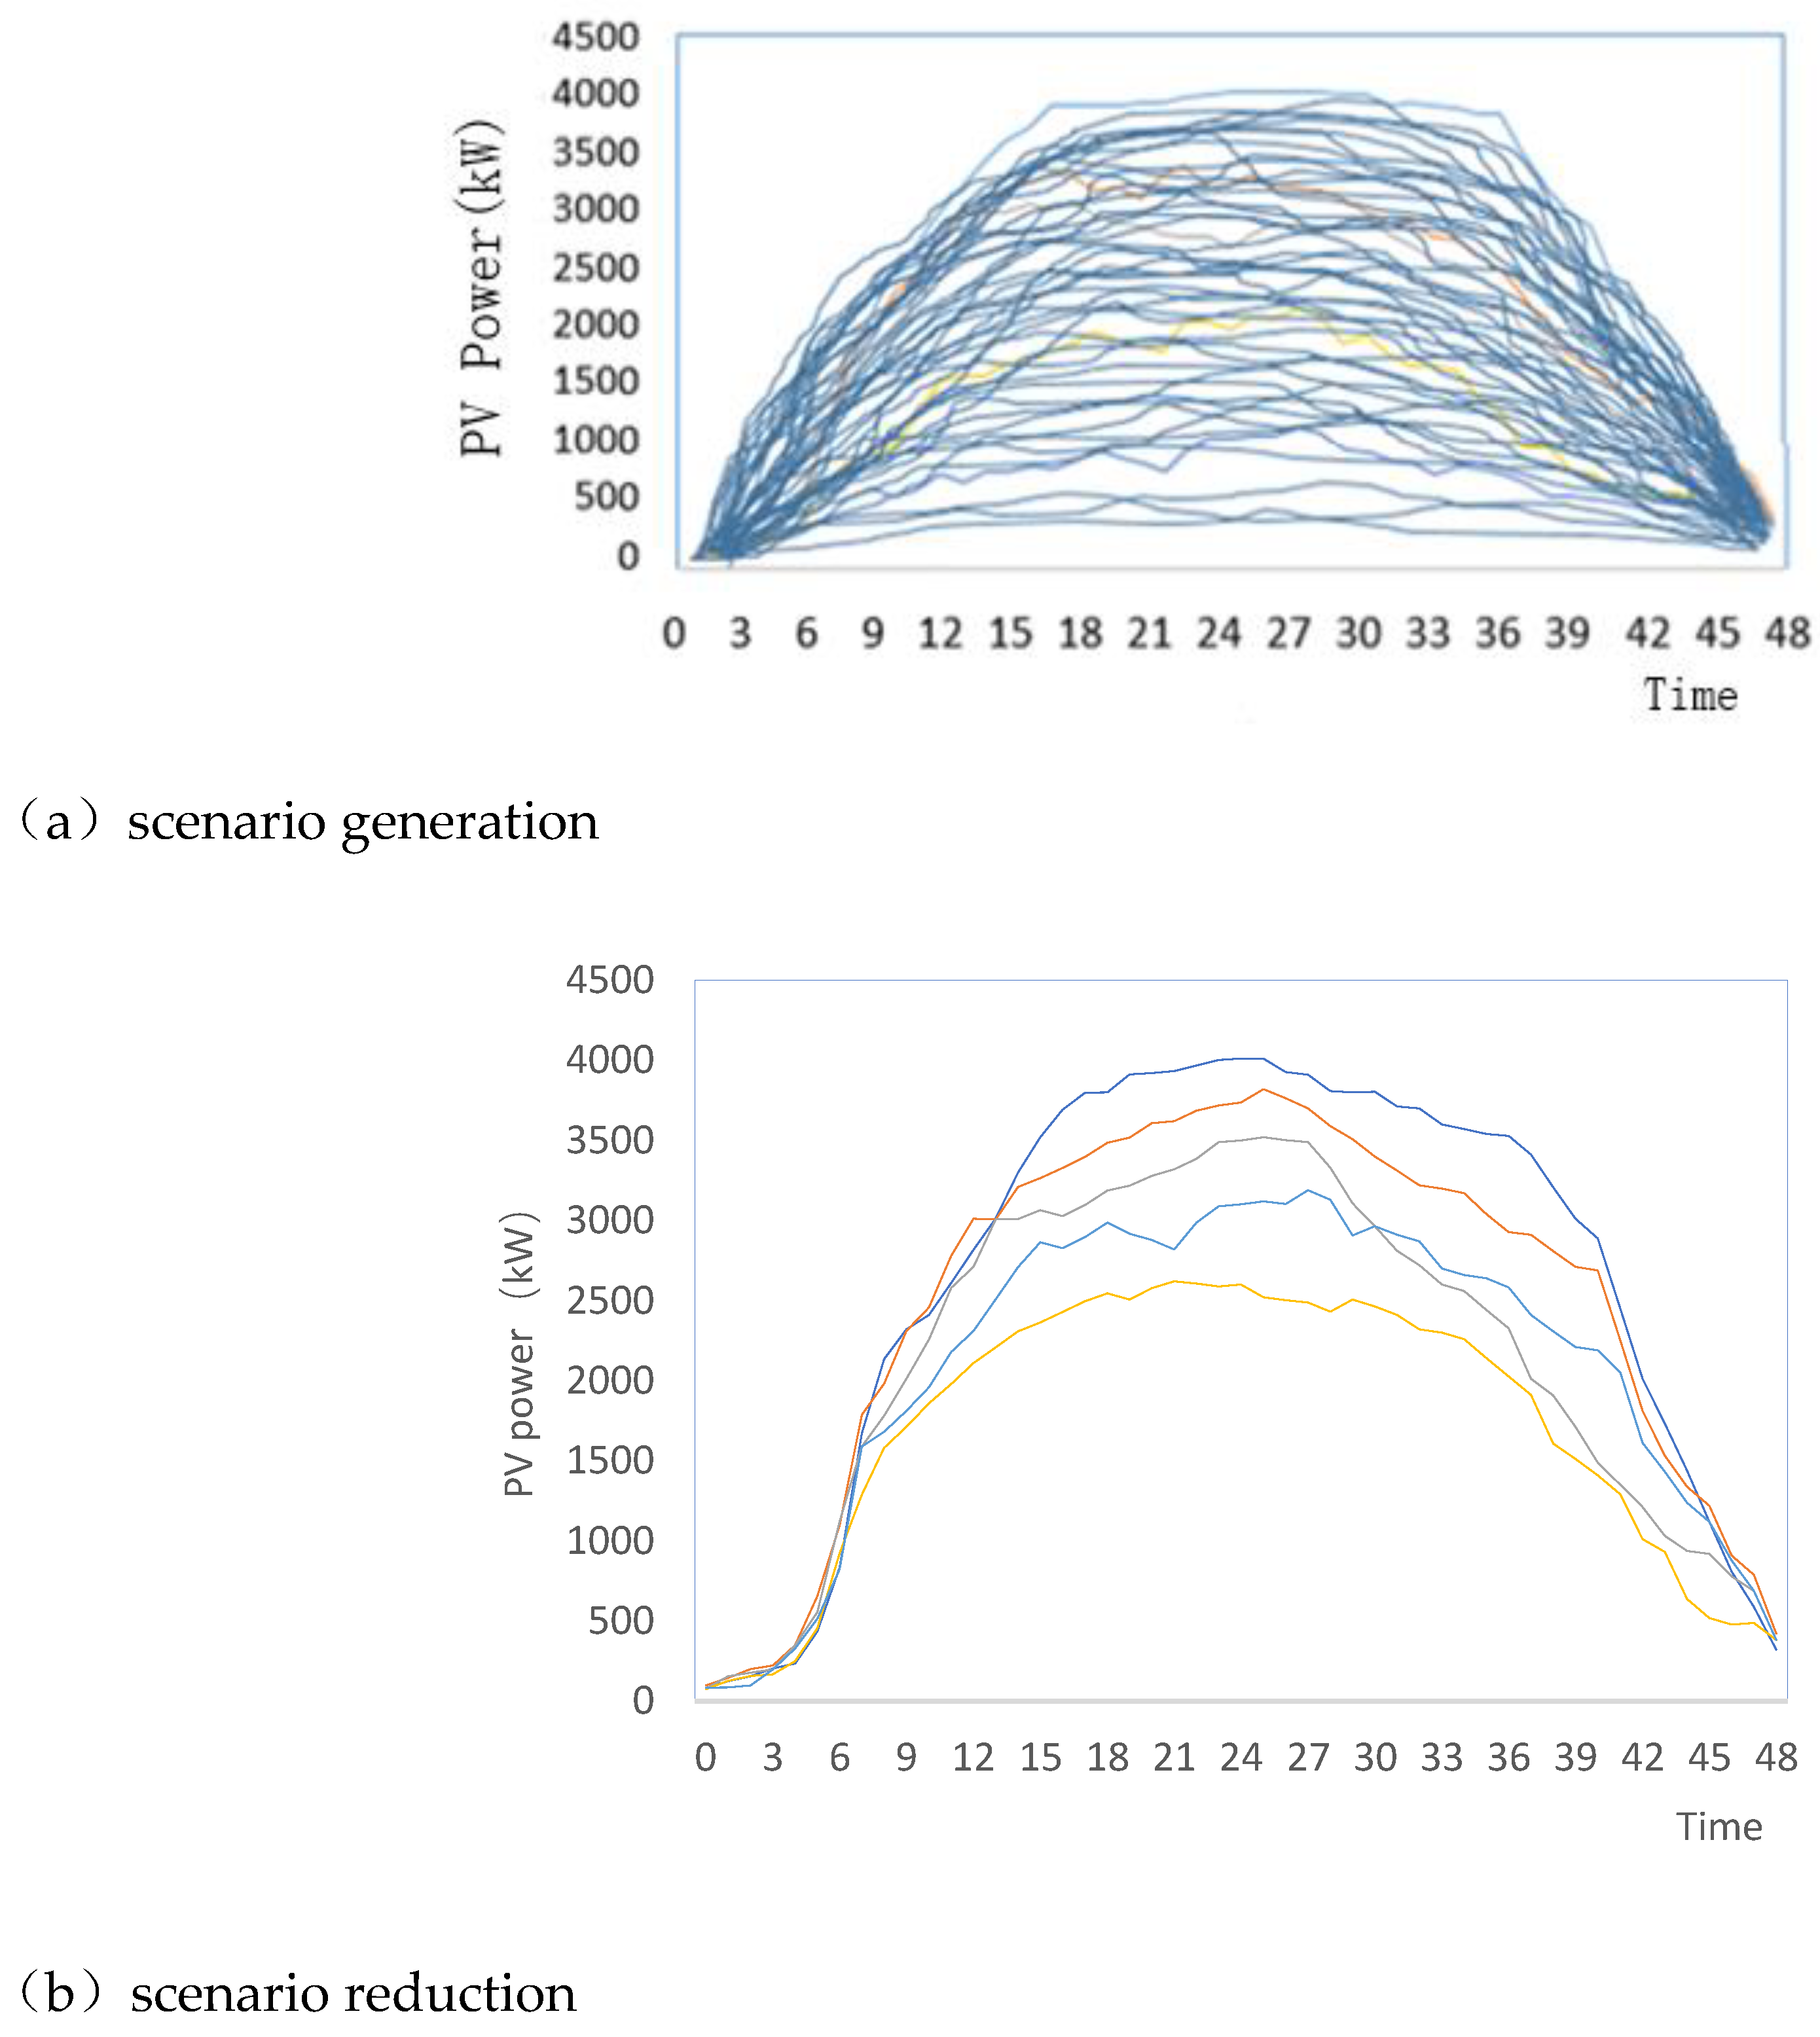
For photovoltaics, 50 dynamic scenarios are generated based on the prediction data and probability density function. After the scenarios reduction, 5 high probability scenarios are obtained, as shown in Figure 3.
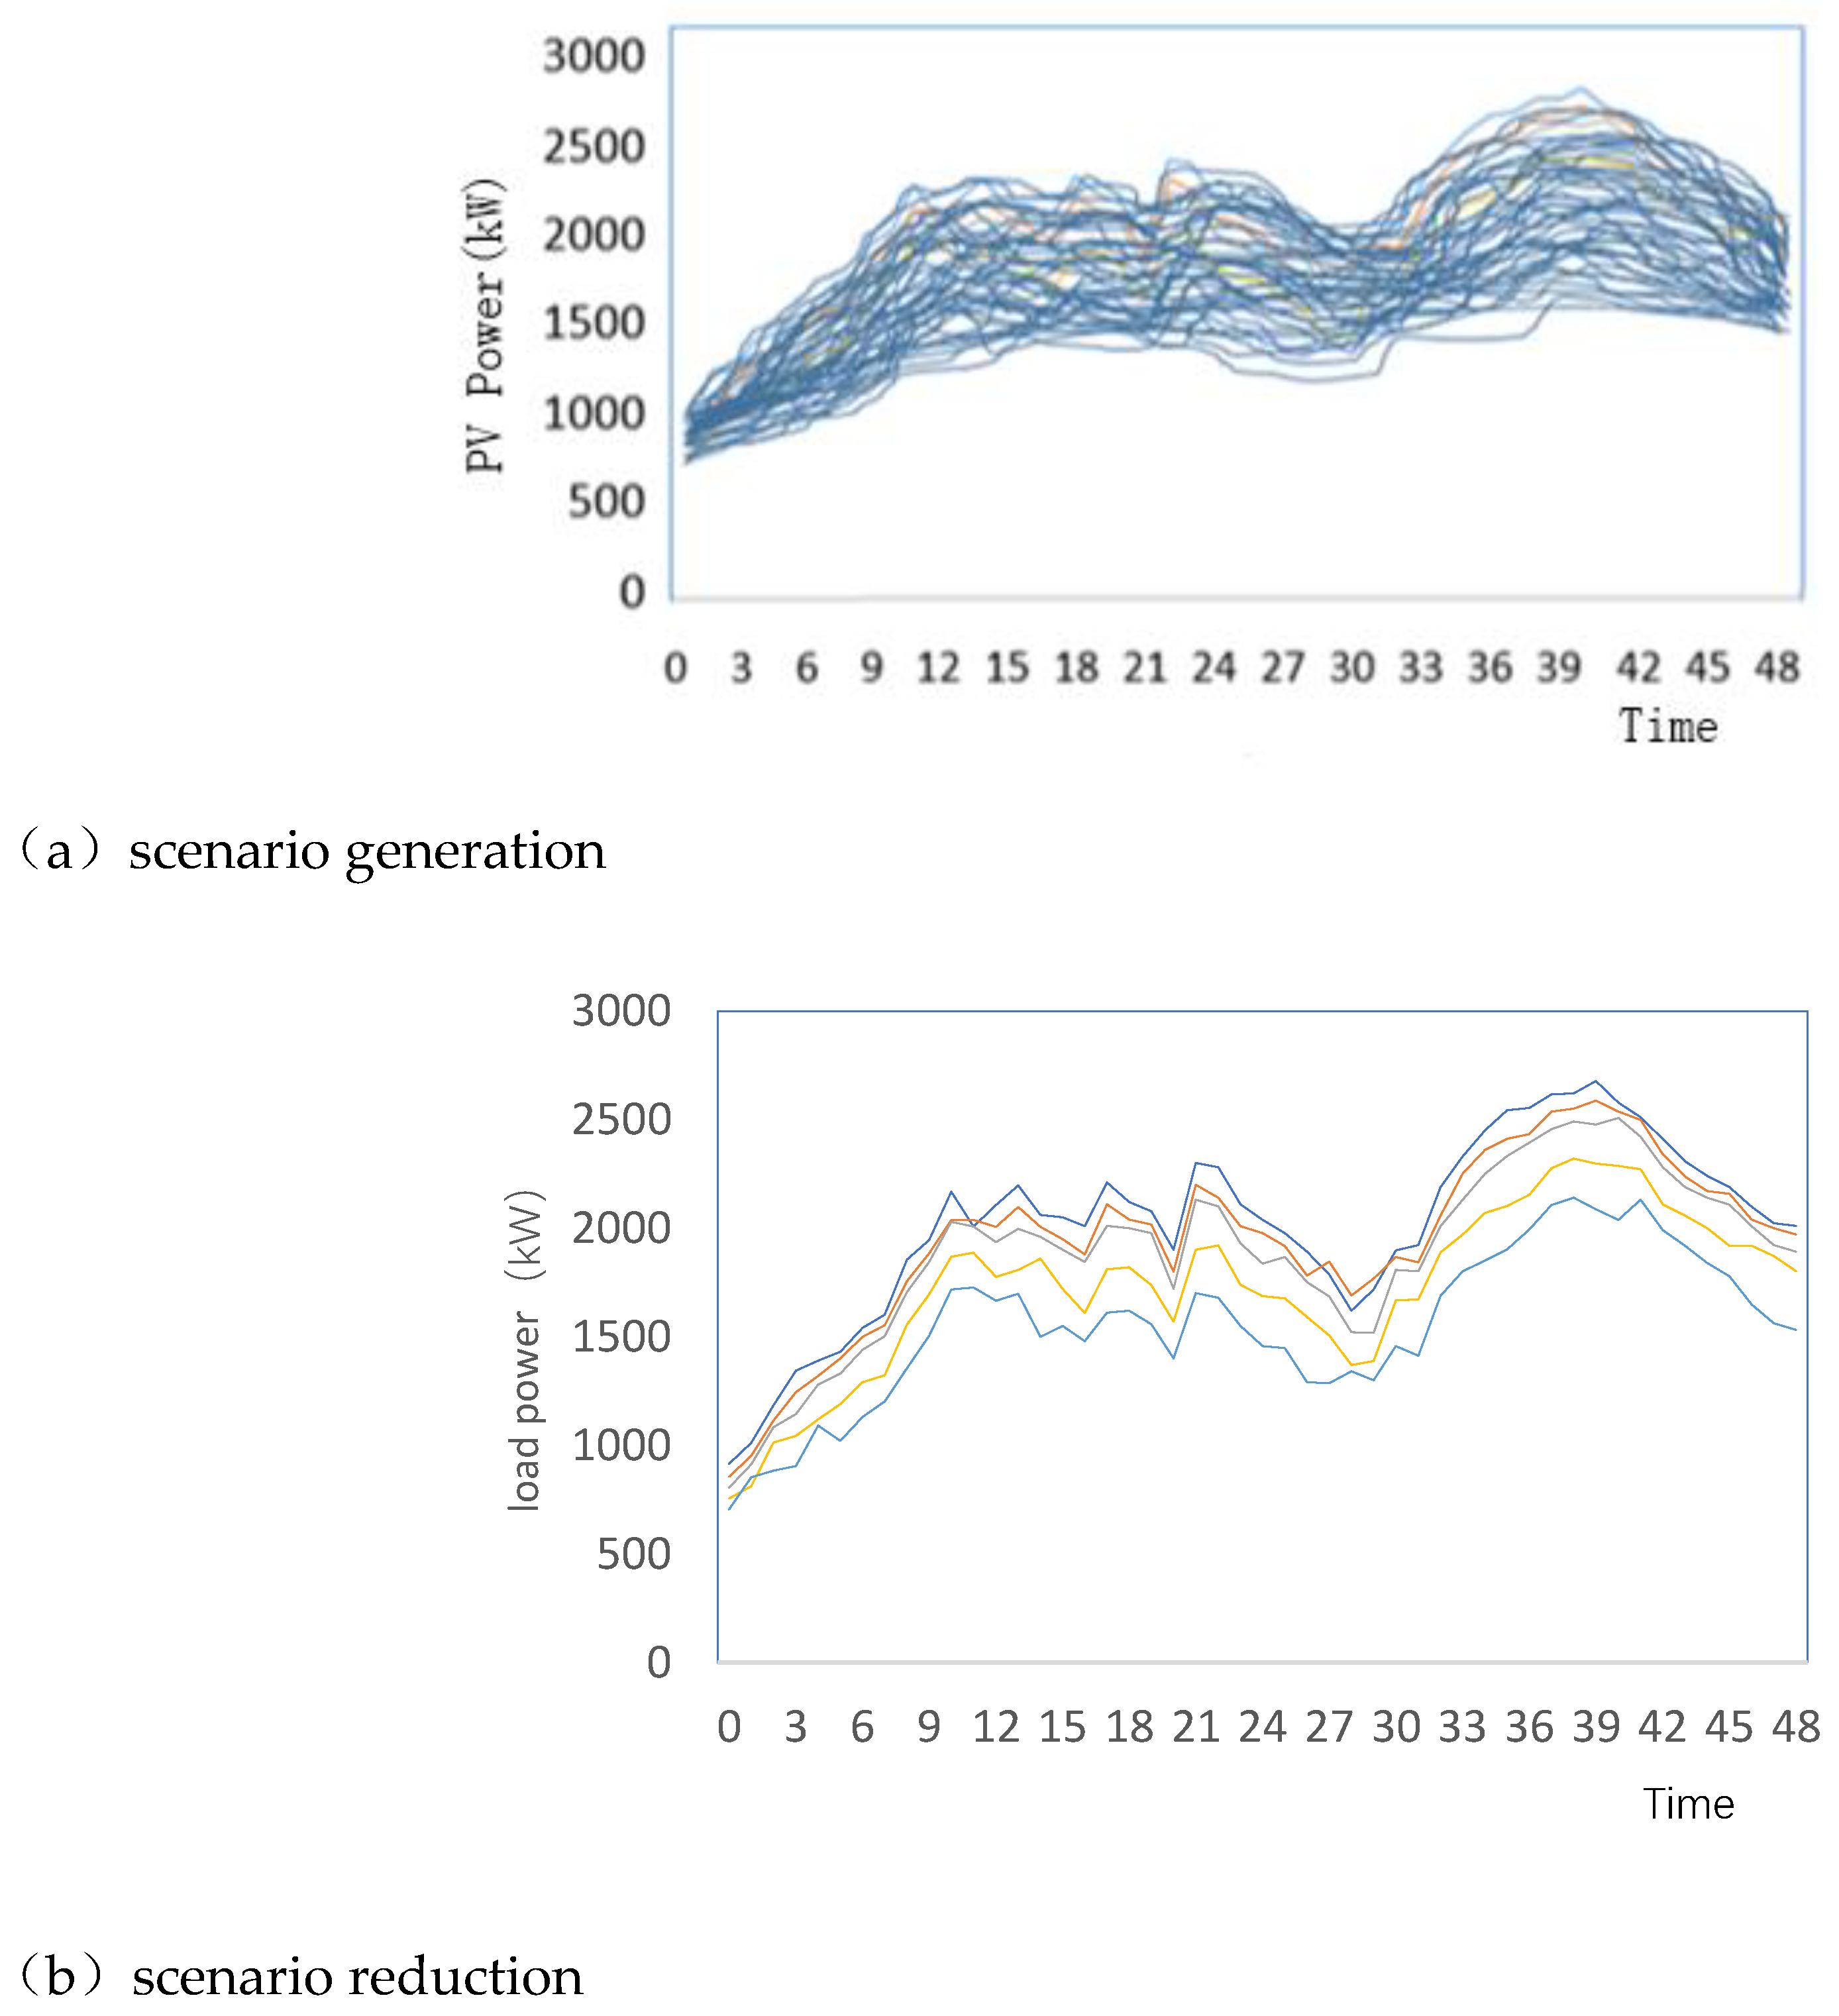
For load, 50 dynamic scenarios are generated based on the empirical distribution probability, and 5 high probability scenarios are obtained, as shown in Figure 4.
(2)Border scenes
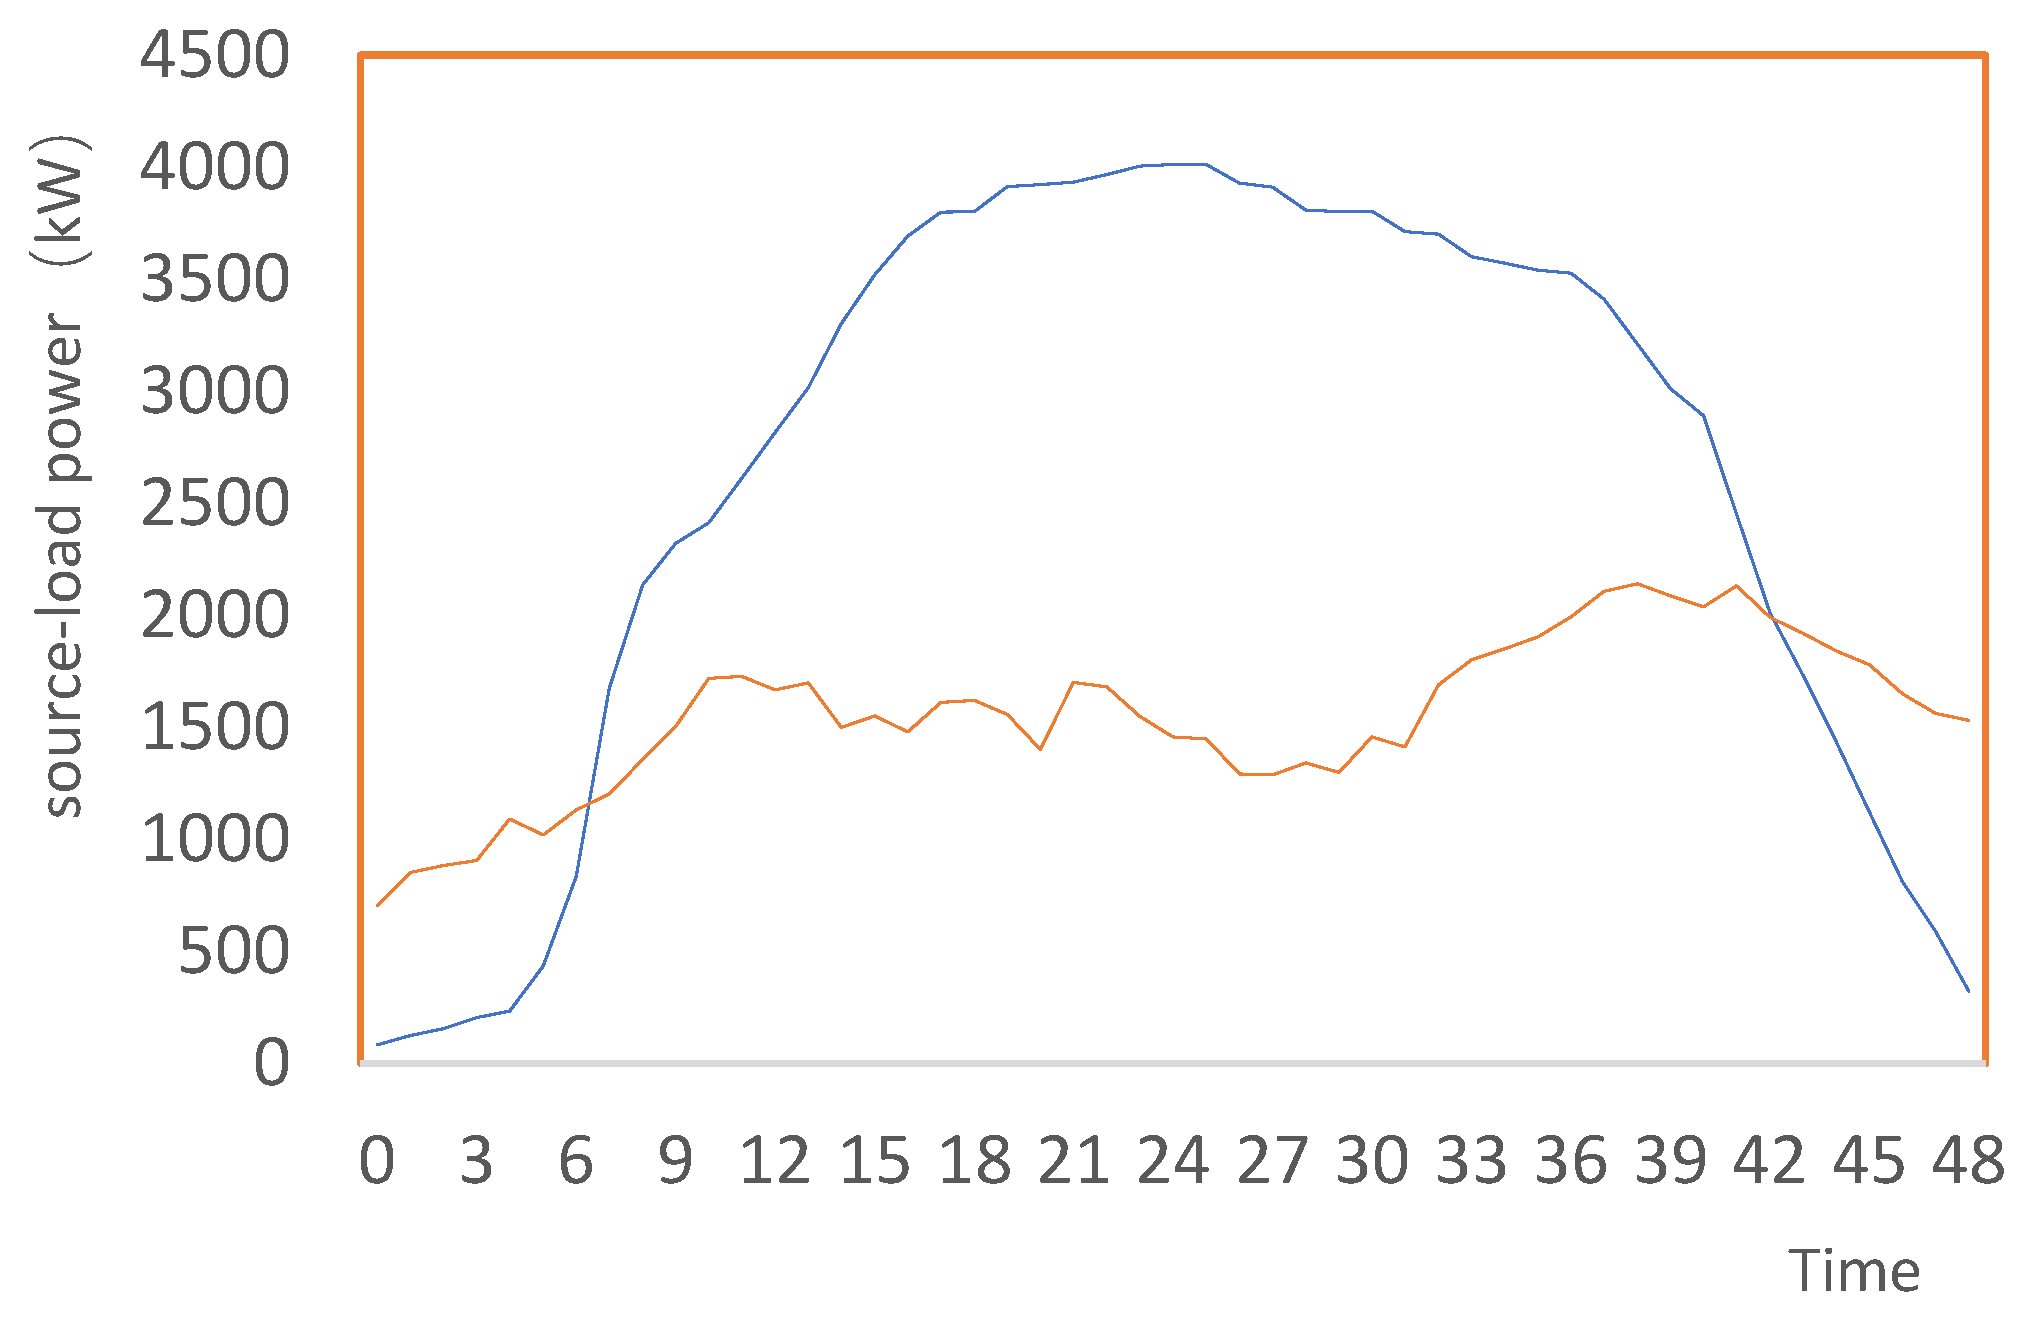
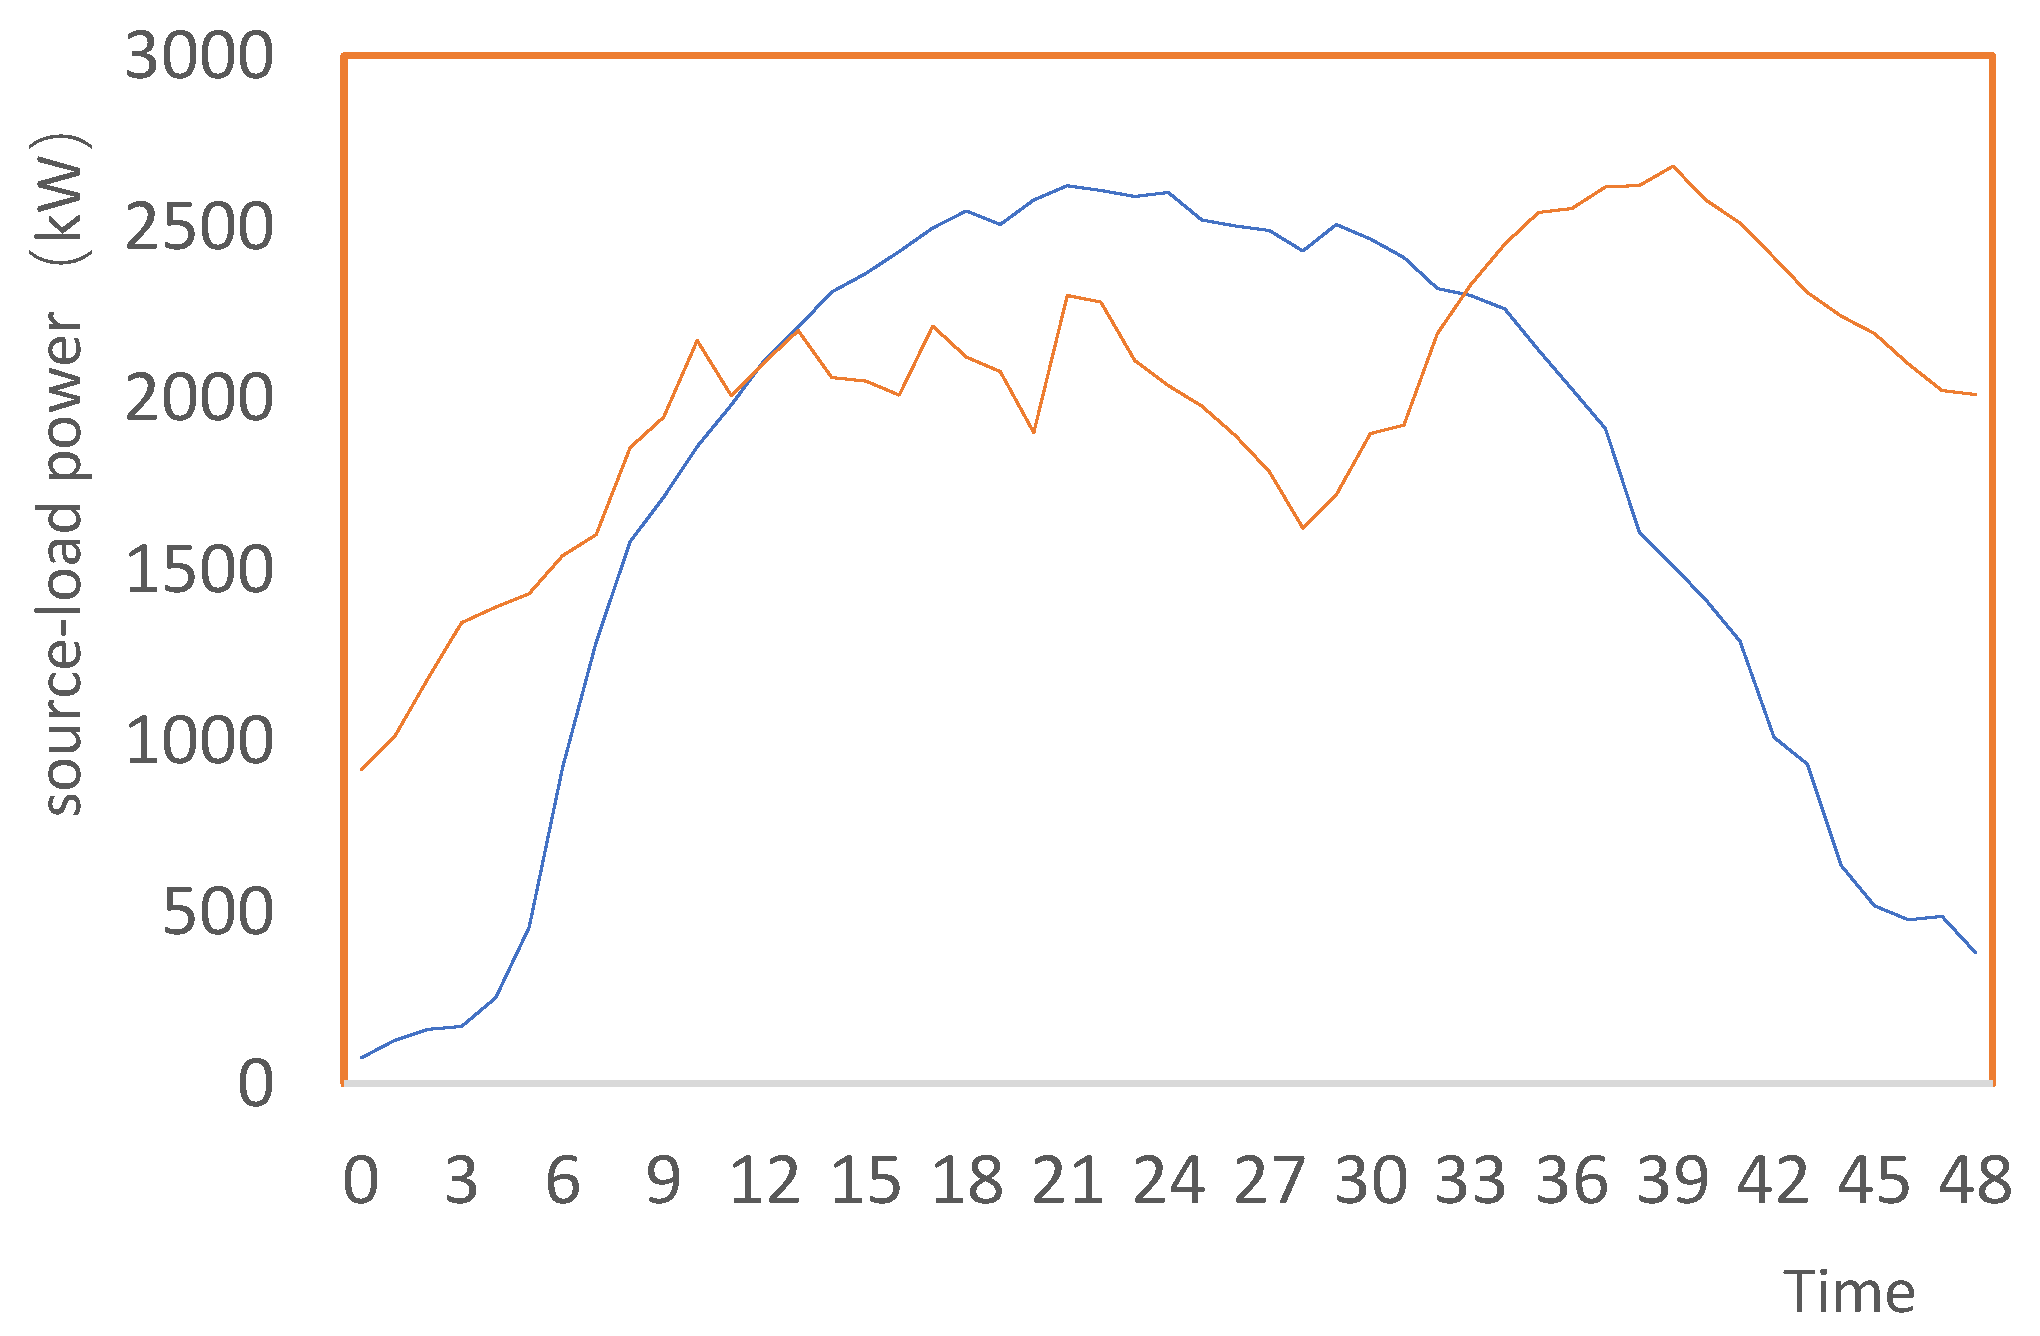
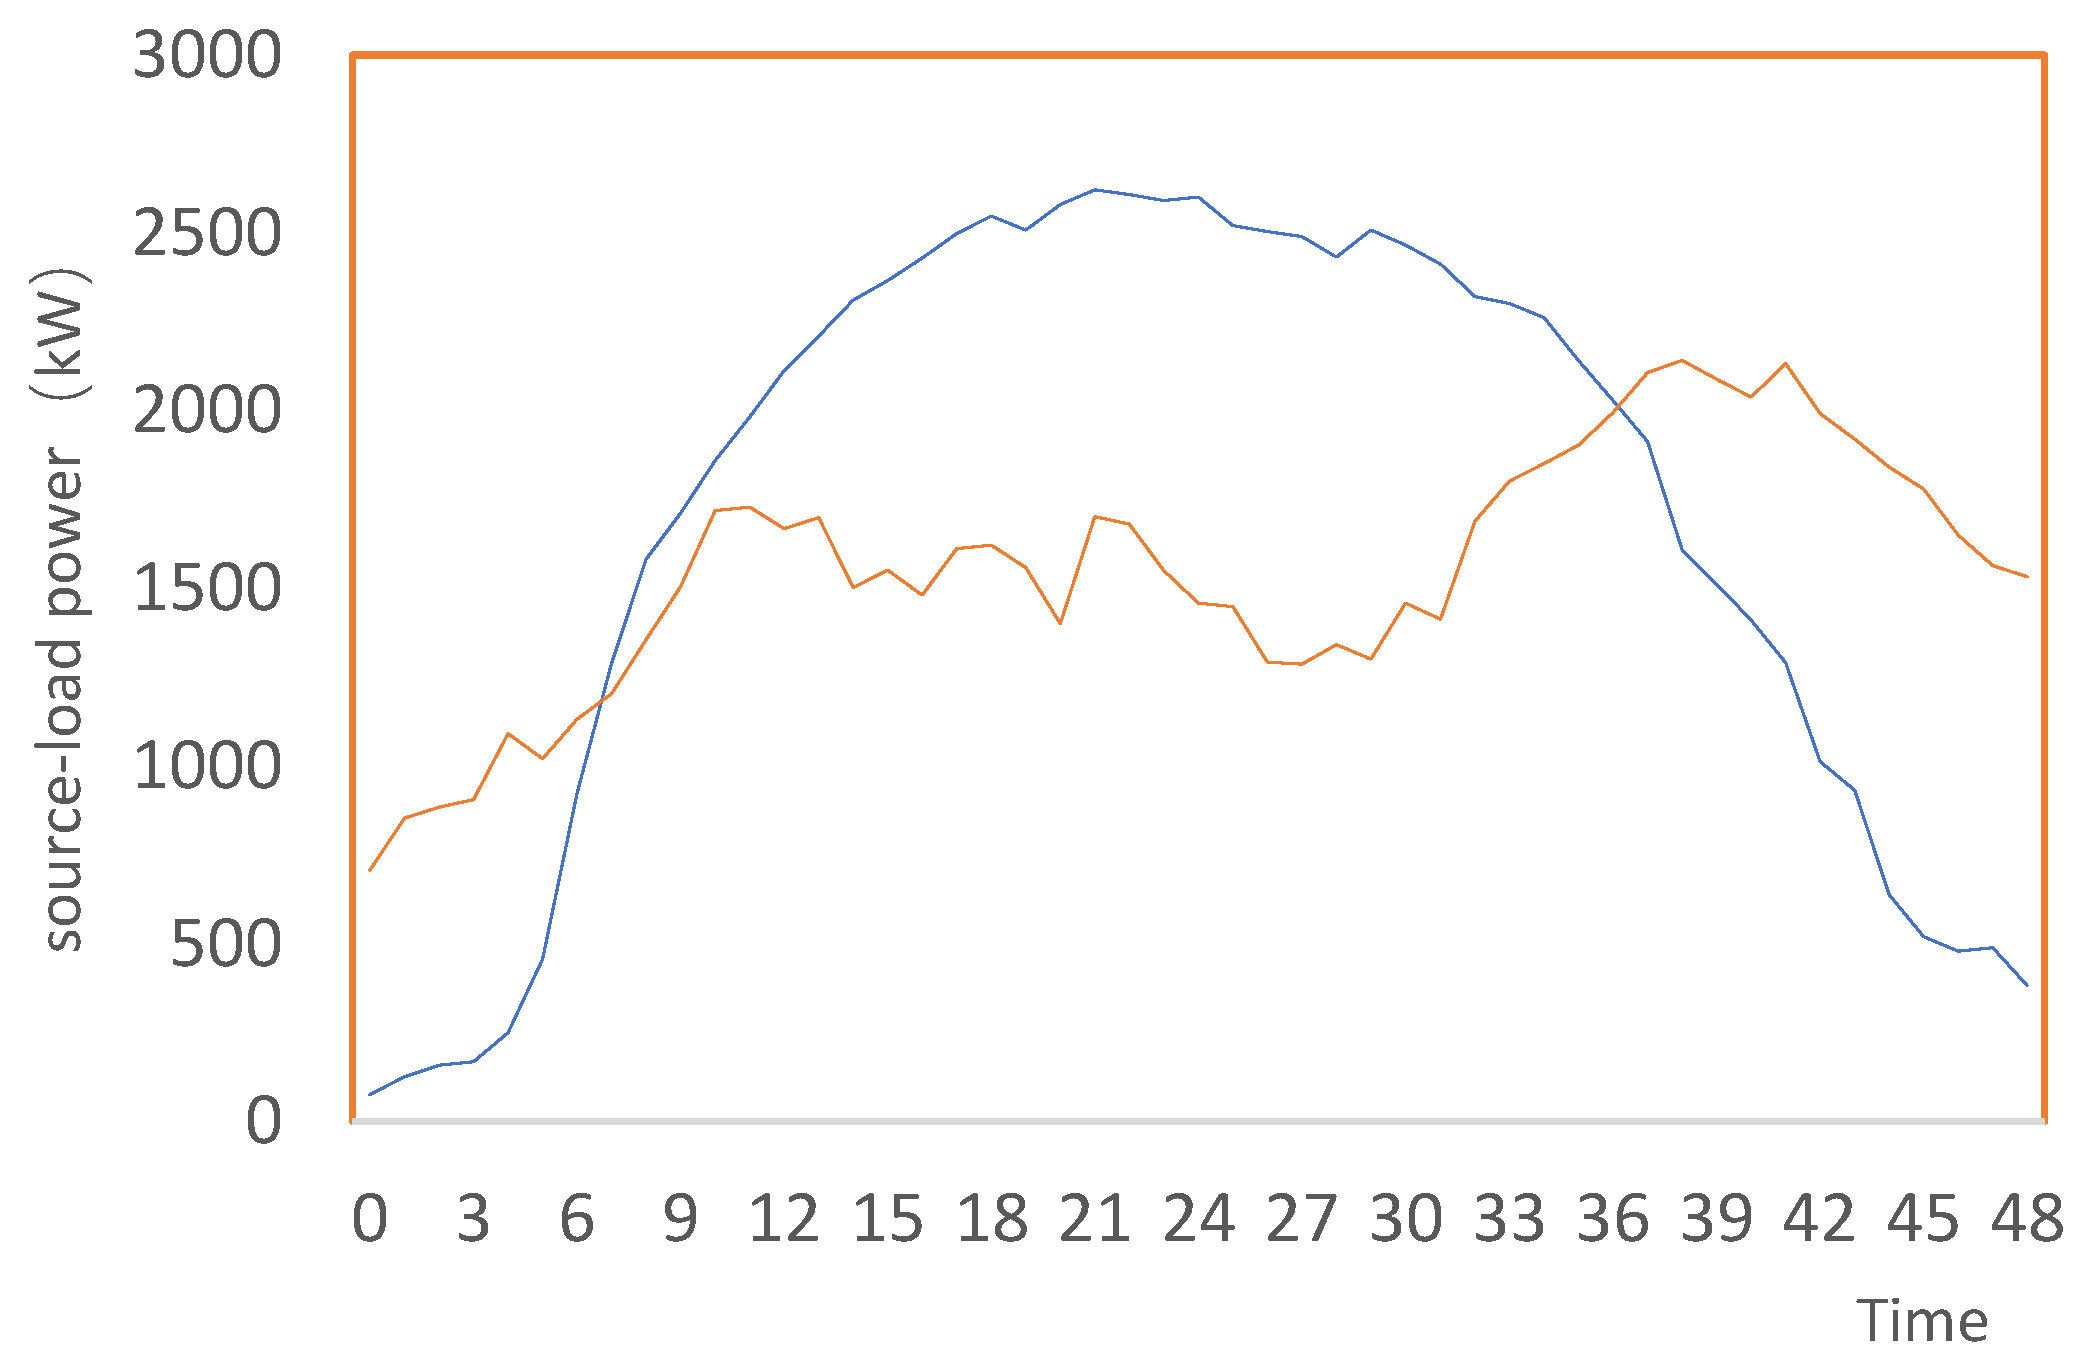
Based on the five scenarios with higher source charge probability, four boundary scenarios are obtained by combining them, as shown in Figure 5, Figure 6, Figure 7 and Figure 8.
Based on the analysis of four boundary scenarios, the calculation results are shown in Table 2.
1) As shown in Fig.5 and 6, in the two boundary scenarios of large source and large load and large source and small load, the load capacity ratio is high. Through load shifting, photovoltaic power generation can meet the power supply requirements. This is a conservative planning. However, the amount of solar abandon is also large, which is as high as 2437kW. The capacity-load ratio can be decreased and the planned photovoltaic capacity can be reduced. However, energy storage may be required to meet power supply, and it can also guide the more controllable loads.
2) As shown in Fig.7 and 8, for the latter two boundary scenarios, the amount of abandoned light is small and the capacity-load ratio is lower, but the photovoltaic capacity cannot meet the load demand. When the photovoltaic power is less than the load power, the load is first shifted. Then energy storage or other power sources may be required to support it. Based on big data analysis, it can guide the more photovoltaics to join the planning.
3) Based on and source-load big data analysis, source-load scenarios interaction can guide the planning sequence. For the scenarios in Fig.5 and 6, the available photovoltaic capacity in nodes 28 and 32 is relatively large. According to the node and the surrounding load, node 32 can currently reduce the maximum planned photovoltaic capacity, followed by node 28. For nodes 32 and 28, it can guide the more electric vehicle loads planning. For the scenarios in Fig.7 and 8, the photovoltaic capacity is insufficient, and energy storage can be installed at 5, 11, and 28. According to the source-load scenario interaction, the planning sequence and the scalability of current and future source-load can be determined or guided.
4) From the overall planning economics, if the probability of high-power photovoltaic scenarios is high, such as high light intensity time exceeding 80% in a year, planning can be carried out according to the high-power scenario mode. For low light intensity times with a high probability, planning can be carried out according to low-power scenarios. As for the low-probability low-power photovoltaic scenario, it may occur for a few days in a year. At this time, it can be supported by other power sources in the distribution network, or the load shedding, no large energy storage required.
Regarding the power supply reliability problem caused by the current rapid development of high-proportion distributed photovoltaic power generation, a planning idea is proposed based on big data to solve this problem from the initial planning source.
The idea of distributed photovoltaic planning based on big data is proposed, which can realize peer-to-peer data deep interaction between source and load, and guide controllable loads to consume photovoltaics. A planning analysis model based on big data is established, and multi-scenario generation and reduction algorithms are studied. Based on the maximum probability scenarios matching between source and load, the planning indicators of static and dynamic capacity-load ratio are proposed. Based on the source-load scenario matching analysis, the load shifting capacity, required energy storage capacity and solar abandonment capacity are obtained, and the load is determined by the source vice versa. the orderliness of distributed photovoltaic planning is guided, and the power supply reliability is improved. In the future work, the coordination of photovoltaic planning capacity, energy storage, and other power sources will be further studied.

Funding

This research was funded by State Grid Corporation of China Headquarters Management of Science and Technology Project(5400-202128154A-0-0-00),and China Scholarship Council.

References

  1. ZHANG Lu, TANG Wei,et al. Optimal Configuration of Active-reactive Power Sources in Distribution Network With Photovoltaic Generation[J]. Procedings of the CSEE, 2014, 34, 5525–5533.
  2. Kai Zou,Ashish Prakash Agalgaonkar,Kashem M. Muttaqi, Sarath Perera. Distribution System Planning With Incorporating DG Reactive Capability and System Uncertainties[J]. IEEE Transactions on Sustainable Energy, 2012, 3, 112–123. [CrossRef]
  3. Shuangshuang Y,Ganghong Z,Jian G, et al. Voltage Management of Distributed Photovoltaic Cluster Connected to a Distribution Network[J]. Journal of Physics: Conference Series, 2023, 2564. [CrossRef]
  4. Yuxin J,Qiong L,Yaqi C, et al. Position-Capacity Optimization Method for Distributed Photovoltaic Accessing to Distribution Network Based on PV Load Uncertainty Quantification[J]. Journal of Physics: Conference Series, 2023, 2557. [CrossRef]
  5. Matheus Sabino Viana, Giovanni Manassero, Miguel E.M. Udaeta,Analysis of demand response and photovoltaic distributed generation as resources for power utility planning[J]. Applied Energy, 2018, 217, 456–466. [CrossRef]
  6. Giraja Shankar Chaurasia, Amresh Kumar Singh, Sanjay Agrawal, N.K. Sharma,A meta-heuristic firefly algorithm based smart control strategy and analysis of a grid connected hybrid photovoltaic/wind distributed generation system[J]. Solar Energy, 2017, 150, 265–274. [CrossRef]
  7. Honglin W,Dong D,Yan S, et al. Topology Optimization of Regional Power Grid Under Large-Scale Access of Distributed Photovoltaic Power Generation[J]. Journal of Nanoelectronics and Optoelectronics, 2022, 17. [CrossRef]
  8. Zhao Bo, Zhang Xuesong ,Hong Bowen.Energy penetration of large-scale distributed photovoltaic sources integrated into smart distribution network[J]. Electric Power Automation Equipment 2012, 32, 95–100.
  9. Shuai Geng, Ran Zou, Shibin Zhang, et al. Dongyan Guo,Research on site combination optimization framework of distributed photovoltaic power station from dual perspectives[J]. Energy Reports, 2022, 8, 4401–4415. [CrossRef]
  10. Huang Bibin, Li Qionghui, Gao Fei,Optimal Planning of High Penetration Distributed Photovoltaic with Considering Grid Reinforcement. Energy Procedia 2017, 105, 427–432. [CrossRef]
  11. Mahmood Sadeghi, Mohsen Kalantar. Multi types DG expansion dynamic planning in distribution system under stochastic conditions using Covariance Matrix Adaptation Evolutionary Strategy and Monte-Carlo simulation[J]. Energy Conversion and Management, 2014, 87, 455–471. [CrossRef]
  12. Mehdi Jalali, Kazem Zare , Mehrdad Tarafdar Hagh. A multi-stage MINLP-based model for sub-transmission system expansion planning considering the placement of DG units[J]. Electrical Power and Energy Systems 2014, 63, 8–16. [CrossRef]
  13. H. Falaghi , C. Singh , M.-R. Haghifam, M. Ramezani. DG integrated multistage distribution system expansion planning[J]. Electrical Power and Energy Systems 2011, 33, 1489–1497. [CrossRef]
  14. Joel Kennedy, Phil Ciufo, Ashish Agalgaonkar,Voltage-based storage control for distributed photovoltaic generation with battery systems[J]. Journal of Energy Storage, 2016, 8, 274–285. [CrossRef]
  15. S. Daud, A.F.A. Kadir, C.K. Gan, A. Mohamed, Tamer Khatib,A comparison of heuristic optimization techniques for optimal placement and sizing of photovoltaic based distributed generation in a distribution system. Solar Energy[J]. 2016, 140, 219–226. [CrossRef]
  16. Shaofei Z,Chao H. Design of A Grid-connected Control System for Distributed Photovoltaic Power Generation Based on PLC[J]. Journal of Physics: Conference Series, 2022, 2399. [CrossRef]
  17. KARAKI S H, CHEDID R B, RAMADAN R, Probabilistic Performance assessment of autonomous solar-wind energy conversion systems[J]. IEEE Trans on Energy conversion, 1999, 14, 766–772. [CrossRef]
  18. Xi-Yuan Ma, Yuan-Zhang Sun, and Hua-Liang Fang. Scenario Generation of Wind Power Based on Statistical Uncertainty and Variability[J]. IEEE Transactions on Sustainable Energy, 2013, 4, 894–904. [CrossRef]
  19. Xi-Yuan Ma, Yuan-Zhang Sun, Hua-Liang Fang, and Yao Tian. Scenario-Based Multi-objective Decision-Making of Optimal Access Point for Wind Power Transmission Corridor in the Load Centers[J]. IEEE Transactions on Sustainable Energy, 2013, 4, 229–239. [CrossRef]
  20. Bludszuweit H., Dominguez-Navarro J. A., and Llombart A. Statistical Analysis of Wind Power Forecast Error[J]. IEEE Transactions on Power Systems, 2008, 23, 983–991. [CrossRef]
  21. Dupacova J., Growe-Kuska N., and Romisch W. Scenario Reduction in Stochastic Programming: An approach Using Probability Metrics[J]. Mathematical Programming Series B, 2003, 95, 493–511.
  22. Jonnavithula S,Billinton R.Minimum cost analysis of feeder routing in distribution system planning[J]. IEEE Trans on Power Delivery 1996, 11, 1935–1940. [CrossRef]
Figure 1. Scenario matching between generation and load.
Preprints 84950 g001
Figure 2. IEEE 33-bus radial distribution system.
Preprints 84950 g002
Figure 3. Photovoltaic generation scenario.
Preprints 84950 g003
Figure 4. Load scenario.
Preprints 84950 g004
Figure 5. Scenario with big generation and big load.
Preprints 84950 g005
Figure 6. Scenario with big generation and small load.
Preprints 84950 g006
Figure 7. Scenario with small generation and big load.
Preprints 84950 g007
Figure 8. Scenario with small generation and small load.
Preprints 84950 g008
Table 1. Solar capacity of node (kW).
Node 2 5 11 14 20 28 32
Capacity 400 400 500 500 400 1200 1200
Table 2. Planning Result.
Ks Power Control(kW)
Max Min Weighted average Shifting Stored energy solar abandon
1 1.632 1.527 1.523 1153 0 1723
2 1.892 1.835 1.829 783 0 2437
3 0.931 0.912 0.903 1034 754 0
4 1.212 1.186 1.179 1321 452 783
Disclaimer/Publisher’s Note: The statements, opinions and data contained in all publications are solely those of the individual author(s) and contributor(s) and not of MDPI and/or the editor(s). MDPI and/or the editor(s) disclaim responsibility for any injury to people or property resulting from any ideas, methods, instructions or products referred to in the content.
Copyright: This open access article is published under a Creative Commons CC BY 4.0 license, which permit the free download, distribution, and reuse, provided that the author and preprint are cited in any reuse.
Prerpints.org logo

Preprints.org is a free preprint server supported by MDPI in Basel, Switzerland.

Subscribe

© 2024 MDPI (Basel, Switzerland) unless otherwise stated