Submitted:
11 September 2023
Posted:
14 September 2023
You are already at the latest version
Abstract
Keywords:
1. Introduction
2. Doppler distortion correction of rolling bearing fault signals
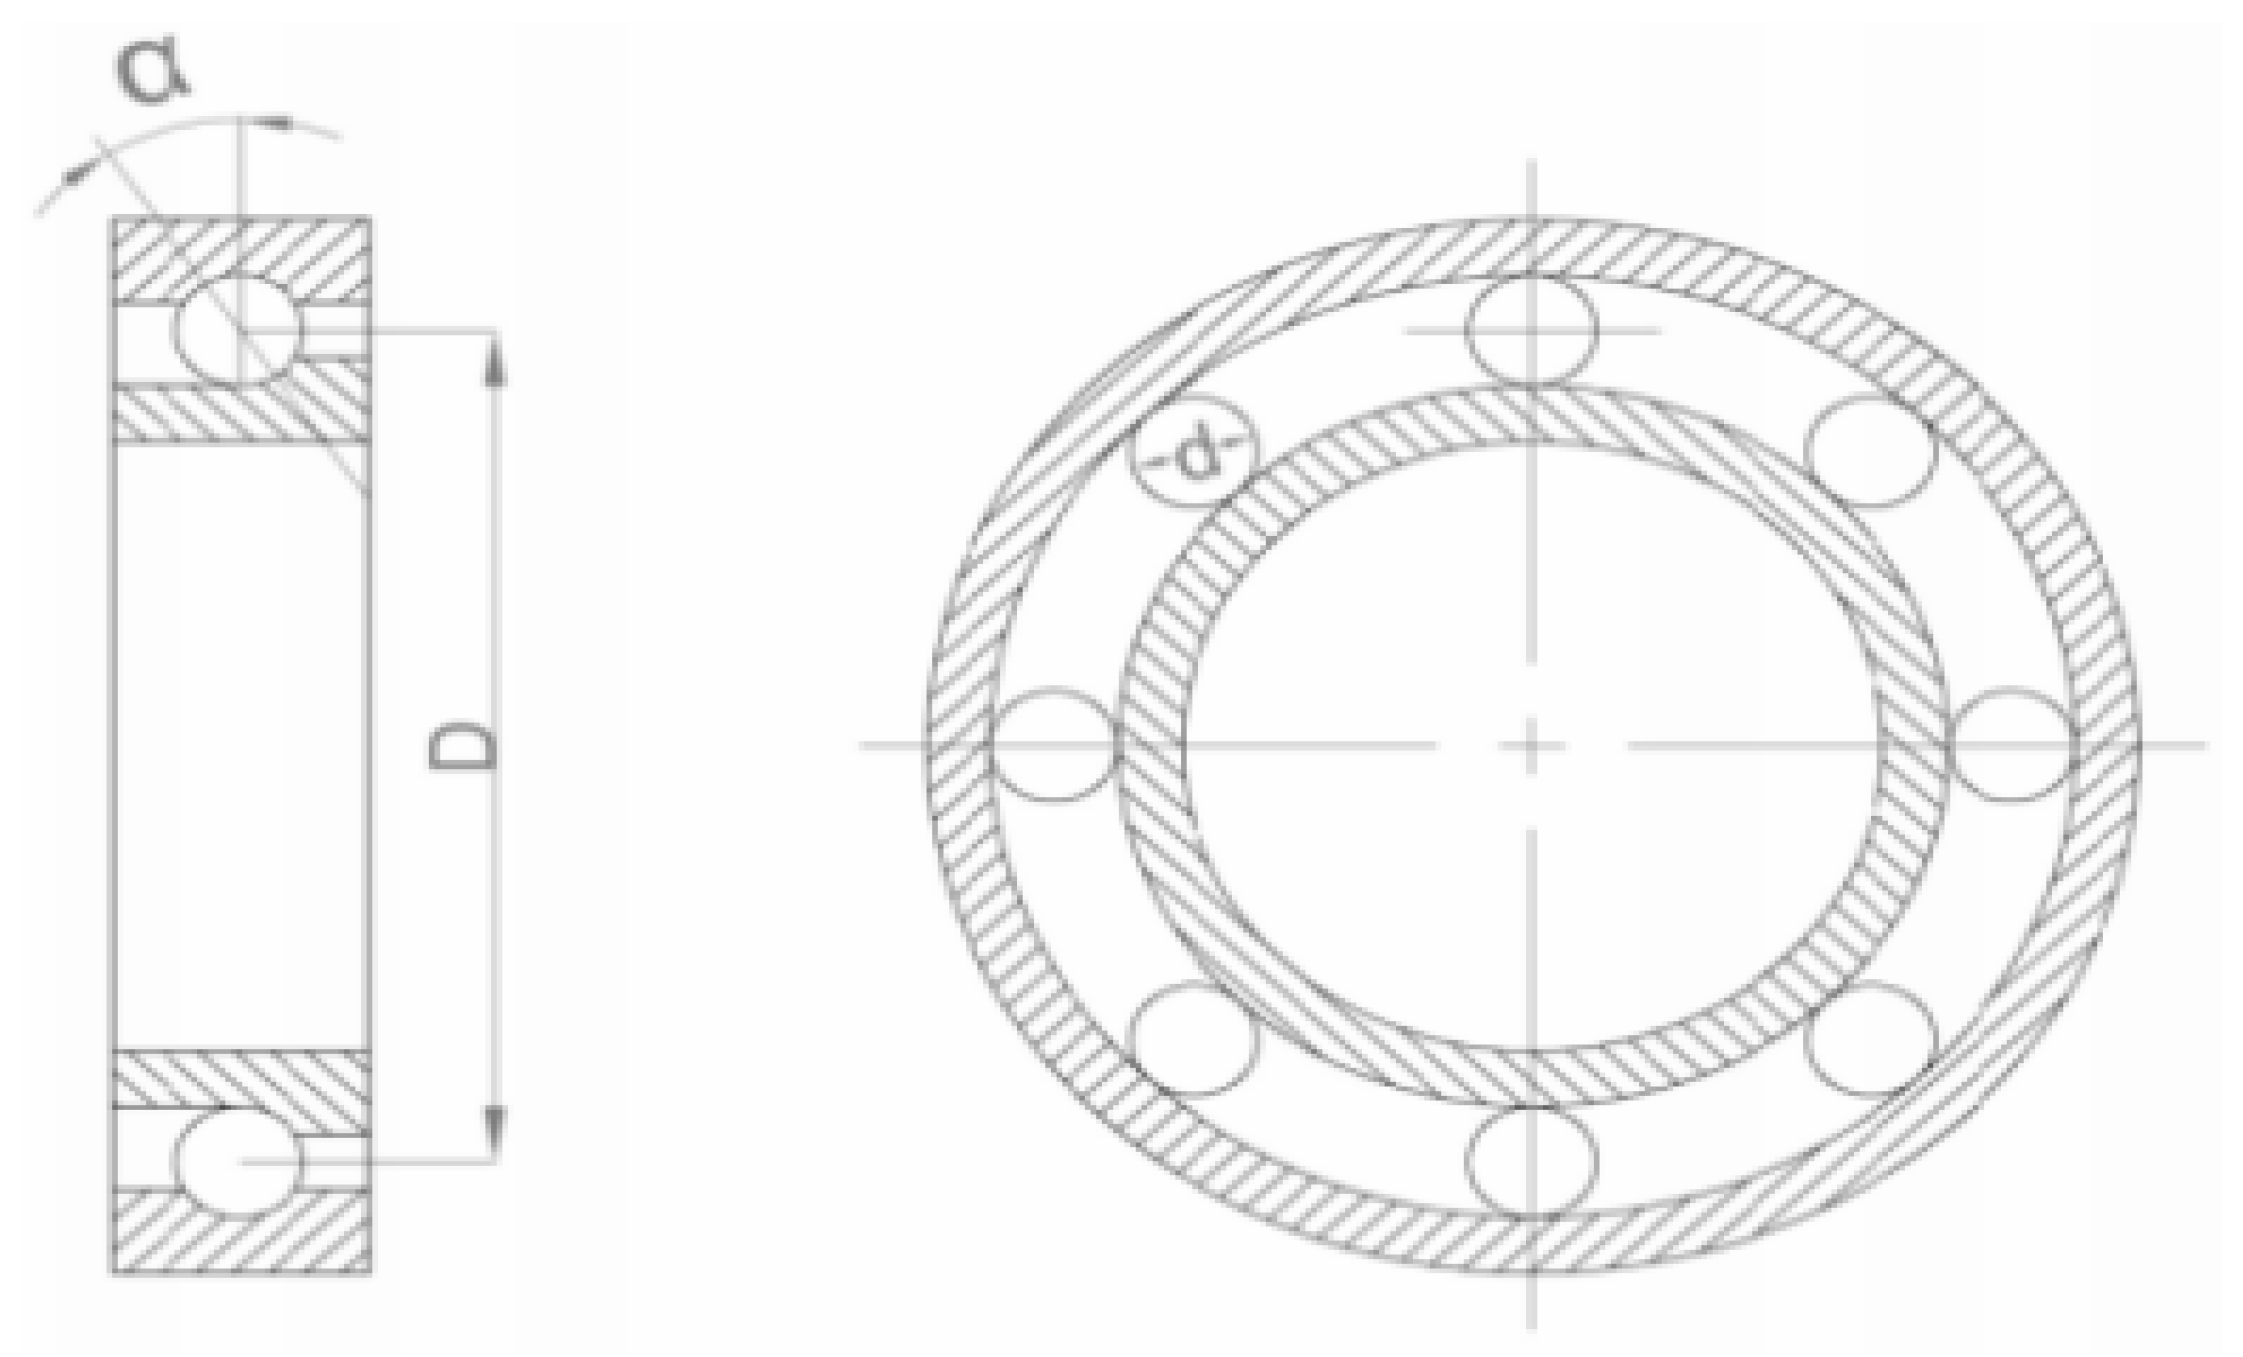
2.1. Rolling bearing failure sound source motion model
2.2. Analysis of the causes of Doppler aberrations in rolling bearings
2.3. Time correction
2.4. Magnitude correction
3. Cyclic and smooth characteristics of rolling bearing fault signals
3.1. Smooth second order cycle
3.2. Cyclic smooth model for rolling bearings
4. Experimentation and analysis
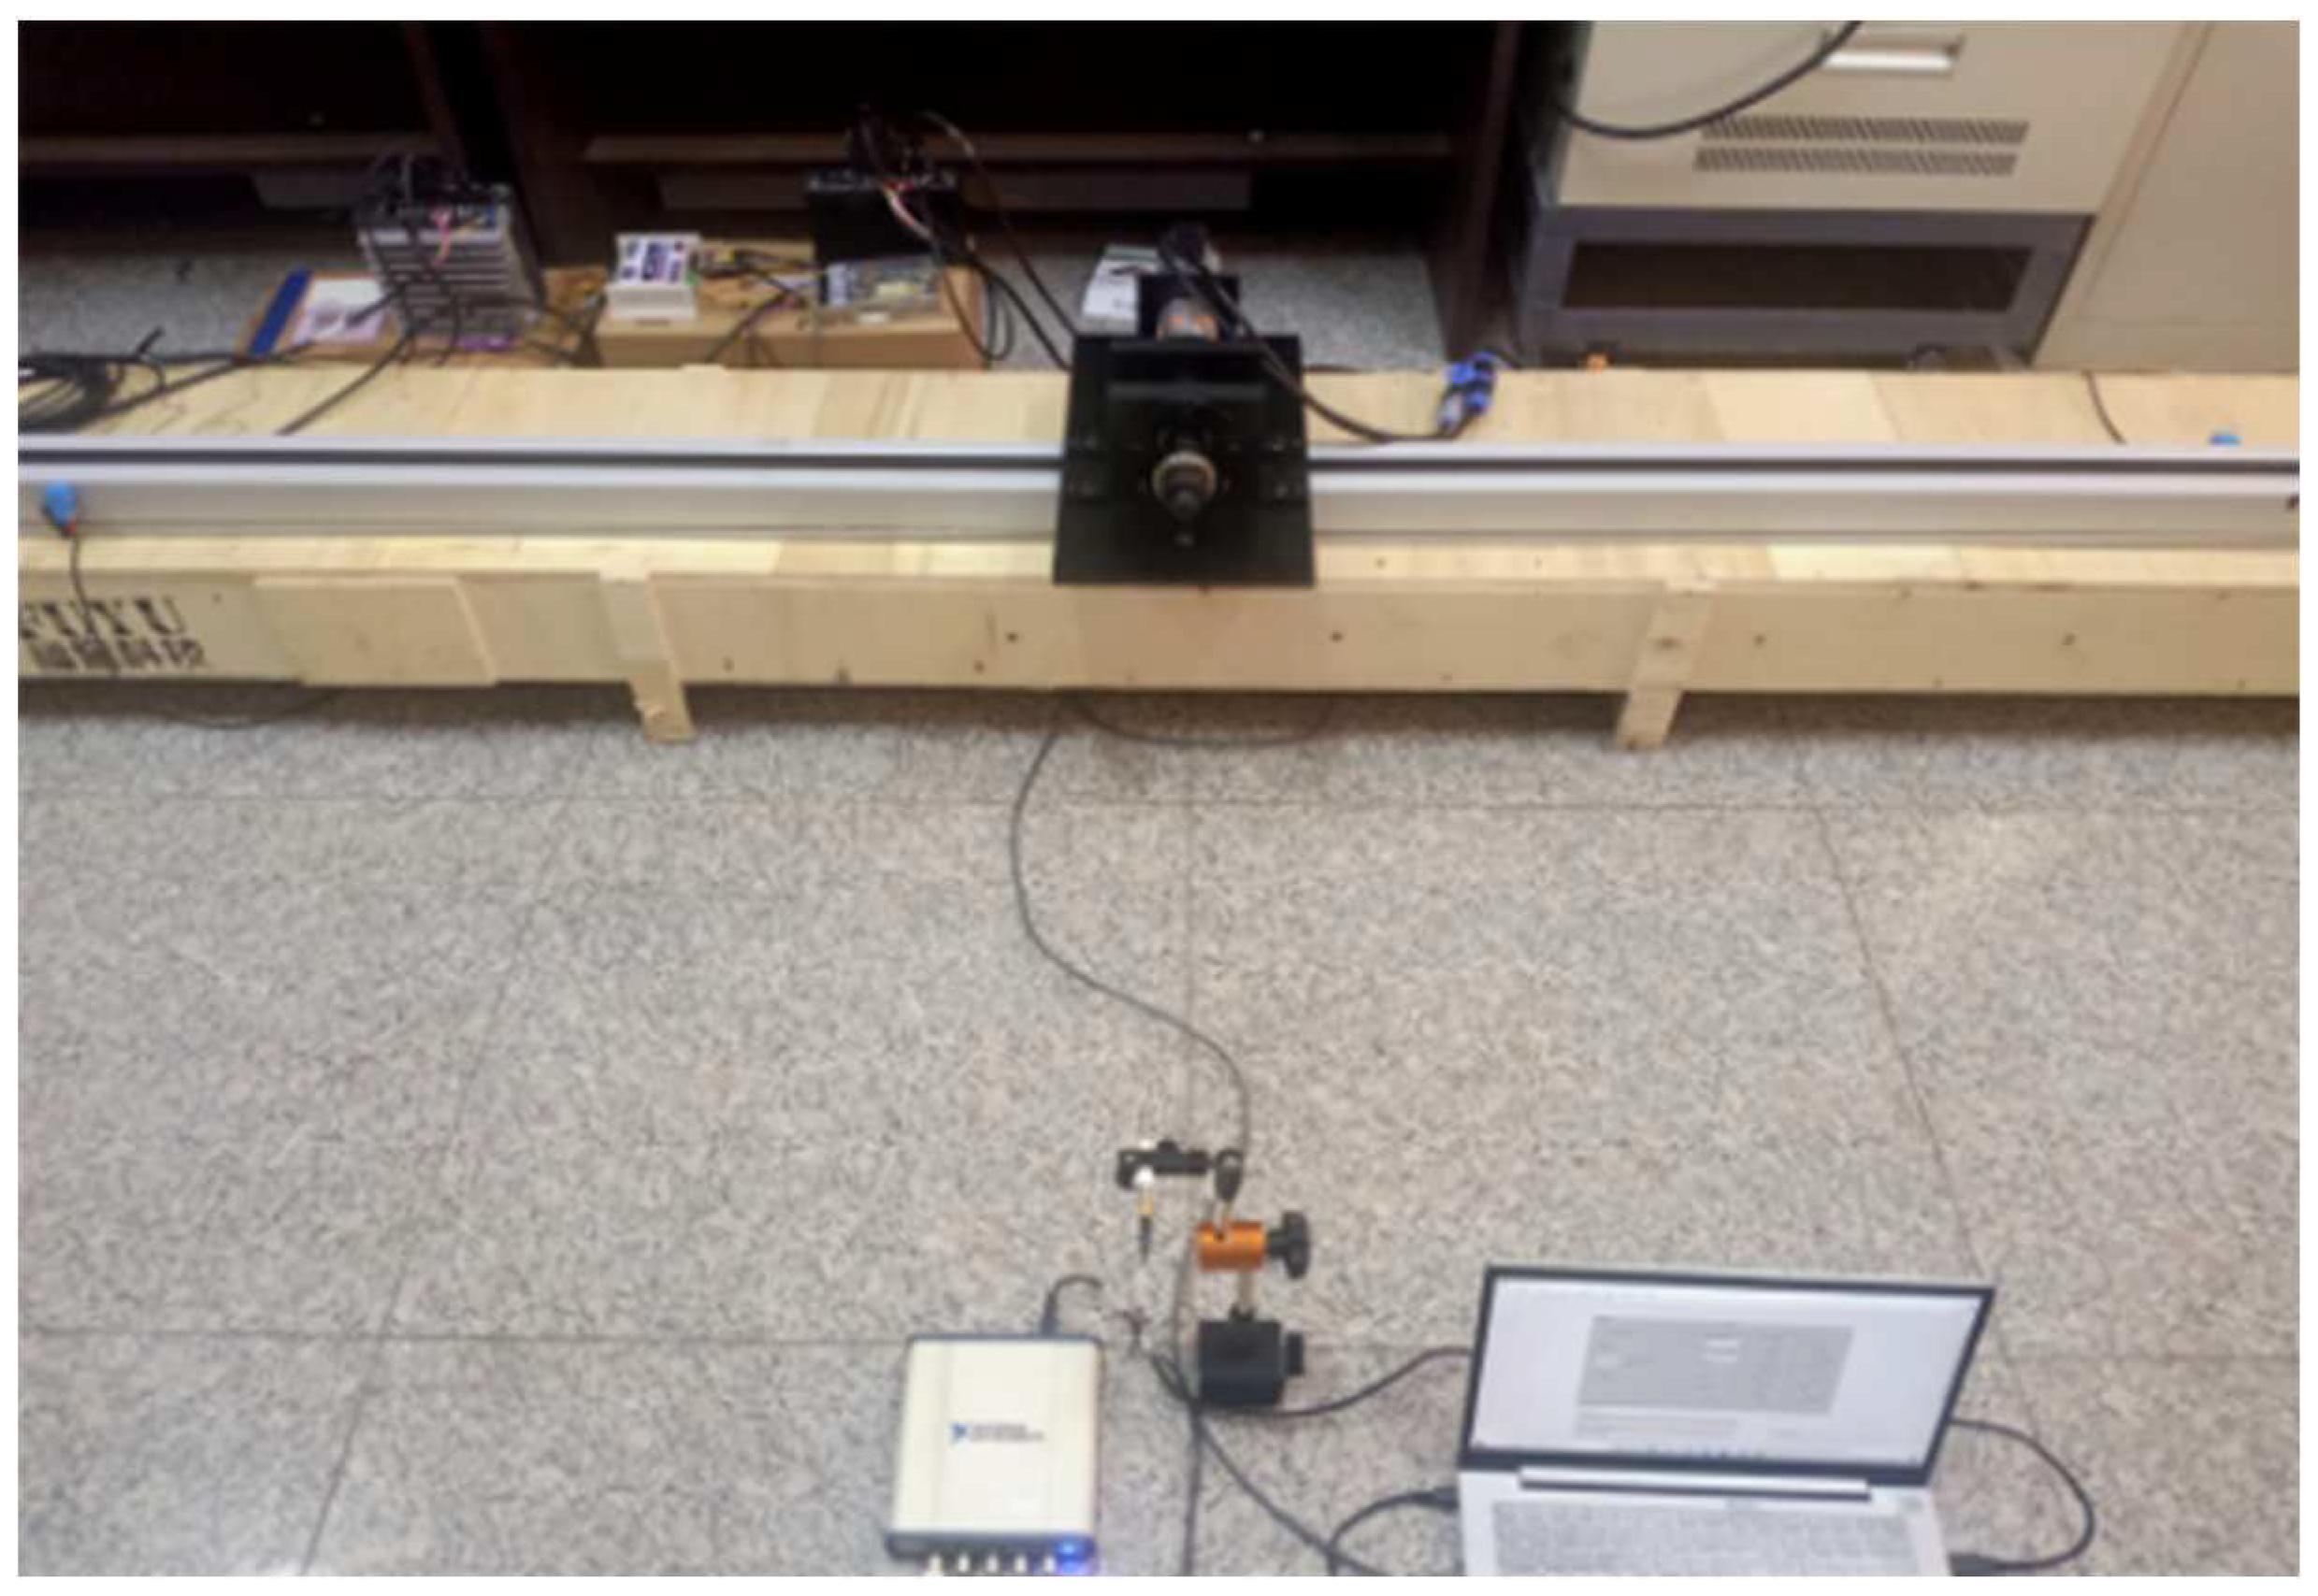
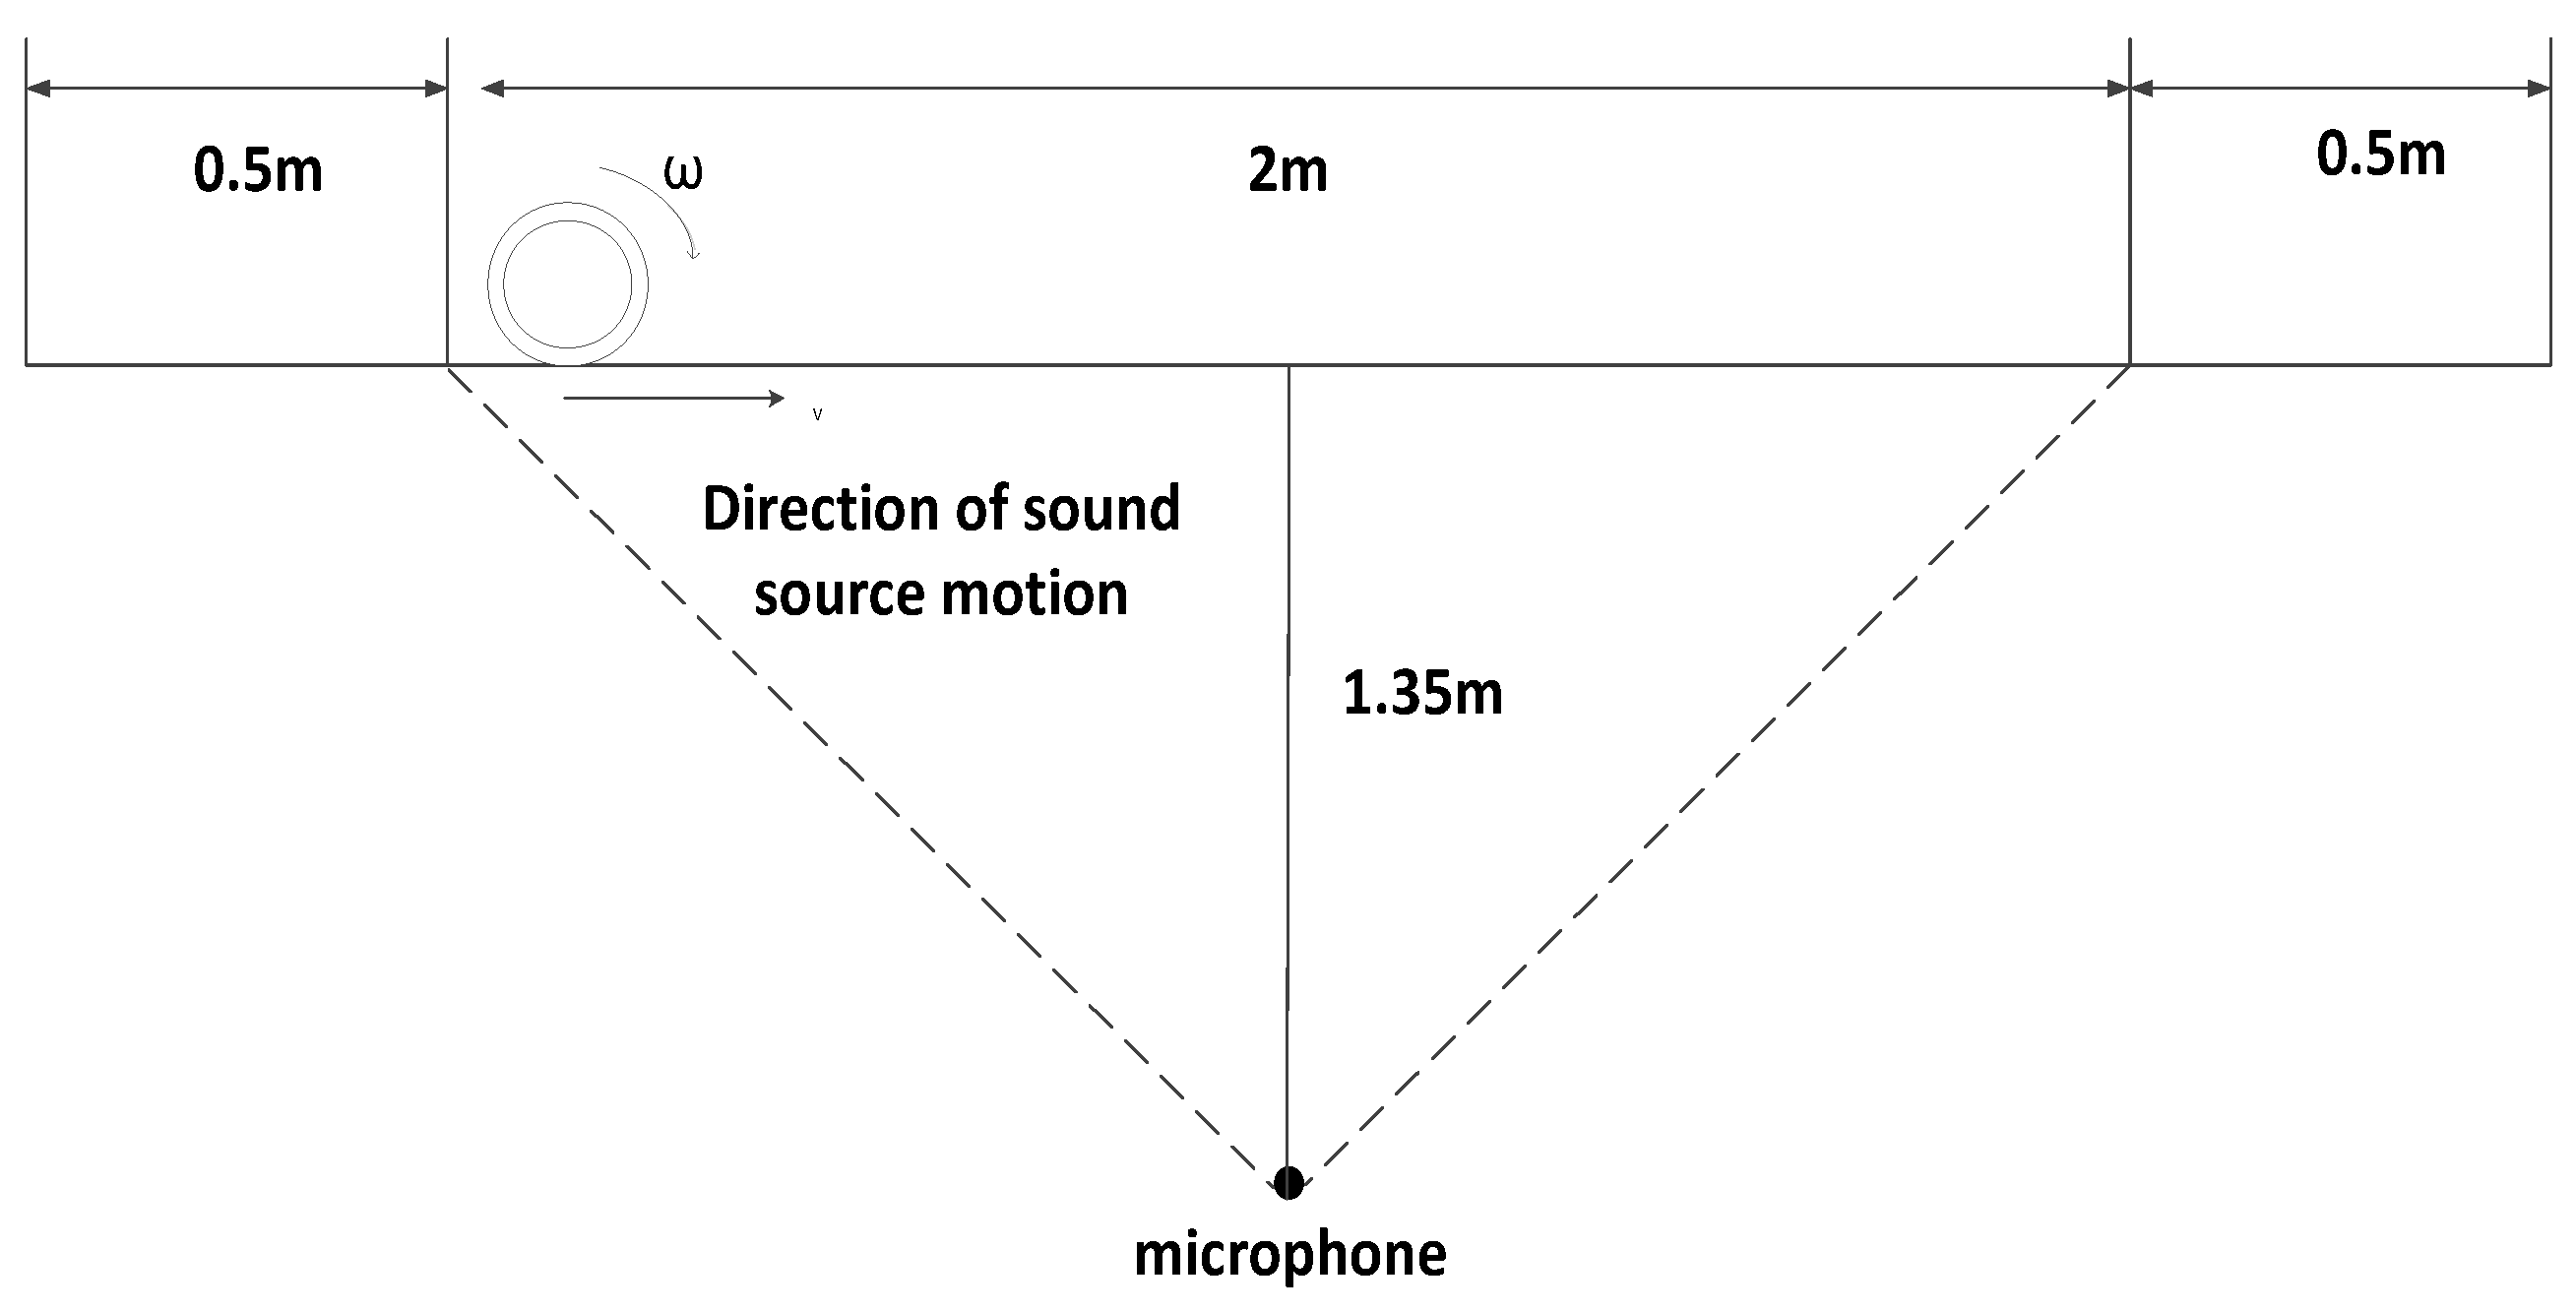
4.1. Trackside acoustic laboratory bench
4.2. Rolling bearing experiments and data analysis
4.3. Project example analysis
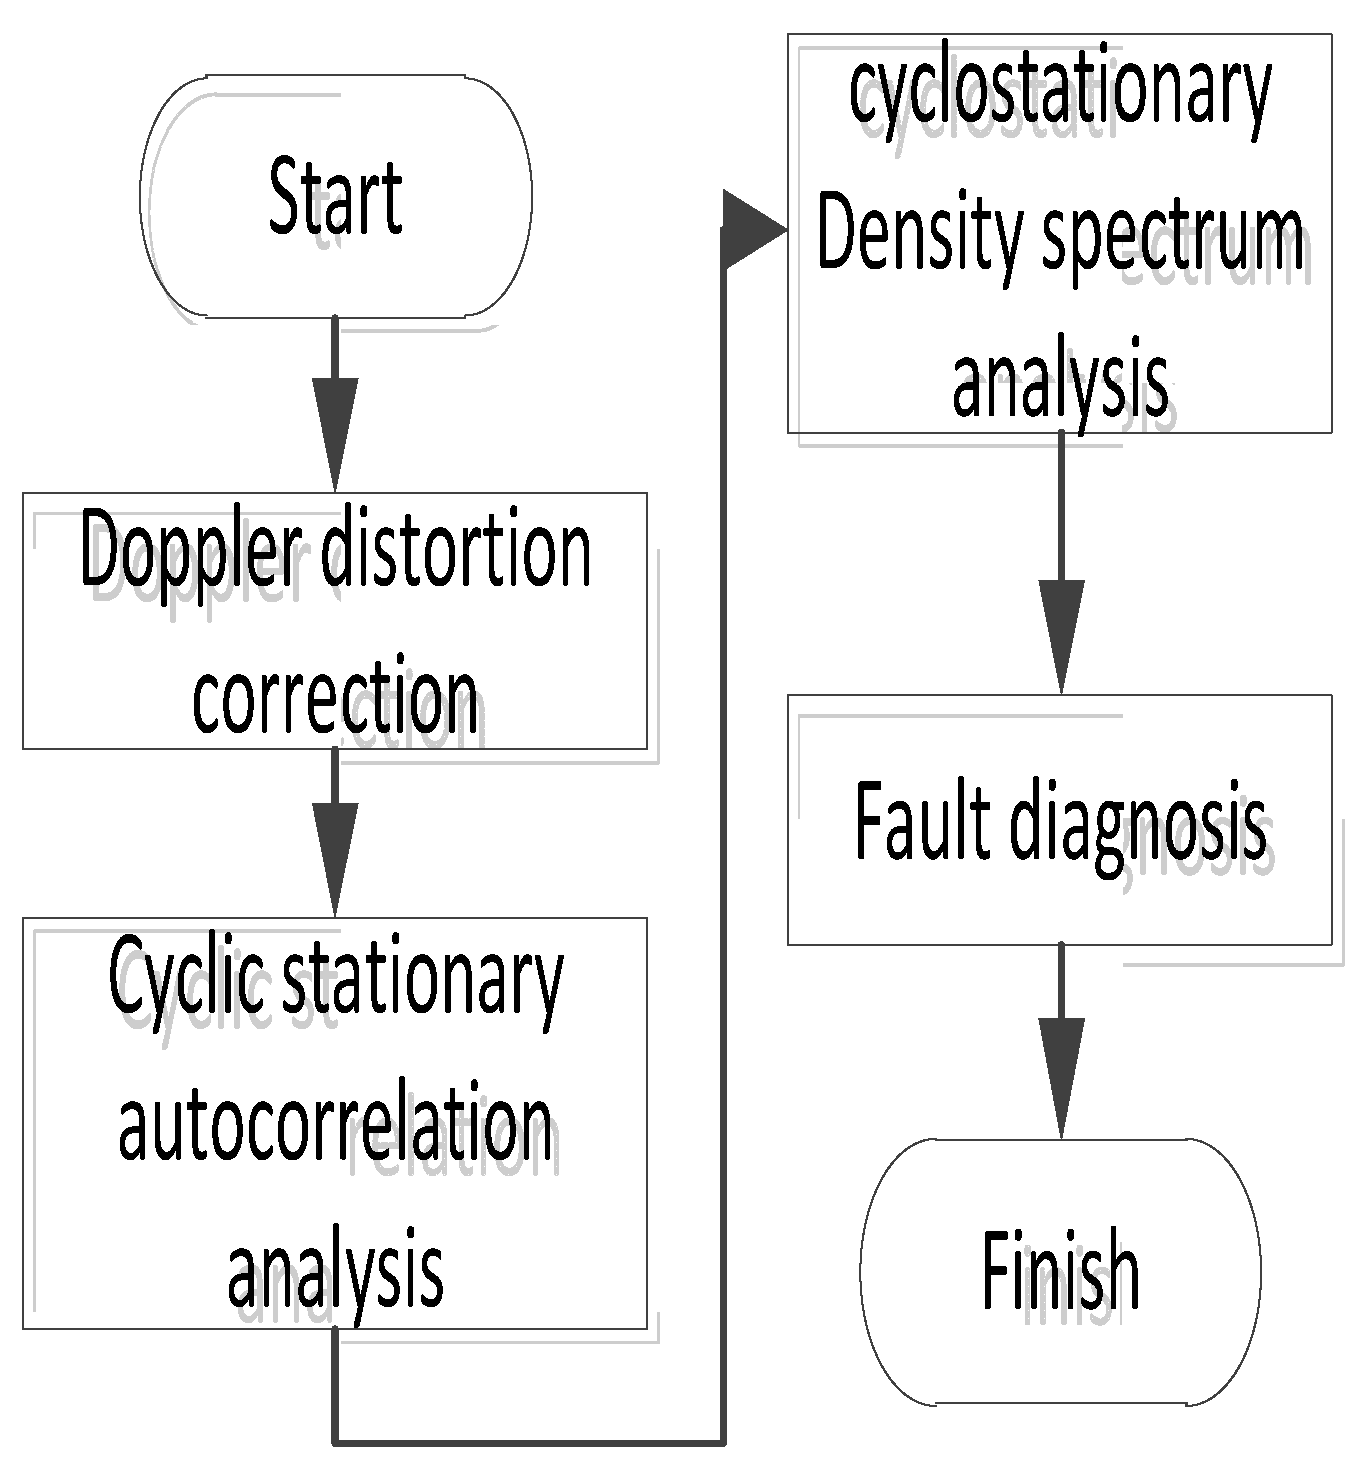
4.4. Bearing fault diagnosis step
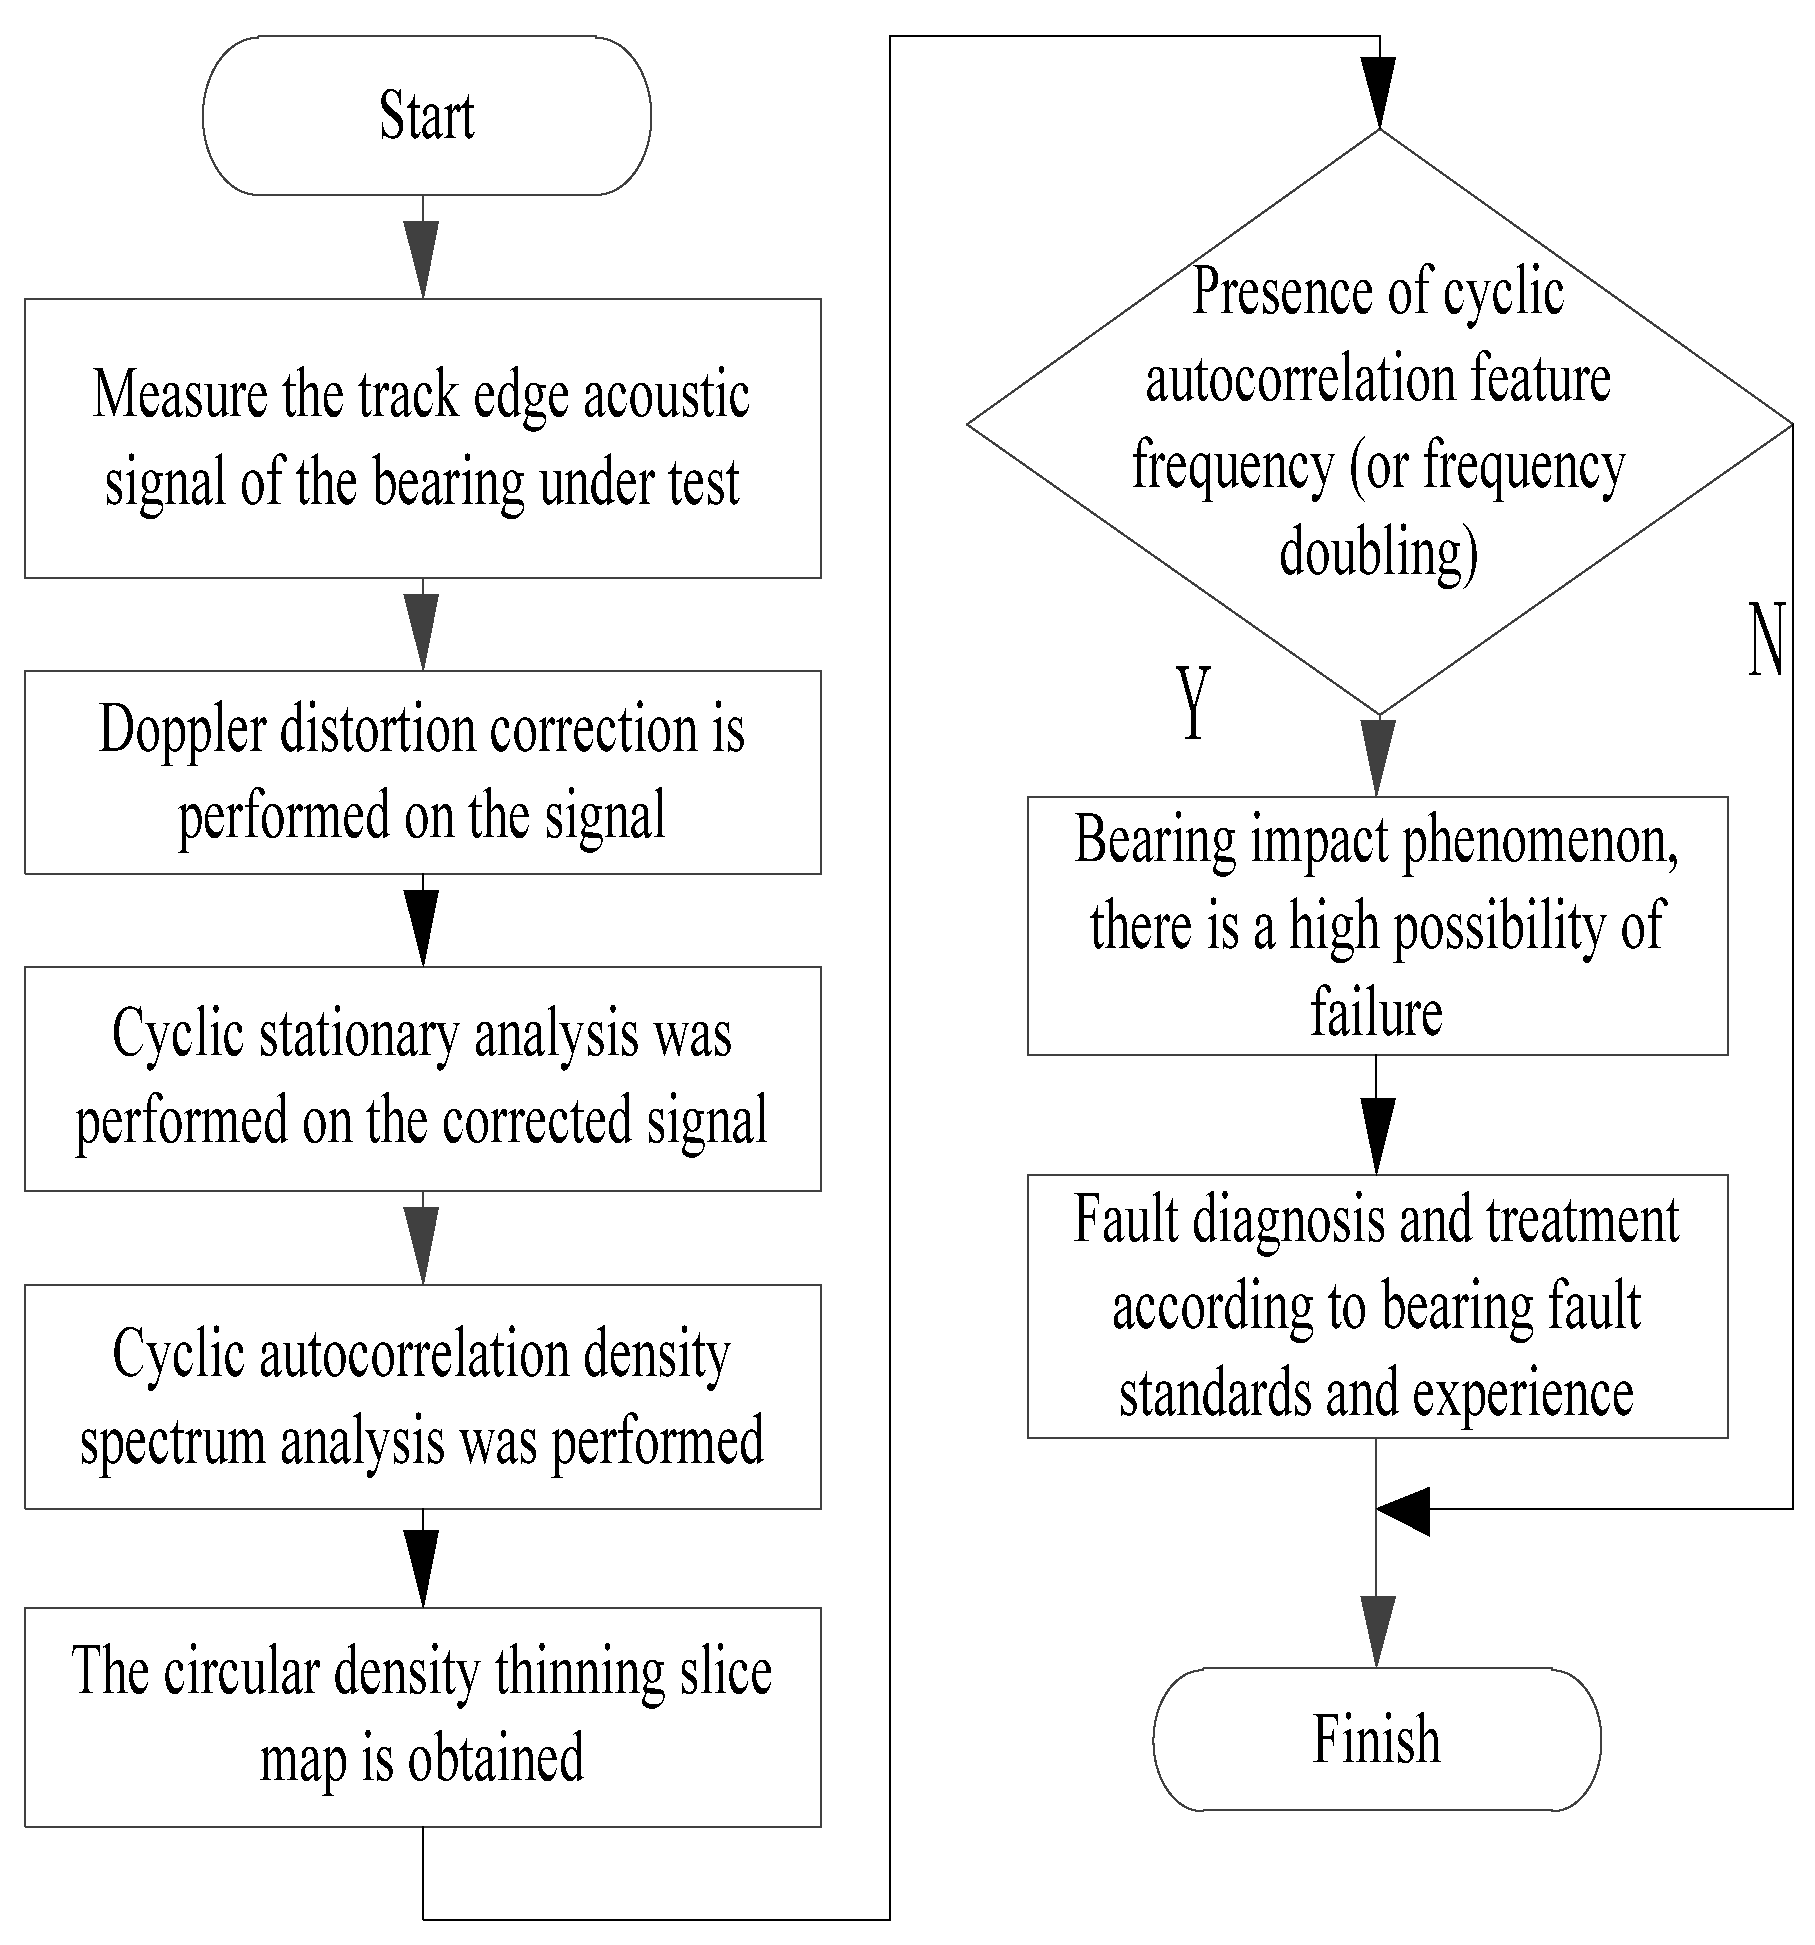
- The trackside acoustic signal of the bearing to be measured, primarily consisting of vibration and speed signals, is subject to measurement.
- The correction of Doppler distortion for acoustic signals received trackside.
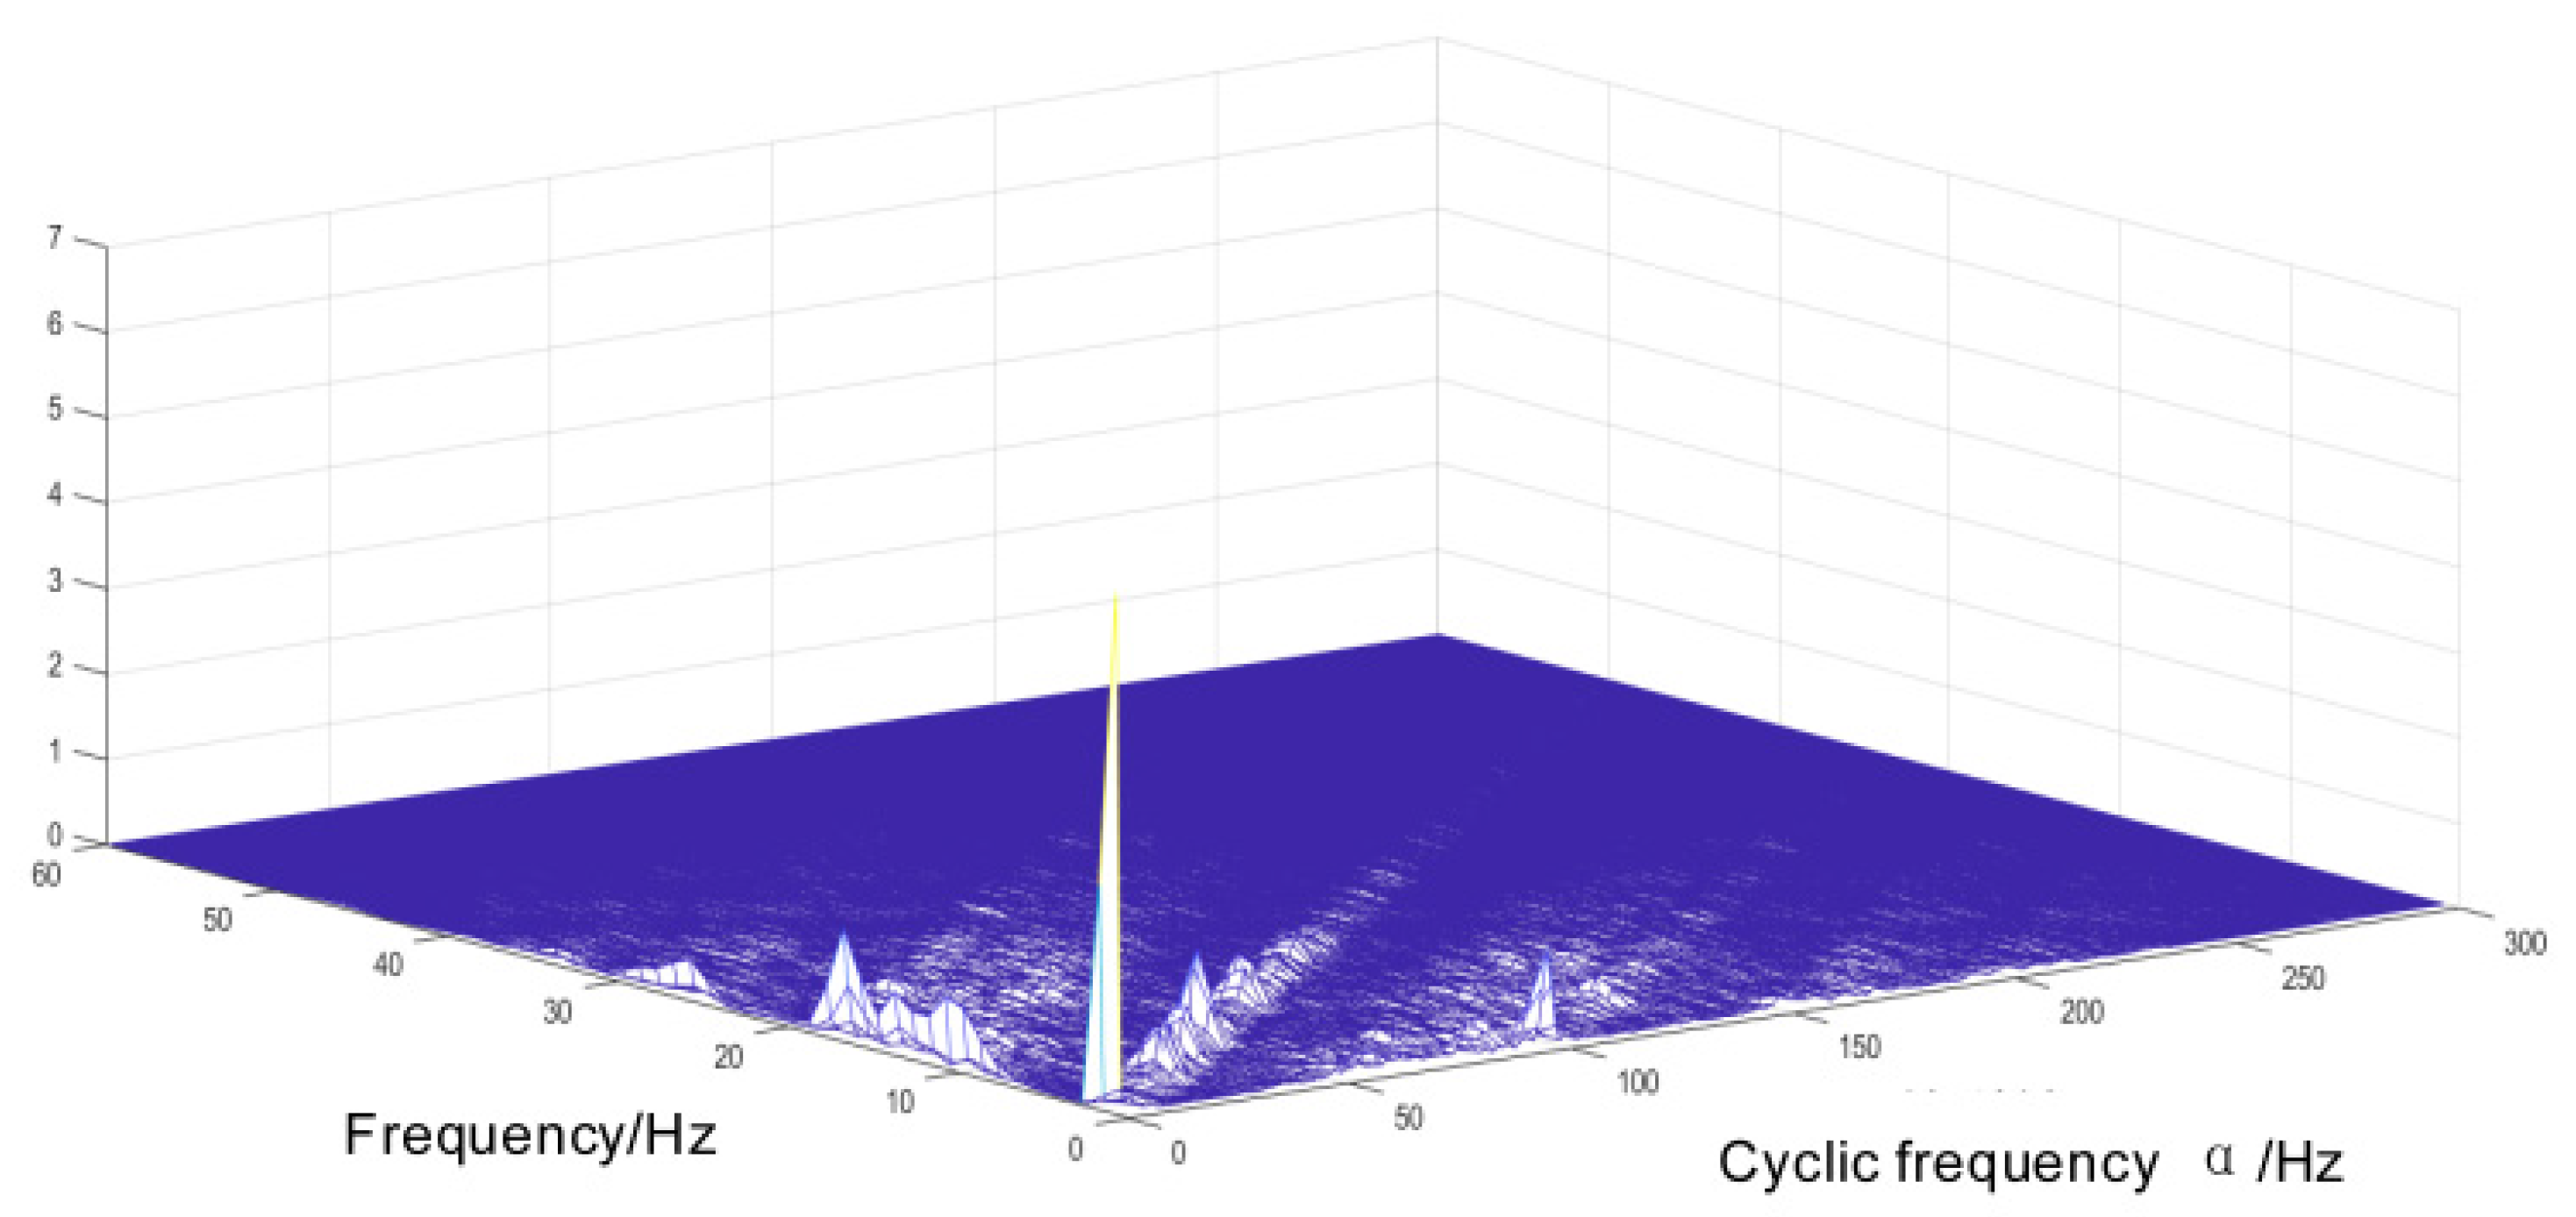
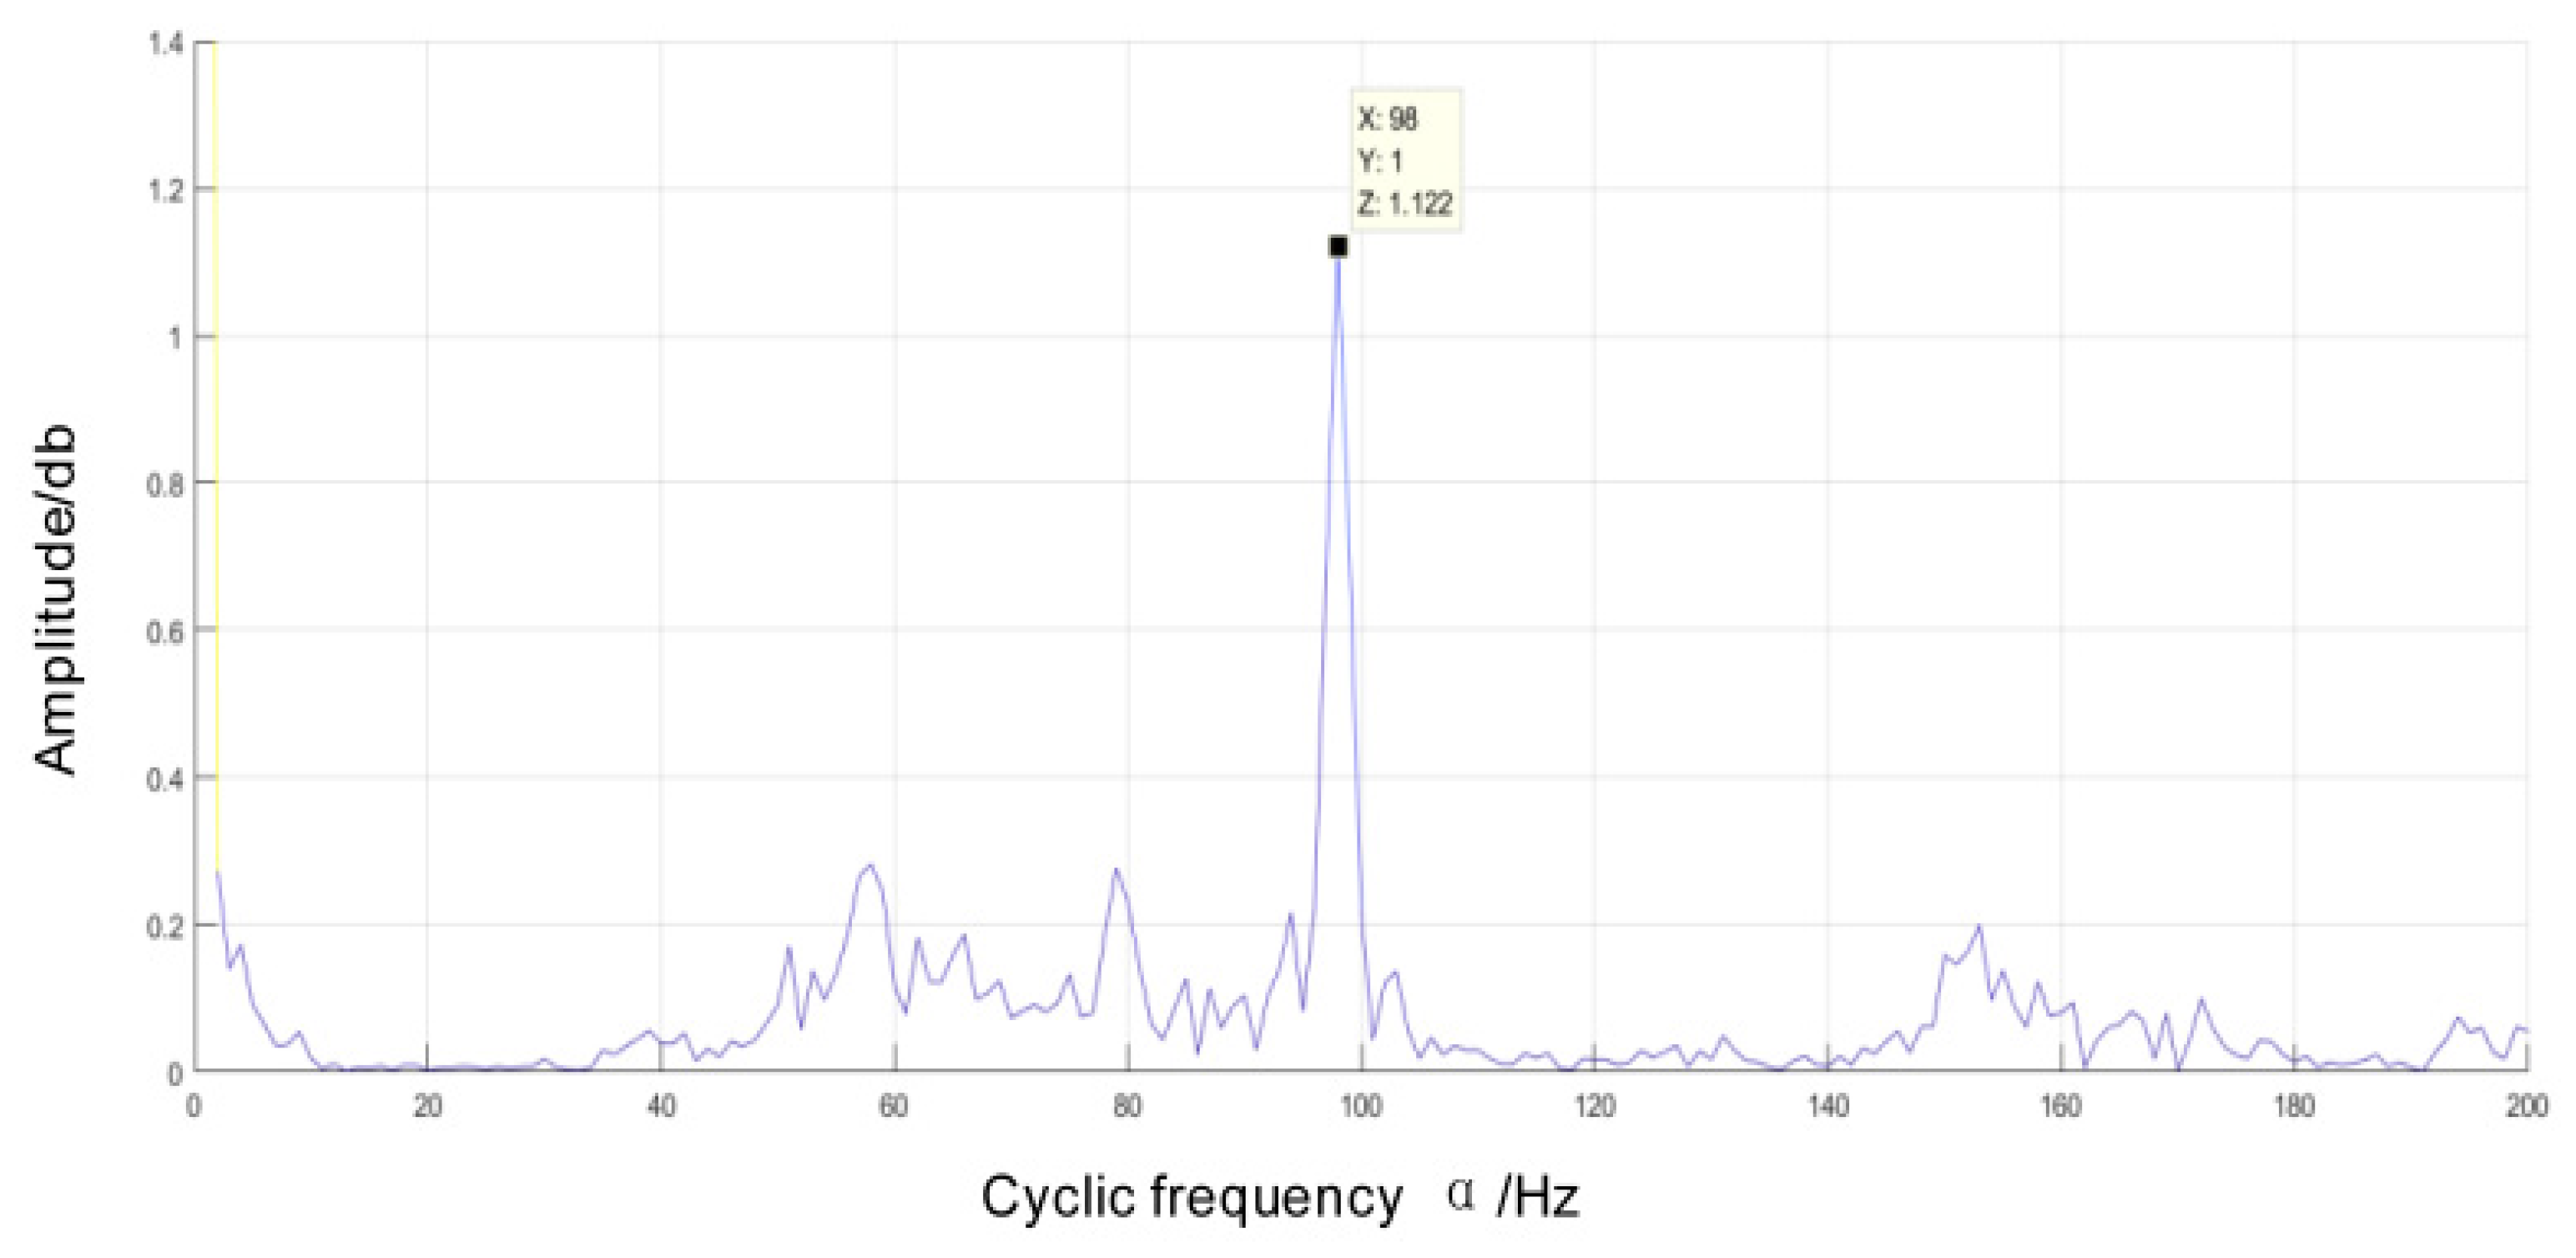
- The Doppler-corrected signal underwent cyclic smoothing analysis. Firstly, a cyclic autocorrelation analysis was conducted to obtain a spectrum of cyclic autocorrelation. Secondly, the spectrum of cyclic autocorrelation density was examined to refine it into a slice of cyclic density refinement in order to determine the presence of a characteristic frequency or its multiple in the cyclic autocorrelation. If such frequency exists, it indicates the occurrence of shock phenomenon in the bearing at that time and suggests an impending failure.
- The faults are assessed based on predetermined criteria for evaluating bearing faults and practical experience to determine their impact on the component’s operation. Subsequently, appropriate handling procedures are implemented.
5. Summary
Author Contributions
Funding
Data Availability Statement
Acknowledgments
Conflicts of Interest
References
- Sun, Y. Research on key technology of rolling bearing fault detection. Master’s Thesis, Harbin Engineering University of China: Harbin, China, 2019. [Google Scholar]
- Ouyang, K. Research on circular array short-time technique for train bearing wayside acoustic signal separation and distortion correction. Ph.D Thesis, University of Science and Technology of China, Hefei, China, 2018. [Google Scholar]
- Xia, J.; Liang, G. Trackside acoustic detector system (TADS) for rolling bearing of train. Harbin Bearing. 2005, 6, 3–4. [Google Scholar]
- Barke, D. Structural Health Monitoring in the Railway Industry: A Review. Structural Health Monitoring. 2005, 4, 81–93. [Google Scholar] [CrossRef]
- Choe, H.; Wan, Y.; Chan, A. Neural pattern identification of railroad wheel-bearing faults from audible acoustic signals: Comparison of FFT, CWT,and DWT features. Texas A&M Univ. 1997, 30, 480–496. [Google Scholar]
- Sneed, W.H.; Smith, R.L. On-board real-time railroad bearing defect detection and monitoring.Proceedings of the 1998 ASME/IEEE Joint Railroad Conference. 1998; pp. 149–153.
- Southern, C.; Rennison, D.; Kopke, U. RailBAM: an advanced bearing acoustic monitor: Initial operational performance results. Core New Horizons for Rail. 2004, 23, 1–7. [Google Scholar]
- Snell; Nairne. Acoustic bearing monitoring, the future RCM 2008.4th IET International Conference on Railway Condition Monitoring. 2008; pp. 32–47.
- Zhang, S. Research on time-varying array analysis of fault spectrum identification in trackside acoustic diagnosis of train bearing. Ph.D Thesis, University of Science and Technology of China, Hefei, China, 2017. [Google Scholar]
- Zhang, A.; Hu, F.; Shen, C. Doppler distortion removal based on energy centrobaric method for wayside fault diagnosis of train bearings by acoustic signals. Vibration and Shock 2014, 33, 17–19. [Google Scholar]
- Liu, F.; Hou, C.; Zhai, T. An adaptive correction method for Doppler distorted signal of moving sound source. Journal of Acoustics. 2022, 47, 820–831. [Google Scholar]
- Zhang, H.; Lu, S.; He, Q. Fake time-frequency analysis of acoustic signals with Doppler distortion and its correction. Vibration and Shock 2016, 35, 14–20. [Google Scholar]
- Li, Q. Application research on new methods of non-stationary signal feature extraction and diagnosis techniques. Master’s Thesis, Tianjin University of China, Tianjin, China, 2005. [Google Scholar]
- Bennett, W.R. Statistics of Regenerative Digital Transmission. Bell System Technical Journal 1958, 37, 1501–1542. [Google Scholar] [CrossRef]
- Gardner, W.A.; Franks, L. Characterization of cyclostationary random signal processes. IEEE Transactions on Information Theory 1975, 21, 4–14. [Google Scholar] [CrossRef]
- Gardner, W.A. Signal interception: a unifying theoretical framework for feature detection. IEEE Transactions on Communications 1988, 36, 897–906. [Google Scholar] [CrossRef]
- Bonnardot, F.; Randall, R.B.; Guillet, F. Extractio of second-order cyclostationary sources—Application to vibration analysis. Mechanical Systems and Signal Processing 2005, 9, 1230–1244. [Google Scholar] [CrossRef]
- Leonardi, R.; Signoroni, A. Cyclostationary error analysis and filter properties in a 3D wavelet coding framework. Signal Processing: Image Communication 2006, 21, 653–675. [Google Scholar] [CrossRef]
- Hanson, D.; Randall, R.B.; Antoni, J.; Thompson, D.J.; Waters, T.P.; Ford, R.a.J. Cyclostationarity and the cepstrum for operational modal analysis of mimo systems—Part I: Modal parameter identification. Mechanical Systems and Signal Processing 2007, 21, 2441–2458. [Google Scholar] [CrossRef]
- Boustany, R.; Antoni, J. Blind extraction of a cyclostationary signal using reduced-rank cyclic regression—A unifying approach. Mechanical Systems and Signal Processing 2008, 22, 520–541. [Google Scholar] [CrossRef]
- Bouaynaya, N.; Schonfeld, D. Nonstationary Analysis of Coding and Noncoding Regions in Nucleotide. J. Sel. Topics Signal Processing 2008, 3. [Google Scholar] [CrossRef]
- Urbanek, J.; Barszcz, T.; Antoni, J. Time–frequency approach to extraction of selected second-order cyclostationary vibration components for varying operational conditions. Measurement 2013, 46, 1454–1463. [Google Scholar] [CrossRef]
- Guo, X. Trackside acoustic signal Doppler correction and acoustic detection platform system design. Master’s Thesis, Dalian Jiaotong University of China, Dalian, China, 2021. [Google Scholar]
- Zhao, X. Study on fault diagnosis of rolling bearing based on angle-domain cyclostationary. Ph.D Thesis, M Dalian Jiaotong University, Dalian, China, 2017. [Google Scholar]
- Liu, F. Research on wayside acoustical fault diagnosis for train-wheel bearings when the train is running at a non-uniform velocity. Ph.D Thesis, University of Science and Technology of China, Hefei, China, 2014. [Google Scholar]
- Wu, Q.; Kong, F.; He, Q. Doppler shift correction for acoustic signals using resampling technique. Signal Processing 2012, 28, 1308–1313. [Google Scholar]
- Han, Y. Design of experimental platform for trackside acoustic detection based on LabVIEW. Master’s Thesis, Dalian Jiaotong University of China, Dalian, China, 2022. [Google Scholar]
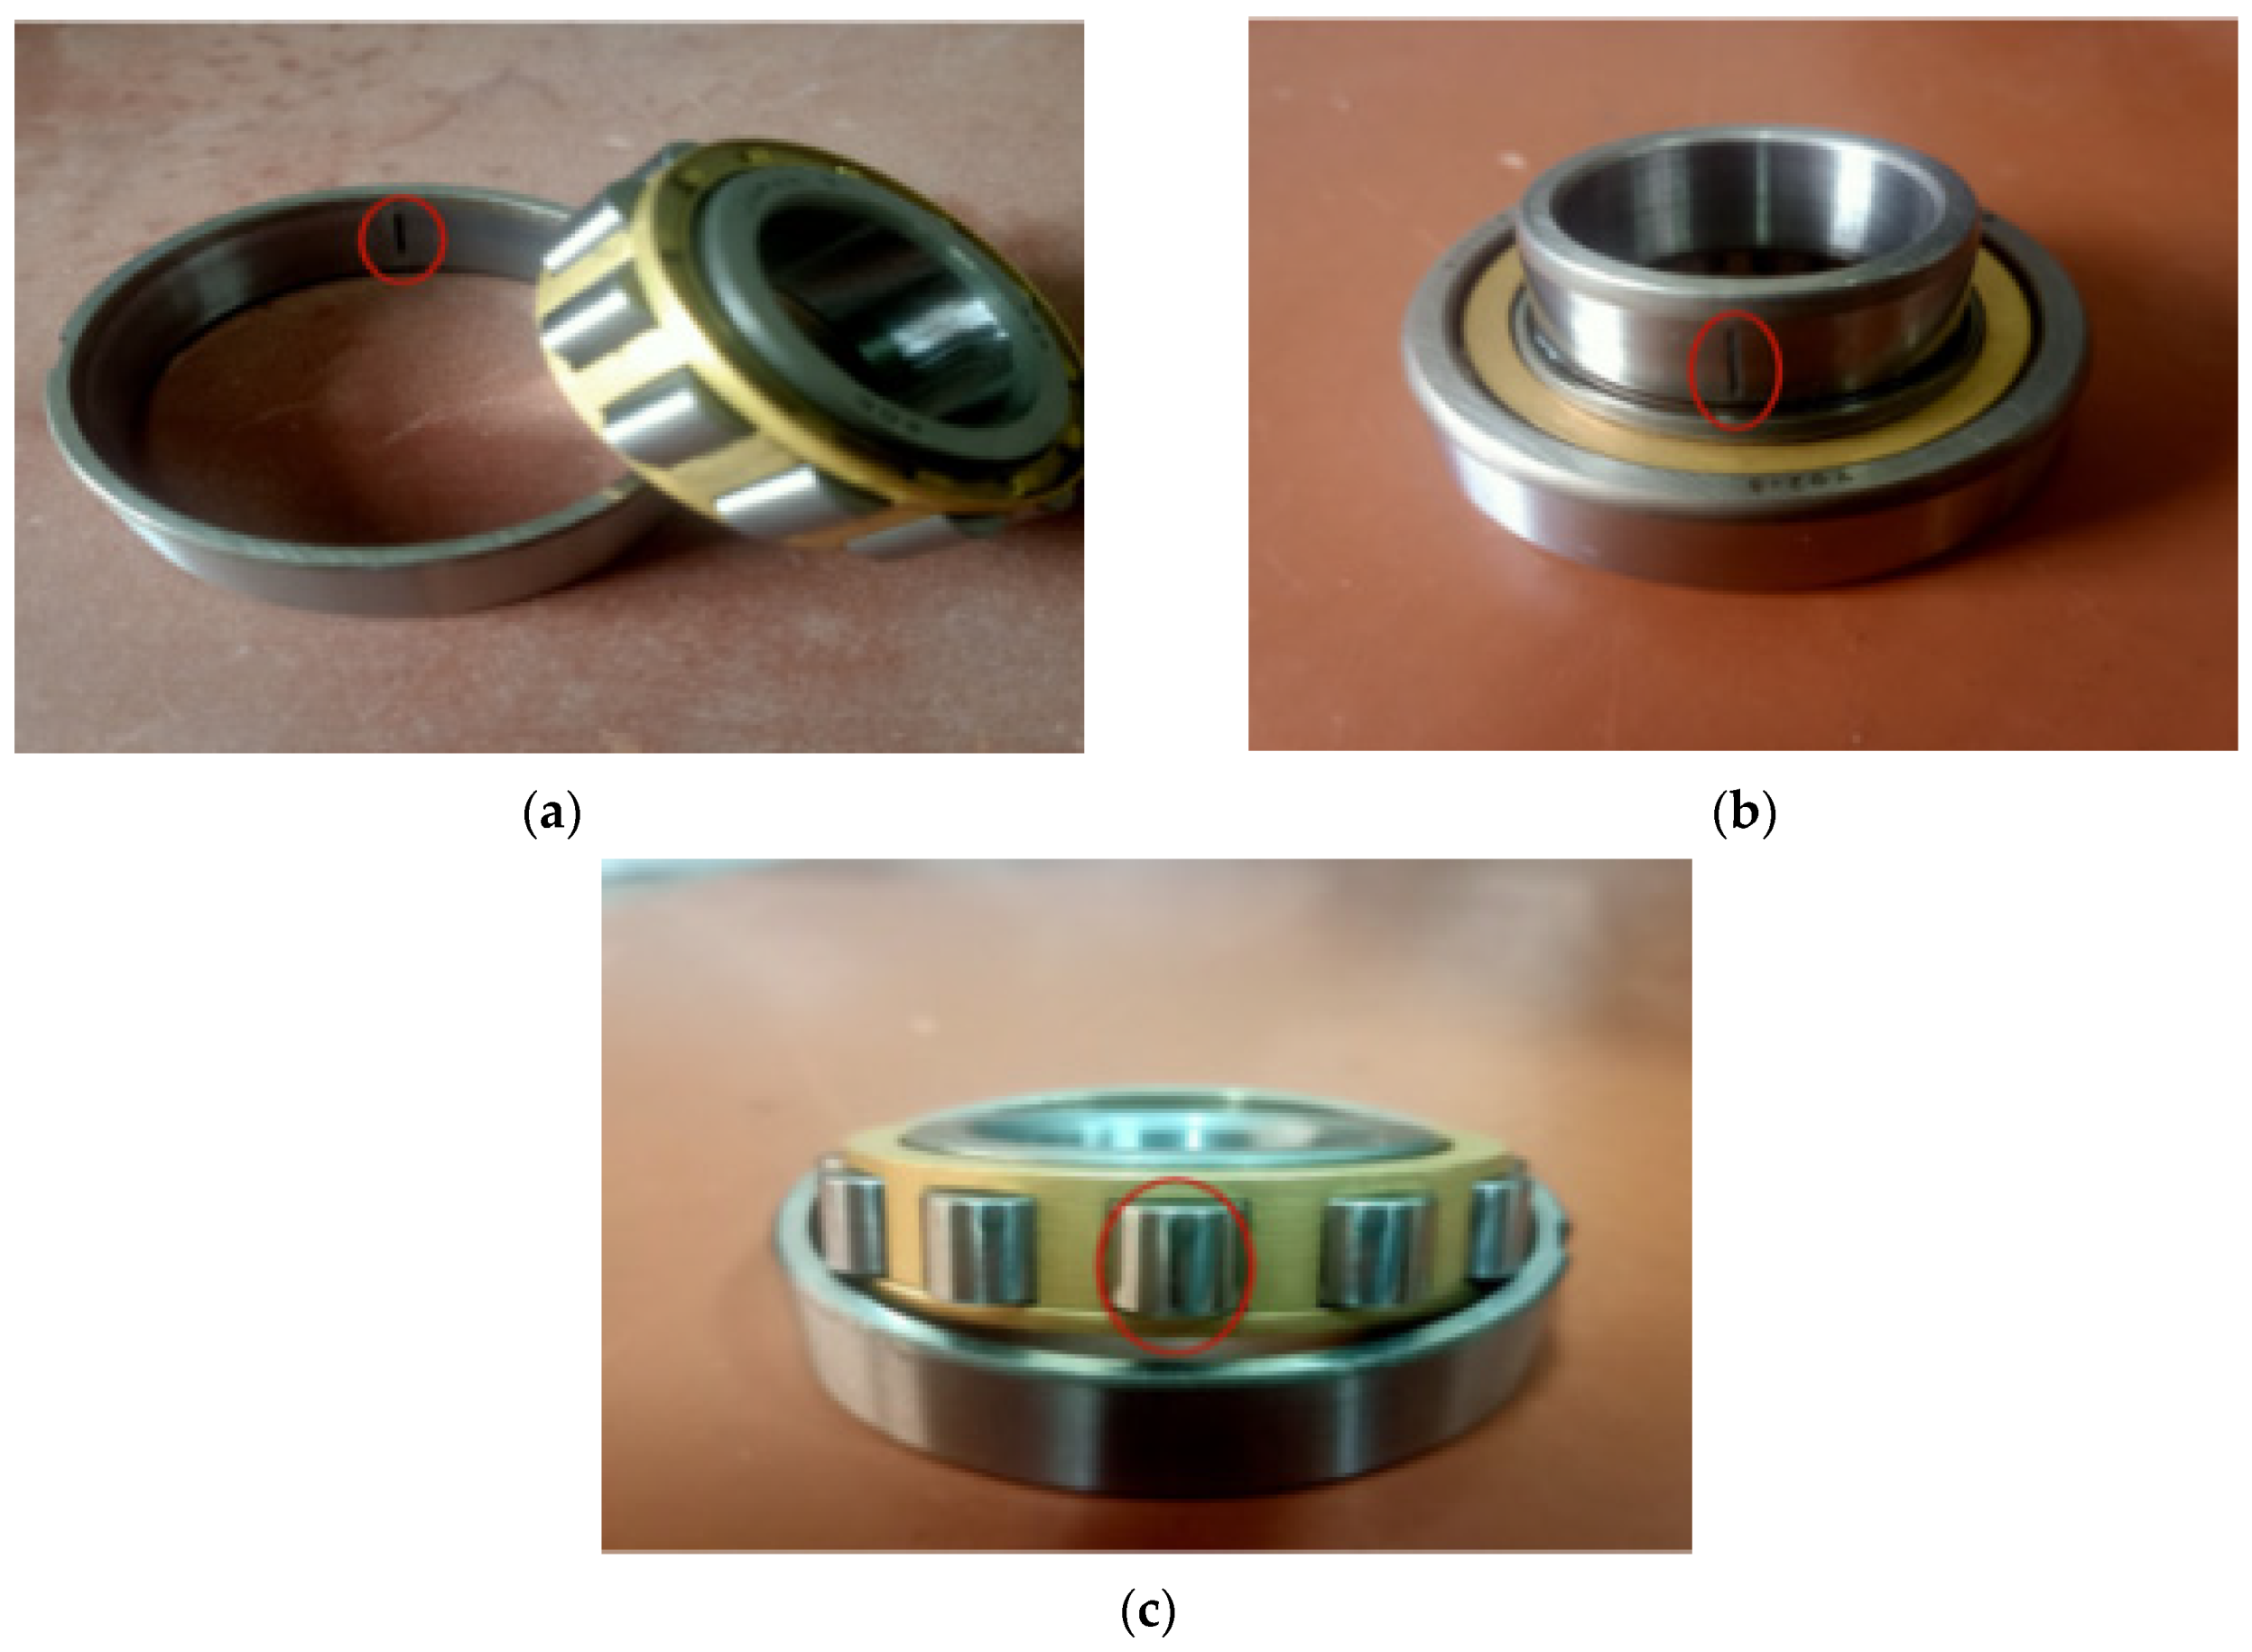
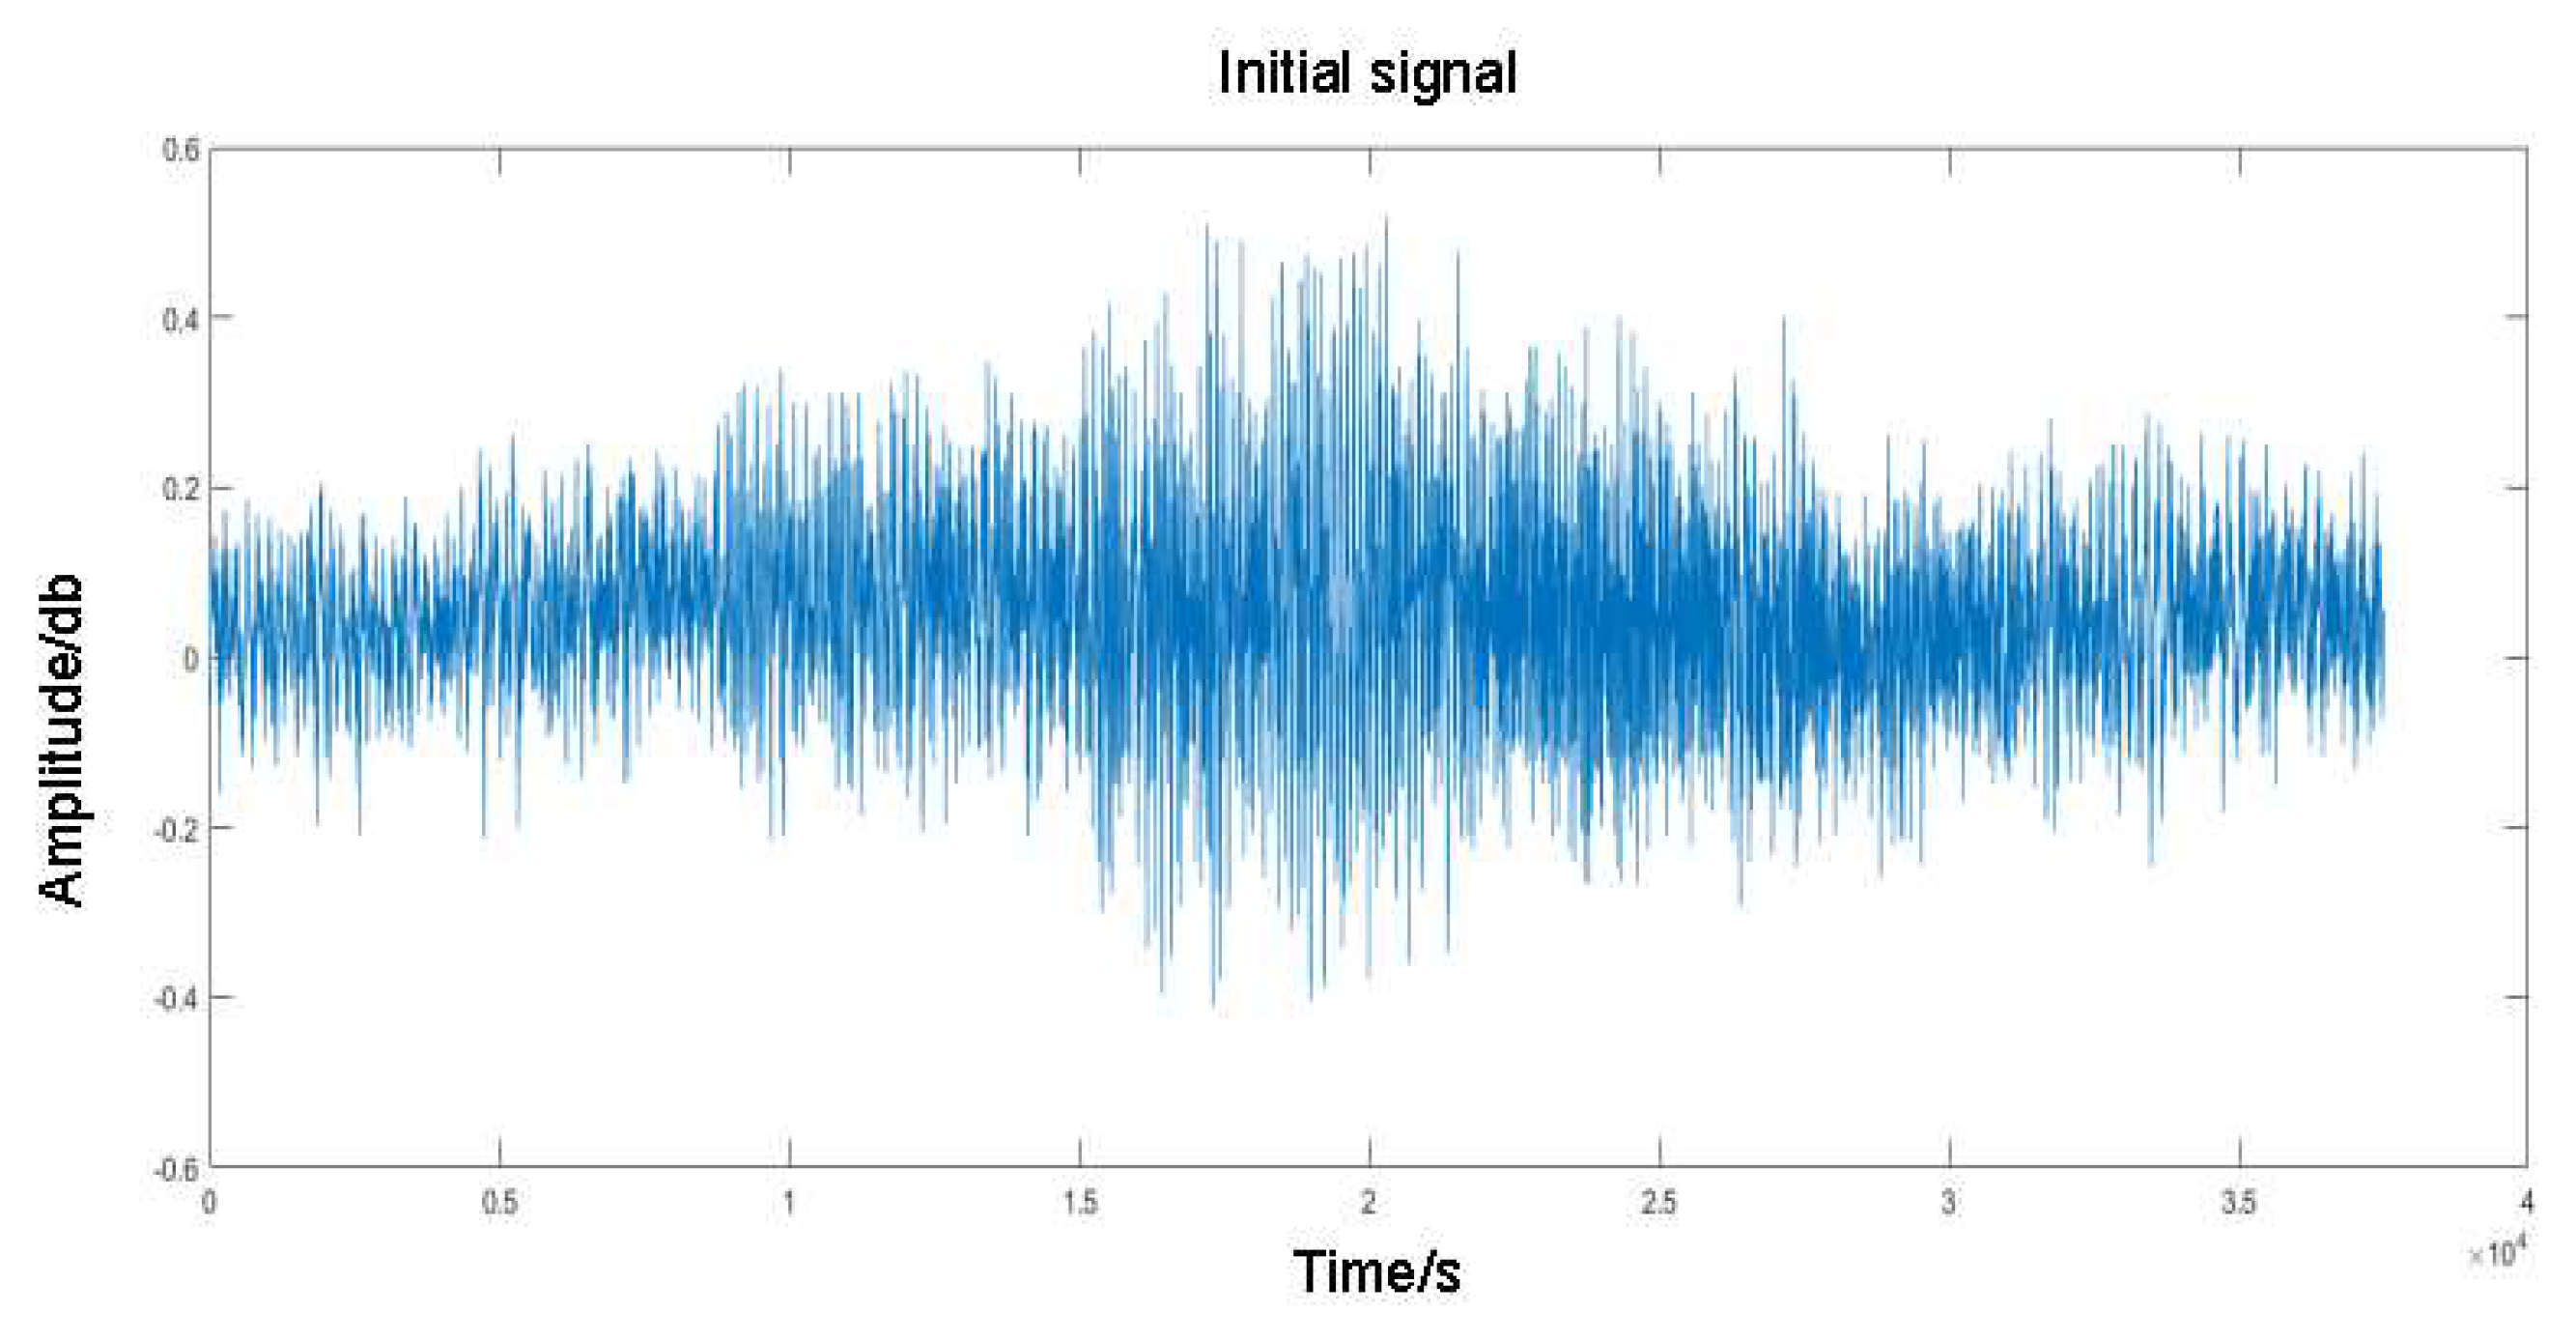
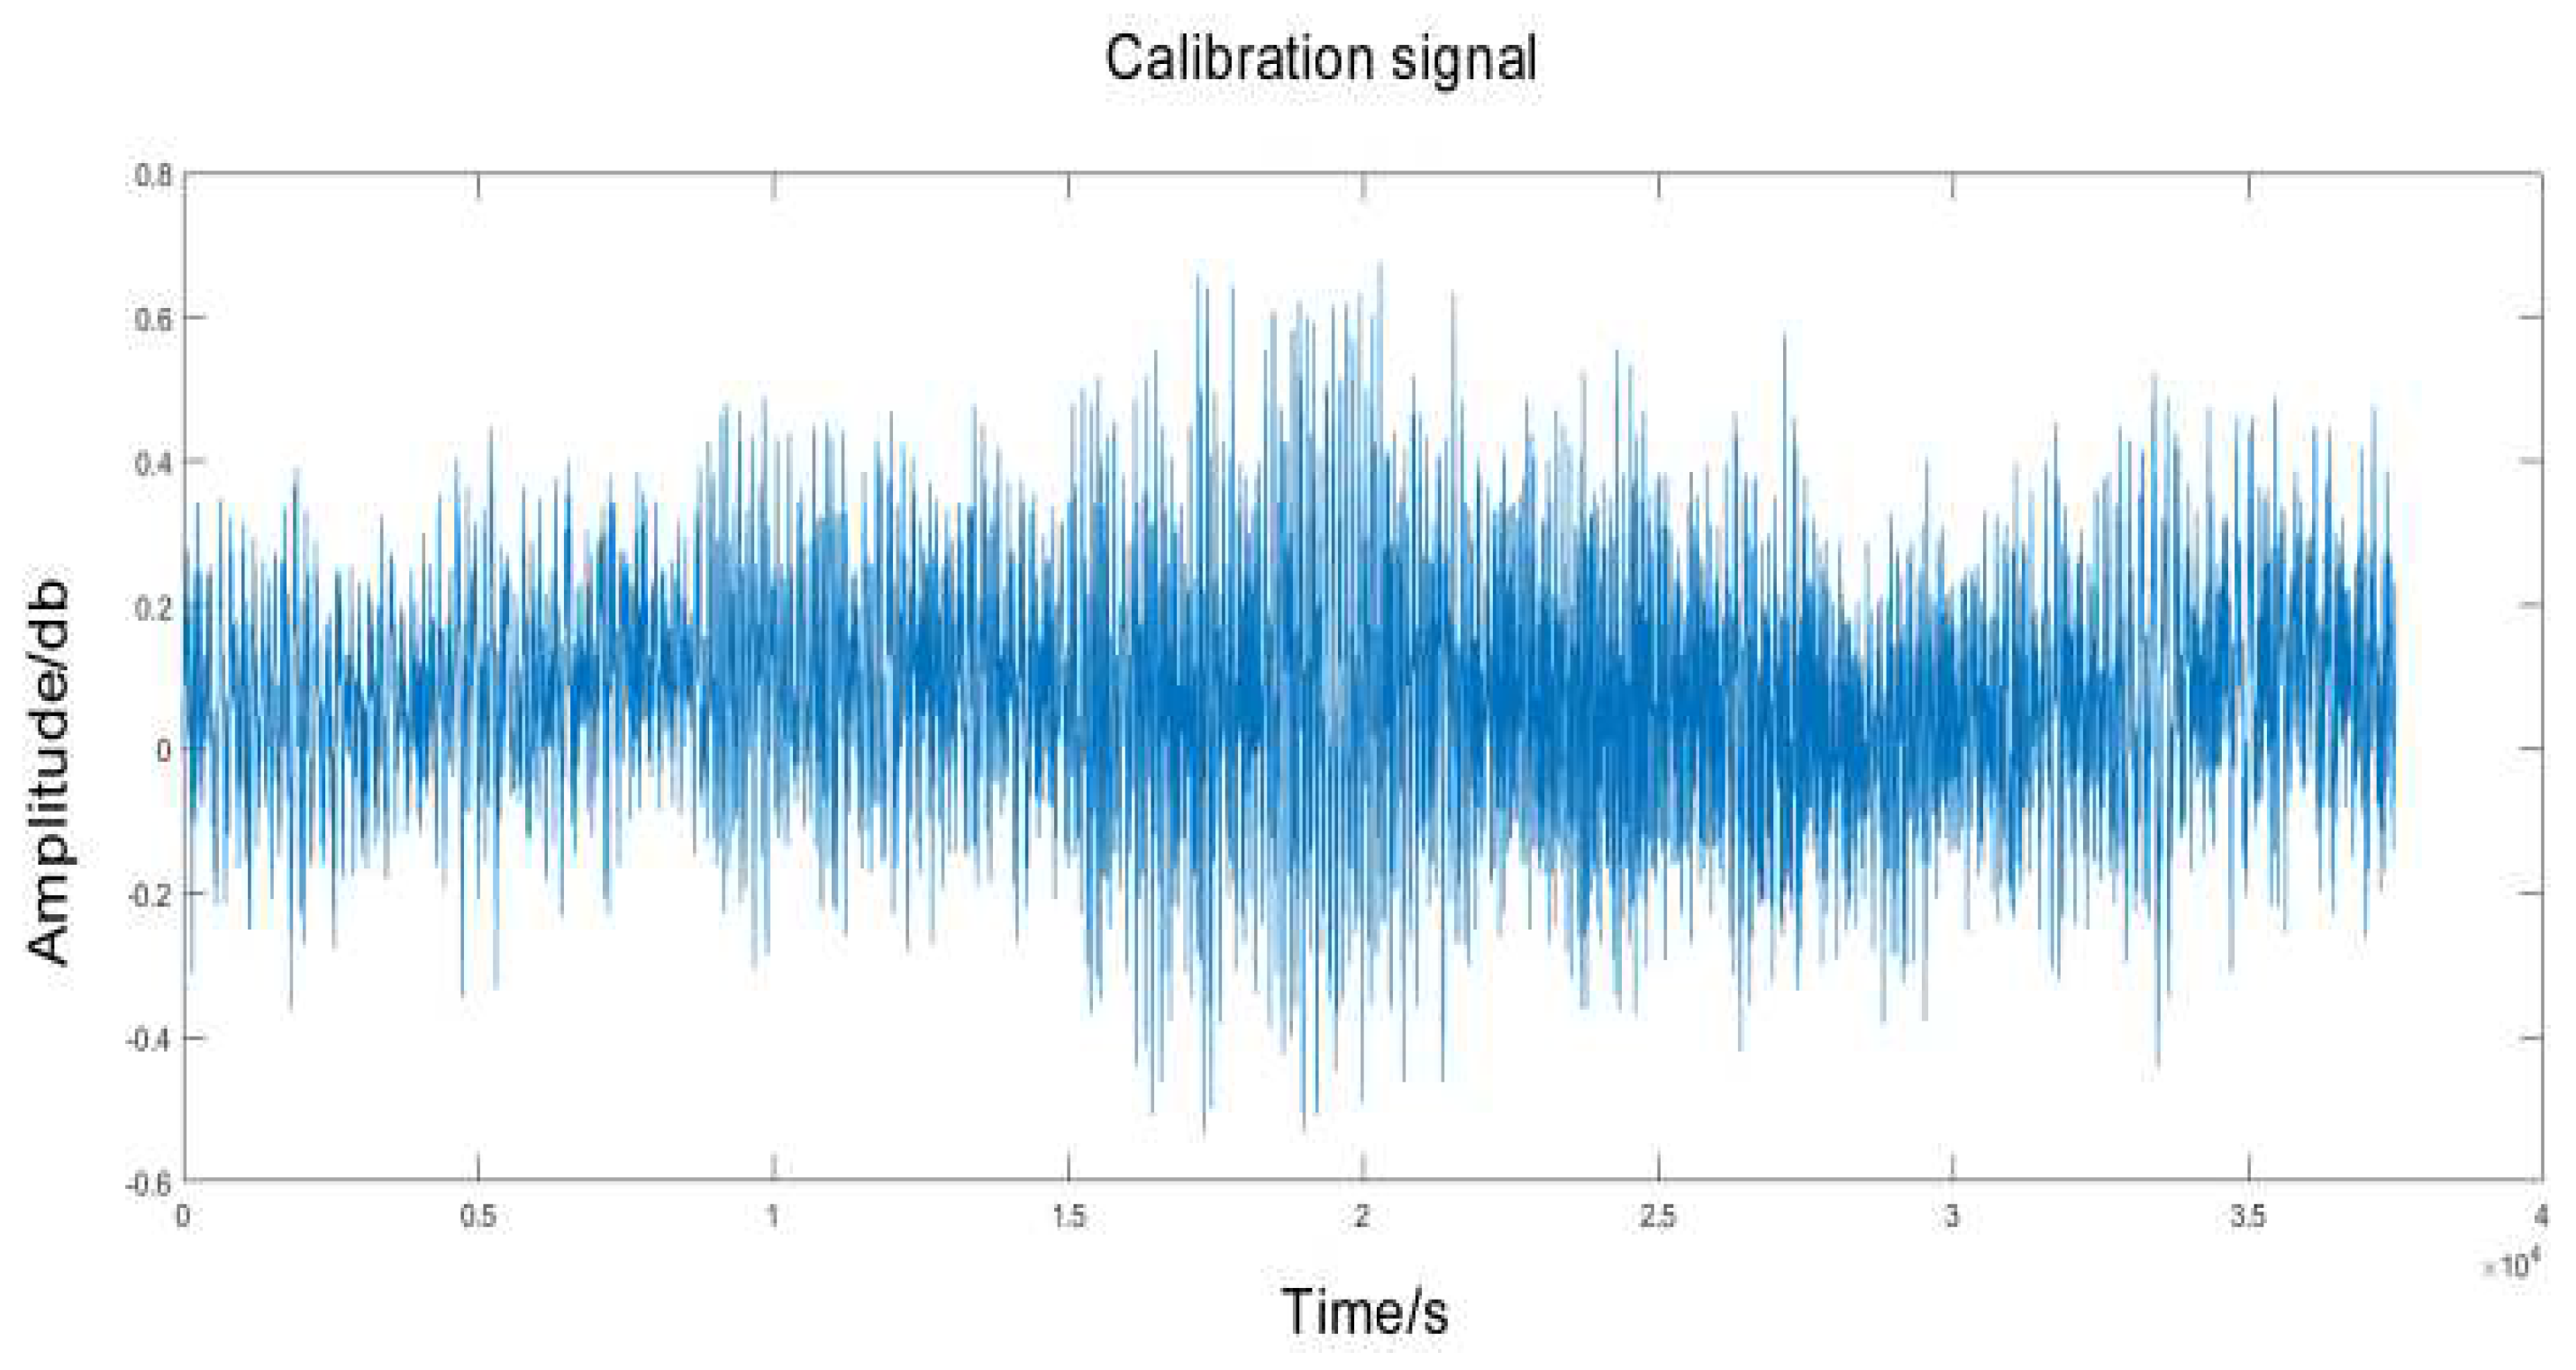
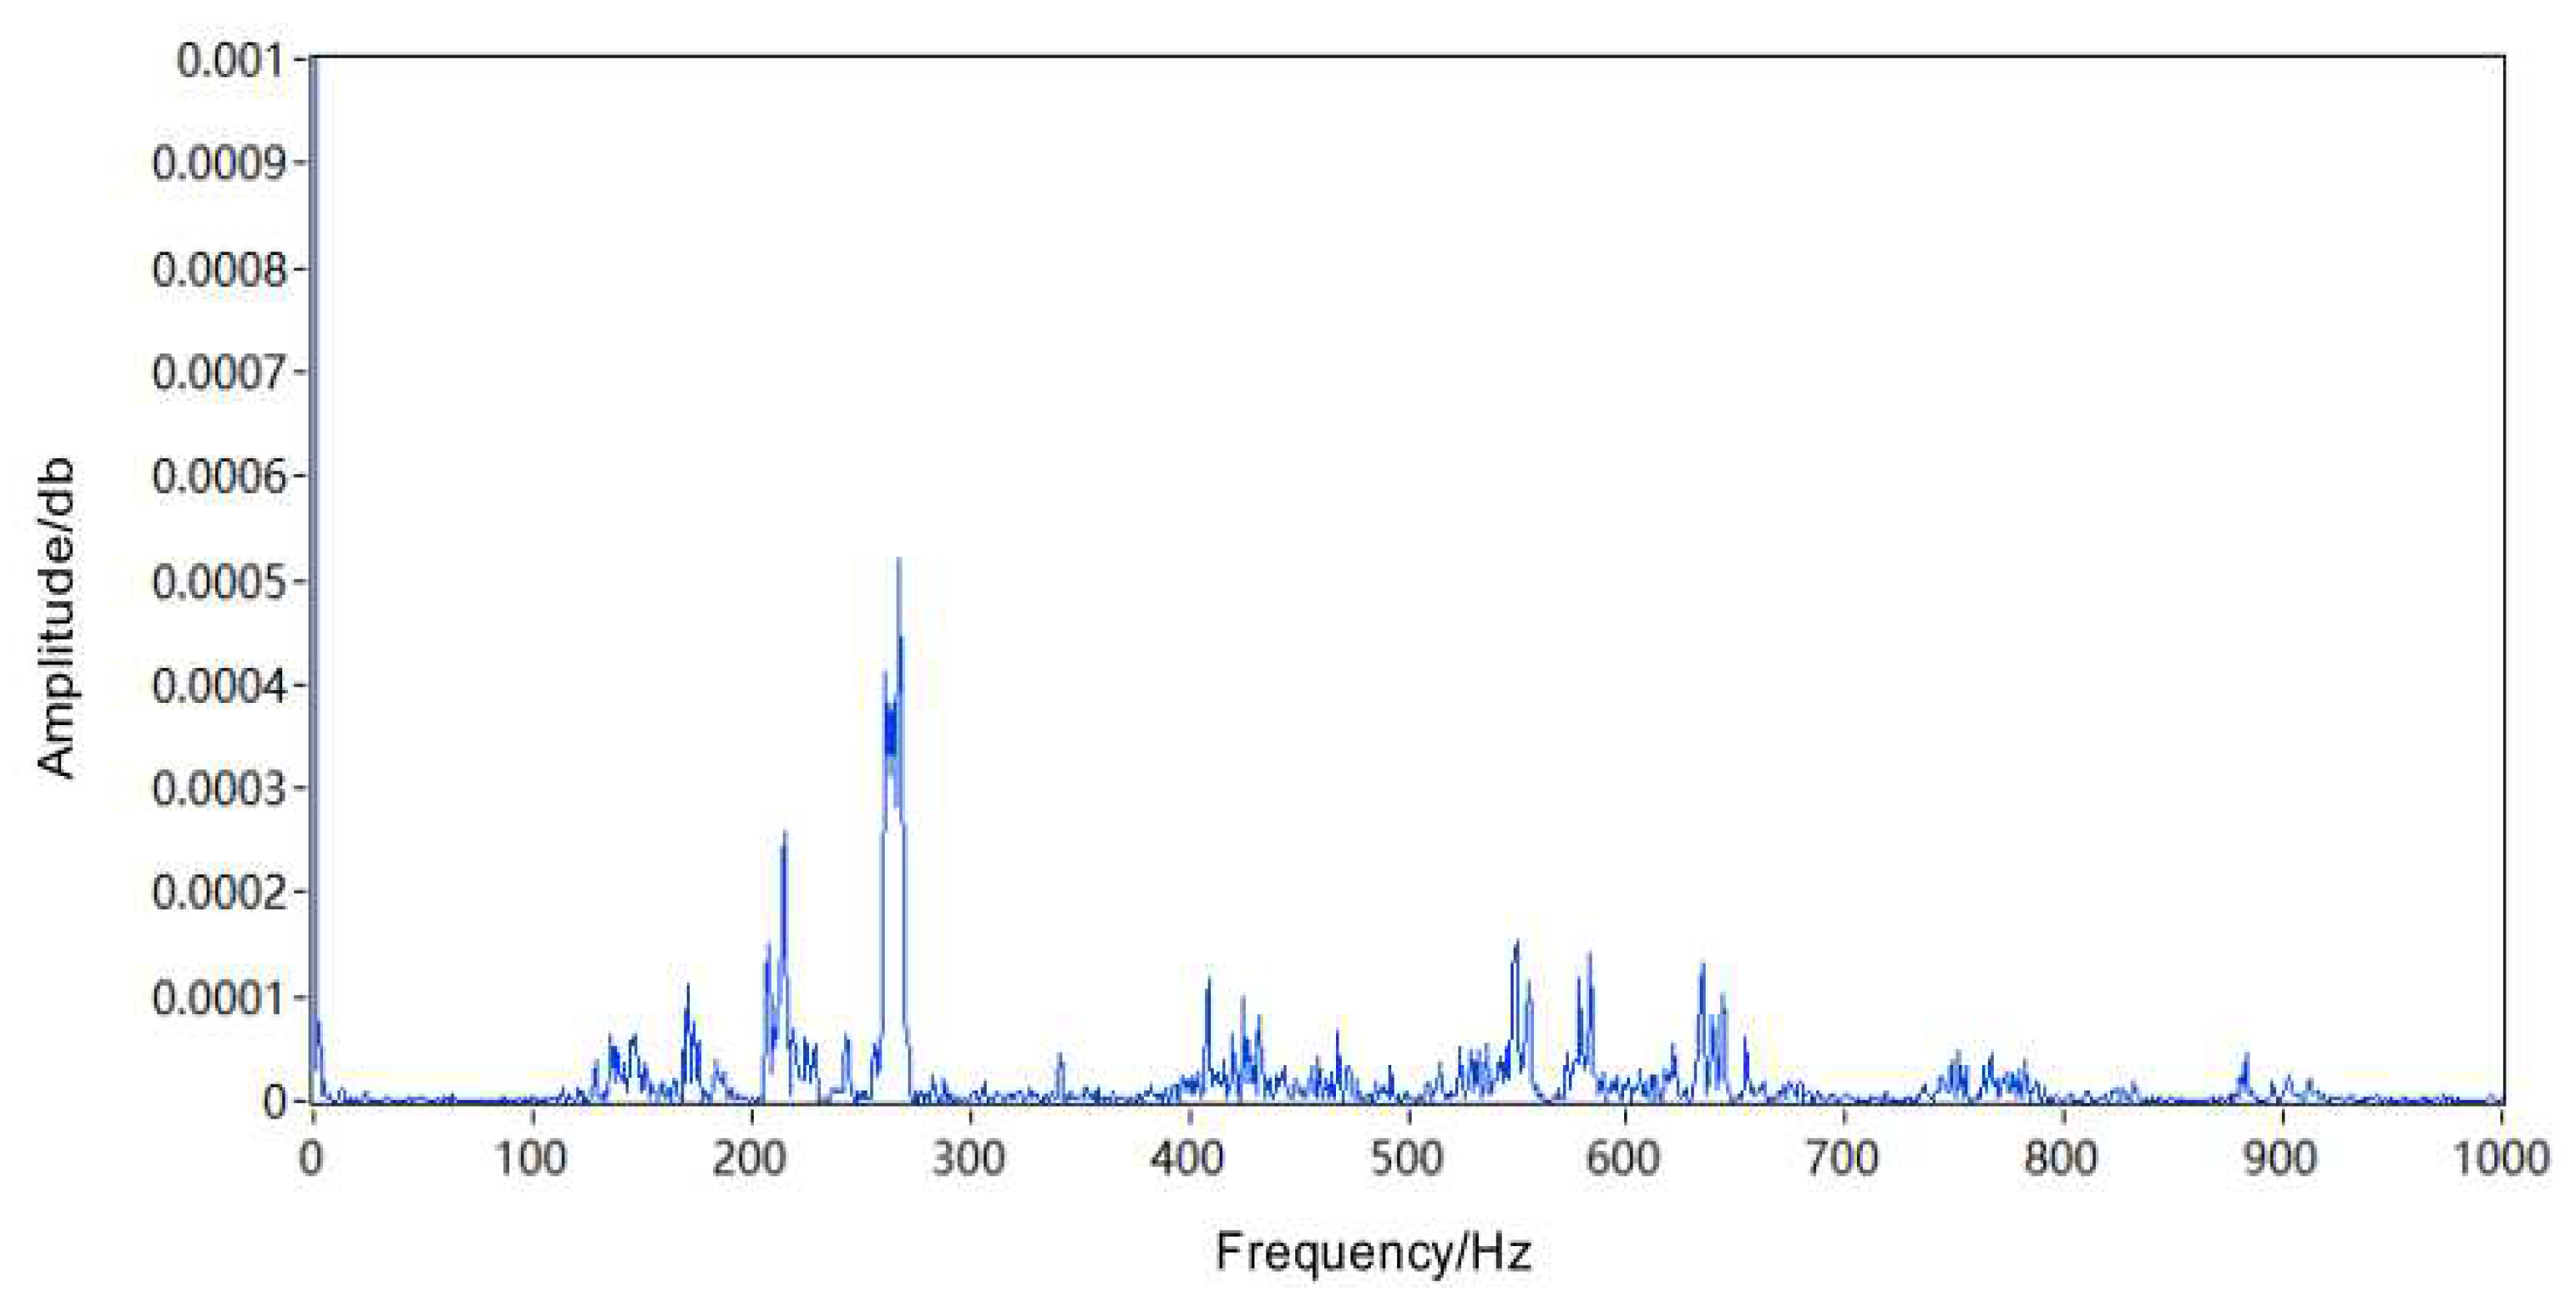
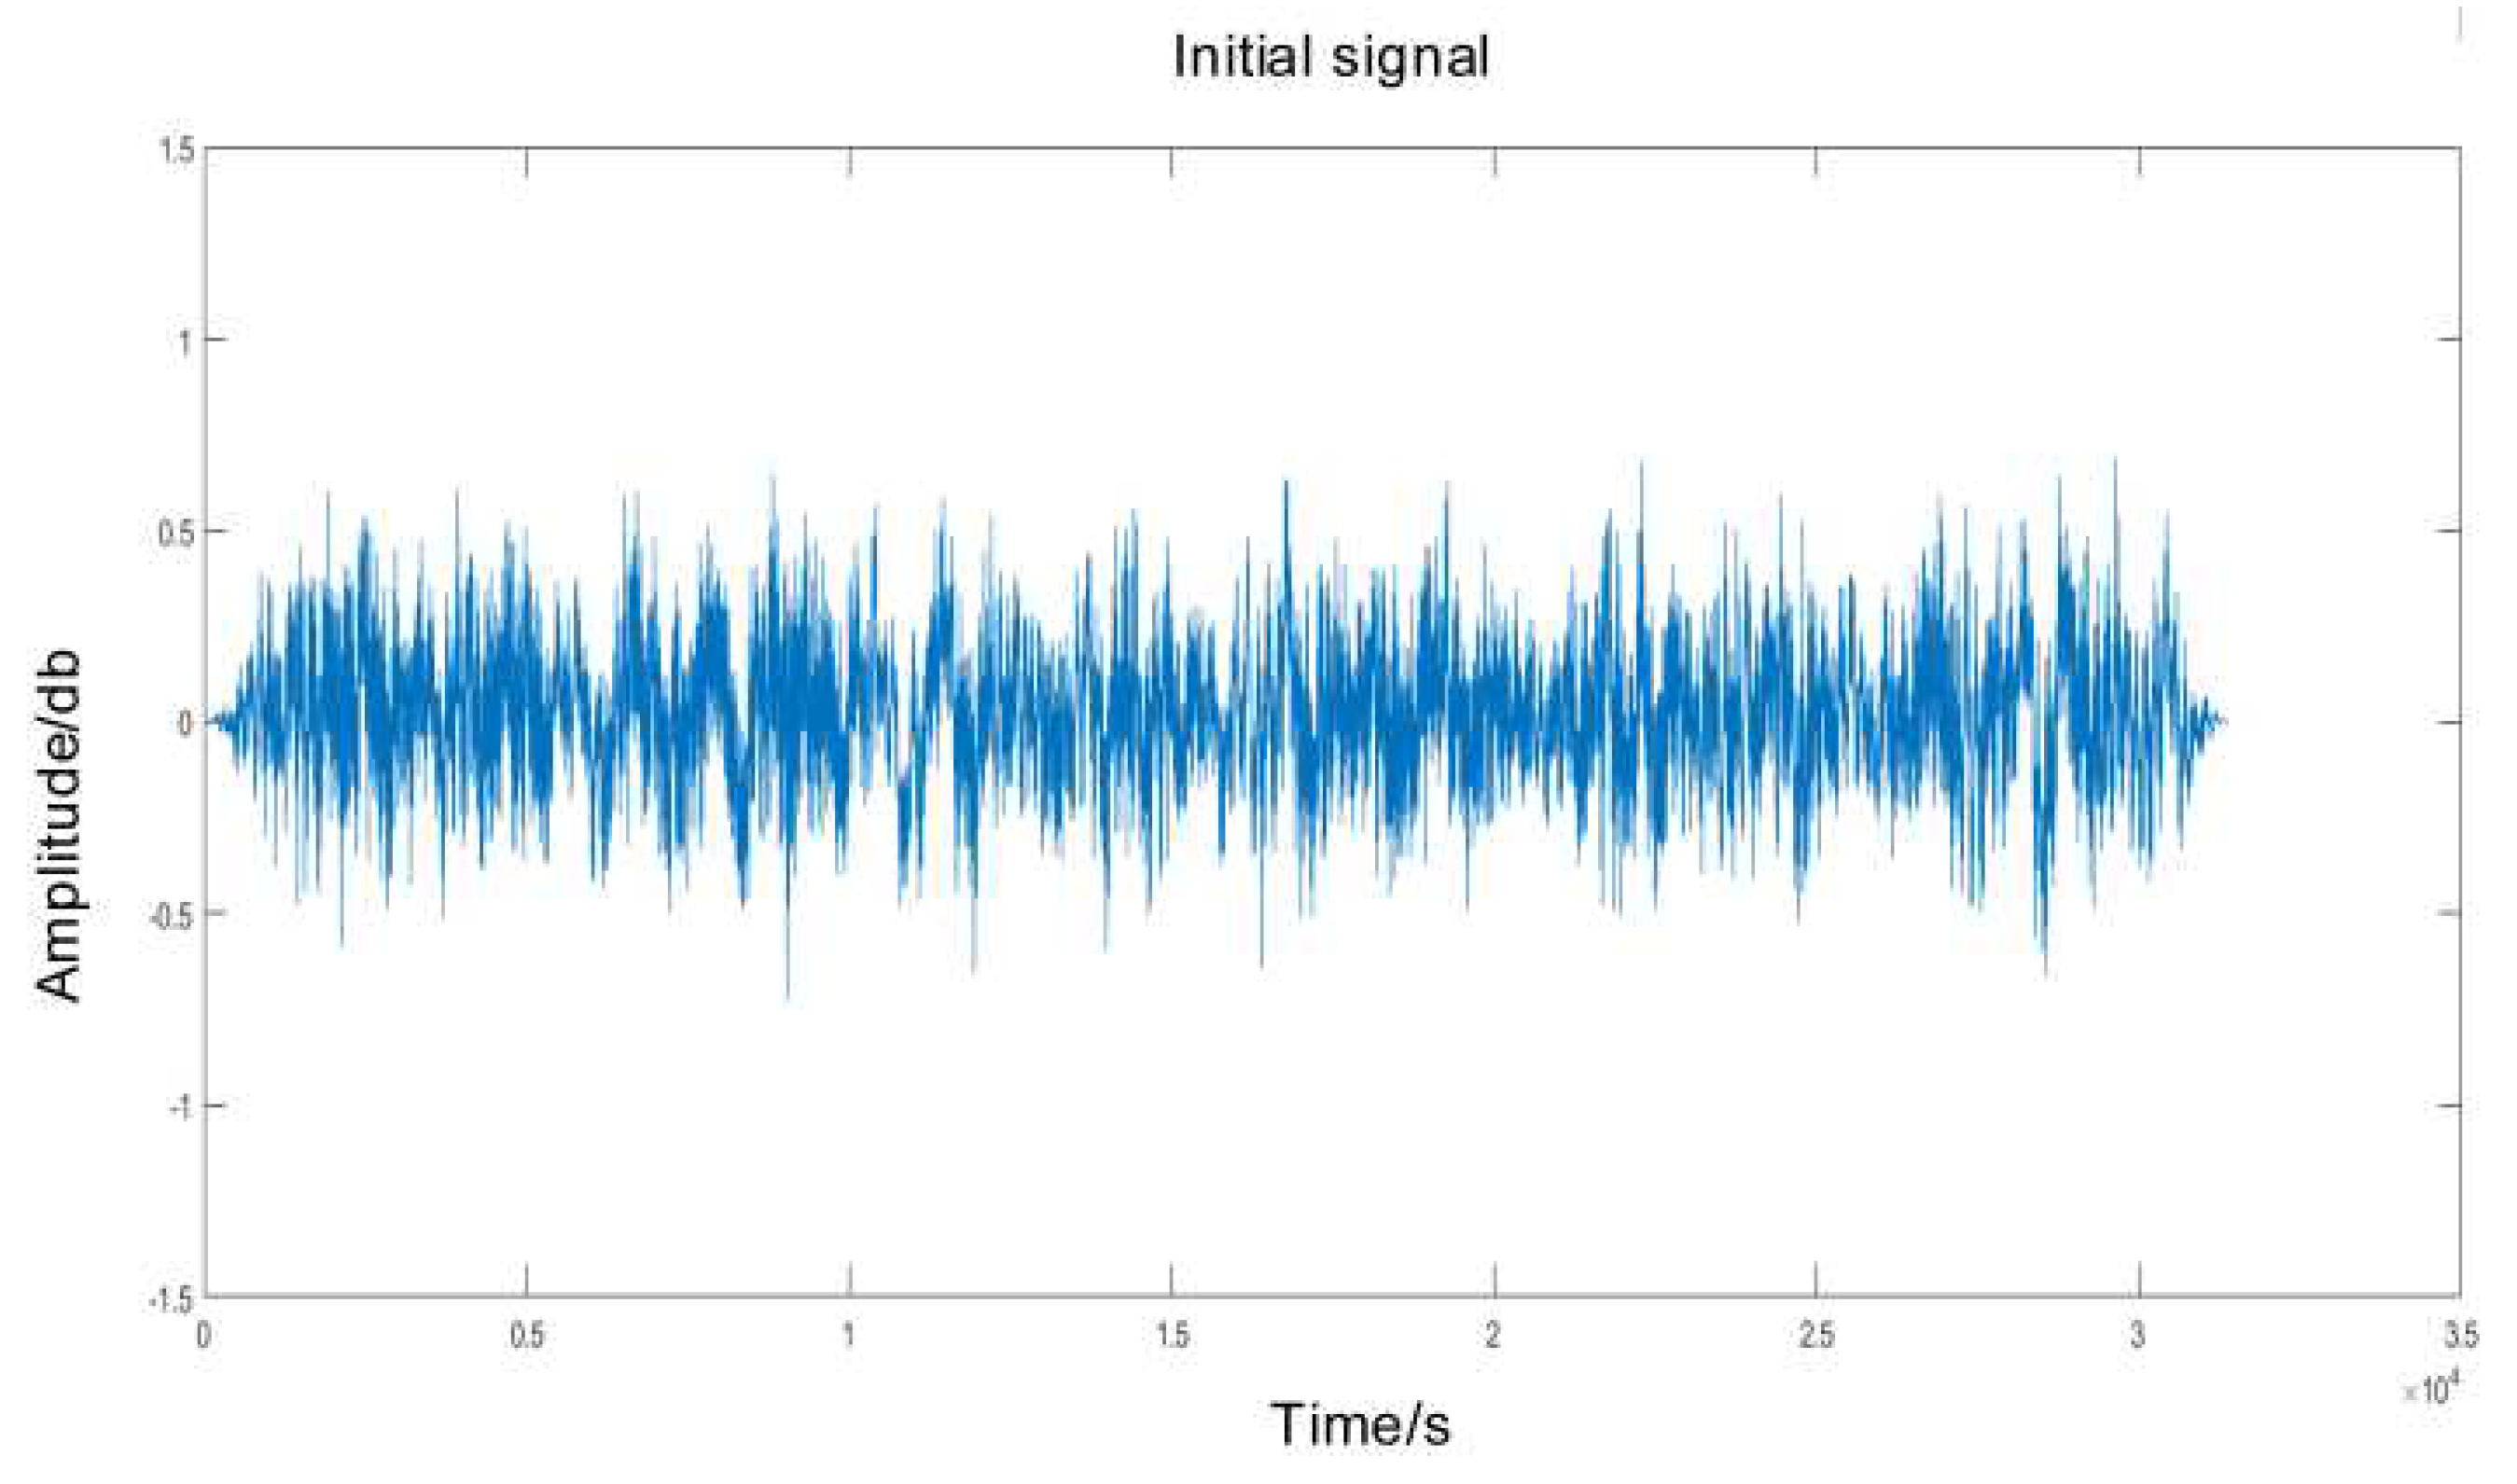
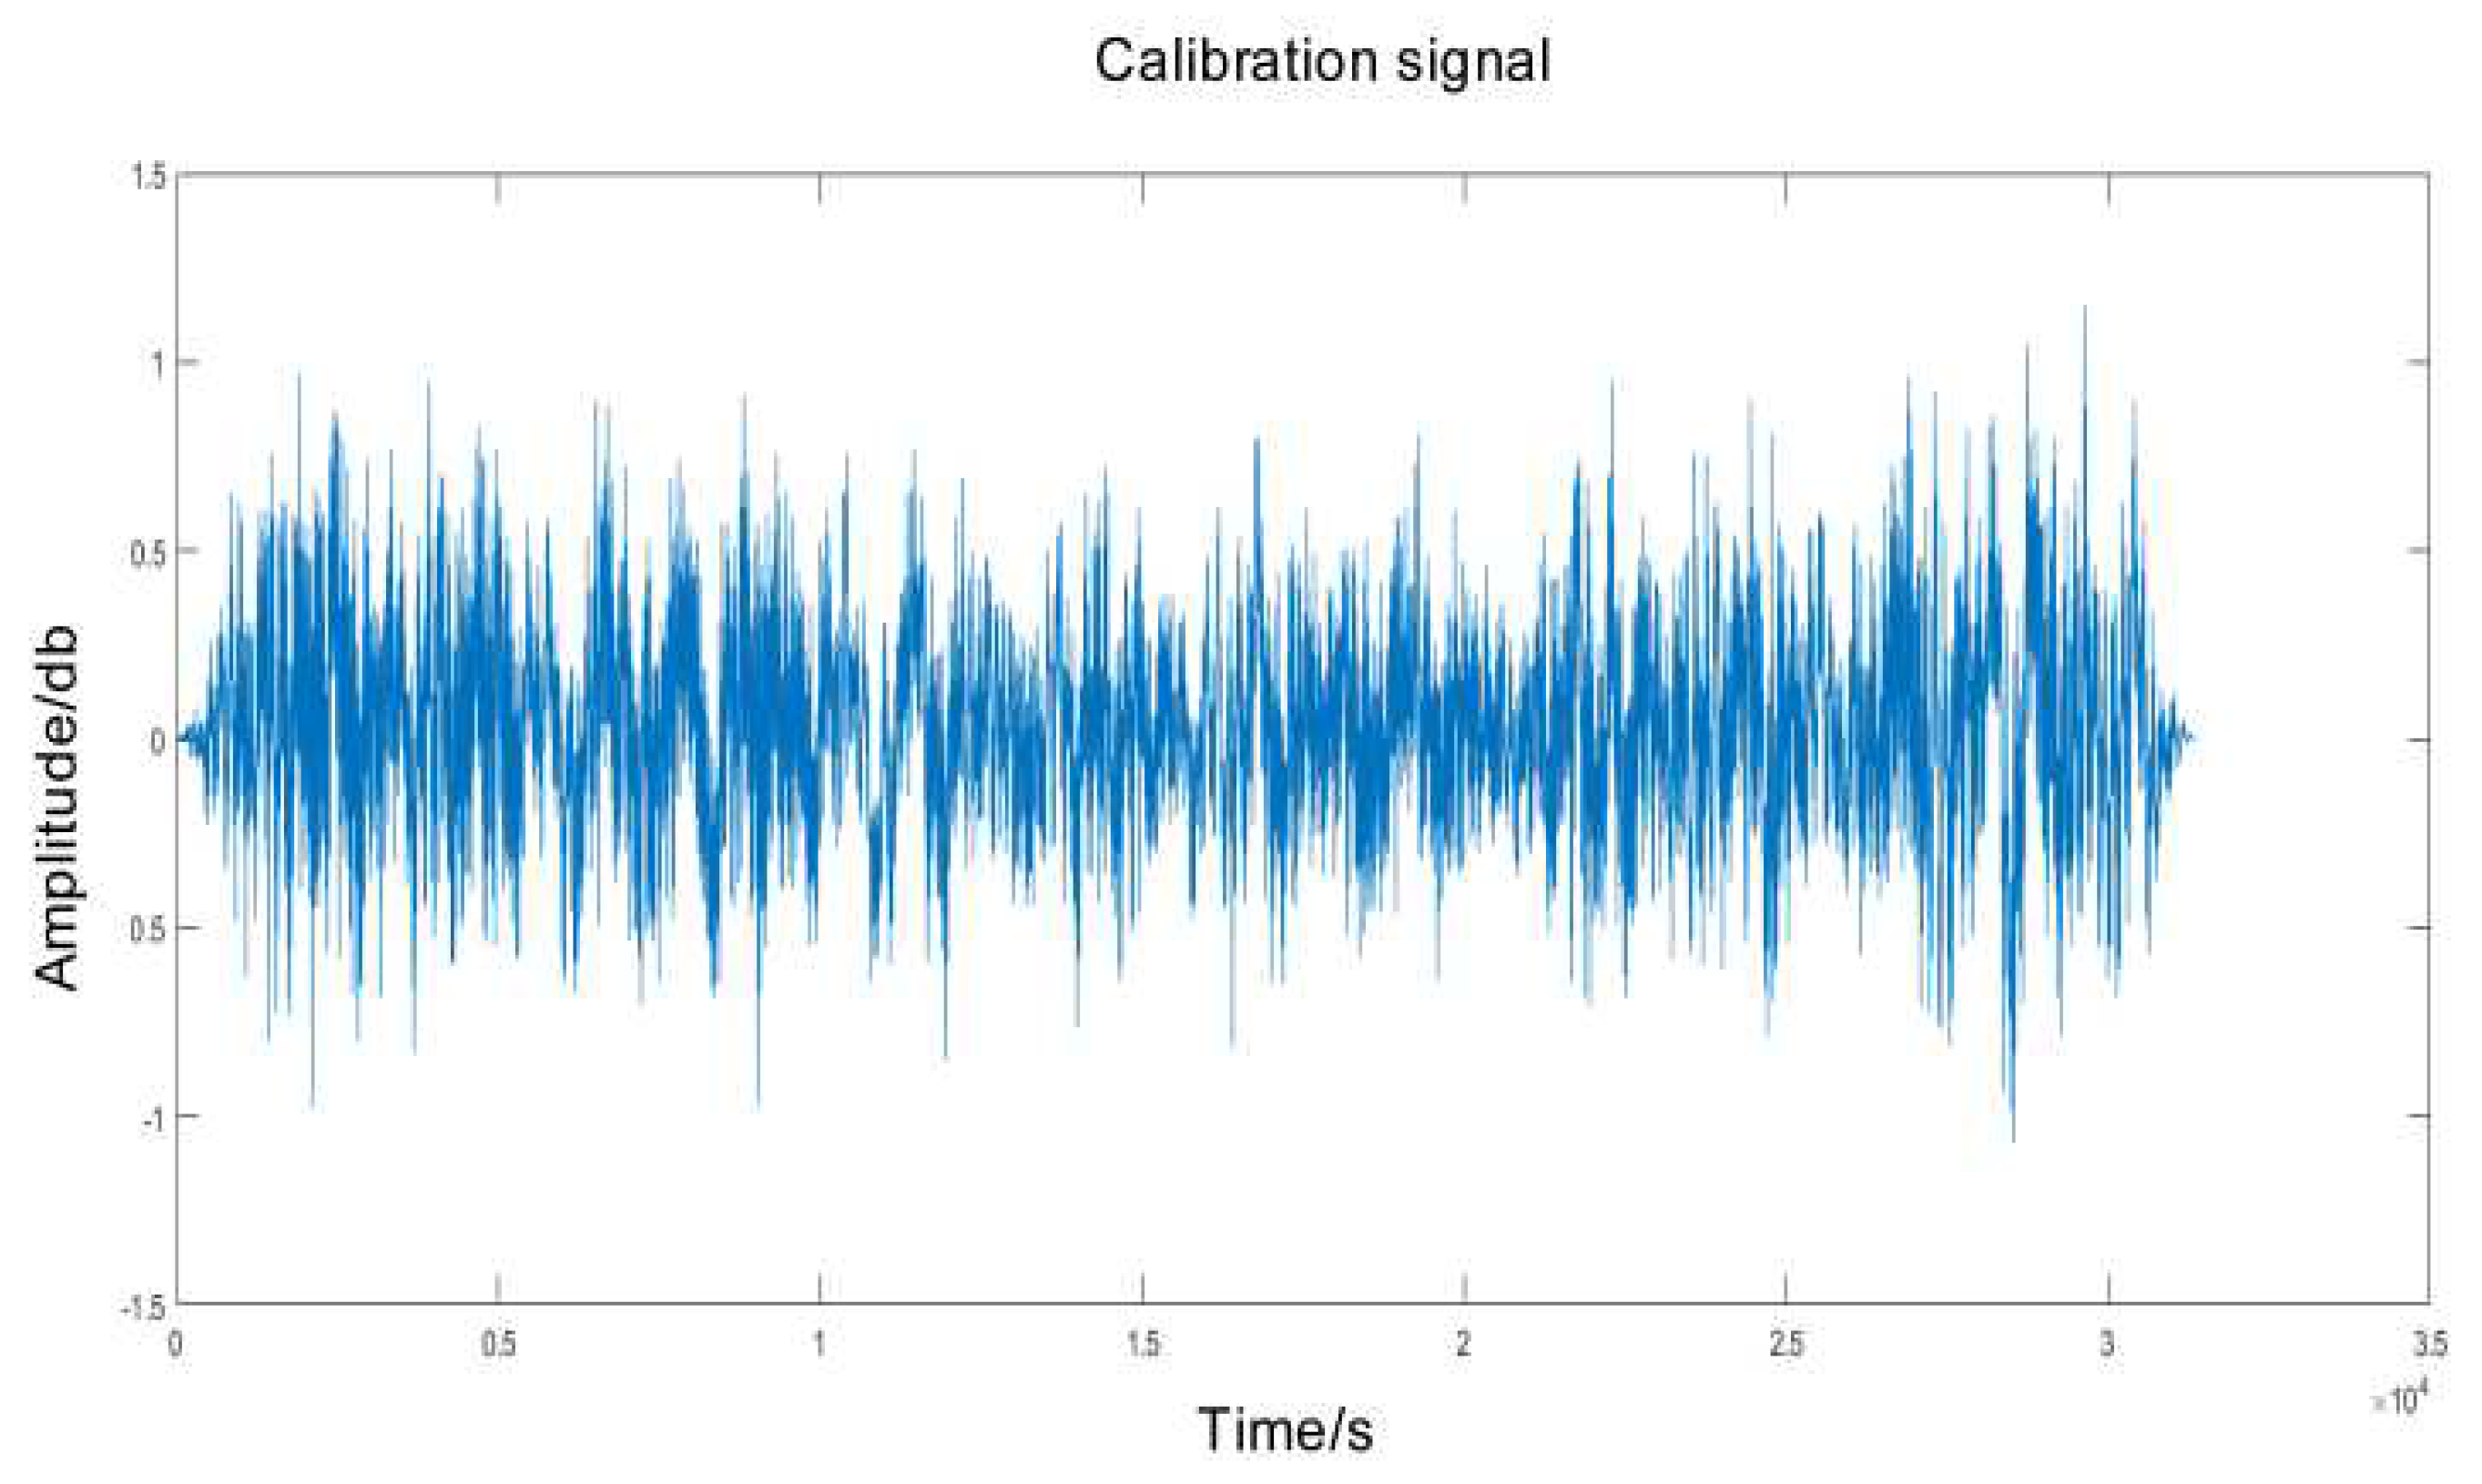
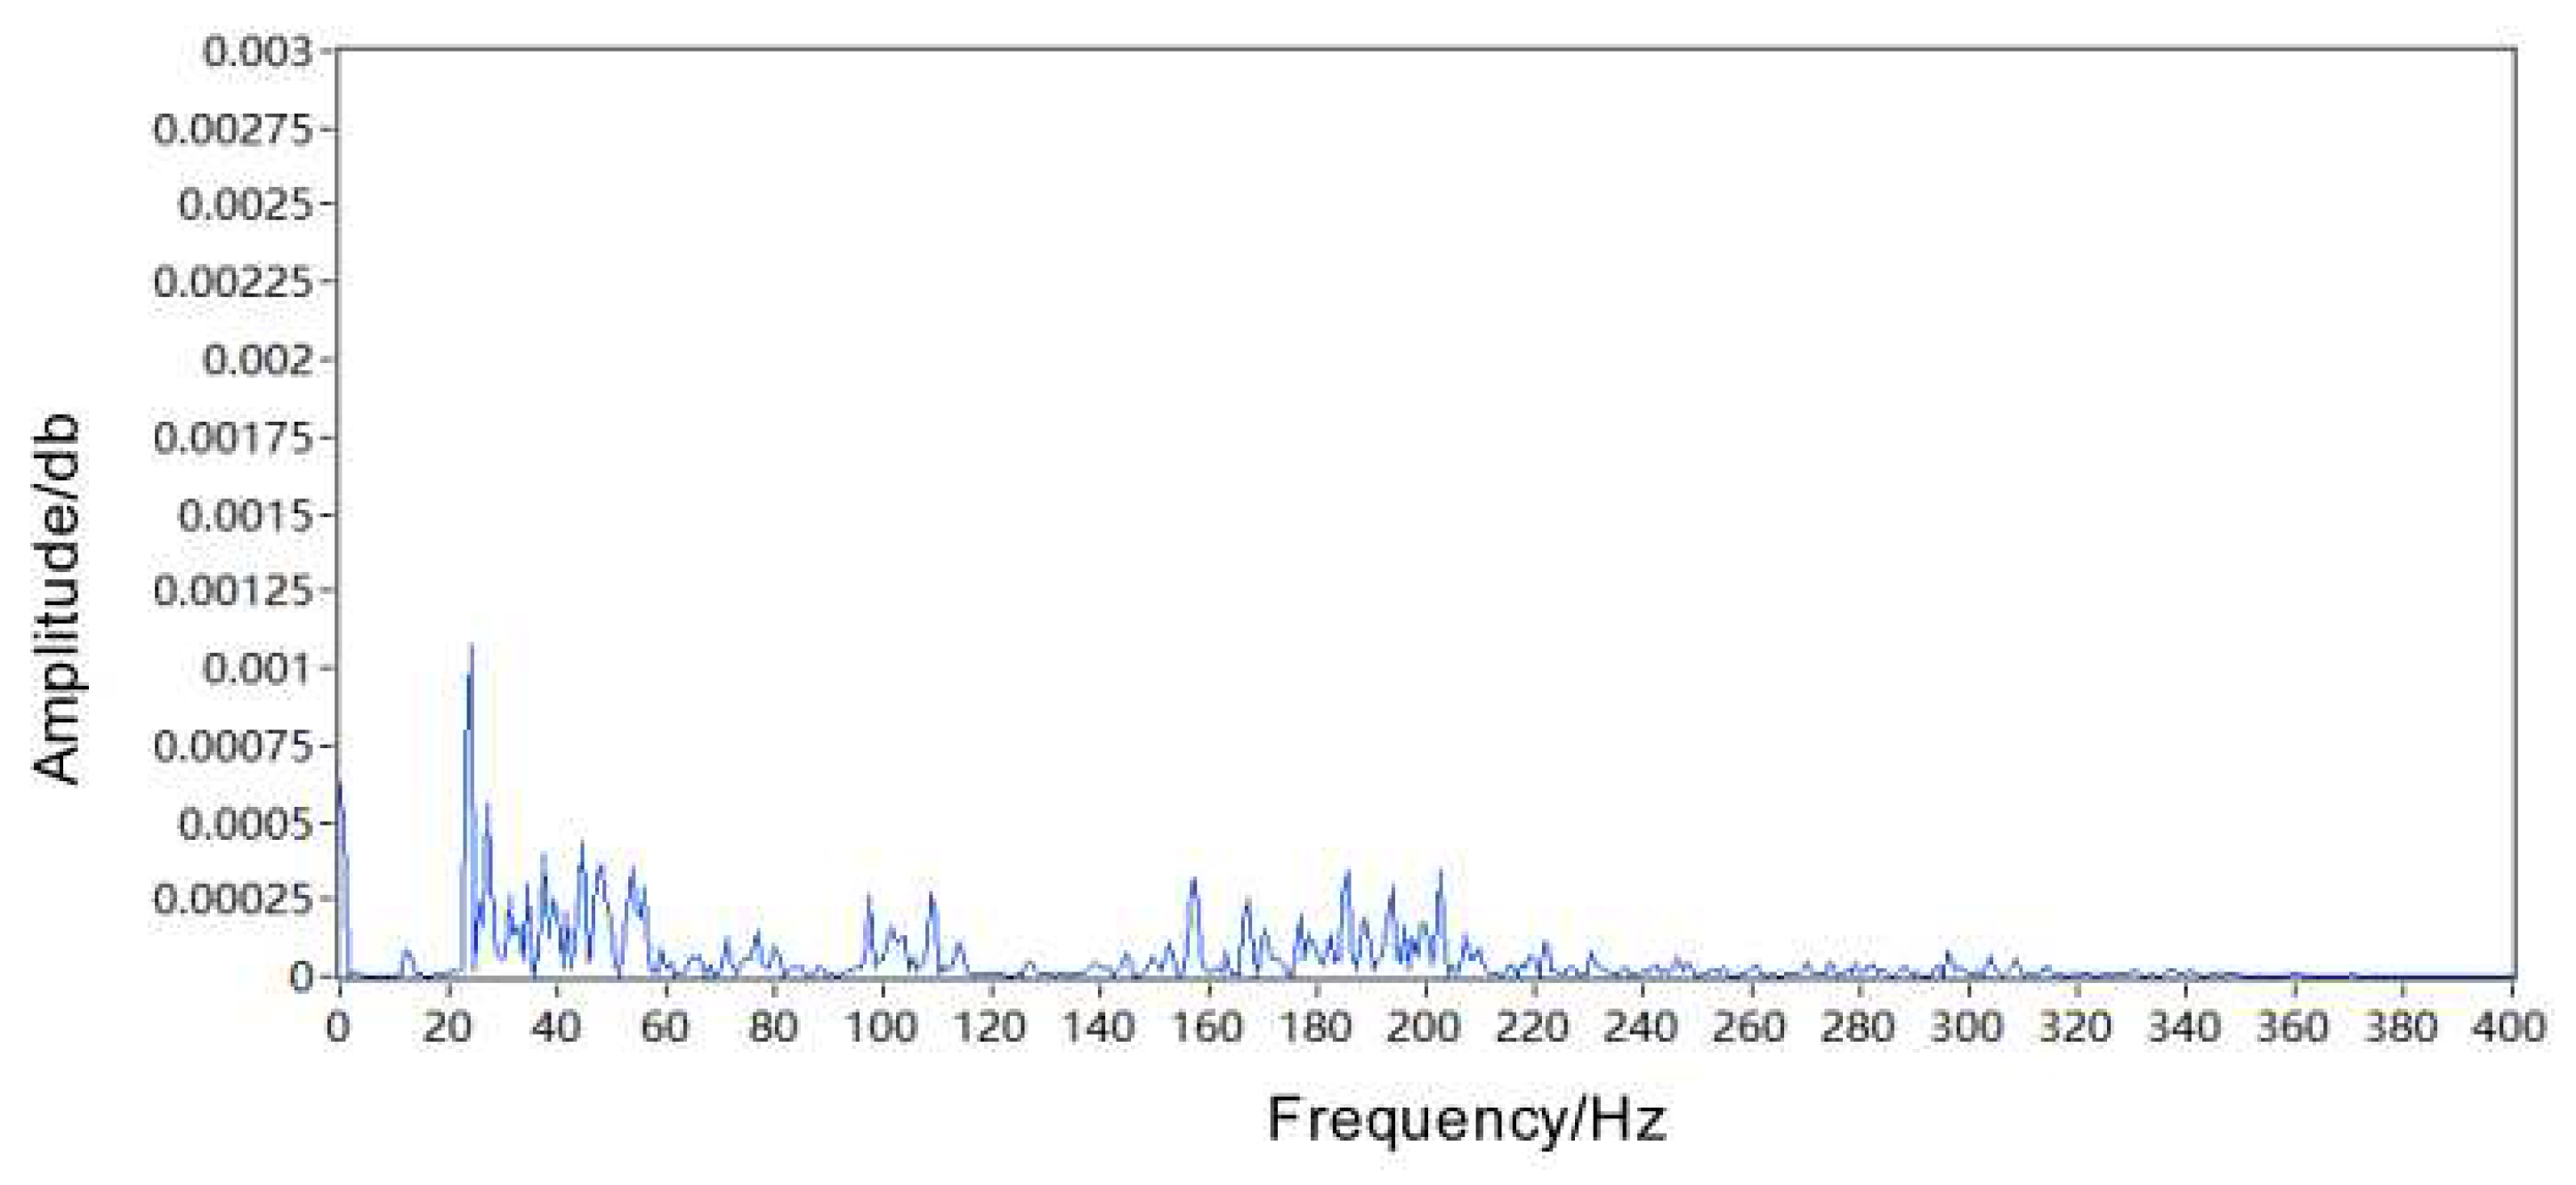
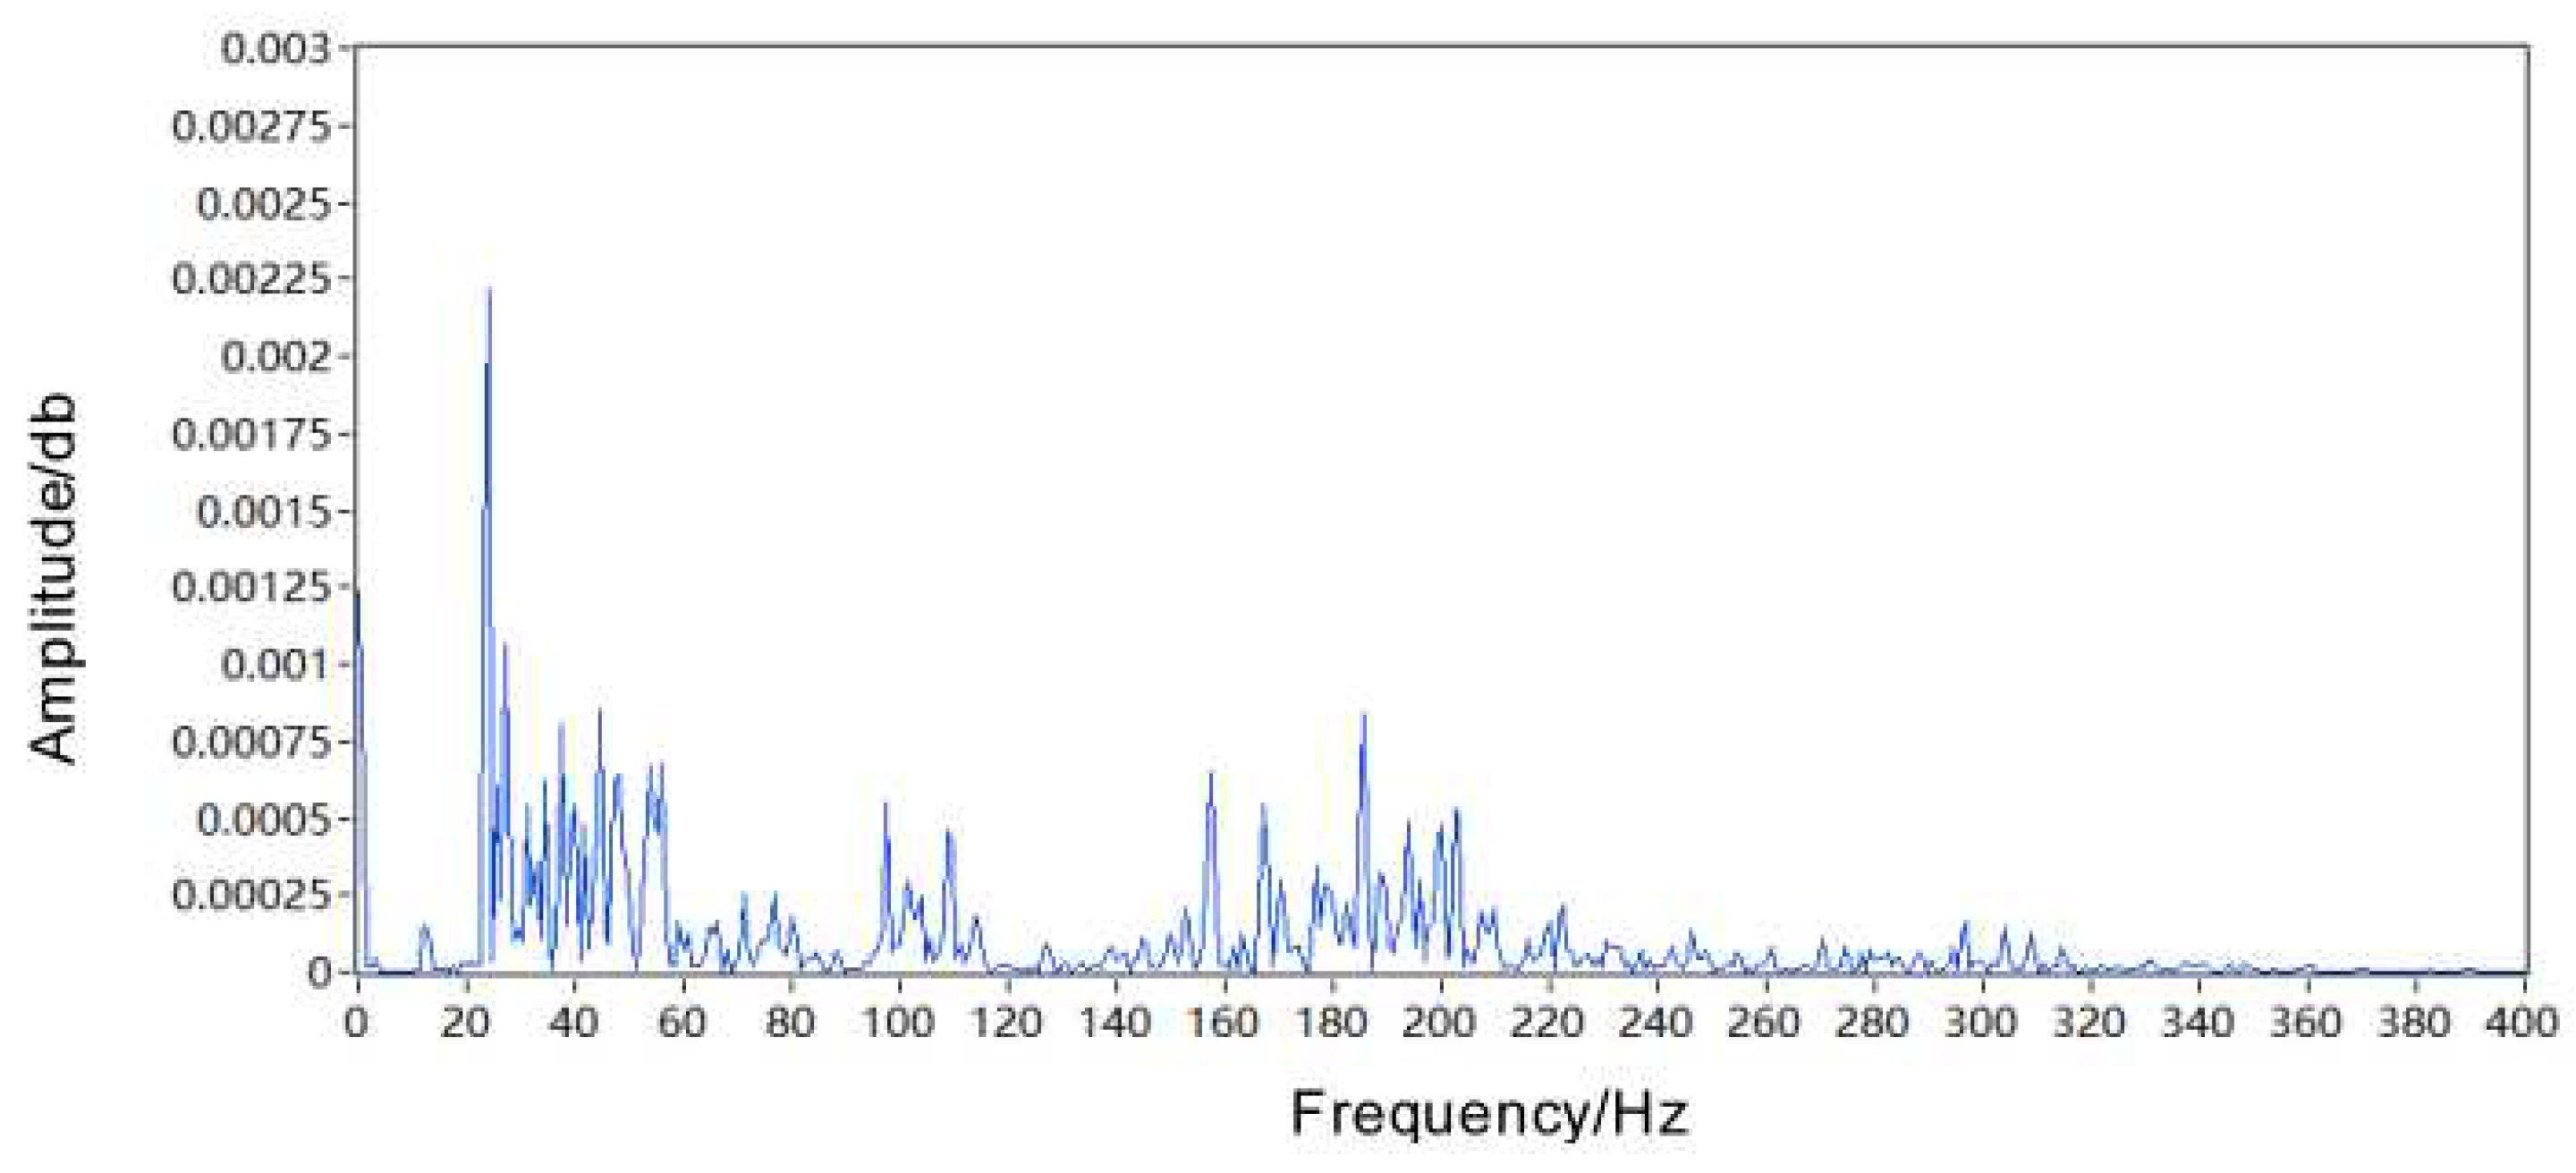
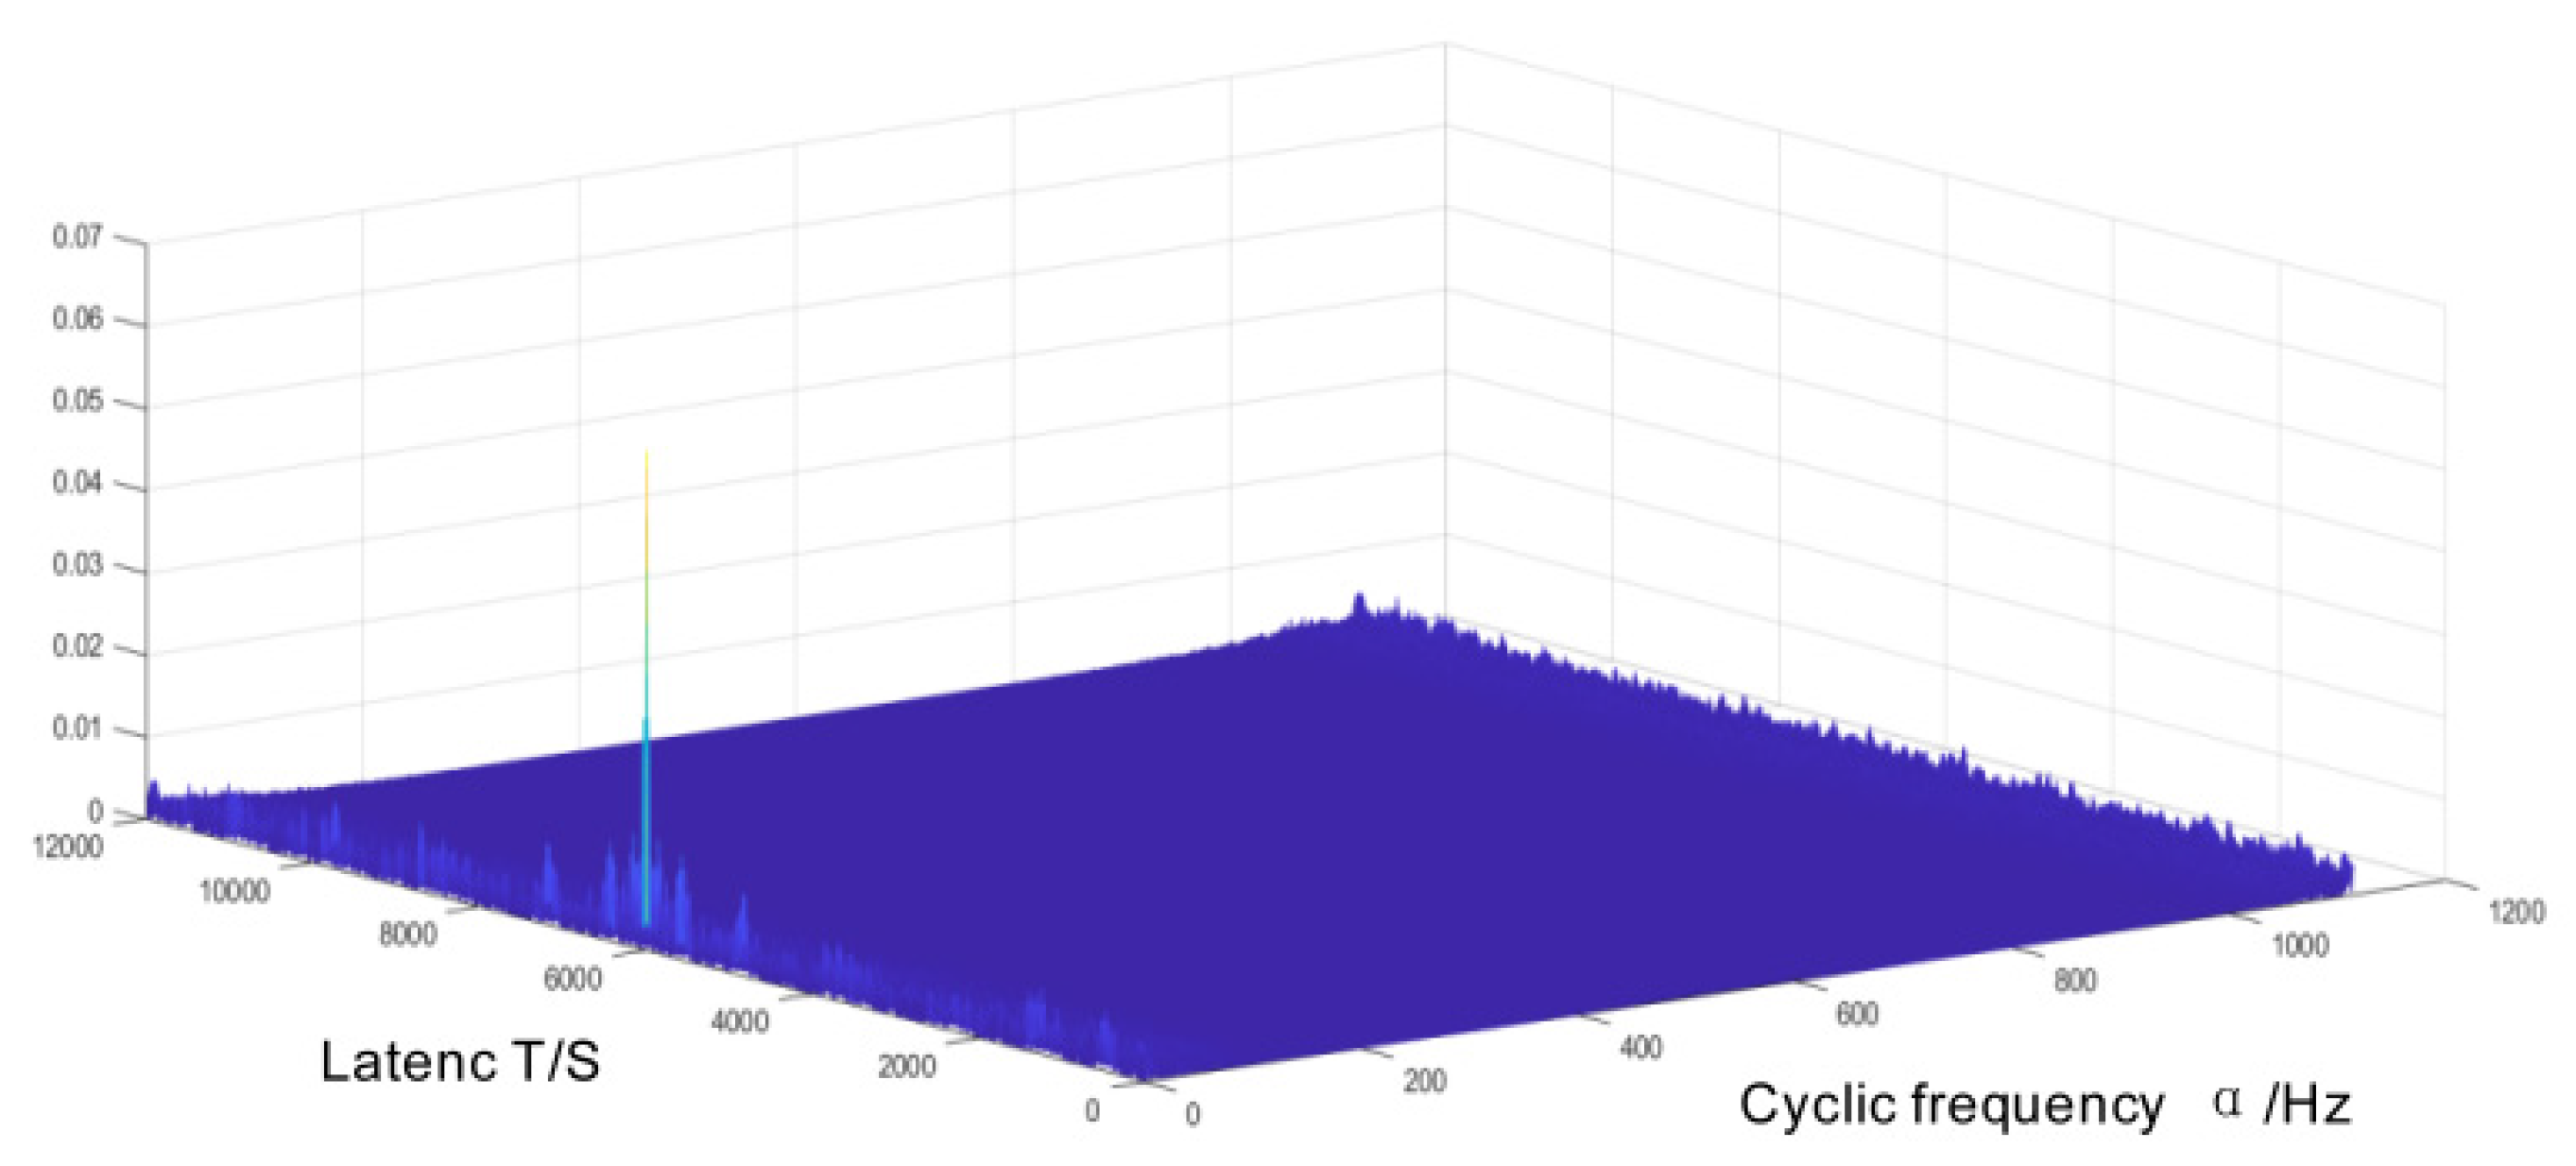
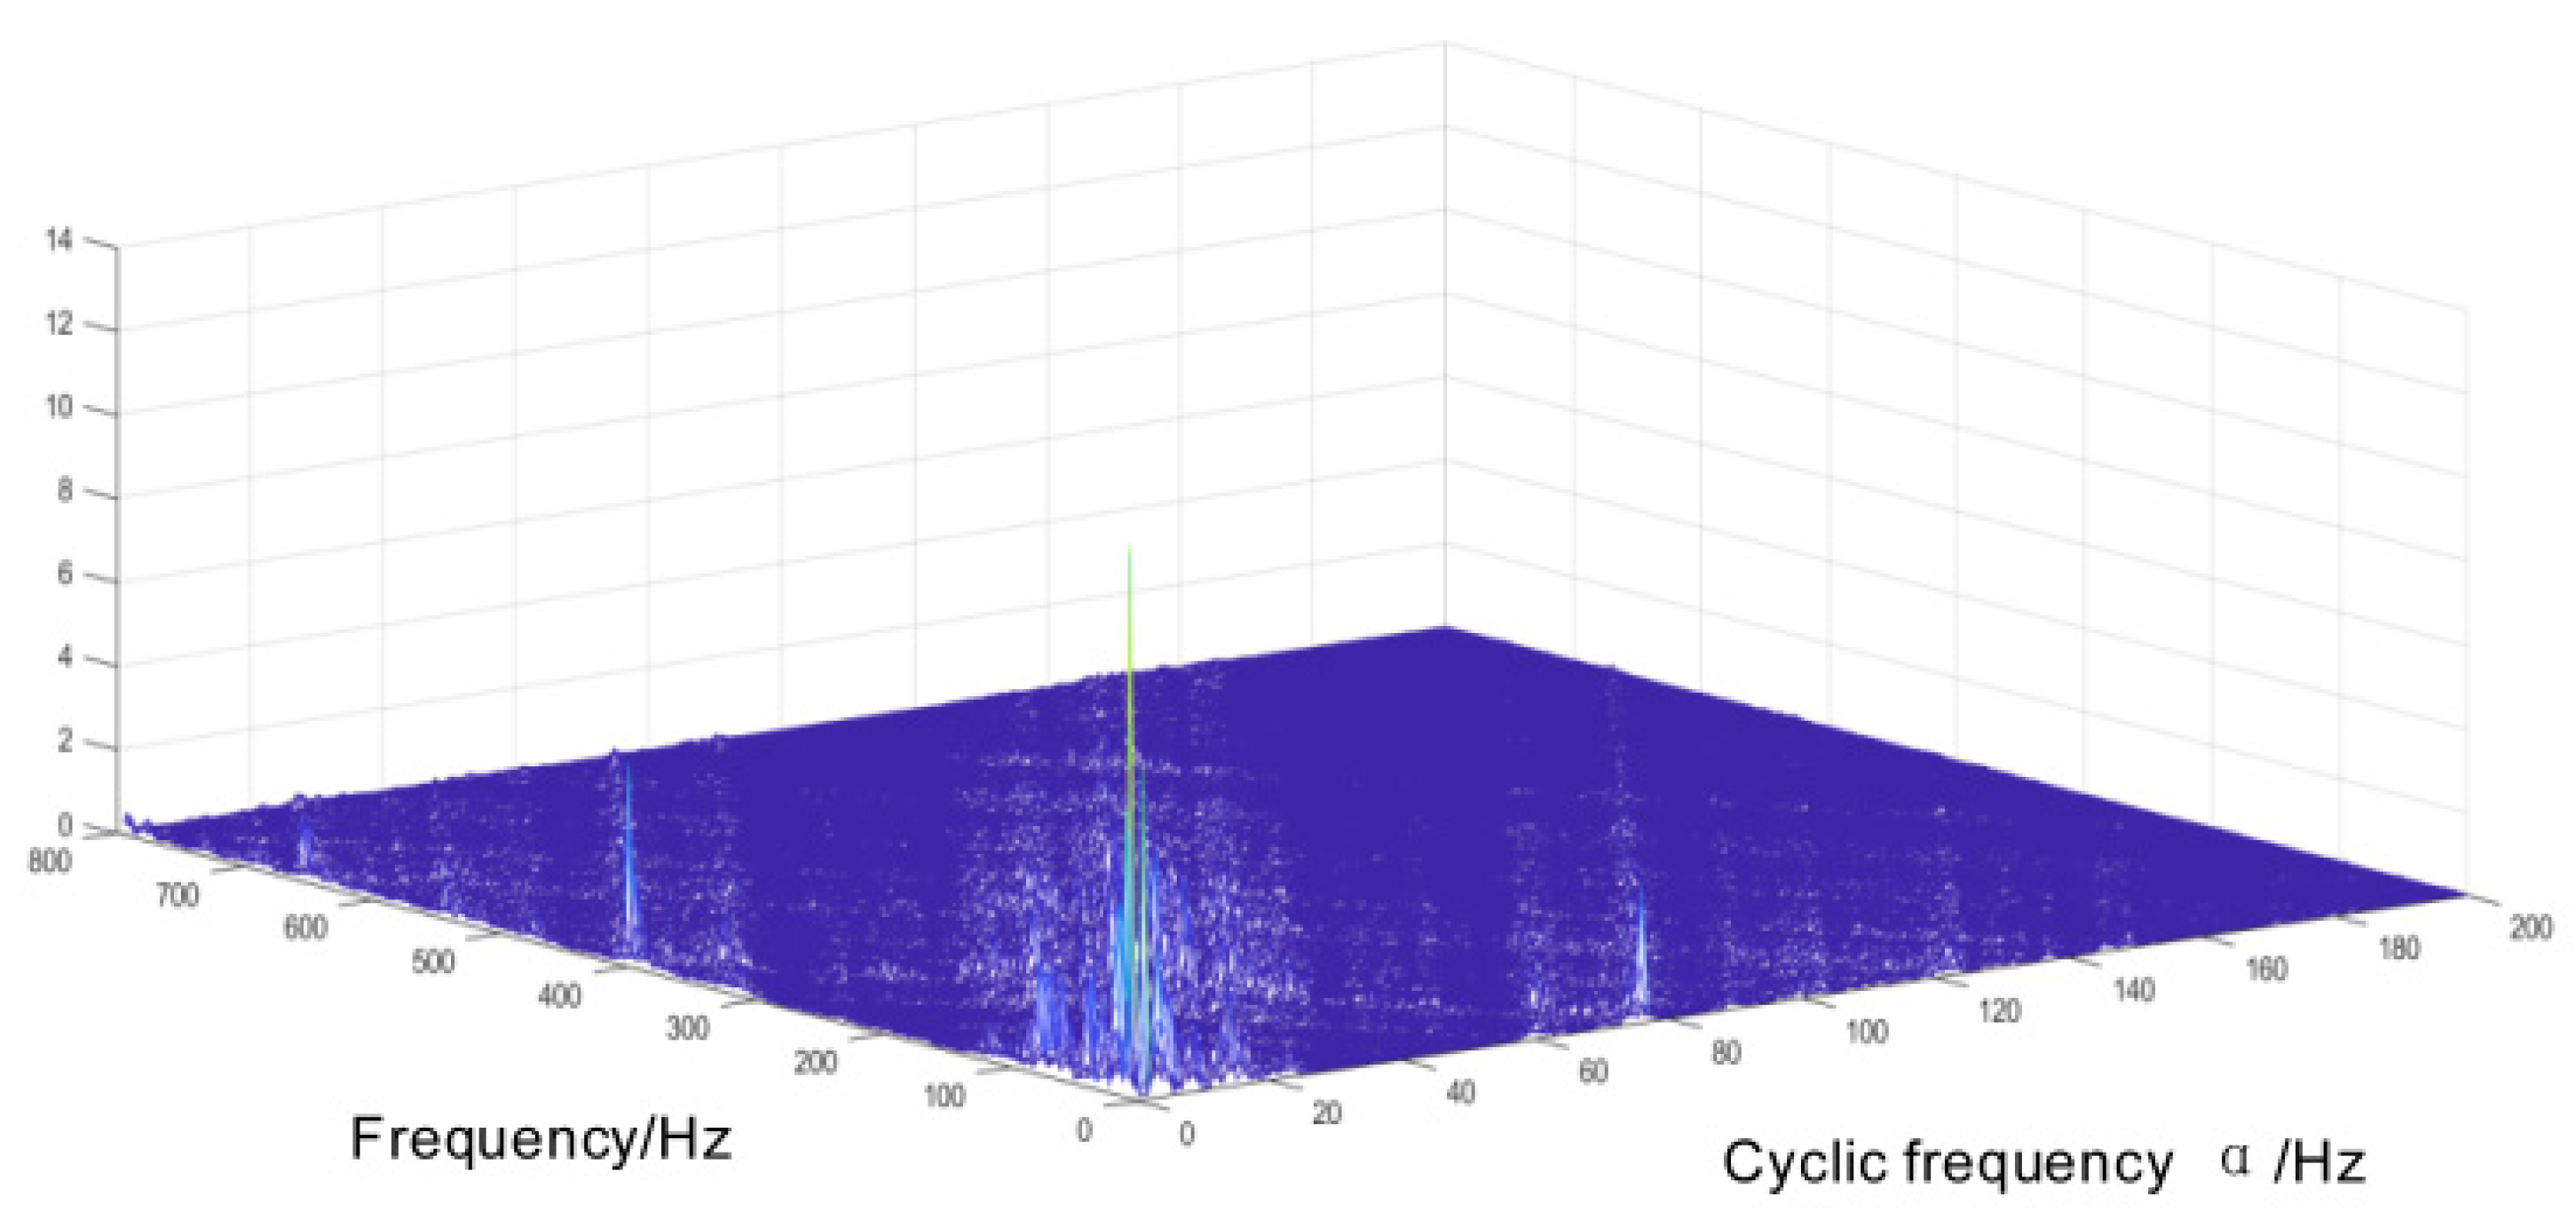
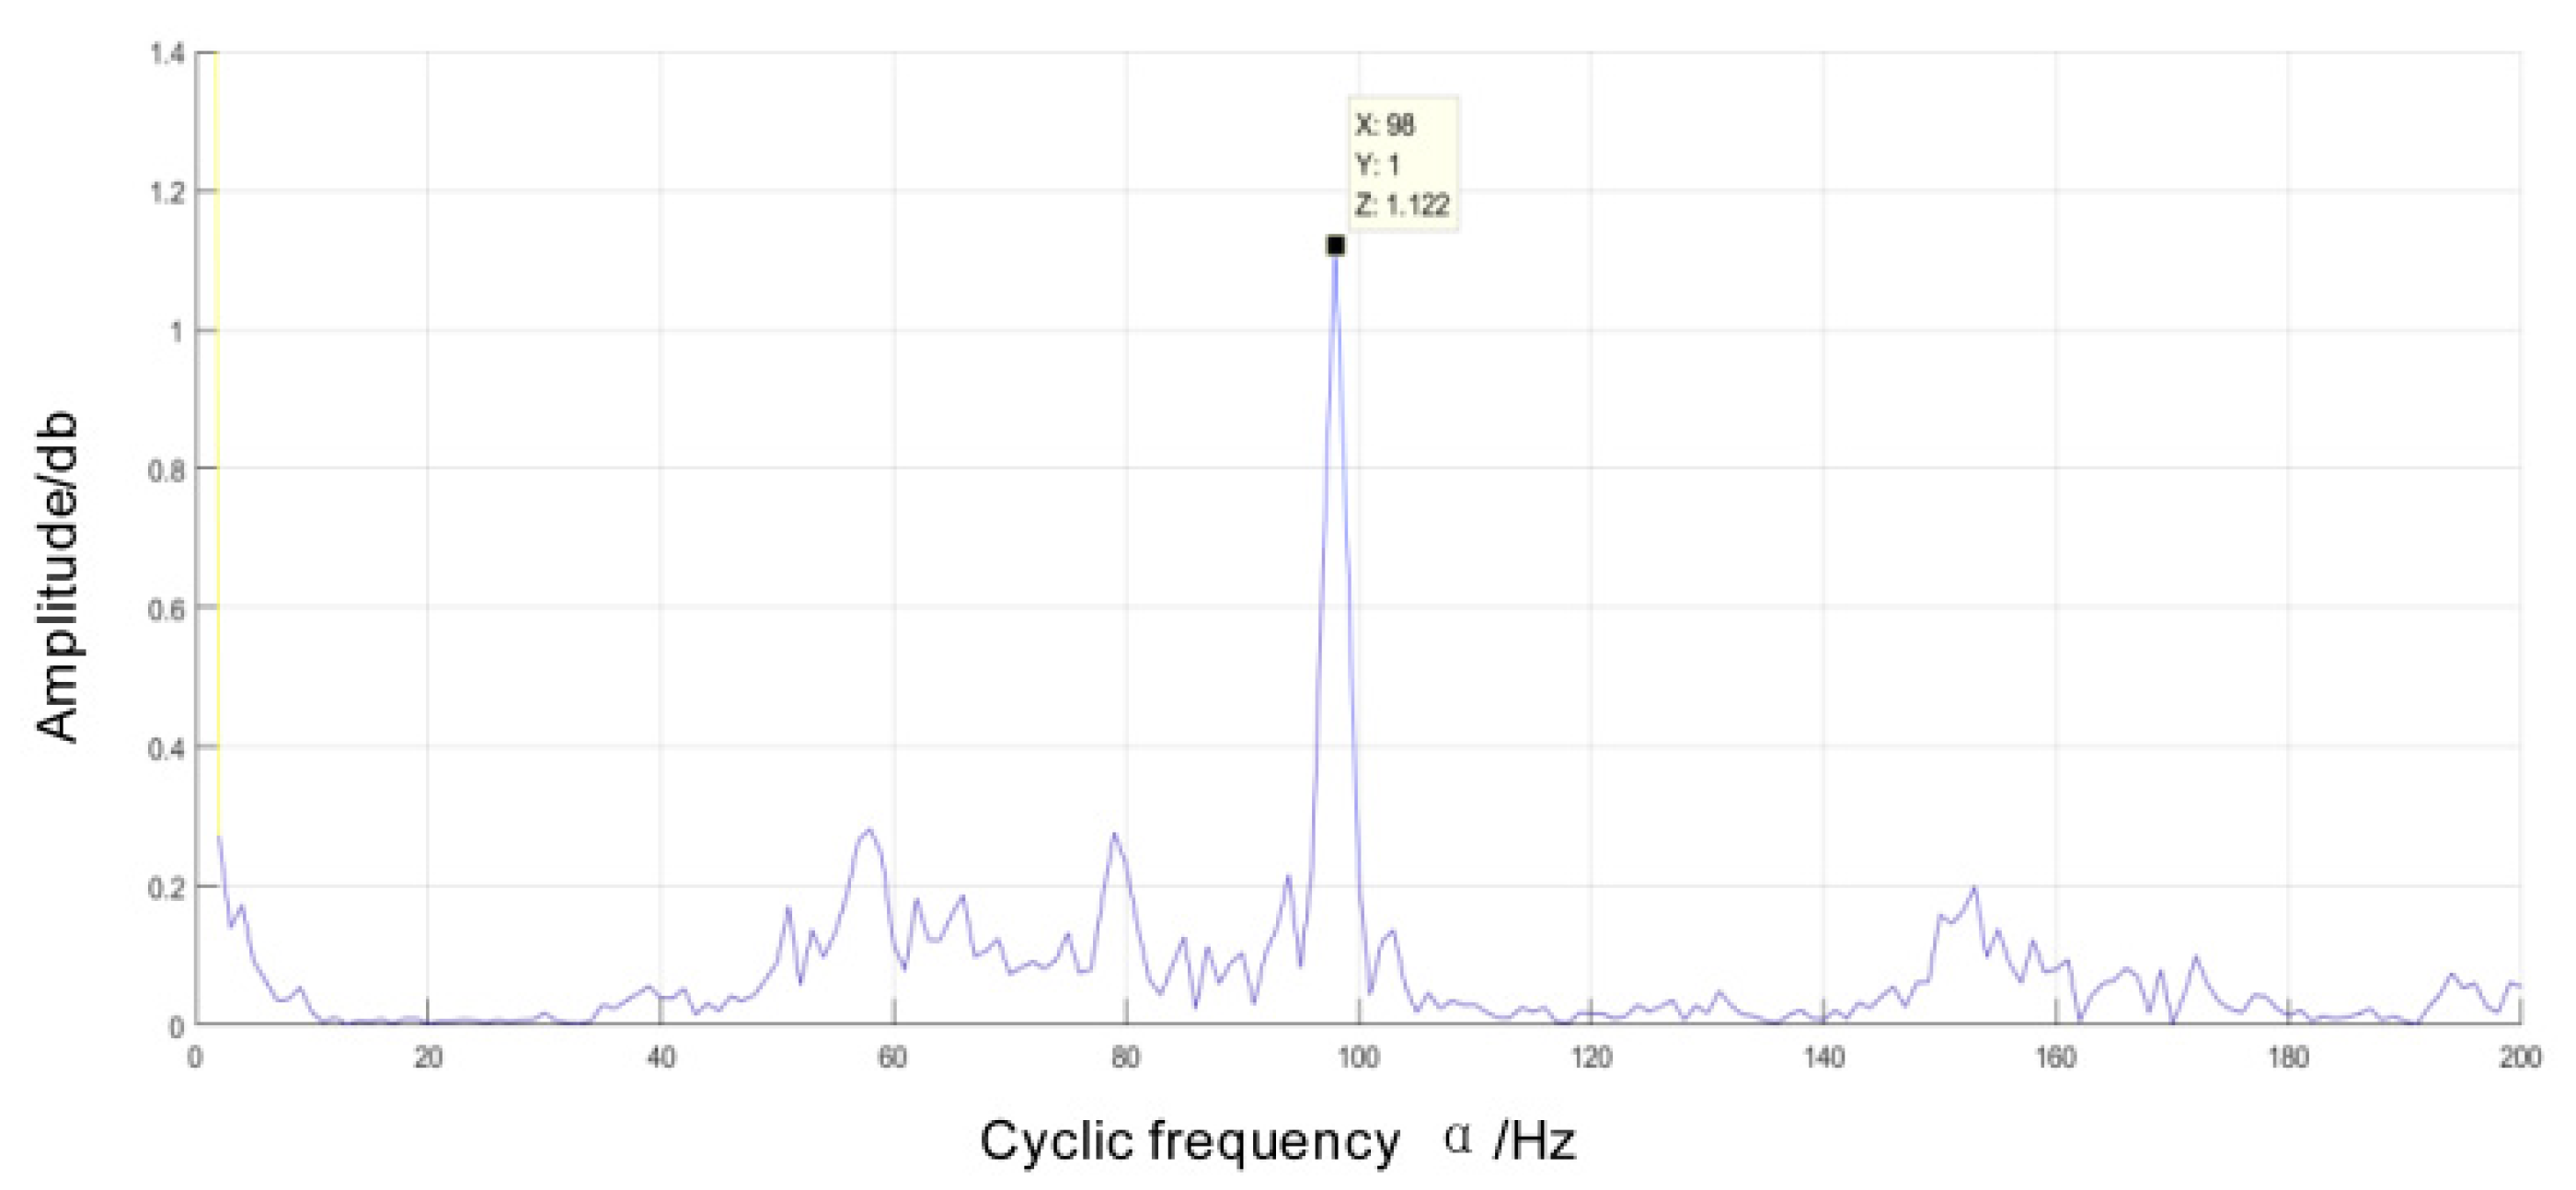
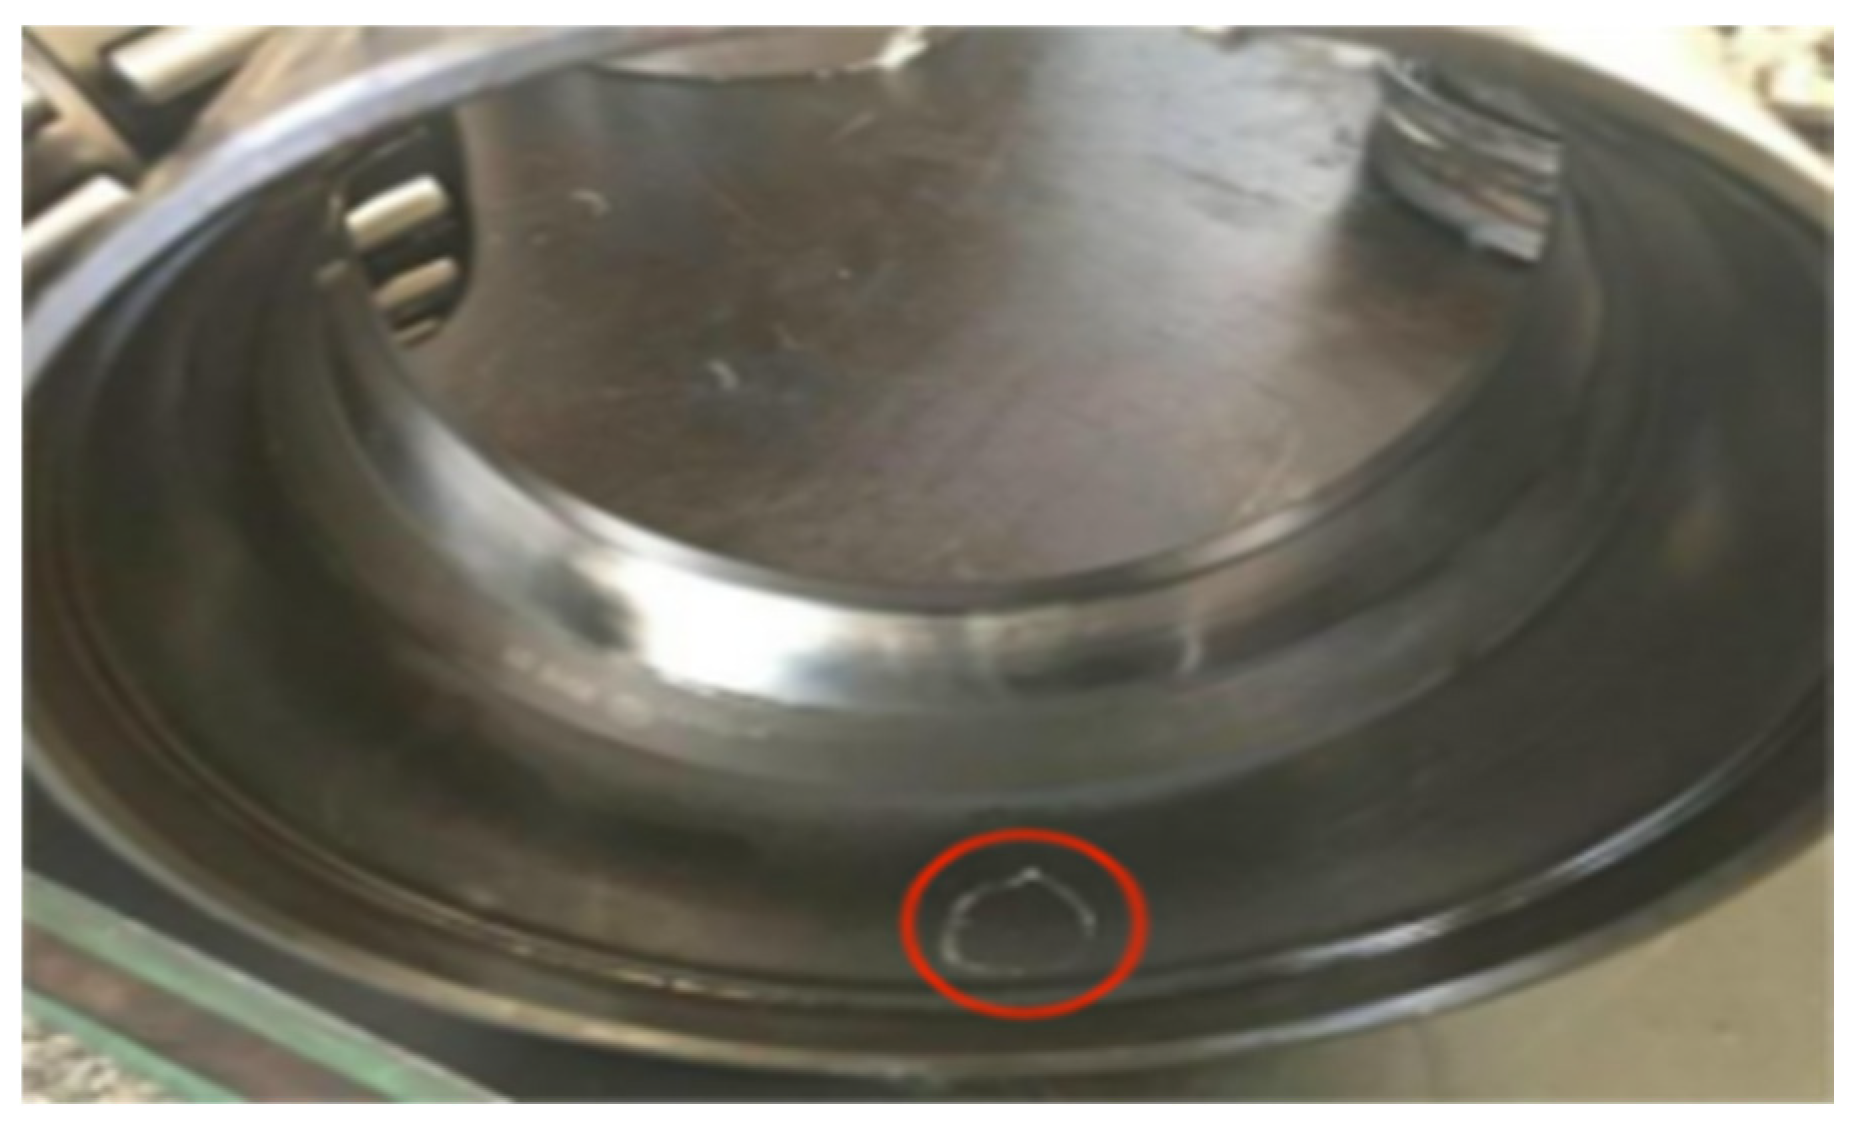

| Test bearing speed n1(rpm) | Slider horizontal speed v2(m/s) | Slider drive motor speed n2(rpm) |
|---|---|---|
| 150 | 0.4 | 145 |
| 300 | 0.8 | 291 |
| 600 | 1.6 | 582 |
| Bearing type | Inside diameter (mm) | Pitch diameter (mm) | Outside diameter (mm) | Rolling diameter (mm) | Number of rolling elements |
|---|---|---|---|---|---|
| N205 | 25 | 38.5 | 52 | 7.5 | 12 |
| Bearing type | Inside diameter (mm) | Pitch diameter (mm) | Outside diameter (mm) | Rolling diameter (mm) | Number of rolling elements |
|---|---|---|---|---|---|
| 353130B | 150 | 200 | 250 | 22 | 23 |
| Fault type | Rolling element fault | Inner loop fault | Outer ring fault |
|---|---|---|---|
| Cycle frequency characteristic | 23.1Hz | 177.4Hz | 15.2Hz |
Disclaimer/Publisher’s Note: The statements, opinions and data contained in all publications are solely those of the individual author(s) and contributor(s) and not of MDPI and/or the editor(s). MDPI and/or the editor(s) disclaim responsibility for any injury to people or property resulting from any ideas, methods, instructions or products referred to in the content. |
© 2023 by the authors. Licensee MDPI, Basel, Switzerland. This article is an open access article distributed under the terms and conditions of the Creative Commons Attribution (CC BY) license (http://creativecommons.org/licenses/by/4.0/).


